Article

How Much Are Planting Dates for Maize Affected by the Climate Trend? Lessons for Scenario Analysis Using Land Surface Models

1
Key Laboratory of Virtual Geographic Environment (Ministry of Education), Nanjing Normal University, Nanjing 210023, China
2
State Key Laboratory Cultivation Base of Geographical Environment Evolution (Jiangsu Province), Nanjing Normal University, Nanjing 213323, China
3
Jiangsu Center for Collaborative Innovation in Geographical Information Resource Development and Application, Nanjing Normal University, Nanjing 210023, China
4
Department of Geography, University of Wisconsin-Madison, Madison, WI 53706, USA
5
School of Integrative Plant Sciences, Section of Soil & Crop Sciences, Cornell University, Ithaca, NY 14853, USA
*
Author to whom correspondence should be addressed.
Agronomy 2019, 9(6), 316; https://doi.org/10.3390/agronomy9060316
Submission received: 15 May 2019 / Revised: 8 June 2019 / Accepted: 11 June 2019 / Published: 14 June 2019
(This article belongs to the Section Farming Sustainability)

Abstract

:
Process-based land surface models are important tools to study the historical and future effects of climate change and land use change. The planting date has a considerable effect on crop growth and consequently on dynamic parameters used in land surface models, for example albedo and actual evapotranspiration. If planting dates can be related to climate, scenarios can use this relation to estimate planting dates. Such a relation is expected to differ according to agro-ecological zone. In this study, spring and summer maize planting date observations at 188 agricultural meteorological experiment stations of China, as well as monthly weather records, over the years 1992–2010 were used as the data source. In order to quantify the relation between planting dates and climate parameters, growing season monthly average minimum temperature (Tmin), mean temperature (T), and precipitation (P) were used. The time trend analysis of planting dates and weather data, principal component analysis (PCA) of weather data, and multivariate regression of planting dates as affected by weather data were used. Both Tmin and T increased during this period in most zones, whereas precipitation showed no trend. In southwest and northwest China, maize planting dates advanced significantly for both spring and summer maize. However, in the north China plain (summer maize) and northeast China (spring maize), the planting date was significantly delayed. Ordinary least squares multivariate regression models were able to explain 33% and 59% of the variance of planting dates in the southwest China (i.e., the humid subtropics zone) for spring and summer maize, respectively. However, only 3% could be explained in the Loess Plateau. Thus, adjusting planting dates in scenario analysis using land surface models is indicated for some zones, but not others, where socioeconomic factors are dominant.

1. Introduction

Process-based land surface models such as the CLM (Community Land Model) [1,2,3] are major scientific tools for scenario analysis at regional or global scale, when estimating both the historical and future effects of climate variability and land use change [4,5]. These models depend on accurate calculation of the dynamic energy fluxes and thus require an accurate representation of the land cover and its status. Croplands account for around 12% of the global ice-free land cover [6] and thus play an important role in land surface processes. Therefore, an accurate representation of cropped area and its status in land surface models is necessary to predict these energy fluxes and related carbon budgets [7], which depends on the crop planting dates and phenology in cropped areas.
A major determinant of crop phenology is the planting date [8]. The time of planting has a considerable effect on crop growth, not only the timing of phenological stages, but also overall productivity in response to weather [9,10]. Thus, the planting date is one of main inputs as management information in process-based crop models [11,12,13]. There are many different methods to determine planting dates as an input to crop models [11,12,13,14,15,16]. One main method uses actual or simulated weather data to define rule-based planting dates [11,13,14]. For example, the crop model of CLM (version 4.5) determines the planting date by crop-specific temperature thresholds [17,18,19]. The PEGASUS 1.0 model determines the planting date by temperature in temperature-limited regions and by precipitation in moisture-limited regions, respectively [11]. These thresholds are often fixed at global or regional scale. In earlier work we found that these thresholds are variable in different region or different time [19].
These methods assume that farmers make decisions on planting at least partly on the weather [11,20]. Thus, if overall climate changes (as some expect), or if a variable climate is being modelled over a number of years, farmers would be expected to change the timing of planting to adapt, according to rules similar to those used to determine modelled planting dates [14,21,22]. Knowing or simulating climate trends or variability would lead to knowing the trend in sowing dates. This information could be used in crop simulation models such as those in the CLM. This would lead to more accurate predictions of land surface fluxes as well as crop productivity.
In actual agricultural practice, the planting date depends on many factors, including market conditions, labor availability, soil moisture conditions, type of mechanization, and rotations. However, planting decision must to a certain extent respect the climate—crops should only be sown when they will develop properly and give satisfactory yields. It is not clear to what extent planting dates are related to climate in different agro-ecological zones. Our aim therefore was to analyze this relation over diverse zones in China during a study period 1992–2010, during which period we also quantified the trend in both planting dates and climate. In this study, maize planting date observations at 188 agricultural meteorological experiment stations of China over the years 1993–2010 were related to growing season climate over this same period. The choice to use experiment station data removes much of the variability in planting dates due to farmer preferences and constraints. Maize was selected as the target crop because it is widely grown in the different regions, and in warmer regions as both a spring and summer crop.
This study addressed the following research questions:
(1) Was there a trend in agricultural climate over the 1992–2010 period? Did this vary with agro-ecological zone?
(2) Was there a trend in actual planting dates over the 1992–2010 period? Did this vary with agro-ecological zone?
(3) What was the relation between actual planting dates and weather during this time period? Which climate variables most controlled planting dates? Did this vary with agro-ecological?

2. Materials and Methods

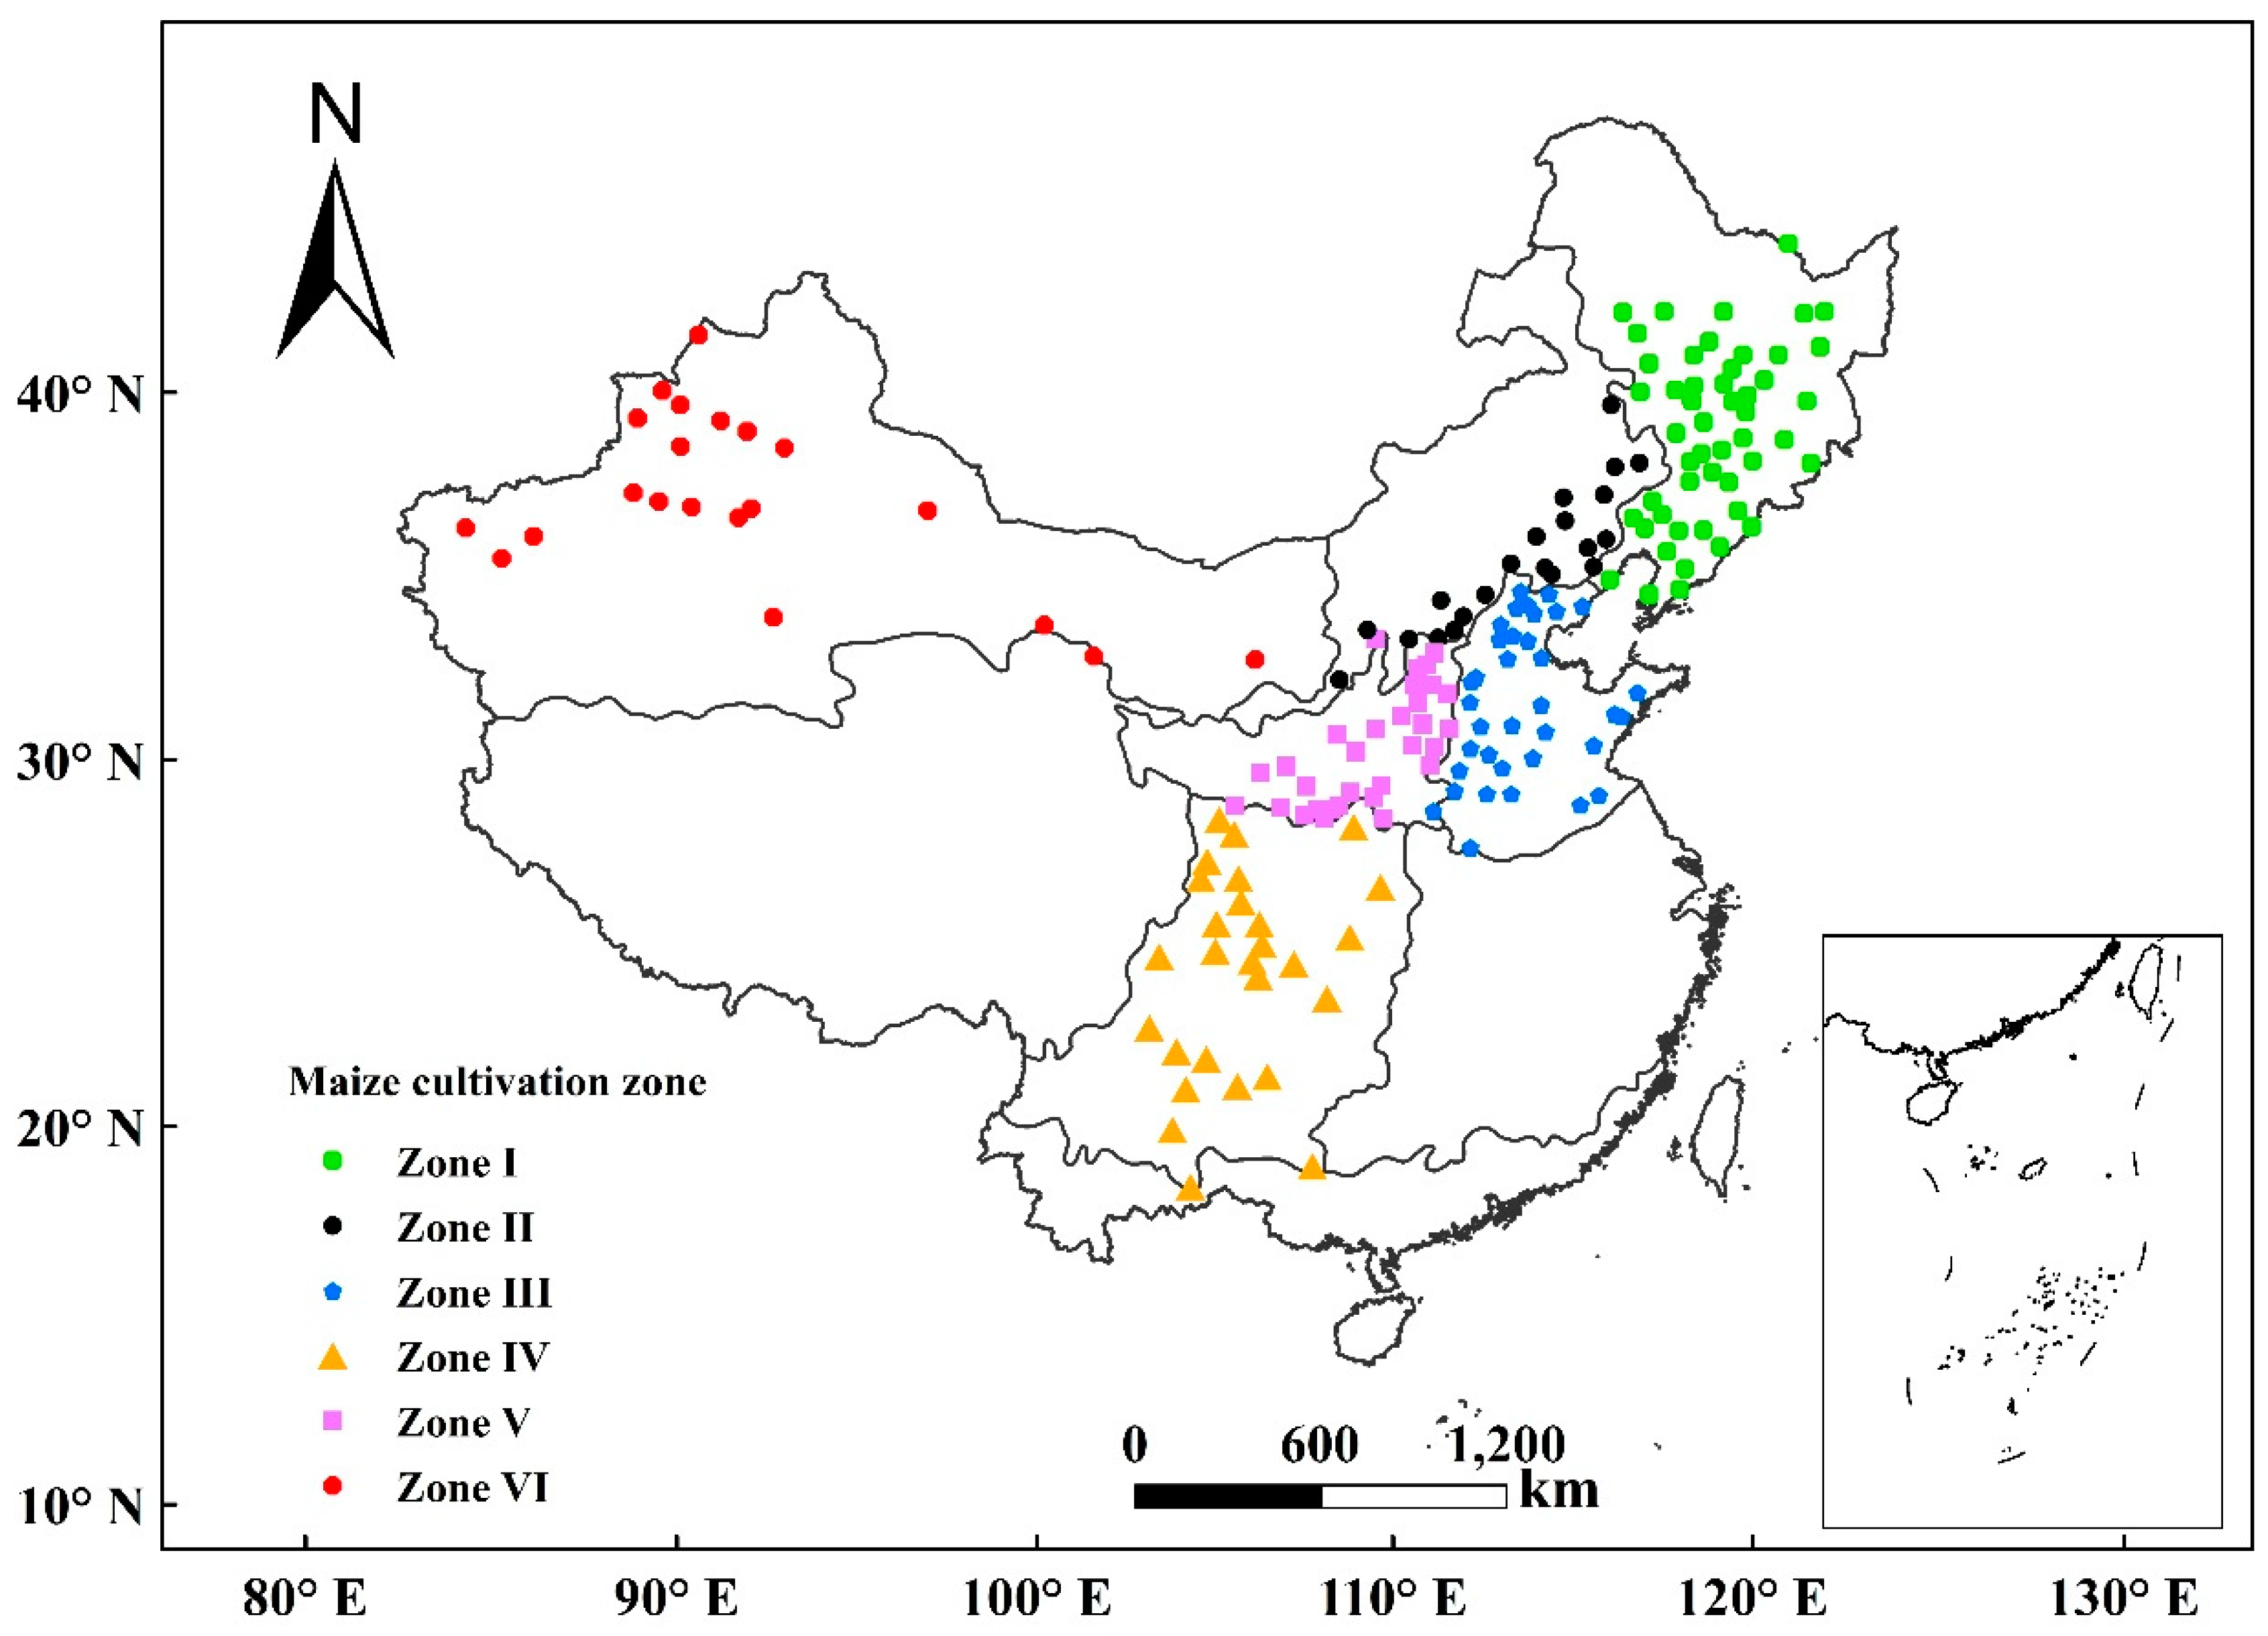
2.1. Study Area and Planting Date Data

The study areas include the major maize cultivation zones in China. Planting dates are the observed actual planting date of maize at 188 agricultural meteorological experiment stations of the Chinese Meteorological Administration (CMA) [23], for the 1992–2010 period. These stations have standardized observing guidelines and method for collecting planting dates [23]. We assume that planting is at an optimal time in these experiment stations, i.e., there is no problem with labor, supplies, or management. This is the same assumption about this dataset made by Tao et al. [24] in their study of maize phenology in China.
China has been divided into crop cultivation zones, based on the soil and climate [25]. This concept is similar to the agro-ecological zones of the Food and Agriculture Organization (FAO) [26]. The 188 agricultural meteorological experiment stations were located in six zones (Figure 1). There were 51, 21, 36, 27, 32, and 21 experiment stations for Zone I, Zone II, Zone III, Zone IV, Zone V, and Zone VI, respectively. There are two types maize: Spring and summer. The spring maize is sown in spring, and the summer maize is sown in summer.
Table 1 shows the basic information about maize cultivation in each zone. Zone I is northeast China, characterized by cold winters, warm summers, moderate precipitation, and a relatively short growing season. Precipitation is concentrated from May to September [27]. Zone II is the semiarid agricultural area of Inner Mongolia Autonomous region north of the Great Wall. In Zones I and II, most maize is spring maize. Zone III is the north China plain, which has a temperate continental climate. It is rainy and hot in summer, while dry and cold in winter. In Zone III, most maize is summer maize. Zone IV is southwest China, which has a subtropical monsoon climate. Zone V is the Loess Plateau of China, which has a temperate continental monsoon climate. Zone VI is in the arid northwest of China, including Gansu province and the Xinjiang Uighur Autonomous Region. In Zone VI, growing period precipitation is generally less than 50 mm [24] so that maize is irrigated. In Zones IV, V, and VI, both spring and summer maize are grown.
The distributions of observed maize planting dates are shown in Figure 2. Note the narrow range of planting dates for spring maize in Zone V, and for summer maize in Zones III, V, and especially VI. Note also the wide range of planting dates for both types of maize in Zone IV (southwest China), and the overlap between the two types, although summer maize is typically later than spring maize.

2.2. Climate Data

Climate data including daily mean and minimum temperatures and precipitation at 188 stations from 1992 to 2010 were collected from the CMA. Some stations without data values were filled by a gridded climate product [28]. We aggregated these by month, including average minimum temperature (Tmin), mean temperature (T), and precipitation (P). The precipitation (P) refers to the total precipitation in a month. For spring maize, previous studies, e.g., of van Oort et al. [29] in Europe show that spring planting is affected by the winter weather through soil conditions. Therefore, we used the monthly averages from February (mid-winter) to June (latest planting). For summer maize, the planting was in summer, so only growing season averages, i.e., March (earliest planting) to July (latest planting) were used.

2.3. Analyses

To answer the research question of whether or not there was a trend in climate variables over the 1992–2010 period we fit a linear model by ordinary least squares (OLS) regression, for each month of each maize type′s season in each zone, based on the experiment stations in that zone, assuming temporal independence between years. Coefficients were tested using t tests for statistical significance at p < 0.05, by the standard error of the regression coefficient. We checked for serial autocorrelation of the OLS residuals, which would have required a generalized least squares (GLS) regression with a model of temporal autocorrelation for the error term, but found none.
To solve the research question of whether or not there was a trend in planting dates over the 1992–2010 period, we fit a linear trend by ordinary least squares (OLS) regression for each maize type in each station, again confirming temporal independence between years.
To assess at what degree planting dates are related to climate, we performed principal component analysis (PCA) data reduction on the standardized predictors, followed by OLS multivariate regression over the years, using the most important derived principal components (PCs) as predictors.
PCA was used to transform a large number of original variables into a small number of uncorrelated principal components based on their influence and quantity [30,31]. PCA is a data transformation that replaces an original multivariate space with a transformed space, with uncorrelated axes, sorted by variance explained. The later components typically represent only a minor part of data variability, and so are eliminated, thereby reducing database dimensionality [32], i.e., the number of predictors to be used in subsequent regression modelling. We determined the number of principal components to retain for modelling by the parallel analysis method [33]. PCA was indicated because there is a high correlation between predictors, especially the T and Tmin of same month. The PCs were interpreted in terms of the original variables, by examining the PC loadings. Function “principal” in the R package psych [34] was used for the PCA analysis.
We assume that the planting date decision made at each station depends only on that year’s weather, i.e., no serial correlation from previous years, which we confirmed by examining the autocorrelation of regression residuals. For each spring maize in five zones, and summer maize in four zones, all observations are considered to be independent and the data from stations were combined to Ordinary Least Squares (OLS) multivariate model:
P D i , t   =   β 0 + X i , t β   +   ε i , t
where the dependent variable P D i , t is annual planting date observation at station i in year t, from 1992 to 2010. The coefficient β 0 denotes an intercept, the design matrix X i , t has an initial column of 1′s and then one column for each principal component scoring for the maize type, at station i in year t. The equation is solved for the coefficient vector β . The error vector ε i , t assumes temporal independence between years (confirmed with autocorrelation analysis) and spatial independence between stations.
In some zones there were outliers, i.e., planting dates far from the majority. Therefore, we re-fitted the planting date observation and independent variables with robust regression [35], using the Huber and bisquare methods with default parameters suggested by the rlm function of the MASS R package [36]. All coefficients of determination were reduced by less than 3%, and all but two (Zones II and IV spring maize) by less than 0.5%, indicating that the outliers did not have high leverage in the OLS multivariate regression model. Therefore, we reported the adjusted coefficient of determination of the OLS multivariate regression as the proportion of variance explained.
Several other studies of the effect of climate on planting dates or yield [37,38,39] used panel regression models. In this study we did not use such models. We did not consider stations as fixed effects, because we are not interested in the differences between specific stations. There could well be systematic bias over years in individual stations (e.g., a conservative or aggressive approach to planting by the farm management); however, there is no way to distinguish any such traits from the site-specific effects of the climate. It’s assumed that any bias is minimal, because these agricultural experiment stations are under the same administration and regulations.

3. Results

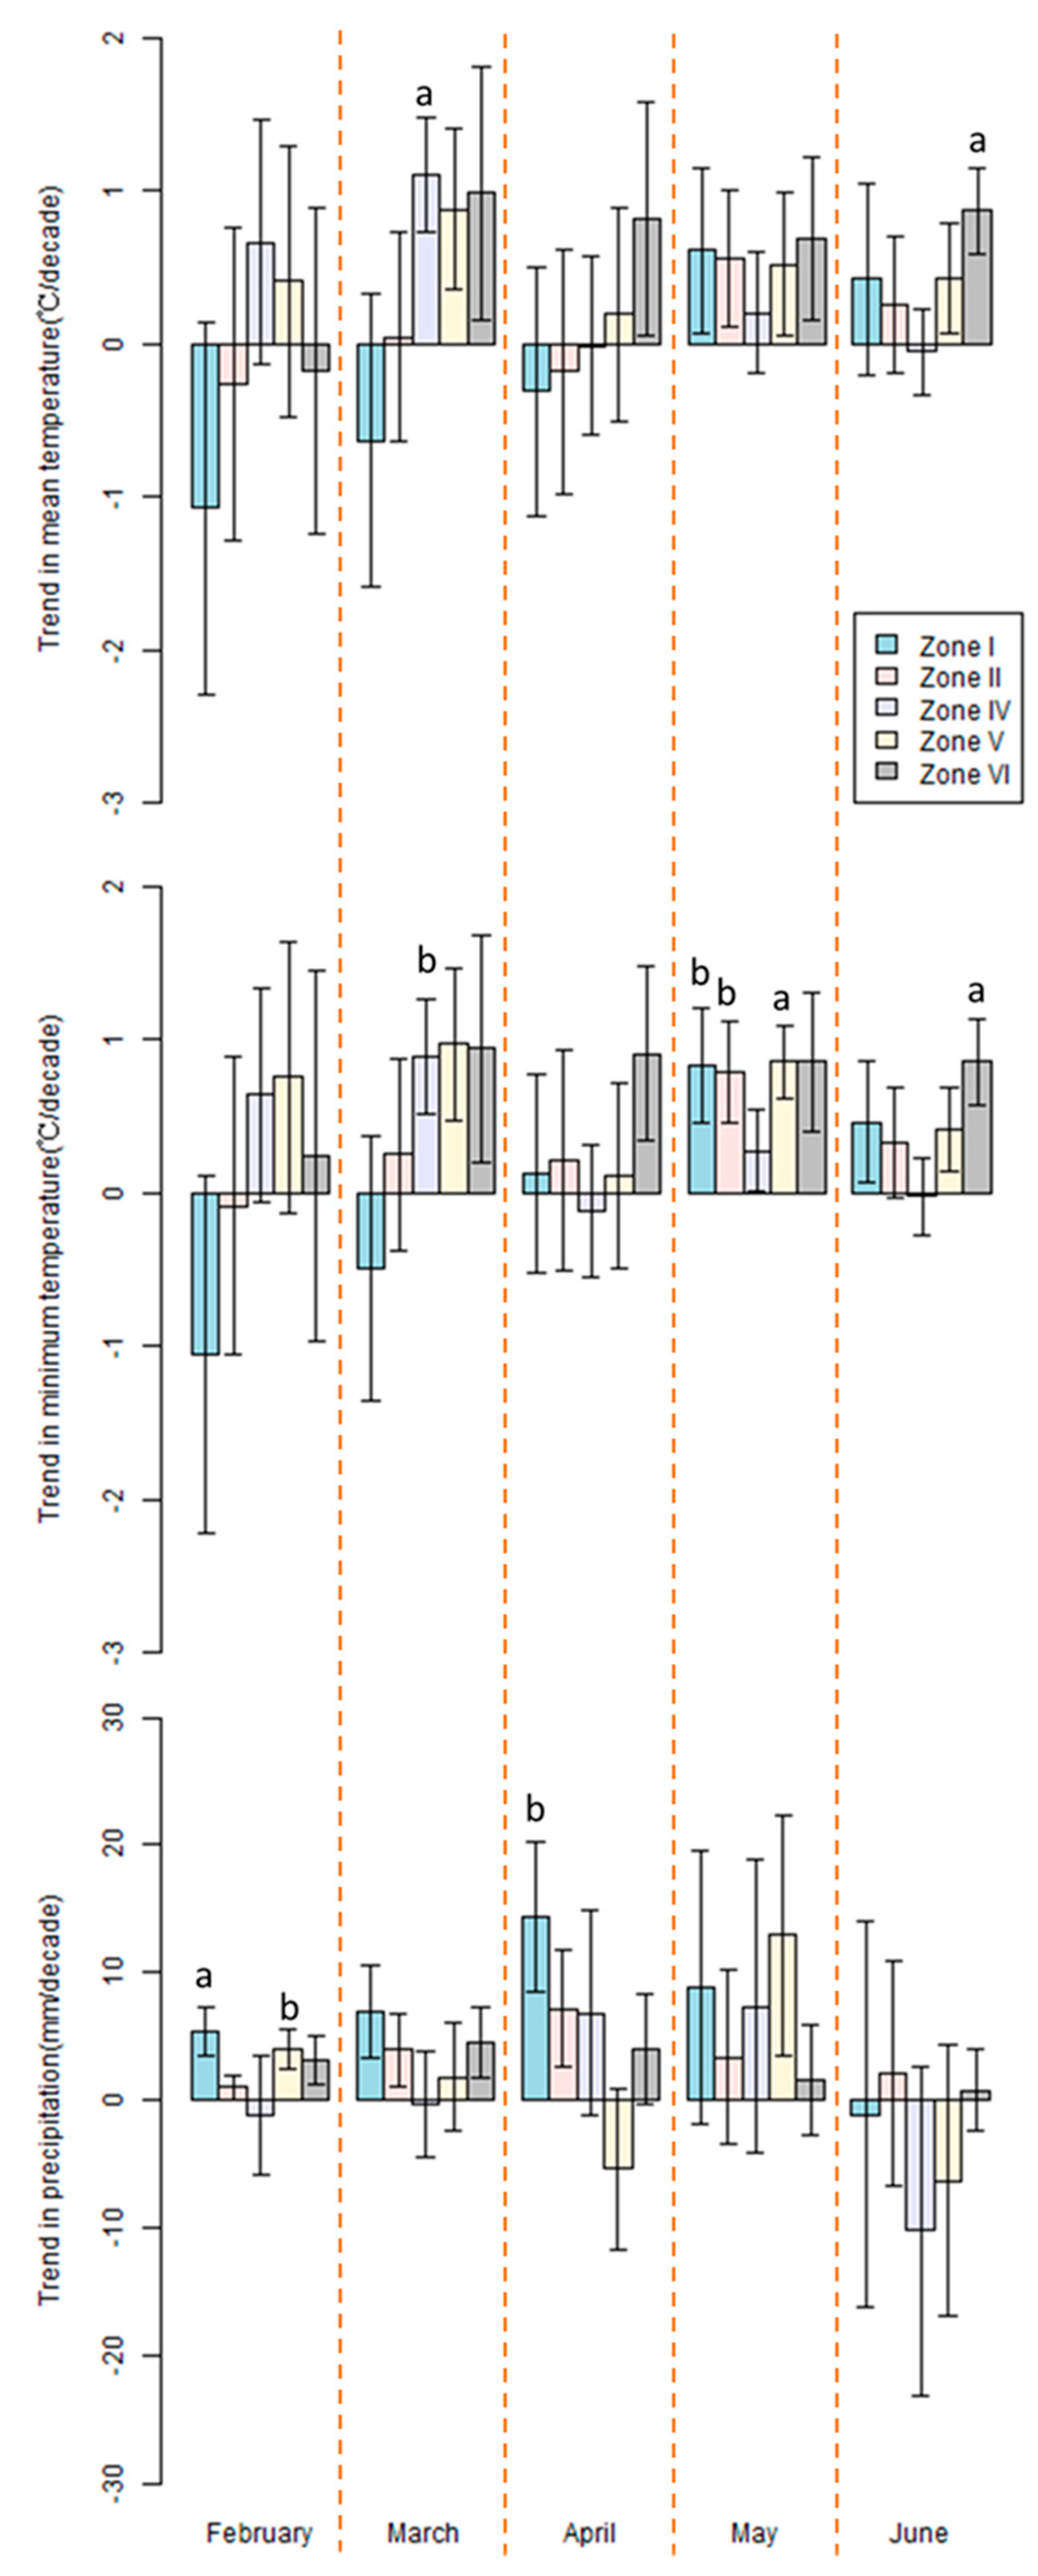
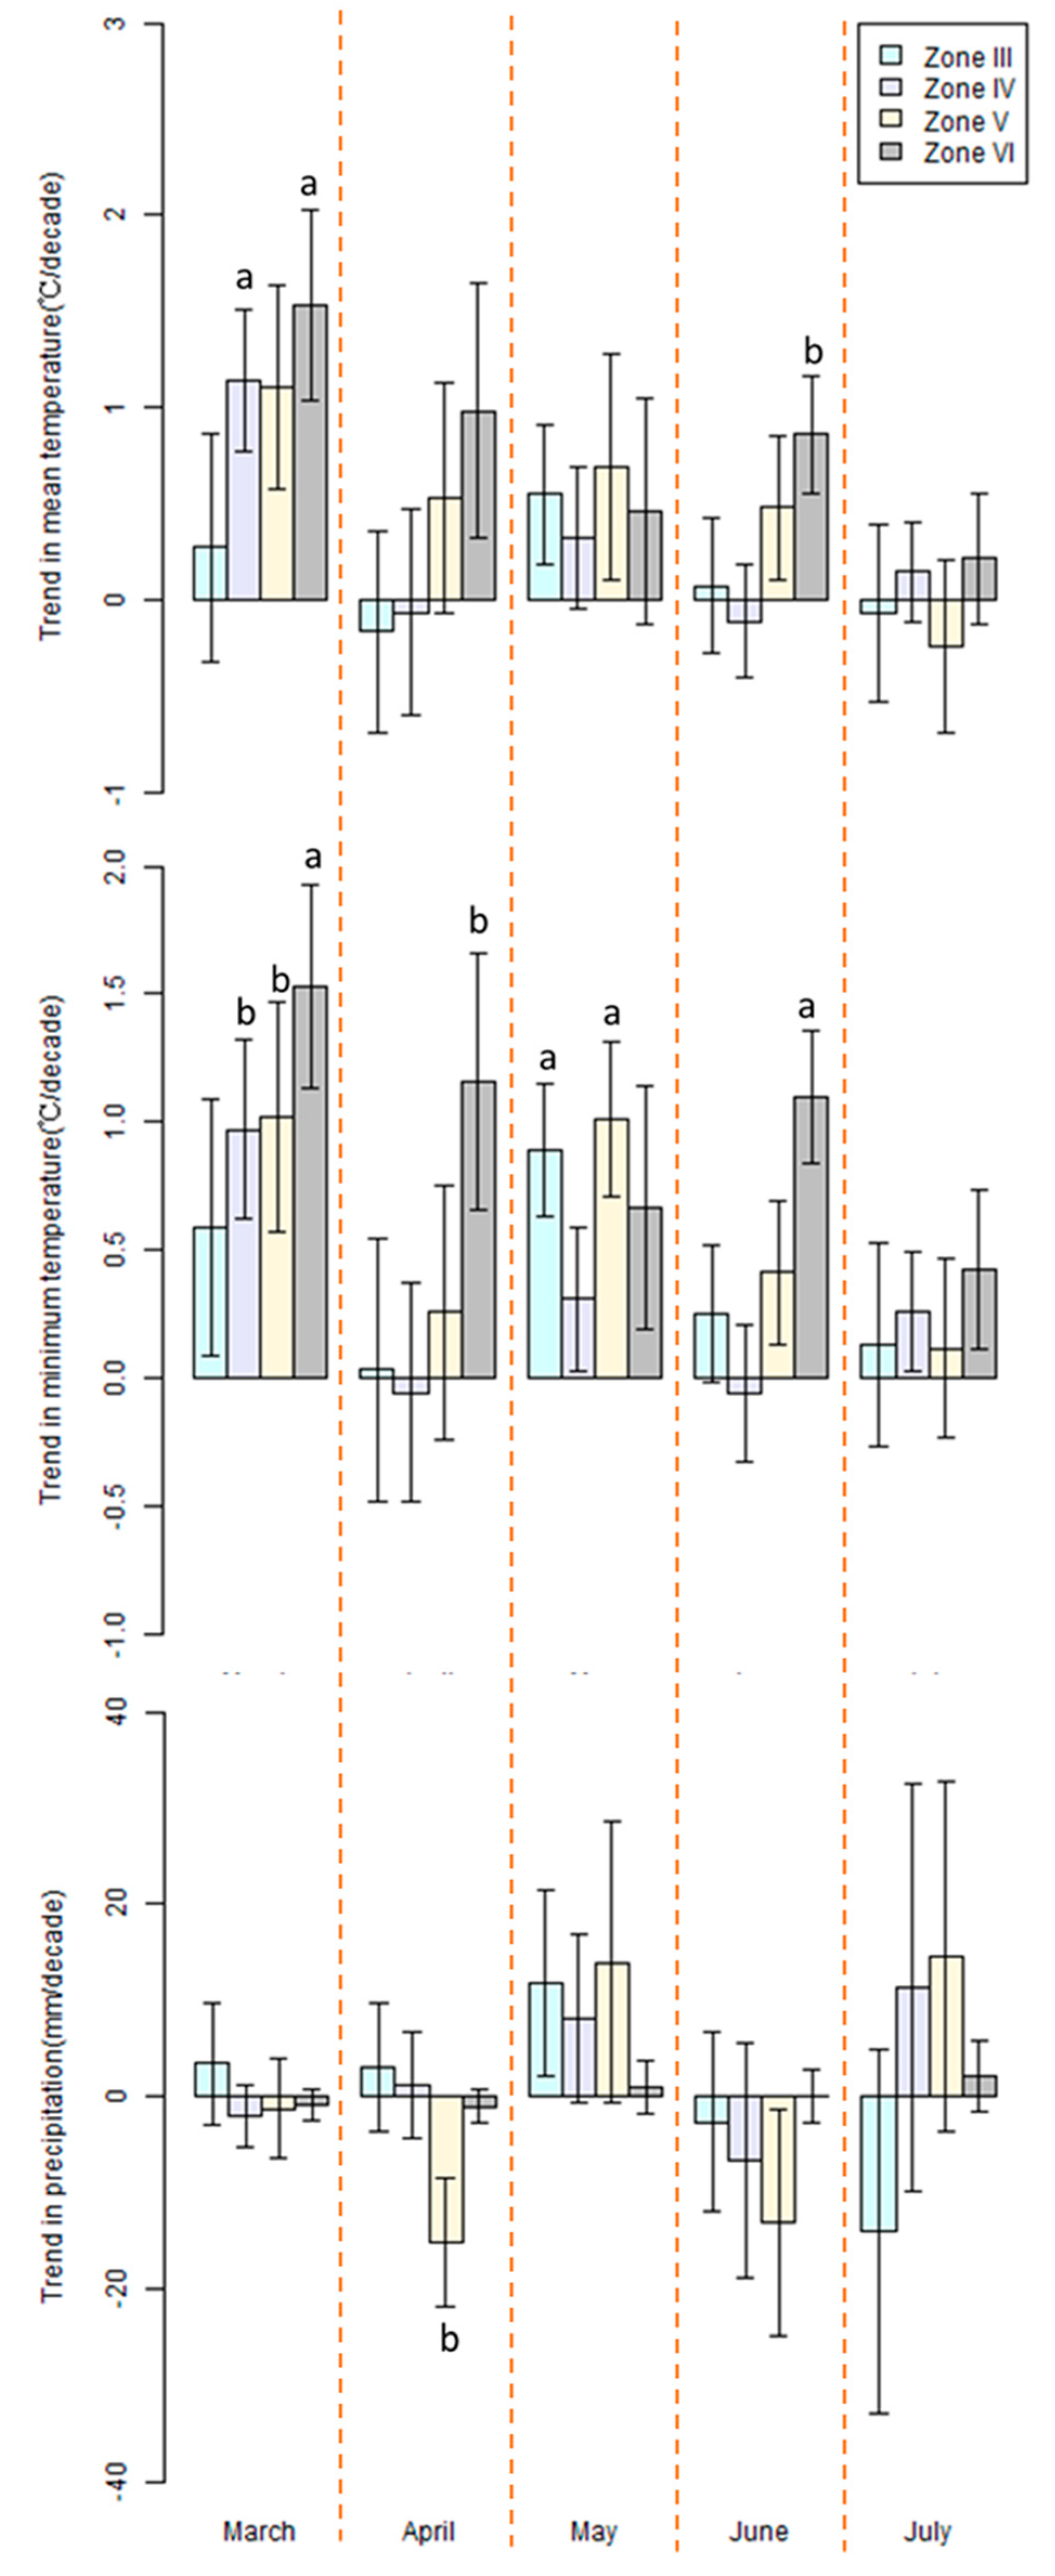
3.1. Climate Trends in the Major Maize Production Zones from 1992 to 2010

3.1.1. Spring Maize

Figure 3 shows the T, Tmin, and P trend coefficients in the five spring maize production zones. In Zone I (northeast China) during February to April, T and Tmin decreased slightly. At the same time, precipitation increased significantly in February and April, which increases the risk of spring freezing with the lower temperature. Tmin of May increased significantly at 0.01 level. In Zone II, T, Tmin, and P changed little during February to June, except Tmin of May, which increased significantly at 0.05 level. In Zone IV (southwest China), the T and Tmin of March increased significantly by about 1.1 °C decade−1 and 0.9 °C decade−1, respectively. In Zone V, only Tmin of May increased significantly by about 0.9 °C decade−1 and precipitation of February increased notably. In Zone VI, T and Tmin of June increased significantly at 0.05 level by 0.9 °C decade−1.

3.1.2. Summer Maize

Figure 4 Tmin increased significantly for most zones while precipitation changed little in most zones. In Zone III, T, Tmin, and precipitation changed little during March to July and only Tmin of May increased significantly by about 1.0 °C decade−1. In Zone IV (southwest China), like the trend of spring maize stations (Figure 3), the T and Tmin of March increased significantly by about 1.1 and 1.0 °C decade−1, respectively. In Zone V, Tmin of March and May increased notable by 1.0 °C decade−1, respectively, and precipitation of April decreased notable by 15 mm/decade. In Zone VI, the T of March and June increased significantly by 1.5 and 0.9 °C decade−1, respectively. The Tmin of March, April, and June increased significantly by 1.5 °C decade−1, 1.2 °C decade−1, and 1.1 °C decade−1, respectively.
In addition, the trends in T, Tmin, and precipitation for the different zones in March, April, May, and June are not the same between Figure 3 and Figure 4. That’s because stations are different for spring and summer maize, although some regions such as Zones IV, V, and VI have a spring maize station and a summer maize station. One station only has one type maize.

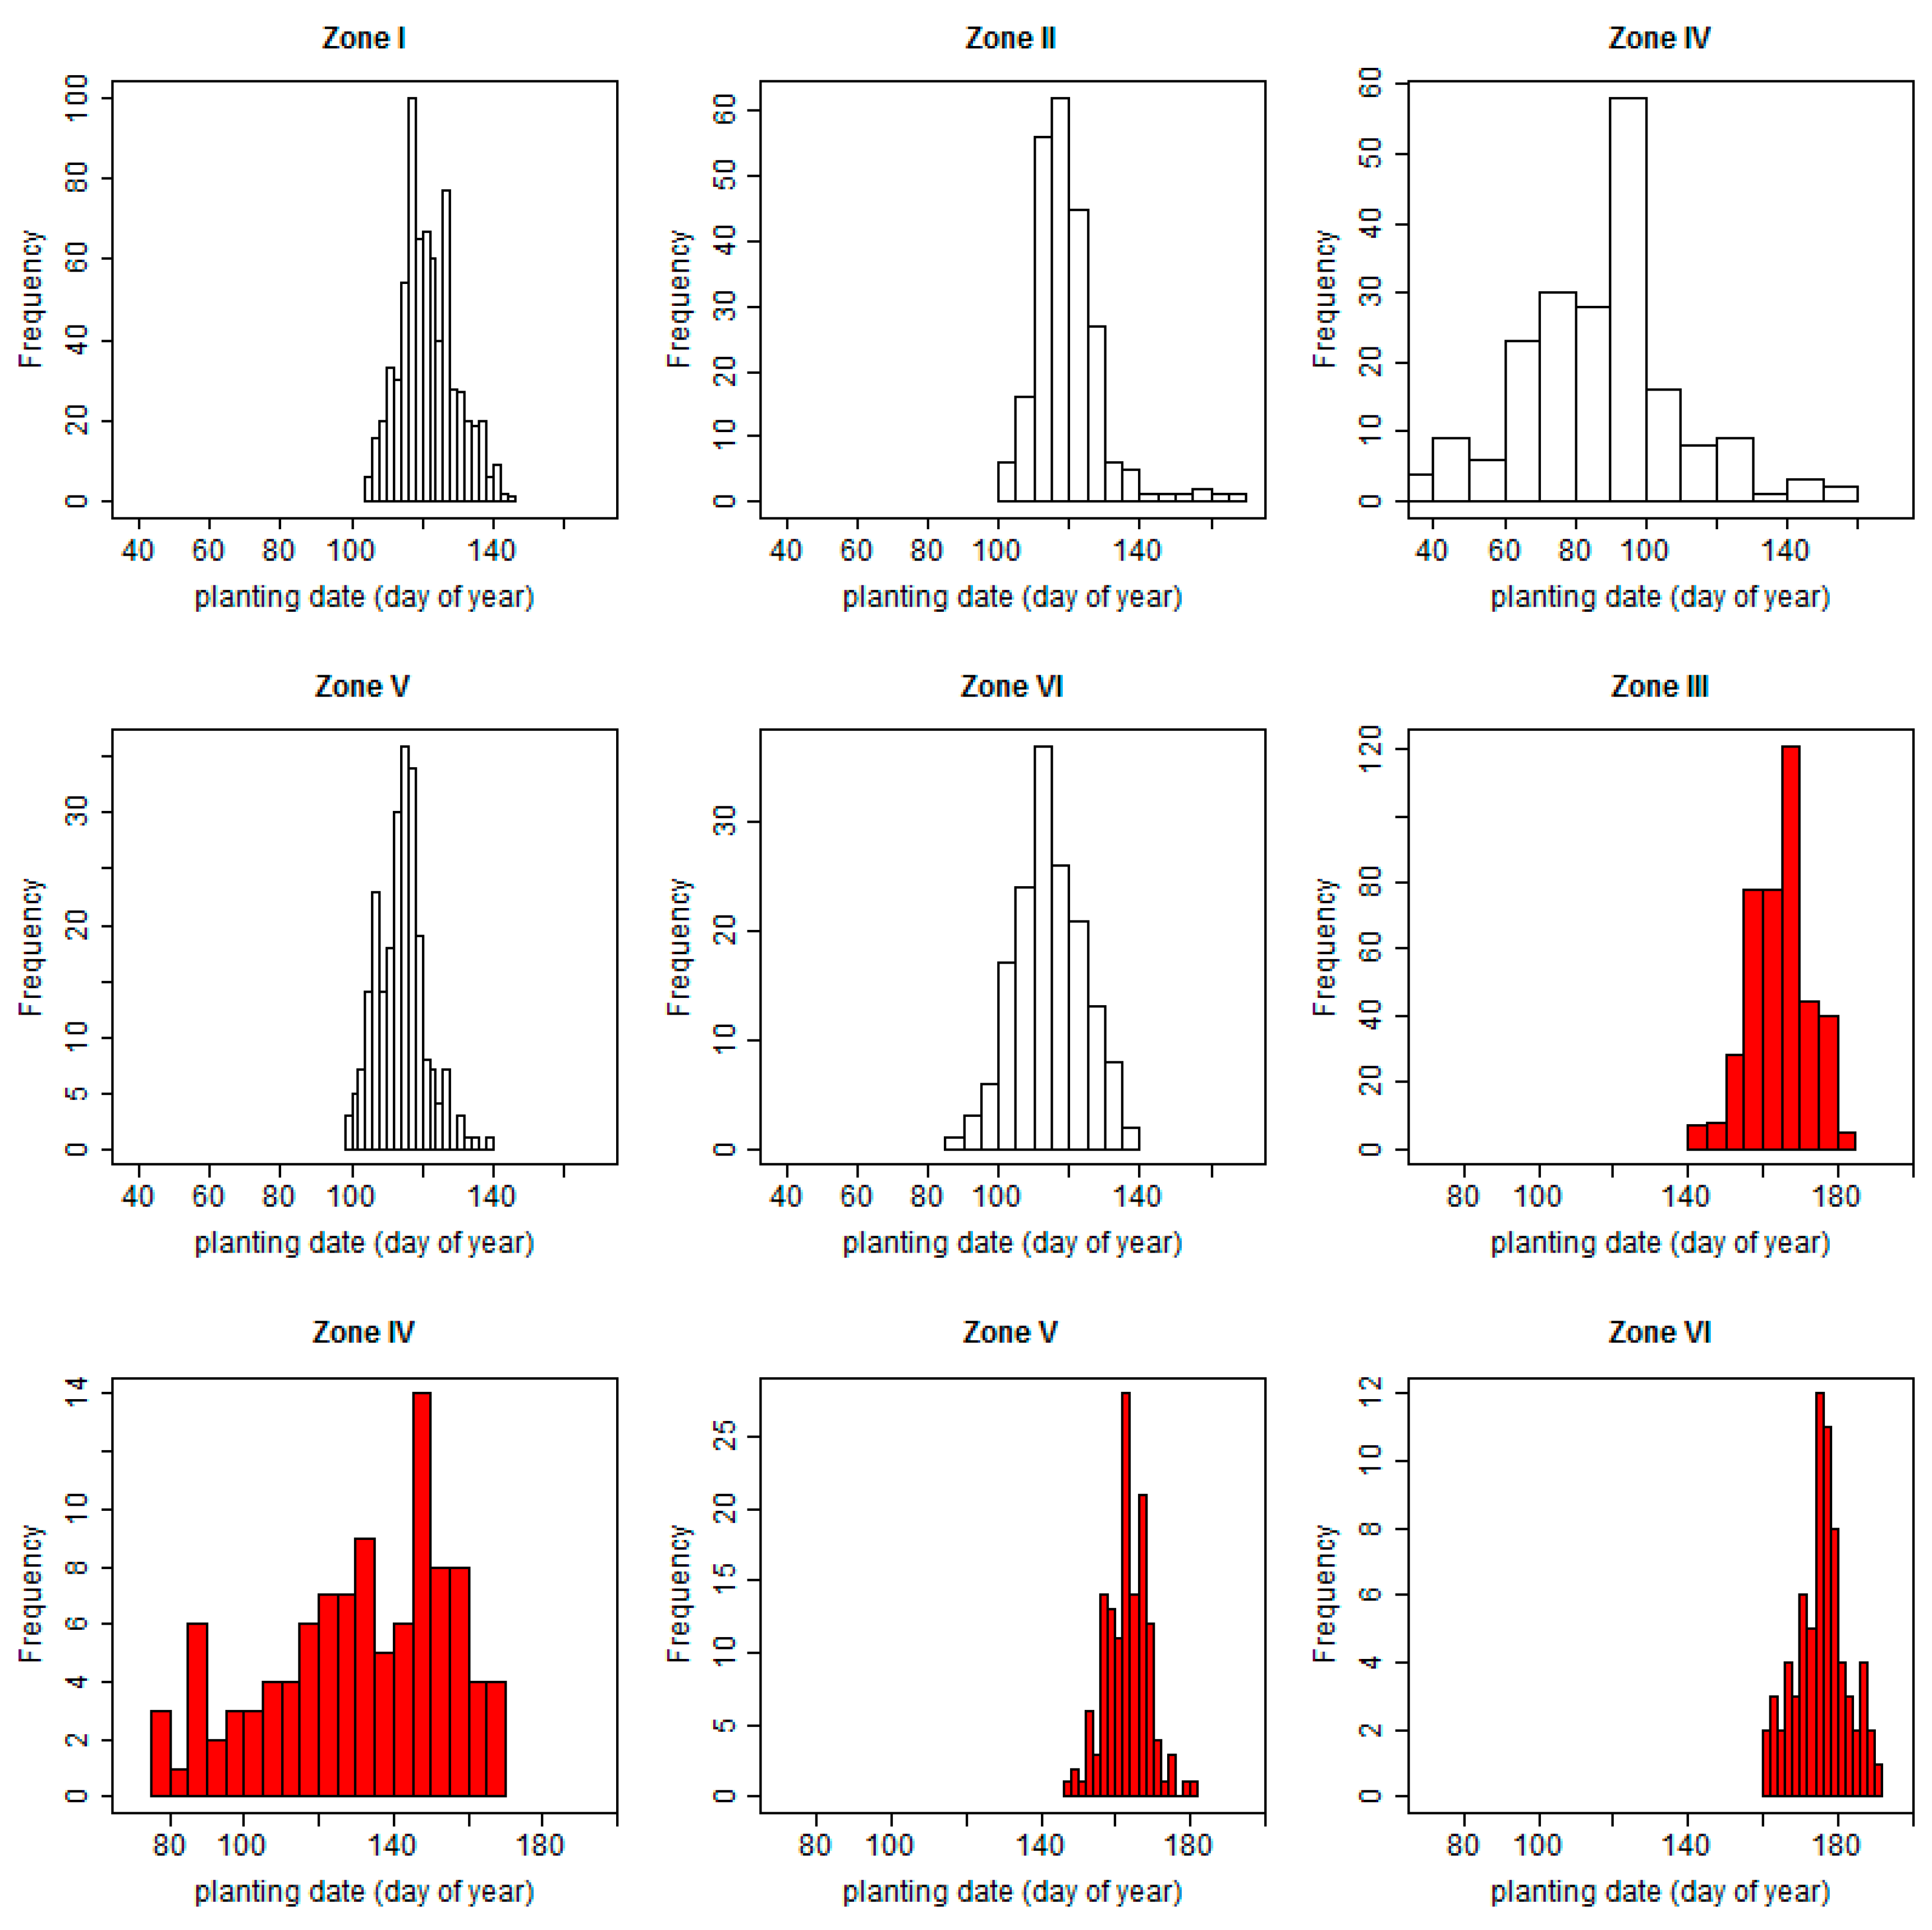
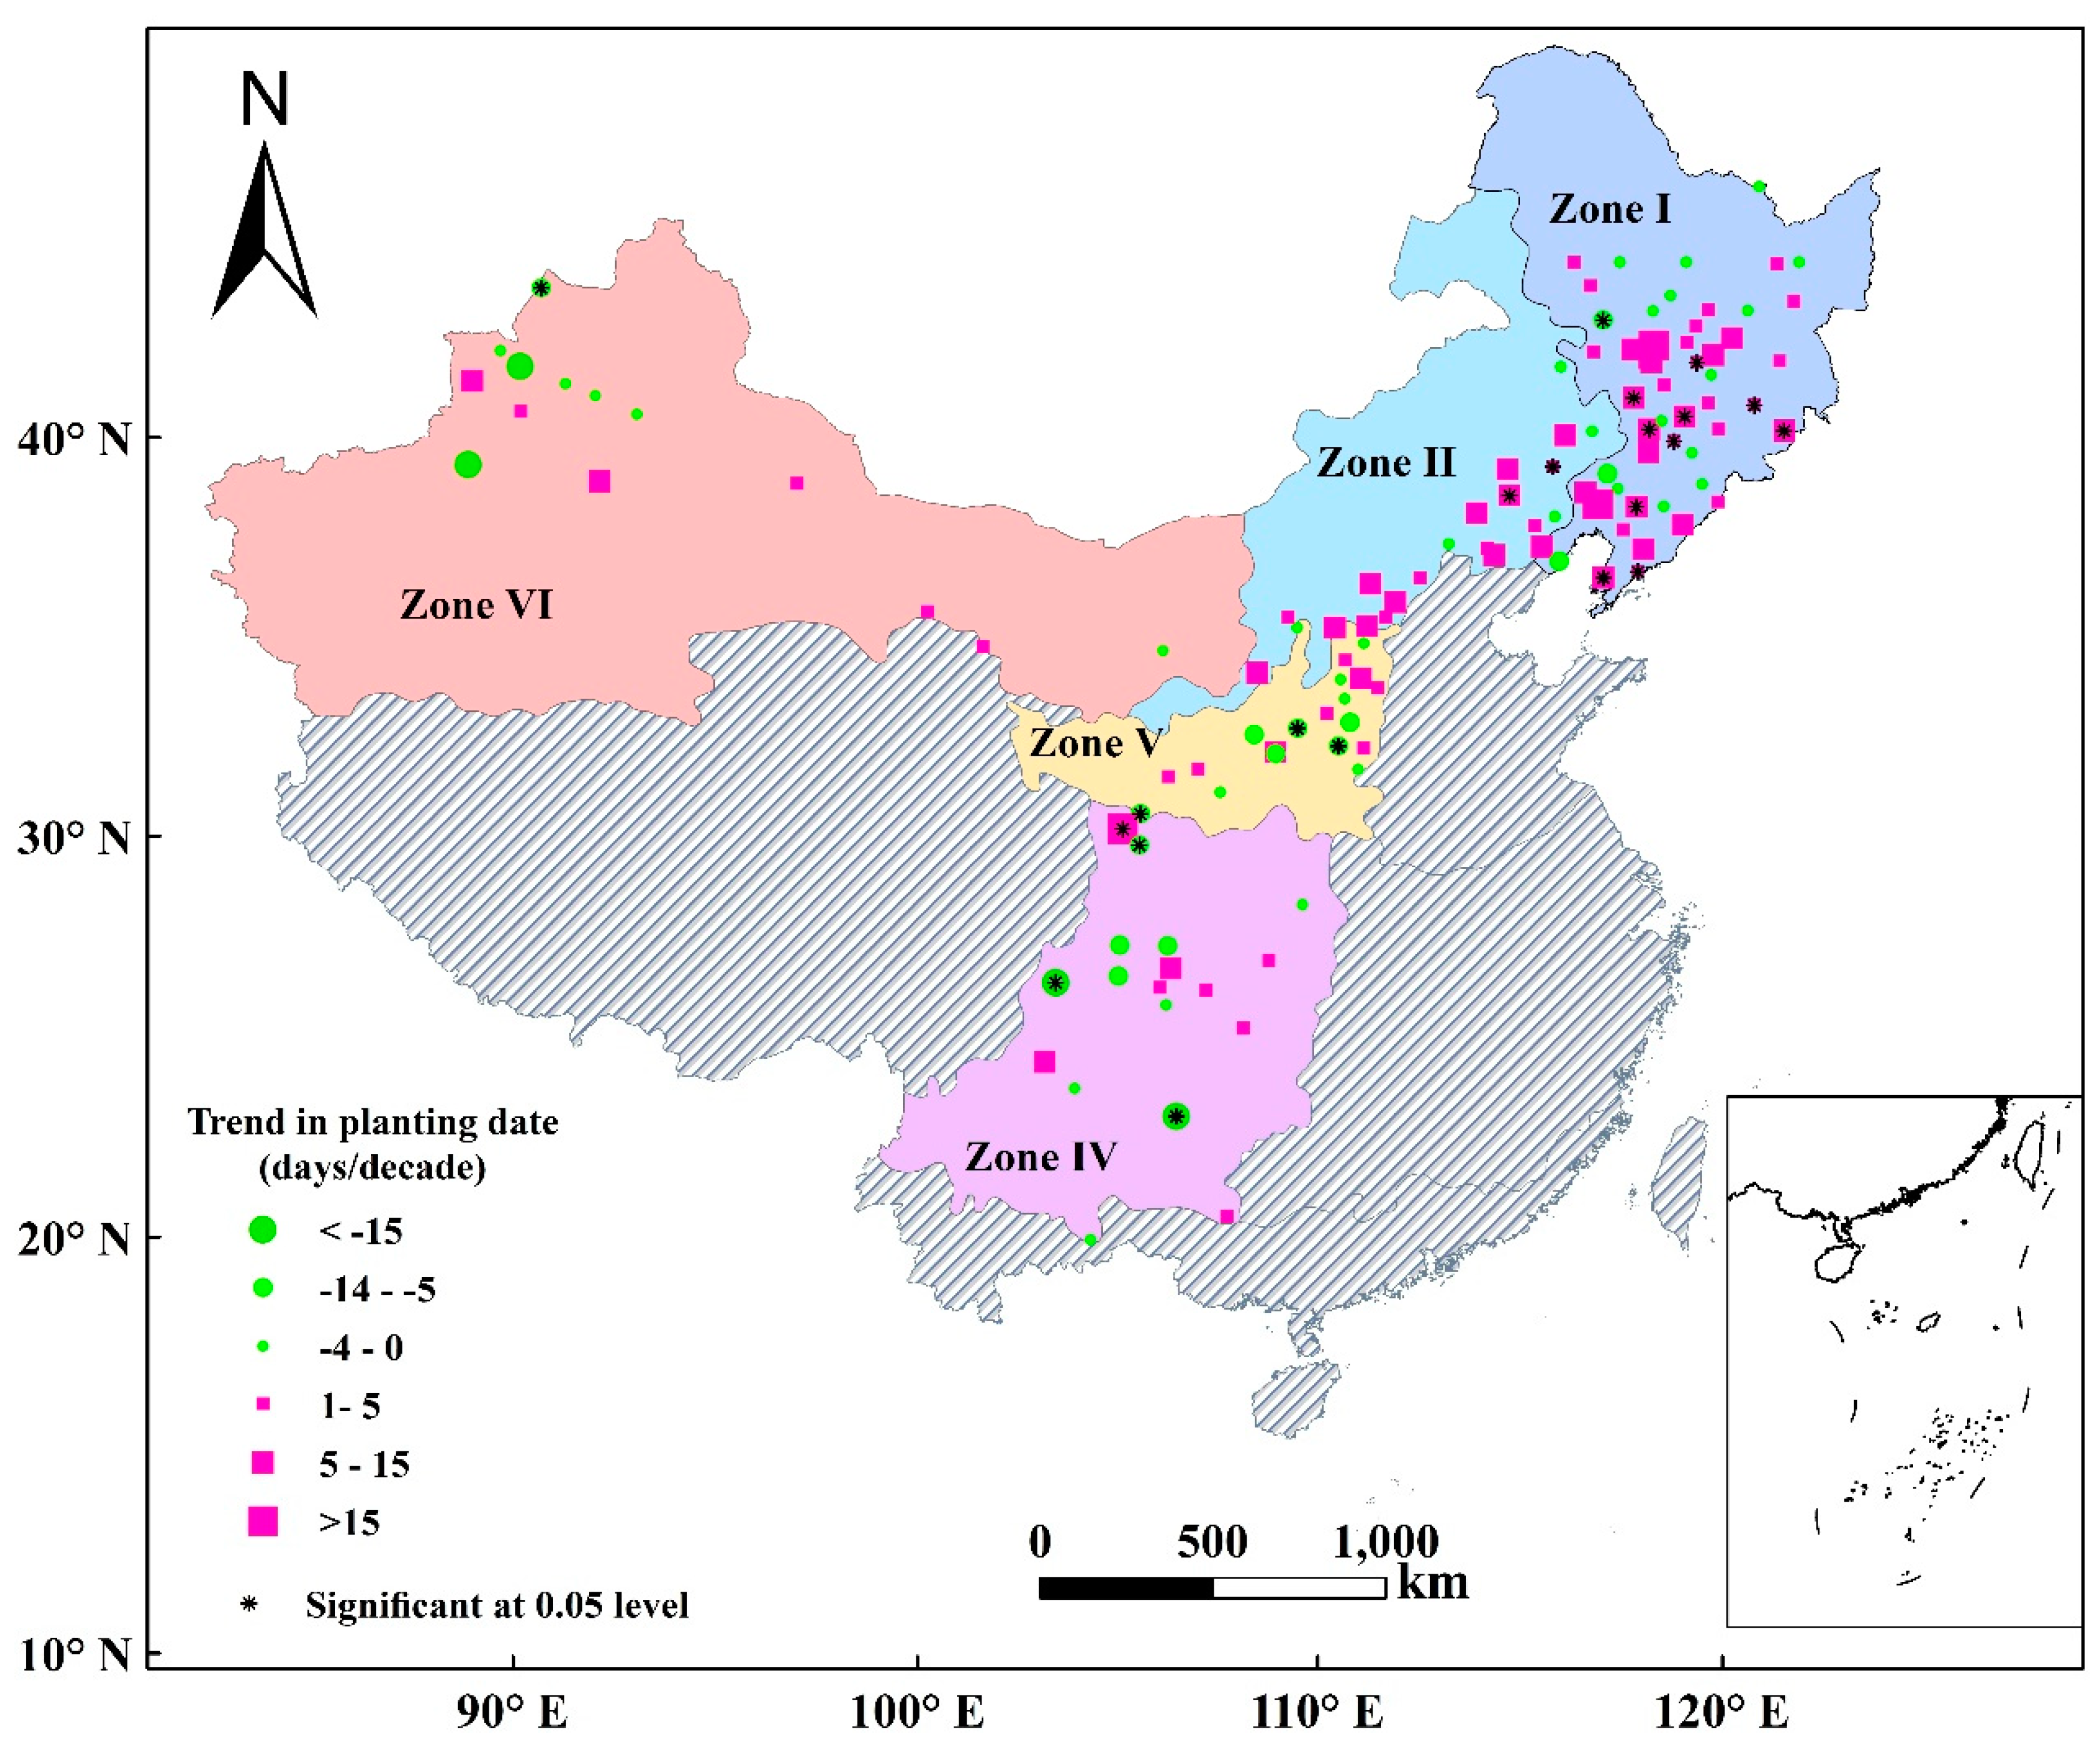
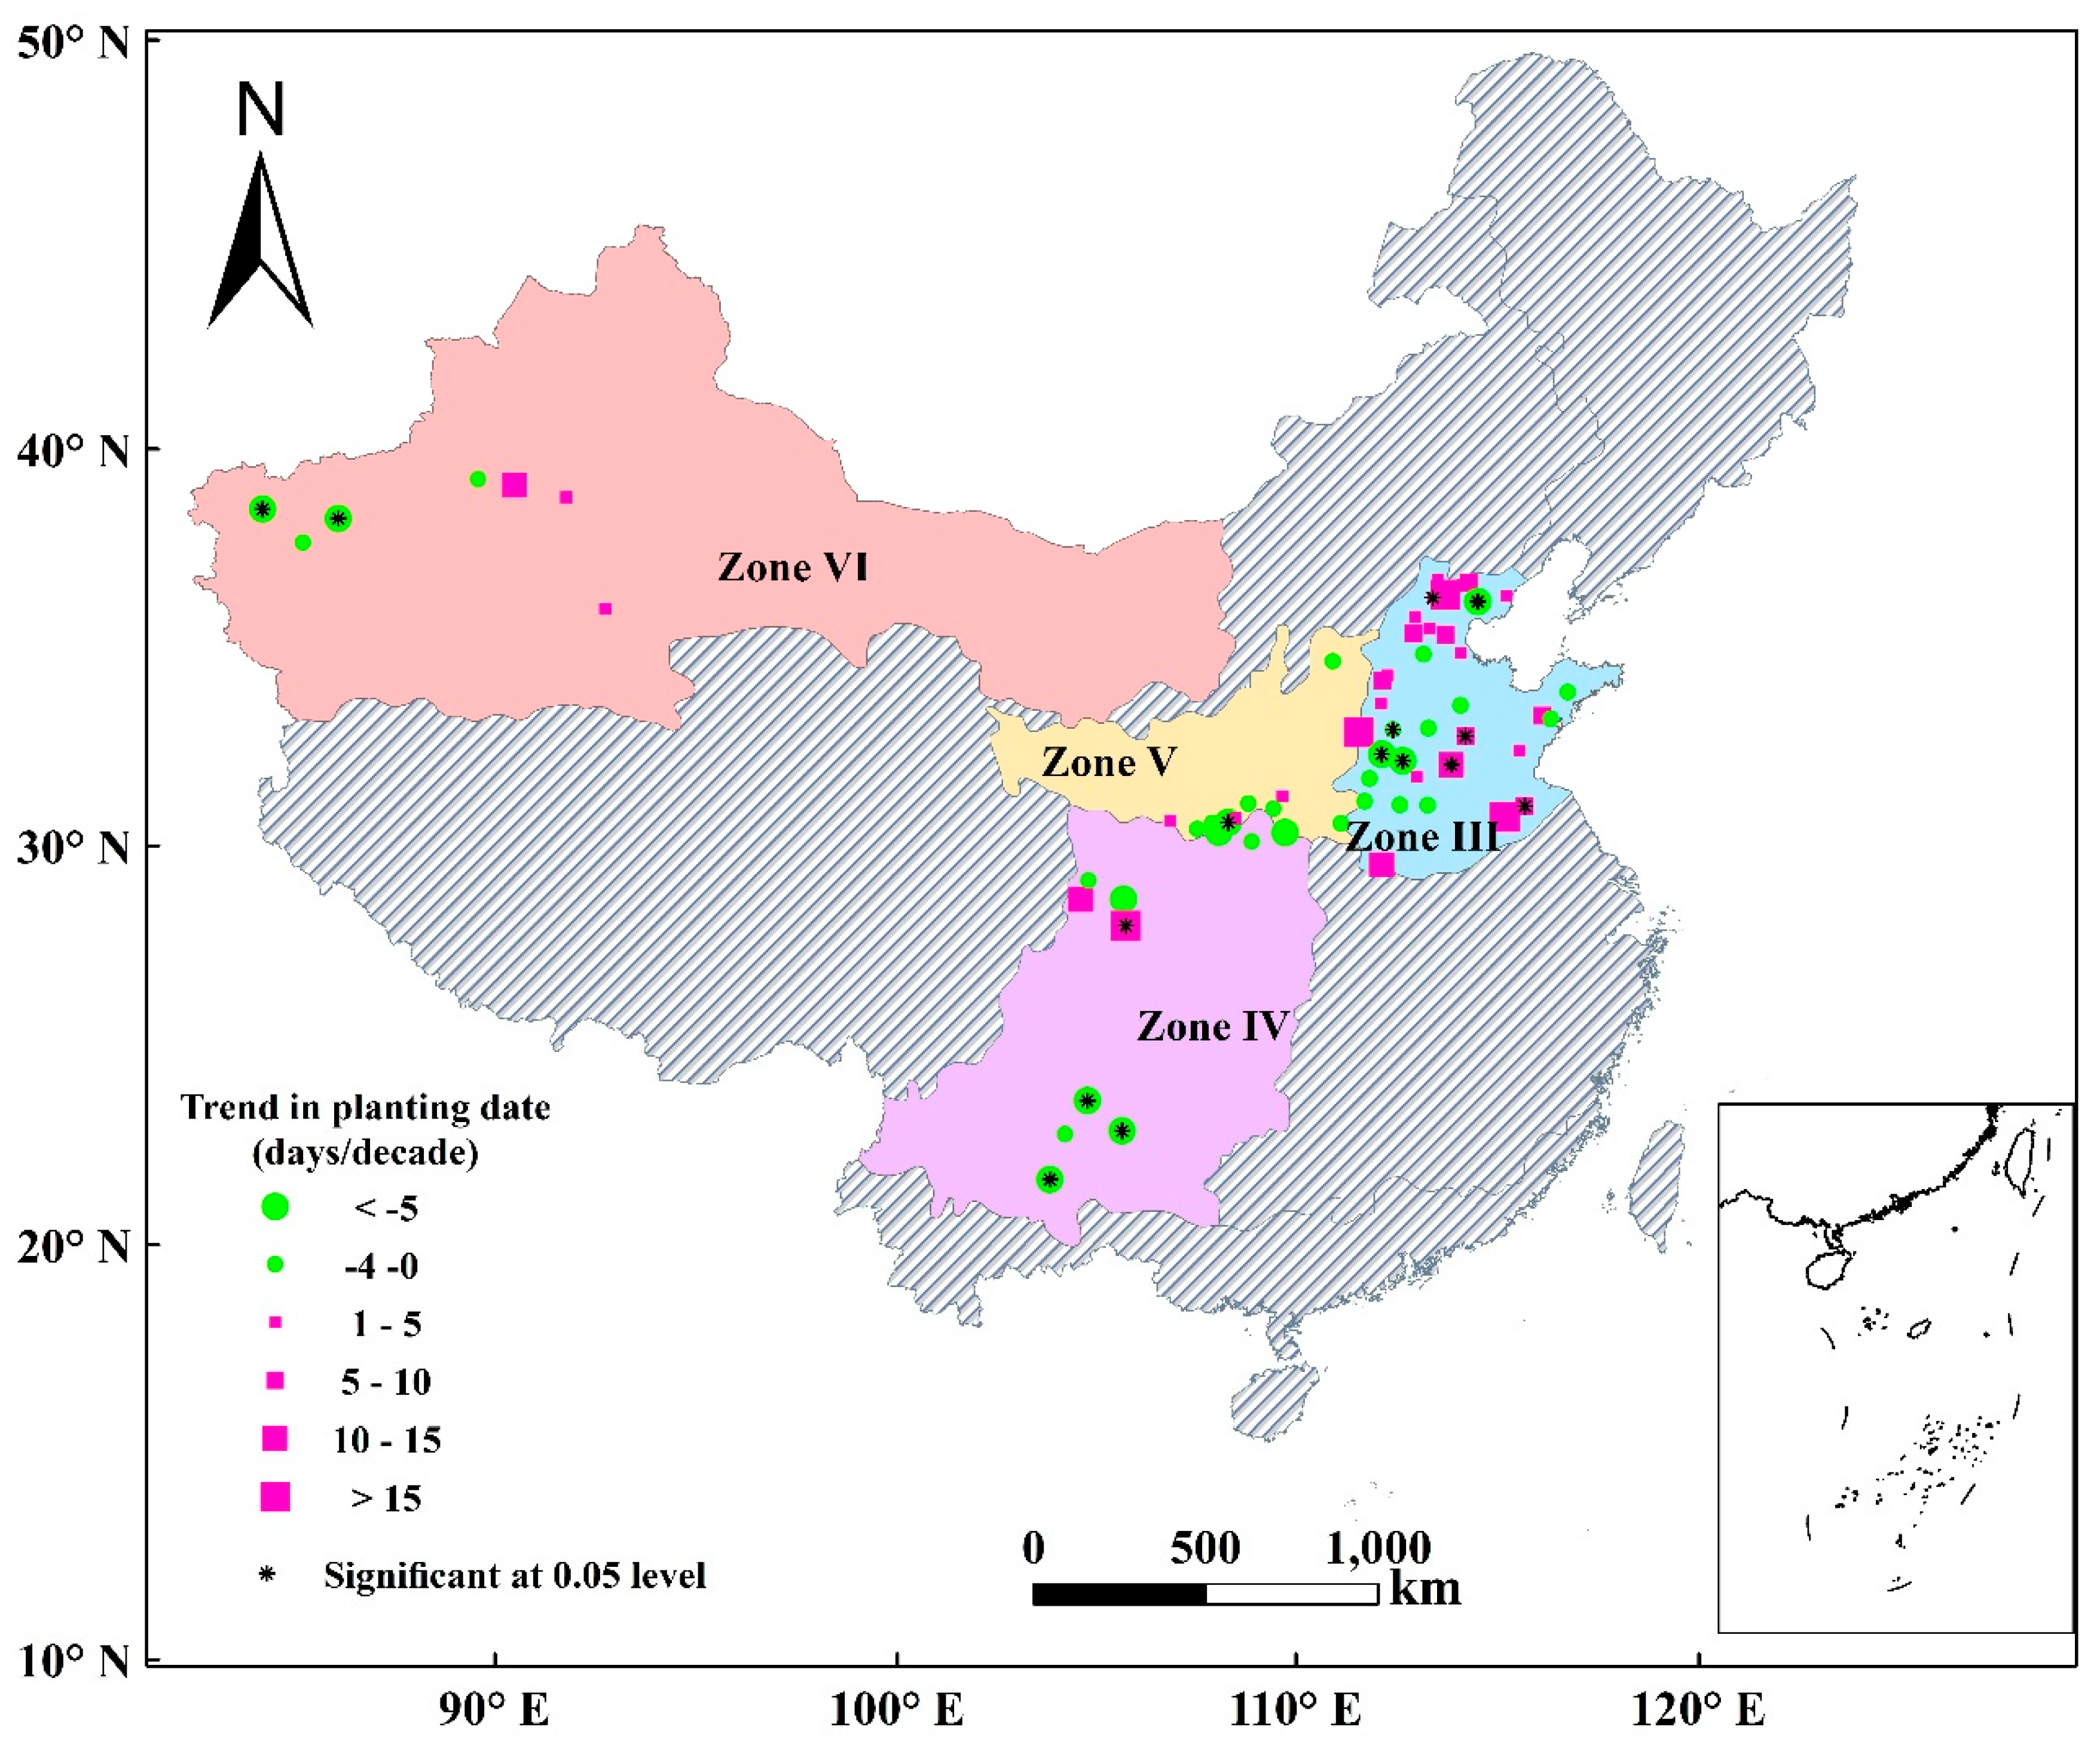
3.2. Trend of Planting Dates

3.2.1. Spring Maize

Figure 5 shows the trends in planting dates of spring maize. Planting dates of spring maize was delayed at 74 (59.7%) out of 124 stations, mainly in the Zones I, II, and IV, of which 13 (10.5%) were delayed significantly at 0.05 level. Especially in Zone I (northeast China), there were 35 (68.6%) stations out of 51 stations where the planting date was delayed on average by 6.1 days decade−1. The planting date advanced at 50 (40.3%) stations out of 124 stations, advanced at 8 (6.4%) stations, mainly in the Zones IV (southwest China) and V (the Loess Plateau of China) (Figure 5). The planting date advanced on average by 5.2 days decade−1. In summary, for high latitude region, planting generally became delayed. But for middle or low latitude region, the planting date generally advanced.

3.2.2. Summer Maize

Figure 6 shows the trends in the planting dates of summer maize trends during 1992–2010. During 1992–2010, planting dates of summer maize advanced at 33 (51.5%) stations out of 64 stations, advanced significantly at 10 (15.6%) stations, mainly in Zones III and IV. The planting date advanced on average by 4.3 days decade−1. Summer maize was sown at the beginning of summer. Farmers do not have to worry about the effect of low temperature on planting. Generally, sowing became advanced with the increased temperature. But the planting date delayed significantly at 5 (7.8%) stations. The planting date delayed on average by 7.1 days decade−1, mainly in the Zone III (north China of plain).

3.3. Principal Component Analysis (PCA)

As Figure S1 shows, a scree plot and parallel analysis with 100 simulations suggest retaining 4, 3, 2, 3, and 3 principal components for spring maize Zones I, II, IV, V, and VI, respectively. Similarly, Figure S2 shows that 3, 3, 2, and 5 principal components are retained for summer maize in Zones III, IV, V, and VI, respectively. Components and factors are interpreted by examining loadings. Contributions of original variables to each principal component (PC) can be conveniently divided into three classes based on the loading scores: Strong (>0.75), moderate (0.75–0.50), and weak (0.50–0.30), respectively [40].

3.3.1. Spring Maize

Generally, the temperature component is the first principal component in most zones. In Zone I, four principal components explain 76% of the total variance (Table 2). The first principal component (PC1) accounts for 40% of the total. This component is largely derived from a significant positive loading of T and Tmin in February to May and a moderate to weak positive loading in June. Thus, PC1 can be interpreted as a temperature factor: High temperatures are correlated with high positive values of this PC. The second principal component (PC2) explains 15% of the total variance, and is mostly a strong positive loading of T6 (monthly mean temperature of June) and moderate positively loading of Tmin6 (monthly average minimum temperature of June), opposed to a moderate negative loading of P6 (monthly precipitation of June). PC2 thus mostly represents temperature of June beyond that accounted for (weakly) in PC1 from the earlier months. The third principal component (PC3) explains 12% of the total variance, and has a moderate positive loading of precipitation form February to May. PC3 thus represents precipitation except for the final month. The fourth principal component (PC4) only explains 8% of the total variance. PC4 is derived from a moderate positive loading of T5 (monthly mean temperature of May); a weak positive loading of P2 (monthly precipitation of February), P4 (monthly precipitation of April), and Tmin5 (monthly average minimum temperature of May); and weak negative loading of P5 (monthly precipitation of May). PC4 represents the precipitation in pre-planting (February) versus the weather during the main planting period (April and May).
In Zone II, three principal components explain 64% of the total variance (Table S1). As in Zone I, PC1 of Zone II also represents temperature. PC2 is loaded with positive loading of the first nine variables and negative loading of the second five variables. PC2 represents the weather in pre-planting versus late-planting. PC3 accounts for 11% of the total variance and is loaded with strong positive loading of P3 and moderate negative loading of P6. As such, it may represent the precipitation in March versus June.
In Zone IV, two principal components account for 74% of the total variance (Table S2). The PC1 correlates strong positively with temperature variables. As such, it represents temperature factor. The PC2 is loaded with moderate positive loading of precipitation and represents precipitation factor.
In Zone V, three principal components account for 67% of the total variance (Table S3). Like Zones I and II, the PC1 represents the temperature factor and is loaded with strong and moderate positive loading of T and Tmin from February to June. PC2 is loaded with moderate positive loading of Tmin2, P3 and P5; moderate negative loading of T5; weak positive loading of T2, P2, Tmin3, P4; weak negative loading of T6 and Tmin6. It represents the factor which is combined the precipitation and the versus between pre-planting temperature to last-planting. PC3 is loaded with moderate positive loading of P4 and P6; weak negative loading of P2 and P5. PC3 represents the precipitation factor.
In Zone VI, three principal components account for 76% of the total variance (Table S4). The PC1 is loaded with positive loading of T and Tmin; negative loading of precipitation from February to June. It appears to be a temperature versus precipitation factor. The PC2 is loaded with negative loading of T2, Tmin2, T3, and Tmin3; positive loading of other variables. It appears to be a factor which is combined precipitation and the versus between pre-planting temperature to last-planting. PC3 represents weather of the pre-planting factor.

3.3.2. Summer Maize

Similarly to the results for spring maize, the temperature component also is the first principal component in most zones. In Zone III, three principal components account for 67% of total variance (Table 3). As shown in Table 3, PC1 represents a factor that is the temperature of related month. PC2 represents precipitation factor. PC3 represents a factor which is the precipitation of pre-planting (March, May) versus last-planting (June, July).
In Zone IV, three principal components explain 74% of total variance (Table S5). As shown in Table S5, PC1 represents a temperature factor. PC2 represents a factor that is combined temperature of pre-planting and precipitation of late-planting. PC3 appears to be a factor which is temperature versus precipitation of pre-planting.
In Zone V, two principal components explain 68% of total variance (Table S6). PC1 is loaded with strong positive loading of T and Tmin from March to July. It represents a temperature factor. PC2 represents precipitation factor.
In Zone VI, five principal components explain 77% of total variance (Table S7). PC1 represents the temperature factor. PC2 represents the temperature of pre-planting versus temperature of last-planting. PC3 appears to be a factor which is the precipitation of March, April, and May. PC4 represents a factor which is the weather of April versus May. PC5 appears to be a factor which is the precipitation of late-planting (June and July).

3.4. OLS Multivariate Regression Model

3.4.1. Spring Maize

Table S8 shows the coefficients, standard error, and levels of significance for the planting date (day of year), regressed against PCA in each zone for spring maize. Table 4 shows the OLS regression of planting date on principal components of the climate variables, along with the adjusted coefficient of determination (R2) for spring maize in each zone.
In Zone I (northeast China) 32% of the variation in planting dates was explained by weather. PC1 (temperature factor) has a negative coefficient, meaning that warmer early- and mid-season temperatures are related to earlier planting. PC2 (higher temperature of June combined with lower precipitation of June) is related to somewhat later planting. PC3 (precipitation factor) and PC4 (the precipitation in pre-planting versus the weather during the main planting period factor) are positive coefficient.
In Zone II (semiarid), almost none (5%) of the total variation in planting dates was explained by weather. In this zone climatic conditions are of minor importance for the timing of planting. So, these climate variables can hardly be used to explain the variation in planting dates of Zone II.
In Zone IV (humid subtropics), 33% of the variation in planting dates was explained by weather. PC1 (temperature factor) is significant with negative coefficient meaning that warmer early- and mid-season temperatures are related to earlier planting. PC2 (precipitation factor) also has negative coefficient meaning that more precipitation leads to earlier sowing.
In Zone V (the Loess Plateau of China, semiarid), the planting date regression model is as poor as Zone II. Almost none (3%) of the variation in planting dates was explained by weather variables.
In Zone VI (arid region), 10% of the variation in planting dates was explained by weather. PC1 (temperature versus precipitation factor) has a negative coefficient. PC3 (pre-planting weather factor) and PC2 (combined precipitation and the versus between pre-planting temperature to last-planting) have positive coefficients, but these did have much effect and so interpretation is not advisable.

3.4.2. Summer Maize

Table S9 shows the coefficients, standard error, and levels of significance for planting dates (day of year), regressed against PCA in each zone for summer maize. Table 5 shows the OLS regression and R2 for summer maize in each zone using principal components scores. In Zone III (north China of plain), the total variation in planting dates was explained 31% by weather variables (Table 5). PC1 (temperature factor), PC2 (precipitation factor), and PC3 (precipitation of pre-planting versus last-planting) have negative coefficients.
In Zone IV (humid subtropics), 59% of the variation in planting dates was explained by weather (Table 5). In this zone, the summer maize regression model is better than spring maize regression model (R2 = 0.33). PC1 (temperature factor) and PC3 (temperature versus precipitation of pre-planting) have positive coefficients. PC2 (combined temperature of pre-planting and precipitation of late-planting) has a negative coefficient.
In Zone V, only a small proportion (9%) of the planting date variation is explained by weather. In this zone, the summer maize regression model is also a little better than spring maize regression model (3% explained). PC1 (temperature factor) is negative coefficient. PC2 (precipitation factor) is positive coefficient.
In Zone VI, 33% of the variation in planting dates was explained by weather. In this zone the summer maize regression model is much better than spring maize regression model (R2 = 0.10). PC2 (the versus of pre-planting temperature to last-planting) has negative coefficient. PC1 (temperature factor), PC3 (the precipitation of pre-planting and main planting period), PC4 (the weather of April versus May), and PC5 (the precipitation of late-planting) are positive coefficients.

4. Discussion

Zone I (Northeast China, sub-humid) is dominated by spring maize. There were 35 (68.6%) stations out of 51 stations where the planting date was delayed on average by 6.1 days decade−1 during the study period in Zone I. There were 10 stations out of 35 stations where the planting date was delayed significantly (Figure 5). Previous researches also showed that the planting date of spring maize became delayed in the northeast China [24,41]. One reason is that Zone I is located at high latitudes and extends over wide range of latitudes, and thus has a wide range of the date when planting is feasible. During 1992 to 2010, T and Tmin of March (the month preceding of the main sowing period) decreased, while precipitation increased (Figure 3). That means that the temperature decreases before planting. The PC interpreted as the temperature factor (PC1) has a negative impact on planting dates and precipitation factors (PC3 and PC4) have a positive impact on planting dates. Thus, lower temperatures and precipitations impede farmers to plant. In order to reduce the risk of spring freezing, farmers had to delay sowing. The other reason is the diminished ability of a wet soil to withstand field traffic.
Zone III (north China of plain, sub-humid) is dominated by summer maize. The planting date was concentrated in June (150~180 days) (Figure 2). The temperature factor (PC1) and precipitation factor (PC2) have a similar negative impact on planting, although the monthly T, Tmin, and P slightly increased in most related months during 1992–2010. There are some stations with delayed planting dates. The reason of planting date delay may be rotation management system between winter wheat and summer maize [24].
In Zone VI (arid region) and Zone IV (humid subtropics region), spring and summer maize are grown. For Zone IV, the time of sowing can be in a wide range (Figure 2). Most stations advanced the planting date during the study period, especially for summer maize. The increased temperature may have caused the planting date to be advanced because in this zone, about 33% and 59% of the variation in planting dates were explained by climate for spring and summer maize, respectively. And trends of the T and Tmin of the related month are increased significantly (Figure 3). Zone VI belongs to an arid region with less precipitation, and most maize fields are irrigated. Therefore, the temperature has more effect on the planting date than precipitation.
In Zones II (semiarid) and V (the Loess Plateau of China, semiarid), climate variables can hardly be used to explain the variation in planting dates. Zone II is dominated by spring maize and Zone V includes spring maize and summer maize. For spring maize in both of zones, the planting date was slightly delayed but not significantly (Figure 5) and the trends of the T, Tmin, and P of related month are also not significant (Figure 3). Zone II and Zone V are semiarid zones with less precipitation in spring. Maize fields are mainly rain-fed. So pre-planting precipitation is an important influence for planting and encourage farmers to plant earlier for spring maize. But for summer maize of Zone V, precipitation would prevent farmer from planting. This is because in Zone V precipitation is mainly concentrated in summer, and too much precipitation is bad for seed germination. In addition, planting date may be determined by other factors such as the terrain, availability of labor and machines, cultivar variety, and other conditions favorable for planting [12,13,20].
In summary, the ability of explaining the variance of planting dates by climate variables in middle latitude semiarid zones (Zone II, V) is lower than other zones. For zones where both spring and summer maize are present (Zone IV, V, VI), the effect of climate on the planting date of summer maize is greater than the planting date of spring maize. Thus, using fixed temperature thresholds to determine the planting date in tropical regions is not advisable.

5. Conclusions

In answer to our research questions:
(1) T and Tmin increased in most zones for both spring and summer maize from 1992 to 2010. The monthly mean temperature increased significantly in Zone IV in March and Zone VI in June. And Tmin increased significantly in most zones (Zones III, IV, V, VI).
(2) For spring maize, the planting date was delayed in the high latitude region (Zone I) and advanced in the mid-low latitude region (Zone IV, V). For summer maize, the planting dates advanced with the increased temperature.
(3) The variance of planting dates can be reasonably well explained by climate variables in the humid and sub-humid zones (Zone I, III, IV) and arid zone (VI) but not in middle latitude semiarid zones (Zone II and V). The ability of explaining the variance of planting dates of summer maize by climate variables is higher than the spring maize.
Therefore, in different agro-ecological zones, and among seasons within the same zone, the effect of future climate on planting dates is expected to be different. Land surface modelers should thus only consider adjusting planting date in response to projected climate change where this research shows a close link between climate and planting, and not in others. Many other controls on planting date must be considered in the projected socio-economic context, for example labor availability, type of soil preparation and planting, and farmer response to markets.

Supplementary Materials

The following are available online at https://www.mdpi.com/2073-4395/9/6/316/s1, Figure S1: S1 Assessing the number of principal components to retain for the climate variables (15) of spring maize in each zone. A scree plot (the blue line with x’s) and parallel analysis with 100 simulations (red dashed line) suggest retaining the number of principal components, Figure S2: Assessing the number of principal components to retain for the climate variables (15) of summer maize in each zone. A scree plot (the blue line with x’s) and parallel analysis with 100 simulations (red dashed line) suggest retaining the number of principal components, Table S1: Loadings of variables (15) on principal components for Zone II spring maize, Table S2 Loadings of variables (15) on principal components for Zone IV spring maize, Table S3 Loadings of variables (15) on principal components for Zone V spring maize, Table S4 Loadings of variables (15) on principal components for Zone VI spring maize, Table S5 Loadings of variables (15) on principal components for Zone IV summer maize, Table S6 Loadings of variables (15) on principal components for Zone V summer maize, Table S7 Loadings of variables (15) on principal components for Zone VI summer maize, Table S8 Coefficients, standard error and levels of significance for planting date (day of year), regressed against PCA in each zone for spring maize, Table S9 Coefficients, standard error and levels of significance for planting date (day of year), regressed against PCA in each zone for summer maize.

Author Contributions

Data curation, M.S.; Formal analysis, M.S.; Funding acquisition, A.-X.Z.; Methodology, D.G.R.; Supervision, A.-X.Z.; Validation, J.L.; Writing—Original draft, M.S.; Writing—Review & editing, A.-X.Z. and D.G.R.

Funding

This research was funded by the grants from National Basic Research Program of China (Project No.: 2015CB954102), National Natural Science Foundation of China (Project No.: 41431177, 41871300), PAPD, and Outstanding Innovation Team in Colleges and Universities in Jiangsu Province.

Acknowledgments

The work reported here was supported by grants from National Basic Research Program of China (Project No.: 2015CB954102), National Natural Science Foundation of China (Project No.: 41431177, 41871300), PAPD, and Outstanding Innovation Team in Colleges and Universities in Jiangsu Province. Supports to A-Xing Zhu through the Vilas Associate Award, the Hammel Faculty Fellow Award, the Manasse Chair Professorship from the University of Wisconsin-Madison are greatly appreciated. The contribution by D.G. Rossiter was supported by the NJNU Visiting Professor Programme.

Conflicts of Interest

The authors declare no conflict of interest.

Abbreviations

Tminmonthly average minimum temperature
Tmonthly mean temperature
Pmonthly precipitation
PCAprincipal component analysis
CLMCommunity Land Model
CMAChinese Meteorological Administration
PDPlanting date
OLSordinary least squares
GLSgeneralized least squares

References

  1. Dickinson, R.E.; Oleson, K.W.; Bonan, G.; Hoffman, F.; Thornton, P.; Vertenstein, M.; Yang, Z.-L.; Zeng, X. The Community Land Model and Its Climate Statistics as a Component of the Community Climate System Model. J. Clim. 2006, 19, 2302–2324. [Google Scholar] [CrossRef]
  2. Lawrence, D.M.; Oleson, K.W.; Flanner, M.G.; E Thornton, P.; Swenson, S.C.; Lawrence, P.J.; Zeng, X.; Yang, Z.-L.; Levis, S.; Sakaguchi, K.; et al. Parameterization improvements and functional and structural advances in Version 4 of the Community Land Model. J. Adv. Model. Earth Syst. 2011, 3, M03001. [Google Scholar]
  3. Sacks, W.J.; Cook, B.I.; Buenning, N.; Levis, S.; Helkowski, J.H. Effects of global irrigation on the near-surface climate. Clim. Dyn. 2009, 33, 159–175. [Google Scholar] [CrossRef]
  4. Levis, S. Modeling vegetation and land use in models of the Earth System. Wiley Interdiscip. Rev. Clim. Chang. 2010, 1, 840–856. [Google Scholar] [CrossRef]
  5. Mao, J.; Shi, X.; Thornton, P.E.; Hoffman, F.M.; Zhu, Z.; Myneni, R.B. Global Latitudinal-Asymmetric Vegetation Growth Trends and Their Driving Mechanisms: 1982–2009. Remote Sens. 2013, 5, 1484–1497. [Google Scholar] [CrossRef]
  6. Ramankutty, N.; Evan, A.T.; Monfreda, C.; Foley, J.A. Farming the planet: Geographic distribution of global agricultural lands in the year 2000. Glob. Biogeochem. Cycles 2008, 22, GB1003. [Google Scholar] [CrossRef]
  7. Ma, S.; Churkina, G.; Trusilova, K. Investigating the impact of climate change on crop phenological events in Europe with a phenology model. Int. J. Biometeorol. 2011, 56, 749–763. [Google Scholar] [CrossRef] [PubMed]
  8. Peng, B.; Guan, K.; Chen, M.; Lawrence, D.M.; Pokhrel, Y.; Suyker, A.; Arkebauer, T.; Lu, Y. Improving maize growth processes in the community land model: Implementation and evaluation. Agric. For. Meteorol. 2018, 250–251, 64–89. [Google Scholar] [CrossRef]
  9. Kucharik, C.J. Contribution of Planting Date Trends to Increased Maize Yields in the Central United States. Agron. J. 2008, 100, 328–336. [Google Scholar] [CrossRef]
  10. Twine, T.E.; Kucharik, C.J.; Foley, J.A. Effects of Land Cover Change on the Energy and Water Balance of the Mississippi River Basin. J. Hydrometeorol. 2004, 5, 640–655. [Google Scholar] [CrossRef]
  11. Deryng, D.; Sacks, W.J.; Barford, C.C.; Ramankutty, N. Simulating the effects of climate and agricultural management practices on global crop yield. Glob. Biogeochem. Cycles 2011, 25, 96–101. [Google Scholar] [CrossRef]
  12. Sacks, W.J.; Deryng, D.; Foley, J.A.; Ramankutty, N. Crop planting dates: An analysis of global patterns. Glob. Ecol. Biogeogr. 2010, 19, 607–620. [Google Scholar] [CrossRef]
  13. Waha, K.; van Bussel, L.G.J.; Müller, C.; Bondeau, A. Climate-driven simulation of global crop sowing dates. Glob. Ecol. Biogeogr. 2012, 21, 247–259. [Google Scholar] [CrossRef]
  14. Dobor, L.; Barcza, Z.; Hlásny, T.; Árendás, T.; Spitkó, T.; Fodor, N. Crop planting date matters: Estimation methods and effect on future yields. Agric. For. Meteorol. 2016, 223, 103–115. [Google Scholar] [CrossRef]
  15. Jahan, M.; Sen, R.; Ishtiaque, S.; Choudhury, A.K.; Akhter, S.; Ahmed, F.; Biswas, J.C.; Manirruzaman, M.; Miah, M.M.; Rahman, M.; et al. Optimizing sowing window for wheat cultivation in Bangladesh using CERES-wheat crop simulation model. Agric. Ecosyst. Environ. 2018, 258, 23–29. [Google Scholar] [CrossRef]
  16. Mathison, C.; Deva, C.; Falloon, P.; Challinor, A.J. Estimating sowing and harvest dates based on the Asian summer monsoon. Earth Syst. Dyn. 2018, 9, 563–592. [Google Scholar] [CrossRef] [Green Version]
  17. Drewniak, B.; Song, J.; Prell, J.; Kotamarthi, V.R.; Jacob, R. Modeling agriculture in the Community Land Model. Geosci. Model Dev. 2013, 6, 495–515. [Google Scholar] [CrossRef] [Green Version]
  18. Oleson, K.W.; Lawrence, D.M.; Bonan, G.B.; Drewniak, B.; Huang, M.; Koven, C.D.; Levis, S.; Li, F.; Riley, W.J.; Subin, Z.M.; et al. Technical Description of Version 4.5 of the Community Land Model (CLM). Ncar Technical Note NCAR/TN-503 + STR; National Center for Atmospheric Research: Boulder, CO, USA, 2013; p. 422. [Google Scholar]
  19. Sheng, M.; Liu, J.; Zhu, A.-X.; Rossiter, D.G.; Zhu, L.; Peng, G. Evaluation of CLM-Crop for maize growth simulation over Northeast China. Ecol. Model. 2018, 377, 26–34. [Google Scholar] [CrossRef]
  20. Kucharik, C.J. A Multidecadal Trend of Earlier Corn Planting in the Central USA. Agron. J. 2006, 98, 1544–1550. [Google Scholar] [CrossRef] [Green Version]
  21. Rosenzweig, C.; Parry, M.L. Potential impact of climate change on world food supply. Nature 1994, 367, 133–138. [Google Scholar] [CrossRef]
  22. Tubiello, F.N.; Donatelli, M.; Rosenzweig, C.; Stockle, C.O. Effects of climate change and elevated CO2 on cropping systems: Model predictions at two Italian locations. Eur. J. Agron. 2000, 13, 179–189. [Google Scholar] [CrossRef]
  23. CMA Archives. Chinese Meteorological Administration Archives. 2010. Available online: http://data.cma.cn/ (accessed on 12 June 2019).
  24. Tao, F.; Zhang, S.; Zhang, Z.; Rötter, R.P. Maize growing duration was prolonged across China in the past three decades under the combined effects of temperature, agronomic management, and cultivar shift. Glob. Chang. Boil. 2014, 20, 3686–3699. [Google Scholar] [CrossRef] [PubMed]
  25. IARRP. Institute of Agricultural Resources and Regional Planning, CAAS. AgriData, 2016. Available online: http://www.agridata.cn (accessed on 12 June 2019).
  26. IIASA/FAO. Global Agro-Ecological Zones (GAEZ v3.0); IIASA/FAO: Laxenburg, Austria; Rome, Italy, 2012. [Google Scholar]
  27. Zhao, J.; Guo, J.; Xu, Y.; Mu, J. Effects of climate change on cultivation patterns of spring maize and its climatic suitability in Northeast China. Agric. Ecosyst. Environ. 2015, 202, 178–187. [Google Scholar] [CrossRef]
  28. Zhang, X.-J.; Tang, Q.; Pan, M.; Tang, Y. A Long-Term Land Surface Hydrologic Fluxes and States Dataset for China. J. Hydrometeorol. 2014, 15, 2067–2084. [Google Scholar] [CrossRef]
  29. Van Oort, P.; Timmermans, B.; Van Swaaij, A. Why farmers’ sowing dates hardly change when temperature rises. Eur. J. Agron. 2012, 40, 102–111. [Google Scholar] [CrossRef]
  30. Sarbu, C.; Pop, H.F. Principal component analysis versus fuzzy principal component analysis A case study: The quality of danube water (1985–1996). Talanta 2005, 65, 1215–1220. [Google Scholar] [CrossRef]
  31. Shrestha, S.; Kazama, F. Assessment of surface water quality using multivariate statistical techniques: A case study of the Fuji river basin, Japan. Environ. Model. Softw. 2007, 22, 464–475. [Google Scholar] [CrossRef]
  32. Helena, B.; Pardo, R.; Vega, M.; Barrado, E.; Fernandez, J.M.; Fernandez, L. Temporal evolution of groundwater composition in an alluvial aquifer (Pisuerga River, Spain) by principal component analysis. Water Res. 2000, 34, 807–816. [Google Scholar] [CrossRef]
  33. Hayton, J.C.; Allen, D.G.; Scarpello, V. Factor Retention Decisions in Exploratory Factor Analysis: A Tutorial on Parallel Analysis. Organ. Res. Methods 2004, 7, 191–205. [Google Scholar] [CrossRef]
  34. An Introduction to Psychometric Theory with Applications in R. Available online: http://personality-project.org/r/book (accessed on 12 June 2019).
  35. Fox, J.; Weisberg, S. Robust Regression in R: An Appendix to “An R Companion to Applied Regression”, 2nd ed.; Sage: Thousand Oaks, CA, USA, 2010; Available online: https://socialsciences.mcmaster.ca/jfox/Books/Companion-1E/appendix-robust-regression.pdf (accessed on 12 June 2019).
  36. Venables, W.N.; Ripley, B.D. Modern Applied Statistics with S. Fourth Edition; Springer: New York, NY, USA, 2002. [Google Scholar]
  37. Lobell, D.B.; Burke, M.B. On the use of statistical models to predict crop yield responses to climate change. Agric. For. Meteorol. 2010, 150, 1443–1452. [Google Scholar] [CrossRef]
  38. Parker, P.S.; Shonkwiler, J.S.; Aurbacher, J. Cause and Consequence in Maize Planting Dates in Germany. J. Agron. Crop Sci. 2017, 203, 227–240. [Google Scholar] [CrossRef]
  39. Tao, F.; Zhang, Z.; Xiao, D.; Zhang, S.; Rötter, R.P.; Shi, W.; Liu, Y.; Wang, M.; Liu, F.; Zhang, H. Responses of wheat growth and yield to climate change in different climate zones of China, 1981–2009. Agric. For. Meteorol. 2014, 189, 91–104. [Google Scholar] [CrossRef]
  40. Rakib, M.A.; Sasaki, J.; Pal, S.; Asif Newaz, M.; Bodrud-Doza, M.; Bhuiyan, M.A.H. An investigation of coastal vulnerability and internal consistency of local perceptions under climate change risk in the southwest part of Bangladesh. J. Environ. Manag. 2018, 231, 419–428. [Google Scholar] [CrossRef] [PubMed]
  41. Mu, J.; Zhao, J.; Guo, J. Response of spring maize growth stage to climate change in Northeast China over the past 30 years. J. Appl. Meteorol. Sci. 2014, 25, 680–689. [Google Scholar]
Figure 1. Maize cultivation zones of China, and the locations of agricultural meteorological stations in the cultivation zones.
Agronomy 09 00316 g001
Figure 2. The planting dates distribution including spring maize (white) and summer maize (red), by days of year in six Zones during 1992–2010.
Agronomy 09 00316 g002
Figure 3. Trends in mean temperature (T), average minimum temperature (Tmin) and precipitation during February to June of spring maize from 1992 to 2010 in each maize production zone. The error bar represents the standard error of the estimates. The trends with a mark ‘a’ are significant at 0.01 level, and with a mark ‘b’ are significant at 0.05 level.
Agronomy 09 00316 g003
Figure 4. Trends in T, Tmin and precipitation during February to June of summary maize from 1992 to 2010 in each maize production zone. The error bar represents the standard error of the estimates. The trends with a mark ‘a’ are significant at 0.01 level, and with a mark ‘b’ are significant at 0.05 level.
Agronomy 09 00316 g004
Figure 5. Trends in spring maize planting dates during the period of 1992 to 2010 at 124 agricultural meteorological experiment stations across China. The stations with trends significant at 0.05 level was marked by an asterisk.
Agronomy 09 00316 g005
Figure 6. Trend in summer maize planting dates during the period of 1992 to 2010 at 64 agricultural meteorological experiment stations across China. The stations with trends significant at 0.05 level was marked by an asterisk.
Agronomy 09 00316 g006
Table 1. General information about cultivation zones on mean climate, maize type, mean planting day during 1992–2010.
ZonesMaize TypeNumber of StationsNumber of SamplingsMean Planting Day (day of year)Mean Annual Temperature (°C)Mean Annual Precipitation (mm)
ISpring maize517001226.0570.3
IISpring maize212301197.9412.1
IIISummer maize3640916513.3622.9
IVSpring maize181978815.5995.8
Summer maize9104130
VSpring maize2023511411.0524.8
Summer maize12136163
VISpring maize141581149.4163.6
Summer maize772176
Table 2. Loadings of variables (15) on principal components (PCs) for Zone I spring maize.
VariablesAbbreviationsPC1PC2PC3PC4
monthly mean temperature of FebruaryT20.85−0.180.18−0.14
monthly average minimum temperature of FebruaryTmin20.85−0.150.17−0.11
monthly precipitation of FebruaryP20.060.010.680.45
monthly mean temperature of MarchT30.88−0.240.02−0.22
monthly average minimum temperature of MarchTmin30.9−0.190.07−0.22
monthly precipitation of MarchP30.050.190.65−0.1
monthly mean temperature of AprilT40.83−0.14−0.15−0.2
monthly average minimum temperature of AprilTmin40.9−0.1−0.03−0.1
monthly precipitation of AprilP40.12−0.280.570.43
monthly mean temperature of MayT50.70.09−0.290.54
monthly average minimum temperature of MayTmin50.810.27−0.120.41
monthly precipitation of MayP50.000.280.64−0.32
monthly mean temperature of JuneT60.290.91−0.050
monthly average minimum temperature of JuneTmin60.530.73−0.080.13
monthly precipitation of JuneP60.04−0.66−0.10.3
Eigenvalues6.052.251.831.25
% of Variance4015128
Cumulative %40556876
Bold and underline values indicate strong and moderate loadings, respectively.
Table 3. Loadings of variables (15) on principal components for Zone III summer maize.
VariablesAbbreviationsPC1PC2PC3
monthly mean temperature of MarchT30.780.350.02
monthly average minimum temperature of MarchTmin30.740.45−0.11
monthly precipitation of MarchP30.080.51−0.38
monthly mean temperature of AprilT40.790.180.14
monthly average minimum temperature of AprilTmin40.790.380.06
monthly precipitation of AprilP400.61−0.07
monthly mean temperature of MayT50.81−0.210.25
monthly average minimum temperature of MayTmin50.840.020.12
monthly precipitation of MayP50.040.52−0.63
monthly mean temperature of JuneT60.86−0.270.02
monthly average minimum temperature of JuneTmin60.9−0.130.06
monthly precipitation of JuneP6−0.120.380.58
monthly mean temperature of JulyT70.75−0.45−0.22
monthly average minimum temperature of JulyTmin70.77−0.26−0.21
monthly precipitation of JulyP7−0.040.560.46
Eigenvalues6.482.261.31
% of Variance43159
Cumulative %435867
Bold and underline values indicate strong and moderate loadings, respectively.
Table 4. Ordinary least squares (OLS) regression for spring maize in each zone. R2 is the adjusted coefficient of determination. PD is planting date (day of year).
ZoneOLS RegressionR2
IPD = 122.13 − 4.24PC1 + 0.52PC2 + 0.69PC3 + 1.09PC40.32
IIPD = 119.55 + 0.36PC1 − 2.24PC2 − 0.65PC30.05
IVPD = 87.70 − 12.51PC1 − 2.47PC20.33
VPD = 114.43 + 0.50PC1 − 1.30PC2 − 0.38PC30.03
VIPD = 114.56 − 0.37PC1+ 3.09PC2 + 1.19PC30.10
Table 5. OLS regression for summer maize in each zone. R2 is the adjust coefficient of determination. PD is planting date (day of year).
ZoneOLS RegressionR2
IIIPD = 165.17 − 3.90 PC1 − 2.21PC2 − 0.15PC30.31
IVPD = 130.62 + 15.08PC1 − 10.01PC2 + 5.38PC30.59
VPD = 163.52 − 1.81PC1 + 0.27PC20.09
VIPD = 176.11 + 0.47PC1 − 2.89PC2 + 3.04PC3 + 0.56PC4 + 0.70PC50.33

