Article

Luxury Absorption of Phosphorus Exists in Maize When Intercropping with Legumes or Oilseed Rape—Covering Different Locations and Years

1
Crop Research Institute, Shandong Provincial Key Laboratory of Crop Genetic Improvement, Ecology and Physiology, Shandong Academy of Agricultural Sciences, Jinan 250100, China
2
College of Life Sciences, Shandong Normal University, Jinan 250014, China
3
College of Agriculture, Henan University of Science and Technology, Luoyang 471000, China
4
College of Life Sciences and Technology, Henan Institute of Science and Technology, Xinxiang 453003, China
5
College of Resources and Environmental Sciences, China Agricultural University, Beijing 100193, China
6
School of Environmental and Material Engineering, Yantai University, Yantai 264005, China
7
School of Agriculture, Ludong University, Yantai 264025, China
8
College of Geography and Environment, Shandong Normal University, Jinan 250358, China
9
Department of Plant Sciences, College of Agricultural and Environmental Sciences, University of California (UC) Davis, Davis, CA 95616, USA
*
Author to whom correspondence should be addressed.
Agronomy 2019, 9(6), 314; https://doi.org/10.3390/agronomy9060314
Submission received: 5 May 2019 / Revised: 27 May 2019 / Accepted: 13 June 2019 / Published: 14 June 2019
(This article belongs to the Section Soil and Plant Nutrition)

Abstract

:
Rational regulation of phosphorus (P) use in the soil–rhizosphere–plant system is challenging in the development of sustainable, intensive, and healthy agriculture. Rational maize (Zea mays L.) based intercropping with legumes/oilseed rape across six experimental sites from 2008 to 2017 proved advantageous over monoculture in terms of both maize biomass production and P uptake. The partial land equivalent ratio (PLER) for P uptake by intercropped maize averaged from 0.58 to 0.92, which was significantly higher than that for biomass production (0.51–0.78), indicating that the advantage of P acquisition by intercropped maize was superior to that of biomass accumulation. It was the excessive accumulation of P in intercropped maize compared to monoculture, especially higher P concentrations in grains that led to the superior P acquisition advantage and luxury absorption of P. P concentrations in maize grains were significantly increased from 1.89–2.91 mg kg−1 in monoculture to 2.09–3.65 mg kg−1, in intercropping, by 8.3%–25.5%. The plant internal P use efficiency of maize was significantly decreased from the initial 411.7–775.7 kg kg−1 in monoculture to 345.7–710.4 kg kg−1 in intercropping by 4.9%–16.0%, and 100 kg maize grain P quantities were significantly increased from 0.25–0.46 kg to 0.27–0.54 kg by 7.0%–17.4%. Rational fertilizer P input maximized maize yields and P use without decreasing the interspecific ecological advantages and harvest indexes of grain yields and P. These findings promoted better understanding of P allocation status within maize plants, and yield and P acquisition advantages through the exploitation of the biological potential of plants for the efficient utilization of P resources in diverse species combinations.

1. Introduction

Most of the phosphorus (P) in crop plants is concentrated in the grain, which affects nutritional quality traits such as protein, starch, and micronutrients [1,2,3,4]. In addition, the content of phosphorus in grains (i.e., food P production) is directly related to the biogeochemical cycle of P in soil, water, and all living ecosystems [5,6]. Maize is a very important food and feed crop [7]. The total P concentration in maize seeds is around 0.26% by mass [8], of which 60%–80% is in the form of phytate that is poorly available to simple-stomached animals such as swine, poultry, and preruminant calves, due to the lack of phytases in their gastrointestinal tracts [9]. Humans and animals can only absorb and utilize 10%–12% of phosphorus in grains, and all other phosphorus is excreted in the form of fecal phosphorus, leading to severe P pollution [10].
The finite nature of phosphate ore reserves (United States Geological Survey estimates of global P reserves currently stand at 260 years’ worth of consumption), their uneven global distribution, and the risk of eutrophication by P loss to watercourses has created the need for more efficient use of soil P and P-containing fertilizers [11,12]. It is thus necessary to reduce the current waste of P fertilizers and to make the soil-accumulated P more bioavailable using plant traits [13], microbial cycling [14] and, more recently, intercropping [15].
Although the actual contribution of intercropping to crop production is still small, e.g., in China [16], sustainable intensification of agriculture by intercropping is considered the new green revolution [17], even in urban agricultural systems [18]. This is because intercropping plays an important role in increasing crop quality, yield, and environmental quality through the efficient utilization of resources, i.e., land, light, soil, water, and nutrients [19,20]. In the last few decades, some intercropping systems, especially those in China, most notably cereal/legume (i.e., wheat/common bean, wheat/faba bean, wheat/maize, wheat/maize/soybean, wheat/soybean, maize/chickpea, maize/faba bean, maize/oilseed rape and maize/soybean) intercropping, have been extensively investigated, especially with respect to the advantages of phosphorus uptake [15]. However, most of the studies of these intercropping systems have focused on understanding the mechanisms behind P uptake in terms of complementarity and facilitation, and have provided convincing evidence of the specific rhizosphere processes that are involved [21,22]. There are also some data available on optimizing fertilizer P application, the recovery of P fertilizer, and P accumulation in soil in maize-based intercropping systems under field conditions over periods of several years [23,24,25,26,27]. However, to our knowledge, there are very few reports on grain nutritional quality or mineral changes in relation to P, and others, in the aforementioned cereal/legume intercropping systems. It is worth mentioning that a field experiment in North Africa by Latati et al. (2014) [28] showed intercropping with cowpea increased shoot and seed P concentrations in maize. However, such results have lacked the experimental verification associated with using a multi-year and multi-location design.
The partial land equivalent ratio (PLER) for each component species in the intercropping system has frequently been calculated to indicate whether intercropping provides an advantage for P uptake or crop biomass production compared to the monocropped species [29,30]. The LER is the sum of the two partial LER (PLER) values to reflect the overall yield or nutrient acquisition advantage of the whole intercropping system over the corresponding monoculture system [31]. If the PLER is higher than the proportion of the land area occupied by the component species in the whole intercropping system, or the LER is >1, it indicates that intercropping provides an advantage compared to the monoculture system. Intercropping can simultaneously improve soil P use efficiency and plant yields. Many previous studies have shown that increased P uptake is generally accompanied by increased biomass or yield production. The question that naturally occurs, then, is whether there is a difference between the advantage of P or any other nutrient element uptake versus the advantage of biomass accumulation in the intercropping system? How can the two be compared? The authors suggest that the comparison between the PLER or LER values for P or uptake of any other nutrient and the corresponding PLER or LER for biomass production is a reasonable and innovative research idea and will thus facilitate a better understanding of the advantages of each nutrient or resource acquisition in the intercropping system. For example, according to the calculation formula, if the PLER for P uptake is higher than the PLER for biomass yield, it means that besides giving a yield advantage, intercropping also improves the plant internal P nutrition status by increasing the overall P concentration in the component crop species. However, there are very few studies comparing the differences among the PLER or LER values of biomass, accumulation of P and any other nutrient elements, as well as a lack of statistical analysis.
Intercropping influences nutrient distribution among different plant parts, i.e., the translocation of the nutrient from the root to shoot and/or from the shoot to grain, and the effects vary depending on the types of nutrient elements and crop species. For example, in a pot experiment, Xiao et al. (2013) [32] found that iron (Fe) concentration increased in the root but decreased in the shoot of cucumber when intercropping with green garlic compared to monocropping, indicating that the intercropping of green garlic inhibits the transfer of Fe from the root to the shoot in cucumber plants. In a field experiment with wheat/chickpea intercropping, intercropping decreased the translocation of zinc (Zn) and manganese (Mn) from the shoot to the seed of wheat, showing significantly higher Zn and Mn concentrations in the shoot, but not in the seed, than with monocropping [33]. Therefore, the grain nutritional status in intercropping is not only determined by the facilitation effect on the uptake of nutrients from soil, but also by the translocation of nutrients to grains via the xylem and phloem within plants [15].
Therefore, on the basis of many previous reports in relation to overyielding and improvements in P uptake, and the apparent recovery of P fertilizer in maize-based intercropping systems, the objective of this study was to further investigate and compare the effects of different P application rates and intercropping with different companion crops (i.e., legumes and oilseed rape) on the PLER values for biomass production and P uptake by maize, and P allocation within maize plants (including grain and straw P concentrations, the harvest indexes of grain yields and P, the plant internal P use efficiency, and the P quantities needed to produce 100 kg maize grains) across 6 different experimental sites located in northwestern, central, and eastern China, along the Yellow River basin of China and across 7 study years from 2008 to 2017. To our knowledge, this is the first report of such a large geographical and temporal range. This research will provide valuable information for the rational regulation of P use in the soil–rhizosphere–plant system and grain nutritional quality in the quest toward the sustainable, productive, and healthy development of maize-based intercropping systems.

2. Materials and Methods
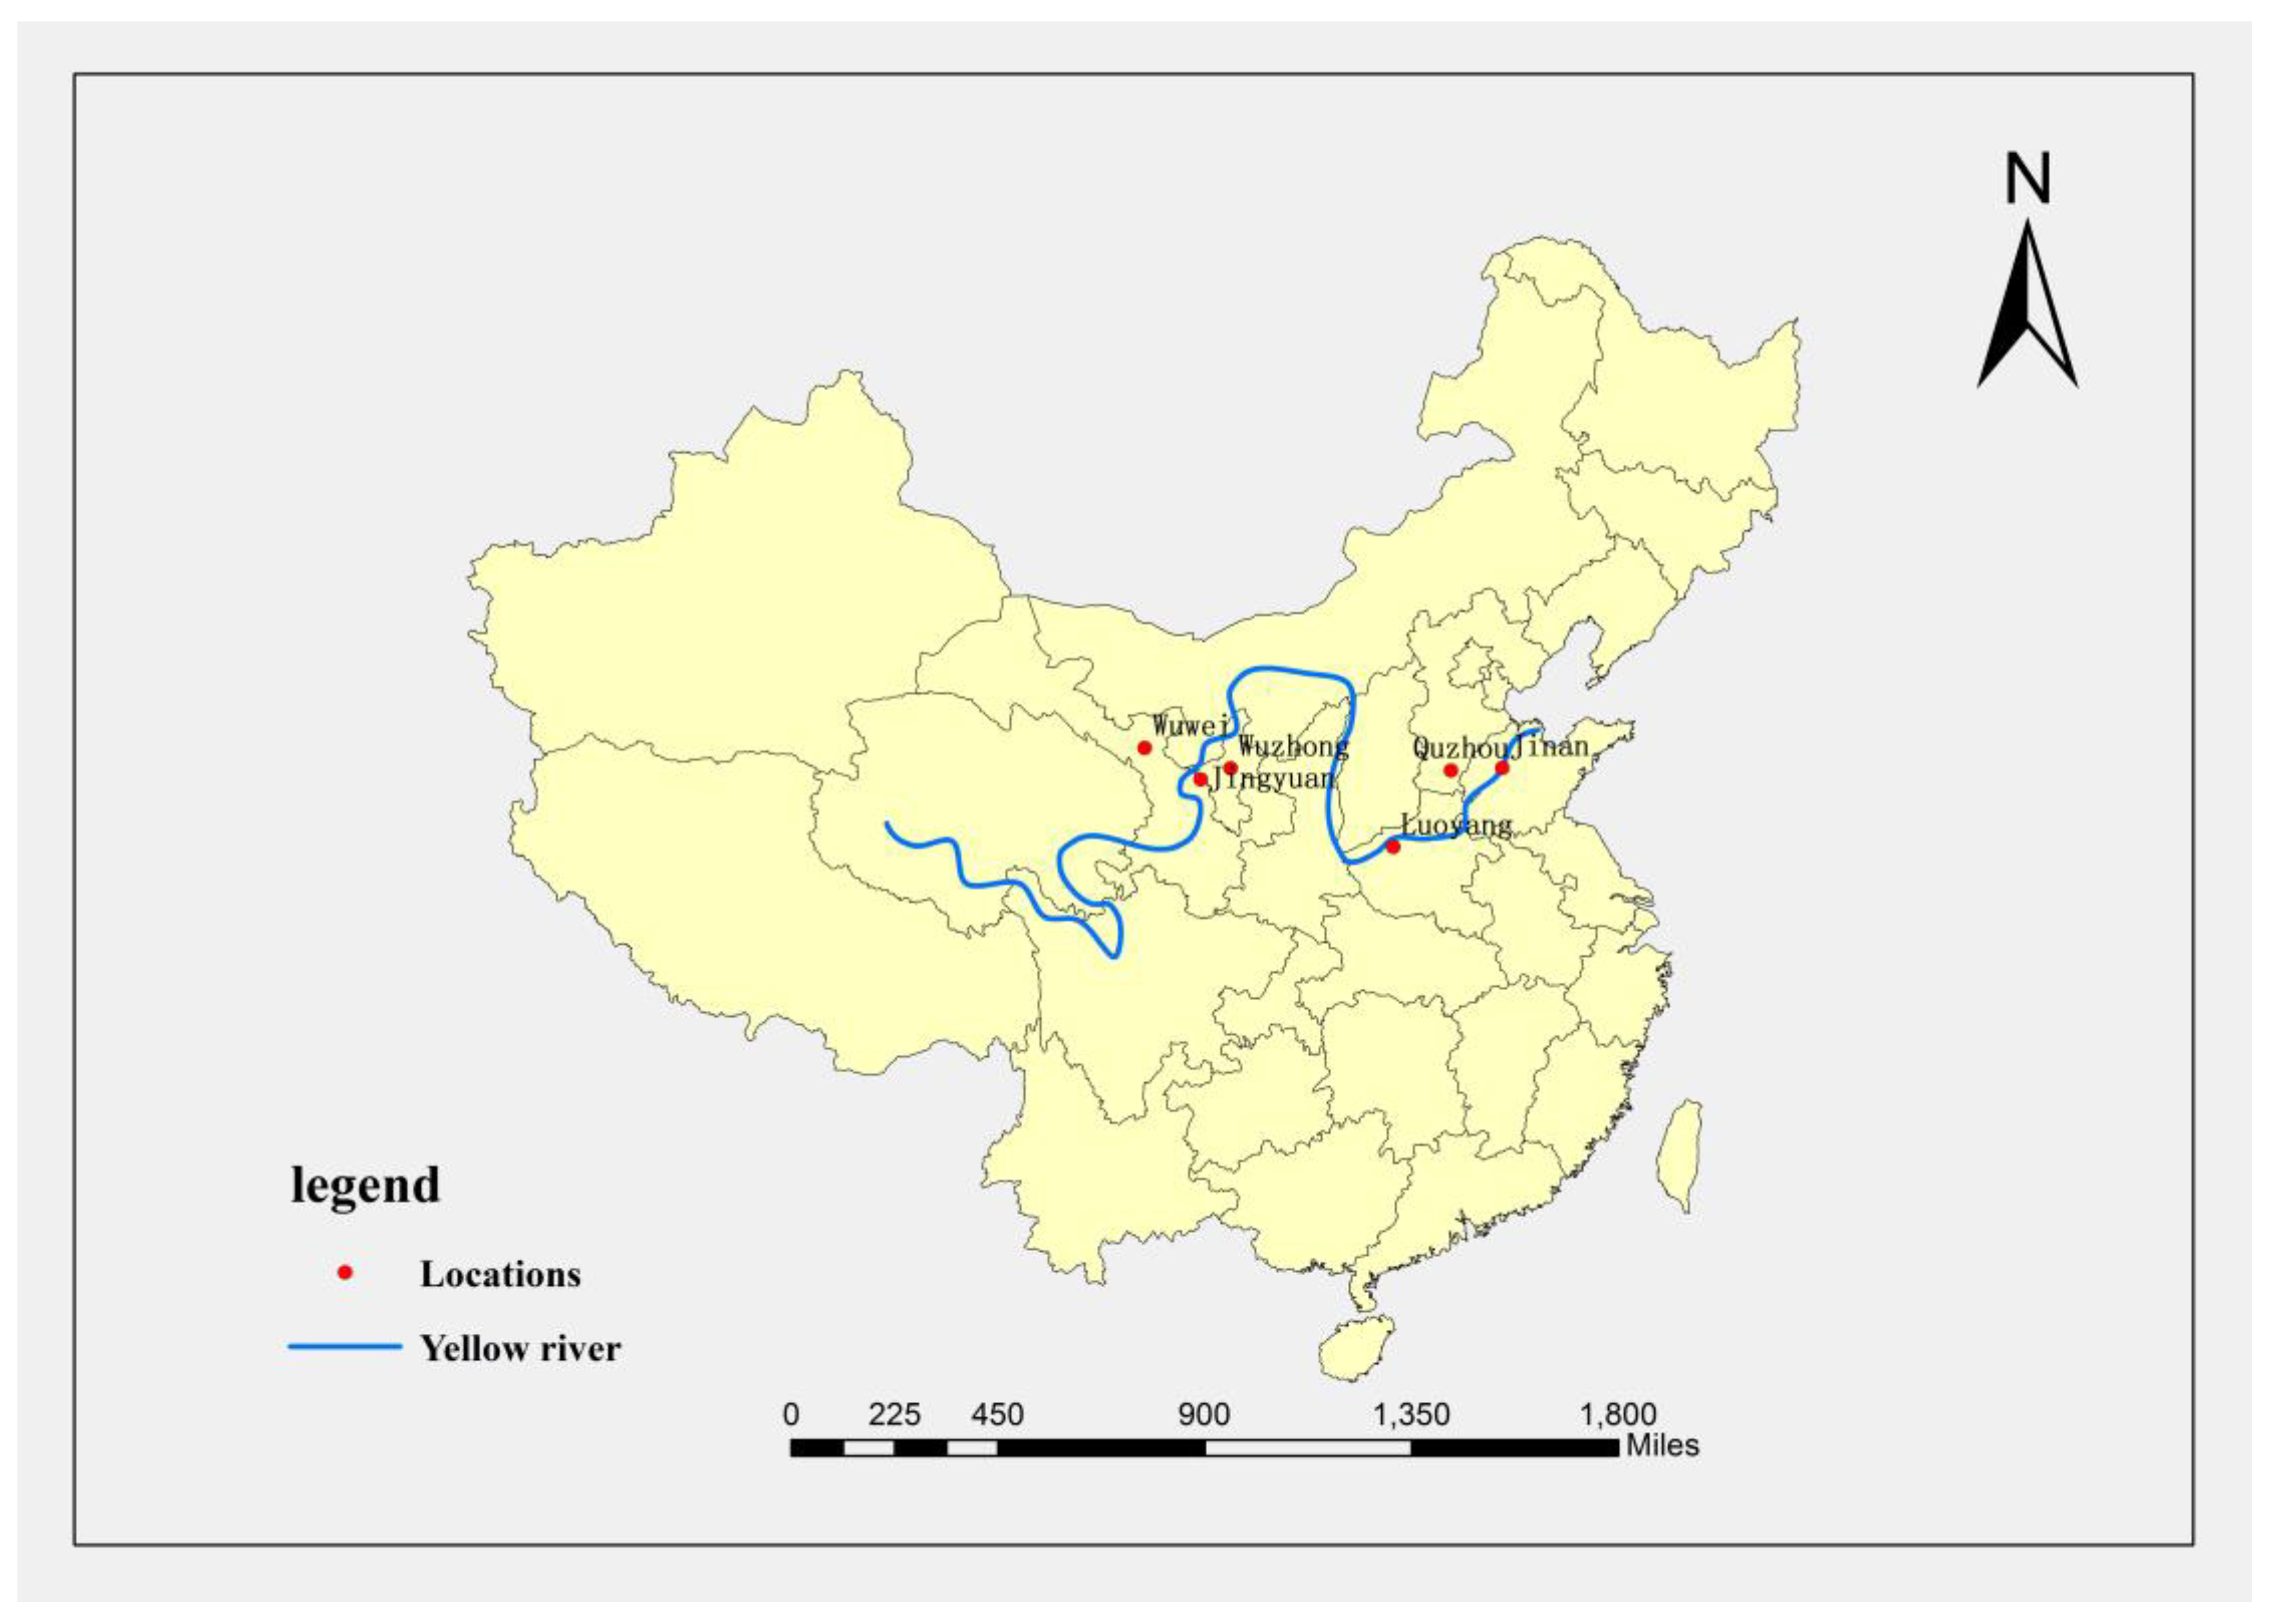
2.1. Study Site

A series of maize-based intercropping field experiments were conducted in 1, 2, or 4 continuous cropping years at six experimental sites located in the following six cities/counties along the Yellow River basin of China: Wuwei, Jingyuan, Wuzhong, Luoyang, Quzhou, and Jinan, as shown in Figure 1. Detailed site descriptions, including geographic coordinates and their associated climatic conditions and soil basal properties, are presented in Table 1 and Table 2.

2.2. Experimental Design and Crop Management

The field experiments in five of the six different locations, namely, Jingyuan, Wuwei, Wuzhong, Quzhou, and Jinan, were all conducted using a split-plot design with three replications (Table 3). The main plot factors included two or three P application rates. The subplot factors were different maize-based strip intercropping systems with legumes (i.e., chickpea, faba bean, soybean, and peanut) or oilseed rape and the corresponding monocultures. The experiment in Luoyang was a two-factor completely randomized design with three replications. These two factors included different P application rates (0 and 80 kg ha−1) and different cropping systems (conventional monocultures, conventional maize/peanut intercropping, and maize/peanut intercropping with chemical regulation). The detailed study years and experimental design, including different P application treatments, cropping systems, and crop cultivars used in different experimental locations, are shown in Table 3.
In each intercropping plot, there were three or four crop combination strips according to the plot area (Table 4). Each intercropped strip consisted of 2 rows of maize and 2–4 rows of associated crops. Table 4 shows details of the plot areas, intercropped strip number and width, row ratios of maize intercropping with associated crops, the distances between adjacent maize and associated crop rows, inter-row distances and inter-plant distances within the same row for maize and companion crops in intercropping and monoculture, and the ratios of the land area occupied by maize in intercropping in different experimental sites.
In Wuzhong, all faba bean plants were inoculated with Rhizobium leguminosarum biovar viciae NM353 (provided by the research group of Prof. Wenxin Chen at China Agricultural University) by seed inoculation. In Luoyang, for the intercropped maize/peanut with chemical regulation at the maize V6 stage, the product named ‘Chaodabang’ (Nanjing Luyuan Biotechnology Co., Ltd., Nanjing, China), containing ethylene as the main ingredient, was sprayed onto newly grown leaves on top of maize plants to make the plants shorter, stronger, and resistant to lodging; and the conventional intercropped maize was only sprayed with clear water.
Details of the sowing/harvest dates and growth days of all crops, and co-growth days of legumes and oilseed rape with maize in different experimental locations are shown in Table 5. Detailed fertilization arrangements in different experimental locations are shown in Table 6. During the growing seasons, all plots of each experimental location were adequately irrigated and weeded manually. No fungicides were applied to either crop. In Wuzhong, the pesticide phoxim ((EZ)-2-(diethoxyphosphinothioyloxyimino)-2-phenylacetonitrile) (Heibei Xingtai Pesticide Co., Ltd., Xingtai, China) was applied when the faba bean began to flower, in 2009, to control belowground insects. In Wuwei and Wuzhong, at the peak flowering stage, omethoate (2-dimethoxyphosphinoylthio-N-methylacetamide) (Dazhou Xinglong Chemical Co., Ltd., Dazhou, China) was foliar sprayed to control aphids on faba bean in all relevant years.

2.3. Plant Sampling and Analysis

At maturity, two continuous rows of maize per plot were harvested to measure grain yields and aboveground biomass yields. Aboveground grain and vegetative parts (straw) of two maize plants were separated, oven-dried at 65–70 °C for 48 h, and then milled and mixed thoroughly. Phosphorus concentrations in ground subsamples of grain and straw were determined by the vanadomolybdate method after digestion in a mixture of concentrated H2SO4 and H2O2. Aboveground P acquisition (i.e., shoot P content) was the sum of grain and straw P content, which can be calculated by multiplying the P concentration by the corresponding grain or straw yield of maize.

2.4. Calculations

PLER of maize = YintercropM/(YsolecropM × PM)
Similarly, the PLER of the companion crop (oilseed rape or legumes) can be calculated by dividing YintercropC by (YsolecropC × PC). Therefore, LER is the sum of the PLER of maize and the PLER of the companion crop. YintercropM and YintercropC are the total shoot (grain + straw) biomass yields of maize and the companion crop based on the total land area occupied by the whole intercropping system, respectively; YsolecropM and YsolecropC are aboveground biomass yields of maize and the companion crop in the sole cropping system, respectively. PM and PC are the proportions of the land area occupied by the respective crops in the intercropping system. PM is determined as PM = WM/(WM + WC) and PC = WC/(WM + WC), where WM and WC are the widths of maize and the companion crop in intercropping strips.
Actually, only the data of the PLER of maize were analyzed in our current study; the PLER of the companion crop (oilseed rape or legumes) or LER were not included. Apparently, the intercropped maize exhibits a yield advantage as compared to the monocropped maize if the PLER of maize is >PM and, conversely, a disadvantage if the PLER of maize is <PM. Similarly, the aforementioned formula was also used in this study to calculate the PLER of P yield (i.e., total shoot (grain + straw) P content) of maize, in which the aboveground shoot biomass yield was substituted by the shoot P content as per the calculation.
Plant internal P use efficiency (kg kg−1) = shoot (grain + straw) biomass yield/shoot P content
P amount needed to produce 100 kg grain (kg) = shoot (grain + straw) P content/grain yield × 100
Only the mean results of the three replications were collected in Quzhou without each repeated value in terms of seed and straw P concentrations, grain yields, and total shoot biomass and P contents, and the corresponding PLER and other indexes were calculated based on these mean values. All data from the other 5 experimental sites corresponded to the results from each replication.

2.5. Statistical Analysis

A two-factor split-plot or completely randomized analysis of variance (ANOVA) process was generally used to analyze the experimental data within the same year in each experimental location. Repeated-measures ANOVA with year as the within subject factor, and P application rate, crop combination, and cropping system (monoculture vs. intercropping) as between-subject factors, were used to analyze the intact data of each index/parameter from two or four years’ experiments conducted in the same location. Means were separated by Fisher’s protected least significant difference (LSD) at p ≤ 0.05, 0.01, 0.001, or 0.0001 levels. For overall effectiveness, the paired t test method was used to compare the datasets across locations and years. ANOVA was performed with SAS 8.0 (SAS Institute, Cary, NC, USA), and t tests with SPSS 17.0 (SPSS Incorporation, Chicago, IL, USA).

3. Results

3.1. Partial Land Equivalent Ratio (PLER) of Shoot Biomass (PLER-B) and PLER of Shoot P Content (PLER-P)

Data collected across all experimental sites and study years showed that the PLER of the shoot biomass of maize intercropped with oilseed rape (Brassica napus L.) averaged only 0.51, which was significantly lower than PM = 0.57 (the proportion of land area occupied by maize in the intercropping system), indicating an obvious yield disadvantage as compared to monocropped maize on a per plant basis (Table 7). PLER of the shoot biomass of maize intercropped with oilseed rape (Brassica campestris L.), chickpea, faba bean, soybean, and peanut ranged from 0.68 to 0.78, which were all dramatically and significantly higher than 0.57 for monocropped maize, indicating obvious yield advantages. Interestingly, PLER of the shoot P content of maize intercropped with each companion crop (ranging from 0.58 to 0.92) were all significantly higher than the PLER of shoot biomass (ranging from 0.51 to 0.78), suggesting the shoot P acquisition advantage of intercropped maize over monocropped maize was greater than the corresponding shoot biomass accumulation advantage (Table 7).
In terms of P application rates (Table 8), neither the PLER of shoot biomass yield nor shoot P content was affected by P application quantities in most cases. With very rare exceptions, e.g., the PLER-B of maize intercropped with oilseed rape (Brassica campestris L.) at high P application was significantly lower than that at low P application; for maize intercropped with peanut, there were significant differences in the PLER-B among different P rates; and the PLER-P of maize intercropped with soybean with medium P input was significantly higher than that with low P input. At each P application level, the values of PLER-B and PLER-P for maize intercropped with oilseed rape (Brassica campestris L.), chickpea, faba bean, and soybean were all significantly higher than the corresponding PM (with only one exception where the PLER-P of maize was intercropped with faba bean with medium P input), showing biomass yield and P acquisition advantages over monocropped maize. Generally, the PLER-P was higher than the PLER-B for maize intercropped with each companion crop. The significantly higher PLER-P than PLER-B for maize intercropped with different companion crops mostly occurred at low and/or high P conditions (Table 8).

3.2. Maize Grain P Concentrations as Affected by Intercropping and P Application Rates

Across all experimental sites, study years, and P application rates, P concentrations in maize grains were significantly increased from 1.89–2.91 mg kg−1 in monocropped maize to 2.09–3.65 mg kg−1 in maize intercropped with legumes or oilseed rape by 8.3%–25.5% (Table 9 and Table S1).
In general, P application rates at the medium and/or high levels increased maize grain P concentrations as compared to no P supply, regardless of the cropping systems (Table 10 and Table S1). Grain P concentrations were increased from the initial 1.91–3.41 mg kg−1 with no P supply to 2.09–3.95 mg kg−1 with medium and high P supply by 1.3%–18.3%. Significant differences were observed in maize intercropped with soybean (between low and medium P levels), oilseed rape (Brassica napus L.) and peanut (between low and high P levels), and oilseed rape (Brassica campestris L.) (between low and medium, and between low and high P levels). A consistent phenomenon was observed in that no significant differences exist in grain P concentrations between the medium and high P supply levels, either for monocropped or for intercropped maize with different companion crops (Table 10 and Table S1).

3.3. Maize Straw P Concentrations as Affected by Intercropping and P Application Rates

Straw P concentrations varied from 0.47 to 0.68 mg kg−1 in spring maize intercropped with oilseed rape, chickpea, faba bean, and soybean, and from 0.51 to 0.65 mg kg−1 in the corresponding monocropped maize (Table 9 and Table S2). Intercropping with peanut significantly increased the summer maize straw P concentration by 9.3%, from an initial 2.0 mg kg−1 in monoculture to 2.2 mg kg−1 in intercropping, and no significant differences were found between monocropped and intercropped spring maize (Table 9 and Table S2).
In general, compared with no/low P supply, P application at medium and high levels increased maize straw P concentrations, either for monocropped or intercropped maize (Table 10 and Table S2). Straw P concentrations were increased by 0.3%–23.5%, from the initial 0.452–2.07 mg kg−1 with no P supply to 0.454–2.43 mg kg−1 with medium and high P supply. There were significant differences between no P and the medium P supply for maize intercropped with faba bean, and between no P and high P supply for maize monoculture (n = 31) and maize intercropped with faba bean and peanut, and in total for maize combined across all monocultures and intercropping combinations. Overuse or high P supply did not lead to significant increases in maize straw P concentrations as compared to the P application rate at the medium level regardless of the cropping systems (Table 10 and Table S2).

3.4. Maize Harvest Indexes as Affected by Intercropping and P Application Rates

Across all experimental sites, study years, and P application rates, the averaged harvest indexes varied from 0.52 to 0.56 for monocropped maize and from 0.53 to 0.56 for intercropped maize with different companion crops (Table S3). For all maize monoculture and intercropping treatments, the harvest indexes varied from 0.52 to 0.56 with no/low P supply, from 0.52 to 0.56 with medium P supply, and from 0.52 to 0.57 with high P supply (Table S4). No significant differences were found between maize in monoculture and intercropping, and among different P application rates (Tables S3–S5).

3.5. Maize P Harvest Indexes as Affected by Intercropping and P Application Rates

The P harvest indexes varied from 75.9 to 84.6 in monocropped spring maize and from 77.0 to 86.7 in intercropped spring maize with different companion crops (Table S3). Across all maize in both monoculture and intercropping, the P harvest indexes varied from 68.0 to 86.3 with no/low P supply and from 68.5 to 88.4 with medium and high P supply (Table S4). Except for the P harvest index of maize that was significantly increased from the initial 65.7 in monoculture to 69.3 in intercropping with peanut by 5.4%, the P harvest indexes of maize were neither affected by intercropping nor by P application rates (Tables S3, S4 and S6).

3.6. Maize Plant Internal P Use Efficiency as Affected by Intercropping and P Application Rates

Intercropping with oilseed rape, chickpea, faba bean, and soybean significantly decreased the maize plant internal P use efficiency from the initial 715.7–775.7 kg kg−1 in monoculture to 622.1–710.4 kg kg−1 in intercropping by 4.9%–13.1% (Table 9 and Table S7). The plant internal P use efficiency in summer maize was also significantly decreased by 16.0% by intercropping with peanut, from 411.7 to 345.7 kg kg−1 (Table 9 and Table S7).
In general, P application rates at medium and high levels decreased the maize plant internal P use efficiency in both monoculture and intercropping as compared to no/low P supply (Table 10 and Table S7). Across all maize in both monoculture and intercropping, the maize plant internal P use efficiency varied from 362.8 to 758.9 kg kg−1 with zero/low P supply, and from 312.6 to 714.1 kg kg−1 with medium and high P supply. There were significant differences between low and medium P supply for maize intercropped with soybean, and between low and high P supply for maize intercropped with oilseed rape soybean and peanut. As a combined total, the maize plant internal P use efficiency was significantly decreased from the initial 709.2 kg kg−1 (n = 97) or 670.1 kg kg−1 (n = 121) at low P application to 674.2 kg kg−1 (n = 97) by the medium P application, and to 666.7 kg kg−1 (n = 97) or 621.6 kg kg−1 (n = 121) by the high P application. No significant differences were observed between the medium and high P supply for monocropped and intercropped maize with different companion crops (Table 10 and Table S7).

3.7. Maize P Quantities Needed to Produce 100 kg Grains as Affected by Intercropping and P Application Rates

Intercropping with oilseed rape, chickpea, faba bean, and soybean significantly increased the P quantities needed to produce 100 kg grains of spring maize by 7.0%–11.1%, from the initial 0.25–0.28 kg in monoculture to 0.27–0.31 kg in intercropping (Table 9 and Table S8). The 100 kg grain P quantity of summer maize was also significantly increased, by 17.4%, through intercropping with peanut, from 0.46 to 0.54 kg (Table 9 and Table S8).
In general, compared with no/low P supply, medium and high P application levels increased the P quantities needed to produce 100 kg grains for monocropped and intercropped maize (Table 10 and Table S8). The 100 kg grain P quantities required for maize varied from 0.26 to 0.52 kg at no/low P supply rate, and from 0.27 to 0.60 kg at medium and high P application rates. Significant differences were found between low and medium P application rates for maize intercropped with soybean, and between low and high P application rates for maize monoculture (n = 32) and maize intercropped with peanut. As a combined total, the 100 kg grain P quantities required for maize were significantly increased from the initial 0.28 kg (n = 97) or 0.31 kg (n = 121) at low P application to 0.29 kg (n = 97) at the medium P application, and to 0.29 kg (n = 97) or 0.34 kg (n = 121) at the high P application. No significant differences were observed between the medium and high P supply for monocropped and intercropped maize with different companion crops and as a combined total (Table 10 and Table S8).

4. Discussion

4.1. The Advantage of Phosphorus Acquisition Is Superior to That of Biomass Accumulation

The present study supports the idea that rational maize-based intercropping systems with legumes or oilseed rape (Brassica campestris) are advantageous over monoculture in terms of maize aboveground shoot biomass (Table 7). In addition, it is worth pointing out that, to our knowledge, this is the first report on the advantages of P acquisition being superior to that of biomass accumulation for maize intercropped with different companion crops. The PLER for P uptake by maize intercropped with each companion crop averaged from 0.58 to 0.92, which was significantly higher than the PLER for biomass production with values ranging from 0.51 to 0.78, indicating the interspecific P acquisition advantage over biomass yield advantage (Table 7). In a recent study by Darch et al. (2018) [30], across the soil P levels, the barley in the barley/legume intercropping pot experiment displayed a positive effect of intercropping, with partial LERs of 0.62–0.76 greater than 0.5 for P accumulation and 0.53–0.67 for biomass. It seems that the PLERs of P accumulation are higher than the PLERs of biomass; however, there was no statistical analysis and the authors did not deliberately compare the differences between the PLERs of P accumulation and biomass. In the present study, we only analyzed the PLERs of P acquisition and the shoot biomass of maize. The results in relation to the PLERs of P acquisition and the shoot biomass of companion crops and total LERs of P acquisition and shoot biomass need to be further studied, in the future, to achieve a comprehensive understanding of P use and biomass accumulation of the whole intercropping system.
Complementarity and facilitation in resource use (e.g., light, soil nutrients, and water) between maize and associated crops may explain the increase in shoot biomass and P acquisition of intercropped maize on a per plant basis [15,21,34]. In addition, competition between different intercropped crop species is another possible mechanism, e.g., in a study by Latati et al. (2014) [28], the root of maize was out-competing the companion cowpea for P acquisition. Maize biomass is mainly composed of carbohydrates and mineral elements. On the one hand, the overyielding of intercropped maize is due to beneficial aboveground light partitioning on maize, leading to more carbohydrate production by photosynthesis [35,36]. On the other hand, intercropping may stimulate maize to access more belowground soil nutrients (e.g., P) and water resources [28,37,38,39,40,41]. According to our present study, that the advantages of phosphorus acquisition by intercropped maize over sole maize are greater than the biomass accumulation advantage—would the soil P acquisition advantage as evaluated by the index of the PLER-P also be superior to aboveground light interception or other soil nutrients and water acquisition advantages for intercropped maize? We only focused on total shoot biomass accumulation and P acquisition in this study. As such, the generality of our findings may be limited, and the question of multiple crop combinations needs to be further studied to gain a full understanding of the relative contributions of different resource acquisition advantages to overyielding in intercropping [27].

4.2. The Increase in Grain P Concentrations Led to the Luxury Absorption of P by Intercropped Maize and the Advantage of P Acquisition over Biomass Accumulation

One of the most intriguing findings of this study is that P concentrations in maize grains were significantly increased by intercropping, irrespective of companion crops, across all 6 experimental sites and study years from 2008 to 2017 (Table 9). To our knowledge, this is the first report in such a large geographical and temporal range. A greenhouse study showed that the shoot P concentrations of maize plants growing for 35 days were much higher when they were intercropped with peanut [42], which seems to be consistent with our results. However, the P concentrations in maize grains at physiological maturity were not determined. In a North Africa field experiment conducted in one year/growing season (2013), Latati et al. (2014) [28] reported that the tissue P concentration of the maize was higher in the intercrop than in the monoculture. Interestingly, at the same time, the tissue P concentration of the companion legume was lower in the intercrop than in the monoculture. In this current study, data on the responses of the companion crops were not presented, which needs to be further studied.
The harvest index is an important agronomic index to reflect the source–sink relationship and dry matter allocation and remobilization, which determines grain yield levels and cultivation effectiveness [43,44]. Jiao et al. (2007) [45] found that the dry matter distributed toward the stem and leaf was reduced, and intercropping promoted photosynthetic assimilate distribution toward the grain and increased the harvest index of maize intercropped with peanut by 0.7%–3.0%. In relay intercropping of wheat/maize, the overyielding of intercropped wheat (especially for border rows) was mainly attributed to more aboveground biomass and P accumulation across the whole growing season, and increased harvest indexes of grain yields and P [44]. In the present study, the harvest indexes of grain yields and P of spring maize across field experiments in Jingyuan, Quzhou, Wuwei, and Wuzhong were not affected by intercropping (Table S3). This indicated that intercropping did not lead to more translocation of dry matter and P from vegetative organs to maize grains. Therefore, the increased grain P concentration in intercropped maize was directly induced by enhanced P acquisition from soil. For summer maize intercropped with peanut across the two experimental sites of Luoyang and Jinan, the harvest index of grain yield was not affected by intercropping, while the P harvest index was significantly increased by 5.4%, by intercropping, from 0.66 to 0.69, indicating greater P allocation toward seeds (Table S3). Actually, the relative changes in the harvest indexes of grain yields and P of maize as affected by intercropping, compared to monoculture, differed greatly in different locations and even in different study years for the same location (Tables S5 and S6). For example, the harvest indexes of grain yields of intercropped maize increased in Wuzhong, and the P harvest indexes increased in Luoyang; however, both of these two indexes decreased in Jinan. Therefore, the increased P accumulation in intercropped maize grains was partly a function of increased uptake from soil, but it also seems possible that intercropping could instead stimulate the translocation of P from vegetative tissues (shoots or roots) to seeds and this may occur late in development; the exact mechanisms need to be further studied.
In the present study, the increase in P concentration in maize grain was not correspondingly or necessarily accompanied by an increase in P concentration in straw, with the exception of maize intercropped with peanut (Table 9 and Table S2). P concentration and total amount of P is typically lower in roots than in shoots [46]. In addition, in our current study, the P concentration and total amount of P is substantially lower in straw than in maize grains (Table 9 and Table S3). According to the calculation formulas for the PLERs of shoot biomass and P uptake, only higher shoot P concentrations lead to a higher PLER-P than PLER-B. Therefore, it is the excessive accumulation of P in the grains of intercropped maize—especially the significant increase in seed P concentration—that led to the advantage of P acquisition over biomass accumulation and the phenomenon of the luxury consumption of P by intercropped maize, which was accompanied by a significant reduction in the plant internal P use efficiency (Table 9) and an increase in the P quantity needed to produce 100 kg maize grains (Table 9). In general, excessive fertilization can lead to the ‘luxury uptake’ [47,48] or ‘luxury consumption’ [49] of nutrients. To the authors’ knowledge, this is the first report of intercropping leading to the luxury absorption of P by maize, mainly due to interspecific P acquisition advantages.

4.3. Rational P Application Rate in Maize-Based Intercropping Systems

In ecology, the ‘stress gradient hypothesis’ proposes that positive interspecific interactions (facilitation, not complementarity) increase in importance and intensity with increasing environmental stress [50]. Such facilitation is particularly valuable when P is limited, as occurs in low-input agroecosystems [21]. Therefore, it was hypothesized that gains in plant growth and shoot P accumulation through intercropping would be greatest under P-limiting conditions [51]. Li et al. (2007) [37] found beneficial effects of intercropping for grain yields of maize intercropped with faba bean at lower rates of P fertilizer application (0, 17, and 33 kg P ha−1), but not at high/sufficient rates (49 or 66 kg P ha−1). In a durum wheat/chickpea intercropping study, an increase in shoot and root biomass of the durum wheat due to facilitation via root-induced alkalization was recorded in soil with limited P availability, but not in soil with adequate P availability [52]. In a barley/legume intercropping study, the LERs for biomass and P accumulation showed that the intercropping effectiveness was significantly greater under very limiting P conditions, than at slightly limiting or excess P levels [30]. These observations appear to agree with the stress-gradient hypothesis. However, the stress-gradient hypothesis does not always hold true. A nutrient-rich environment may lead to more pronounced selection effects [53] and less facilitative interactions among species [51]. Durum wheat/faba bean intercropping at very low, low, and high soil P had no significant differences in LERs or partial LERs for shoot biomass and P uptake [29]. In the present study, in most cases, the biomass accumulation or P uptake advantage of intercropped maize over monoculture, as evaluated by the PLER of corresponding shoot biomass yield or shoot P content, was not affected by P application quantities (Table 8). Possible reasons are (1) Olsen P was high in the fields used, >14.0 mg kg−1 at the start of experiments in Wuwei, Quzhou, and Jinan; (2) Most field trials were conducted for only one or two years, with a lack of long-term localized studies, so the stress gradient of soil P did not occur, e.g., the soil Olsen P without P fertilizer application decreased after two annual growing seasons, and there was a yield response to P fertilization only in the third year in Wuwei [24]. It has also been found that the partial LERs of biomass and P accumulation for barley increased with P level, and those for the legume decreased to negative values, indicating that the LER is merely a balance of the competitiveness of the two crops [30]. Therefore, overyielding and higher shoot P uptake of intercropped maize in this current study may be more likely to be determined by interspecific competition, selection effect, or resource-niche complementarity in space, time, and forms (which one is more dominant is still unclear) rather than facilitative P acquisition [24,51,53]. The responses of the PLERs of shoot biomass and P uptake of companion crops and total LERs to P supply levels need to be further studied to elucidate/verify the aforementioned mechanisms.
In the field experiment conducted in Wuwei, at a 40 kg P ha−1 fertilizer application rate, there was a platform or maximum peak for the grain yields and shoot P contents of intercropped maize, and also for the total grain yields and shoot P contents of the whole intercropping system including maize and companion crops, with no further increases when increasing P rate up to 80 kg ha−1 [24]. Moreover, the apparent recovery of fertilizer P of the intercropping systems increased from 6.1% in monoculture to 30.6% at 40 kg P ha−1, and from 4.8% to 14.5% at 80 kg P ha−1, as compared with overall monoculture systems, on average, over three years. In the field experiment conducted in Wuzhong, Mei et al. (2012) [23] found that moderate fertilizer P application (60 kg P2O5 ha−1) enhanced the productivity and nodulation of the intercropping system of maize/faba bean in reclaimed desert soil, and P deficiency was ameliorated to some extent. Simultaneously, the apparent P recovery of the intercropping system was 297.0% greater than that of the sole cropping system (weighted means) and was highest at the intermediate P application rate, on average. Similar results were reported in a soybean/wheat intercropping system on a sandy loam with very low extractable P which required a direct application of only 60 kg P2O5 ha−1 to both soybean and wheat to meet their P requirements, and there were no significant differences among the different P application rates of 60, 80, and 100 kg P2O5 ha−1 [54]. In a recent wheat/maize relay intercropping field experiment with three P levels (0, 40, and 80 kg P ha−1), more than 40 kg P ha−1 did not result in any further increase in grain yields, aboveground biomass, and harvest indexes of dry matter and P of wheat [44]. In the present study, in most cases, the PLERs of shoot biomass and P uptake were not affected by P application quantities (Table 8). Similar results were found in terms of the harvest indexes of grain yields and grain P for both monocropped and intercropped maize (Table S4). Therefore, our study supports the idea that rational P application maximizes grain/biomass production, P uptake, and the apparent P fertilizer recovery without decreasing the interspecific interaction advantages and harvest indexes of grain yields and P as compared to no/low and high/excessive P supply. This sheds light on the development of sustainable/ecological and productive intensified agriculture through exploitation of the biological potential of plants for the efficient utilization of P and other resources by maximizing interspecific interactions in diverse species combinations.

4.4. More Attention Should Be Paid Regarding Grain Nutritional Quality for the Future Development of Maize-Based Intercropping to Produce Healthy Foods and Feed

Nutrient concentrations in the edible parts of crops eventually affect animal and human health [48,49]. Intercropping with cereals has been recognized as an effective agronomic biofortification practice to harvest legume seeds with higher Fe and Zn concentrations to alleviate human micronutrient malnutrition [55,56]. The quantitative relationships among various nutrients in intercropping appear to be different from those in monoculture [15]. In the present study, the P concentration in maize grain was significantly increased by intercropping with oilseed rape and legumes, and is referred to as ‘luxury consumption/uptake’. When this occurs, it inevitably leads to an imbalance of high P and, therefore, a relative deficiency of some other nutrients; e.g., in the present field experiment conducted in Wuwei, it has been found that the Fe, Mn, Cu, and Zn concentrations in maize grains were decreased by intercropping [57]. Increasing the P content of maize seeds is an undesirable trait in animal feed since it leads to nutritive pollution [9,10]. In addition, except for nutrient elements, grain P concentrations were reported to be related to other grain nutritional quality traits, e.g., protein, starch, and the anti-nutritional compound phytic acid/phytate [1,58,59]. Therefore, in addition to grain P, it is worthwhile to further investigate the many other related nutritional traits (including heavy metals that are harmful or beneficial to human health) that are affected by maize-based intercropping. Finally, how to coordinate the relationships among overyielding, the efficient utilization of soil/fertilizer P or other resources, and crop nutritional quality in intercropping systems is an important issue to be solved to produce healthy or higher-value food and feed while ensuring high yield and resource use efficiency.

5. Conclusions

Across 6 different experimental sites located in northwestern, central, and eastern China, along the Yellow River basin, with a time span of 10 years from 2008 to 2017, the present study found that rational maize-based intercropping with legumes or oilseed rape is advantageous over monoculture in both maize aboveground biomass production and P uptake. Simultaneously, according to the paired t tests of partial land equivalent ratios for biomass production and P uptake, the advantage of P acquisition by intercropped maize is superior to that of biomass accumulation. Further studies elucidated that it was the excessive accumulation of P in intercropped maize plants compared to monoculture, especially the higher P concentration in the maize grain, that led to the superior interspecific P acquisition advantage over that of biomass accumulation and the phenomenon of the luxury absorption of P, which was accompanied by a reduction in the plant internal P use efficiency and an increase in P quantities needed to produce 100 kg grains in intercropped maize. Our study supports that rational fertilizer P application maximizes maize yields and P use without decreasing the interspecific advantages and harvest indexes of grain yields and P as compared to no/low and high/excessive P supply. P application rates at the medium and/or high levels enhanced maize grain and straw P concentrations and P quantities needed to produce 100 kg grains, but reduced the maize plant internal P use efficiency in both monoculture and intercropping as compared to no/low P supply, while overuse or high P supply did not lead to significant changes as compared to the medium P application level. All these results have been reported, for the first time, on such a large geographical and temporal scale, covering six experimental sites and seven study years. Finally, in future studies, more attention should be given regarding the grain nutritional quality (including P) as affected by integrated agronomic practices, and how to coordinate its relationship with overyielding and the efficient utilization of soil/fertilizer P and other resources to promote the sustainable, productive, and healthy development of maize-based intercropping systems.

Supplementary Materials

The following are available online at https://www.mdpi.com/2073-4395/9/6/314/s1: Table S1: Maize grain P concentrations as affected by intercropping with legumes or oilseed rape and P application rates in each year at each experimental location, Table S2: Maize straw P concentrations as affected by intercropping with legumes or oilseed rape and P application rates in each year at each experimental location, Table S3: Maize harvest indexes and P harvest indexes as affected by intercropping with legumes or oilseed rape across all experimental sites, study years and P application rates, Table S4: Maize harvest indexes and P harvest indexes as affected by P application rates across all experimental sites, study years and cropping systems, Table S5: Maize harvest indexes as affected by intercropping with legumes or oilseed rape and P application rates in each year at each experimental location, Table S6: Maize P harvest indexes as affected by intercropping with legumes or oilseed rape and P application rates in each year at each experimental location, Table S7: Maize plant-internal P use efficiency as affected by intercropping with legumes or oilseed rape and P application rates in each year at each experimental location, Table S8: Maize P amounts needed to produce 100 kg grains as affected by intercropping with legumes or oilseed rape and P application rates in each year at each experimental location.

Author Contributions

Methodology, H.X., Y.Y. and M.L.; investigation, H.X., L.W., N.J., P.M., Z.W., Y.L., L.C., H.D., W.K., and Y.X.; resources, X.G., X.W., and J.S.; writing—original draft preparation, H.X.; writing—review and editing, H.X.

Funding

This work was funded by the National Natural Science Foundation of China (31501834), the National Key Research and Development Program of China (2016YFD0300202, 2017YFD0300407), the Project Granted to Haiyong Xia by Shandong Provincial Key Laboratory of Crop Genetic Improvement, Ecology and Physiology, the Young Scientist Research Foundation of the Shandong Academy of Agricultural Sciences of China (SAAS, 2014QNM07), the Shandong Provincial Innovation Project for Agricultural Key Technology Application: Research and Demonstration of Annual Planting Patterns and Key Technologies for Green Improvement of Grain, Industrial and Forage Crops Production, the SAAS Innovation Project (CXGC2016B04), and the Corn Innovation Team of Shandong Provincial Modern Agricultural Industry and Technology System (SDAIT-01-021-11, SDAIT-02-11).

Acknowledgments

We thank the reviewers for valuable comments and suggestions and editors for valuable work. The assistance of internship students including Xiaohui Yang from Inner Mongolia Agricultural University, China, Jie Wang and Zhen Liu from Ludong University, China, and Wentao Zhong and Zhichen Li from Shandong Normal University, China, with the field experiments is very gratefully acknowledged.

Conflicts of Interest

The authors declare no conflict of interest.

References

  1. Rosen, C.J.; Kelling, K.A.; Stark, J.C.; Porter, G.A. Optimizing Phosphorus Fertilizer Management in Potato Production. Am. J. Potato Res. 2014, 91, 145–160. [Google Scholar] [CrossRef]
  2. Singh, S.K.; Barnaby, J.Y.; Reddy, V.R.; Sicher, R.C. Varying Response of the Concentration and Yield of Soybean Seed Mineral Elements, Carbohydrates, Organic Acids, Amino Acids, Protein, and Oil to Phosphorus Starvation and CO2 Enrichment. Front. Plant Sci. 2016, 7, 1967. [Google Scholar] [CrossRef] [PubMed]
  3. Zhang, W.; Liu, D.; Liu, Y.; Chen, X.; Zou, C. Overuse of Phosphorus Fertilizer Reduces the Grain and Flour Protein Contents and Zinc Bioavailability of Winter Wheat (Triticum aestivum L.). J. Agric. Food Chem. 2017, 65, 1473–1482. [Google Scholar] [CrossRef] [PubMed]
  4. Wafula, W.N.; Korir, N.K.; Ojulong, H.F.; Siambi, M.; Gweyi-Onyango, J.P. Protein, Calcium, Zinc, and Iron Contents of Finger Millet Grain Response to Varietal Differences and Phosphorus Application in Kenya. Agronomy 2018, 8, 24. [Google Scholar] [CrossRef]
  5. Elser, J.; Bennett, E. Phosphorus cycle: A broken biogeochemical cycle. Nature 2011, 478, 29–31. [Google Scholar] [CrossRef]
  6. Liu, X.; Sheng, H.; Jiang, S.; Yuan, Z.; Zhang, C.; Elser, J.J. Intensification of phosphorus cycling in China since the 1600s. Proc. Natl. Acad. Sci. USA 2016, 113, 2609–2614. [Google Scholar] [CrossRef] [PubMed] [Green Version]
  7. Klopfenstein, T.; Erickson, G.; Berger, L. Maize is a critically important source of food, feed, energy and forage in the USA. Field Crops Res. 2013, 153, 5–11. [Google Scholar] [CrossRef]
  8. Wu, L.; Cui, Z.; Chen, X.; Yue, S.; Sun, Y.; Zhao, R.; Deng, Y.; Zhang, W.; Chen, K. Change in phosphorus requirement with increasing grain yield for Chinese maize production. Field Crops Res. 2015, 180, 216–220. [Google Scholar] [CrossRef]
  9. Lei, X.G.; Porres, J.M. Phytases. In Encyclopedia of Animal Science; CRC Press: Boca Raton, FL, USA, 2004. [Google Scholar]
  10. Raboy, V. Seeds for a better future: ‘low phytate’ grains help to overcome malnutrition and reduce pollution. Trends Plant Sci. 2001, 6, 458–462. [Google Scholar] [CrossRef]
  11. Steffen, W.; Richardson, K.; Rockström, J.; Cornell, S.E.; Fetzer, I.; Bennett, E.M.; Biggs, R.; Carpenter, S.R.; de Vries, W.; de Wit, C.A.; et al. Planetary boundaries: Guiding human development on a changing planet. Science 2015, 347, 1259855. [Google Scholar] [CrossRef] [Green Version]
  12. Van Dijk, K.C.; Lesschen, J.P.; Oenema, O. Phosphorus flows and balances of the European Union Member States. Sci. Total Environ. 2016, 542, 1078–1093. [Google Scholar] [CrossRef] [PubMed]
  13. Faucon, M.-P.; Houben, D.; Lambers, H. Plant Functional Traits: Soil and Ecosystem Services. Trends Plant Sci. 2017, 22, 385–394. [Google Scholar] [CrossRef] [PubMed]
  14. Richardson, A.; Simpson, R. Soil microorganisms mediating phosphorus availability. Plant Physiol. 2011, 156, 989–996. [Google Scholar] [CrossRef] [PubMed]
  15. Xue, Y.; Xia, H.; Christie, P.; Zhang, Z.; Li, L.; Tang, C. Crop acquisition of phosphorus, iron and zinc from soil in cereal/legume intercropping systems: A critical review. Ann. Bot. 2016, 117, 363–377. [Google Scholar] [CrossRef] [PubMed]
  16. Hong, Y.; Heerink, N.; Jin, S.; Berentsen, P.; Zhang, L.; Van Der Werf, W. Intercropping and agroforestry in China—Current state and trends. Agric. Ecosyst. 2017, 244, 52–61. [Google Scholar] [CrossRef]
  17. Martin-Guay, M.-O.; Paquette, A.; Dupras, J.; Rivest, D. The new Green Revolution: Sustainable intensification of agriculture by intercropping. Sci. Total Environ. 2018, 615, 767–772. [Google Scholar] [CrossRef] [PubMed]
  18. Wan, N.-F.; Cai, Y.-M.; Shen, Y.-J.; Ji, X.-Y.; Wu, X.-W.; Zheng, X.-R.; Cheng, W.; Li, J.; Jiang, Y.-P.; Chen, X.; et al. Increasing plant diversity with border crops reduces insecticide use and increases crop yield in urban agriculture. eLife 2018, 7, e35103. [Google Scholar] [CrossRef]
  19. Brooker, R.W.; Bennett, A.E.; Cong, W.-F.; Daniell, T.J.; George, T.S.; Hallett, P.D.; Hawes, C.; Iannetta, P.P.M.; Jones, H.G.; Karley, A.J.; et al. Improving intercropping: A synthesis of research in agronomy, plant physiology and ecology. New Phytol. 2015, 206, 107–117. [Google Scholar] [CrossRef] [PubMed]
  20. Weiner, J. Applying plant ecological knowledge to increase agricultural sustainability. J. Ecol. 2017, 105, 865–870. [Google Scholar] [CrossRef] [Green Version]
  21. Hinsinger, P.; Betencourt, E.; Bernard, L.; Brauman, A.; Plassard, C.; Shen, J.; Tang, X.; Zhang, F. P for Two, Sharing a Scarce Resource: Soil Phosphorus Acquisition in the Rhizosphere of Intercropped Species1. Plant Physiol. 2011, 156, 1078–1086. [Google Scholar] [CrossRef]
  22. Li, L.; Tilman, D.; Lambers, H.; Zhang, F.-S. Plant diversity and overyielding: Insights from belowground facilitation of intercropping in agriculture. New Phytol. 2014, 203, 63–69. [Google Scholar] [CrossRef] [PubMed]
  23. Mei, P.-P.; Gui, L.-G.; Wang, P.; Huang, J.-C.; Long, H.-Y.; Christie, P.; Li, L. Maize/faba bean intercropping with rhizobia inoculation enhances productivity and recovery of fertilizer P in a reclaimed desert soil. Field Crops Res. 2012, 130, 19–27. [Google Scholar] [CrossRef]
  24. Xia, H.-Y.; Wang, Z.-G.; Zhao, J.-H.; Sun, J.-H.; Bao, X.-G.; Christie, P.; Zhang, F.-S.; Li, L. Contribution of interspecific interactions and phosphorus application to sustainable and productive intercropping systems. Field Crops Res. 2013, 154, 53–64. [Google Scholar] [CrossRef]
  25. Wang, Z.-G.; Jin, X.; Bao, X.-G.; Li, X.-F.; Zhao, J.-H.; Sun, J.-H.; Christie, P.; Li, L. Intercropping Enhances Productivity and Maintains the Most Soil Fertility Properties Relative to Sole Cropping. PLoS ONE 2014, 9, e113984. [Google Scholar] [CrossRef] [PubMed]
  26. Chen, Y.; Zhou, T.; Zhang, C.; Wang, K.; Liu, J.; Lu, J.; Xu, K. Rational Phosphorus Application Facilitates the Sustainability of the Wheat/Maize/Soybean Relay Strip Intercropping System. PLoS ONE 2015, 10, 0141725. [Google Scholar] [CrossRef] [PubMed]
  27. Li, X.-F.; Wang, C.-B.; Zhang, W.-P.; Wang, L.-H.; Tian, X.-L.; Yang, S.-C.; Jiang, W.-L.; Ruijven, J.V.; Li, L. The role of complementarity and selection effects in P acquisition of intercropping systems. Plant Soil 2018, 422, 479–493. [Google Scholar] [CrossRef]
  28. Latati, M.; Blavet, D.; Alkama, N.; Laoufi, H.; Drevon, J.J.; Gérard, F.; Pansu, M.; Ounane, S.M. The intercropping cowpea-maize improves soil phosphorus availability and maize yields in an alkaline soil. Eur. J. Agron. 2014, 385, 181–191. [Google Scholar] [CrossRef]
  29. Tang, X.; Placella, S.A.; Daydé, F.; Bernard, L.; Robin, A.; Journet, E.-P.; Justes, E.; Hinsinger, P. Phosphorus availability and microbial community in the rhizosphere of intercropped cereal and legume along a P-fertilizer gradient. Plant Soil 2016, 407, 119–134. [Google Scholar] [CrossRef]
  30. Darch, T.; Giles, C.D.; Blackwell, M.S.A.; George, T.S.; Brown, L.K.; Menezes-Blackburn, D.; Shand, C.A.; Stutter, M.I.; Lumsdon, D.G.; Mezeli, M.M.; et al. Inter- and intra-species intercropping of barley cultivars and legume species, as affected by soil phosphorus availability. Plant Soil 2018, 427, 125–138. [Google Scholar] [CrossRef]
  31. He, Y.; Ding, N.; Shi, J.; Wu, M.; Liao, H.; Xu, J. Profiling of microbial PLFAs: Implications for interspecific interactions due to intercropping which increase phosphorus uptake in phosphorus limited acidic soils. Soil Boil. Biochem. 2013, 57, 625–634. [Google Scholar] [CrossRef]
  32. Xiao, X.; Cheng, Z.; Meng, H.; Liu, L.; Li, H.; Dong, Y. Intercropping of Green Garlic (Allium sativum L.) Induces Nutrient Concentration Changes in the Soil and Plants in Continuously Cropped Cucumber (Cucumis sativus L.) in a Plastic Tunnel. PLoS ONE 2013, 8, e62173. [Google Scholar] [CrossRef] [PubMed]
  33. Gunes, A.; Inal, A.; Adak, M.S.; Alpaslan, M.; Bagci, E.G.; Erol, T.; Pilbeam, D.J. Mineral nutrition of wheat, chickpea and lentil as affected by mixed cropping and soil moisture. Nutr. Cycl. Agroecosyst. 2007, 78, 83–96. [Google Scholar] [CrossRef]
  34. Duchene, O.; Vian, J.-F.; Celette, F. Intercropping with legume for agroecological cropping systems: Complementarity and facilitation processes and the importance of soil microorganisms. A review. Agric. Ecosyst. 2017, 240, 148–161. [Google Scholar] [CrossRef]
  35. Zhu, J.; Van Der Werf, W.; Anten, N.P.R.; Vos, J.; Evers, J.B. The contribution of phenotypic plasticity to complementary light capture in plant mixtures. New Phytol. 2015, 207, 1213–1222. [Google Scholar] [CrossRef] [PubMed]
  36. Burgess, A.J.; Retkute, R.; Pound, M.P.; Mayes, S.; Murchie, E.H. Image-based 3D canopy reconstruction to determine potential productivity in complex multi-species crop systems. Ann. Bot. 2017, 119, 517–532. [Google Scholar] [CrossRef] [PubMed] [Green Version]
  37. Li, L.; Li, S.-M.; Sun, J.-H.; Zhou, L.-L.; Bao, X.-G.; Zhang, H.-G.; Zhang, F.-S. Diversity enhances agricultural productivity via rhizosphere phosphorus facilitation on phosphorus-deficient soils. Proc. Natl. Acad. Sci. USA 2007, 104, 11192–11196. [Google Scholar] [CrossRef] [Green Version]
  38. Mao, L.; Zhang, L.; Li, W.; Van Der Werf, W.; Sun, J.; Spiertz, H.; Li, L. Yield advantage and water saving in maize/pea intercrop. Field Crops Res. 2012, 138, 11–20. [Google Scholar] [CrossRef]
  39. Latati, M.; Bargaz, A.; Belarbi, B.; Lazali, M.; Benlahrech, S.; Tellah, S.; Kaci, G.; Drevon, J.J.; Ounane, S.M. The intercropping common bean with maize improves the rhizobial efficiency, resource use and grain yield under low phosphorus availability. Eur. J. Agron. 2016, 72, 80–90. [Google Scholar] [CrossRef]
  40. Latati, M.; Aouiche, A.; Tellah, S.; Laribi, A.; Benlahrech, S.; Kaci, G.; Ouarem, F.; Ounane, S.M. Intercropping maize and common bean enhances microbial carbon and nitrogen availability in low phosphorus soil under Mediterranean conditions. Eur. J. Soil Boil. 2017, 80, 9–18. [Google Scholar] [CrossRef]
  41. Wang, X.; Deng, X.; Pu, T.; Song, C.; Yong, T.; Yang, F.; Sun, X.; Liu, W.; Yan, Y.; Du, J.; et al. Contribution of interspecific interactions and phosphorus application to increasing soil phosphorus availability in relay intercropping systems. Field Crops Res. 2017, 204, 12–22. [Google Scholar] [CrossRef]
  42. Inal, A.; Gunes, A.; Zhang, F.; Cakmak, I. Peanut/maize intercropping induced changes in rhizosphere and nutrient concentrations in shoots. Plant Physiol. Biochem. 2007, 45, 350–356. [Google Scholar] [CrossRef] [PubMed]
  43. Hay, R.K.M. Harvest index: A review of its use in plant breeding and crop physiology. Ann. Appl. Boil. 1995, 126, 197–216. [Google Scholar] [CrossRef]
  44. Zhou, T.; Xu, K.; Liu, W.; Zhang, C.; Chen, Y.; Yang, W. More aboveground biomass, phosphorus accumulation and remobilization contributed to high productivity of intercropping wheat. Int. J. Plant Prod. 2017, 11, 407–424. [Google Scholar]
  45. Jiao, N.; Chen, M.; Ning, T.; Li, Z. Effects of maize intercropping with peanut on dry matter accumulation and distribution of maize. J. Anhui Agric. Sci. 2007, 35, 11782–11783. (In Chinese) [Google Scholar]
  46. Mollier, A. Maize root system growth and development as influenced by phosphorus deficiency. J. Exp. Bot. 1999, 50, 487–497. [Google Scholar] [CrossRef]
  47. Soder, K.J.; Stout, W.L. Effect of soil type and fertilization level on mineral concentration of pasture: Potential relationships to ruminant performance and health. J. Anim. Sci. 2003, 81, 1603–1610. [Google Scholar] [CrossRef] [PubMed]
  48. Hafla, A.N.; Macadam, J.W.; Soder, K.J. Sustainability of US Organic Beef and Dairy Production Systems: Soil, Plant and Cattle Interactions. Sustainability 2013, 5, 3009–3034. [Google Scholar] [CrossRef] [Green Version]
  49. Herencia, J.F.; García-Galavís, P.A.; Dorado, J.A.R.; Maqueda, C. Comparison of nutritional quality of the crops grown in an organic and conventional fertilized soil. Sci. Hortic. 2011, 129, 882–888. [Google Scholar] [CrossRef]
  50. Brooker, R.; Kikvidze, Z.; Pugnaire, F.I.; Callaway, R.M.; Choler, P.; Lortie, C.J.; Michalet, R. The importance of importance. Oikos 2005, 109, 63–70. [Google Scholar] [CrossRef]
  51. He, Q.; Bertness, M.D.; Altieri, A.H. Global shifts towards positive species interactions with increasing environmental stress. Ecol. Lett. 2013, 16, 695–706. [Google Scholar] [CrossRef]
  52. Betencourt, E.; Duputel, M.; Colomb, B.; Desclaux, D.; Hinsinger, P. Intercropping promotes the ability of durum wheat and chickpea to increase rhizosphere phosphorus availability in a low P soil. Soil Boil. Biochem. 2012, 46, 181–190. [Google Scholar] [CrossRef]
  53. Fridley, J.D. Resource availability dominates and alters the relationship between species diversity and ecosystem productivity in experimental plant communities. Oecologia 2002, 132, 271–277. [Google Scholar] [CrossRef] [PubMed]
  54. Aulakh, M.S.; Pasricha, N.S.; Bahl, G.S. Phosphorus fertilizer response in an irrigated soybean–wheat production system on a subtropical, semiarid soil. Field Crops Res. 2003, 80, 99–109. [Google Scholar] [CrossRef]
  55. Zuo, Y.; Zhang, F. Iron and zinc biofortification strategies in dicot plants by intercropping with gramineous species. A review. Agron. Sustain. Dev. 2009, 29, 63–71. [Google Scholar] [CrossRef]
  56. Dragičević, V.; Oljaca, S.; Stojiljković, M.; Simic, M.; Dolijanovic, Z.; Kravic, N. Effect of the maize–soybean intercropping system on the potential bioavailability of magnesium, iron and zinc. Crop Pasture Sci. 2015, 66, 1118–1127. [Google Scholar] [CrossRef]
  57. Xia, H.; Sun, J.; Xue, Y.; Eagling, T.; Bao, X.; Zhao, J.; Zhang, F.; Li, L. Maize grain concentrations and above-ground shoot acquisition of micronutrients as affected by intercropping with turnip, faba bean, chickpea, and soybean. Sci. China Life Sci. 2013, 56, 823–834. [Google Scholar] [CrossRef] [Green Version]
  58. Shegro, A.; Shargie, N.G.; Biljon, A.; Labuschagne, M.T.; Van Biljon, A. Diversity in starch, protein and mineral composition of sorghum landrace accessions from Ethiopia. J. Sci. Biotechnol. 2012, 15, 275–280. [Google Scholar] [CrossRef]
  59. Perera, I.; Seneweera, S.; Hirotsu, N. Manipulating the Phytic Acid Content of Rice Grain Toward Improving Micronutrient Bioavailability. Rice 2018, 11, 4. [Google Scholar] [CrossRef] [Green Version]
Figure 1. The locations where the experiments were conducted in 6 cities/counties along the Yellow River basin of China.
Agronomy 09 00314 g001
Table 1. Detailed available geographic coordinates and climatic conditions of the study sites.
LocationLongitudeLatitudeAltitude
(m)
Growing SeasonTotal Solar Radiation
(MJ m−2 year−1)
Average Annual Hours of SunshineAnnual Mean TemperatureCumulative Temperatures ≥0 °C and 10 °CAnnual Frost-Free PeriodAnnual Mean PrecipitationAnnual Potential EvaporationSoil Type
(h)(°C)(°C)(Days)(mm)(mm)
Jingyuan104°40′ E37°05′ N1645mid-March–mid-October-----200.02369.0Aridisol (Serozem)
Wuwei102°40′ E38°37′ N1504mid-March–mid-October5988.030237.73646.0/3149.0170–180150.02021.0Aridisol (Serozem)
Wuzhong106°12′ E37°44′ N1450mid-March–mid-October6020.8-8.9-/2963.9168185.42015.0Serozem
Quzhou115°10′ E36°52′ N-Whole year--13.1-/4472.0201556.2-Calcareous alluvial soil
Luoyang112°27′ E34°41′ N-Whole year-2300–260012.1–14.6-215–219600.02113.7Calcareous yellow fluvo-aquic soil
Jinan117°04′ E36°42′ N48Whole year--13.6--625.0-Calcareous yellow fluvo-aquic soil
Table 2. Top soil (0–20 cm) basal properties before initiation of each experiment in different locations.
LocationpH
(2.5:1 Water/Soil Ratio)
Organic Matter
(g kg−1)
Total Nitrogen
(g kg−1)
Alkaline Hydrolysis Nitrogen
(mg kg−1)
Olsen P
(mg kg−1)
Exchangeable Potassium
(mg kg−1)
Soil Bulk Density
(g cm−3)
Jingyuan7.614.70.83-9.3204.7-
Wuwei8.0 19.11.08-20.3233.01.40
Wuzhong7.4 (2.5:1 CaCl2)5.20.25-3.5271.8-
Quzhou7.3 (2.5:1 CaCl2)14.30.84-16.4210.61.35
Luoyang7.610.7-10.53.5-1.48
Jinan7.721.0-45.014.8163.0-
Table 3. Detailed study years and experimental design including different P application treatments, cropping systems, and crop cultivars used in different experimental locations.
LocationYearExperimental DesignReplicateMain Plot
(P Application Rate, kg ha−1)
Subplot
(Maize-Based Intercropping and Corresponding Monocultures)
Jingyuan2009Split-plot30, 40, and 80Maize (Zea mays L. cv. Shendan no. 16) with oilseed rape (Brassica napus L. cv. Longyou no. 1),
chickpea (Cicer arietinum L. cv. Longying no. 1), faba bean (Vicia faba L. cv. Lincan no. 5),
or soybean (Glycine max L. cv. Wuke no. 2)
Wuwei2009–2012Split-plot30, 40, and 80Maize (Zea mays L. cv. Zhengdan no. 958) with oilseed rape (Brassica napus L. cv. Longyou no. 1 in 2009;
Brassica campestris L. cv. Gannan no.4 in 2010, 2011 and 2012),
chickpea (Cicer arietinum L. cv. Longying no. 1),
faba bean (Vicia faba L. cv. Lincan no. 5),
or soybean (Glycine max L. cv. Huaxia no. 1 in 2009; cv. Wuke no. 2 in 2010, 2011 and 2012)
Wuzhong2008 and 2009Split-plot30 and 52.4 in 2008;
0, 26.2, and 52.4 in 2009
Maize (Zea mays L. cv. Shengdan no.16)/faba bean (Vicia faba L. cv. Lincan no.2)
Quzhou2009 and 2010Split-plot30, 40, and 80Maize (Zea mays L. cv. Zhengdan no. 958) with oilseed rape (Brassica napus L. cv. Longyou no. 5),
chickpea (Cicer arietinum L. cv. Longying no. 1), faba bean (Vicia faba L. cv. Lincan no. 5),
or soybean (Glycine max L. cv. Huaxia no. 1 in 2009, Hedou no. 12 in 2010)
Luoyang2012 and 2013Completely randomized30 and 80Conventional monocultures and
maize (Zea mays L. cv. Zhengdan no.958)/peanut (Arachis hypogaea L. cv. Huayu no.16)
(conventional and chemical regulation)
Jinan2017Split-plot30, 40, and 80Maize (Zea mays L. cv. Ludan no.818)/peanut (Arachis hypogaea L. cv. Huayu no.25)
Table 4. Detailed spatial arrangements of maize and associated crops in monocropped and intercropped plots in different experimental locations.
LocationPlot AreaStrip NumberStrip Width (m)Row Ratio of Maize Intercropping with Companion CropsThe Distance between Adjacent Maize and Companion Crop Row (m)Inter-Row Distance for Maize and Associated Crops in Intercropping and Monoculture (m)Inter-Plant Distance within the Same Row for Maize and Associated Crops in Both Monoculture and Intercropping (m)Ratio of the Land Area Occupied by Maize in IntercroppingMono- and Intercropped Maize Plant Density a (Plants ha−1)
Jingyuan4.2 m × 6.0 m31.42:30.30.4 (maize), 0.2 (others)0.3 (maize), 0.2 (others)4/783,333/47,619
Wuwei5.6 m × 5.5 m41.42:30.30.4 (maize), 0.2 (others)0.27 (maize), 0.2 (legumes)
and broadcast sowing
(oilseed rape)
4/792,593/52,910
Wuzhong3.45 m × 6.0 m
in 2008;
3.6 m × 6.0 m
in 2009
31.15 in 2008;
1.2 in 2009
2:3 in 2008;
2:2 in 2009
0.2 in 2008;
0.3 in 2009
0.35 in 2008, 0.4 in 2009 (maize) and 0.2 (faba bean) in intercropping;
0.2 for the narrow row and 0.35 for the wide of sole maize in 2008,
0.4 for sole maize in 2009, and 0.2 for sole faba bean in both years
0.3 (maize), 0.2 (faba bean)11/23 in 2008;
2/3 in 2009
121,212/45,549 in 2008;
83,333/55,556 in 2009
Quzhou4.2 m × 8.0 m31.42:30.30.4 (maize), 0.2 (others)0.3 (maize), 0.2 (others)4/783,333/47,619
Luoyang6.0 m × 10.0 m322:40.350.4 (maize), 0.3 (peanut) in intercropping;
0.6 (maize), 0.3 (peanut) in monoculture
0.25 in monoculture,
0.2 in intercropping
(maize); 0.2 (peanut)
2/566,667/50,000
Jinan8.0 m × 5.0 m422:20.50.6 (maize), 0.4 (peanut)0.27 (maize), 0.2 (peanut)3/561,728/37,037
a Intercropped maize plant density was calculated based on the land area occupied the whole intercropping system including the companion crop.
Table 5. Sowing, harvest dates, and growth days of all crops, and co-growth days of legumes and oilseed rape with maize in different experimental locations.
LocationMaizeOilseed Rape
(Brassica napus L.)
Oilseed Rape
(Brassica campestris L.)
ChickpeaFaba BeanSoybeanPeanut
Jingyuanfrom 12 April to 10 October; 181 daysfrom 12 April to 11 August; 121 days, 121 days-from 23 Mar to 31 July; 130 days, 110 daysfrom 23 March to 31 July; 130 days, 110 daysfrom 12 April to 10 October; 181 days, 181 days-
Wuweifrom late April to early October; ~163 daysfrom late March to early August; ~133 days, ~103 daysfrom late March
to late June;
~92 days, ~62 days
from late March to late July/early August, ~127 days, ~97 daysfrom late March to late July/early August; ~127 days, ~97 daysfrom late April
to late August/early September; ~127 days, ~127 days
-
Wuzhongfrom mid-April to early October; ~173 days---from mid-March to late July/early August; ~137 days, ~107 days--
Quzhoufrom late April/early May to early September; ~128 daysfrom early March to early July; ~122 days, ~71 days from 10 April to 23 July in 2009, from 7 March to 6 July in 2010; 104 days, ~84 d in 2009, 121 days, ~67 days in 2010from early March to early July; ~122 days, ~71 daysfrom late April/early May to early September; ~128 days, ~128 days-
Luoyangfrom early June to late September or early October; ~117 days-----from early June to late September/early October; ~117 days, ~117 days
Jinanfrom 21 June to 27 September; 98 days-----from 21 June to 27 September; 98 days, 98 days
Table 6. Detailed fertilization arrangements in different experimental locations.
LocationBasal Fertilizer Amount before Sowing for All CropsSources of FertilizerTiming of N Application for Maize
N (kg ha−1)P (kg ha−1)K2O (kg ha−1)NPK
Jingyuan1500, 40, and 800UreaDiammonium phosphate-375.0 kg ha−1 in total, 2/5 before sowing,
3/10 at stem elongation and 3/10 at pre-tasseling
Wuwei112.50, 40, and 800UreaTriple superphosphate-225.0 kg ha−1 in total, 1/2 before sowing,
1/4 at stem elongation and 1/4 at pre-tasseling
Wuzhong900 and 52.4 in 2008;
0, 26.2, and 52.4 in 2009
0UreaTriple superphosphate-225.0 kg ha−1 in total, 2/5 before sowing,
3/10 at stem elongation and 3/10 at pre-tasseling
Quzhou112.5 in 2009;
90 in 2010
0, 40, and 800UreaTriple superphosphate-225.0 kg ha−1 in total in 2009, 1/2 before sowing, 1/4 at the V12 stage and 1/4 at silking;
180 kg ha−1 in total in 2010, 1/2 before sowing and 1/2 at V12
Luoyang900 and 800UreaTriple superphosphate-180 kg ha−1 in total, 1/2 before sowing and 1/2 at the V12 stage
Jinan112.50, 40, and 80120UreaCalcium superphosphatePotassium sulfate225.0 kg ha−1 in total, 1/2 before sowing
and 1/2 at pre-tasseling
Table 7. Comparison of the partial land equivalent ratio (PLER) of shoot biomass (PLER-B) and shoot P content (PLER-P) of maize intercropped with different companion crops and the proportion of land area occupied by maize in the intercropping system (PM) irrespective of P application rates across all experimental sites and study years.
Companion Crop TypeLocationHarvest YearPMPLER-BPLER-PThe p Value of Paired t Testn
PLER-B and PMPLER-P and PMPLER-B and PLER-P
Oilseed rape (Brassica napus L.)Jingyuan20090.570.570.65NSNS0.03869
Wuwei20090.570.450.560.0015NS0.00229
Quzhou20090.570.420.450.01010.0468NS3
20100.570.580.57NSNSNS3
Mean0.570.500.51NSNSNS6
Grand mean-0.570.510.580.0210NS0.000524
Oilseed rape (Brassica campestris L.)Wuwei20100.570.760.920.00030.00050.01389
20110.570.770.830.00460.0006NS9
20120.570.810.840.00110.0004NS9
Grand mean-0.570.780.86<0.0001<0.00010.003027
ChickpeaJingyuan20090.570.610.69NSNSNS9
Wuwei20090.570.630.73NS0.00040.00189
20100.570.801.000.00060.00200.03749
20110.570.700.760.01180.0033NS9
20120.570.740.790.00160.0067NS9
Mean0.570.720.82<0.0001<0.00010.000236
Quzhou20090.570.810.920.00430.00040.01523
20100.570.880.900.0098NSNS3
Mean0.570.840.91<0.00010.0005NS6
Grand mean-0.570.710.81<0.0001<0.0001<0.000151
Faba beanJingyuan20090.570.560.62NSNS0.03719
Wuwei20090.570.690.760.00920.0003NS9
20100.570.810.89<0.0001<0.00010.01829
20110.570.680.75NS0.01720.01589
20120.570.700.700.00020.0081NS9
Mean0.570.720.77<0.0001<0.00010.000436
Wuzhong20080.480.450.63NS0.01790.00516
20090.670.690.74NSNSNS9
Mean0.590.590.70NS0.03080.005715
Quzhou20090.570.490.490.01430.0104NS3
20100.570.640.75NS0.0222NS3
Mean0.570.570.62NSNSNS6
Grand mean-0.580.680.75<0.0001<0.0001<0.000166
SoybeanJingyuan20090.570.540.58NSNSNS9
Wuwei20090.570.690.760.02010.0328NS9
20100.570.810.890.00300.00060.01129
20110.570.860.87<0.00010.0001NS9
20120.570.770.720.00050.0021NS9
Mean0.570.770.81<0.0001<0.0001NS36
Quzhou20090.570.810.890.02490.0008NS3
20100.570.850.880.00110.0135NS3
Mean0.570.830.89<0.0001<0.0001NS6
Grand mean-0.570.740.78<0.0001<0.00010.012951
PeanutLuoyang20120.400.740.99<0.0001<0.0001<0.000112
20130.400.760.88<0.0001<0.00010.000312
Mean0.400.750.93<0.0001<0.0001<0.000124
Jinan20170.600.830.90<0.00010.0010NS9
Grand mean-0.450.770.92<0.0001<0.0001<0.000133
Total--0.560.700.79<0.0001<0.0001<0.0001252
Values are means of different P application rates with three replications for each P rate. NS: not significant.
Table 8. Comparison of the partial land equivalent ratio (PLER) of shoot biomass (PLER-B) and shoot P content (PLER-P) of maize intercropped with different companion crops and the proportion of land area occupied by maize in the intercropping system (PM) at different P application levels across all experimental sites and study years.
Crop Type of Maize
Intercropped with
ParameterP Application LevelThe p Value of Paired t Test
Low (L)Medium (M)High (H)L and ML and HM and H
Oilseed rape (Brassica napus L.)
(n = 8)
PM0.570.570.57---
PLER-B0.540.500.49NSNSNS
PLER-P0.580.560.60NSNSNS
p value of paired t test of PLER-B and PMNSNSNS---
p value of paired t test of PLER-P and PMNSNSNS---
p value of paired t test of PLER-B and PLER-PNSNS0.0088---
Oilseed rape (Brassica campestris L.)
(n = 9)
PM0.570.570.57---
PLER-B0.850.790.70NS0.0436NS
PLER-P0.920.850.82NSNSNS
p value of paired t test of PLER-B and PM0.00030.00010.0120---
p value of paired t test of PLER-P and PM0.00040.00030.0009---
p value of paired t test of PLER-B and PLER-PNSNSNS---
Chickpea
(n = 17)
PM0.570.570.57---
PLER-B0.710.740.70NSNSNS
PLER-P0.820.830.77NSNSNS
p value of paired t test of PLER-B and PM0.0016<0.00010.0008---
p value of paired t test of PLER-P and PM<0.00010.00110.0001---
p value of paired t test of PLER-B and PLER-P0.0002NS0.0096---
Faba bean
(n = 23 at L and H levels, n = 20 at M)
PM0.570.590.57---
PLER-B0.640.670.66NSNSNS
PLER-P0.720.720.73NSNSNS
p value of paired t test of PLER-B and PM0.01450.01830.0052---
p value of paired t test of PLER-P and PM<0.0001NS<0.0001---
p value of paired t test of PLER-B and PLER-P0.00130.02980.0005---
Soybean
(n = 17)
PM0.570.570.57---
PLER-B0.700.770.73NSNSNS
PLER-P0.720.840.780.0230NSNS
p value of paired t test of PLER-B and PM0.0031<0.00010.0007---
p value of paired t test of PLER-P and PM0.0027<0.00010.0001---
p value of paired t test of PLER-B and PLER-PNSNS0.0426---
Peanut
(n = 15 at L and H levels, n = 3 at M)
PM0.440.600.44---
PLER-B0.780.900.740.03360.03590.0104
PLER-P0.921.080.90NSNSNS
p value of paired t test of PLER-B and PM<0.00010.0088<0.0001---
p value of paired t test of PLER-P and PM<0.00010.0190<0.0001---
p value of paired t test of PLER-B and PLER-P0.0002NS0.0003---
Combined in total
(n = 89 at L and H levels, n = 74 at M)
PM0.550.580.55---
PLER-B0.700.710.68NSNSNS
PLER-P0.780.780.77NSNSNS
p value of paired t test of PLER-B and PM<0.0001<0.0001<0.0001---
p value of paired t test of PLER-P and PM<0.0001<0.0001<0.0001---
p value of paired t test of PLER-B and PLER-P<0.0001<0.0001<0.0001---
-: no value. NS: not significant.
Table 9. Maize grain and straw P concentrations, plant internal P use efficiency, and P quantities needed to produce 100 kg grains as affected by intercropping with legumes or oilseed rape across all experimental sites, study years, and P application rates.
Maize
Monoculture
Maize Intercropped withThe p Value of Paired t TestIncrease over Maize Monoculture
(%)
Standard Deviation for Different Trials
(%)
Oilseed RapeOilseed RapeChickpeaFaba BeanSoybeanPeanut
(Brassica napus L.)(Brassica campestris L.)
Grain P concentrations (mg kg−1)
2.092.47-----<0.0001 (n = 21)18.414.1
1.89-2.09----<0.001 (n = 27)10.57.1
1.98--2.26---<0.0001 (n = 48)14.65.6
2.00---2.18--<0.0001 (n = 63)8.92.9
1.98----2.14-<0.01 (n = 48)8.33.6
2.91-----3.65<0.0001 (n = 33)25.514.6
Straw P concentrations (mg kg−1)
0.510.47-----NS (n = 21)−8.816.0
0.65-0.68----NS (n = 27)4.210.1
0.59--0.62---NS (n = 48)3.911.2
0.54---0.58--NS (n = 63)6.517.3
0.593----0.586-NS (n = 48)−1.28.5
2.00-----2.200.0013 (n = 33)9.310.2
Plant internal P use efficiency (kg kg−1)
715.7622.1-----0.0002 (n = 24)−13.18.8
774.4-705.7----0.0024 (n = 27)−8.97.5
746.8--663.3---<0.0001 (n = 51)−11.22.7
775.7---700.0--<0.0001 (n = 66)−9.84.6
746.8----710.4-0.0184 (n = 51)−4.91.4
411.7-----345.7<0.0001 (n = 33)−16.09.1
P quantities needed to produce 100 kg grains (kg)
0.280.31-----0.0166 (n = 24)11.115.8
0.25-0.27----0.0050 (n = 27)8.26.6
0.26--0.29---<0.0001 (n = 51)10.92.8
0.26---0.28--<0.0001 (n = 66)8.911.3
0.26----0.28-0.0025 (n = 51)7.01.9
0.46-----0.54<0.0001 (n = 33)17.40.1
-: no value. NS: not significant.
Table 10. Maize grain P and straw concentrations, plant internal P use efficiency, and P quantities needed to produce 100 kg grains as affected by P application rates across all experimental sites, study years, and cropping systems.
Cropping SystemP Application RateThe p Value of Paired t Test
Low (L)Medium (M)High (H)L and ML and HM and H
Grain P concentrations (mg kg−1)
Maize monoculture (n = 22)2.092.122.16NSNSNS
Maize monoculture (n = 31)2.21-2.33-NS-
Maize
intercropped with
Oilseed rape (Brassica napus L.) (n = 7)2.302.532.58NS0.0030NS
Oilseed rape (Brassica campestris L.) (n = 9)1.912.092.260.00900.0202NS
Chickpea (n = 16)2.242.272.28NSNSNS
Faba bean (n = 19)2.142.122.22NSNSNS
Faba bean (n = 22)2.17-2.25-NS-
Soybean (n = 16)2.002.252.170.0420NSNS
Peanut (n = 15)3.41-3.95-0.0001-
Grand mean (n = 92)2.142.242.280.01100.0007NS
Grand mean (n = 116)2.32-2.51-<0.0001-
Straw P concentrations (mg kg−1)
Maize monoculture (n = 22)0.600.610.63NSNSNS
Maize monoculture (n = 31)0.87-0.98-0.0036-
Maize
intercropped with
Oilseed rape (Brassica napus L.) (n = 7)0.4520.500.454NSNSNS
Oilseed rape (Brassica campestris L.) (n = 9)0.6560.6580.73NSNS NS
Chickpea (n = 16)0.6130.630.607NSNSNS
Faba bean (n = 19)0.510.630.590.00740.0269NS
Faba bean (n = 22)0.51-0.60-0.0085-
Soybean (n = 16)0.550.590.61NSNSNS
Peanut (n = 15)2.07-2.43-0.0031-
Grand mean (n = 92)0.590.6280.63NS 0.0477NS
Grand mean (n = 116)0.84-0.94-<0.0001-
Plant internal P use efficiency (kg kg−1)
Maize monoculture (n = 23)729.1699.5706.7NS NSNS
Maize monoculture (n = 32)711.6-662.2-NS -
Maize
intercropped with
Oilseed rape (Brassica napus L.) (n = 8)665.6611.8588.9NS0.0057NS
Oilseed rape (Brassica campestris L.) (n = 9)758.9714.1643.9NS0.0004NS
Chickpea (n = 17)667.0662.1660.9NSNSNS
Faba bean (n = 20)718.4690.5684.7NSNSNS
Faba bean (n = 23)719.0-689.2-NS-
Soybean (n = 17)755.2685.3690.80.03510.0192NS
Peanut (n = 15)362.8-312.6-0.0010-
Grand mean (n = 97)709.2674.2666.70.0008<0.0001NS
Grand mean (n = 121)670.1-621.6-<0.0001-
P quantities needed to produce 100 kg grains (kg)
Maize monoculture (n = 23)0.2660.2720.28NSNSNS
Maize monoculture (n = 32)0.30-0.33 -0.0089-
Maize
intercropped with
Oilseed rape (Brassica napus L.) (n = 8)0.300.310.31NSNSNS
Oilseed rape (Brassica campestris L.) (n = 9)0.260.270.29NSNSNS
Chickpea (n = 17)0.2890.2930.30NSNSNS
Faba bean (n = 20)0.270.280.29NSNSNS
Faba bean (n = 23)0.27-0.29-NS-
Soybean (n = 17)0.270.290.290.0481NSNS
Peanut (n = 15)0.52-0.60-0.0008-
Grand mean (n = 97)0.280.290.290.01930.0012NS
Grand mean (n = 121)0.31-0.34-<0.0001-
-: no value. NS: not significant.

