Article

Effect of Senescence Phenotypes and Nitrate Availability on Wheat Leaf Metabolome during Grain Filling

1
Max Planck Institute of Molecular Plant Physiology, 14424 Potsdam, Germany
2
NAIST-BS, Division of Biological Sciences, 8916-5, Takayama, Ikoma, Nara, 630-0912, Japan
3
Energy Plant Research Center, School of Life Sciences, Qilu Normal University, Jinan 250099, China
4
Rothamsted Research, Harpenden AL5 2JQ, UK
*
Author to whom correspondence should be addressed.
Agronomy 2019, 9(6), 305; https://doi.org/10.3390/agronomy9060305
Submission received: 26 April 2019 / Revised: 21 May 2019 / Accepted: 30 May 2019 / Published: 11 June 2019

Abstract

:
The capacity for optimising grain yield depends largely on the timing of senescence and the processes underlying efficient remobilisation and cycling of nutrients from source tissues to the developing grain. This study describes how metabolism is adjusted during senescence in response to varying nitrogen application rates after anthesis. A comprehensive metabolite analysis was performed in field-grown Avalon/Cadenza using segregating doubled haploid wheat genotypes having contrasting traits relating to timing of the onset of senescence. Correlative matrices of metabolites and yield parameters determined the metabolic networks that underlie these phenotypes, and were helpful for identifying unique metabolites that are indicative of timing of senescence. They also revealed robust correlations between steady increases in hexose levels, a late senescence phenotype and high straw yield associated with low N fertiliser levels. Tryptophan, cis-aconitate, phosphate and 1-kestose demonstrated strong perturbations in response to nitrogen availability and progression towards developmental senescence. A comprehensive metabolic map of wheat leaf primary metabolites yielded a cumulative readout of processes that occur during developmental ripening and contribute to grain filling in plants with differential senescence timing.

1. Introduction

Wheat is the most widely grown crop in the world, being cultivated on an estimated 220 million hectares of cropland yearly, and providing a major share of the world’s caloric demands [1]. Although global grain yield has doubled over the last 50 years, the rate of increase has slowed significantly due to the lack of genetic expansion [1]. Pressure to further improve germplasm is high, owing to the increase in incidence and magnitude of temperature increases and sporadic drought occurrence. To obtain maximum grain yield potential, metabolic activity must coincide with maximum photosynthetic activity in the source leaves, and high yielding cultivars may also possess leaves with an extended photosynthetic activity that stretches maximally into the grain filling period [2,3,4]. Grain yields are based on both grain number, which is determined at 30 days before flowering until shortly after anthesis, and grain size, which is determined during grain filling [5]. Environmental perturbations that contribute to damage of the photosynthetic apparatus and accelerate leaf senescence towards the end of the growing season shorten the duration of grain filling and reduce seed size significantly, which may be ascribed to the accelerated leaf senescence [6].
Plants maintain nutrient balance and homeostasis by regulating uptake and assimilation of macro nutrients and by remobilising these from macro molecules (proteins in the case of N and nucleotides in the case of P), and establish a redistribution of micro nutrients and a translocation of these to the growing grains [7]. Senescence is a highly regulated process that plants utilise to manage nutrient recycling, principally nitrogen containing molecules in order to adapt to stress and facilitate seed production to maximise the success of the next generation [8,9]. Under optimal growth conditions, senescence sets in following a developmentally-regulated, age-dependent process [10]; under suboptimal conditions, senescence programmes can be switched on, and rescue mechanisms such as early flowering and a rapid remobilisation of nutrients from the senescent leaves to the seed are engaged [11]. The onset of senescence is an important limit to grain filling, consequently affecting grain yield [12]. At the organ level, senescence starts soon after entering the reproductive phase, and the entire plant undergoes senescence after the onset of anthesis and eventually dies [13]. Monocarpic senescence remobilises nutrients from the leaves and compromises these nutrients to the developing reproductive organs during flower initiation and anthesis [14]. When nutrients are sufficient, the ratio of senescing to non-senescing or photosynthetically active biomass is small in vegetative growing wheat. High levels of nitrogen can delay senescence, since the sink demand is satisfied [15]. Conversely, low levels of nitrogen induce early senescence resulting from protein degradation due to the demand from sink organs [16]. Water soluble carbohydrate mobilised from the stem to the growing grain is another source of assimilation when photosynthesis is limited in low nitrogen conditions. The remobilisation of valuable nutrients during anthesis is crucial for fruit and seed development, affecting yield quantity and quality [17,18]. During senescence, the plant replaces autotrophic carbon metabolism with catabolism of organelles and macro molecules. Proteins are metabolised as an alternative source of respiratory substrates, (especially when the plant is carbon starved), and free amino acids help maintain energy homeostasis in senescing leaves [19,20,21]. These are also exported to the growing grain for protein synthesis and nitrogen remobilisation. Protein synthesis and amino acid metabolism are compromised; chlorophyll and carotenoid biosynthesis are impaired, followed by a down-regulation in carbon utilisation and a reduction in photosynthetic rate. Although most of the nitrogen is stored in proteins, nucleobases are also rich in nitrogen [22,23,24]. Plants can degrade purine nucleotides for assimilation into amino acids by oxidising and hydrolysing the purine ring to glyoxylate, carbon dioxide and ammonia ([25]). Since the failure of mineral remobilisation is linked to late onset of leave senescence, extended photosynthesis alone is unlikely to increase grain mass; however, the manipulation of sink capacity in combination with extended photosynthesis could potentially increase grain yield [7]. In the current study, we sought to expand the knowledge base on how the global metabolite pattern in wheat leaves responds temporally during grain filling when subjected to various nitrogen levels, and to which extent the metabolic profile is altered with respect to the timing of the onset of senescence. Modern wheat cultivars were selected for their elite performance with high levels of applied nitrogen fertiliser, and although these elite varieties hold a narrow genetic basis compared to their wild progenitors [26], they still possess some restricted but useful diversity [1]. The Wheat Genetic Improvement Network (WGIN) comprises long-standing wheat field trials at Rothamsted Research, and has been established to examine the attributes that contribute to producing new, improved wheat varieties (http://www.wgin.org.uk).
The Avalon x Cadenza doubled-haploid mapping population, which comprises 850 lines, is highly suitable for dissecting complex processes that contribute to wheat performance due to the segregation of several major traits [27] (http://www.wgin.org.uk/information/publications.php).
From this Avalon x Cadenza doubled-haploid mapping population, lines with contrasting traits relating to early and late senescence were selected for analysis [28]. The performance of these lines was assessed in field-grown trials at various nitrogen levels (i) to obtain a combined and integrated analysis of the developmental response of wheat source leaf composition during grain filling with a weekly temporal resolution from anthesis until final harvest, and (ii) to identify metabolites that are indicative of senescence, or to determine the relevance of precise timing of the onset of senescence. Metabolic processes are described that are directed by the developmental programme following anthesis (developmental senescence) at four nitrogen application levels (0, 100, 200 and 350 kg ha−1 ammonium nitrate) in two doubled haploid lines differing in timing of senescence, i.e., early and late senescence.

2. Material and Methods

2.1. Plant Material and Growth Conditions

Two Avalon x Cadenza doubled-haploid (DH) lines (AxC 181; AxC 112) were preselected for contrasting canopy senescence, i.e., early senescence (ES) and late senescence (LS), out of a population of 208 DH individuals in two field trails at Rothamsted Research, UK in 2009/2010 under 100 and 200 kg/ha N fertilisation. The DH population derived from the F1 progeny of a cross between cultivars Avalon and Cadenza, was developed by Clare Ellerbrook, Liz Sayers and the late Tony Worland (John Innes Centre), as part of a Defra-funded project led by ADAS. The parents were originally chosen (to contrast for canopy architecture traits) by Steve Parker (CSL), Tony Worland and Darren Lovell (Rothamsted Research). The contrasting DH lines were integrated 2011/2012 in the Diversity field trail with 24 selected different wheat varieties as part of the Defra funded Wheat Genetic Improvement Network (WGIN) project. The field trial was grown at four nitrogen fertiliser levels (0, 100, 200 and 350 kg N ha−1 as ammonium nitrate) in three randomised replicate blocks at the Summerdells I and II fields at Rothamsted Research. Figure 4 and Supplemental Data set S1 summarises the main characteristics of the environments studied. In all field trials, post anthesis senescence was monitored by weekly SPAD (Soil Plant Analysis Development meter SPAD-502, Minolta, Japan) reading of the second leaf from the top. The full emergence of the second leaf with anthesis and slowest senescence of all leaves post-anthesis enabled complete post-anthesis monitoring until complete senescence, which is not the case for the flagleaf and other leaves.
For metabolome and further Chl analyses to specify senescence, replicated leaf samples of the second leaf just below the flag leaf (ten leaves from 10 main shoots per sample) were harvested and immediately frozen in liquid nitrogen, weekly, starting from anthesis up until final harvest.

2.2. Determination of Physiological Parameters

The concentration of Chl content per unit area was estimated in attached leaves by taking SPAD-502 (Konica Minolta, Ramsey, NJ) meter readings weekly on the second fully expanded leaf, midway along the leaf blade and half way between the central vein and the leaf edge. Measurements were made on leaves which were subsequently harvested for metabolite analyses.

2.3. Determination of Chl Contents

Samples were homogenised into a fine powder under liquid nitrogen and freeze dried. Chl was extracted twice with 80% and once with 50% ethanol (in water). The Chl contents of the combined and mixed extracts were measured with a Gemini XPS Fluorescence Micro plate Reader (Molecular Devices, UK). The contents of chlorophyll a (Chl a) and chlorophyll b (Chl b) were calculated with the following formulas: Chl a = 5.21A665 − 2.07A645, Chl b = 9.29A645 − 2.74A665, where A645 and A665 were absorbances at 645 nm and 665 nm, respectively [29].

2.4. Metabolite Extraction

The extraction of metabolites was performed by a conventional method of methanol/chloroform extraction, as described previously [30]. Metabolites were extracted from 30 mg freeze-dried plant material with 360 µL 80% methanol containing 30 µL nonadecanoic acid methylester (2 mg/mL stock in chloroform) for quantitative internal standardisation of the lipid phase and 30 µL of a pre-mixture of sorbitol (0.2 mg/mL methanol) and D-(−)-isoascorbic acid (0.5 mg/mL in H2O) used for quantitative internal standardisation for the polar phase. The extract was heated for 15 min at 70 °C before 200 µL chloroform was added to the polar phase. Then, 400 µL H2O was added to the mixture after shake incubation at 37 °C for 5 more minutes, and vortexed vigorously before centrifugation to separate the polar and non-polar phases. Aliquots of 100 µL each were dried in a speed-vac. Primary metabolites, amino acid and ion contents were measured from dried extracts.

2.5. Determination of Ion Contents

Dried extracts were dissolved in UPLC/MS grade water and analysed by high-performance anion exchange chromatography with conductivity detection using a Dionex ICS-3000 system. Elution of the ions was performed using a KOH gradient (flow rate 0.25 mL/min); 0 min, 6 mM KOH; 10 min, 45 mM KOH; 12 min, 55 mM KOH; 17 min, 6 mM KOH).

2.6. Determination of Amino Acid Contents

Dried extracts were dissolved in 70 µl 5 mM sodium phosphate buffer (Na2HPO4 and NaH2PO4) pH 6.2. The samples were centrifuged at 20,000 g for 30 min at 4 °C. Amino acids were measured by precolumn derivatisation with orthophthaldehyde in combination with fluorescence detection (excitation wavelength 330 nm; emission wavelength 450 nm) as described in [31]. Elution was achieved on a Hyperclone C18 ODS column (Phenomenex) connected to a HPLC system (Dionex), applying a solvent gradient with increasing hydrophobicity (buffer A: 0.2% (v/v) tetrahydrofolate, 8.5 mM sodium phosphate buffer, pH 6.8; buffer B: 32.5% (v/v) methanol, 20.5% (v/v) acetonitrile, and 18.5 mM sodium phosphate buffer, pH 6.8; flow: 1.0 mL/min; 0 to 3 min: 100% A, 5 min: 93% A, 7% B; 14 min: 60% A, 40% B; 18 min: 55% A, 45% B; 28 to 31 min 100% B, 31.3 to 34 min: 100% A).

2.7. Profiling of Primary Metabolism

Profiling the relative changes of primary metabolite pools by gas chromatography-time of flight-mass spectrometry (GC-TOF-MS) was performed as described previously [31,32]. Multiparallel chromatography data processing and compound identification were performed by TagFinder software [33] using reference spectra from the Golm Metabolome Database for compound identification [34].

2.8. Statistical Analysis

The R statistical scripting language (http://www.r-project.org/) was used for most of the statistical analysis in this study. In the metabolite correlation analysis, each metabolite was normalised by dividing its average from all conditions (the combinations of genotype, treatment and time point) and R “stats” package was used to implement the Pearson correlation analysis.
For the principal component analysis (PCA), the biological replicates (n = 3) of each metabolite were firstly averaged as a metabolite expression level; then, each metabolite was normalised by dividing its average from all conditions. PCA was implemented using R package “pcaMethods” [35]. Lines with contrasting phenotypes relating to senescence (i.e., early and late senescence) were also assessed separately as pairs to identify metabolites that are indicative of metabolic traits which influenced the interaction between N-supply and post-anthesis development (Figure 4 and Supplemental Data Set S2). Metabolite data were scrutinised by PCA, pair-wise t-test and two-way ANOVA to identify metabolites that differed in absolute content between the contrasting genotypes. Next, the differential responses between genotypes contrasting in trait were investigated by normalising the early senescing line to the late senescing line. The data set was Log transformed and Log2-fold ratios were ranked to identify differentially abundant metabolites in the early senescing line. Additionally, the structure of the metabolic network was assessed by examining correlative matrices of metabolites and yield parameters for each genotype to determine which metabolites contribute to improved yield or %N in the grain or straw. By using these approaches, metabolites could be identified that revealed differences and distinguished the early and late senescing lines from another.

3. Results

3.1. Difference in Chlorophyll Content in the Leaves of Wheat under Different Nitrogen Conditions

The second leaf from plants which were grown on four different nitrogen levels was harvested weekly from the onset of anthesis until final harvest to compare leaf senescence metabolism in response to nitrate availability in wheat lines differing in their timing of senescence. Since chlorophyll content is often regarded as a proxy of leaf N content and senescence progression [36,37], chlorophyll contents and SPAD meter readings were recorded weekly to monitor the progression of senescence after anthesis, comparing genotypes with contrasting traits to one another; i.e., early senescence; AxC181 to late senescence; AxC112 (Table 1). In agreement with visible yellowing, chlorophyll contents in wheat leaves decreased with the progression of development. The N application rates had a strong effect on the total chlorophyll content in the leaves showing a positive N dose-response relationship. Chlorophyll levels were maintained longer at higher levels in plants fertilised with adequate (N200) or high N (N350) and chlorophyll degradation set in one week later (3 wpa) compared to nitrate limiting conditions (N100 and N0 at 2 wpa). The early senescing line had a lower chlorophyll content overall, but it also demonstrated an earlier decline in chlorophyll contents. Chlorophyll contents at N100, N200 and N350 were maintained at higher levels up to 3 wpa in the late senescing line compared to the early senescing line, which showed a reduction in chlorophyll contents (Table 1). Interestingly, at the N0 level, there was no differentiation between early and late senescence between the lines with partly higher chlorophyll contents in the early senescing line compared to the late senescing line. This possibly resulted from the already reduced chlorophyll content compared to the higher N-fertilisation rates from anthesis onwards based on the diminished growth under N0 (Table 1).
The manual SPAD analysis of just a small (middle) part of the leaf of wheat plants, especially late post-anthesis, suffers from higher error rates, which is also seen in Table 1 (mostly based on the unequal distributed reduction of greenness during senescence) in contrast to the chlorophyll measurement which covers the whole leaf. This is partly due to a slightly weak discrepancy without diminishing the overall senescence pattern between SPAD and chlorophyll measurements. We clarified the senescence behaviour for the two DH lines grown at N0, in which, interestingly, there was no differentiation between early and late senescence between the lines, with partly higher chlorophyll contents in the early senescing line compared to the late senescing line. This means that early senescence is also dependent on N-supply with at least (in our experiments) from N100 onwards, explaining the drastic reduction between 2 and 3 wpa at N100 and the delay between 3 and 4 wpa at N200/N350.

3.2. The Effect of Nitrogen Supply on Grain and Straw Yield, and %N in Grain and %N in the Straw

The life span of leaves or the duration of photosynthetic activities determines total assimilates available for grain filling and influencing crop yield [13,38]. Premature senescence generally leads to significant yield loss, while delayed senescence shows increased grain production [39]. Senescence, on the other hand, is required for yield formation and efficient nutrient use [40,41]. In order to investigate the effect of the senescence programme in relation to nitrogen availability on yield formation, grain yield, straw yield, % N in grain and % N in straw were determined in the harvest. Plants grown in plots where zero nitrogen (N0) was administered delivered low yields (Table 1), while an N supply of 100 kg N ha−1 (N100) or higher significantly increased grain yield. However, N application levels of 200 (N200) and 350 kg N ha−1 (N350) did not significantly improve grain yield further. On the other hand, differences in straw yield were evident. Straw yield increased at N0, N100 and N200, respectively in the early senescing line compared to the late senescing line (Table 1). Moreover, the early senescing lines had higher N contents in the grain and straw at the N350 level (Table 1).

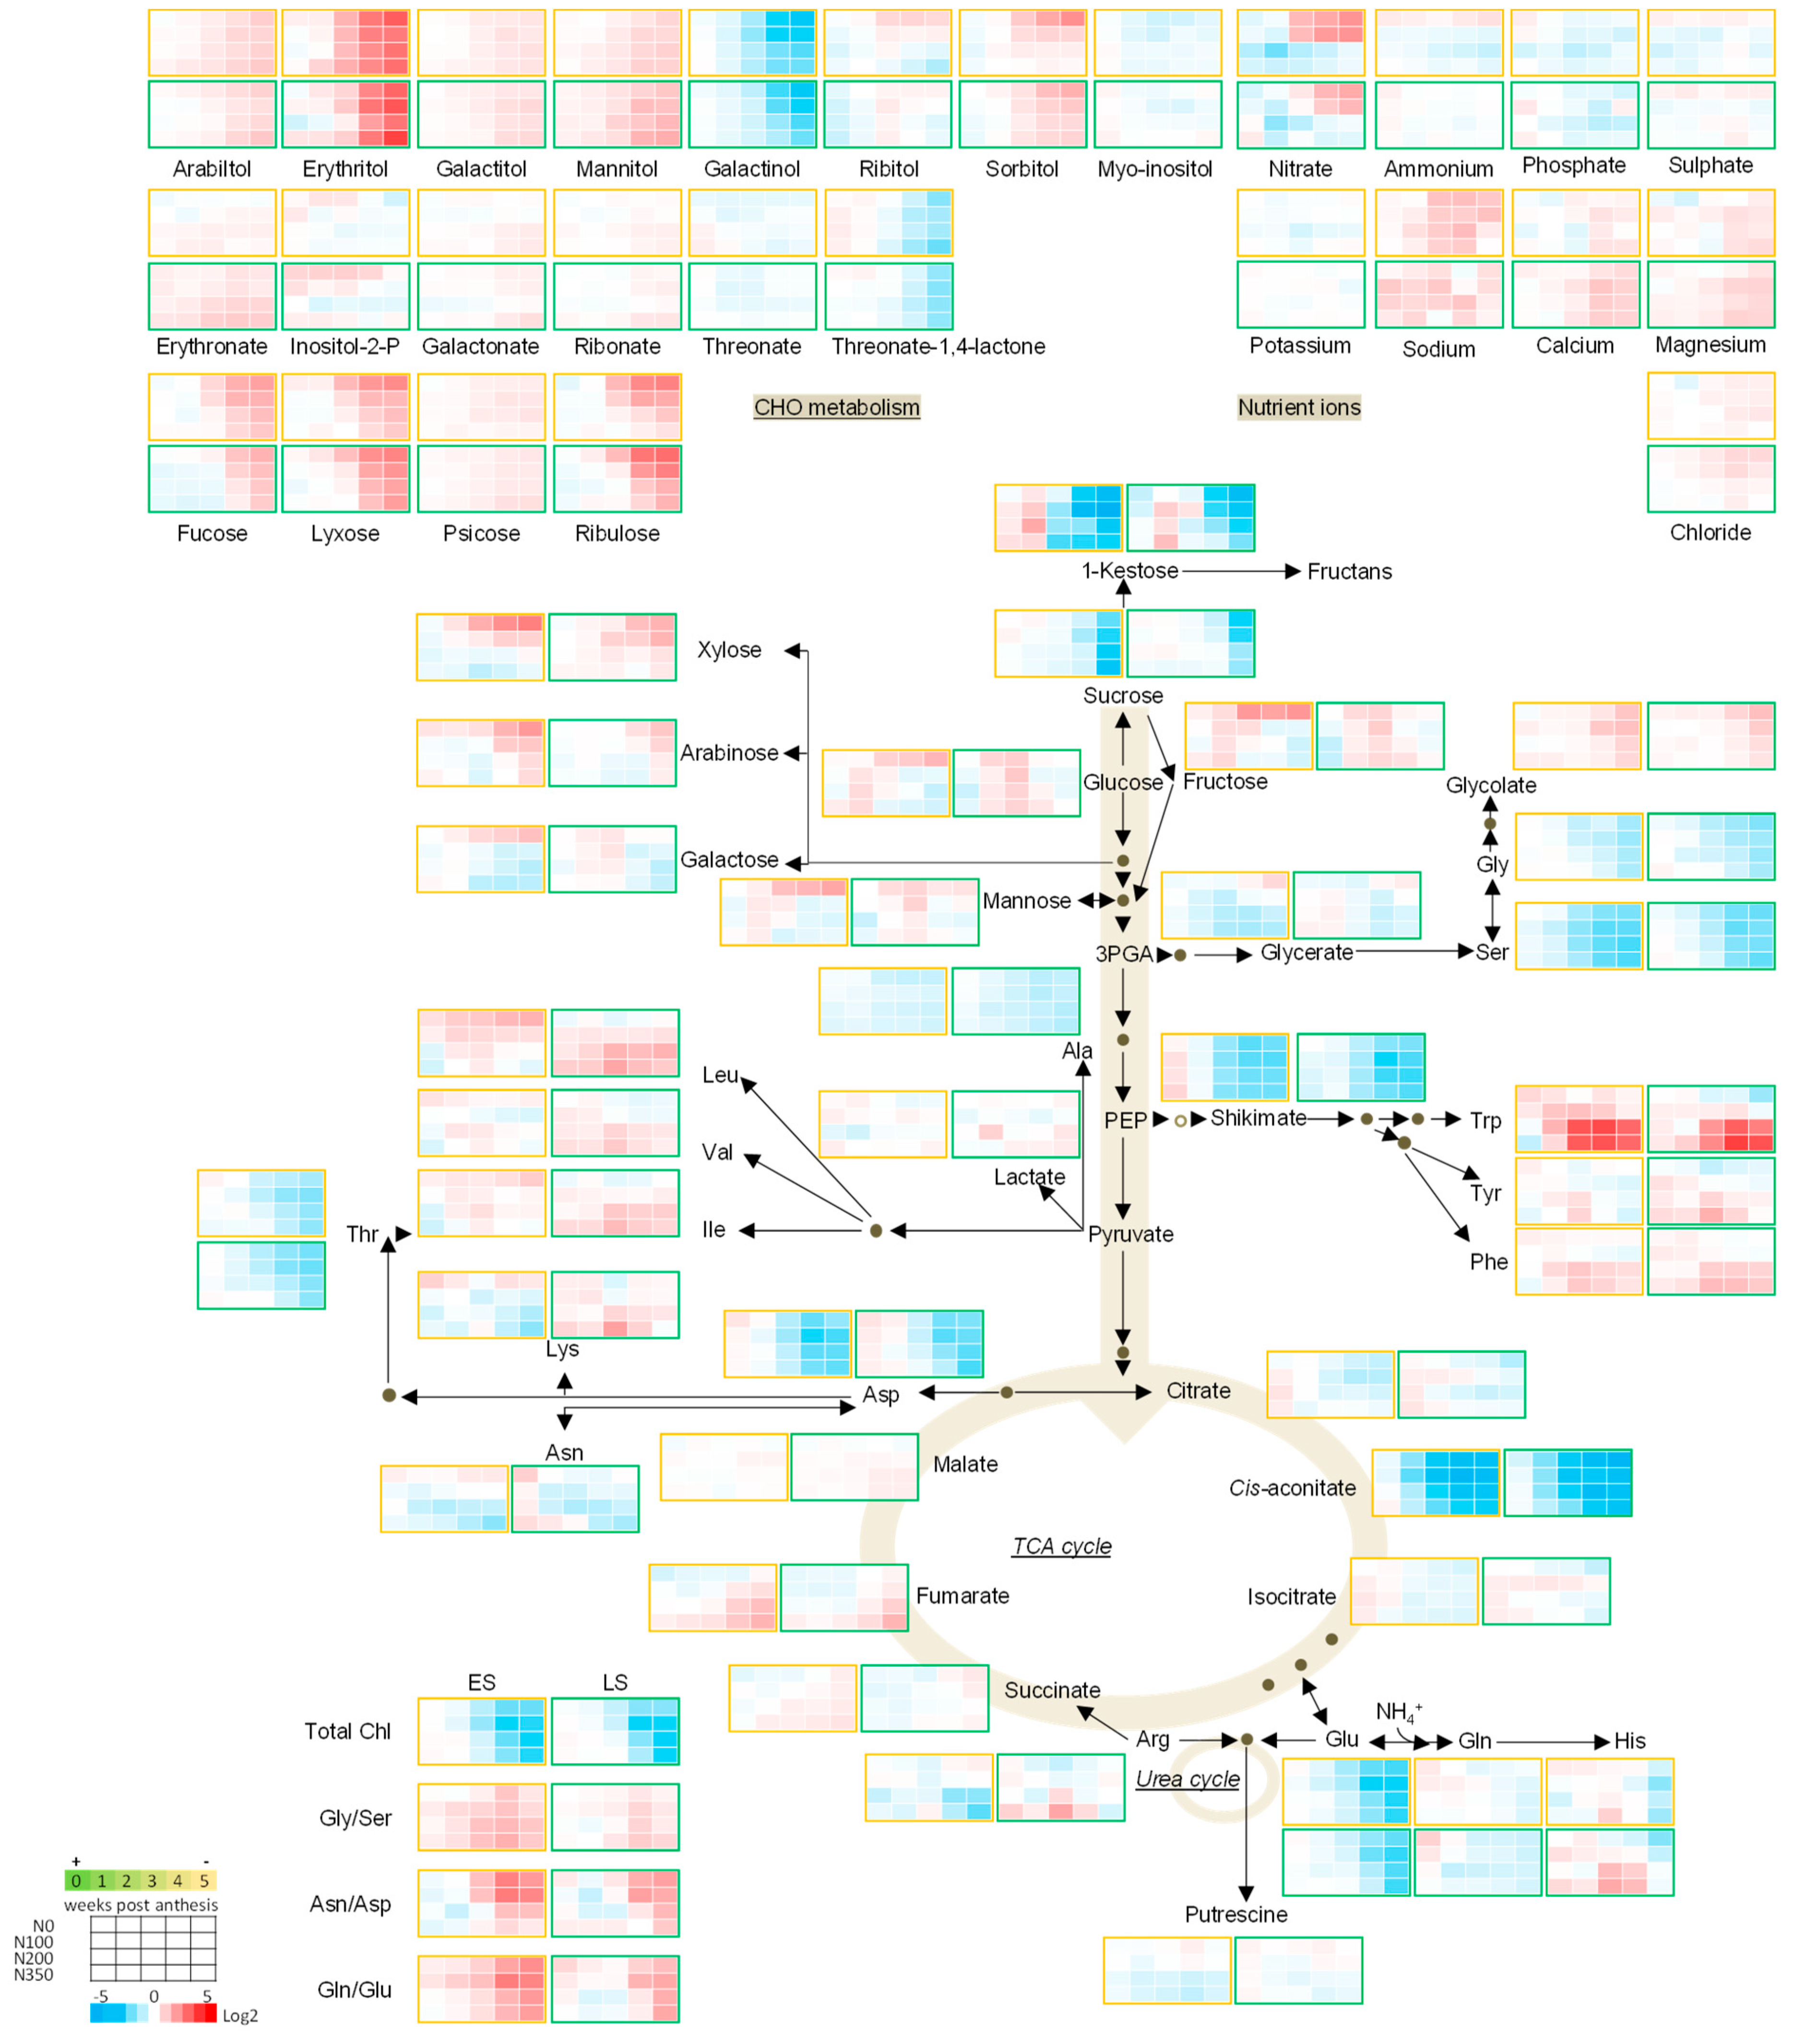
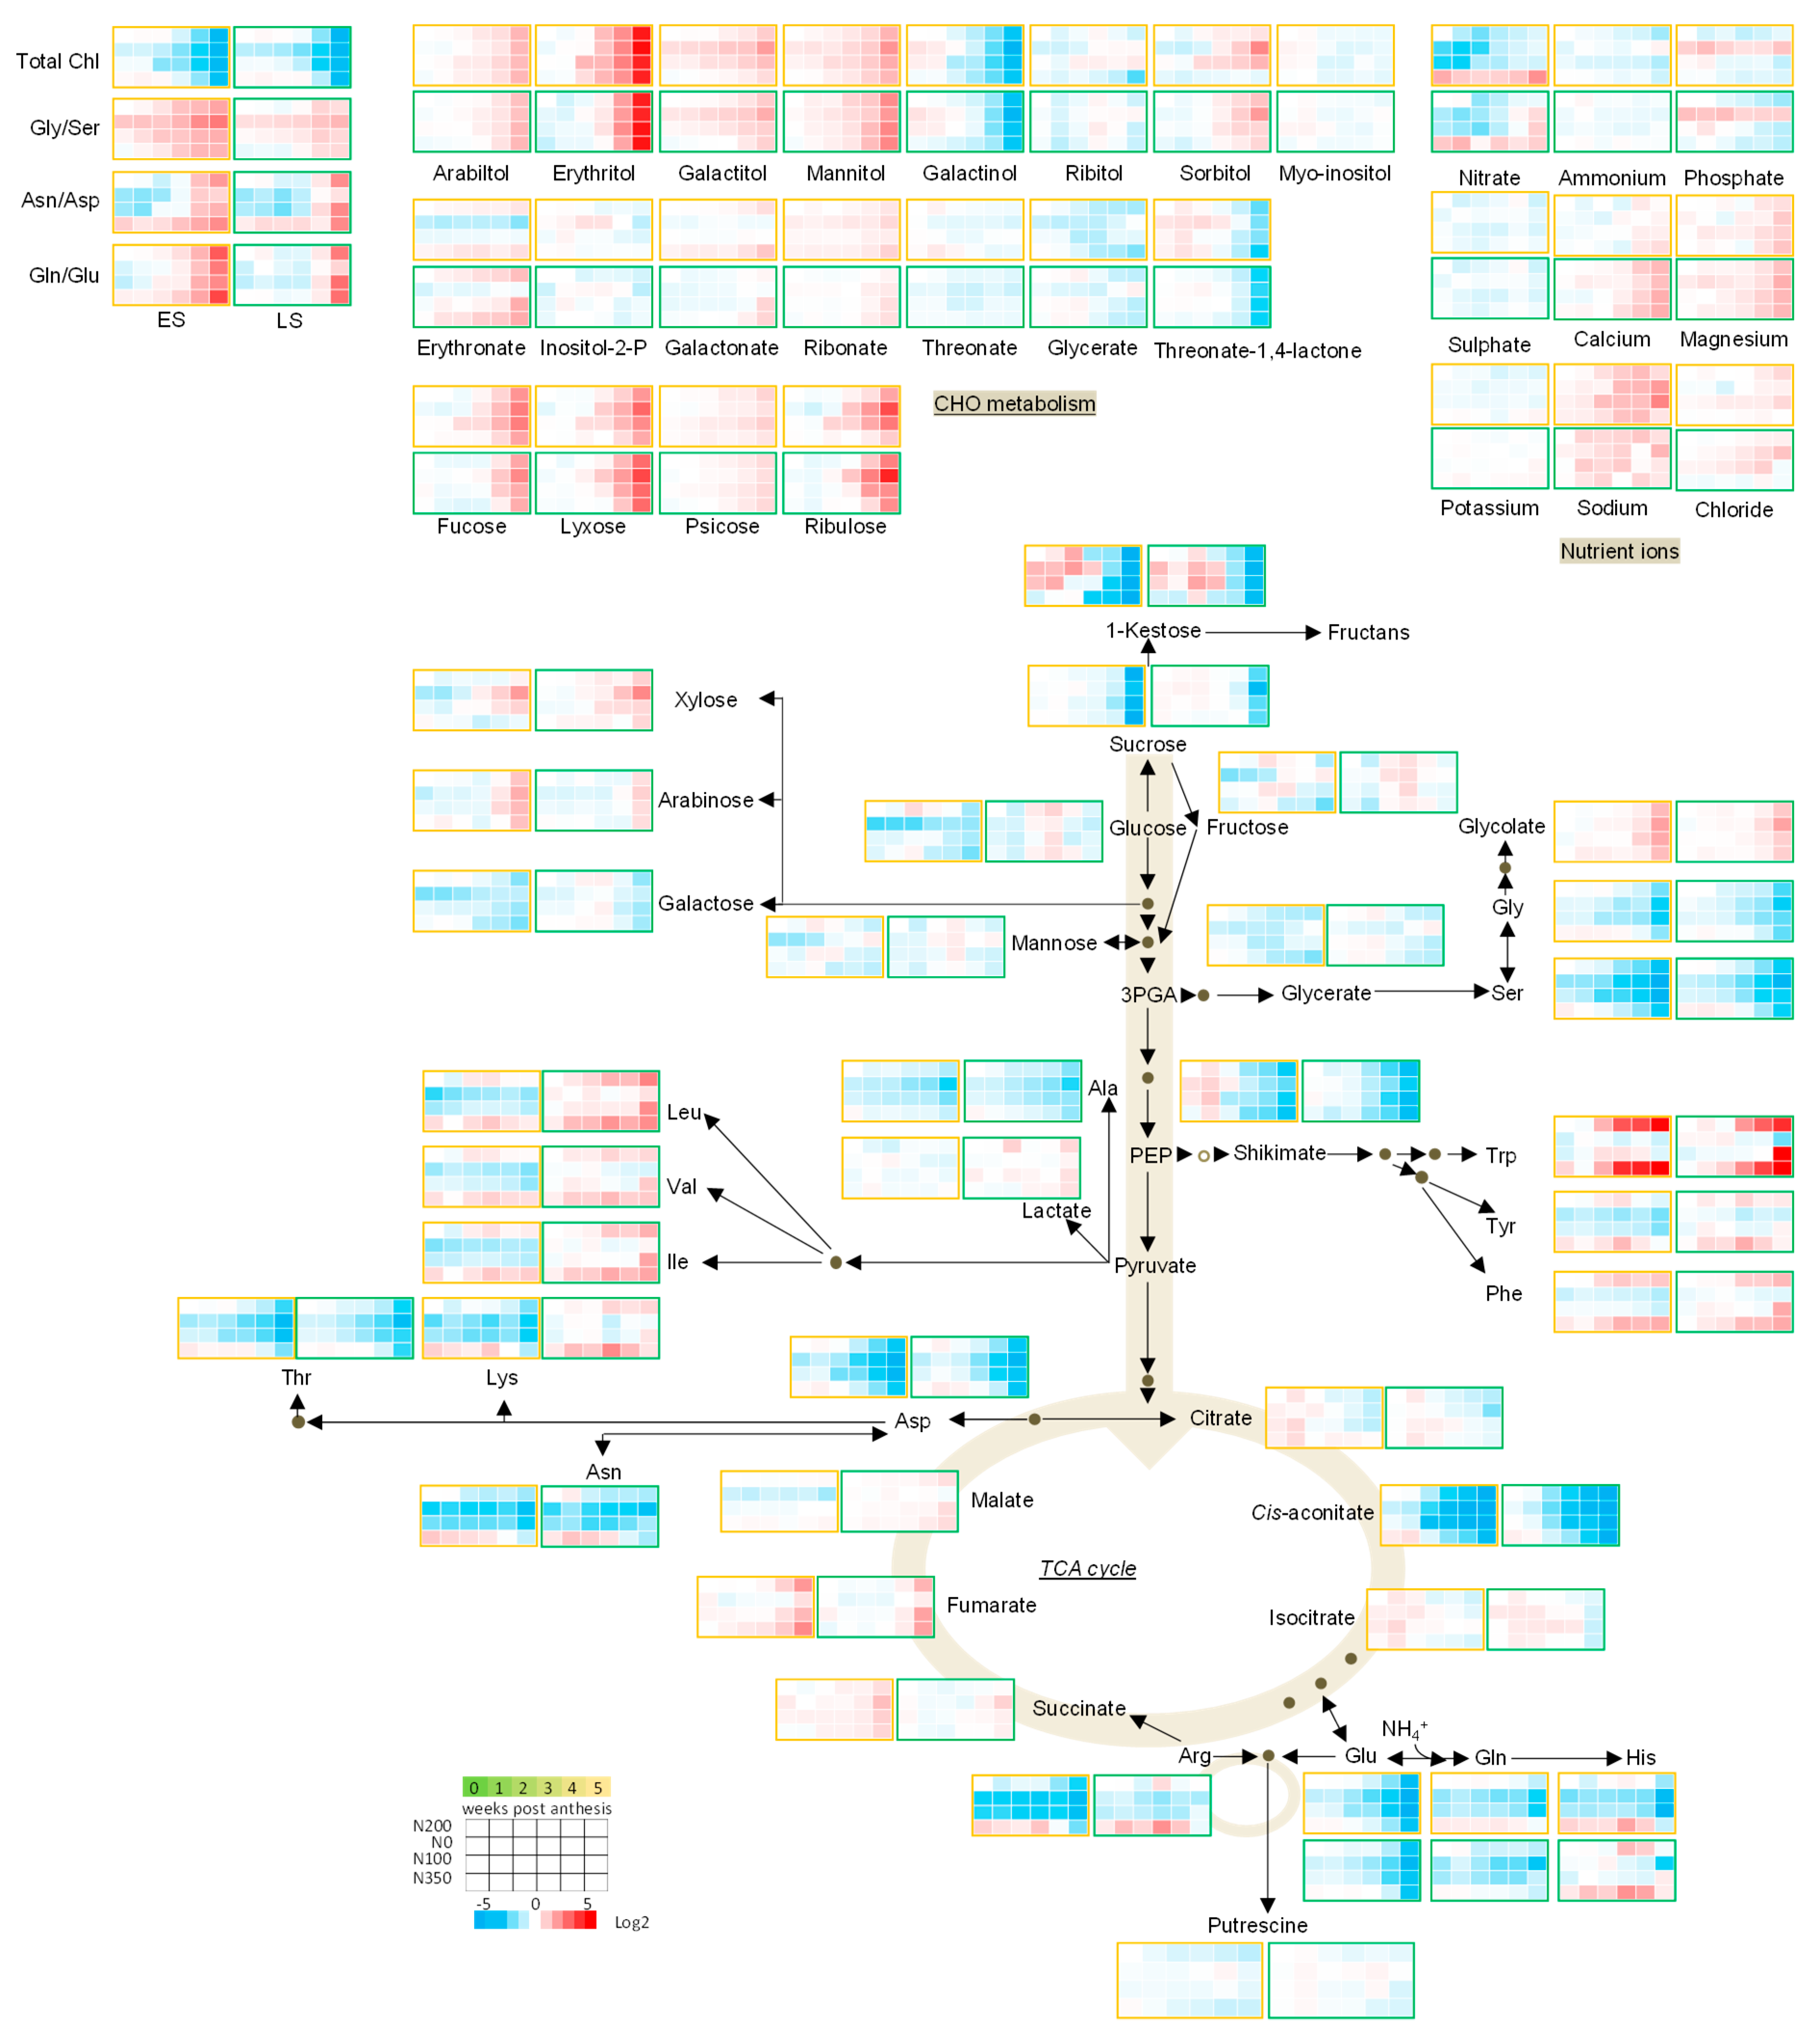
3.3. The Metabolic Profile of Leaves during Post Anthesis Senescence

To support the physiological data, samples of leaves at 0, 1, 2, 3, 4, and 5 wpa were collected and subjected to metabolic analysis using gas chromatography (GC)-mass spectrometry (MS) and high-performance liquid chromatography (HPLC) to investigate the metabolic relationship between post anthesis leaf senescence and the availability of nitrogen fertiliser. In total, 88 metabolites were identified, including 12 carbohydrates, 17 amino acids, 15 organic acids, 9 ions, and 35 other compounds (Supplemental Data Set S1).
Significant changes in metabolite accumulation were observed between leaf samples from different developmental stages and grown under different nitrogen levels. Notably, metabolite data showed a low variability among biological replicates. To assess the metabolic response with respect to timing of senescence, metabolite profiles of two lines with contrasting senescence phenotypes, i.e., early senescence (AxC181) and late senescence (AxC112) were compared. All of the 88 primary metabolites, including chlorophyll contents (which were performed on the same material) were subjected to Principal Component Analysis (PCA) to visualise the general trend of metabolic changes in global space over time occurring during senescence after anthesis in relation to the administered nitrogen fertiliser levels (Supplemental Figure S1A,B). The PCA analysis revealed dynamic patterns of changes in the metabolism between the different developmental stages and nitrogen levels. The metabolic changes from anthesis to 5 wpa showed a linier trend at low nitrogen levels, while a scattered distribution of principal components was observed at higher nitrogen levels. The PCA score plot (Supplemental Figure S1A) separated samples largely by nitrogen treatment depicted by the first principal component (PC1) which accounted for 32.4% of the variance. The second principal component (PC2) accounted for 30.3% of the variance and resolved post anthesis development. A strong separation between nitrogen conditions (PC1) indicated that nitrate nutrition had a strong effect on metabolite concentrations. The distribution of data points between the consecutive weeks (0 – 5 wpa) revealed that post anthesis development (senescence) also had a strong effect on metabolite concentrations, but was influenced strongly by higher nitrogen levels. Subsequently, the metabolic composition of wheat leaves is developmentally controlled (indicated by the arrows), but also, the nutritional status of the vegetative tissues has a comparable effect. Euclidean distances (Supplemental insert, Figure S1A), depicted the largest metabolic differences at 0 and 3 wpa between the early senescing line (AxC181) and the late senescing line (AxC112) at N350. A PCA loadings plot (Supplemental Figure S1B) demonstrates the contribution each of the metabolites had to the separation between conditions seen in the score plot (Supplemental Figure S1A). The PCA loadings plot indicated that the majority of the amino acids, nitrate, cis-aconitate as well as some of the sugars such as 1-kestose, fucose, lyxose and ribulose contributed most to the separation between samples (Supplemental Data Set S1). The metabolite levels, rather than their presence or absence, distinguished the lines from one another when nitrogen levels were sufficient at anthesis and 3 wpa (Supplemental Figure S1B).

3.4. Senescence Related Changes in Metabolite Levels in Wheat during Grain Filling

The senescence-related metabolic changes of the plants were scrutinised to get insights into their temporal behaviour under the various nitrogen levels. Log2-fold ratios of the metabolic levels were calculated and normalised to (i) anthesis, to evaluate their response during post anthesis developmental senescence, and (ii) normalised to the N200 nitrogen level, to determine how nitrogen fertilisation influences developmental senescence during grain filling. The resulting heat maps provided a metabolic map of the primary metabolism landscape during post anthesis senescence (Figure 1) and in response to nitrogen level (Figure 2).

3.4.1. Nutrient Ions

Leaf senescence is strongly connected to the nitrogen status of the plant, which ultimately determines the yield. This compelled us to study the senescence effects also under various N levels. As a leaf senesces, nutrient ions like nitrogen, phosphorus and minerals are remobilised to rapidly-growing parts, or to storage organs such as the developing fruits/seeds [8,9]. Because plant nitrate levels also modify the uptake of other ions and may influence the levels of phosphate and sulphate in the plant leaves [42], the ion contents were determined. Normalising the nitrogen-related metabolite changes to the 200 kg N ha−1 level allowed us to assess the effects nitrogen has on primary metabolism during post-anthesis development. Interestingly, leaf nitrate content only increased in plants that were grown under low nitrate and increased with progression of senescence. The levels of calcium, magnesium, chloride and sodium also showed marginal increases, while those of the macro nutrients, i.e., ammonium, phosphate, sulphate and potassium, remained unchanged, meaning they are not mobilised in a similar manner. On the other hand, the levels of nitrate accumulated by more than 4-fold in the early senescing line when high levels of N fertiliser were applied. A large amount of ammonium is produced as a result of nucleic acid catabolism and protein degradation in senescing leaves [43]. The resulting ammonium may either be channelled back to form amino acid structures via the GS/GOGAT cycle, or may either be directly incorporated into glutamate through amination of alpha-ketoglutarate and subsequently into glutamine [44,45]. Ammonium contents of the leaves didn’t change significantly over the post anthesis growth period, nor did they change in response to the various N levels.

3.4.2. Amino Acids

Protein degradation during senescence releases free amino acids for nutrient recycling and allows nutrients to be remobilised to growing green tissues, or to fuel energy metabolism by being fed into the TCA cycle to form the substrate, acetyl-coA, or to fill seeds to guarantee a progeny [46]. The levels of 17 amino acids were determined in this study. The accumulation of the aromatic amino acids which are derivatives of the shikimate pathway and include Phe, Trp and Tyr increased significantly during senescence, while the levels of their precursor, shikimate decreased. Among these, Trp showed the strongest developmental response, and levels increased even more in plant leaves grown on high nitrate (Figure 3). These amino acids have also been shown to accumulate during dark-induced senescence and in response to nitrogen limitation; however, in our study the levels increased strongly in those plants under high levels of nitrogen [47,48]. Similarly, the branched-chain amino acids (Leu, Ile and Val), which have been shown to be critical in respiration as alternative substrates also displayed an accumulation as senescence progressed [47,48,49]. The levels of Lys and His followed the response of the branched-chain amino acids, peaking at 3 wpa and decreasing again as senescence progressed. The levels of Thr, Ala, the N-rich and senescence associated amino acids (Asn, Asp, Gln and Glu) as well as Gly and Ser all decreased as senescence progressed. We observed an increase in the Asn/Asp and Gln/Glu ratios, pointing to a more active inter-conversion of Asp to Asn and Glu to Gln during senescence, suggesting that Asp and Glu became the limiting metabolic factor during developmental leaf senescence and the nitrogen-rich amino acid, Gln, accumulated with the decrease in Glu with senescence pointing to mobilisation and reallocation of nitrogen from the senescing leaves to sink tissues. This conversion was again stronger and occurred earlier in leaves of plants under nitrate limitation, and clearly corresponds to the decreasing chlorophyll contents which is apparent from 3 wpa onwards. Another source of amino acids during senescence is guaranteed by their synthesis. Both Gly and Ser which are involved in photorespiration [50], decreased with development, whereas their direct upstream intermediate, glycolate increased slightly. The reduction in the levels of Ser was stronger thereby contributing to a marginal increase in the Gly/Ser ratio.

3.4.3. Sugars

The role of sugars in plant senescence remains controversial, and their role in the senescence programme may vary depending on the species, tissue type and treatment/perturbations. Both sugar addition and starvation can give rise to the development of leaf senescence [51,52,53]. Moreover, sugars are known to control plant growth by regulating the rate of photosynthesis and the development of senescence by inducing the expression of SAG genes [54]. In this study, metabolites associated with sugar metabolism were assessed for their response over time following anthesis, in relation to nitrogen availability and in two lines with opposite senescence programmes. As a general trend, metabolites associated with sugar metabolism increased as senescence progressed. Fucose, lyxose, psicose, xylose, arabinose and ribulose increased towards the end of the growth period. Alongside the increase of these sugars, an accumulation of sugar derivatives such as the sugar alcohols arabitol, galactitol, mannitol and erythritol could be seen. Among carbohydrates and glycolysis compounds, erythritol increased the strongest as senescence progressed, followed by ribulose, lyxose and fucose, while the levels of 1-kestose and galactinol decreased as senescence progressed. The monosaccharides fructose and glucose showed very little change, while the disaccharides sucrose and 1-kestose decreased during senescence. This decline may be ascribed to the continued need for carbohydrates (produced during photosynthesis) for cell division and cell elongation or an indication of sink/source transitions taking place in the plant [55]. The timing of the onset of the metabolite response to senescence also revealed that sucrose levels remained unchanged up until the week of final harvest, pointing to a sporadic reshuffling at the later stages of grain filling where the wheat leaf is fully senescent. Interestingly, the response in levels of the mentioned sugars were sturdier in plant leaves of the early senescent line and more pronounced in the late senescing line as exemplified by the strong decrease in sucrose when grown at N0 which once again highlights their role in nitrogen metabolism and during senescence.

3.4.4. The TCA Cycle Metabolites

The TCA cycle metabolites displayed a rather mixed pattern. Among the TCA cycle metabolites, cis-aconitate levels showed the most remarkable changes with developmental time, preceding the decline in the levels of total chlorophyll. The decline in cis-aconitate levels was not only occurring earlier, but was also stronger in plants grown on lower N levels. Fumarate and succinate levels increased over time, accumulating in leaves that received plenty of nitrogen. Malate levels remained constant with the progression of senescence, but portrayed significant differences between the ES and LS lines, accumulating two-fold higher in LS than in ES line. Although no changes in any of the other TCA cycle metabolites could be seen, former research showed that the TCA cycle remained active until the very late stages of leaf senescence to provide intermediates for generating ATP to match the increased demand of energy for nutrient mobilisation and sink/source relationships in which cell viability has to be maintained [43].

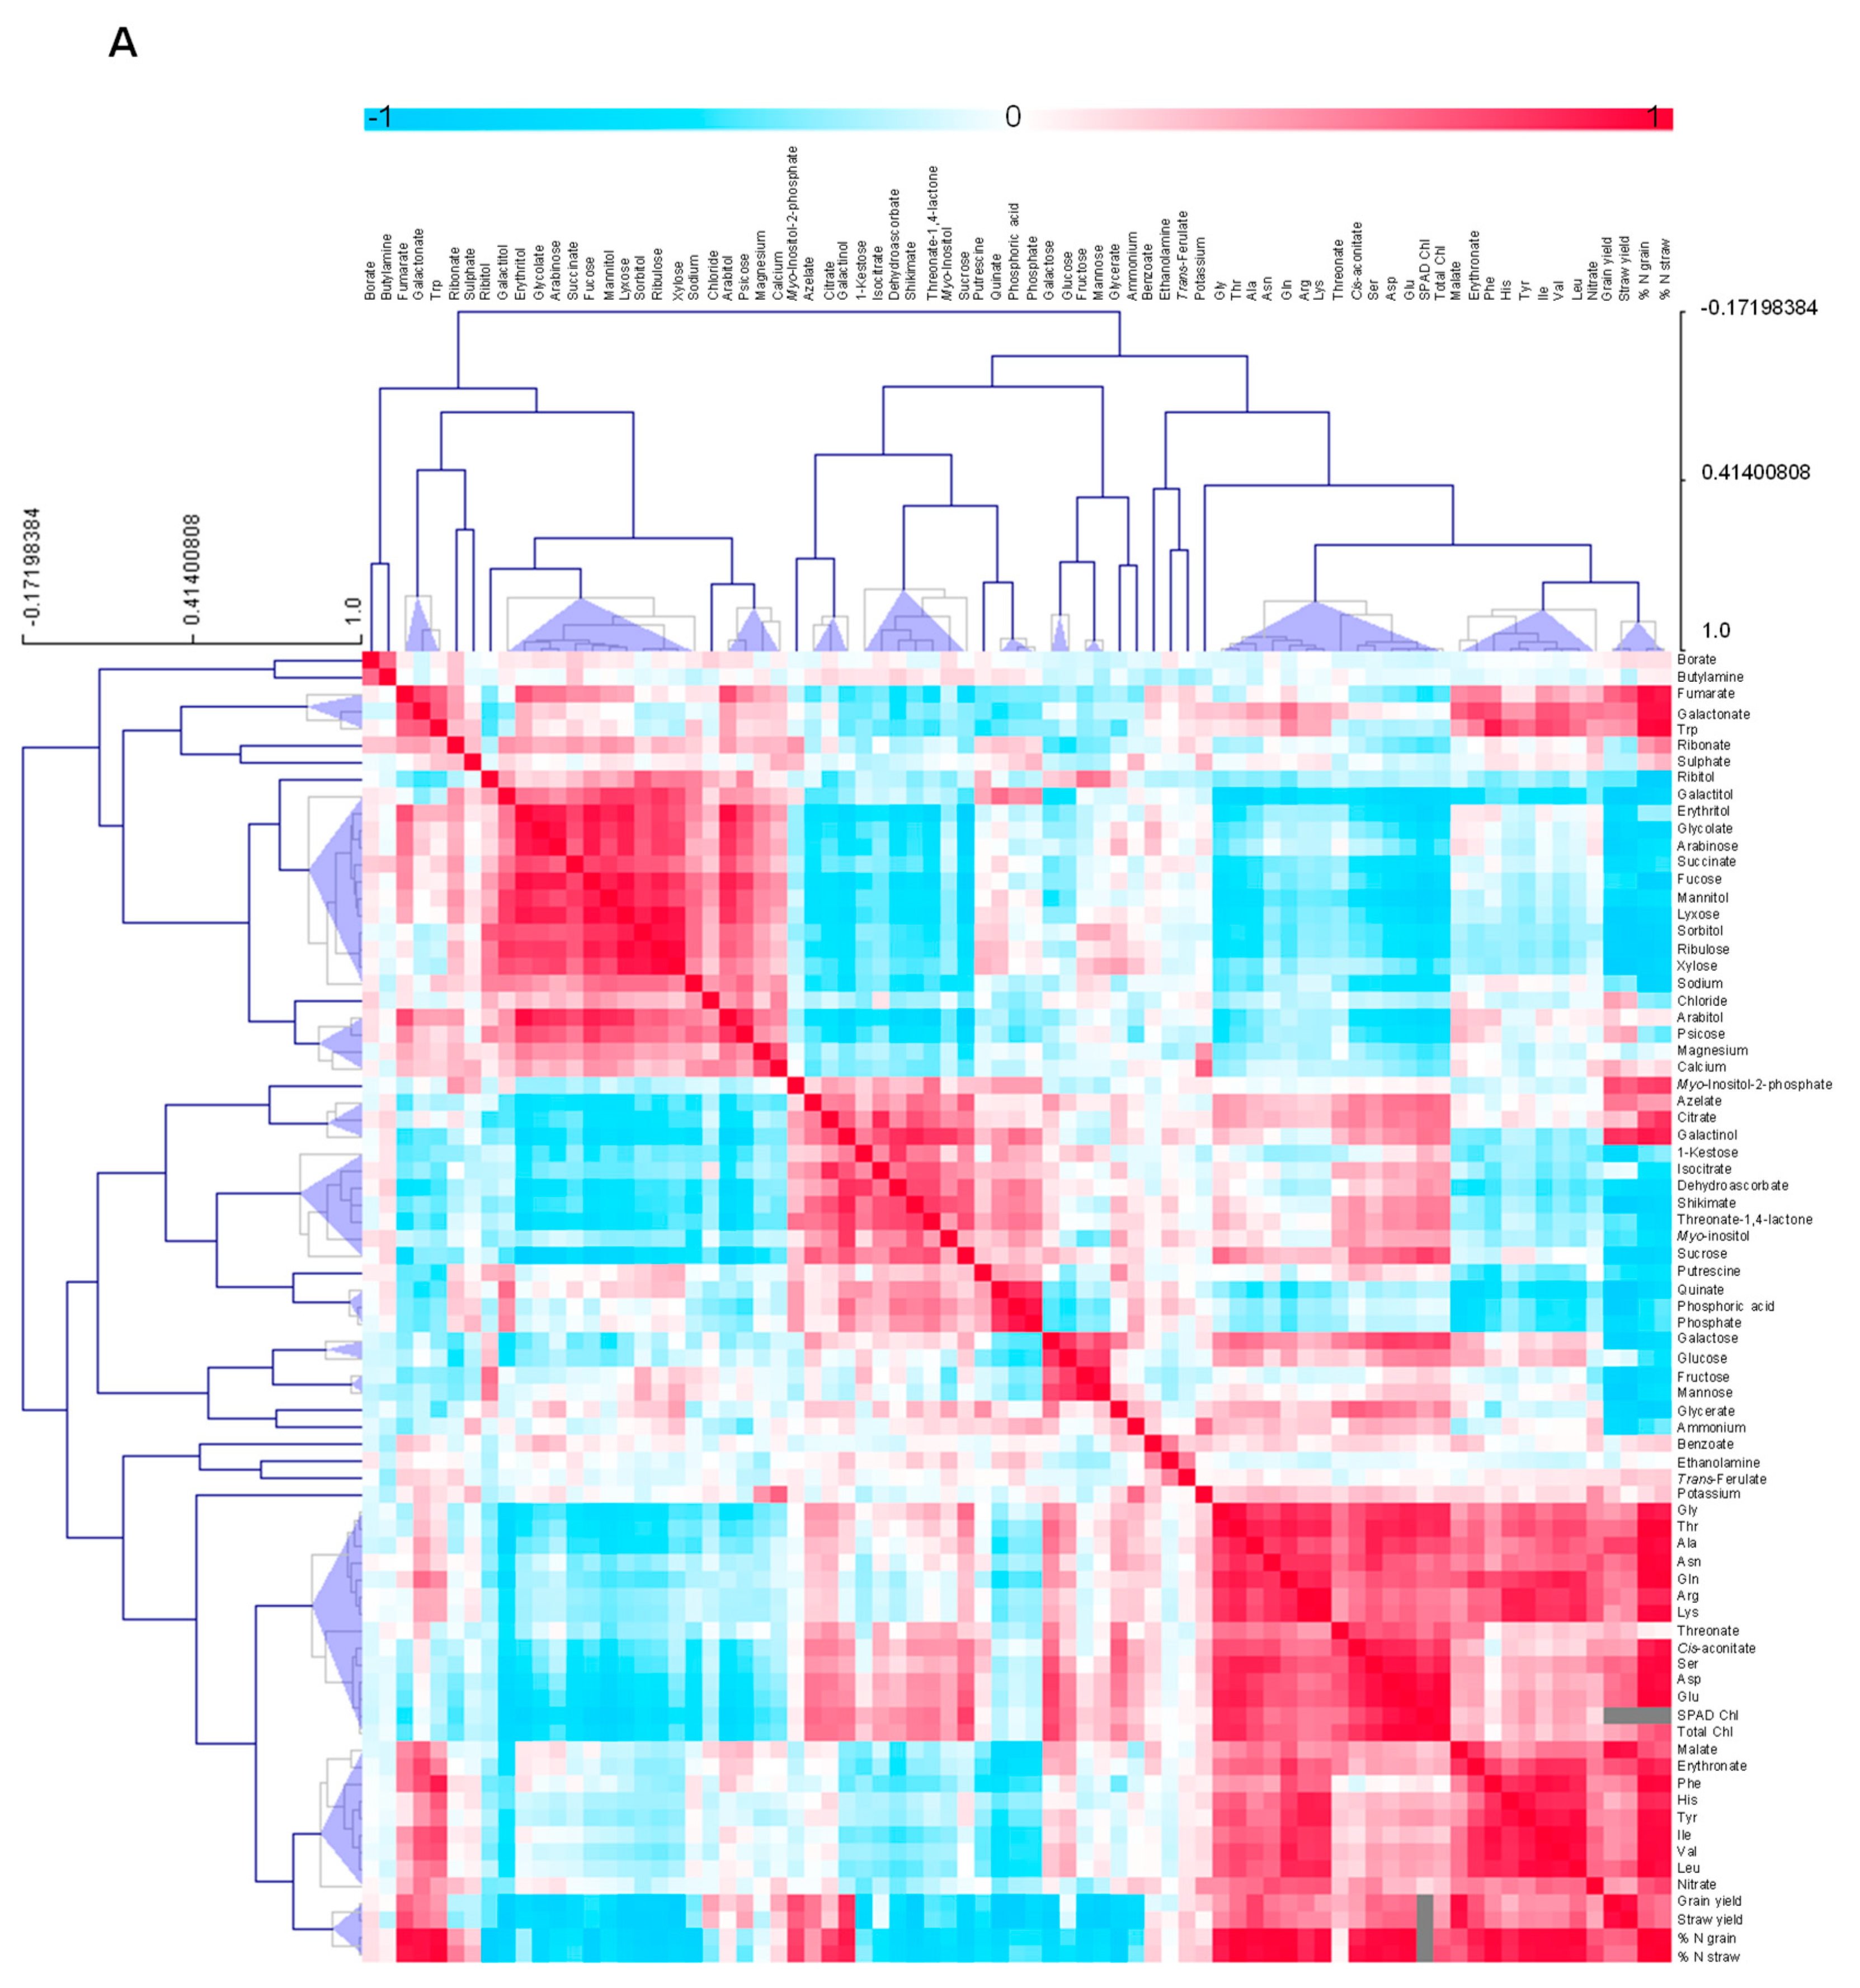
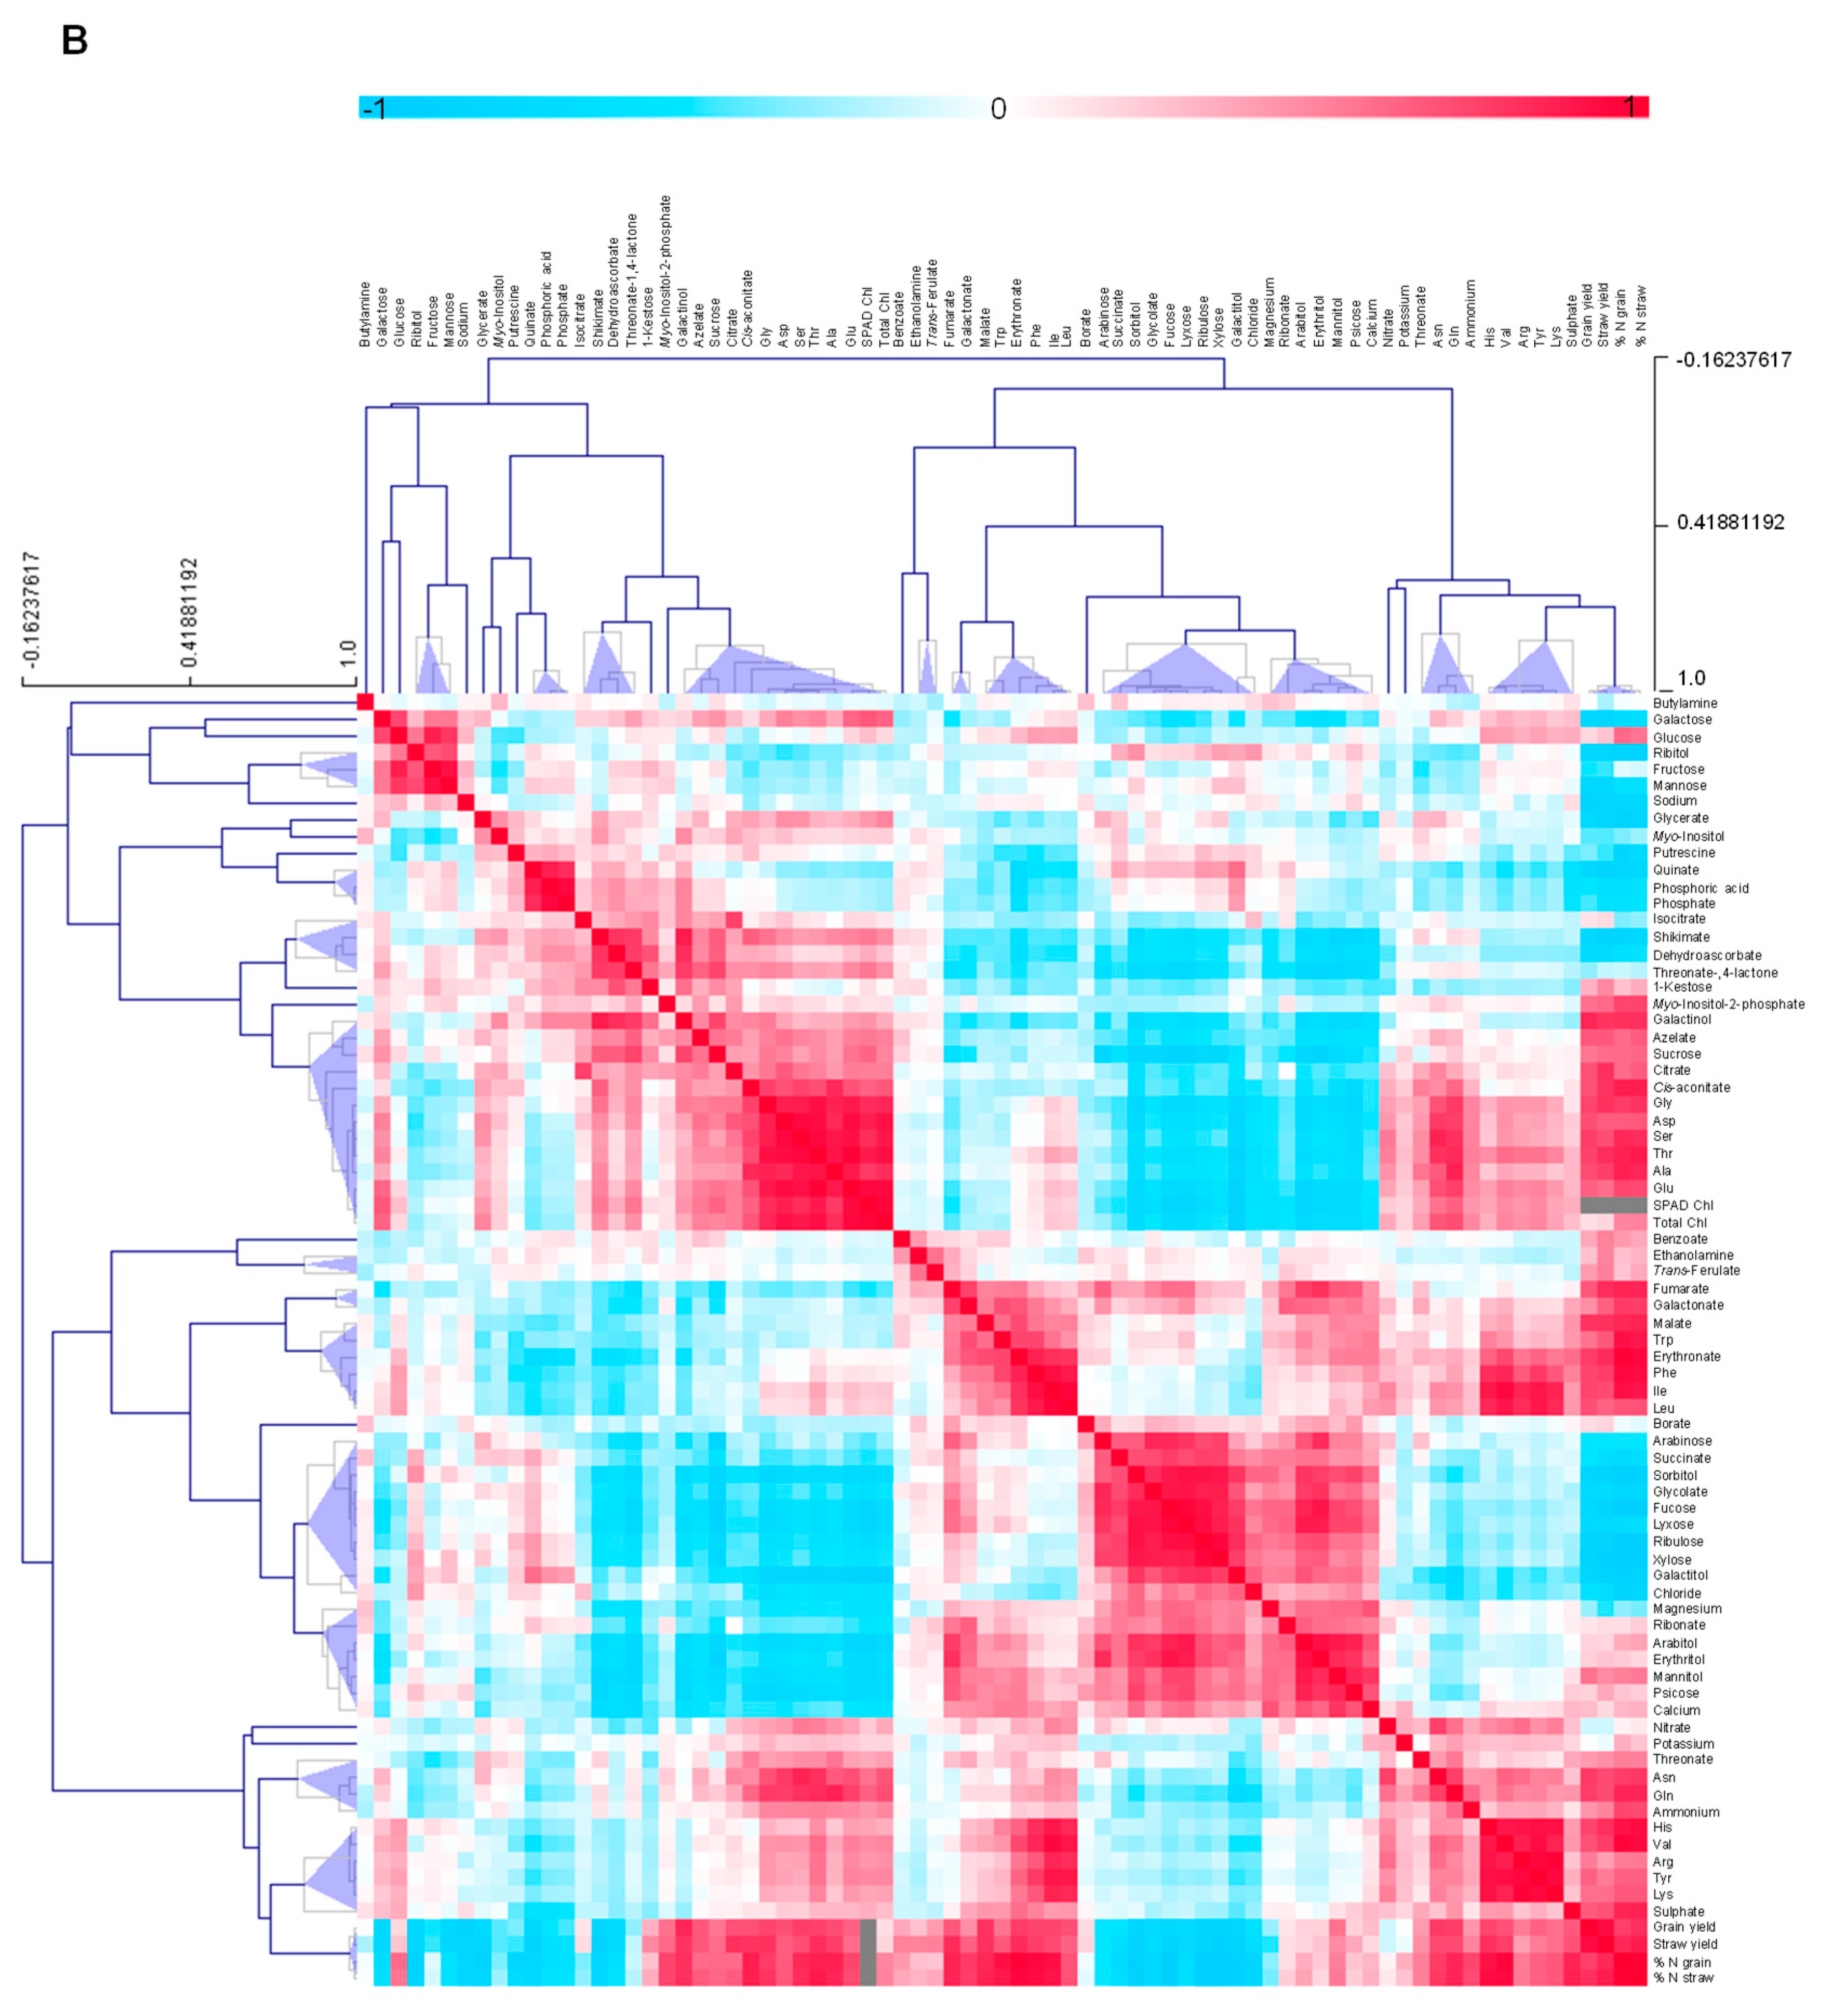
3.4.5. Metabolite-Metabolite Correlation Analysis with Reference to Yield Characteristics

Pair-wise comparisons of the 88 metabolites, Chl contents and yield parameters were calculated using Pearson’s correlation coefficients (Figure 4 and Supplemental Data Set S1). The resulting correlation matrix revealed metabolites that either positively or negatively correlated to each other or to yield parameters (Figure 4). Erythritol, mannitol, 1-kestose, sucrose and glucose showed a distinction in their correlation to yield parameters, differentiating the early and late senescing lines. 1-kestose showed a significant negative correlation to grain and straw yield in the early senescing line. Contrary, 1-kestose correlated positively to grain yield in the late senescing line. Furthermore, sucrose correlated negatively to yield and positively to Chl contents in the early senescing line, but positively to both yield and Chl contents in the late senescing line. A significant positive correlation of sulphate to both grain and straw yield, as well as to %N in the grain and the straw in the late senescing line, could be detected, while sulphate displayed no significant correlation to either grain or straw yield in the early senescing line. A negative correlation of sulphate to nitrate under low N was evident.
The differential response of the late senescing line was normalised to the early senescing line to filter out metabolites that are diagnostic for the senescence phenotype. Figure 5 depicts the differential response of metabolites, i.e., early senescing line normalised to the late senescing line. We compared changes between the early and late senescing line by normalising the early senescing line to the late senescing line. From this analysis, sugars and amino acids were the main drivers separating the ES and LS lines. A metabolite analysis of the differentially-senescing lines, i.e., early and late senescing lines, allowed us to identify a number of sugars and amino acids that could be indicative of key processes during early senescence. The leaf senescence process has important implications for the C/N balance of the leaf, and it is therefore not surprising that the greatest changes that differentiate the early and late senescing lines from one another were apparent in some of the sugars and amino acids. The levels of the monosaccharide sugars, Fru, Glu and Galactose increased under N0 in the late senescing line, which might explain the accelerated senescence seen at the N0 grown plants. In contrast, the disaccharide sugar, sucrose decreased in the in the late senescing line at low N. Photorespiration dramatically influences the interaction between photosynthetic C and N in leaves as a side-reaction of photosynthesis being infinitely associated with respiratory C metabolism and N assimilation [56]. The early senescing line displayed a pronounced increase in nitrate at N350, but when we compare this to the late senescing line, higher nitrate levels manifested at N0 and decreased at N350.
Photorespiration is likely to protect against photoinhibition in conditions where CO2 assimilation is limited, despite reducing the efficiency of photosynthesis [50,57]. The Gly/Ser ratio dramatically increases with the progression of senescence.

4. Discussion

Developmental leaf senescence occurs autonomously in an age-dependent manner [58,59]. However, stress responses can also trigger senescence during leaf development and plants coordinate their responses to minimise fitness costs by employing mechanisms that balances stress-response trade-offs to maintain growth and reproductive fitness [31,60,61]. It is a complex coordinated process which is accompanied by many changes that involve the remobilisation of nutrients from the senescing leaves to the active sink tissues; often, it is the seed that secures the next generation [17]. We evaluated the metabolic alterations during post anthesis developmental senescence in two contrasting genotypes, early senescent (ES) and late senescent (LS), and their response under differential N-supply. By doing so, we could gain information on (i) the metabolic alterations that take place during post anthesis developmental senescence, and (ii) the metabolic alterations that arise in response to low, moderate or high N levels. Further work to unravel the possible factors determining the development and speed of senescence onset, and the influence that various senescence programmes (under specific N-levels) have on determining grain yield and plant biomass production, should be undertaken.

4.1. Metabolite Alterations Following Anthesis

Post-anthesis senescence affects the entire plant, with the flag leaves and glumes which are closest to the developing grains usually senescing last [15]. A large fraction of the mobile nutrients from the senescing plant are aliquoted to the growing grain, making the processes concerning nutrient remobilisation during post-anthesis senescence and the mechanisms that control yield more important than sequential leaf senescence during vegetative plant growth [14,15,62]. Senescence is affected by many factors, and nitrogen availability has a well-studied effect on terminal senescence timing [63].
Developmentally-driven increases in the monosaccharide sugars fucose, lyxose, psicose, ribulose, xylose, arabinose, galactose, glucose and fructose were a characteristic of this study. Inversely, 1-kestose levels decreased with development. The levels of glucose and fructose, two important monosaccharides that are the degradation products of sucrose and starch peaked at 3 wpa. This increase at 3 wpa coincided with the sudden decrease in chlorophyll content in the leaves, exemplifying the well-known role of sugars in the onset of senescence. On the other hand, sucrose levels decreased only at the end of the growth period. Sucrose is a cytoplasmic product produced during photosynthesis in plant cells, and can be used as a transport sugar for entry into glycolysis and the TCA cycle, for the production of ATP and NADH, and carbon backbones for further anaplerotic biosynthesis. The strong decrease in the levels of sucrose at the end of the growth period reflected the decrease in photosynthesis rates and the high energy demands in other tissues. The degradation of chl and protein with the accumulation of free aa occur after the accumulation of carbohydrates as a consequence of the increased sugar levels which have been widely demonstrated [31,64]. In this study, a concomitant increase in the levels of the branched chain amino acids (BCAA), Leu, Val and Ile, was apparent. The strongest perturbations were evident in the aromatic amino acid Trp, while levels of Tyr and Phe also showed increases over the growth period accompanied by a concomitant decrease in the levels of their common precursor, shikimate (Figure 1). This indicated the need to fuel energy metabolism. C metabolism (i.e., sugar metabolism, glycolysis, TCA cycle and shikimate-phenylpropanoid metabolism) is responsible for the production of accessible energy, stress and resistance metabolites and carbon skeletons for activities during growth and development. Energy metabolism principally comprising glycolysis and the TCA cycle generates vast amounts of reducing equivalents, energy compounds and precursors for various plant physiological processes through oxidative decomposition of carbohydrates [64]. The lower levels of intermediates of the central carbon metabolism (glycolysis and TCA cycle) point to an increase in energy consumption and a shift in C to N metabolism [47]. The shikimate-phenylpropanoid pathway generates antioxidants such as flavonoids, phenols and lignins and their precursors, the aromatic amino acids (AAA), Trp, Phe, Tyr and shikimate protect the plant from serious injury by protecting cell membranes, membrane lipids, DNA and other cell components by scavenging or inhibiting the generation of reactive oxygen species [65,66]. Defence compounds are also synthesised as part of the phenylpropanoid pathway [66]. The higher levels of intermediates of the pentose phosphate pathway metabolism (erythritol, arabitol, mannitol) suggested that the respiration-related pentose phosphate pathway was enhanced. Sugar polyols function as osmoprotectants by increasing the hydration around macromolecules through their water-like hydroxyl groups [67]. Sugar polyols accumulate and may help to maintain cellular function during senescence. Glycine and serine are two important photorespiratory products that appear to be connected to each other by the tandem glycine decarboxylase complex (GDC) and provide the 1-C units that participate in nucleic acid metabolism, polyamine metabolism, betaine synthesis and glycine decarboxylase and serine hydroxymethyltransferase reaction which combines two Gly into one Ser, leading to the release of NH3, CO2 and NADH [68,69]. Here, the abundance of both Gly and Ser decreased with time; however, the ratio of Gly to Ser (Gly/Ser) increased as senescence progressed. Interestingly, the two pairs, Asn/Asp and Gln/Glu also increased as senescence progressed. When comparing the relative amount of the individual amino acids, the abundance of amino acids from the TCA cycle, Asp, decreased as senescence progressed, while Asn did not change significantly. Similarly, the levels of Glu decreased, while Gln did not portray significant changes. Together, this indicated that Glu is depleted more rapidly than Gln, and that Glu becomes a limiting metabolic factor during post anthesis senescence. The increases in the ratios of the aforementioned metabolites is compatible with the mobilisation and reallocation of nitrogen from the senescing leaves to the organs that are still active.

4.2. Metabolic Alterations in Response to Differential N-Supply

Nitrogen utilisation is an important physiological activity in plant growth and development. Amino acid metabolism is the main component of nitrogen metabolism. The total amino acid content decreased with decrease in N fertiliser level, reflecting the lower level of nitrogen assimilation at N0 (Figure 2). Nitrogen assimilation is highly coordinated with photosynthesis. The decrease in amino acid content followed the synergistic reduction in chlorophyll levels during leaf senescence. Nitrogen containing amino acids, Asn and Arg, accumulated to high levels when N was readably available and the photosynthetic apparatus still intact. The levels of Glu and Asp, which are precursors for many other amino acids, did not portray large N dependent alterations. Nitrogen (N) is a major component of the photosynthetic apparatus and is widely used as fertiliser to crops; however, the dynamic of photosynthesis establishment due to differential N supply is highly complex. Apart from the strong differential regulation of the levels of Asn and Asp, Trp showed a very strong decrease in plants grown on low N. It was not unexpected that the levels of the AAA precursor metabolite, shikimate, remained high under low N, photorespiration, senescence and N limitation. In the metabolic step required for carbon dioxide production, two molecules of Gly (equal to two molecules of O2) is converted to one molecule of Ser and one molecule of CO2 [70]. Plants can use Gln as nitrogen source at concentrations much lower than those of ammonium nitrate, but so could Ala and Gly [71]. Gly and Ser decreased with senescence and the decrease was stronger in low N fertilised plants. The Gly to Ser ratio also decreased. Gly and Ser are involved in photorespiration. Their precursor, glycerate, on the other hand, increased, and stronger increases were seen in low N treated plant leaves. Photosynthate availability does not limit grain yield. Moderate N and high C (high C/N balance) promote leaf senescence. Reduced N is exported in the form of Gln, Asp, Thr and Ser from senescing leaves [15]. From Gln and Glu, nitrogen can be transferred to other amino acids through the activity of asparagine synthase and other amino transaminases and these enzymes are upregulated during senescence [72]. In barley, asparagine synthase was more than 2.4 times upregulated in flag leaves at 21 dpa in early vs. late senescing lines [73]. Amino acids, small peptides, ammonium, urea and nitrate are the major forms remobilised from senescing leaves to restore nitrogen. Free amino acids and small peptides are the major forms, and therefore associated with nitrogen metabolism with carbohydrate metabolism [46]. During senescence, protein and amino acid degradation is especially high to allocate nutrients from the source leaves to the developing seeds. Similarly, under nitrogen limiting conditions where amino acids are scarce, proteins, which are the constitutive reservoirs of amino acids are degraded to mobilise amino acids via proteasome mediated degradation and autophagy [20,74].
This work also presents an in-depth analysis of the response of other nutrient ions with respect to the overall response under different N fertiliser levels during grain filling. Nutrient ions such as S, K, Mg, and Ca increased with increased N input and contributed to increased straw yield, while the accumulation of P was apparent under low N input and portrayed a strong negative correlation to straw yield, which may be the result of continued P uptake in plants with reduced growth.

4.3. N-Supply and the Responsiveness of the Genotype Determined the Degree of Senescence

4.3.1. Sugars and Amino Acids Distinguish the Timing of Senescence

Metabolic information derived from genotypes with contrasting senescence phenotypes were extracted to determine how senescence processes influence remobilisation to contribute to yield (Figure 5). While the leaf metabolome is largely affected by the nutritional status of the plant, the seed metabolome is mainly developmentally regulated following anthesis, which has implications for improvement of grain filling under reduced fertiliser inputs [75]. Hence, optimising the timing of remobilisation to match with the temporal developmental programme during grain filling offers opportunities to optimise yield under low fertiliser inputs. The strong increases in levels of sugars (glucose, fructose, galactose and mannose) coincided with a delayed senescence in N deprived plants, which suggests that a delay in senescence makes the plant more vulnerable to N-starvation. In addition, delayed senescence exceeding three weeks may decrease wheat grain protein, zinc and iron content by as much as 30% [76]. Contrary to the response of the aforementioned sugars, 1-kestose increased strongly in the early senescing plants under limiting N. Longer and/or more complex fructans can be synthesised via the conversion of sucrose into glucose and 1-kestose (shortest fructan). Fructans are utilised to fuel rapid regrowth, they play a role in membrane stabilisation, and thereby, protect plants against cold and drought stress; they also regulate osmosis during flower opening [77]. This increase in the levels of 1-kestose under limiting N coincided with increased straw yield in the early senescing line in plants grown at N0 and N100 (Figure 4). Furthermore, the correlation of 1-kestose with grain and straw yield was distinctly different between the early and late senescing lines (Figure 4), i.e., a negative correlation of 1-kestose to yield for the early senescing lines compared to a positive correlation of 1-kestose with straw yield in the late senescing line. It is well known that the supply of carbohydrates from the source (leaf) to sink (grain) tissues of a plant determines grain yield in wheat [78]. Why elevated levels of 1-kestose translate into an increased straw yield under limiting N during early senescence has to be determined. Additionally, a differential abundance of amino acid contents at 3 wpa, rather than a time-shift in the response distinguished the early and late senescing lines from another under conditions where N was sufficient. These increases may be explained by an efficient and increased mobilisation occurring with early senescence under high N conditions. The %N in the grain and straw increased significantly in early senescing plants grown on high N, compared to the late senescing line, which can be ascribed to an increased and efficient remobilisation during early senescence, but only when N is sufficient.
The notable increase in the levels of Arg, Trp, Lys, His, Ile, Leu, Tyr, Cis-aconitate and 1-kestose (Figure 3) in the early senescing line (AxC181) can be supported by findings made during previous studies. Previous reports highlight a dramatic increase in aromatic amino acids and branched chain amino acids during dark-induced senescence [21,79,80] and nitrate limitation [81]. It was also reported that genes involved in aromatic amino acid biosynthetic processes and transport, are up-regulated at early stages of leaf senescence [82]. It has been suggested that the accumulation of branched chain amino acids provides an alternative source of energy to support alternative respiration during dark-induced senescence [21,47] and that the accumulation of aromatic amino acids forms important precursors for the synthesis of secondary metabolites such as flavonoids, which have a protective function in cells during senescence [83,84].
Alternatively, the developmentally-accompanied biphasic response of the aromatic amino acids and branched chain amino acids (Figure 1) could be explained by increased synthesis rates up to 3 wpa followed by either accelerated export or catabolism at the weeks following. Thus, in conclusion, the recycling of metabolites during natural or nutrient depletion induced senescence (NuDIS) combines degradation products from different sources, and in particular, for nitrogen depletion-induced senescence (NDIS), those metabolites centred on the metabolism of amino acids, most apparently for recycling N to the growing sink, which in this case would be the expanding grain.

4.3.2. The Influence of Senescence and N-Supply on Crop Yield and Plant Biomass Production

Grain yield depends on senescence [15]. During leaf senescence, macromolecules such as proteins and nucleic acids are degraded, resulting in decreased photosynthesis, crop yield and biomass production [58]. While the leaf metabolome is largely affected by the nutritional status of the plant, the seed metabolome is mainly developmentally regulated following anthesis, which has implications for improvement of grain filling under reduced fertiliser inputs [75]. Proteins and nucleic acids have to be hydrolysed and converted, while reduced nitrogen from senescing leaves is remobilised and exported. Hence, by optimising the timing of remobilisation to match with the temporal developmental programme during grain filling offers opportunities to optimise yield under low fertiliser inputs. Low levels of N induce early senescence (NDIS) as a result of sink demand, whereas high levels of N can delay senescence, as sink demand may be satisfied from stored nitrogen, permitting extended photosynthesis [24]. Stay-green mutants have increased grain yield for this reason; however, delayed senescence can also influence sink capacity and limit yield [85]. This multi-level study provided important new insights into the re-adjustment of metabolic pathways towards N level during grain filling which allows the formulation of hypotheses and assists the integration of metabolism with growth during nutrient shortage respectively correlates metabolic signatures with crop yield and developmental traits. Straw and grain yield increased in ES, while %N in the grain and straw was compromised. The increase in grain and straw yield was bigger in plants grown under low N and moderate N. The majority of the amino acids, and especially Asn and Gln, but also cis-aconitate correlated strongly to %N in the grain and the straw, and, to a lesser extent, to yield. Galactinol correlated strongly to both. Interestingly, malate correlated strongly to yield in the ES line, while galactitol and other sugar polyols and monosaccharides showed a strong negative correlation to yield. Also, in the LS line, the majority of the amino acids, but also malate, fumarate and cis-aconitate correlated strongly to yield. Again, many sugars had a strong negative correlation to yield. It appears that the ES line has enough time to export all N and still have seed growth before final harvest. Additionally, increased levels of osmoprotectants such as monosaccharide sugars and sugar polyols sustain the plant by protecting active parts of the plant [86]. Low malate levels and already depleted levels of Asn, Arg, Gln and His in the leaf at N0 in the ES line indicate that these amino acids were already exported to the growing grain, while in the LS lines the levels of these amino acids are maintained at high levels. Furthermore, the sugars in the ES lines increased up to 3 wpa in the LS lines. In contrast, the levels of monosaccharide sugars glucose, fructose, mannose, galactose, xylose, arabinose all increased from 2 wpa until the final harvest. Interestingly, the BCAA Leu and Ile, although initially having lower levels in the ES line, reached similar levels to LS line by the end of the growing season.

5. Conclusions

In this study, lines from the Avalon/Cadenza doubled-haploid mapping population contrasting in traits relating to early and delayed onset of senescence were field grown (i) to compile a parallel analysis of relative metabolite abundances and an evaluation of agronomic traits, including grain yield, (ii) to assess the influence of various N application rates over the developmental programme following anthesis until final harvest, and (iii) to identify metabolites that are indicative of, or which demonstrate the relevance of, the precise timing of the onset of senescence. In summary, the results substantially extend the understanding of nitrogen metabolism during grain filling in wheat leaves: (i) the induction in sugar levels are closely timed with the onset of Chl degradation, (ii) the response of amino acids correlate strongly to nitrate levels, Chl contents and yield, and (iii) metabolites such as Trp and cis-aconitate, phosphate and 1-kestose demonstrated strong perturbations and proved to be reliable as marker metabolites which are indicative of the plant status in terms of nitrogen availability and progression towards developmental senescence. When early and late senescing lines were compared, the results indicated that higher rates of photosynthesis, photorespiration and respiration were utilised in the late senescing line to generate the energy and carbon skeletons needed for biosynthesis of nitrogen-containing metabolites were available in senescing line
Photosynthate availability does not limit grain yield. Moderate N and high C (high C/N balance) promote leaf senescence. Reduced N is exported in the form of Gln, Asp, Thr and Ser from senescing leaves. From Gln and Glu, nitrogen can be transferred to other amino acids through the activity of asparagine synthase and other amino transaminases and these enzymes are upregulated during senescence. In barley, asparagine synthase was more than 2.4 times upregulated in flag leaves at 21 dpa in early vs. late senescing lines [73].

Supplementary Materials

The following are available online at https://www.mdpi.com/2073-4395/9/6/305/s1, Supplemental Data Set S1: Averages, correlation coefficients and statistical analyses of metabolites: Early senescing line (AxC181) and the late senescing line (AxC112); Figure S1A: PCA score plot of primary metabolite profiles differentiating timing of senescence; Figure S1B: PCA loadings plot of all measured primary metabolite profiles for DH lines line 112 and line 181.

Author Contributions

R.H. and M.J.H.: designed the research; E.H., P.B., M.W. and A.E.: performed the research; E.H., P.B., M.W., G.D., A.E., J.K. and D.W.: analysed the data; E.H.: wrote the paper.

Funding

This research was funded by [the Marie Skłodowska Curie research program] grant number [PITN-GA-2010-264296].

Acknowledgments

This work was supported by the Marie Skłodowska Curie research program (Grant Agreement Number PITN-GA-2010-264296). EH received the Marie Curie BioNUT fellowship for completing this work as part of her doctorate. Financial support for this project from the Max Planck Society is gratefully acknowledged. Rothamsted Research receives support from the Biotechnology and Biological Sciences Research Council (BBSRC) of the UK as part of the 20:20 Wheat® project and Designing Future Wheat projects (BB/P016855/1), and by the Defra sponsored Wheat Genetic Improvement Network project. The population of doubled-haploid (DH) individuals, derived from F1 progeny of a cross between cvs Avalon and Cadenza, was developed by Clare Ellerbrook, Liz Sayers and the late Tony Worland (John Innes Centre), as part of a Defra funded project led by ADAS. The parents were originally chosen (to contrast for canopy architecture traits) by Steve Parker (CSL), Tony Worland and Darren Lovell (Rothamsted Research). MJH and RH are members of the Expert Working Group on Nutrient Use Efficiency of the International Wheat Initiative and are greatful to the discussions with colleagues within the Wheat Initiative network.

Conflicts of Interest

The authors declare no conflict of interest.

References

  1. Hawkesford, M.J. Reducing the reliance on nitrogen fertilizer for wheat production. J. Cereal Sci. 2014, 59, 276–283. [Google Scholar] [CrossRef] [PubMed]
  2. Makino, A. Photosynthesis, grain yield, and nitrogen utilization in rice and wheat. Plant Physiol. 2011, 155, 125–129. [Google Scholar] [CrossRef] [PubMed]
  3. Gaju, O.; DeSilva, J.; Carvalho, P.; Hawkesford, M.J.; Griffiths, S.; Greenland, A.; Foulkes, M.J. Leaf photosynthesis and associations with grain yield, biomass and nitrogen-use efficiency in landraces, synthetic-derived lines and cultivars in wheat. Field Crop. Res. 2016, 193, 1–15. [Google Scholar] [CrossRef]
  4. Richards, R.A. Selectable traits to increase crop photosynthesis and yield of grain crops. J. Exp. Bot. 2000, 51, 447–458. [Google Scholar] [CrossRef] [PubMed]
  5. Xie, Q.; Mayes, S.; Sparkes, D.L. Carpel size, grain filling, and morphology determine individual grain weight in wheat. J. Exp. Bot. 2015, 66, 6715–6730. [Google Scholar] [CrossRef] [PubMed] [Green Version]
  6. Lobell, D.B.; Sibley, A.; Ivan Ortiz-Monasterio, J. Extreme heat effects on wheat senescence in india. Nat. Clim. Chang. 2012, 2, 186–189. [Google Scholar] [CrossRef]
  7. Uauy, C.; Distelfeld, A.; Fahima, T.; Blechl, A.; Dubcovsky, J. A nac gene regulating senescence improves grain protein, zinc, and iron content in wheat. Science 2006, 314, 1298–1301. [Google Scholar] [CrossRef]
  8. Masclaux-Daubresse, C.; Daniel-Vedele, F.; Dechorgnat, J.; Chardon, F.; Gaufichon, L.; Suzuki, A. Nitrogen uptake, assimilation and remobilization in plants: Challenges for sustainable and productive agriculture. Ann. Bot. 2010, 105, 1141–1157. [Google Scholar] [CrossRef]
  9. Maillard, A.; Diquélou, S.; Billard, V.; Laîné, P.; Garnica, M.; Prudent, M.; Garcia-Mina, J.-M.; Yvin, J.-C.; Ourry, A. Leaf mineral nutrient remobilization during leaf senescence and modulation by nutrient deficiency. Front. Plant Sci. 2015, 6, 317. [Google Scholar] [CrossRef] [Green Version]
  10. Balazadeh, S.; Schildhauer, J.; Araújo, W.L.; Munné-Bosch, S.; Fernie, A.R.; Proost, S.; Humbeck, K.; Mueller-Roeber, B. Reversal of senescence by n resupply to n-starved arabidopsis thaliana: Transcriptomic and metabolomic consequences. J. Exp. Bot. 2014, 65, 3975–3992. [Google Scholar] [CrossRef]
  11. Wuest, S.E.; Philipp, M.A.; Guthörl, D.; Schmid, B.; Grossniklaus, U. Seed production affects maternal growth and senescence in arabidopsis. Plant Physiol. 2016, 171, 392–404. [Google Scholar] [CrossRef]
  12. Borrill, P.; Fahy, B.; Smith, A.M.; Uauy, C. Wheat grain filling is limited by grain filling capacity rather than the duration of flag leaf photosynthesis: A case study using nam rnai plants. PLoS ONE 2015, 10, e0134947. [Google Scholar] [CrossRef] [PubMed]
  13. Schippers, J.H.M.; Schmidt, R.; Wagstaff, C.; Jing, H.-C. Living to die and dying to live: The survival strategy behind leaf senescence. Plant Physiol. 2015, 169, 914–930. [Google Scholar] [CrossRef] [PubMed]
  14. Bieker, S.; Zentgraf, U. Plant Senescence and Nitrogen Mobilization and Signaling; IntechOpen: London, UK, 2013. [Google Scholar]
  15. Distelfeld, A.; Avni, R.; Fischer, A.M. Senescence, nutrient remobilization, and yield in wheat and barley. J. Exp. Bot. 2014, 65, 3783–3798. [Google Scholar] [CrossRef] [PubMed] [Green Version]
  16. Jagadish, K.S.V.; Kavi Kishor, P.B.; Bahuguna, R.N.; von Wirén, N.; Sreenivasulu, N. Staying alive or going to die during terminal senescence-an enigma surrounding yield stability. Front. Plant Sci. 2015, 6, 1070. [Google Scholar] [CrossRef]
  17. Wu, X.-Y.; Kuai, B.-K.; Jia, J.-Z.; Jing, H.-C. Regulation of leaf senescence and crop genetic improvementf. J. Integr. Plant Biol. 2012, 54, 936–952. [Google Scholar] [CrossRef]
  18. Gregersen, P.L.; Holm, P.B.; Krupinska, K. Leaf senescence and nutrient remobilisation in barley and wheat. Plant Biol. 2008, 10, 37–49. [Google Scholar] [CrossRef]
  19. Araújo, W.L.; Ishizaki, K.; Nunes-Nesi, A.; Tohge, T.; Larson, T.R.; Krahnert, I.; Balbo, I.; Witt, S.; Dörmann, P.; Graham, I.A.; et al. Analysis of a range of catabolic mutants provides evidence that phytanoyl-coenzyme a does not act as a substrate of the electron-transfer flavoprotein/electron-transfer flavoprotein:Ubiquinone oxidoreductase complex in arabidopsis during dark-induced senescence. Plant Physiol. 2011, 157, 55–69. [Google Scholar]
  20. Yoshimoto, K.; Avila-Ospina, L.; Moison, M.; Masclaux-Daubresse, C. Autophagy, plant senescence, and nutrient recycling. J. Exp. Bot. 2014, 65, 3799–3811. [Google Scholar] [Green Version]
  21. Araújo, W.L.; Ishizaki, K.; Nunes-Nesi, A.; Larson, T.R.; Tohge, T.; Krahnert, I.; Witt, S.; Obata, T.; Schauer, N.; Graham, I.A.; et al. Identification of the 2-hydroxyglutarate and isovaleryl-coa dehydrogenases as alternative electron donors linking lysine catabolism to the electron transport chain of arabidopsis mitochondria. Plant Cell 2010, 22, 1549–1563. [Google Scholar] [CrossRef]
  22. Crafts-Brandner, S.J.; Hölzer, R.; Feller, U. Influence of nitrogen deficiency on senescence and the amounts of rna and proteins in wheat leaves. Physiol. Plantarum 1998, 102, 192–200. [Google Scholar] [CrossRef]
  23. Crafts-Brandner, S.J.; Klein, R.R.; Klein, P.; Hölzer, R.; Feller, U. Coordination of protein and mrna abundances of stromal enzymes and mrna abundances of the clp protease subunits during senescence of phaseolus vulgaris (l.) leaves. Planta 1996, 200, 312–318. [Google Scholar] [CrossRef] [PubMed]
  24. Soltabayeva, A.; Srivastava, S.; Kurmanbayeva, A.; Bekturova, A.; Fluhr, R.; Sagi, M. Early senescence in older leaves of low nitrate-grown ATXDH1 uncovers a role for purine catabolism in n supply. Plant Physiol. 2018, 178, 1027–1044. [Google Scholar] [CrossRef] [PubMed]
  25. Werner, A.K.; Medina-Escobar, N.; Zulawski, M.; Sparkes, I.A.; Cao, F.-Q.; Witte, C.-P. The ureide-degrading reactions of purine ring catabolism employ three amidohydrolases and one aminohydrolase in arabidopsis, soybean, and rice. Plant Physiol. 2013, 163, 672–681. [Google Scholar] [CrossRef] [PubMed]
  26. Huang, X.; Han, B. Natural variations and genome-wide association studies in crop plants. Ann. Rev. Plant Biol. 2014, 65, 531–551. [Google Scholar] [CrossRef] [PubMed]
  27. Ma, J.; Wingen, L.; Orford, S.; Fenwick, P.; Wang, J.; Griffiths, S. Using the uk reference population avalon × cadenza as a platform to compare breeding strategies in elite western european bread wheat. Mol. Breed. 2015, 35, 1–18. [Google Scholar] [CrossRef] [PubMed]
  28. Zhao, D.; Derkx, A.P.; Liu, D.C.; Buchner, P.; Hawkesford, M.J. Overexpression of a nac transcription factor delays leaf senescence and increases grain nitrogen concentration in wheat. Plant Biol. 2015, 17, 904–913. [Google Scholar] [CrossRef]
  29. Arnon, D.I. Copper enzymes in isolated chloroplasts. Polyphenoloxidase in beta vulgaris. Plant Physiol. 1949, 24, 1–15. [Google Scholar] [CrossRef] [PubMed]
  30. Erban, A.; Schauer, N.; Fernie, A.; Kopka, J. Nonsupervised construction and application of mass spectral and retention time index libraries from time-of-flight gas chromatography-mass spectrometry metabolite profiles. In Metabolomics; Weckwerth, W., Ed.; Humana Press: New York, NY, USA, 2007; Volume 358, pp. 19–38. [Google Scholar]
  31. Watanabe, M.; Balazadeh, S.; Tohge, T.; Erban, A.; Giavalisco, P.; Kopka, J.; Mueller-Roeber, B.; Fernie, A.R.; Hoefgen, R. Comprehensive dissection of spatiotemporal metabolic shifts in primary, secondary, and lipid metabolism during developmental senescence in arabidopsis. Plant Physiol. 2013, 162, 1290–1310. [Google Scholar] [CrossRef]
  32. Lisec, J.; Schauer, N.; Kopka, J.; Willmitzer, L.; Fernie, A.R. Gas chromatography mass spectrometry-based metabolite profiling in plants. Nat. Protocols 2006, 1, 387–396. [Google Scholar] [CrossRef]
  33. Luedemann, A.; Strassburg, K.; Erban, A.; Kopka, J. Tagfinder for the quantitative analysis of gas chromatography—mass spectrometry (gc-ms)-based metabolite profiling experiments. Bioinformatics 2008, 24, 732–737. [Google Scholar] [CrossRef] [PubMed]
  34. Kopka, J.; Schauer, N.; Krueger, S.; Birkemeyer, C.; Usadel, B.; Bergmüller, E.; Dörmann, P.; Weckwerth, W.; Gibon, Y.; Stitt, M.; et al. [email protected]: The golm metabolome database. Bioinformatics 2005, 21, 1635–1638. [Google Scholar] [CrossRef] [PubMed]
  35. Stacklies, W.; Redestig, H.; Scholz, M.; Walther, D.; Selbig, J. Pcamethods—a bioconductor package providing pca methods for incomplete data. Bioinformatics 2007, 23, 1164–1167. [Google Scholar] [CrossRef] [PubMed]
  36. Foyer, C.H.; Parry, M.; Noctor, G. Markers and signals associated with nitrogen assimilation in higher plants. J. Exp. Bot. 2003, 54, 585–593. [Google Scholar] [CrossRef] [PubMed]
  37. Lawlor, D.W. Carbon and nitrogen assimilation in relation to yield: Mechanisms are the key to understanding production systems. J. Exp. Bot. 2002, 53, 773–787. [Google Scholar] [CrossRef] [PubMed]
  38. Rivero, R.M.; Kojima, M.; Gepstein, A.; Sakakibara, H.; Mittler, R.; Gepstein, S.; Blumwald, E. Delayed leaf senescence induces extreme drought tolerance in a flowering plant. Proc. Nat. Acad. Sci. USA 2007, 104, 19631–19636. [Google Scholar] [CrossRef] [PubMed] [Green Version]
  39. Sehgal, A.; Sita, K.; Siddique, K.H.M.; Kumar, R.; Bhogireddy, S.; Varshney, R.K.; HanumanthaRao, B.; Nair, R.M.; Prasad, P.V.V.; Nayyar, H. Drought or/and heat-stress effects on seed filling in food crops: Impacts on functional biochemistry, seed yields, and nutritional quality. Front. Plant Sci. 2018, 9. [Google Scholar] [CrossRef] [PubMed]
  40. Lin, W.; Guo, X.; Pan, X.; Li, Z. Chlorophyll composition, chlorophyll fluorescence, and grain yield change in esl mutant rice. Int. J. Mol. Sci. 2018, 19, 2945. [Google Scholar] [CrossRef] [PubMed]
  41. Wang, Y.; Lu, J.; Ren, T.; Hussain, S.; Guo, C.; Wang, S.; Cong, R.; Li, X. Effects of nitrogen and tiller type on grain yield and physiological responses in rice. AoB PLANTS 2017, 9, plx012. [Google Scholar] [CrossRef] [PubMed]
  42. Tischner, R. Nitrate uptake and reduction in higher and lower plants. Plant Cell Envir. 2000, 23, 1005–1024. [Google Scholar] [CrossRef]
  43. Li, W.; Zhang, H.; Li, X.; Zhang, F.; Liu, C.; Du, Y.; Gao, X.; Zhang, Z.; Zhang, X.; Hou, Z.; et al. Intergrative metabolomic and transcriptomic analyses unveil nutrient remobilization events in leaf senescence of tobacco. Sci. Rep. 2017, 7, 12126. [Google Scholar] [CrossRef] [PubMed] [Green Version]
  44. Bernard, S.M.; Habash, D.Z. The importance of cytosolic glutamine synthetase in nitrogen assimilation and recycling. New Phytol. 2009, 182, 608–620. [Google Scholar] [CrossRef] [PubMed]
  45. Kamachi, K.; Yamaya, T.; Mae, T.; Ojima, K. A role for glutamine synthetase in the remobilization of leaf nitrogen during natural senescence in rice leaves. Plant Physiol. 1991, 96, 411–417. [Google Scholar] [CrossRef] [PubMed]
  46. Diaz-Mendoza, M.; Velasco-Arroyo, B.; Santamaria, M.E.; González-Melendi, P.; Martinez, M.; Diaz, I. Plant senescence and proteolysis: Two processes with one destiny. Genet. Mol. Biol. 2016, 39, 329–338. [Google Scholar] [CrossRef]
  47. Araújo, W.L.; Tohge, T.; Ishizaki, K.; Leaver, C.J.; Fernie, A.R. Protein degradation—An alternative respiratory substrate for stressed plants. Trends Plant Sci. 2011, 16, 489–498. [Google Scholar] [CrossRef] [PubMed]
  48. Hildebrandt, T.M.; Nunes Nesi, A.; Araújo, W.L.; Braun, H.-P. Amino acid catabolism in plants. Mol. Plant 2015, 8, 1563–1579. [Google Scholar] [CrossRef]
  49. Pires, M.V.; Pereira Júnior, A.A.; Medeiros, D.B.; Daloso, D.M.; Pham, P.A.; Barros, K.A.; Engqvist, M.K.M.; Florian, A.; Krahnert, I.; Maurino, V.G.; et al. The influence of alternative pathways of respiration that utilize branched-chain amino acids following water shortage in arabidopsis. Plant Cell Environ. 2016, 39, 1304–1319. [Google Scholar] [CrossRef] [PubMed]
  50. Peterhansel, C.; Horst, I.; Niessen, M.; Blume, C.; Kebeish, R.; Kürkcüoglu, S.; Kreuzaler, F. Photorespiration. Arabidopsis Book 2010, 8, e0130. [Google Scholar] [CrossRef] [PubMed]
  51. Hanaoka, H.; Noda, T.; Shirano, Y.; Kato, T.; Hayashi, H.; Shibata, D.; Tabata, S.; Ohsumi, Y. Leaf senescence and starvation-induced chlorosis are accelerated by the disruption of an arabidopsis autophagy gene. Plant Physiol. 2002, 129, 1181–1193. [Google Scholar] [CrossRef]
  52. Wingler, A.; Masclaux-Daubresse, C.; Fischer, A.M. Sugars, senescence, and ageing in plants and heterotrophic organisms. J. Exp. Bot. 2009, 60, 1063–1066. [Google Scholar] [CrossRef] [Green Version]
  53. Quirino, B.F.; Noh, Y.-S.; Himelblau, E.; Amasino, R.M. Molecular aspects of leaf senescence. Trends Plant Sci. 2000, 5, 278–282. [Google Scholar] [CrossRef]
  54. Rolland, F.; Baena-Gonzalez, E.; Sheen, J. Sugar sensing and signaling in plants: Conserved and novel mechanisms. Ann. Rev. Plant Biol. 2006, 57, 675–709. [Google Scholar] [CrossRef] [PubMed]
  55. Koch, K. Sucrose metabolism: Regulatory mechanisms and pivotal roles in sugar sensing and plant development. Curr. Opin. Plant Biol. 2004, 7, 235–246. [Google Scholar] [CrossRef] [PubMed]
  56. Maire, V.; Martre, P.; Kattge, J.; Gastal, F.; Esser, G.; Fontaine, S.; Soussana, J.-F. The coordination of leaf photosynthesis links c and n fluxes in c3 plant species. PLoS ONE 2012, 7, e38345. [Google Scholar] [CrossRef] [PubMed]
  57. Takahashi, S.; Bauwe, H.; Badger, M. Impairment of the photorespiratory pathway accelerates photoinhibition of photosystem ii by suppression of repair but not acceleration of damage processes in arabidopsis. Plant Physiol. 2007, 144, 487–494. [Google Scholar] [CrossRef] [PubMed]
  58. Guiboileau, A.; Sormani, R.; Meyer, C.; Masclaux-Daubresse, C. Senescence and death of plant organs: Nutrient recycling and developmental regulation. CR Biol. 2010, 333, 382–391. [Google Scholar] [CrossRef] [PubMed]
  59. Woo, H.R.; Kim, H.J.; Nam, H.G.; Lim, P.O. Plant leaf senescence and death – regulation by multiple layers of control and implications for aging in general. J. Cell Sci. 2013, 126, 4823–4833. [Google Scholar] [CrossRef] [PubMed]
  60. Watanabe, M.; Hubberten, H.M.; Saito, K.; Hoefgen, R. General regulatory patterns of plant mineral nutrient depletion as revealed by serat quadruple mutants disturbed in cysteine synthesis. Mol. Plant 2010, 3, 438–466. [Google Scholar] [CrossRef]
  61. Whitcomb, S.J.; Heyneke, E.; Aarabi, F.; Watanabe, M.; Hoefgen, R. Mineral nutrient depletion affects plant development and crop yield. In Nutrient Use Efficiency in Plants: Concepts and Approaches; Hawkesford, M.J., Kopriva, S., De Kok, L.J., Eds.; Springer International Publishing: Cham, Switzerland, 2014; pp. 205–228. [Google Scholar]
  62. Gregersen, P.; Culetic, A.; Boschian, L.; Krupinska, K. Plant senescence and crop productivity. Plant Mol. Biol. 2013, 82, 603–622. [Google Scholar] [CrossRef]
  63. Martre, P.; Dambreville, A. A model of leaf coordination to scale-up leaf expansion from the organ to the canopy. Plant Physiol. 2018, 176, 704–716. [Google Scholar] [CrossRef]
  64. Galili, G.; Avin-Wittenberg, T.; Angelovici, R.; Fernie, A.R. The role of photosynthesis and amino acid metabolism in the energy status during seed development. Front. Plant Sci. 2014, 5, 447. [Google Scholar] [CrossRef] [PubMed]
  65. Mouradov, A.; Spangenberg, G. Flavonoids: A metabolic network mediating plants adaptation to their real estate. Front. Plant Sci. 2014, 5, 620. [Google Scholar] [CrossRef] [PubMed]
  66. Vogt, T. Phenylpropanoid biosynthesis. Mol. Plant 2010, 3, 2–20. [Google Scholar] [CrossRef] [PubMed]
  67. Slama, I.; Abdelly, C.; Bouchereau, A.; Flowers, T.; Savouré, A. Diversity, distribution and roles of osmoprotective compounds accumulated in halophytes under abiotic stress. Ann. Bot. 2015, 115, 433–447. [Google Scholar] [CrossRef] [PubMed] [Green Version]
  68. Timm, S.; Florian, A.; Wittmiß, M.; Jahnke, K.; Hagemann, M.; Fernie, A.R.; Bauwe, H. Serine acts as a metabolic signal for the transcriptional control of photorespiration-related genes in arabidopsis. Plant Physiol. 2013, 162, 379–389. [Google Scholar] [CrossRef] [PubMed]
  69. Eisenhut, M.; Bräutigam, A.; Timm, S.; Florian, A.; Tohge, T.; Fernie, A.R.; Bauwe, H.; Weber, A.P.M. Photorespiration is crucial for dynamic response of photosynthetic metabolism and stomatal movement to altered Co2 availability. Mol. Plant 2017, 10, 47–61. [Google Scholar] [CrossRef]
  70. Abadie, C.; Boex-Fontvieille, E.R.A.; Carroll, A.J.; Tcherkez, G. In vivo stoichiometry of photorespiratory metabolism. Nature Plants 2016, 2, 15220. [Google Scholar] [CrossRef]
  71. Kan, C.-C.; Chung, T.-Y.; Juo, Y.-A.; Hsieh, M.-H. Glutamine rapidly induces the expression of key transcription factor genes involved in nitrogen and stress responses in rice roots. BMC Genomics 2015, 16, 1–15. [Google Scholar] [CrossRef] [Green Version]
  72. Masclaux-Daubresse, C.; Reisdorf-Cren, M.; Orsel, M. Leaf nitrogen remobilisation for plant development and grain filling. Plant Biol. 2008, 10, 23–36. [Google Scholar] [CrossRef]
  73. Jukanti, A.K.; Heidlebaugh, N.M.; Parrott, D.L.; Fischer, I.A.; McInnerney, K.; Fischer, A.M. Comparative transcriptome profiling of near-isogenic barley (hordeum vulgare) lines differing in the allelic state of a major grain protein content locus identifies genes with possible roles in leaf senescence and nitrogen reallocation. New Phytol. 2008, 177, 333–349. [Google Scholar] [CrossRef]
  74. Avin-Wittenberg, T.; Bajdzienko, K.; Wittenberg, G.; Alseekh, S.; Tohge, T.; Bock, R.; Giavalisco, P.; Fernie, A.R. Global analysis of the role of autophagy in cellular metabolism and energy homeostasis in arabidopsis seedlings under carbon starvation. Plant Cell 2015, 27, 306–322. [Google Scholar] [CrossRef] [PubMed]
  75. Howarth, J.R.; Parmar, S.; Jones, J.; Shepherd, C.E.; Corol, D.-I.; Galster, A.M.; Hawkins, N.D.; Miller, S.J.; Baker, J.M.; Verrier, P.J.; et al. Co-ordinated expression of amino acid metabolism in response to n and s deficiency during wheat grain filling. J. Exp. Bot. 2008, 59, 3675–3689. [Google Scholar] [CrossRef] [PubMed]
  76. Uauy, C.; Brevis, J.C.; Dubcovsky, J. The high grain protein content gene gpc-b1 accelerates senescence and has pleiotropic effects on protein content in wheat. J. Exp. Bot. 2006, 57, 2785–2794. [Google Scholar] [CrossRef] [PubMed]
  77. Ritsema, T.; Smeekens, S. Fructans: Beneficial for plants and humans. Curr. Opin. Plant Biol. 2003, 6, 223–230. [Google Scholar] [CrossRef]
  78. Li, H.; Cai, J.; Jiang, D.; Liu, F.; Dai, T.; Cao, W. Carbohydrates accumulation and remobilization in wheat plants as influenced by combined waterlogging and shading stress during grain filling. J. Agron. Crop Sci. 2013, 199, 38–48. [Google Scholar] [CrossRef]
  79. Fahnenstich, H.; Saigo, M.; Niessen, M.; Zanor, M.I.; Andreo, C.S.; Fernie, A.R.; Drincovich, M.F.; Flügge, U.-I.; Maurino, V.G. Alteration of organic acid metabolism in arabidopsis overexpressing the maize c4 nadp-malic enzyme causes accelerated senescence during extended darkness. Plant Physiol. 2007, 145, 640–652. [Google Scholar] [CrossRef] [PubMed]
  80. Gibon, Y.; Usadel, B.; Blaesing, O.; Kamlage, B.; Hoehne, M.; Trethewey, R.; Stitt, M. Integration of metabolite with transcript and enzyme activity profiling during diurnal cycles in arabidopsis rosettes. Genome Biol. 2006, 7, R76. [Google Scholar] [CrossRef] [PubMed]
  81. Diaz, C.; Purdy, S.; Christ, A.; Morot-Gaudry, J.-F.; Wingler, A.; Masclaux-Daubresse, C. Characterization of markers to determine the extent and variability of leaf senescence in arabidopsis. A metabolic profiling approach. Plant Physiol. 2005, 138, 898–908. [Google Scholar] [CrossRef] [PubMed]
  82. Zhang, W.Y.; Xu, Y.C.; Li, W.L.; Yang, L.; Yue, X.; Zhang, X.S.; Zhao, X.Y. Transcriptional analyses of natural leaf senescence in maize. PLoS ONE 2014, 9, e115617. [Google Scholar] [CrossRef]
  83. Tzin, V.; Galili, G. The biosynthetic pathways for shikimate and aromatic amino acids in arabidopsis thaliana. Arabidopsis Book 2010, e0132. [Google Scholar] [CrossRef]
  84. Wittstock, U.; Halkier, B.A. Glucosinolate research in the arabidopsis era. Trends Plant Sci. 2002, 7, 263–270. [Google Scholar] [CrossRef]
  85. Perrotta, C.; Platani, C.; Lawlor, D.W.; Ronga, G.; Spano, G.; Napier, J.A.; Di Fonzo, N.; Shewry, P.R. Physiological characterization of ‘stay green’ mutants in durum wheat. J. Exp. Bot. 2003, 54, 1415–1420. [Google Scholar]
  86. Keunen, E.; Peshev, D.; Vangronsveld, J.; van den Ende, W.; Cuypers, A. Plant sugars are crucial players in the oxidative challenge during abiotic stress: Extending the traditional concept. Plant Cell Environ. 2013, 36, 1242–1255. [Google Scholar] [CrossRef] [PubMed]
Figure 1. Metabolic pathway heatmap in wheat leaves in early senescing line (ES; AxC181) and late senescing line (LS; AxC112) normalised to anthesis (0 wpa). The metabolic map represents a core-set of metabolites (the full dataset is presented in Supplemental Data Set S1). Absolute values as recorded were averaged and normalised to the average of each metabolite. The levels of each metabolite were normalised to the anthesis time point. Log2 fold values are presented by the false colour code. Red indicates a relative increase; whereas blue designates a relative decrease in metabolite abundance. The early senescing line (ES; AxC181) is boxed in orange, while the late senescing line (LS; AxC112) is boxed in green.
Agronomy 09 00305 g001
Figure 2. Metabolic pathway heatmap in wheat leaves in early senescing line (ES; AxC181) and late senescing line (LS; AxC112) normalised to the N200 nitrogen level. The metabolic map represents a core-set of metabolites (the full dataset is presented in Supplemental Data Set S1). Absolute values as recorded were averaged and normalised to the average of each metabolite. The levels of each metabolite were normalised to the N200 nitrogen level. Log2 fold values are presented by the false colour code. Red indicates a relative increase; whereas blue designates a relative decrease in metabolite abundance. The early senescing line (ES; AxC181) is boxed in orange, while the late senescing line (LS; AxC112) is boxed in green.
Agronomy 09 00305 g002
Figure 3. Metabolic pathway heatmap in wheat leaves in early senescing line (ES; AxC181) and late senescing line (LS; AxC112) double-normalised to the anthesis time point of the N200 nitrogen level. The metabolic map represents a core-set of metabolites (the full dataset is presented in Supplemental Data Set S1). Absolute values as recorded were averaged and normalised to the average of each metabolite. The levels of each metabolite were double-normalised to anthesis and N200 level. Log2 fold values are presented by the false colour code. Red indicates a relative increase; whereas blue designates a relative decrease in metabolite abundance. The early senescing line (ES; AxC181) is boxed in orange, while the late senescing line (LS; AxC112) is boxed in green.
Agronomy 09 00305 g003
Figure 4. Clustered heat map depicting correlations between metabolites for the early senescing line, AxC181 (A) and the late senescing line, AxC112 (B). Correlations were calculated using the Pearson’s correlation and applying the average linkage algorithm. The assigned colours indicate the strength of a particular correlation between two metabolites, blue for negative correlations, and red for positive correlations as depicted in the colour key (−1 < 0 < 1). Grey colour indices represent empty values and tallies SPAD measurements that gave no reading at the final sampling and yield which were not determined at all sampling points taken over the developmental period, but only at final harvest. The values were generated in R (http://www.r-project.org/) and the heat map was constructed using the MultiExperimentalViewer software (http://www.tm4.org/).
Agronomy 09 00305 g004aAgronomy 09 00305 g004b
Figure 5. Differential metabolic heatmap representing a core-set of metabolites (the full dataset is presented in Supplemental Table S2). Absolute values as recorded were averaged and normalised to the average of each metabolite. The early senescing line was normalised to the late senescing line. Log2 fold values are presented by the false colour code. Red indicates a relative increase; whereas blue designates a relative decrease in metabolite abundance.
Agronomy 09 00305 g005
Table 1. Averages (±SD;) chlorophyll content and yield attributes (n = 3) determined in AxC181 (early senescence) and AxC112 (late senescence).(Statistical data are summarised in Figure 4 and Supplemental Data Set S1).
AxC181AxC112
Chl (SPAD unit)Chl (mg/gDW)Grain Yield (t/ha)Straw Yield (t/ha)%N in Grain%N in StrawChl (SPAD unit)Chl (mg/gDW)Grain Yield (t/ha)Straw Yield (t/ha)%N in Grain%N in Straw
N0 0WPA26.40 (±1.71)2.62 (±0.39) 25.83 (±0.4)1.99 (±0.19)
N0 1WPA27.66 (±2.00)2.71(±0.19) 26.9 (±1.42)1.77 (±0.43)
N0 2WPA22.33 (±1.67)2.00 (±0.53) 18.57 (2.87)1.47 (±0.25)
N0 3WPA13.7 (±3.08)0.79 (±0.15) 11.6 (±3.47)0.75 (±0.12)
N0 4WPA2.70 (±4.68)0.27 (±0.02) 4.1 (±7.1)0.3 (±0.16)
N0 5WPA0 (±0)0.27 (±0.09)3.14 (±0.18)1.14 (±0.37)1.3 (±0.05)0.23 (±0.01)0 (±0)0.29 (±0.02)2.22 (±1.01)0.39 (±0.27)1.37 (±0.04)0.25(±0.03)
N100 0WPA46.37 (±1.94)4.70 (±0.08) 52.6 (±1.01)5.1 (±0.17)
N100 1WPA45.70 (±1.51)4.69 (±0.26) 50.6 (±0.26)5.42 (±0.1)
N100 2WPA39.47 (±3.29)3.03 (±0.33) 45.67 (±2.65)4.37 (±0.36)
N100 3WPA9.17 (±2.66)0.90 (±0.42) 28.97 (±5.22)2.12 (±0.38)
N100 4WPA0 (±0)0.24 (±0.06) 0 (±0)0.22 (±0.03)
N100 5WPA0 (±0)0.27(± 0.09)7.29 (±0.39)4.56 (±0.57)1.49 (±0.1)0.25 (±0.01)0 (±0)0.26 (±0.04)7.24 (±0.13)2.7 (±0.59)1.55 (±0.09)0.31 (0.02)
N200 0WPA53.70 (±2.34)5.78 (±0.39) 57.88 (±1.91)6.33 (±0.43)
N200 1WPA54.67 (±0.7)6.41 (±0.31) 58.73 (±1.36)7.5 (±0.46)
N200 2WPA54.00 (±1.35)6.40 (±0.19) 57.63 (±0.45)6.68(±0.57)
N200 3WPA41.43(±1.04)2.80 (±0.78) 53.4 (±8.1)5.05 (±1.13)
N200 4WPA11.00(±9.66)0.61 (±0.24) 16.53 (±4.65)0.98 (±0.43)
N200 5WPA0 (±0)0.27 (±0.02)7.95 (±1.23)4.78 (±0.29)2.31 (±0.28)0.41 (±0.06)0 (±0)0.26 (±0.01)8.3 (±1.33)3.37 (±1.01)2.09(±0.13)0.42 (±0.03)
N350 0WPA57.40 (±2.34)6.64 (±0.35) 59.73 (±2.38)7.37 (±0.47)
N350 1WPA56.73 (±1.16)7.60 (±0.38) 61.7 (±2.6)8.08 (±0.22)
N350 2WPA56.13 (±0.92)6.84 (±0.35) 60.9 (±1.95)7.08 (±0.18)
N350 3WPA40.23 (±9.88)3.50 (±0.93) 61.2 (±4.42)7.36 (±1.14
N350 4WPA17.43 (±0.49)0.95 (±0.32) 36.1 (±3.02)1.91 (±0.46)
N350 5WPA0 (±0)0.39 (±0.04)7.84 (±1.15)4.76 (±0.8)2.86 (0.04)0.61(±0.01)0 (±0)0.36 (±0.01)8.94 (±0.84)3.99 (±0.25)2.47 (±0.06)0.51 (±0.01)

