1. Introduction
Precision agriculture (PA) consists of managing crops by observing, measuring, and acting against the many variable factors that affect them. Systems for PA can be based on satellite navigation systems or terrestrial systems for geographic information and sensors located in the plot. These systems collect information to be used to make decisions with greater precision and to optimize crop yields. PA contributes to producing a more efficient and ecological agriculture. It allows saving on phytosanitary products, fertilizers, and reducing the amount of nitrogen used. PA reduces costs and optimizes agriculture. It also reduces the environmental impact by optimizing the use of water, pesticides, and machinery fuel; thus, greater production is obtained with fewer resources.
In order to develop efficient PA systems, there is an increasing trend towards using smart decision systems (SDS). The acceptance of SDS solutions in many industrial sectors that specialize in agriculture is limited by the fact that building an SDS requires a significant investment of time and knowledge. If it is to benefit from technological advances, agricultural activity has therefore to absorb not only technical expertise, but also skilled knowledge of engineering. The Internet of Things (IoT) [
1] can be used for that purpose, despite several immense challenges linked to big data analytics, cloud computing, and new business models in SDS.
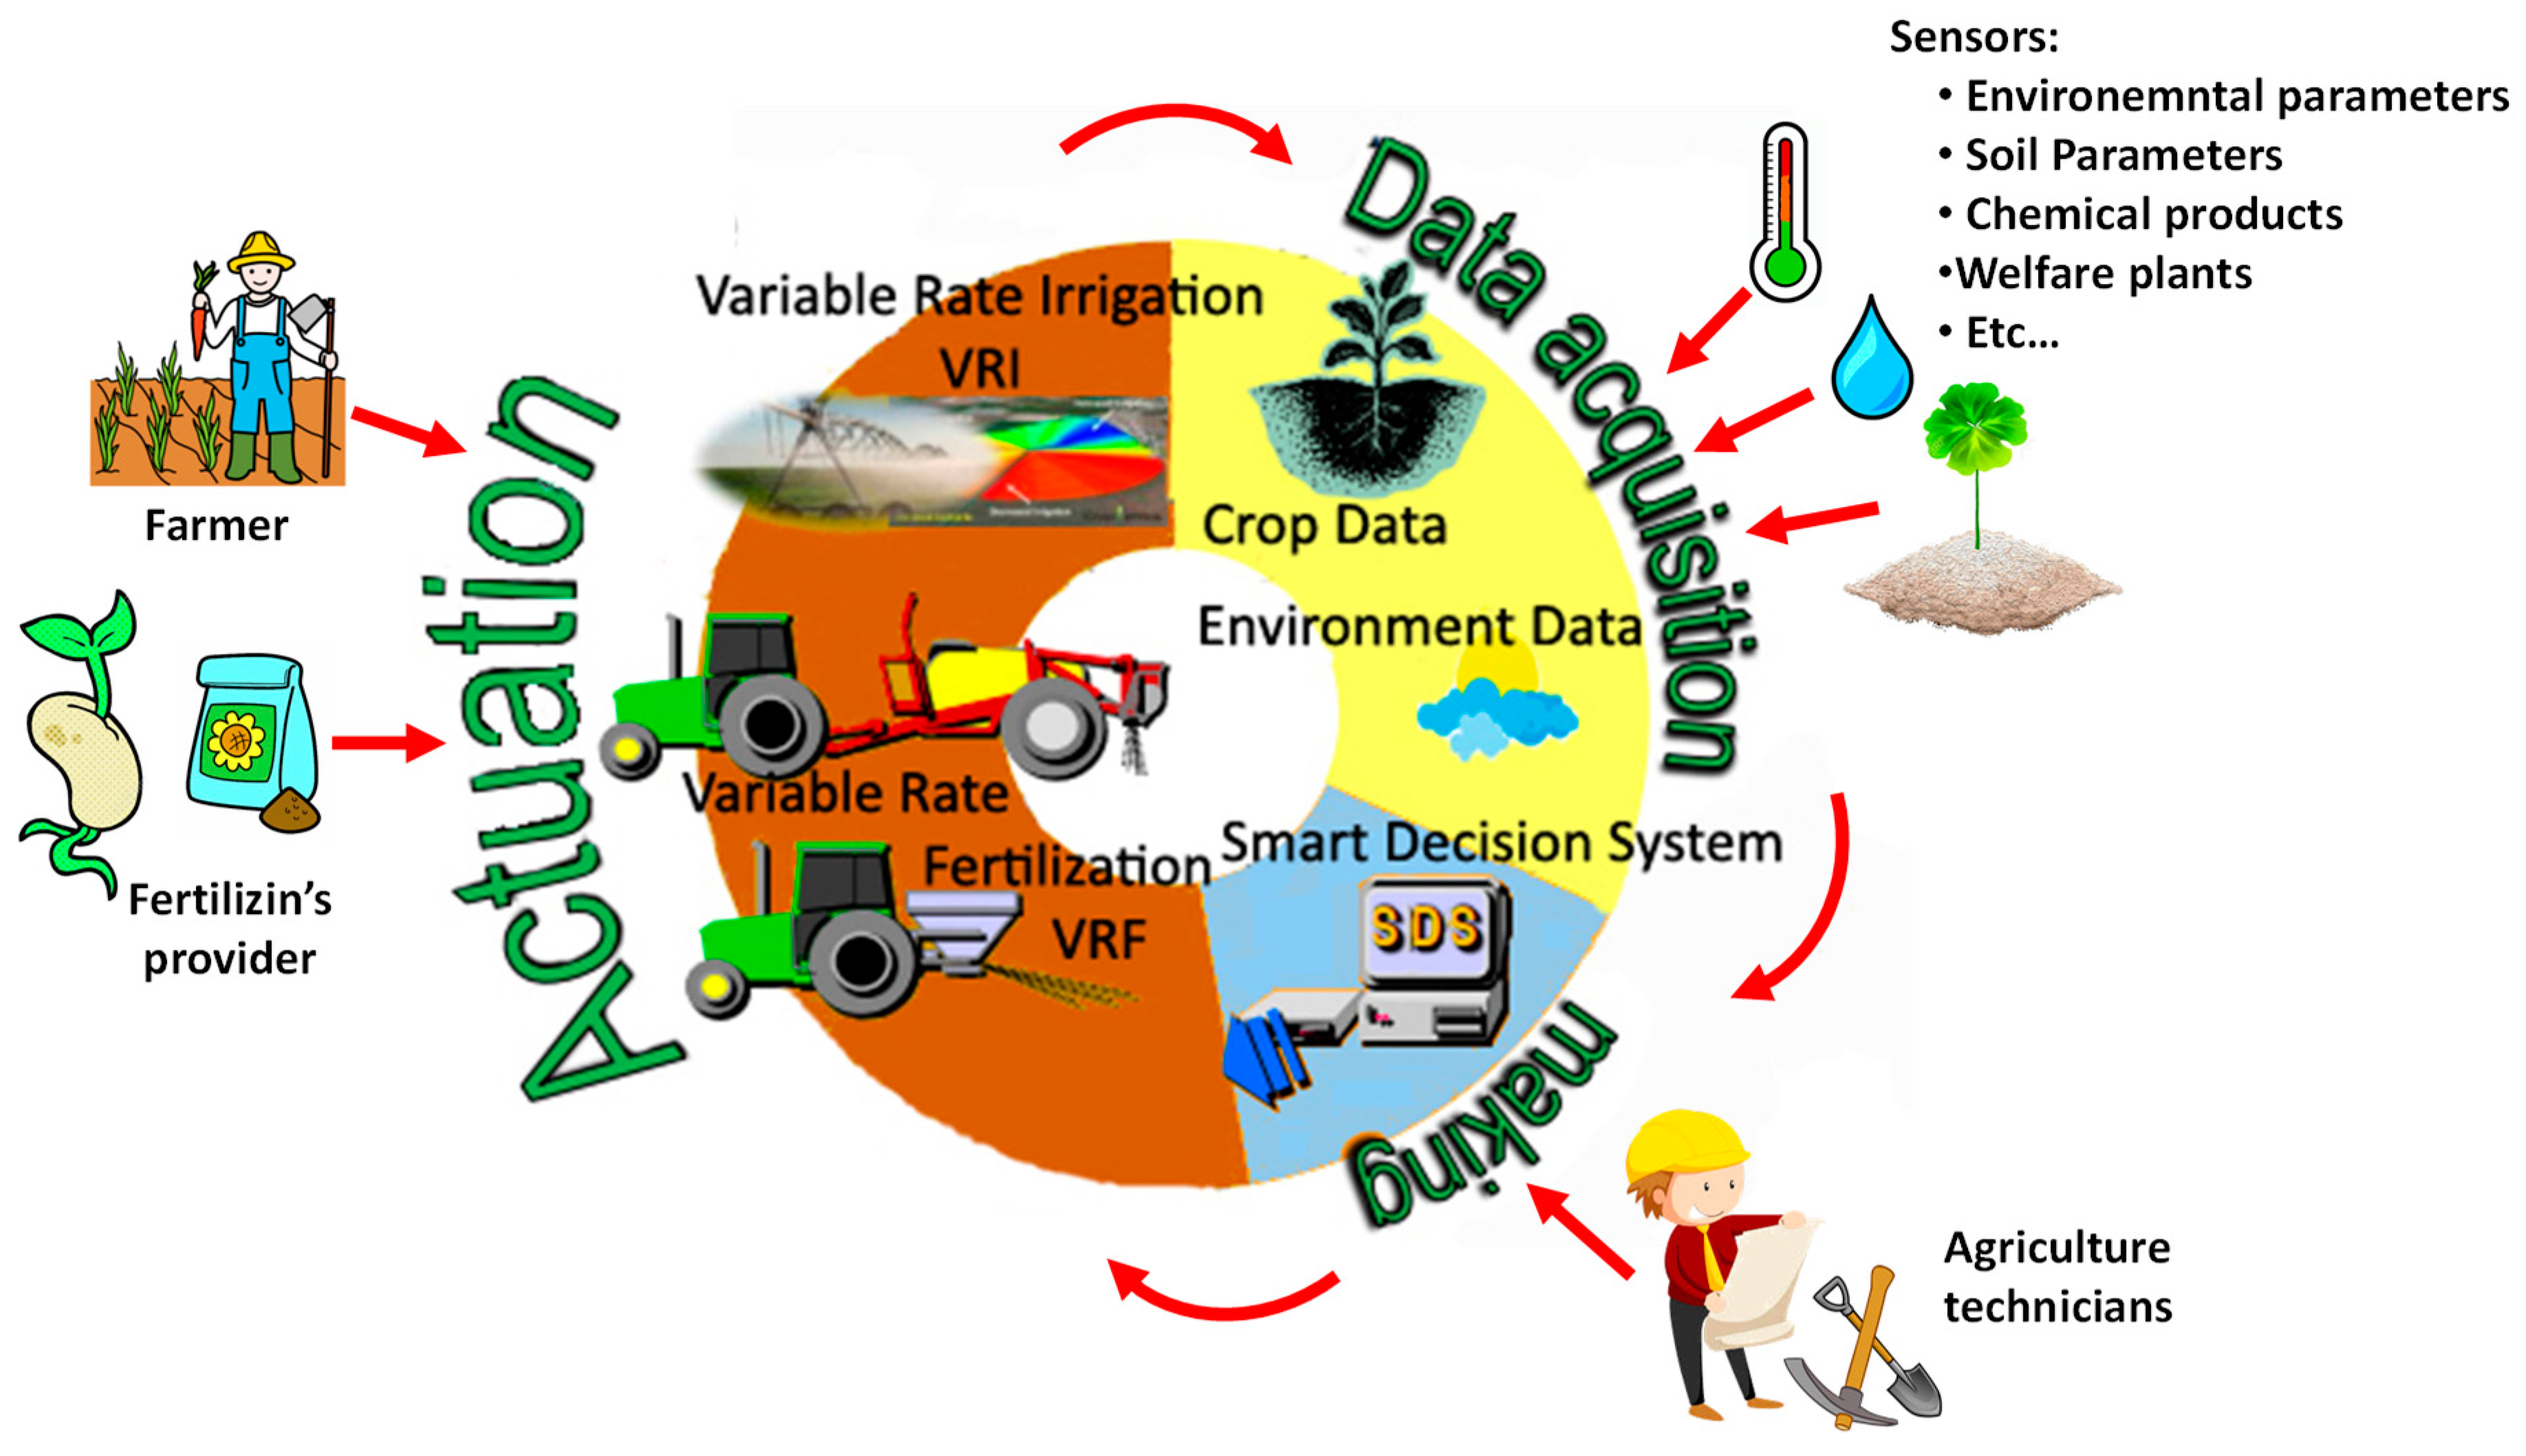
These features typically include intelligent assistance with the implementation of technology and its maintenance and use. The concept of smart farming is summarized in
Figure 1, together with the management cycle as a cyber-physical system, leading eventually to smart online devices capable of controlling a range of farming systems.
Sundmaeker [
2] reported rapid developments in the IoT and cloud computing, applied in this paper to a field known as smart farming. Algorithmic training processes for decision-making support are highly complex tasks, with many problematic issues found in models that are automatically induced from data through big data applications [
3]. Perhaps the most problematic is the value chain that refers to the sequence of activities from data capture to decision making, involving data marketing, decision trees, and rule injection procedures. The advantage of these models is that they consist of individual units of knowledge (rules) that can be separately viewed, evaluated, processed, deleted, and even edited. In a business process [
4], for example, work laid out in a set of logically related tasks can be performed to achieve a defined business outcome.
Big data represents the information assets that are characterized by high volumes, high-speed processing and a variety of inputs. Processing such information requires specific technology and analytical methods [
5] for their transformation into a value chain.
This paper presents a complete implementation of a smart decision support system prototype, which automatically learns decision rules from data, thereby permitting the domain expert to edit the resulting rule base, which can apply the rules to achieve incoming objects. As agriculture consumes about 70% of all fresh water resources, one important aspect of green farming is economical and efficient use of water [
6]. Water consumption percentages can be decreased through efficient water management, where irrigation needs are adjusted to supply. Decision trees generate rules to enhance the use of irrigation water, fertilizers, pesticides, etc. A web platform can convert the results of data-based decision making into user-friendly public information that is only posted following a decision maker review process. The major advantage is integration into a unique platform to control farming decisions such as irrigation system control, fertilization, pesticides, and an open data network, all in one. In addition, our system includes rules based on variable-rate irrigation (VRI) [
7]. VRI is a new technique that allows optimization of irrigation application, considering the status of field and weather. In most cases, these systems are implemented by using a center pivot irrigation system that can reduce the total irrigation water volume required to grow field crops. According to Reference [
8], this kind of system is able to reduce irrigation water use by 8% compared to uniform irrigation application. Considering this idea, we designed [
9], developed, and tested an intelligent system for irrigation control of urban lawns. The system is based on the use of a multisensor node composed by humidity and temperature for soil and air, as well as a rain sensor. The multisensor node is controlled by an intelligent algorithm that takes into account the real time values provided by the sensors and the stored data of previous measurements. The intelligent algorithm is responsible for analyzing the data and deciding on the amount of water to be used in a given area. Using actual annual meteorological values of a city with different water requirements, the system’s operation was simulated. The results showed that for a landscaped area of about 140 ha, we could save around 6% of the irrigation water, which would be equivalent to about 22 million liters of water. Finally, the complete system behaves as a collaborative platform, taking into account the experience of other users and previous events introduced into the system. A system with these features can help farmers to enhance the activity sustainability, at the same time, that a more controlled use of chemical products and natural resources will protect our environment and groundwater resources.
This study is organized as follows.
Section 2 will present the reasoning behind the study and related works.
Section 3 will describe the individual steps of the preparation process of a classification rule set.
Section 4 will then detail the software components of the engine and, in
Section 5, the web platform and the processing of open data will be outlined. Finally, in
Section 6, the conclusions will present the advantages of the demonstrated model and future avenues of work will be suggested.
2. Related Works
The generation of “business rules” from data-mining results is an emerging research area. To the best of our knowledge, the only publicly available software solution to business rule learning is Rule Learner, which forms part of the Open-Rules Decision Management System. According to the SOA paradigm, software should function as cooperating services, as described in a previous work [
1]. However, there have been several experimental systems developed in the machine learning community with related functionality. The Drools system [
3], used in our solution, is a business rules management system that combines user needs and constraints in the search space with interactive mining. The interactive nature of both systems, MIME and Drools, can help to address the excessive number of rules that typically form the output of rule learning. Additionally, in Reference [
4], we showed that the database-pruning algorithm can significantly reduce the number of rules that Drools outputs, without adversely impacting on the quality of the classifier. The smart farming decision system proposed in this paper is called PLATEM. Drools is the core of this system, which is integrated in a single web application. The user can launch multiple farm functionalities, export the results that are selected, and apply the rules on test data in auto mode. The rule-learning algorithm used in Drools for building the classifier from association rules is evaluated and described in detail in the following sections. The software solution is presented and implemented in demo form. Its main contribution, with respect to the previous results in References [
5,
6], is in the integration of the periodically sampled indoor and outdoor irrigation system linked to a wireless sensor network, the SDS, and the web, which together form the complete PLATEM system.
This pervasive paradigm [
10] of the Internet of Things (IoT) is to increase the value of the information generated by the number of interconnections between people and gadgets, denoted by things, and to transform of the processed information into knowledge for the benefit of mankind and society.
The architecture of the IoT unit [
11] is built from a man-like neural network (MLN) model and its modified model. Ubiquitous IoT refers to the global IoT and its integration in multiple-unit IoTs. Its architecture employs a social organization framework (SOF) model. The models for future IoTs are not only helpful to interpret the relationship between IoT and the real world, but are also beneficial for the implementation of IoT in its current form.
Vazquez et al. explored [
12] the different criteria for designing IoT architectural solutions, together with illustrative examples of prototypes that have implemented these approaches. Likewise, Misra [
13] proposed a community detection scheme in an integrated Internet of Things (IoT) and social network (SN) architecture. The paper follows a graph mining approach to solve the problem in a complex network of IoT and SN. There are a few studies in the literature on community detection in SNs; however, to the best of our knowledge, there are no specific studies that address the integration of IoT and SN architecture.
Atzori [
14] analyzed the major opportunities arising from the integration of social networking concepts in the Internet of Things, presenting the mainstream research activities and pointing to the most critical technical challenges.
Smart farming technology is continuously reinventing new business models using real-time data with automated data-acquisition devices. The sector needs open infrastructure between technologies, because of a concern that key data processing techniques may become the exclusive domain of multinational AgTech corporations. In the current market, applications developed by AgTech corporations and AgBusiness companies, with patented specifications, are commonly found for machine manufacturing processes. There are also applications that function exclusively with irrigation. These underlying reasons prompt us to work towards integrated components in technology, both for device interaction, such as fertirrigation controllers, and for data processing, to produce information for greater agricultural efficiency. Basing our work on agricultural knowledge, and in consultation with individual farmers and agronomists, the focus of this work is on the development of a platform that integrates the core control operations and that monitors data on crop yields, in order to build on synergetic results from multidisciplinary expertise. PLATEM PA is a combination of a smart fertirrigation manager application that displays historical data, and social networking forums that share productive data.
The main complexity of such applications is that they require collaboration between many different elements with different contributions to the data values and related decisions over the consequential actions. An overview of current European applications in PA is presented below, identifying the major functions of each one in comparison with PLATEM PA.
Table 1 shows the aspects that PLATEM introduces in relation to the different elements of other smart farming platforms. The integration of several tools in the main user profile is central to PLATEM, enabling the development of a social network between professionals in different areas where they can discuss data acquisitions, notifications, and crops risks. The ultimate goal is an open communication protocol and open data platform between large precision agriculture technologies, oriented towards indoor and outdoor VRF and VRI.
Smart-Akis [
15] represents the application of modern information and communication technologies (ICT) in agriculture, leading to what can be called a third Green Revolution.
Agrivi [
16] is a crop management software for crop planning, monitoring, and analysis. Advice and relevant data on tillage, sowing, fumigation, fertilization, irrigation, and harvesting, and almost all other activities, can be accessed with a few clicks. In addition, volumetric calculations, and costs and hours of work are suggested for each activity. The processes, based on best practices gathered in relation to over 100 crops, are designed to improve productivity.
The main objective of the sigAGROasesor [
17] project is the development of decision support tools for the agricultural sector, through a web platform for online services to farmers, assisting efficient, effective, and competitive farming activities, based on environmental and social sustainability.
In relation to a smart water-saving irrigation system [
18], X, Kehui et al. published a scientific paper based on an intelligent irrigation programmer with sensory connectivity and 433 MHz ISM communication. The research focused on applications in precision agriculture, using a wireless humidity sensor. A network of wireless sensors was configured to monitor the moisture content and the amount of water in the field soil samples. The architectures of both the wireless sensor network and the intelligent system were based on the network of sampled irrigation controllers. The irrigation test was performed with real-time humidity data and expert inputs. A feasible system was demonstrated in the rice cultivation process, and a good exploration in the field of precision agriculture and sustainable water resources.
The APOLLO project [
19] shares similarities with the PLATEM PA project proposal design. The technology was analyzed in depth for the consolidation of the PLATEM PA system, improving its potential for use with other innovative ultra-low power communications and dynamic routing protocols, and in the latest business rule engine models applied to the multimedia platform.
APOLLO aims to bring the benefits of precision agriculture to farmers through affordable information services, making extensive use of free and open Earth observation data, such as those provided by the EU Copernicus program. These services are intended to assist agricultural decision making, while observing crop growth and conditions, providing advice on irrigation and tilling, and providing crop estimations. Ultimately, these interventions are designed to reduce agricultural inputs and increase competitive production levels and benefits.
As
Table 1 shows, the novelty of our platform is that PLATEM PA can be considered as a collaborative tool where farmers can post their experiences. It is able to monitor the different parameters of soil and environment to better growth of crops. In addition, PLATEM PA is able to improve their decision, regarding to actions to be performed over the field, taking into account previous stored information and farmers posts. Finally, its operation is based on the use of an intelligent Virtual Routing and Forwarding (VRF) and Virtual Router Instances (VRI). PLATEM PA therefore represents a competitive sample of European supplier networks focused on Precision Agriculture management and a multimedia platform with basic group tools to control and monitor data and relations between all participants for sharing results.
The PLATEM system presented in this paper can be used to accomplish the task through a chain of web-based graphical tools, running on standard BRMS software with open-source formats. Our technological solution is capable of adapting “high-tech tools” to be used by farmers, many of whom may have little or no technical hi-tech expertise. One problem is the necessary automatization of several systems (irrigation controller, fertirrigation pump, pH sensor node, …) from different manufacturers that need to be adapted to specific communication protocol. PLATEM PA combines several data integration processes in a single easy-to-use platform with a standard communication protocol.
Although the final system will be composed by both hardware part (in charge of collecting data from the field) and software part (in charge of processing data), this paper is focused on data computation and not in the agronomic side and to perform the tests we will take a data base with the needs of fertilization, weekly irrigation liters and different Kc for corn varieties of alfalfa, barley and wheat.
3. Rule-Based Preparation Work
The first step to develop our management platform was to know the variable inputs the system has and how they have to be processed by using the rules. Taking into account that the final goal is to enhance the sustainability and competitiveness of the activity, the system also includes business process management (BPM) and business rules. It is also important to define the platform architecture. This section therefore presents the server-based decision-making structure for decision making on irrigation device settings, which processes data inputs on edaphic and environmental conditions, images of crop growth, and crop status.
The objective of this server-based decision-making structure is the integration of a BPMS and a business rules management system. A middleware data-exchange system serves as a link between both. The middleware that serves to relay data from Bonita BPM and Drools includes the following developments:
Performance of an integrated architecture for a business rules management system and a business rule management system (BRMS).
Dialogue through the intermediate middleware component that is responsible for the data management model and the rule-based activities.
Bonita Soft provides connectors to interact with the Drools manager that connect with the Drools API Engine to run the execution of a certain rule, in order to obtain results that conclude with the previously triggered decision-making process.
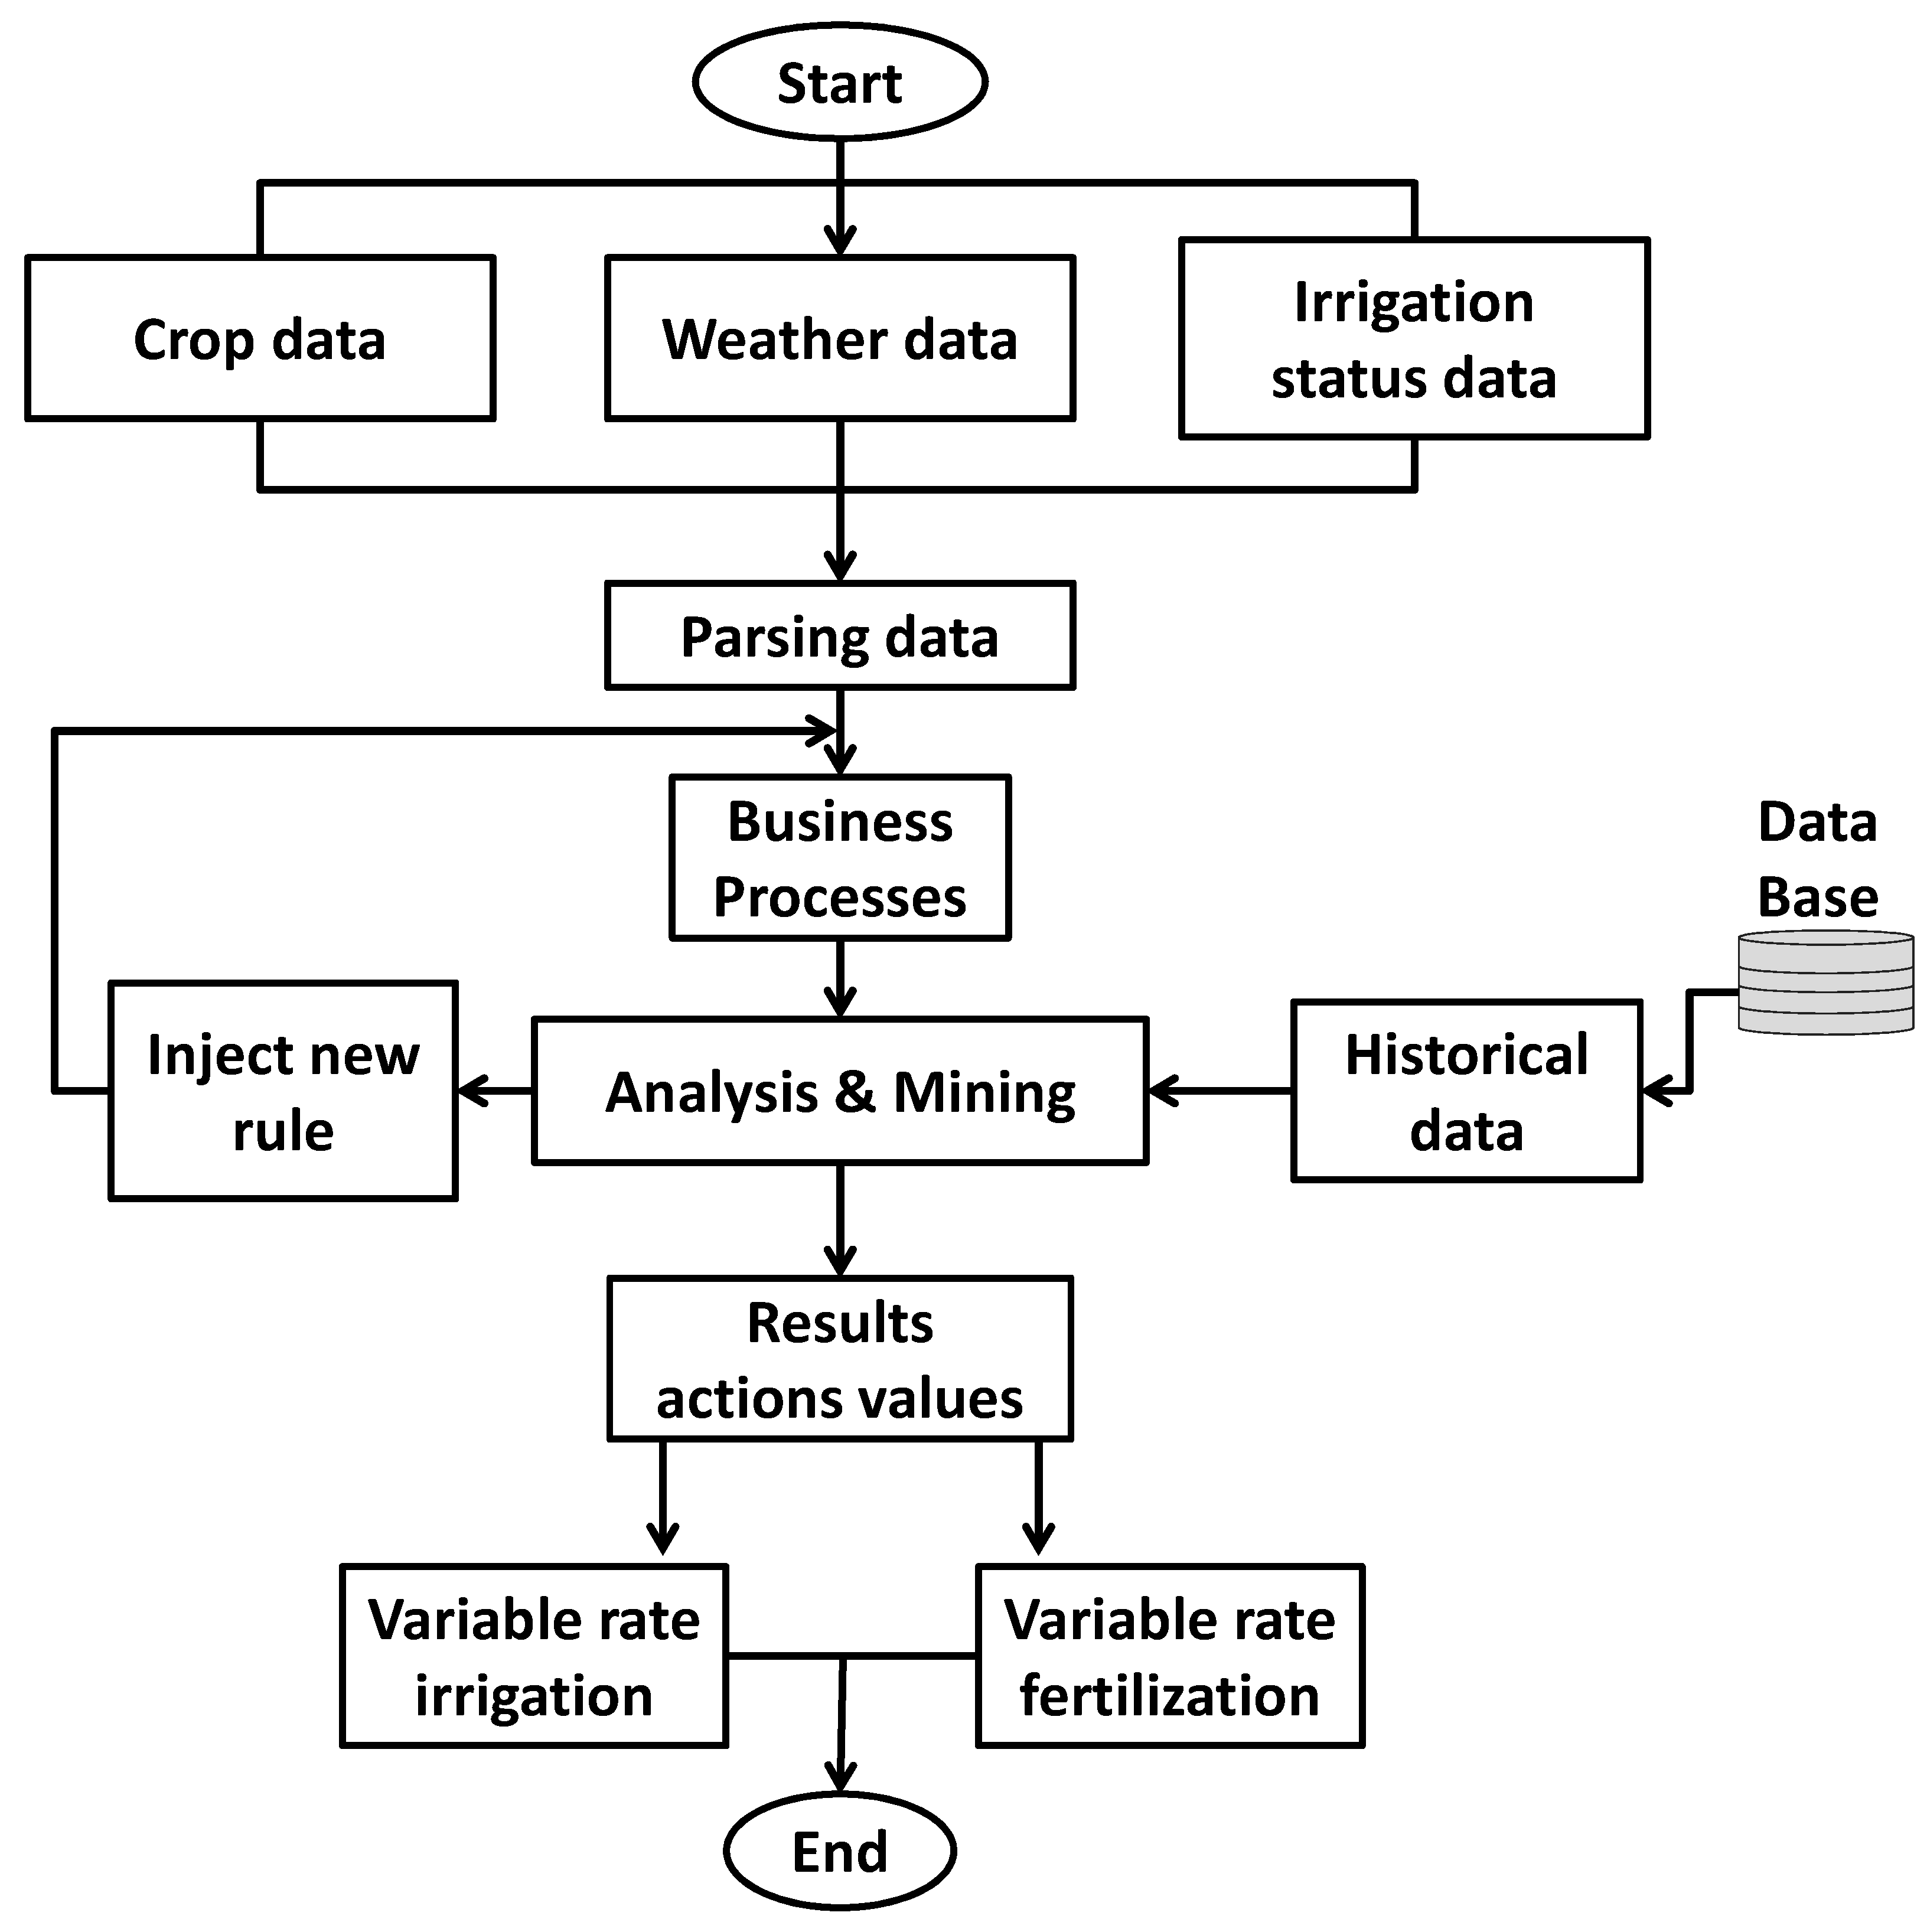
The process of preparing a rule base in Drools can be divided into several consecutive steps that are presented in
Figure 2, wherein several layers are created: data preparation, association rule learning, rule selection, classification model testing, rule set editing, and deployment of rules.
These steps, which can be performed with a standard web browser, are described below in
Figure 2:
Data are collected for the smart decision system, (soil sensors, leaf sensor, etc.) weather and environmental conditions, and machinery (pivot irrigation, controllers, pumps, etc.) from a range of devices, and the information is then transmitted through the network coordinator to the middleware. These data, once pre-processed and formatted, are sent to the rule engine for rule-based processing to produce relevant results. Historical database information may be required for some rules.
Having obtained the results, the coordinator module communicates with the appropriate services (e.g., pumps, irrigation controllers, etc.), sends their recommendations via virtual routing and forwarding (VRF) and virtual router instances (VRI), and reports either to the farmer profile or directly to systems installed on the farm for automated implementation, if the system device is configured to do so. The type of setting and the basic information for a range of settings—i.e., turn on, watering time, turn off—are configurable by the farmer with appropriate permissions for automatic SDS adjustment.
3.1. Data Preparation
The user starts with a dataset for training the classification model. Typically, the dataset is divided into a training and a testing part. The design of data management and processing procedures, associated with a long-term wireless monitoring system, can join all these farming systems and data acquisition elements (see backend structure in
Figure 2). The data from WSN is stored in a MySQL database via middleware through a management process and a communication socket. The user can, for instance, upload a profile of crops and fields that will be stored in the MySQL database.
The weather forecast updates from a weather server can then be added, including field coordinates and responses with forecasts in XML, which will also be stored in MySQL as the weather profile.
Data from aerial images (drone or satellite) may be manually uploaded for users via web view (Image and NDVI index file).
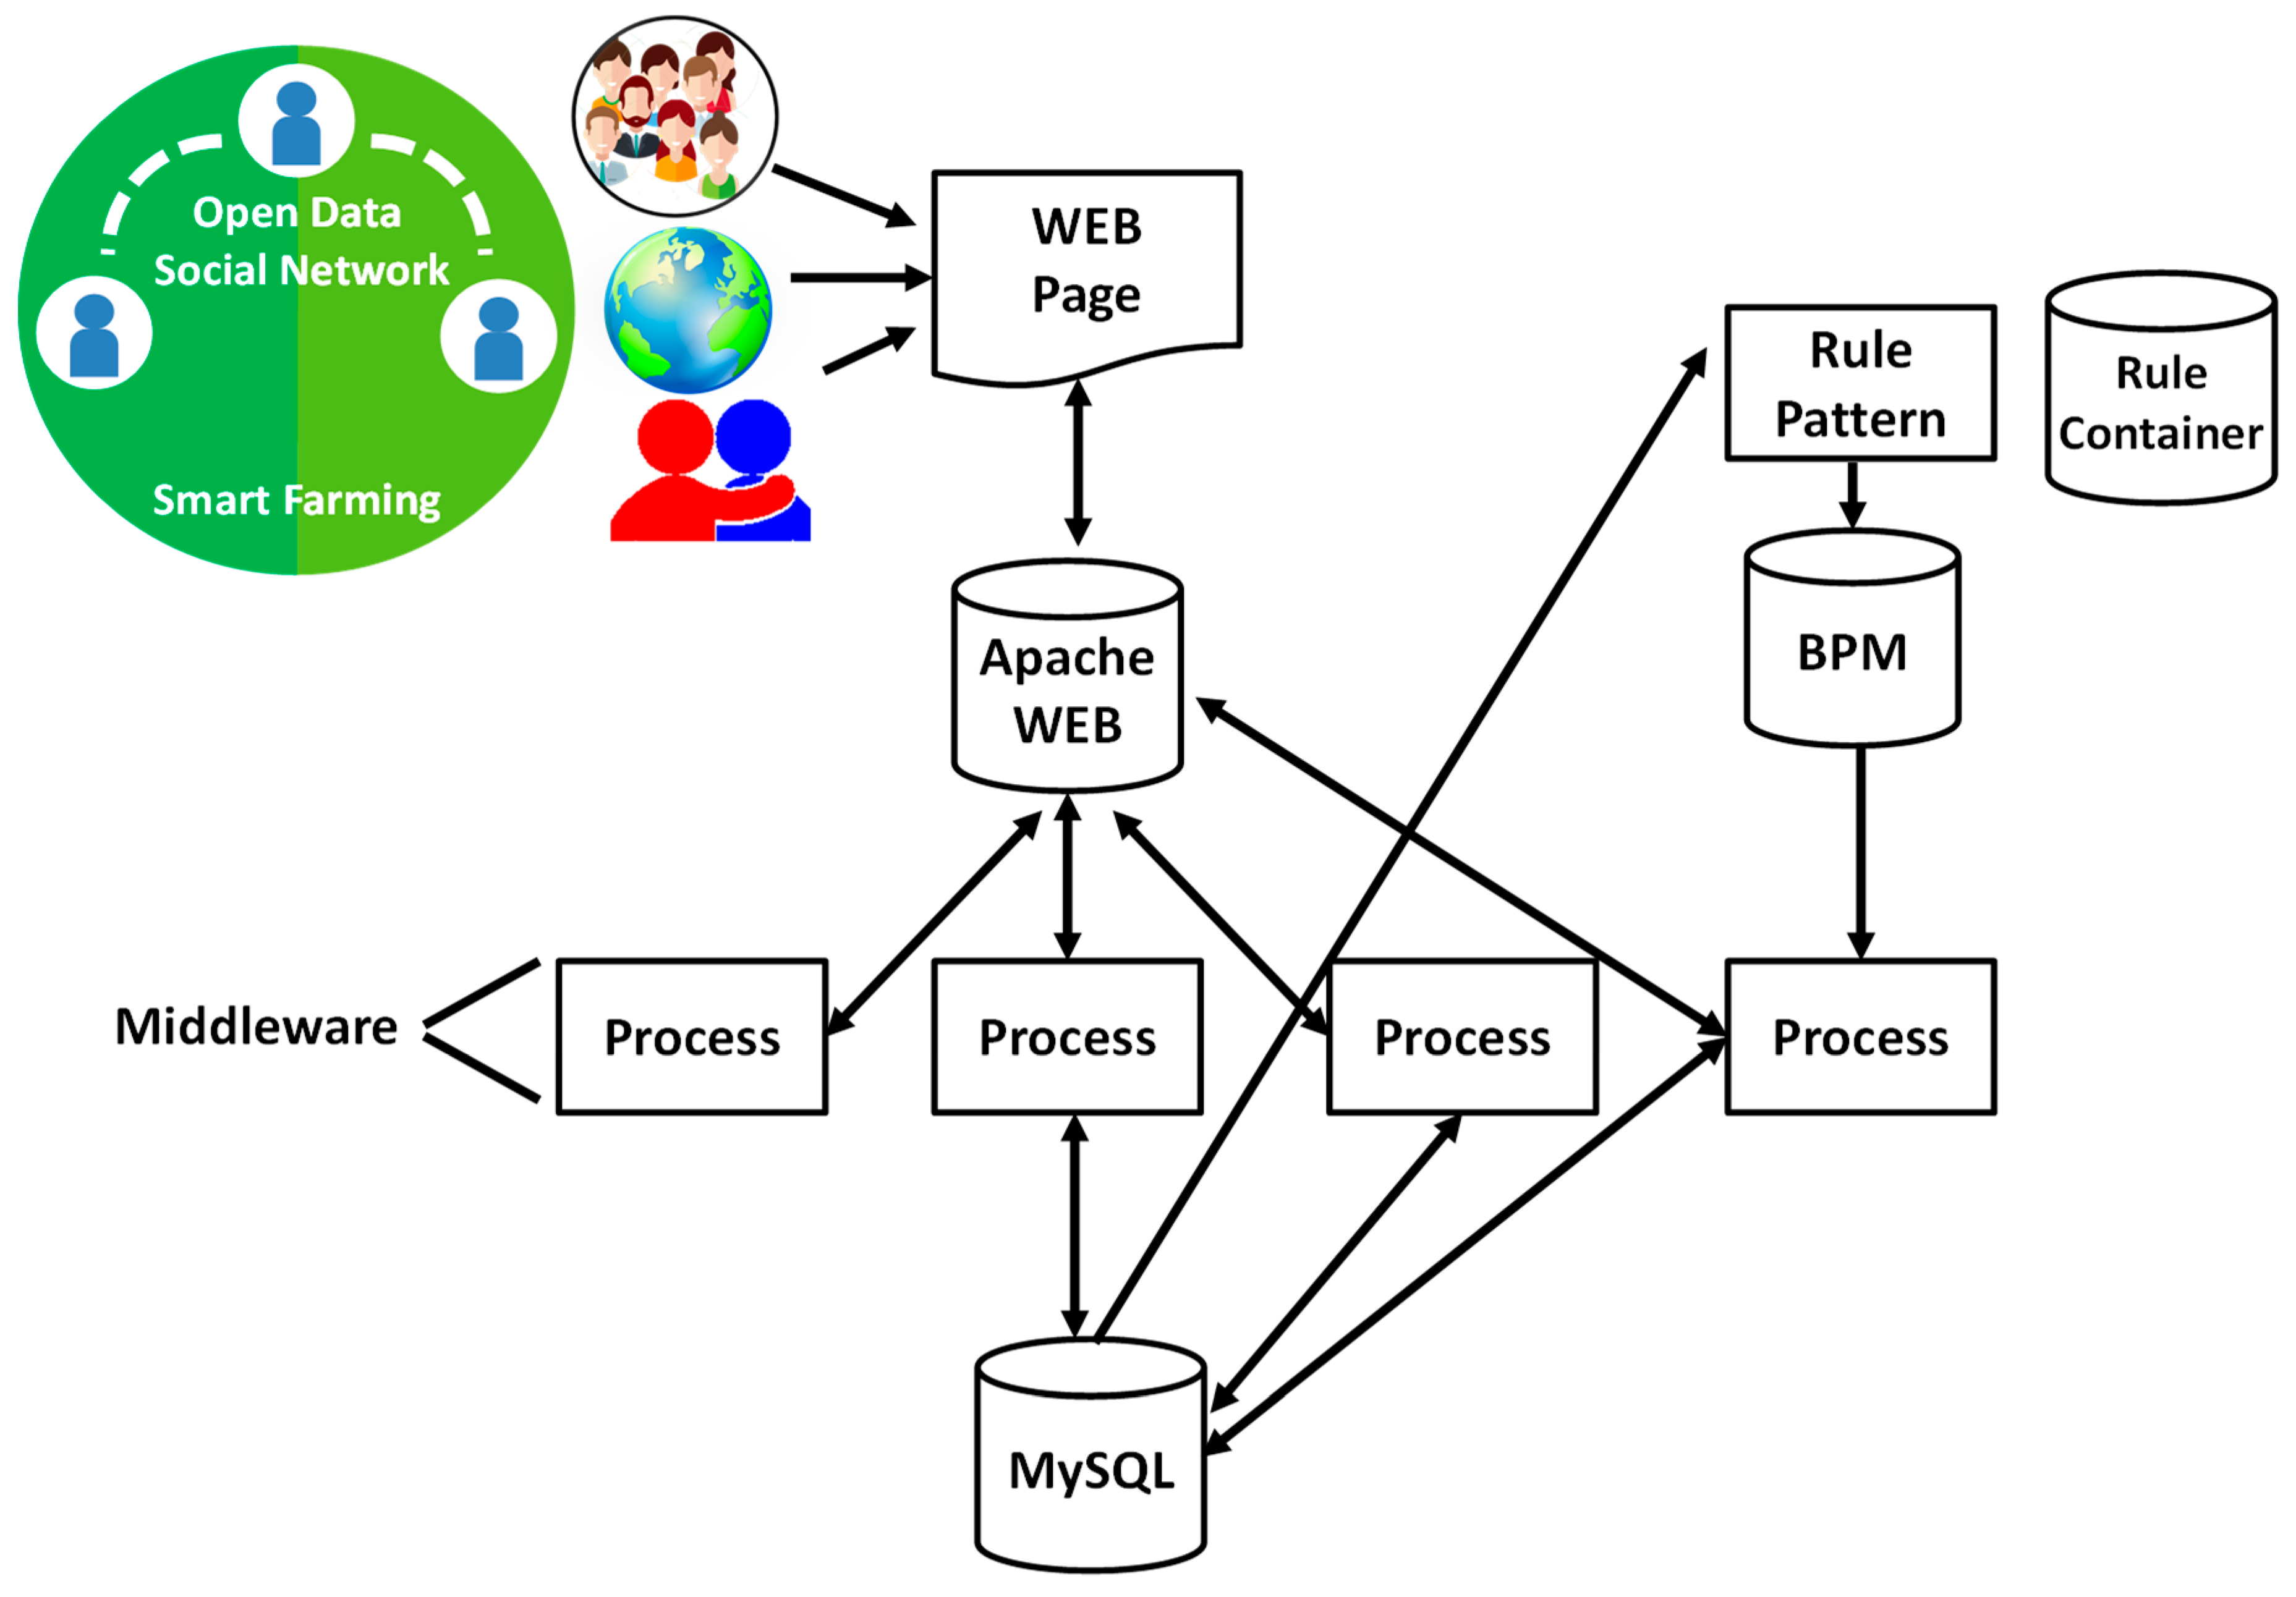
The general structure of the system is shown in
Figure 3, where the server layers are described: database, middleware, Server Web, BPM, and responsive web view.
The system supports several types of pre-processing. Middleware prepares information to store, and the user can do pre-processing using intervals of determinate values. The user can then merge values at different intervals.
3.2. Association Ruler Learner
As a rule-learning algorithm, the current version uses a simple procedure implemented in the system. The user is required to input a defined rule pattern for the crop and field profile to commence the associative rule learning process in Drools. The user then selects the attributes from attributes and selects a list in a rule pattern container DB. By default, the attributes are connected with a conjunction, but the system also supports disjunction and negation connectives.
New rules may be introduced for each attribute in the rule pattern as a set of its values considered during the matching process.
3.3. Rule Selection
The user can then change the parameters of the rule-learning task, typically by introducing changes to the rule pattern, sometimes with a different location or season; some values will therefore need adjusting. The rules are saved, grouped by data mining tasks, and the rule container updates the attributes of each one.
For classification, it is essential that the rules entered on the clipboard be chosen to maximize data accuracy. The accuracy is computed either on the training dataset or on a separate test dataset. The system exports the rule results saved in the Rule Clipboard to the MySQL, where middleware is then able, for example, to send reconfiguration instructions to the irrigation controller. The system can also be used to post user friendly data in web view, informing users of the results of certain rules.
3.4. Rule Editor
The results can be suitably combined (association rules) for the construction of a classification model selected from multiple data-mining tasks. The user can export/import rules from the Rule section into the “business rules” base. For practical purposes, the rules are internally saved in a JSON format. The system then converts the rules into the Drools DRL format.
The user can display the rules saved in the “business rules” knowledge base and edit them using a web interface. An irrigation schedule business process is displayed in
Figure 4.
4. Software Components
Once the platform architecture and the rules association had been defined, it was required to develop the software part that would implement our web platform. To perform that, this section presents the implementation of server rules in the Drools engine. The server has three main components. The first one is an application that is able to register the external sensor data in the system. A device or application simply registers as a data source by sending information via socket communication to the middleware, which then prepares the data in a specified format, depending on the type of sensor.
The system architecture is divided into the following layers:
User interface: enables farmers, providers, and technics to interact with the system and execute computerized workflow activities. To do so, it invokes operations of the interfaces published by the business layer. It is a set of HTML and Php pages hosted on an Apache web server that are displayed in a web browser.
Business layer: responsible for making calculations, queries, and invoking the execution of business rules. To do this, it accesses the data layer and the rules services layer. It is a set of PHP pages hosted on an Apache web server.
Data layer: in charge of managing the system’s database, which contains information about all the data of the process and its stages for each field. It provides interfaces so that the business layer can access it. To implement this layer, the MySQL database management system was used.
Service layer of business rules: exposes interfaces through web services to business rules. It is invoked from the business layer and executes the rules contained in the rules layer. It is made up of web services, programmed in Java, which run on a Tomcat web server.
Rules layer: makes it possible to manage business rules, for which it provides interfaces to the rules services layer. To implement this layer, a free, open source, java-developed BRMS was used. The BRMS is deployed on a Tomcat web server.
Figure 5 shows the architecture of BRMS used by our platform. As we can see, the main component of our BRMS is an Apache web server, which uses the data stored in our database (DB). In order to enhance our server, we used a Tomcat web server. Tomcat is an extension of Apache that works as a container of servlets, and can help us to include new functionalities to our server. Using the servlets, we can extend applications held in web servers to be seen as JAVA Applets. To generate and manage the different rules we need to enhance the system performance, we used Drools, a common tool used for managing business rules that we have adapted to our application. These rules are sent to the Tomcat web server through the API. These rules are sent to the Apache web server, which combines them with the data stored in the DB. Finally, the users can see the results of these decisions by using a web browser and surfing the different options the platform offers.
The following section introduces the Drools management based on the Rete pattern-matching algorithm [
20]. It provides the basis for a more efficient implementation that can check each rule against facts in a knowledge base, firing the rule if necessary.
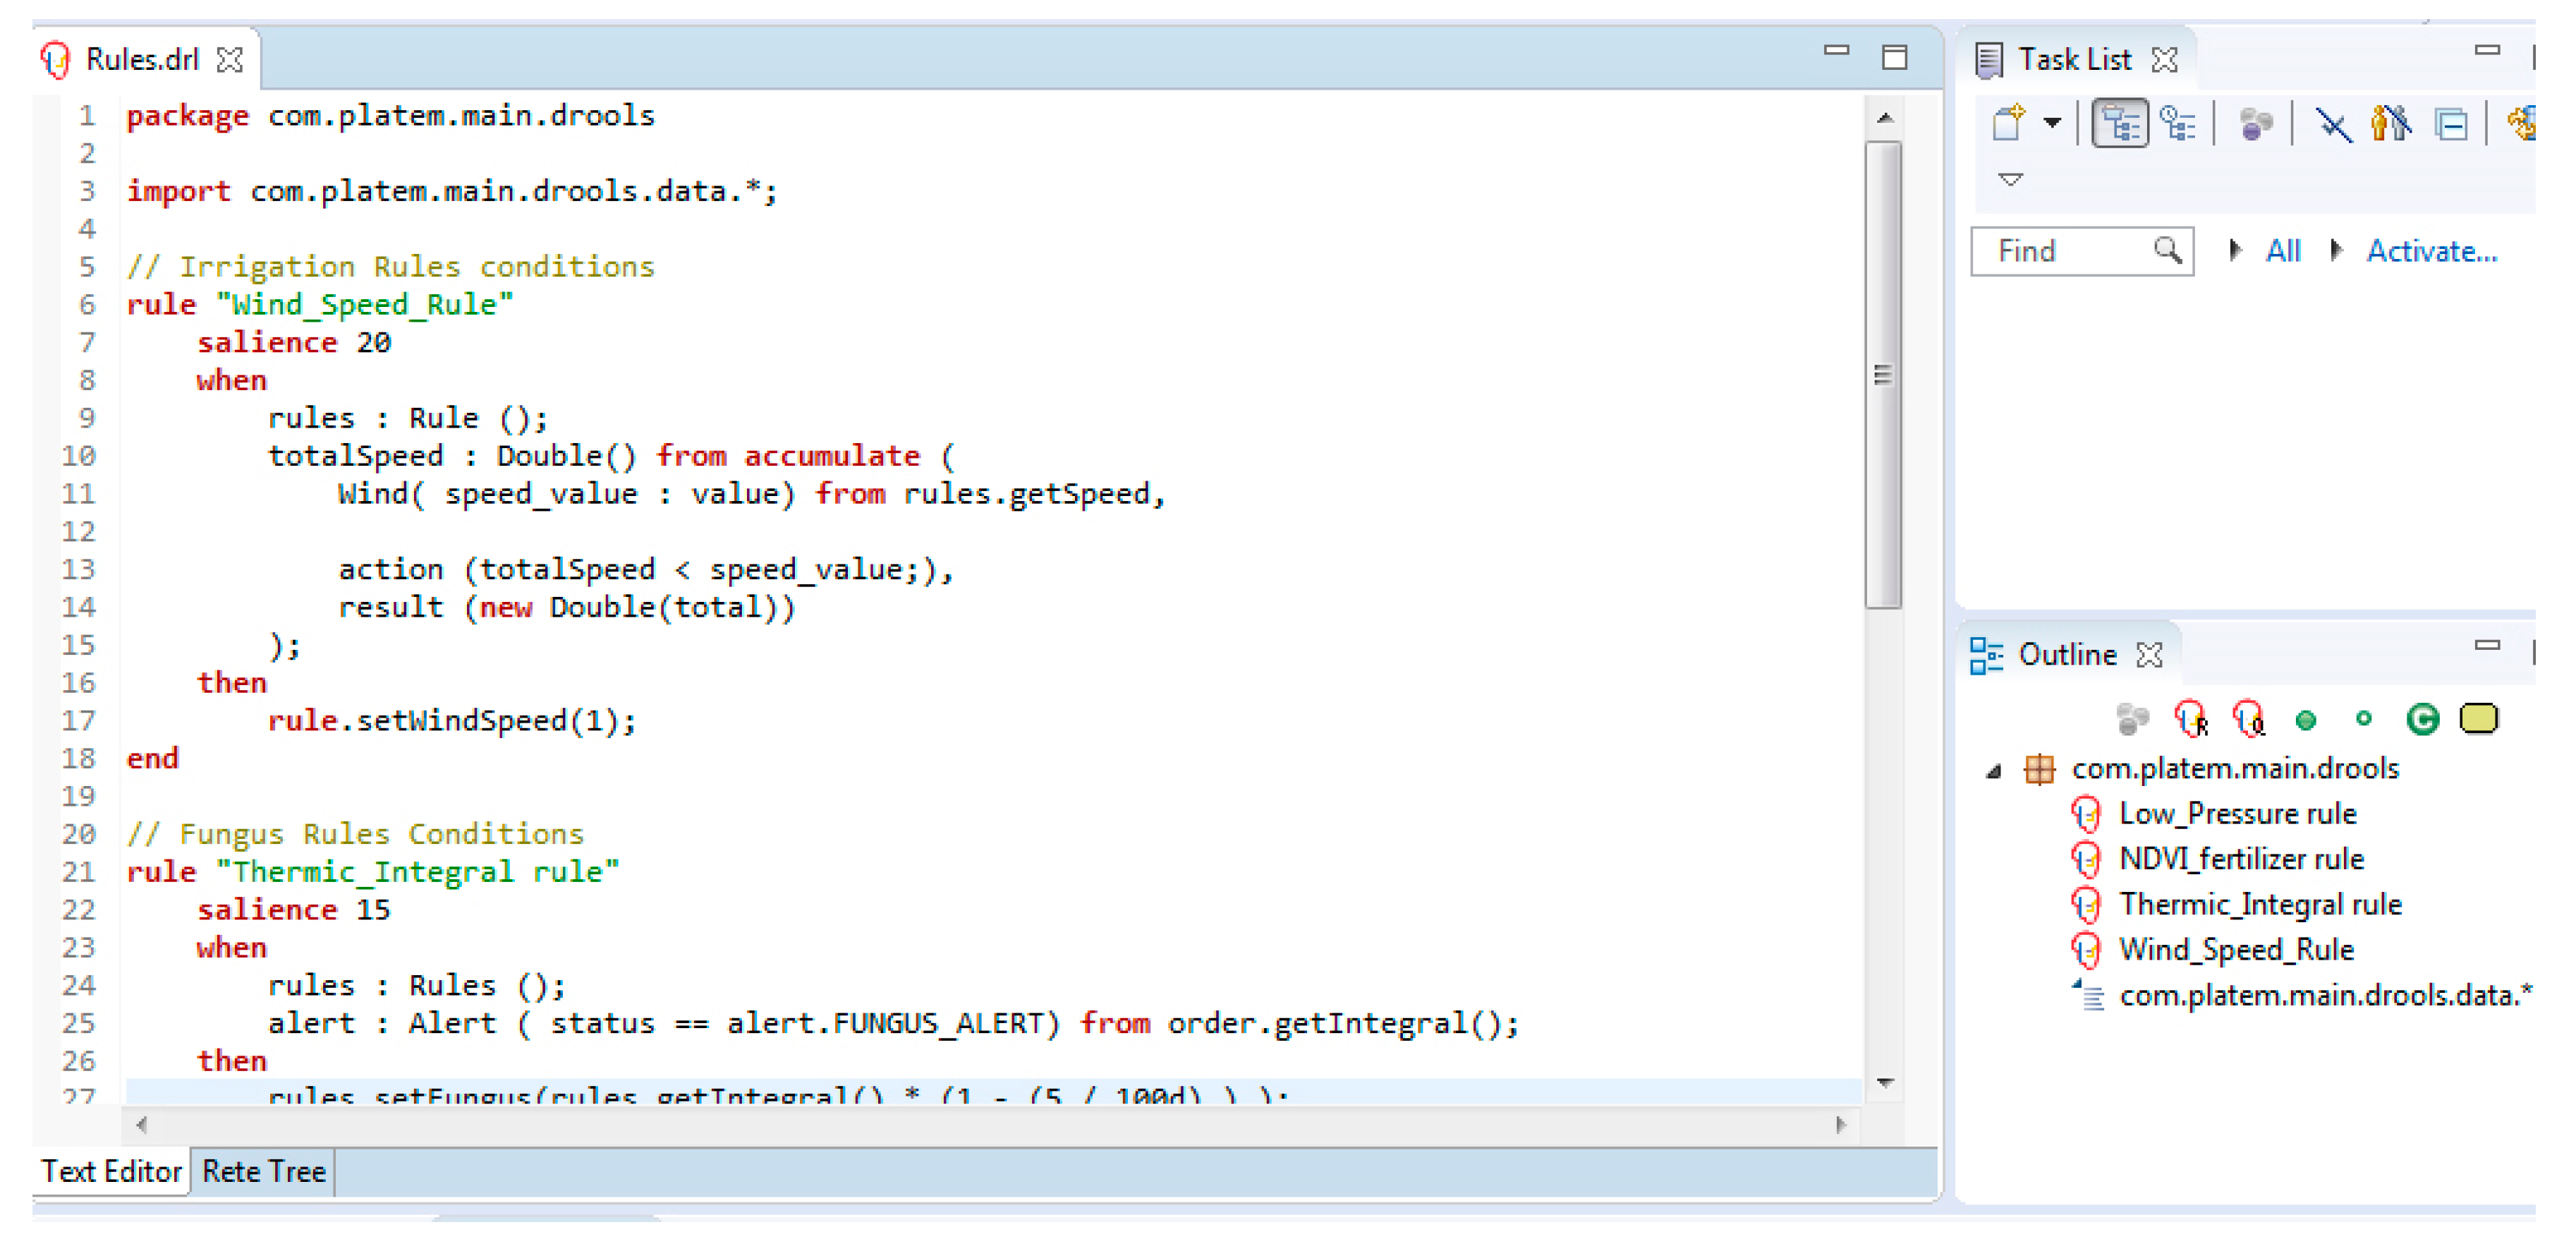
Figure 6 shows the *.drl file where basic rules for operating with Drools are located.
There are several benefits of this algorithm, such as reducing or removing redundancy and efficient memory erasure when the facts are retracted. The rule container refers to the part of the database where the rules of the system are saved. There are internal entities that contain the parameter rules of each individual rule set: system irrigation functionality, fertilization, pest control, agronomy parameter, and weather; there is a rule for each type only in the basic demo mode. The system needs to gain experiences and broker new rule-based relations. Each rule contains two main sections: the conditions section and the actions section.
The next table,
Table 2, is a resume of tools and related main features were used in the PLATEM development of its different levels.
5. Web Platform View
The last step to make the web platform usable was to develop a graphic user interface (GUI) to facilitate its use by farmers. Additionally, PLATEM should be tested in terms of data collected and operation. In this section, the web view development is presented, with the aim of offering a high usability level for non-IT-experts. PLATEM incorporates a web-based data-mining system [
21,
22]. The web provides an important interaction model for the smart farming IoT by letting users obtain device-related information and, in some cases, control their devices through the ubiquitous web browser. The conventional web is a convenience we enjoy as we search for information, irrigation Tele Management control, and post historical data in social networking. Users can refer to devices that are part of the IoT and that are directly accessed, monitored, and controlled by web technologies as the Physical Web: web technology + IoT. The web interface supports pre-processing definitions such as uploading data to DB, and post processing ones such as the data results viewer [
23]. The backend is written in PHP; the frontend is based on PHP/HTML5, CSS3, and JavaScript libraries.
The PLATEM platform is a web view application written in PHP. The user module can share restricted postings and control security. Communication is performed through a MySQL extension.
MySQL is great at performance database technology, but we see databases becoming more popular when they simply provide more and more features that are easily connectable and manageable with existing systems. The more features a database has, the easier it will be for users to develop their systems, thus making them better and raising the general level of the applications that are made through MySQL. Since MySQL is very popular, any major improvements or added features affect many people. The web view uses direct communication with Drools only in parts, with specific functionality where it is accessible through REST web services in JSON. The remaining fields interact, such as: make a post, likes, upload images, write commentaries to status or in images, search and list friends, friend request (send and accept), send messages to friends. They are all accessible through the web interface without setters to the rule engine.
In addition, there is a settings view to update user profiles that is accessible to friends, which can be edited (clicking on Edit Information). The next important point is a notifications menu located on the top-right of the screen in main view, where the notification icons flash for alerts/notifications, friends, and messages.
The user can search for other users in the database by writing the name in edit text “Search People,” and can view an open profile, send a message, and add a name to a list of friends.
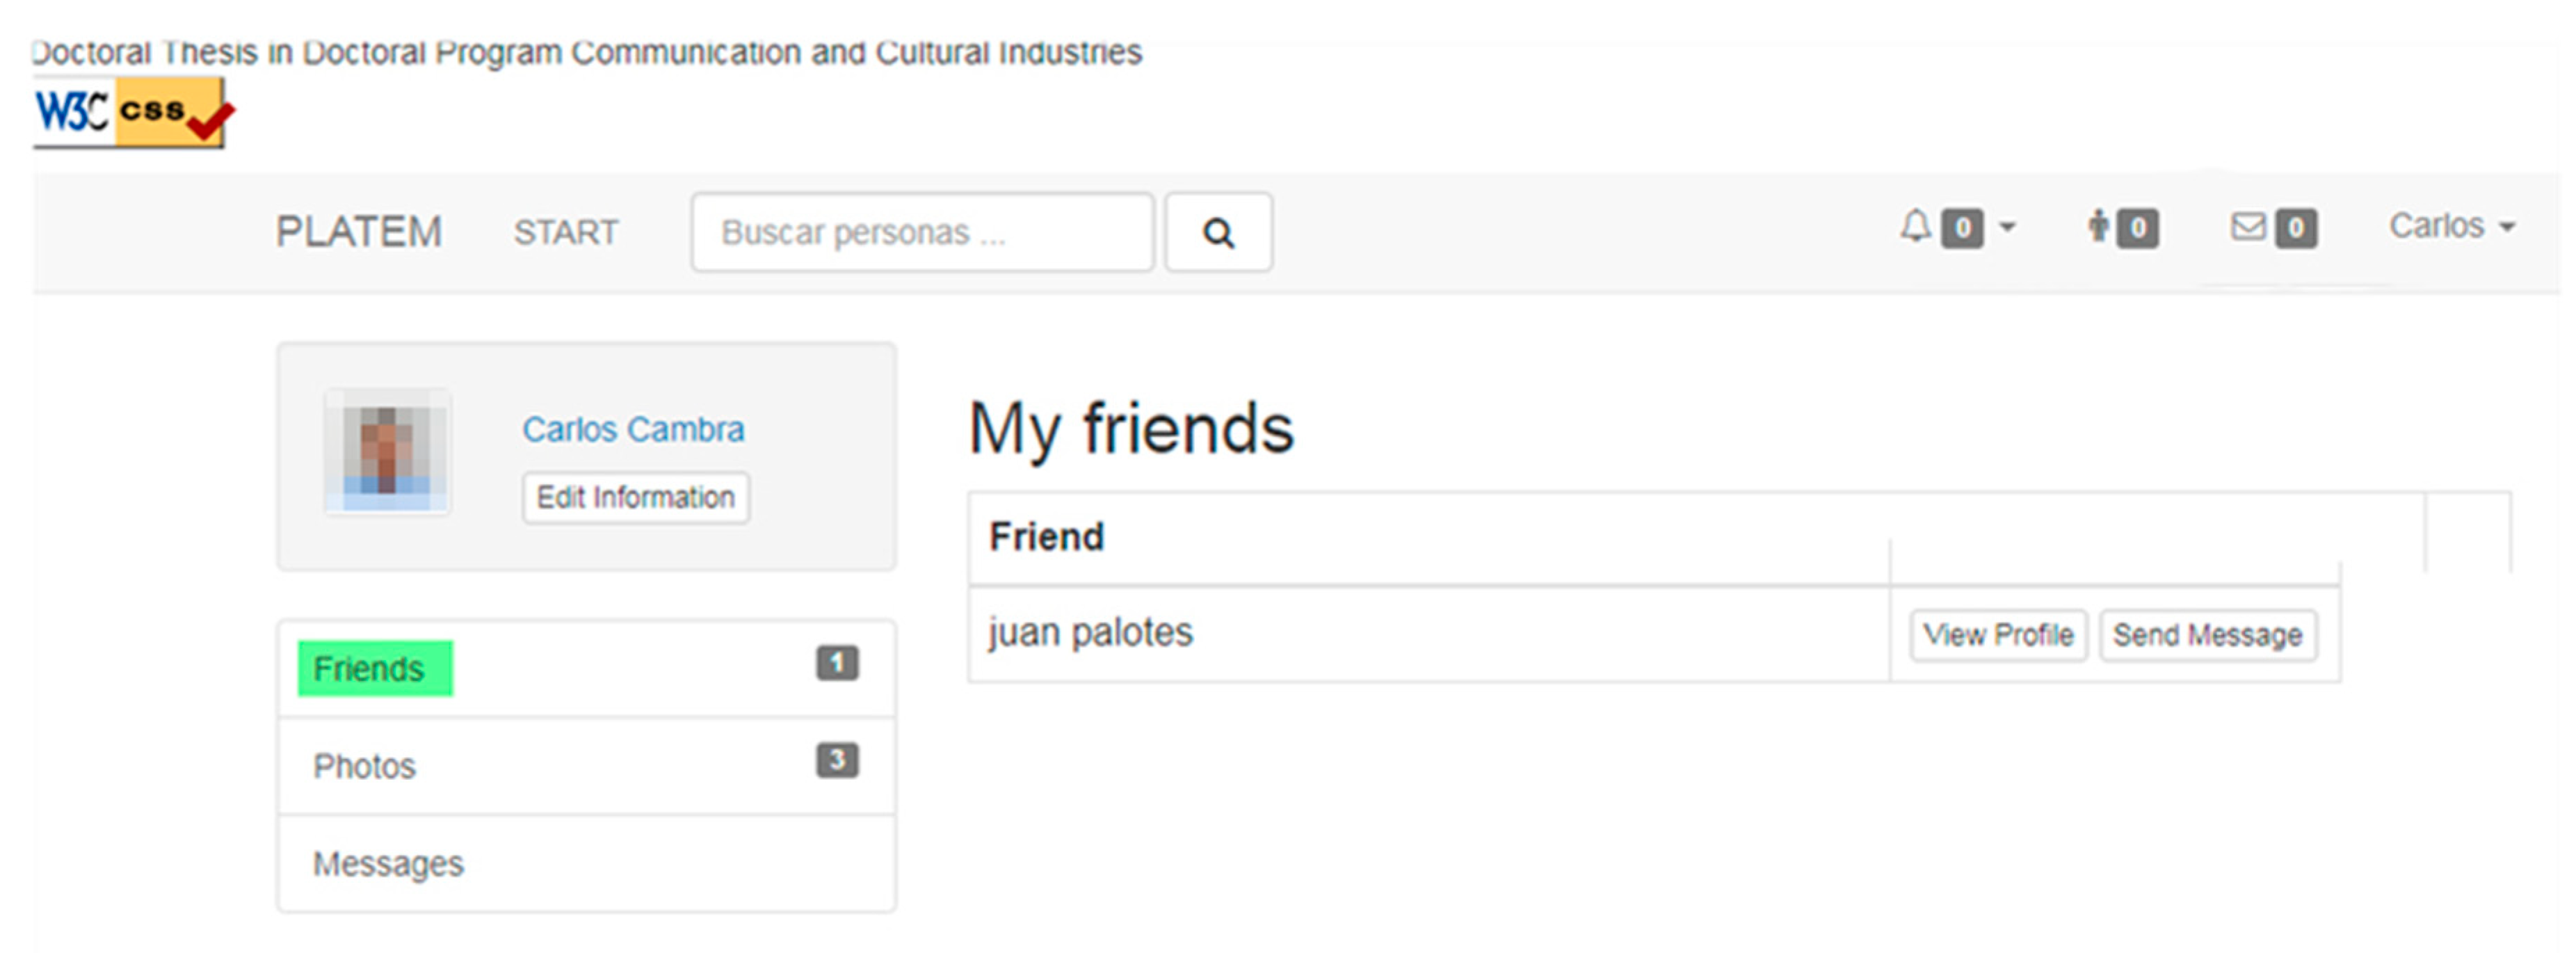
Figure 7 shows the My Friends list with a “View profile” button and “Send message” button.
Testing Scenario
In this section, the performance results will be explained at the level of erroneous data, in the sensor environments, and in the traffic generated for two different transmission scenarios. The network server analysis, another important aspect, shows the server bandwidth.
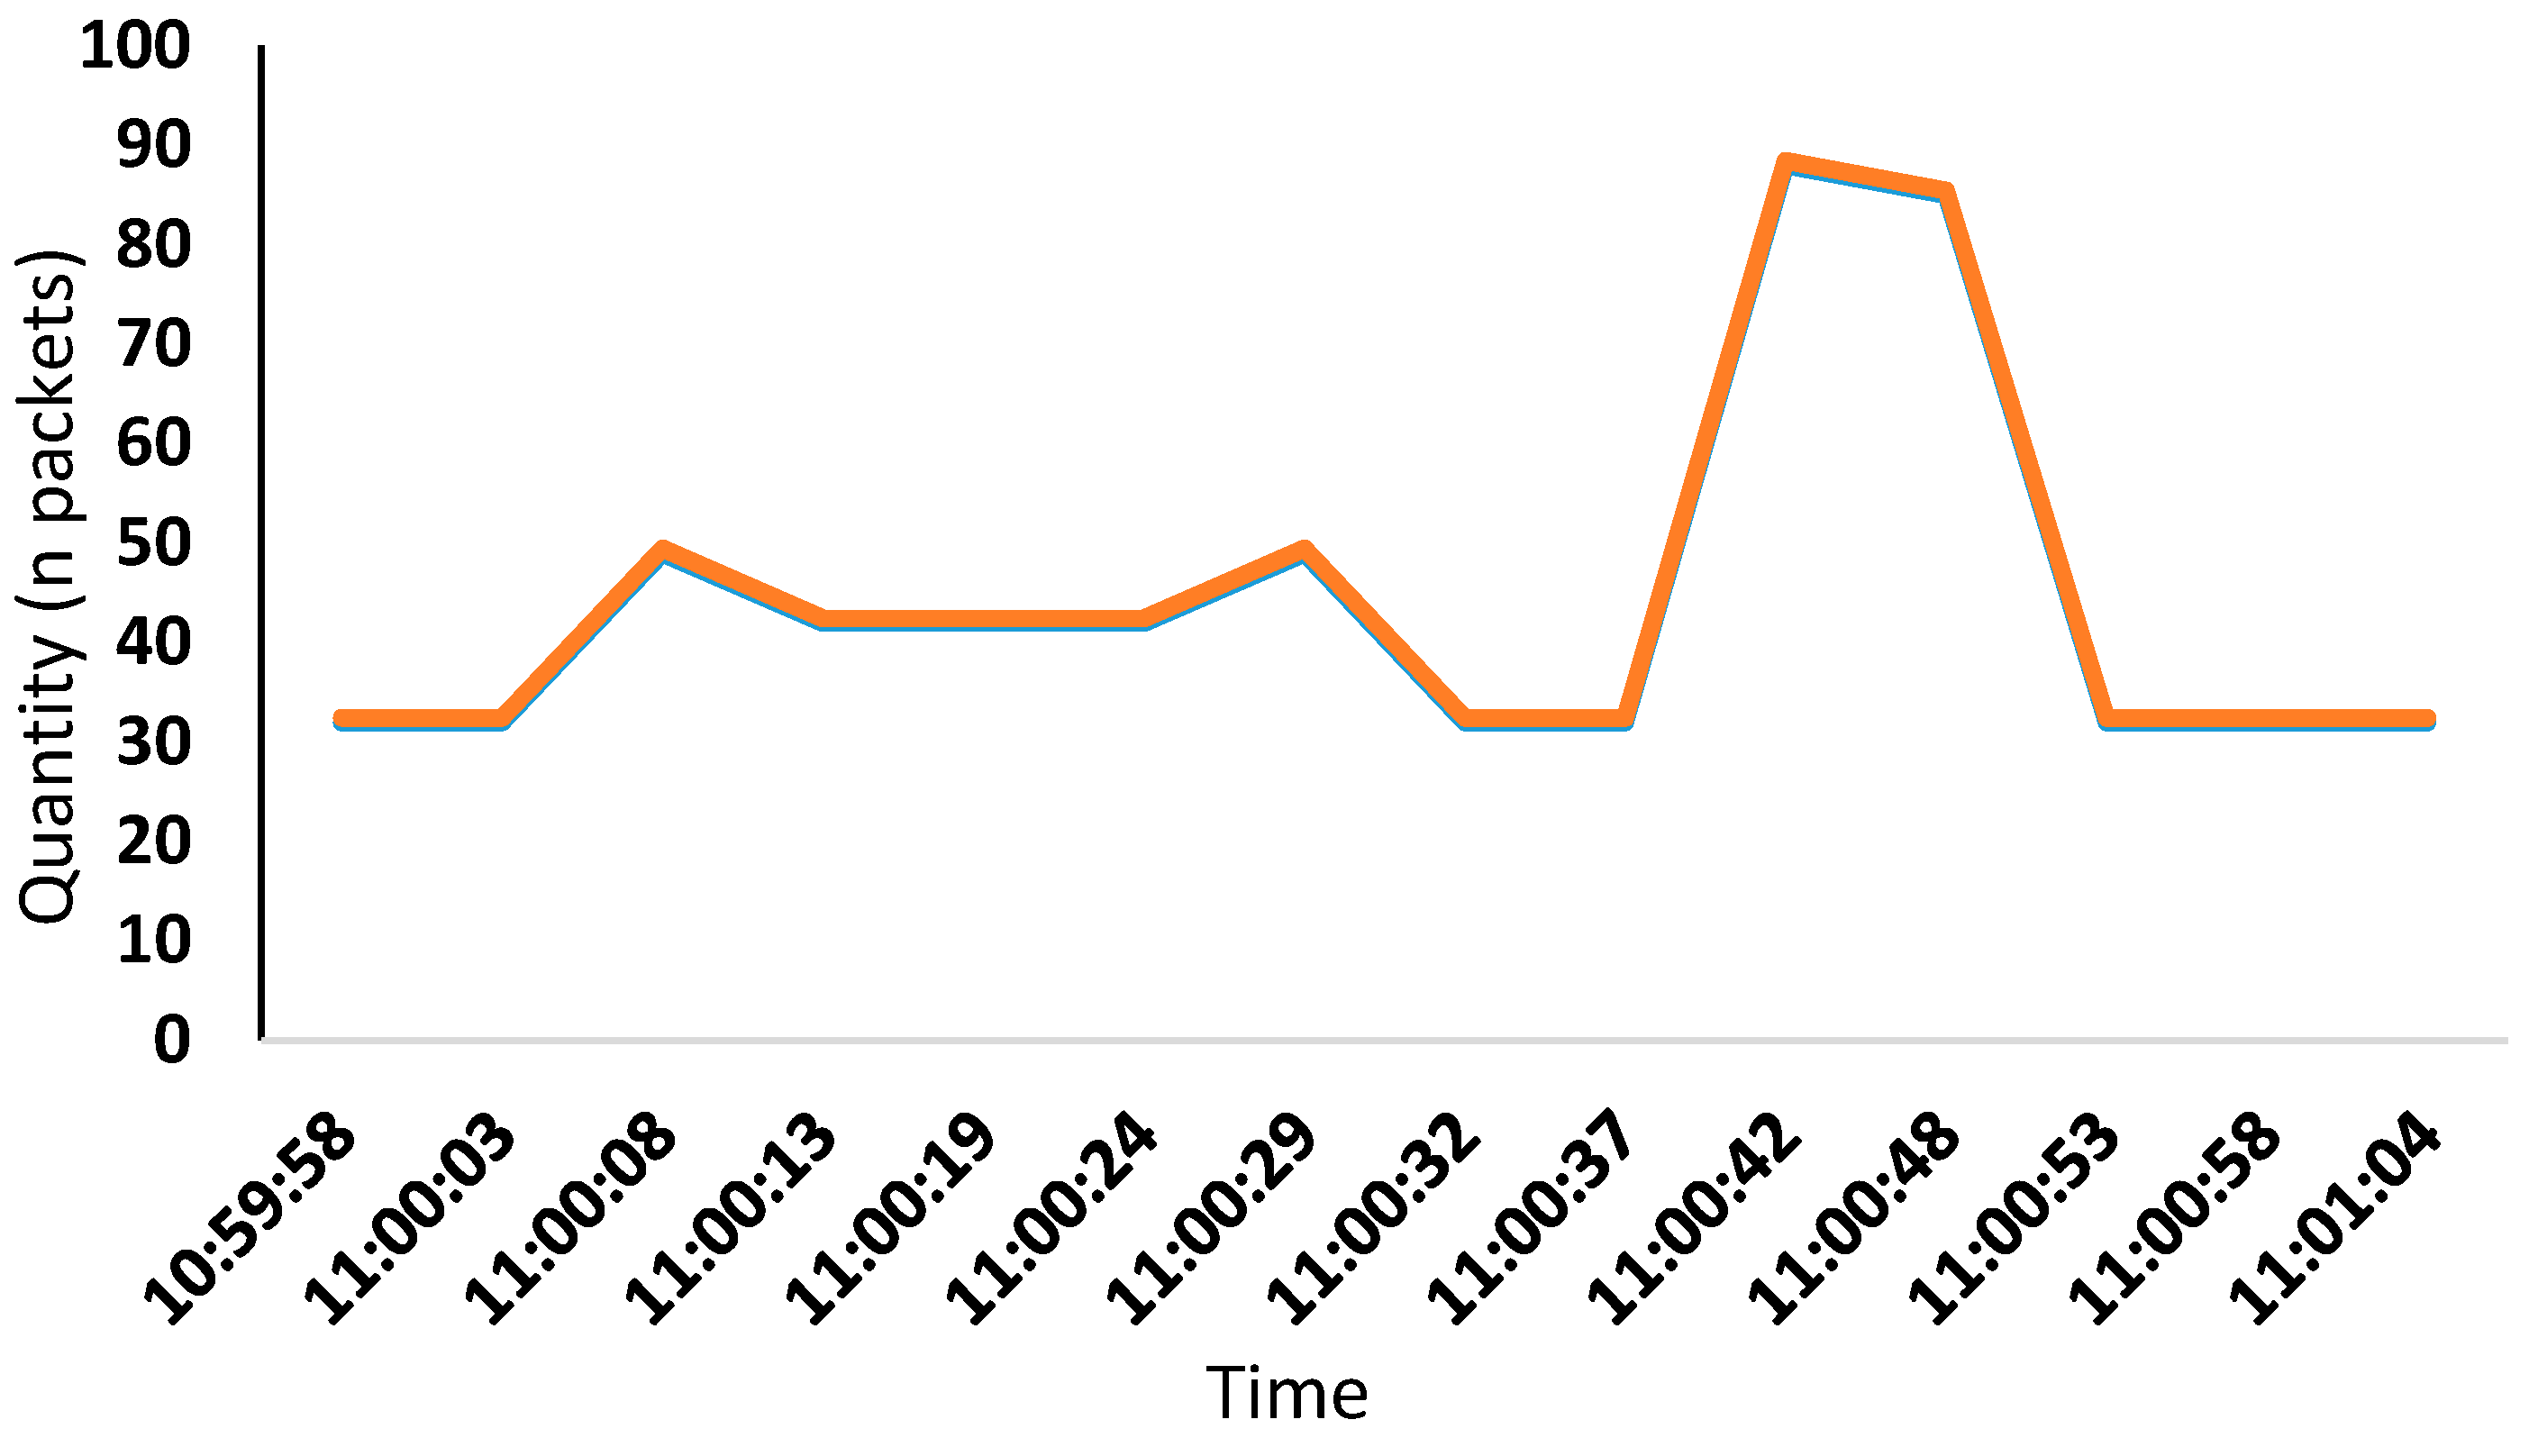
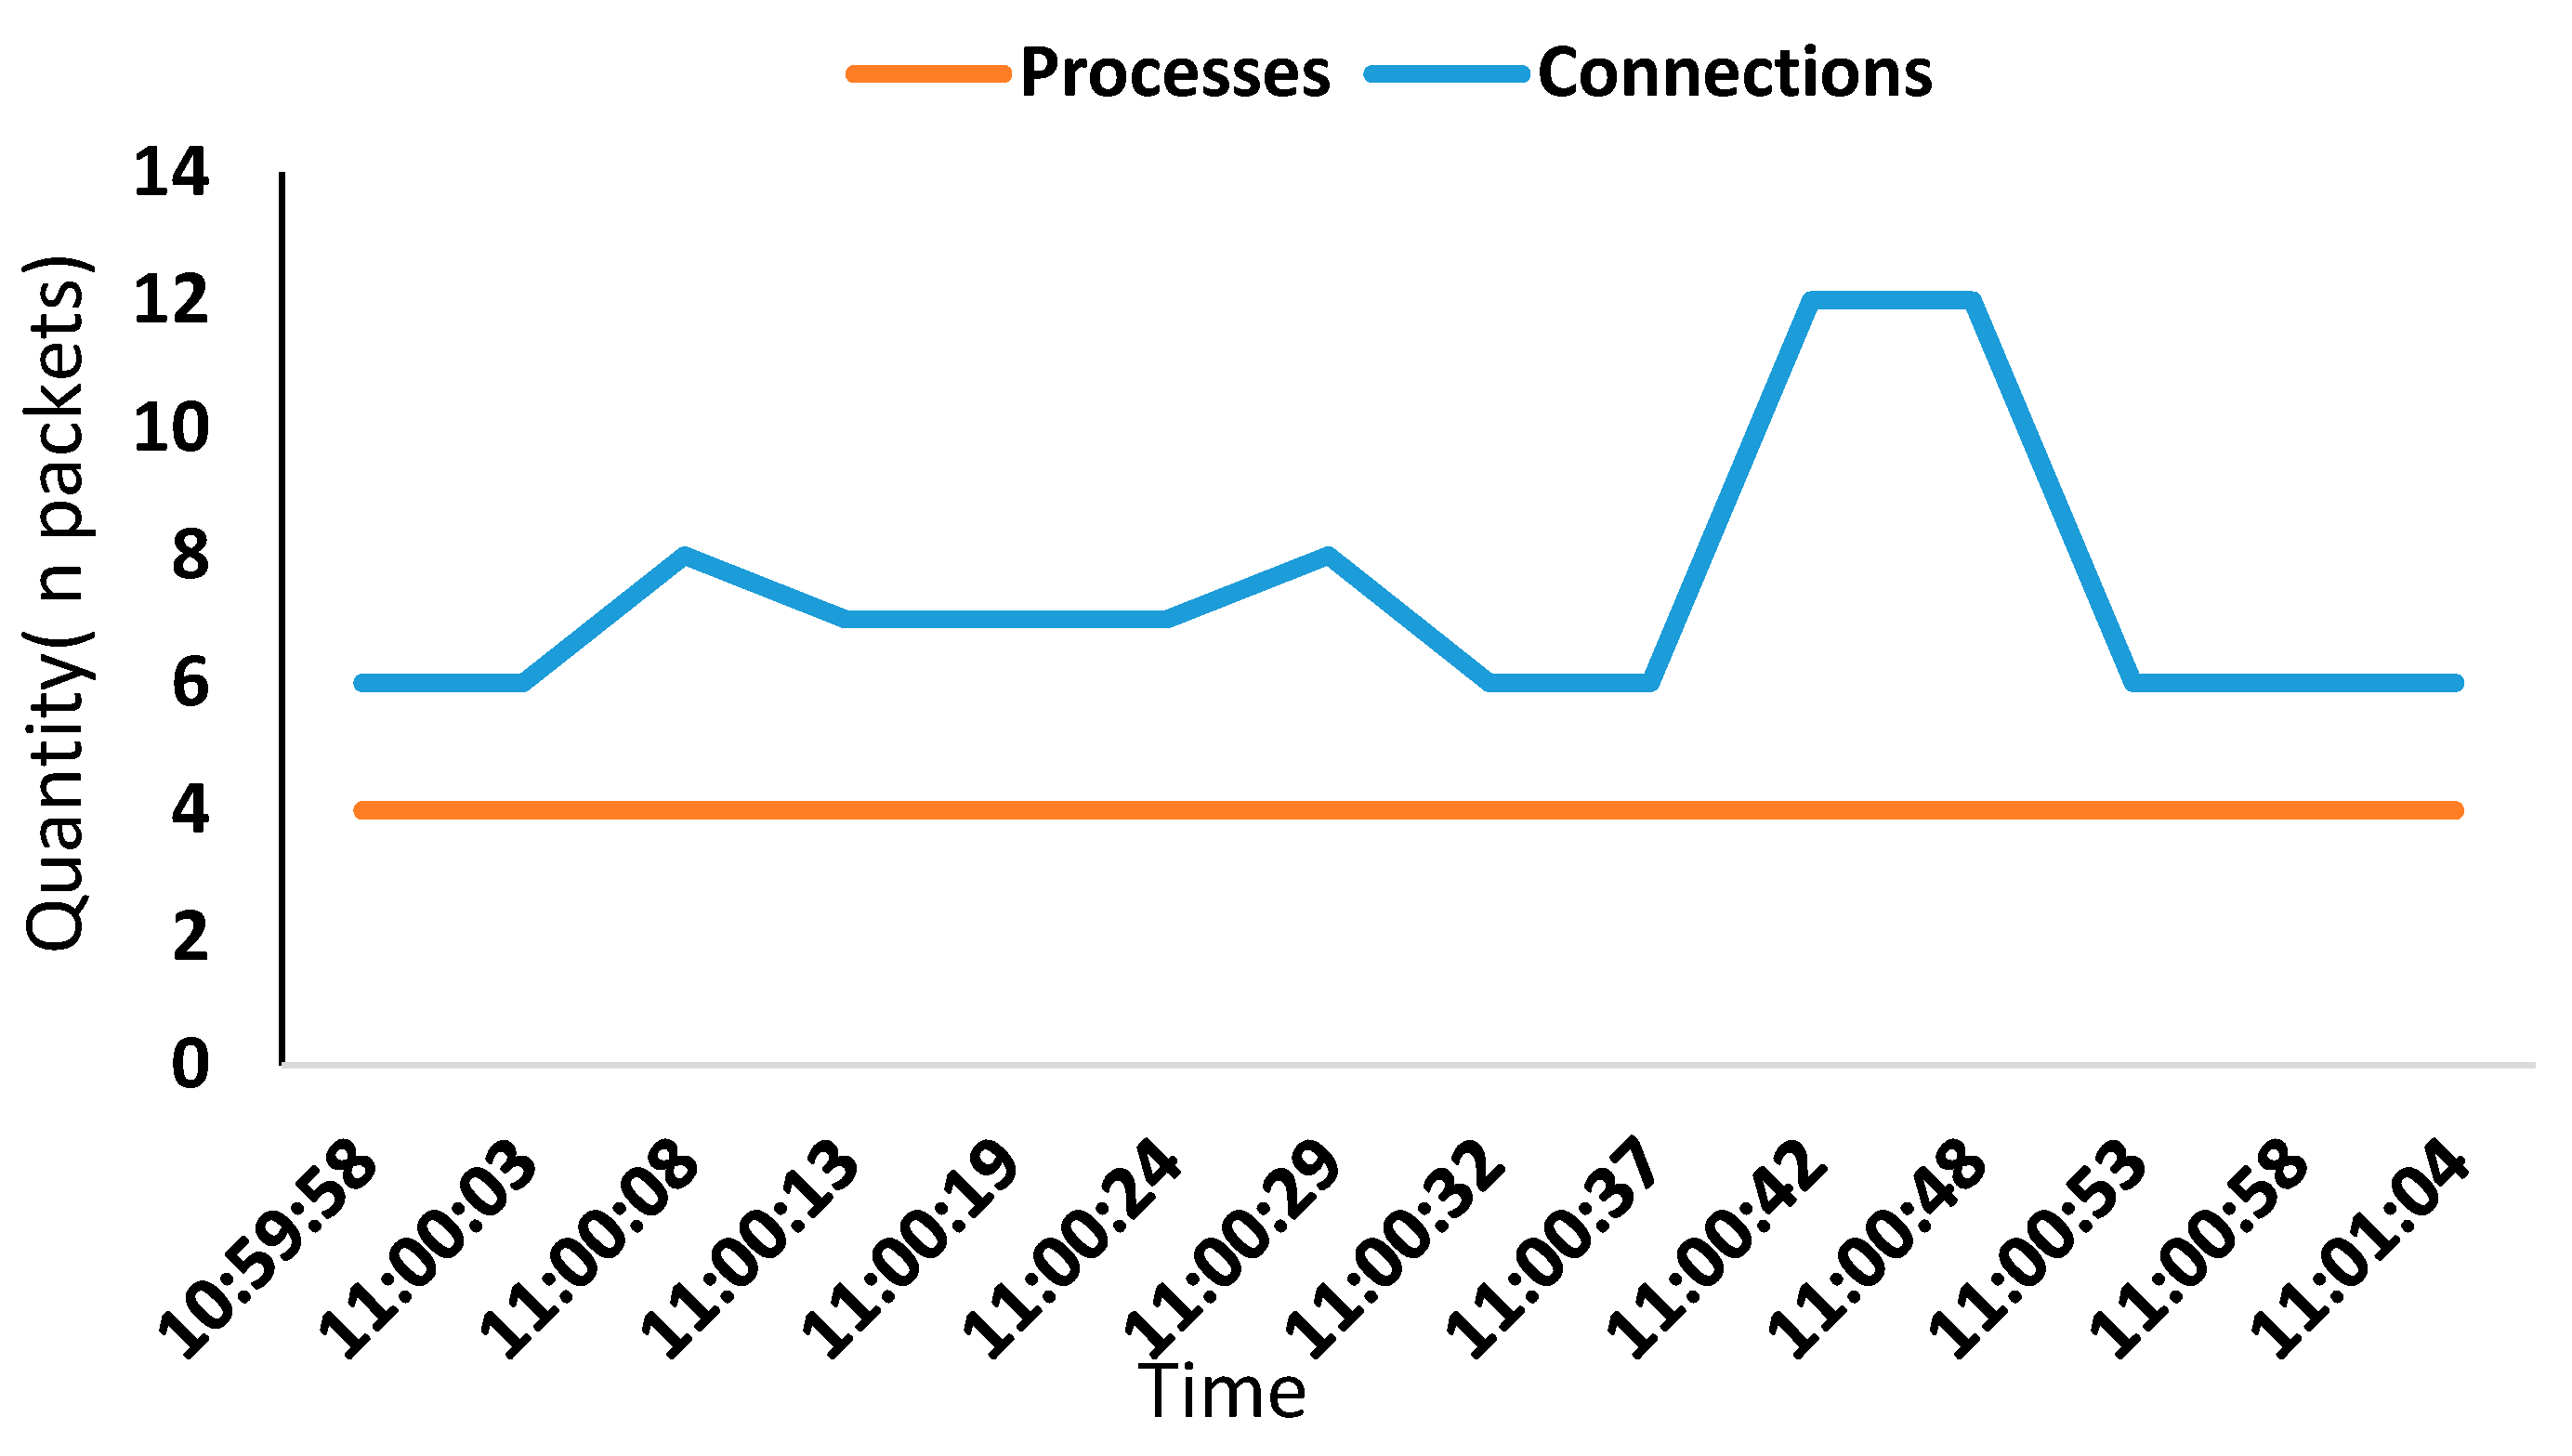
A real scenario was simulated with virtual users where they pretended to be farmers in action, making queries and publications in their virtual profiles to check the server response capacity, in which a query was analyzed and the data were simultaneously fed into the database and the connections. The results were very positive, with low usage of system capacity.
Figure 8 shows a sample of the server test. On the first graphs, the number of queries appear, and a login action test period with several database queries.
Figure 9 shows a sample of the server test. The graph shows that the number of connections to DB is in a period of login action.
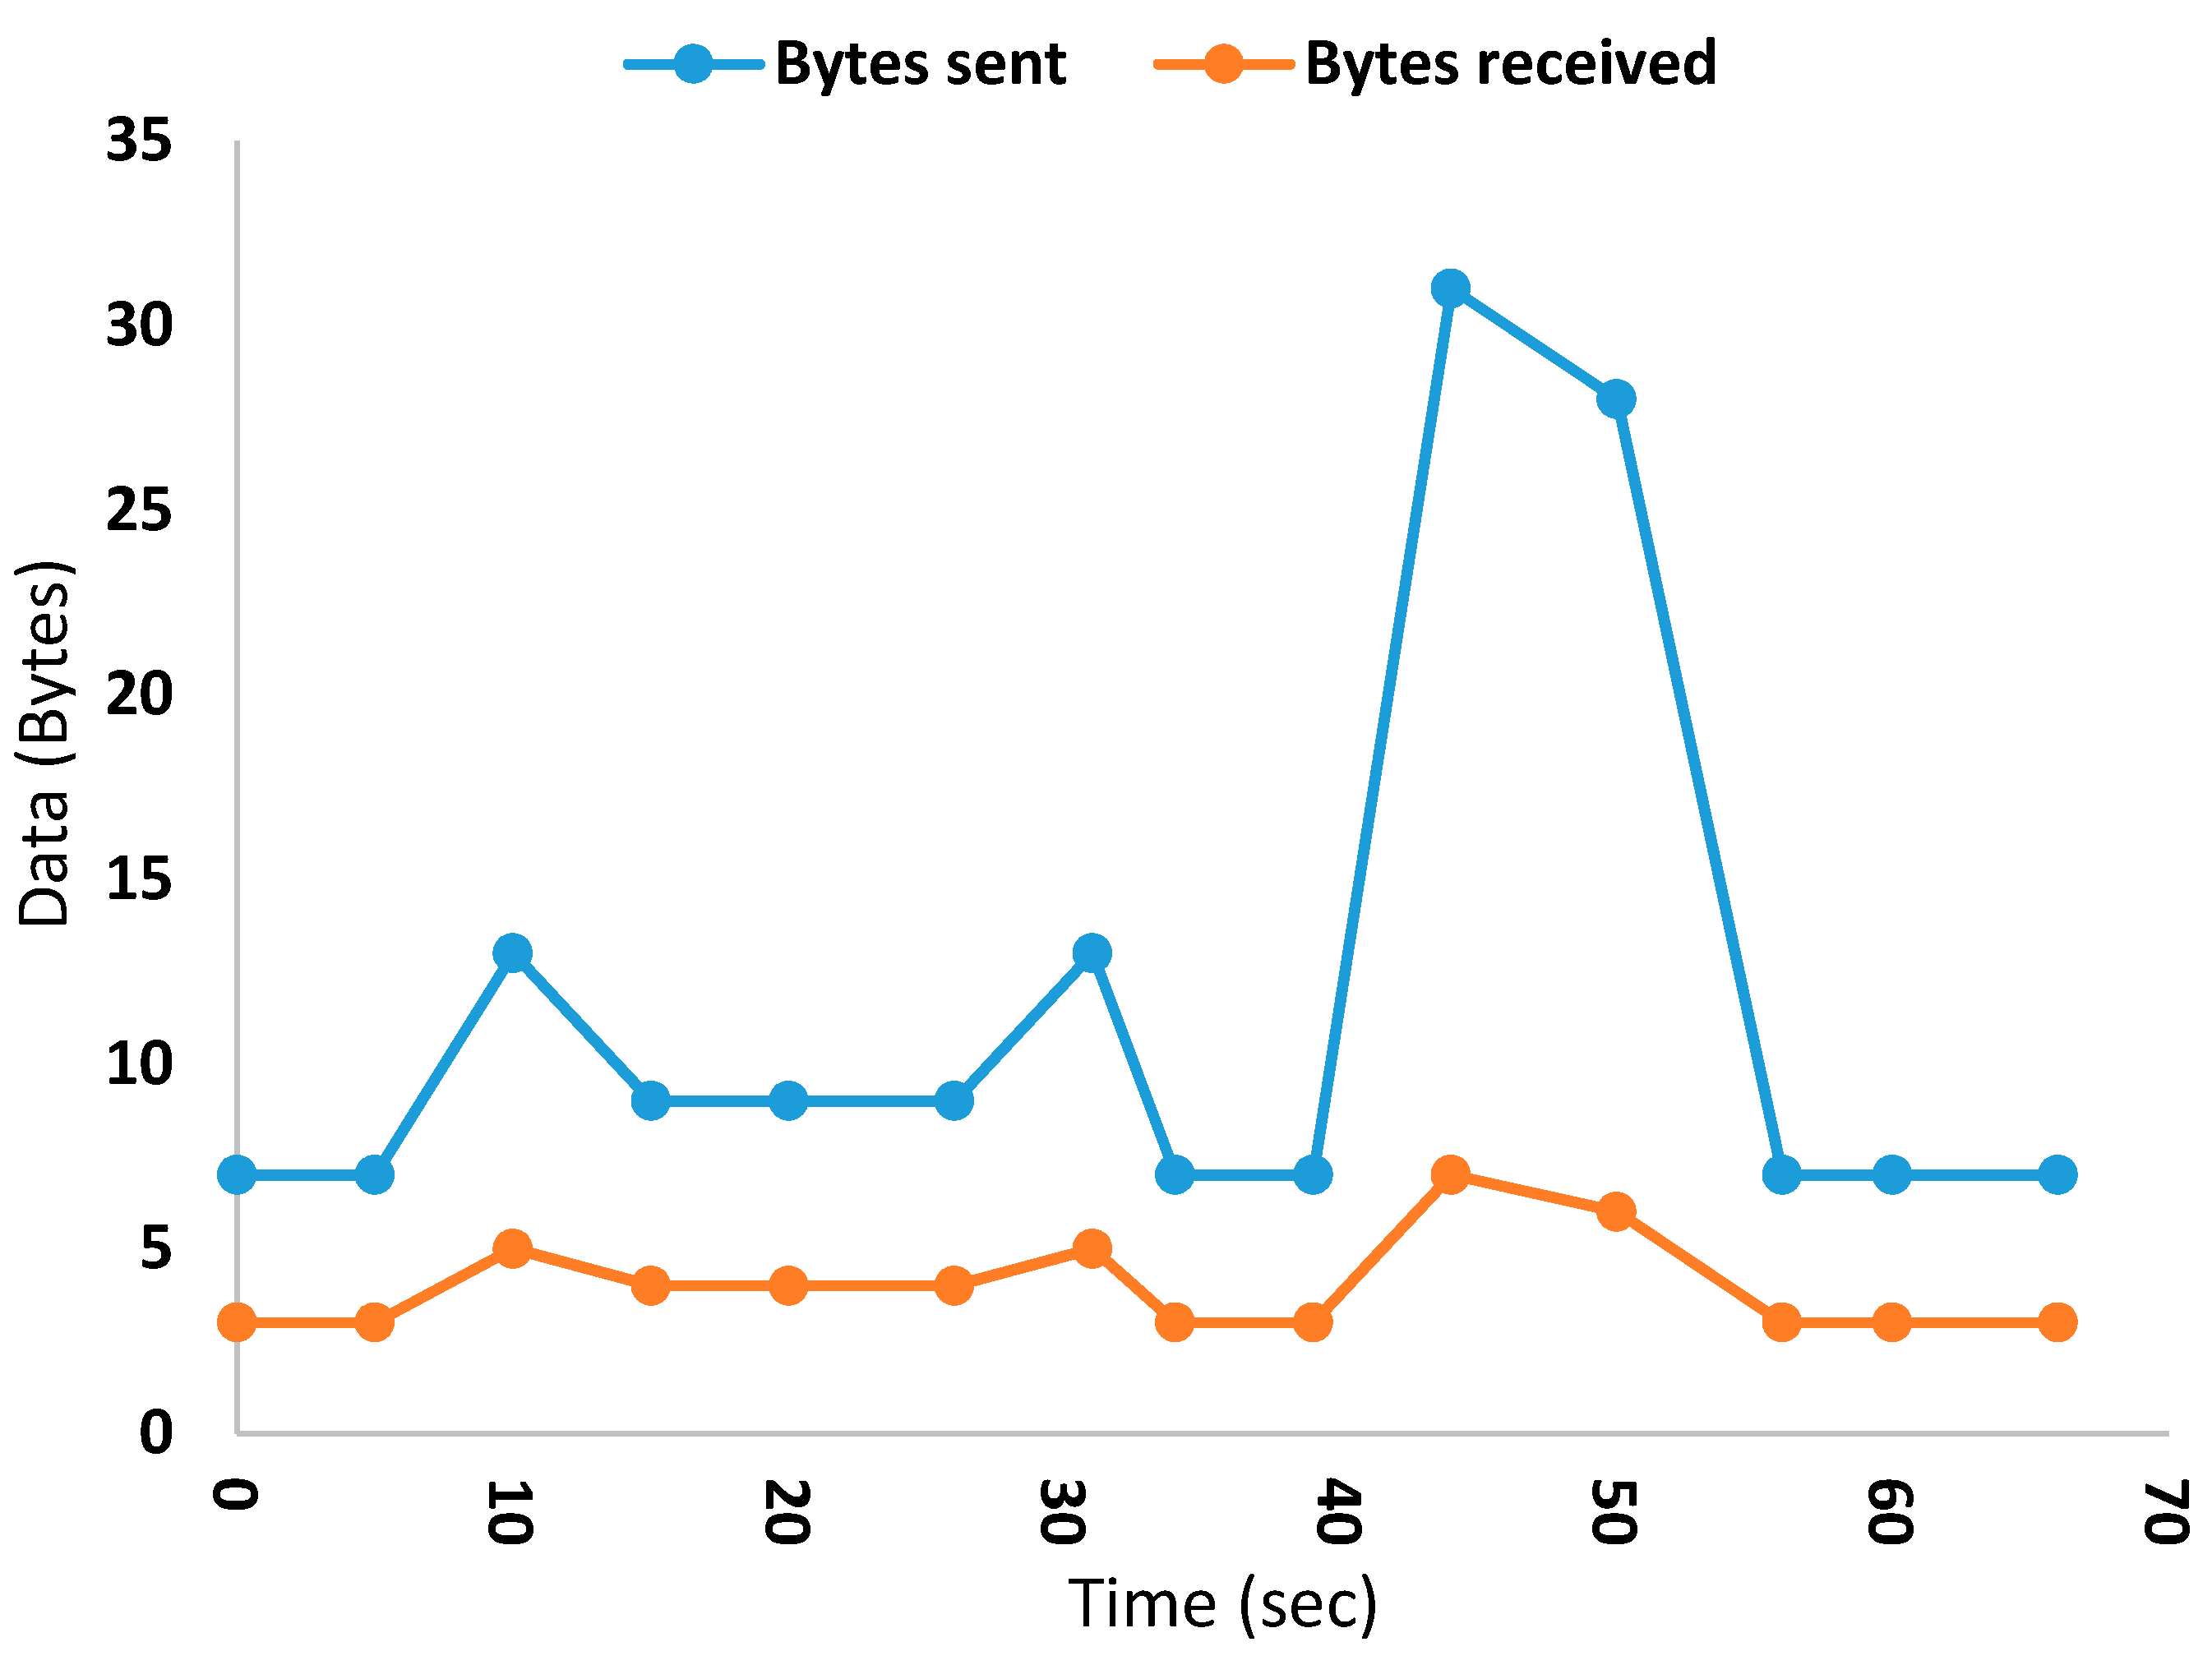
Network traffic can be displayed, as shown in
Figure 10. The insert process starts when PLATEM adds the user as new friend, and a request can then be sent to the user.
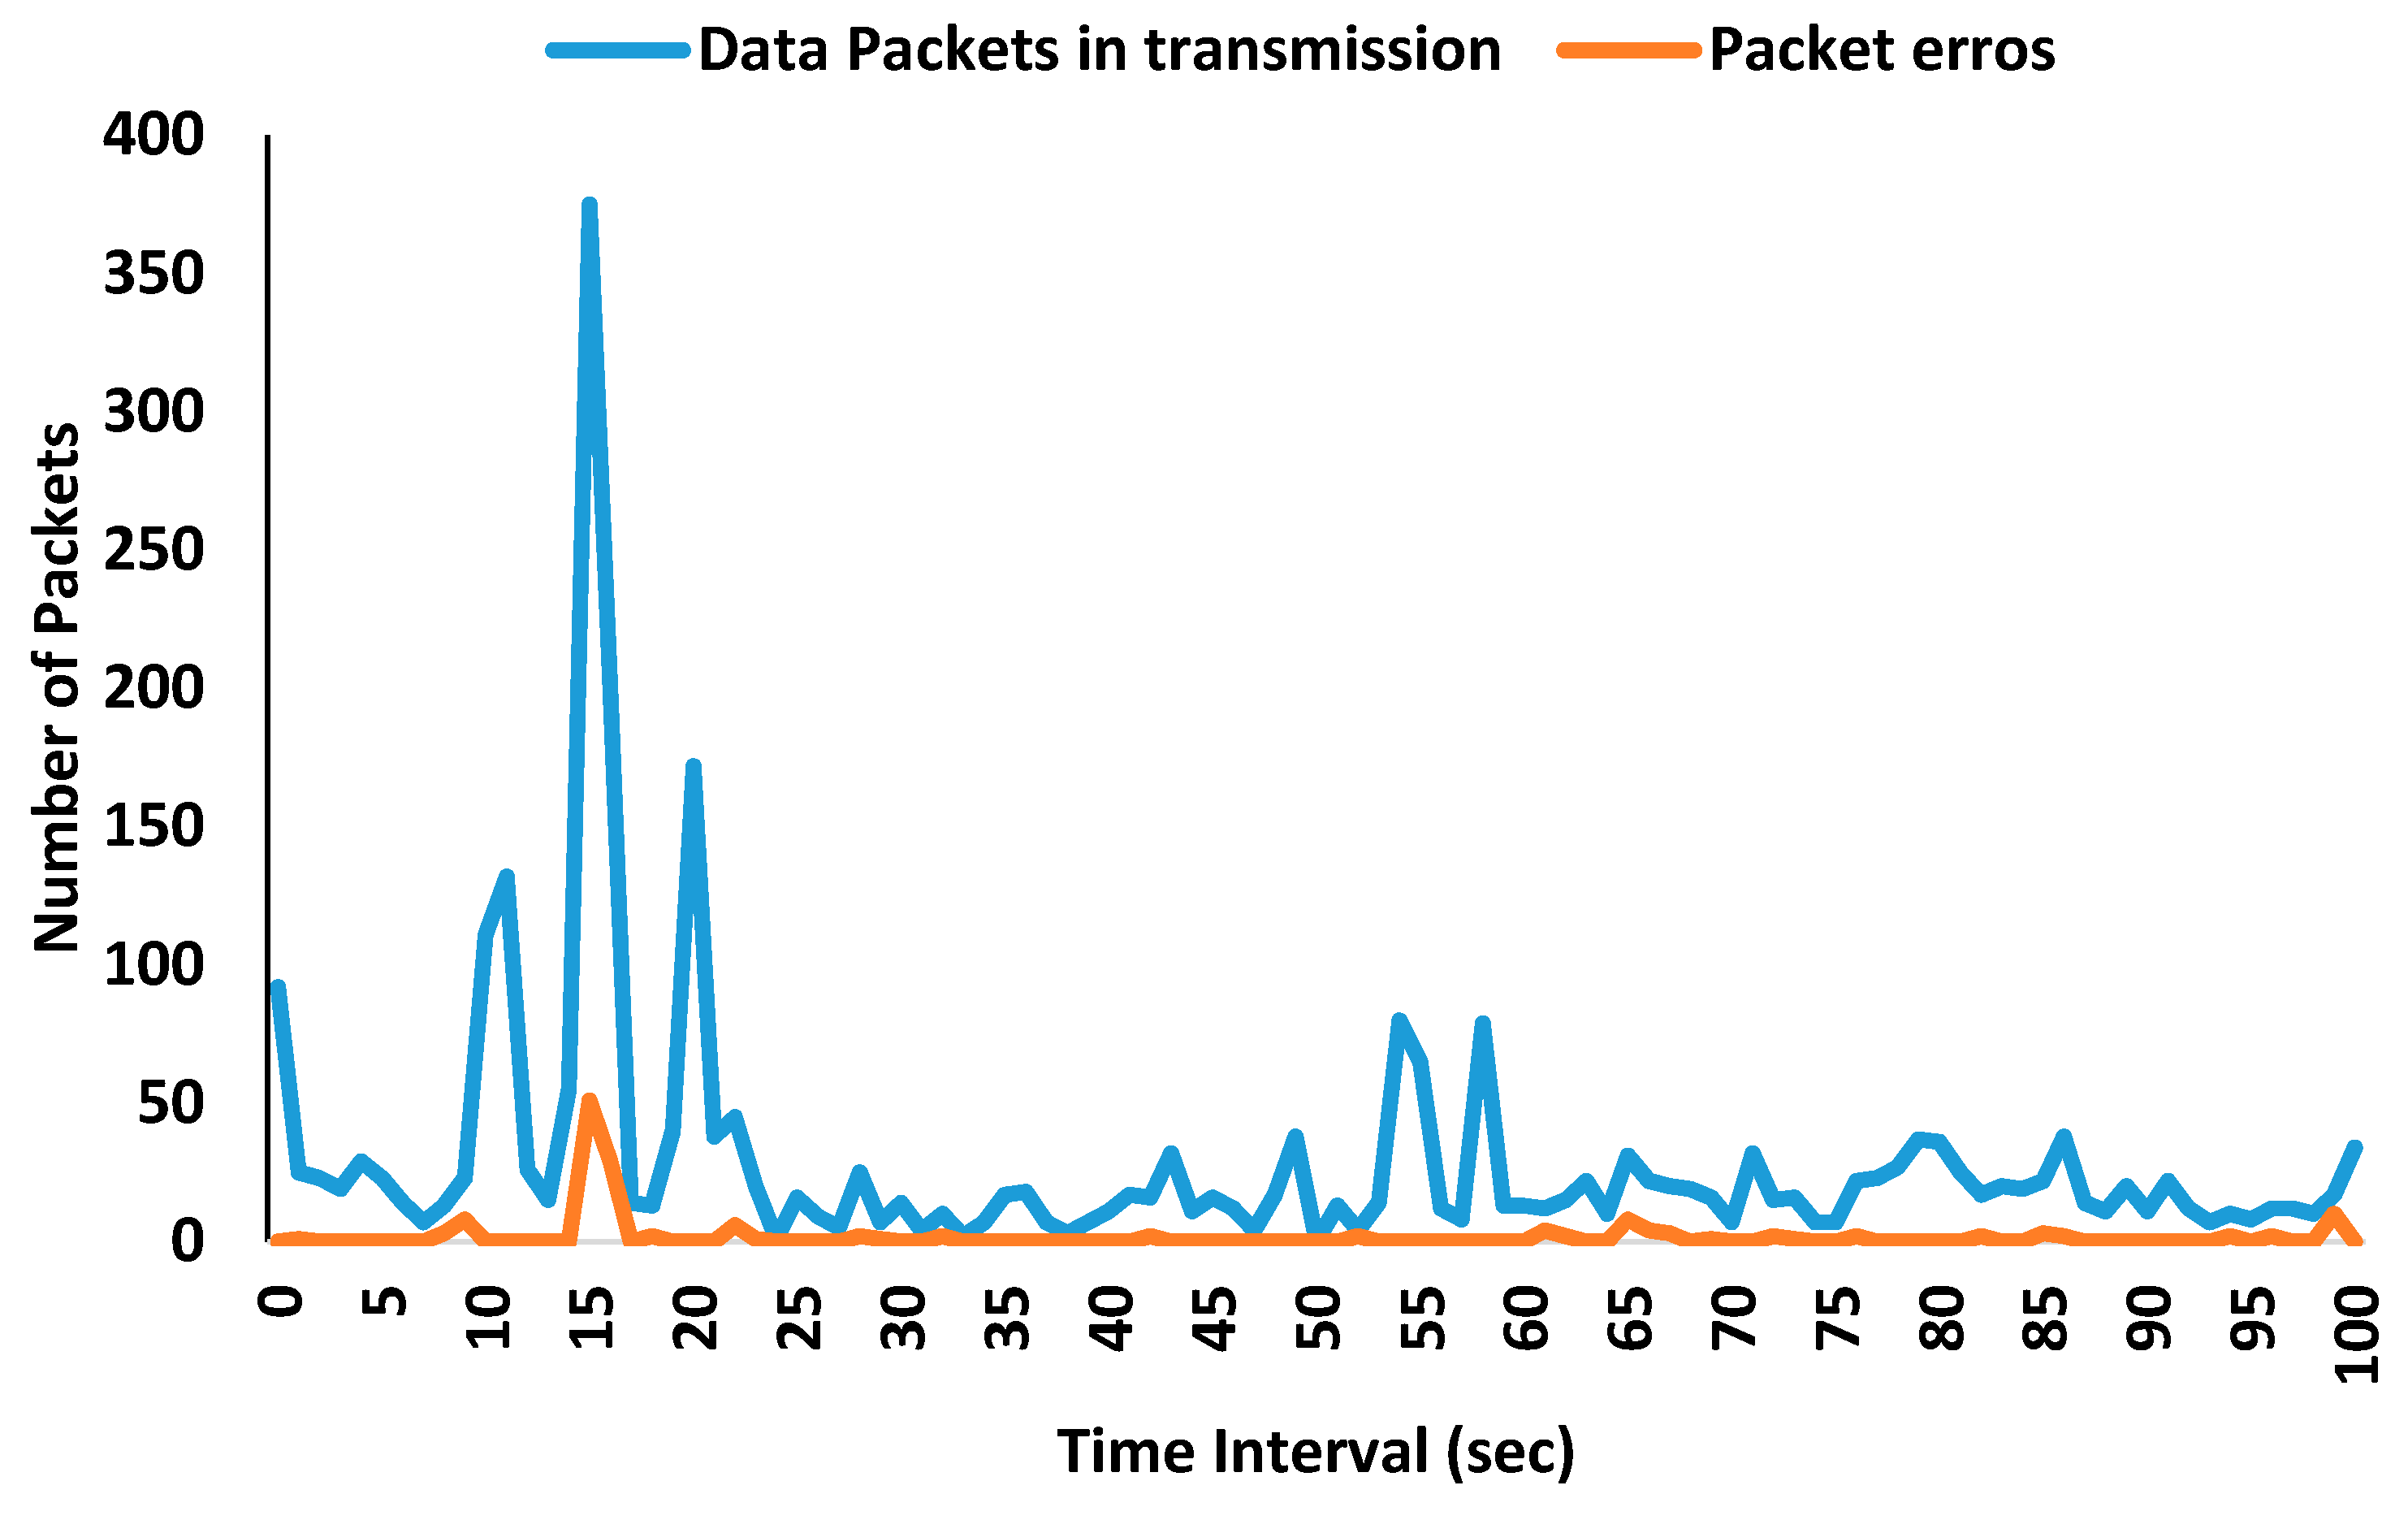
The capture generated by Wireshark of the server bandwidth and response time test during user posting of an uploaded image on the social network can be seen in
Figure 11. This scenario implies the dedication of network server resources at a high level. Optimal performance of this task is the key to the proper functioning of the system. It is possible to analyze user queries and server data responses, where the length of each package is marked with the server response time. It may be the case that the data are images or big data sets. The server was capable of facilitating basic navigation for many users on the multimedia platform where many sender packets are ACKs, but server communications were congested when responding to big data, such as images, tables of historical data, and some user posts. The network analysis was based on uploaded messages with image posting, and the server network had to allocate additional resources for uploading and saving images.
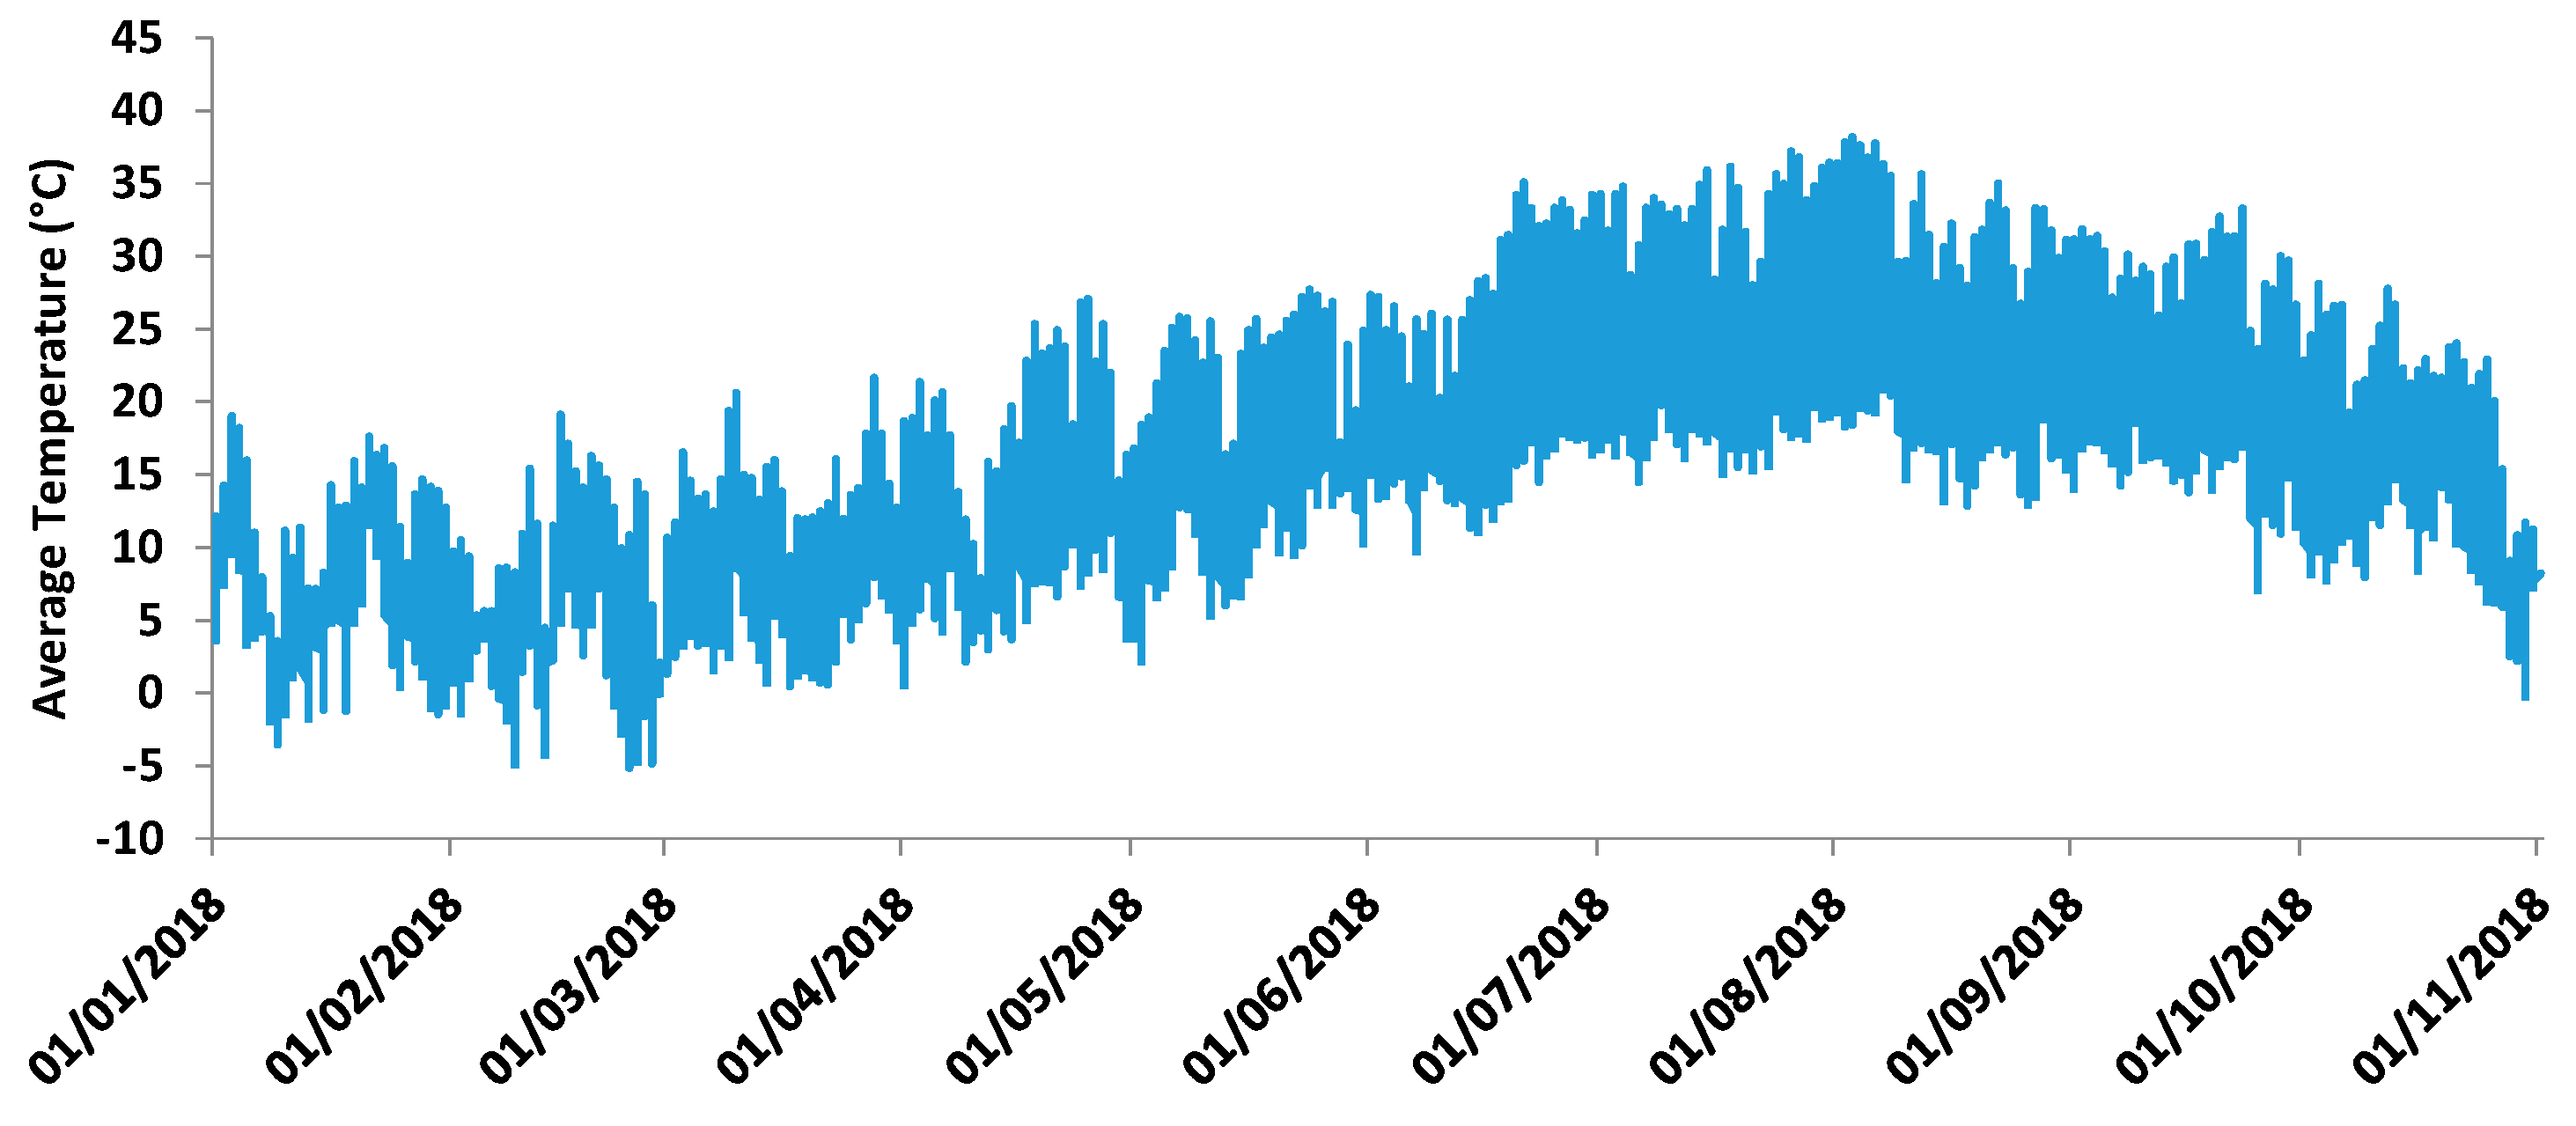
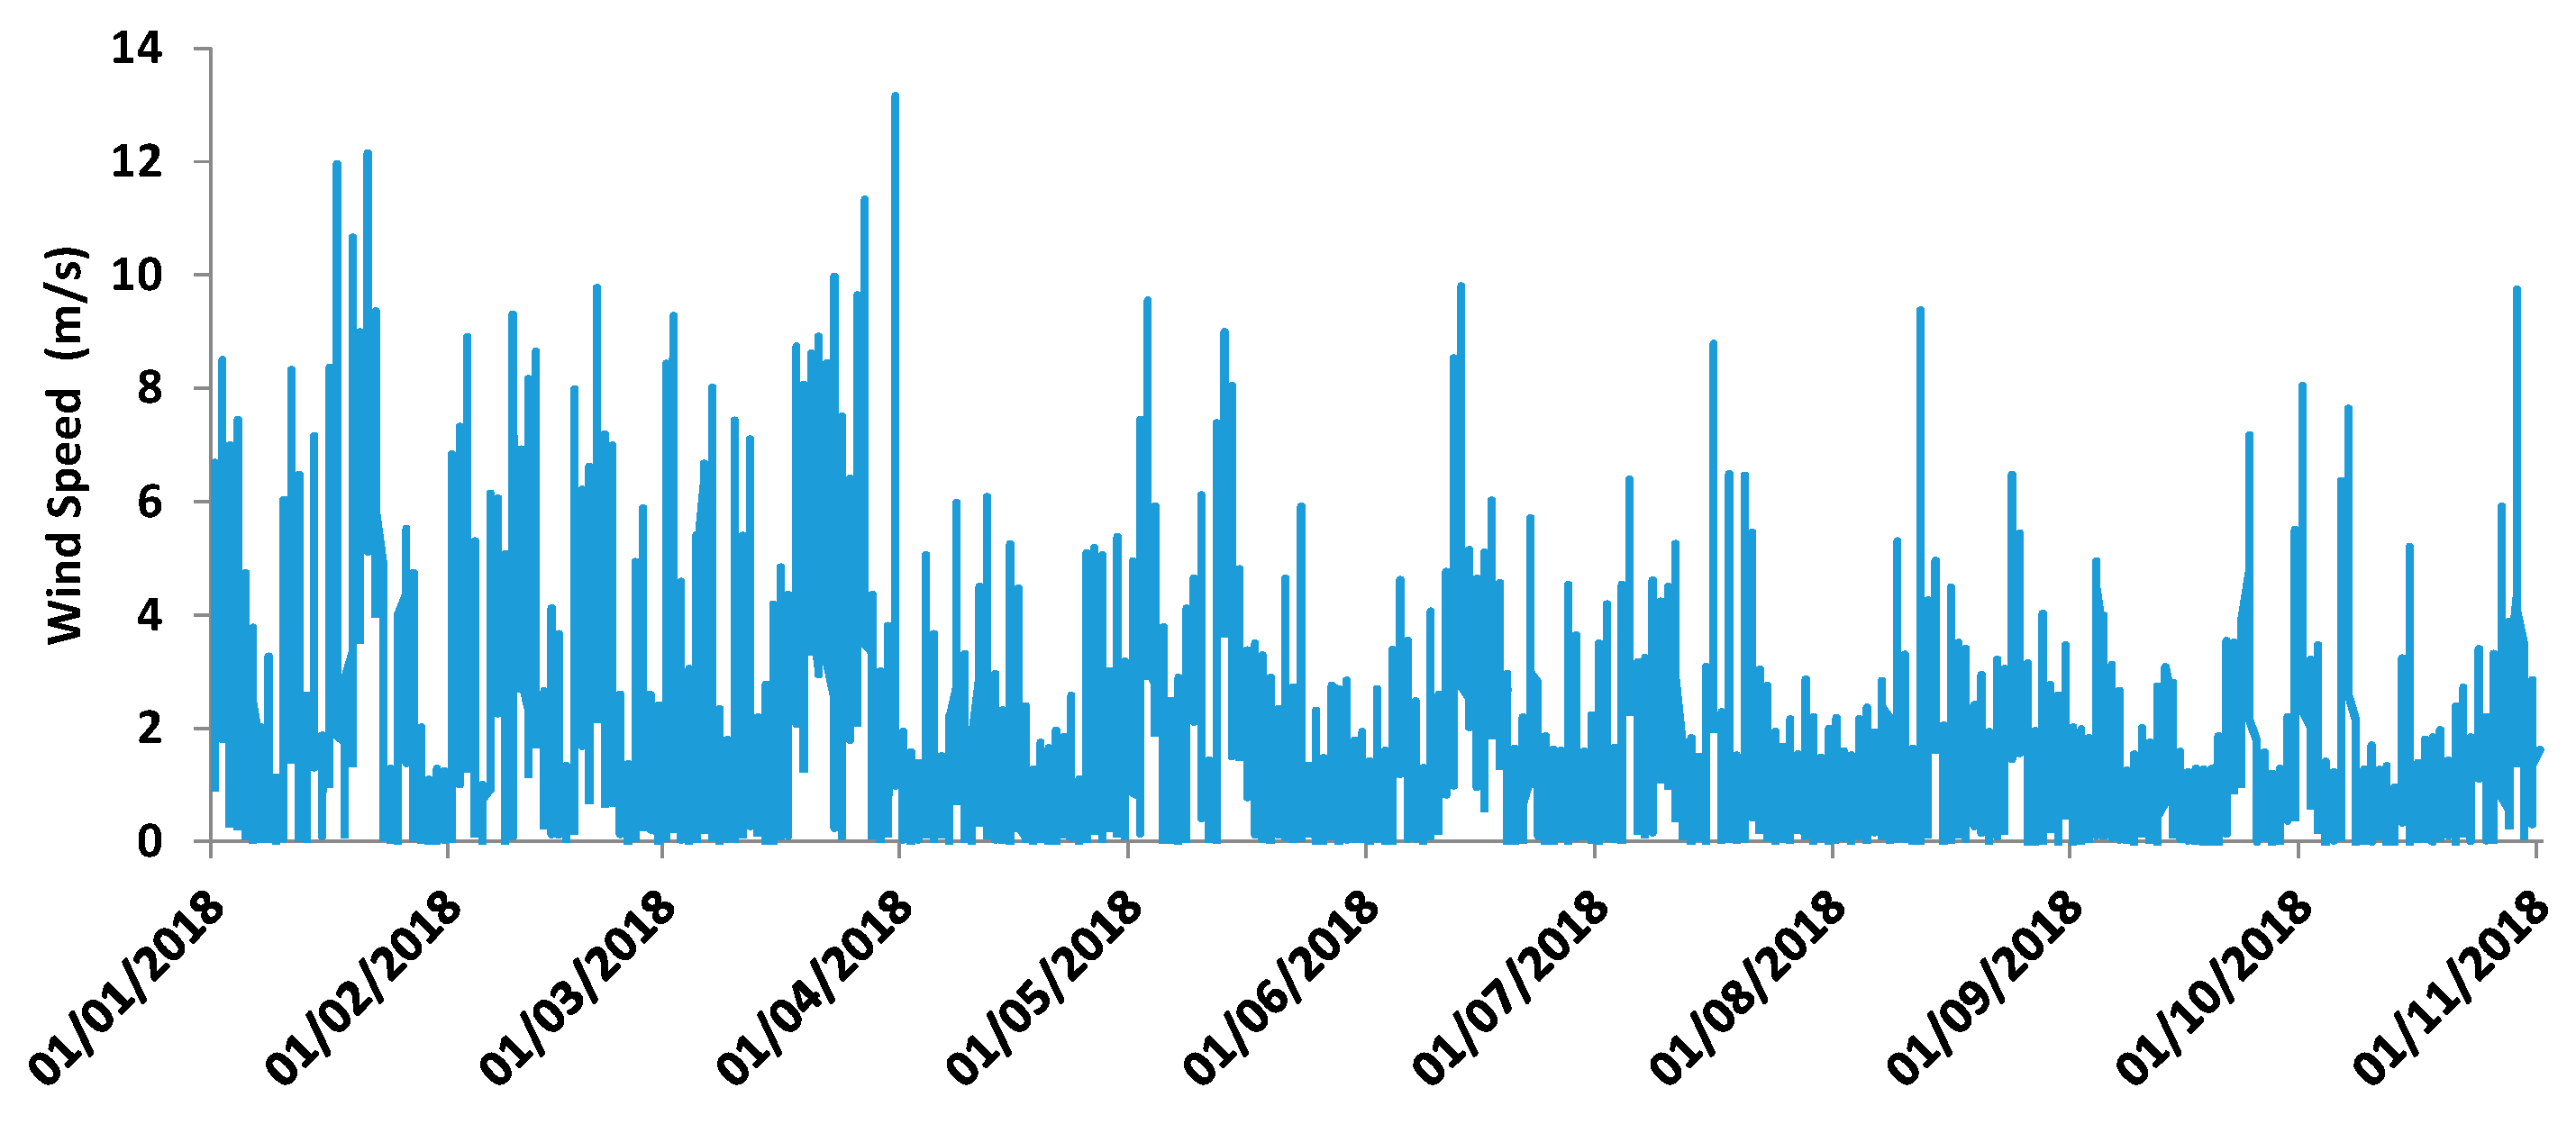
Additionally, through the platform, we can collect data from sensors placed in the field, such as temperature (see
Figure 12) or wind speed (see
Figure 13).
Figure 12 and
Figure 13 show the average temperature per day (in °C) and average wind speed per day (in m/s), respectively, measured over 10 months. These values are used to calculate the irrigation needs.
An example of the rules implementation on the server is given to solve a problem involving nitrogen application with an irrigation system. The dosages can be tuned with a nitrogen adjustment rule, e.g., as shown in
Figure 14, in this case a PossibleFertiEvent rule that is capable of detecting the potentially low vegetation index in one part of a field, labelled area 1. The rule conditions determine when the action has to be implemented. In this example, two events must occur: manual user upload of the index calculation data of the field, with an NDVI level lower than 0.42, and pressure sensor detection of an operational irrigation system ready to begin fertilization. These real-life events are mapped to events in the system, dependent on LowNDVI and WaterPressureEvent. When all the conditions are fulfilled, the new event can be created. The last line of the actions section inserts this event in the rule engine. In this way, the new event can be used by other rules. Rules give great flexibility to the user to combine low level events and higher-level events, which should trigger proper services and generate user notifications. Drools Guvnor rule management tools provide a user-friendly interface for building rules so the user does not have to know all the language details, e.g., possible Low level on Vegetation Index detected in Aerial Mapping Data changes. Integration with service layers was also tested with sensor data and notification services. Complex events added several additional dimensions to the monitoring process. It was proven in the test scenario that the decisions based on extra assumptions were more accurate.
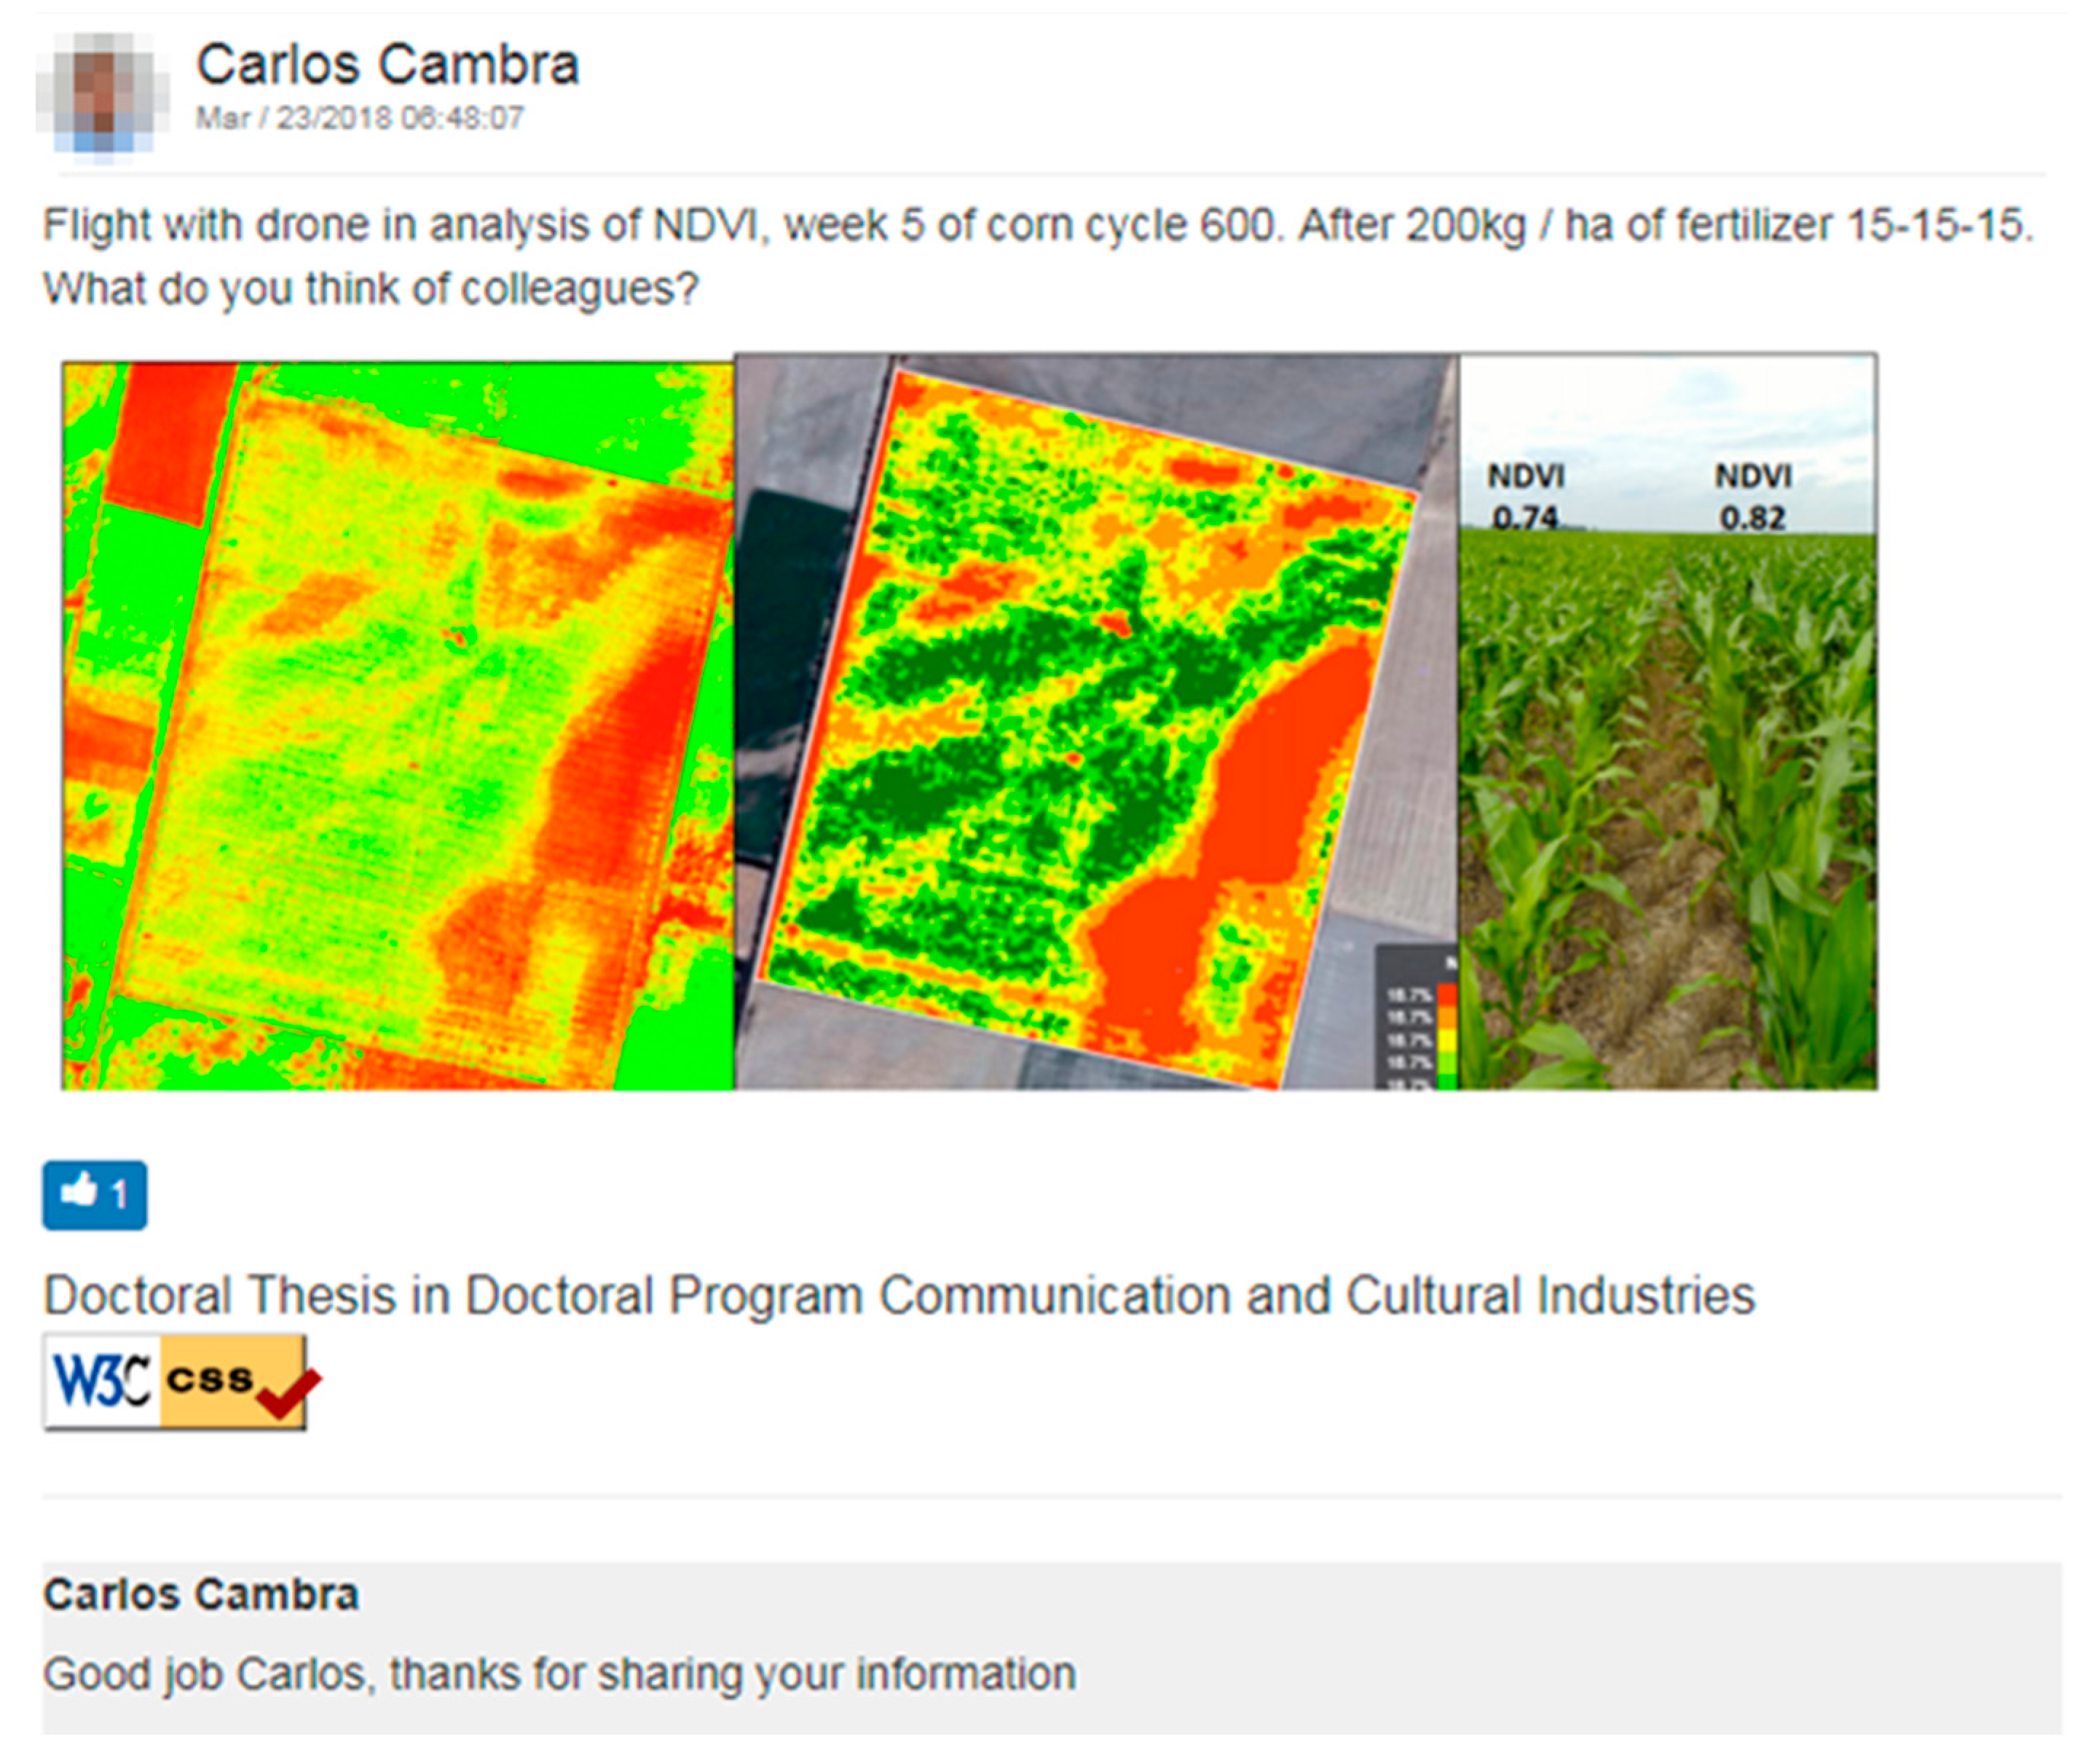
Users have the option of sharing an NDVI index image in PLATEM view. The data is stored in numerical form in the DB, and as an image for visual display of the NDVI index. See
Figure 15.
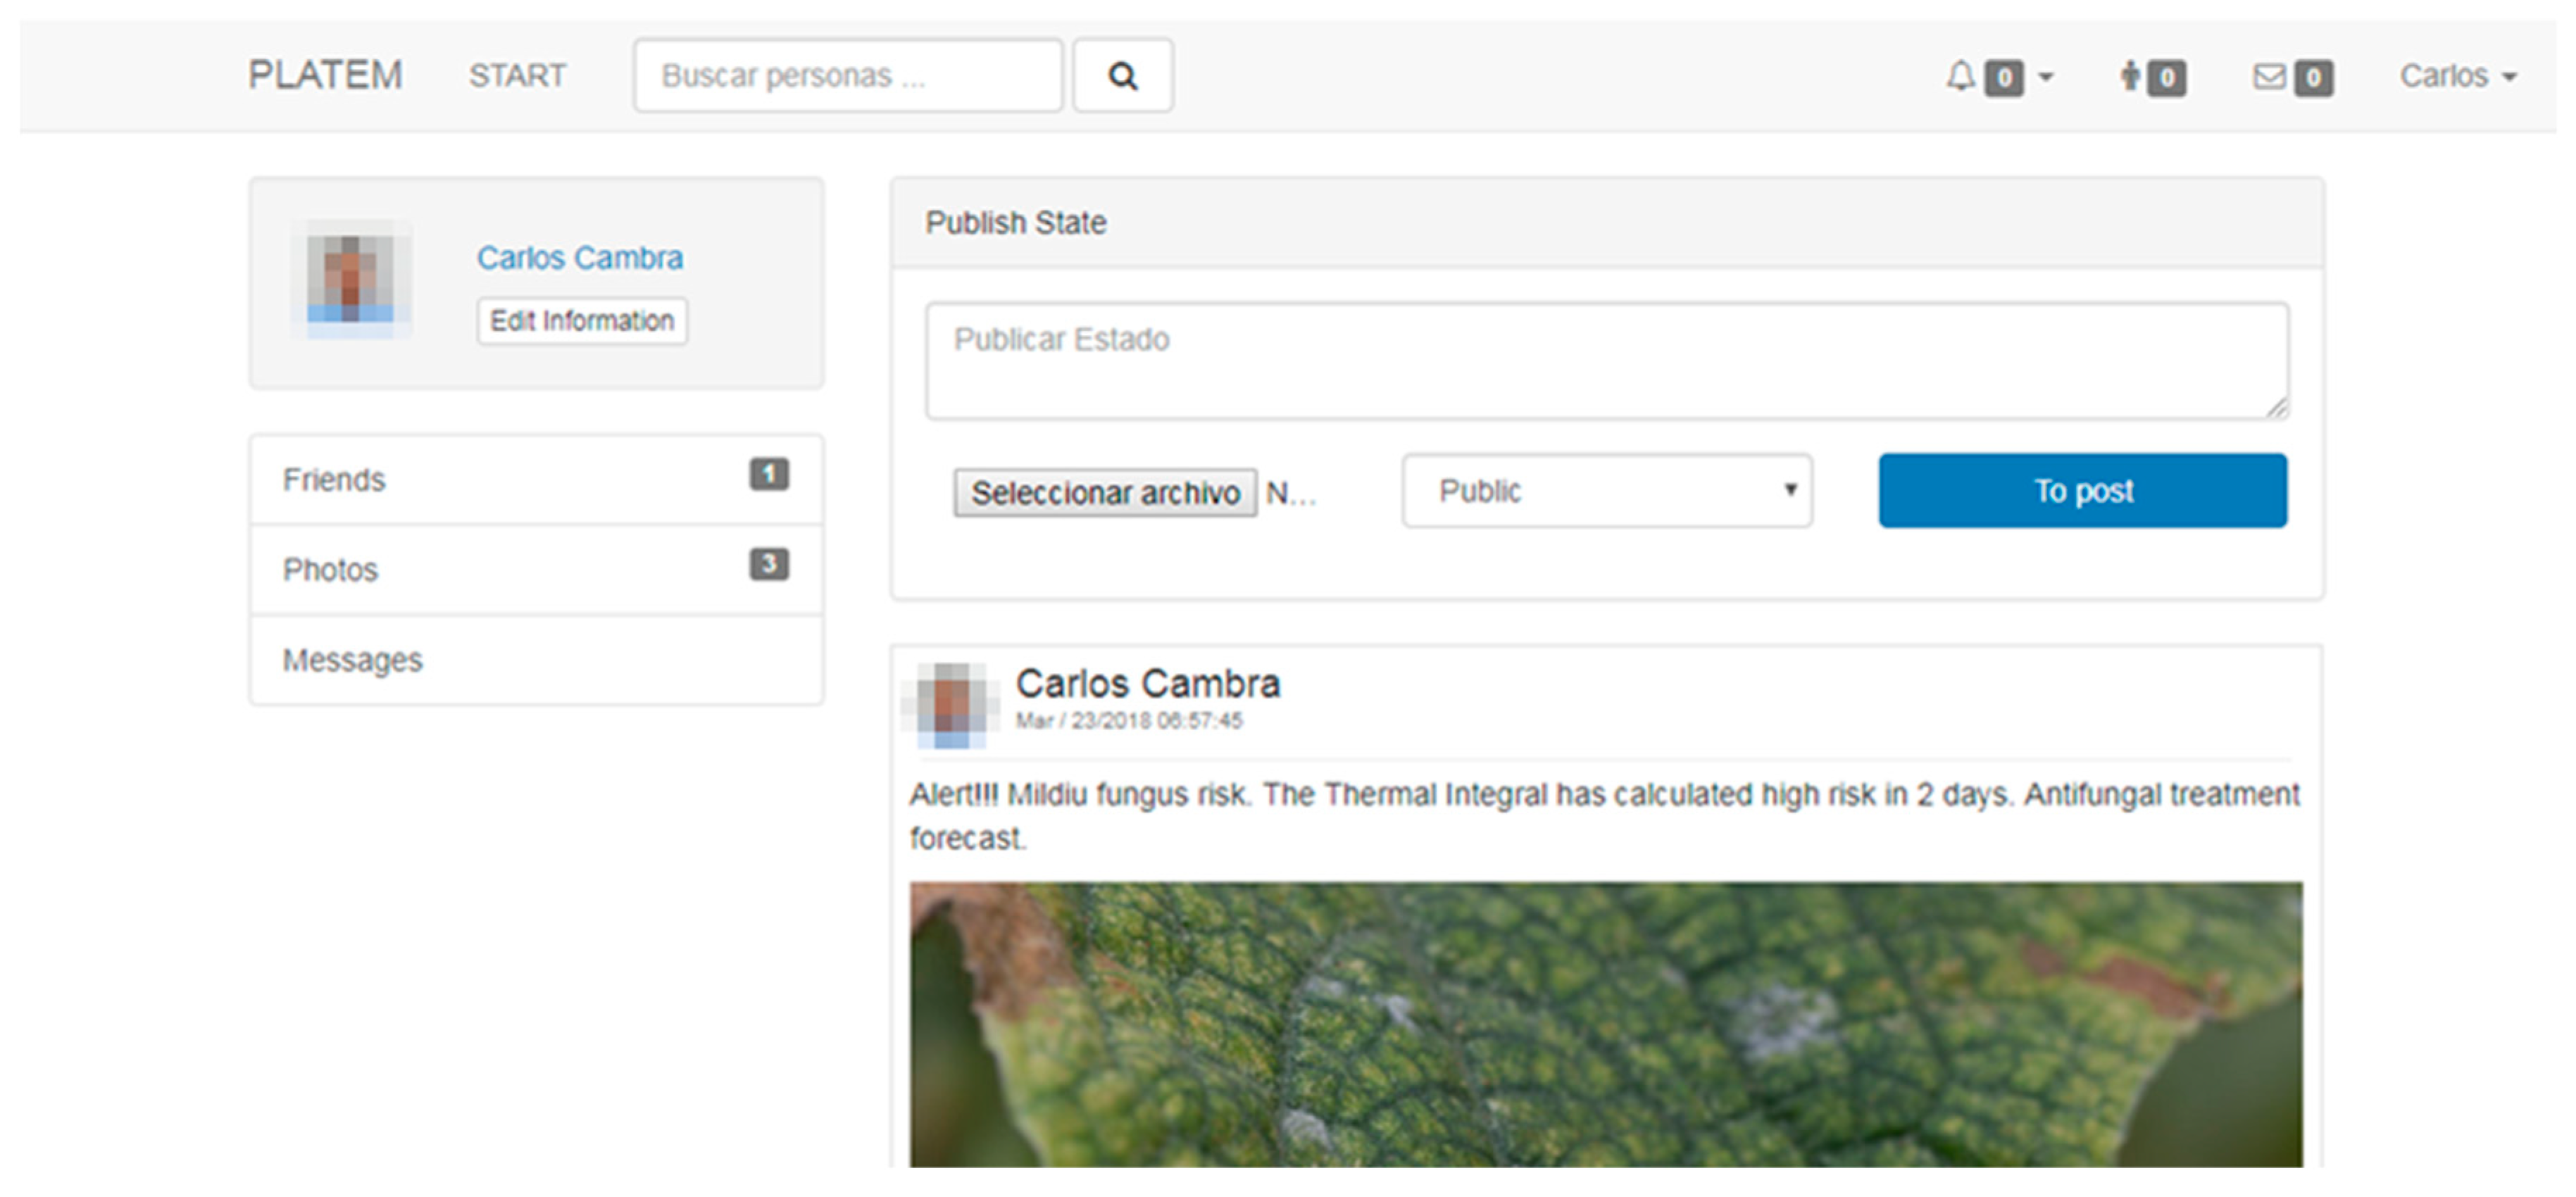
PLATEM supports the auto notification mode when posting directly via JSON to the user web profile and when posting new alerts either for user friends or for the general public with the business rules engine.
Figure 16 shows PLATEM predictions of the fungal mildew risk factor based on the historical weather DB, the forecast, and thermal integral.
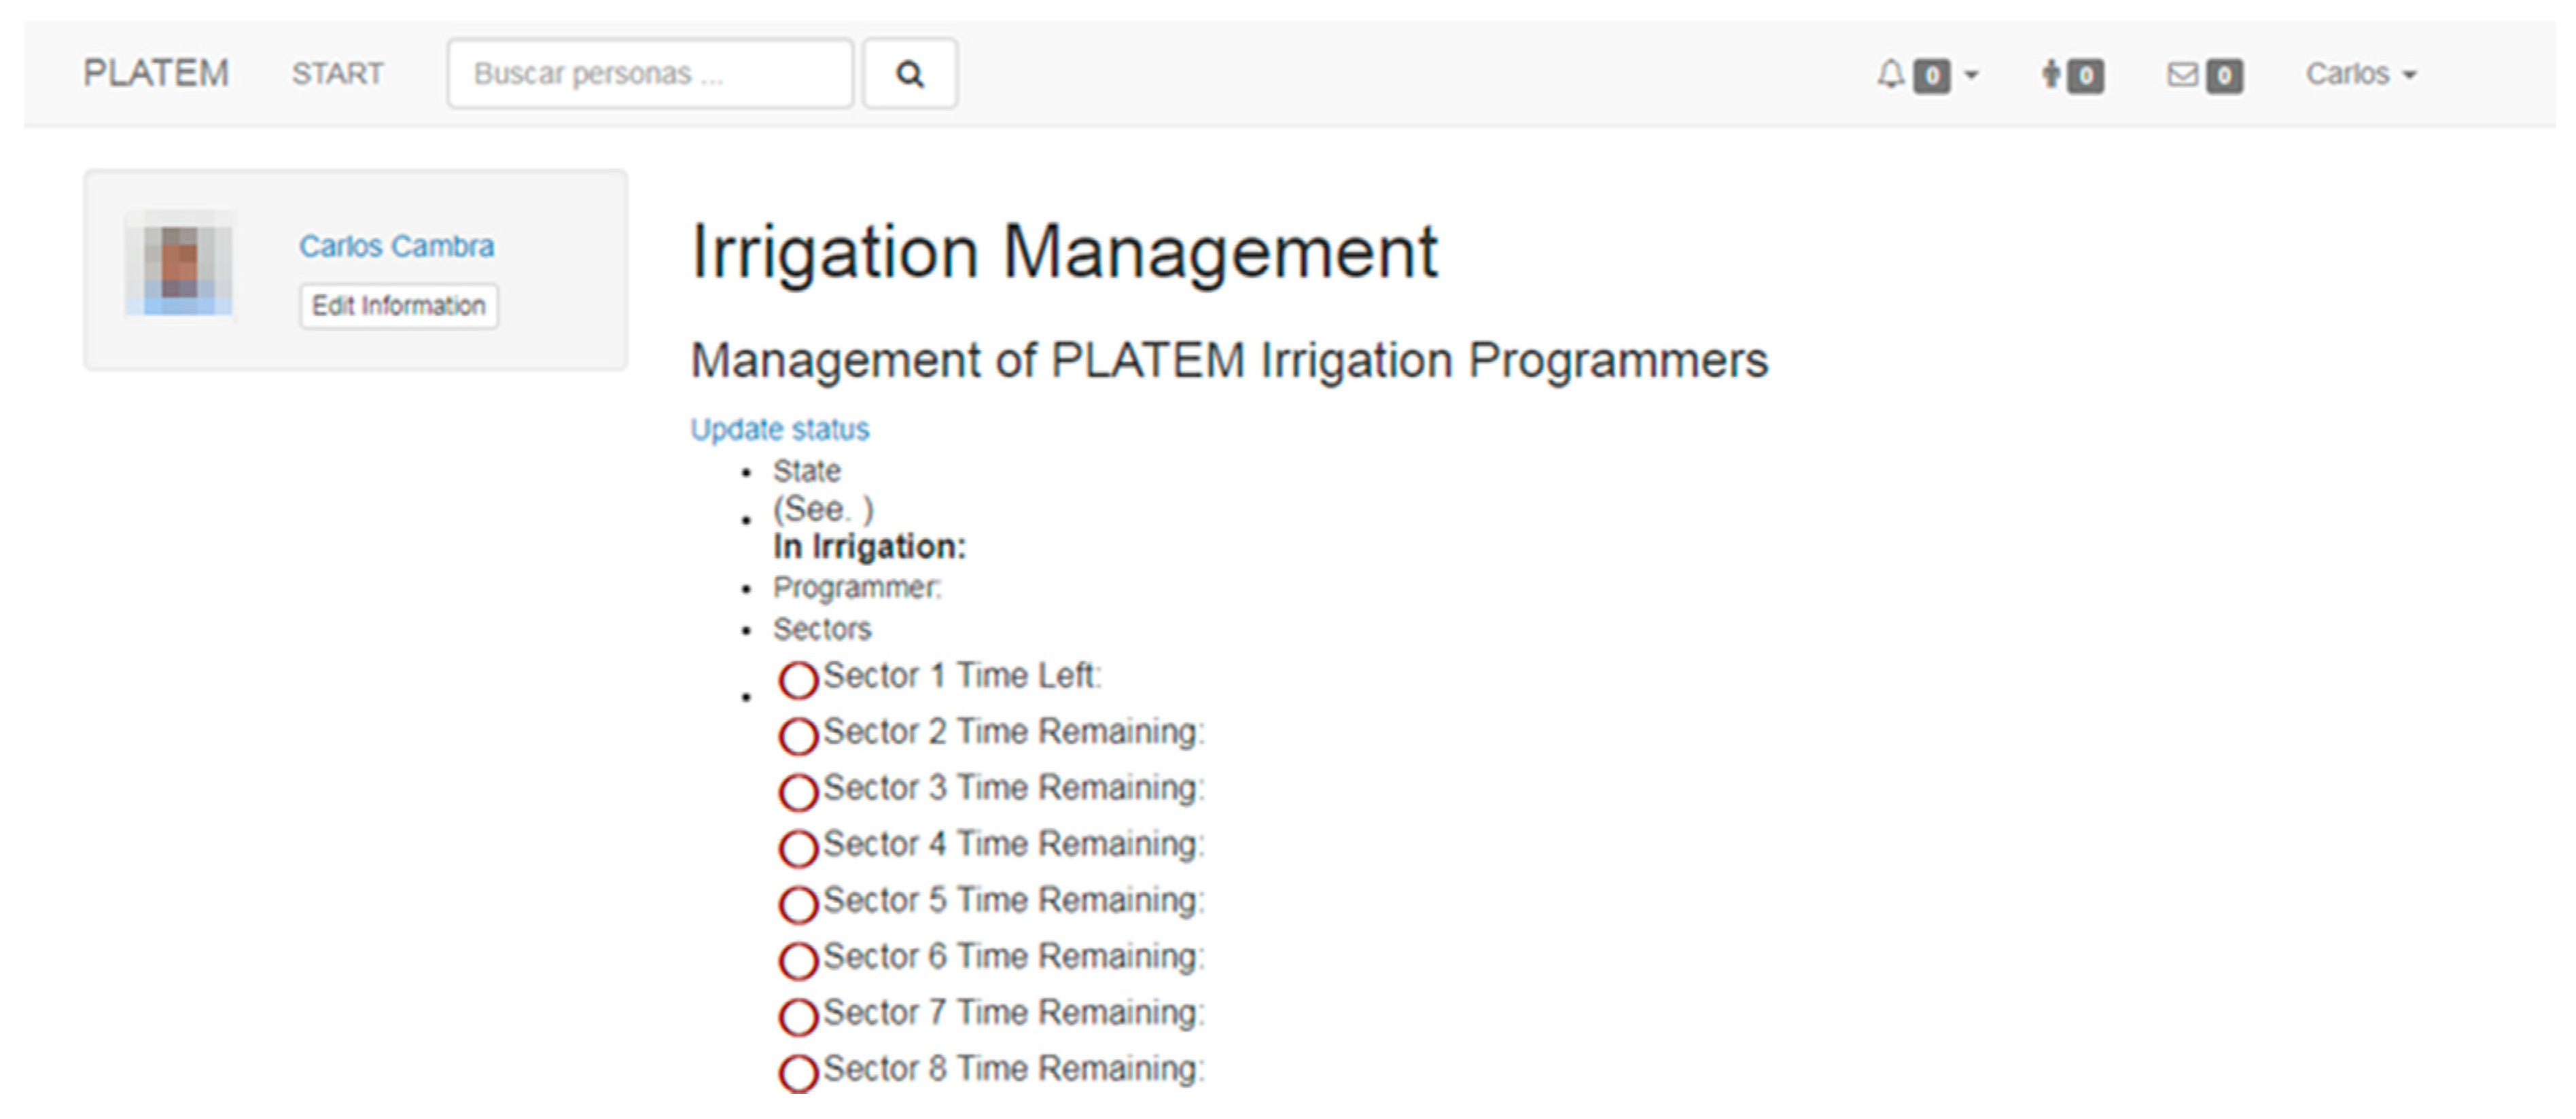
The irrigation management application has a high usable visual functionality backed up by an intelligent system, which adjusts the irrigation schedules that are introduced on the basis of the variables acquired by the sensors. In this way, intelligent programming can be achieved for farmers with simple programming settings. Smart conditions come from weather environment data, plant growth status, edaphic data, and aerial data from NDVI images (UAV or Satellite). The irrigation manager needs a basic irrigation configuration that will eventually be capable of auto-tuning with sufficient inputs.
Figure 17 shows the irrigation sectors of a single controller.
Each program can be modified by clicking on a program number that will launch the edit view. Basic parameters can be adjusted to start the work (see
Figure 18). The system will adjust itself on the basis of information from sensors, images, and weather conditions. The type of start (weekdays or intervals), add restrictions, time start, and additional starts can all be added.
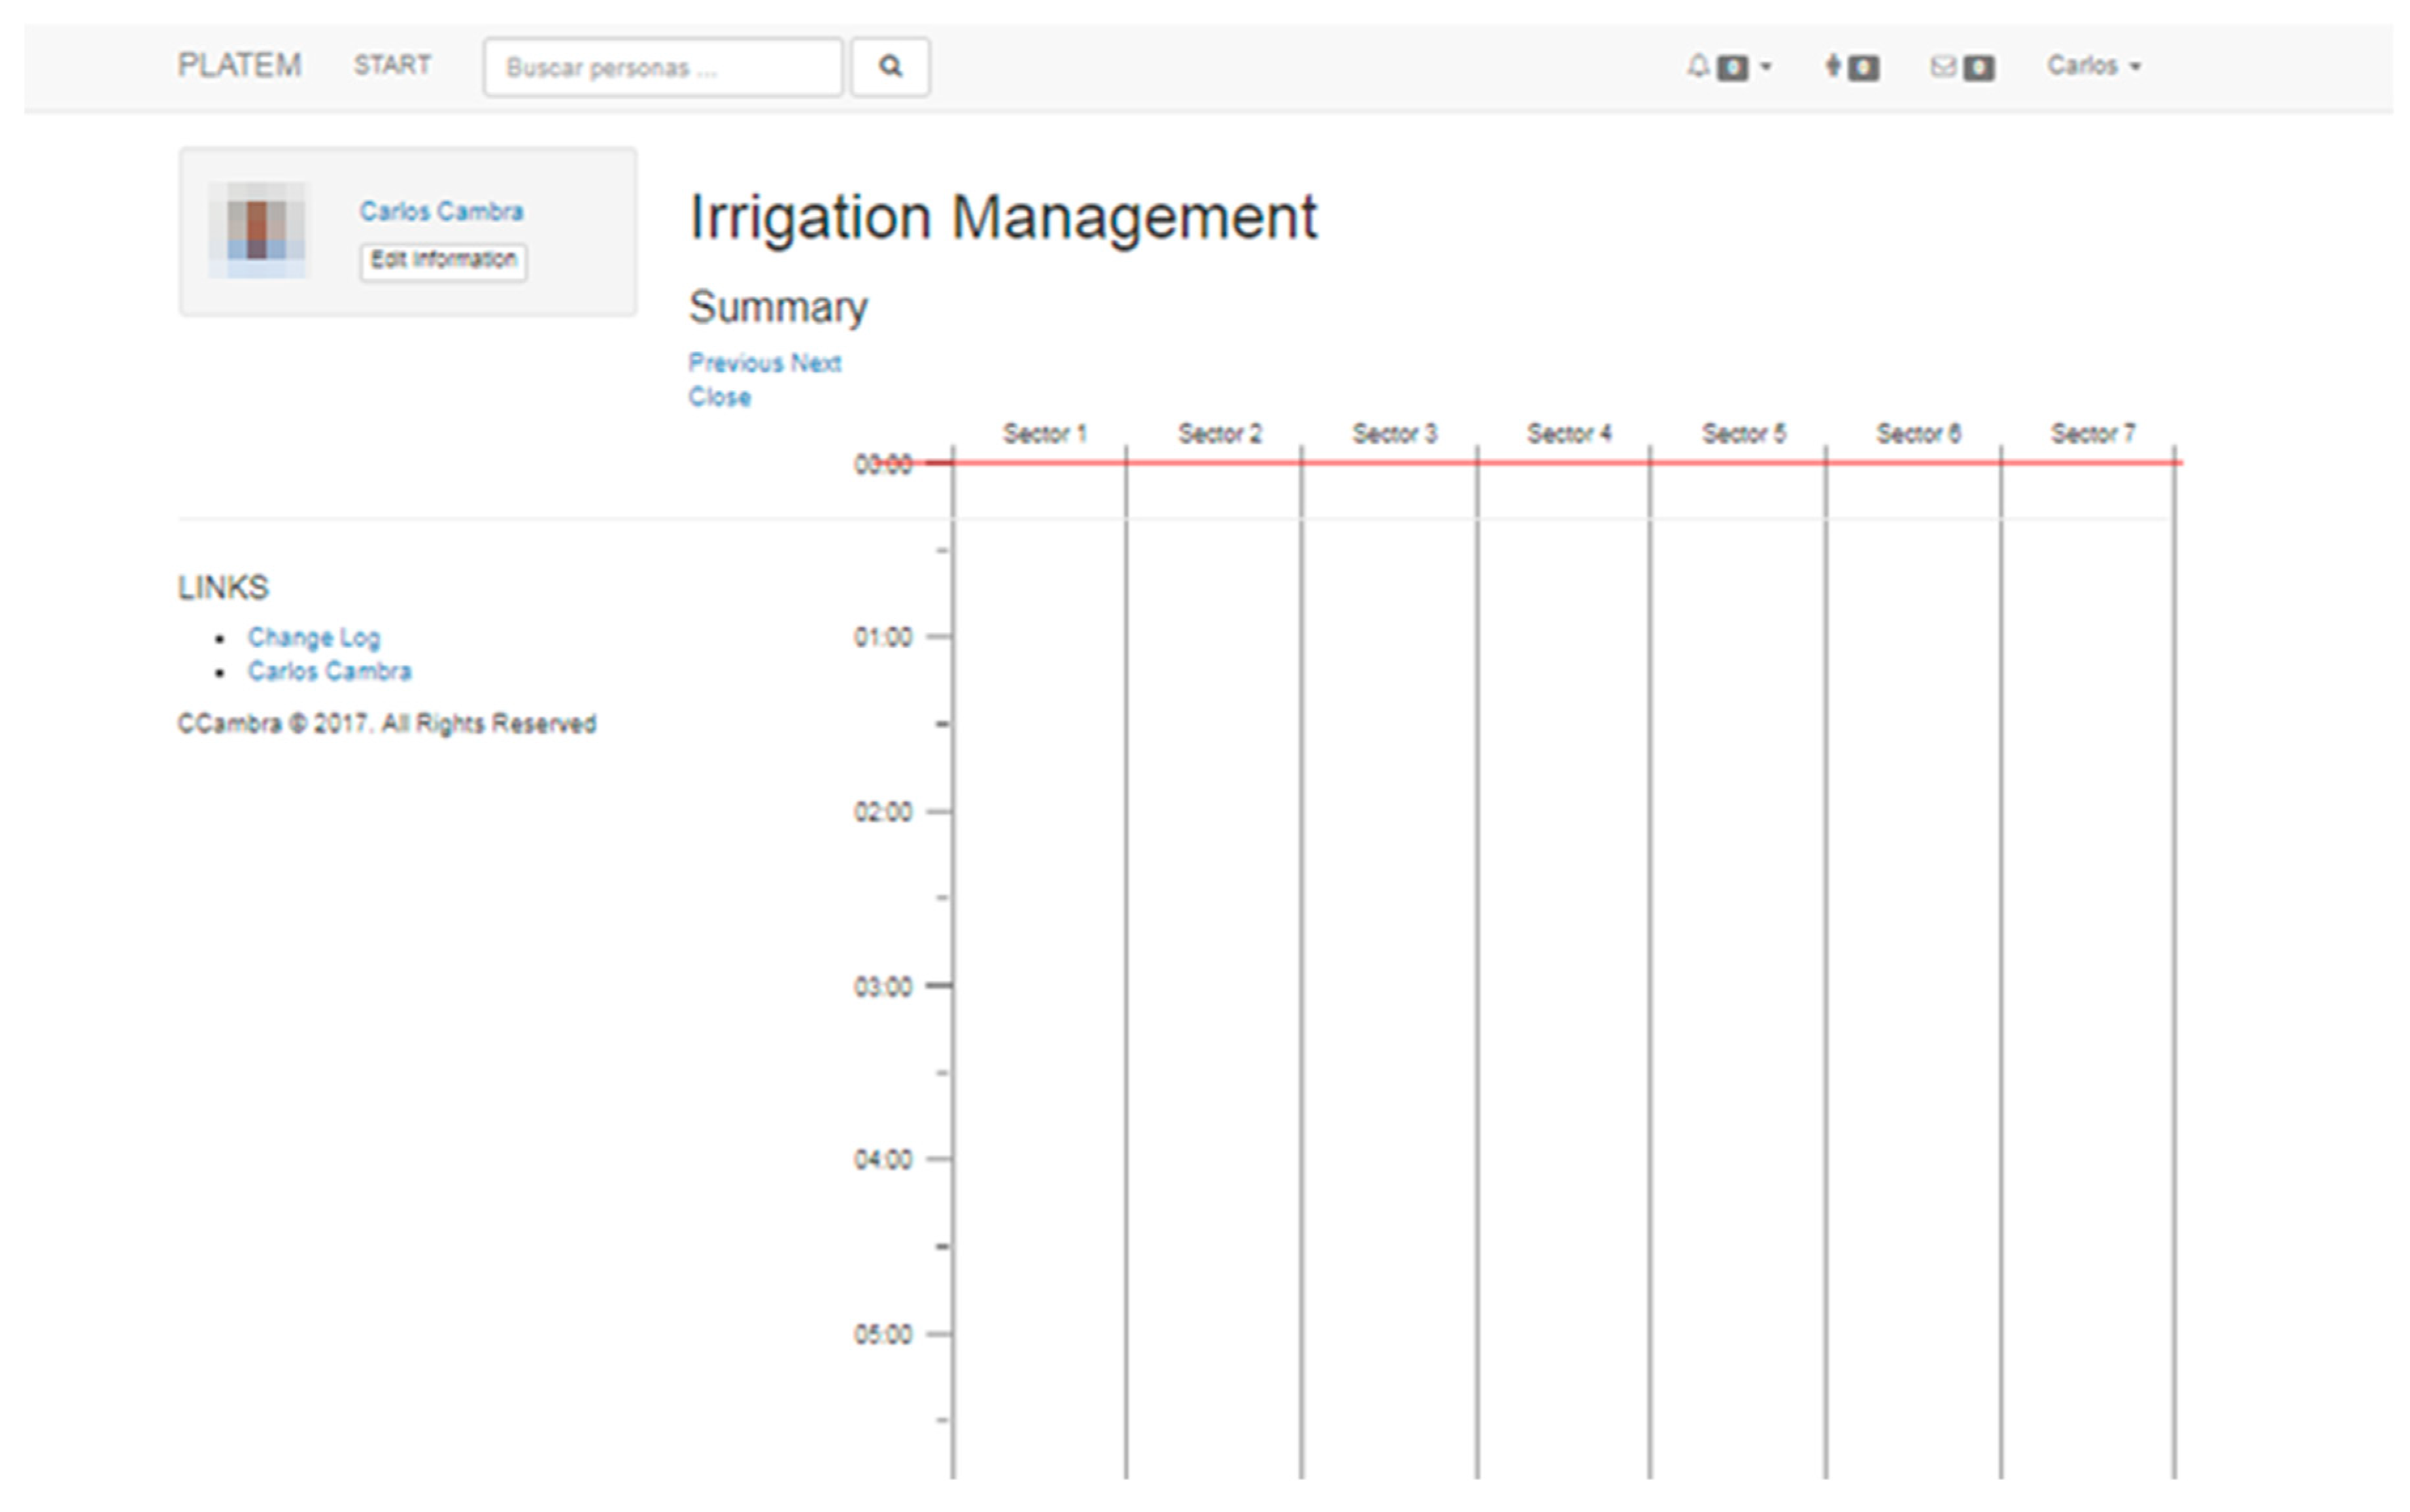
A graphic view of the historical irrigation schedule was introduced to monitor total water consumption, and to establish water consumption levels in each irrigation sector, irrigation cycle, and fertirrigation event, all presented as basic visual data in a user-friendly way for farmers. When the crops are harvested, and at any other time, the irrigation records (see
Figure 19) can be compared with past weather conditions to establish relationships between them.
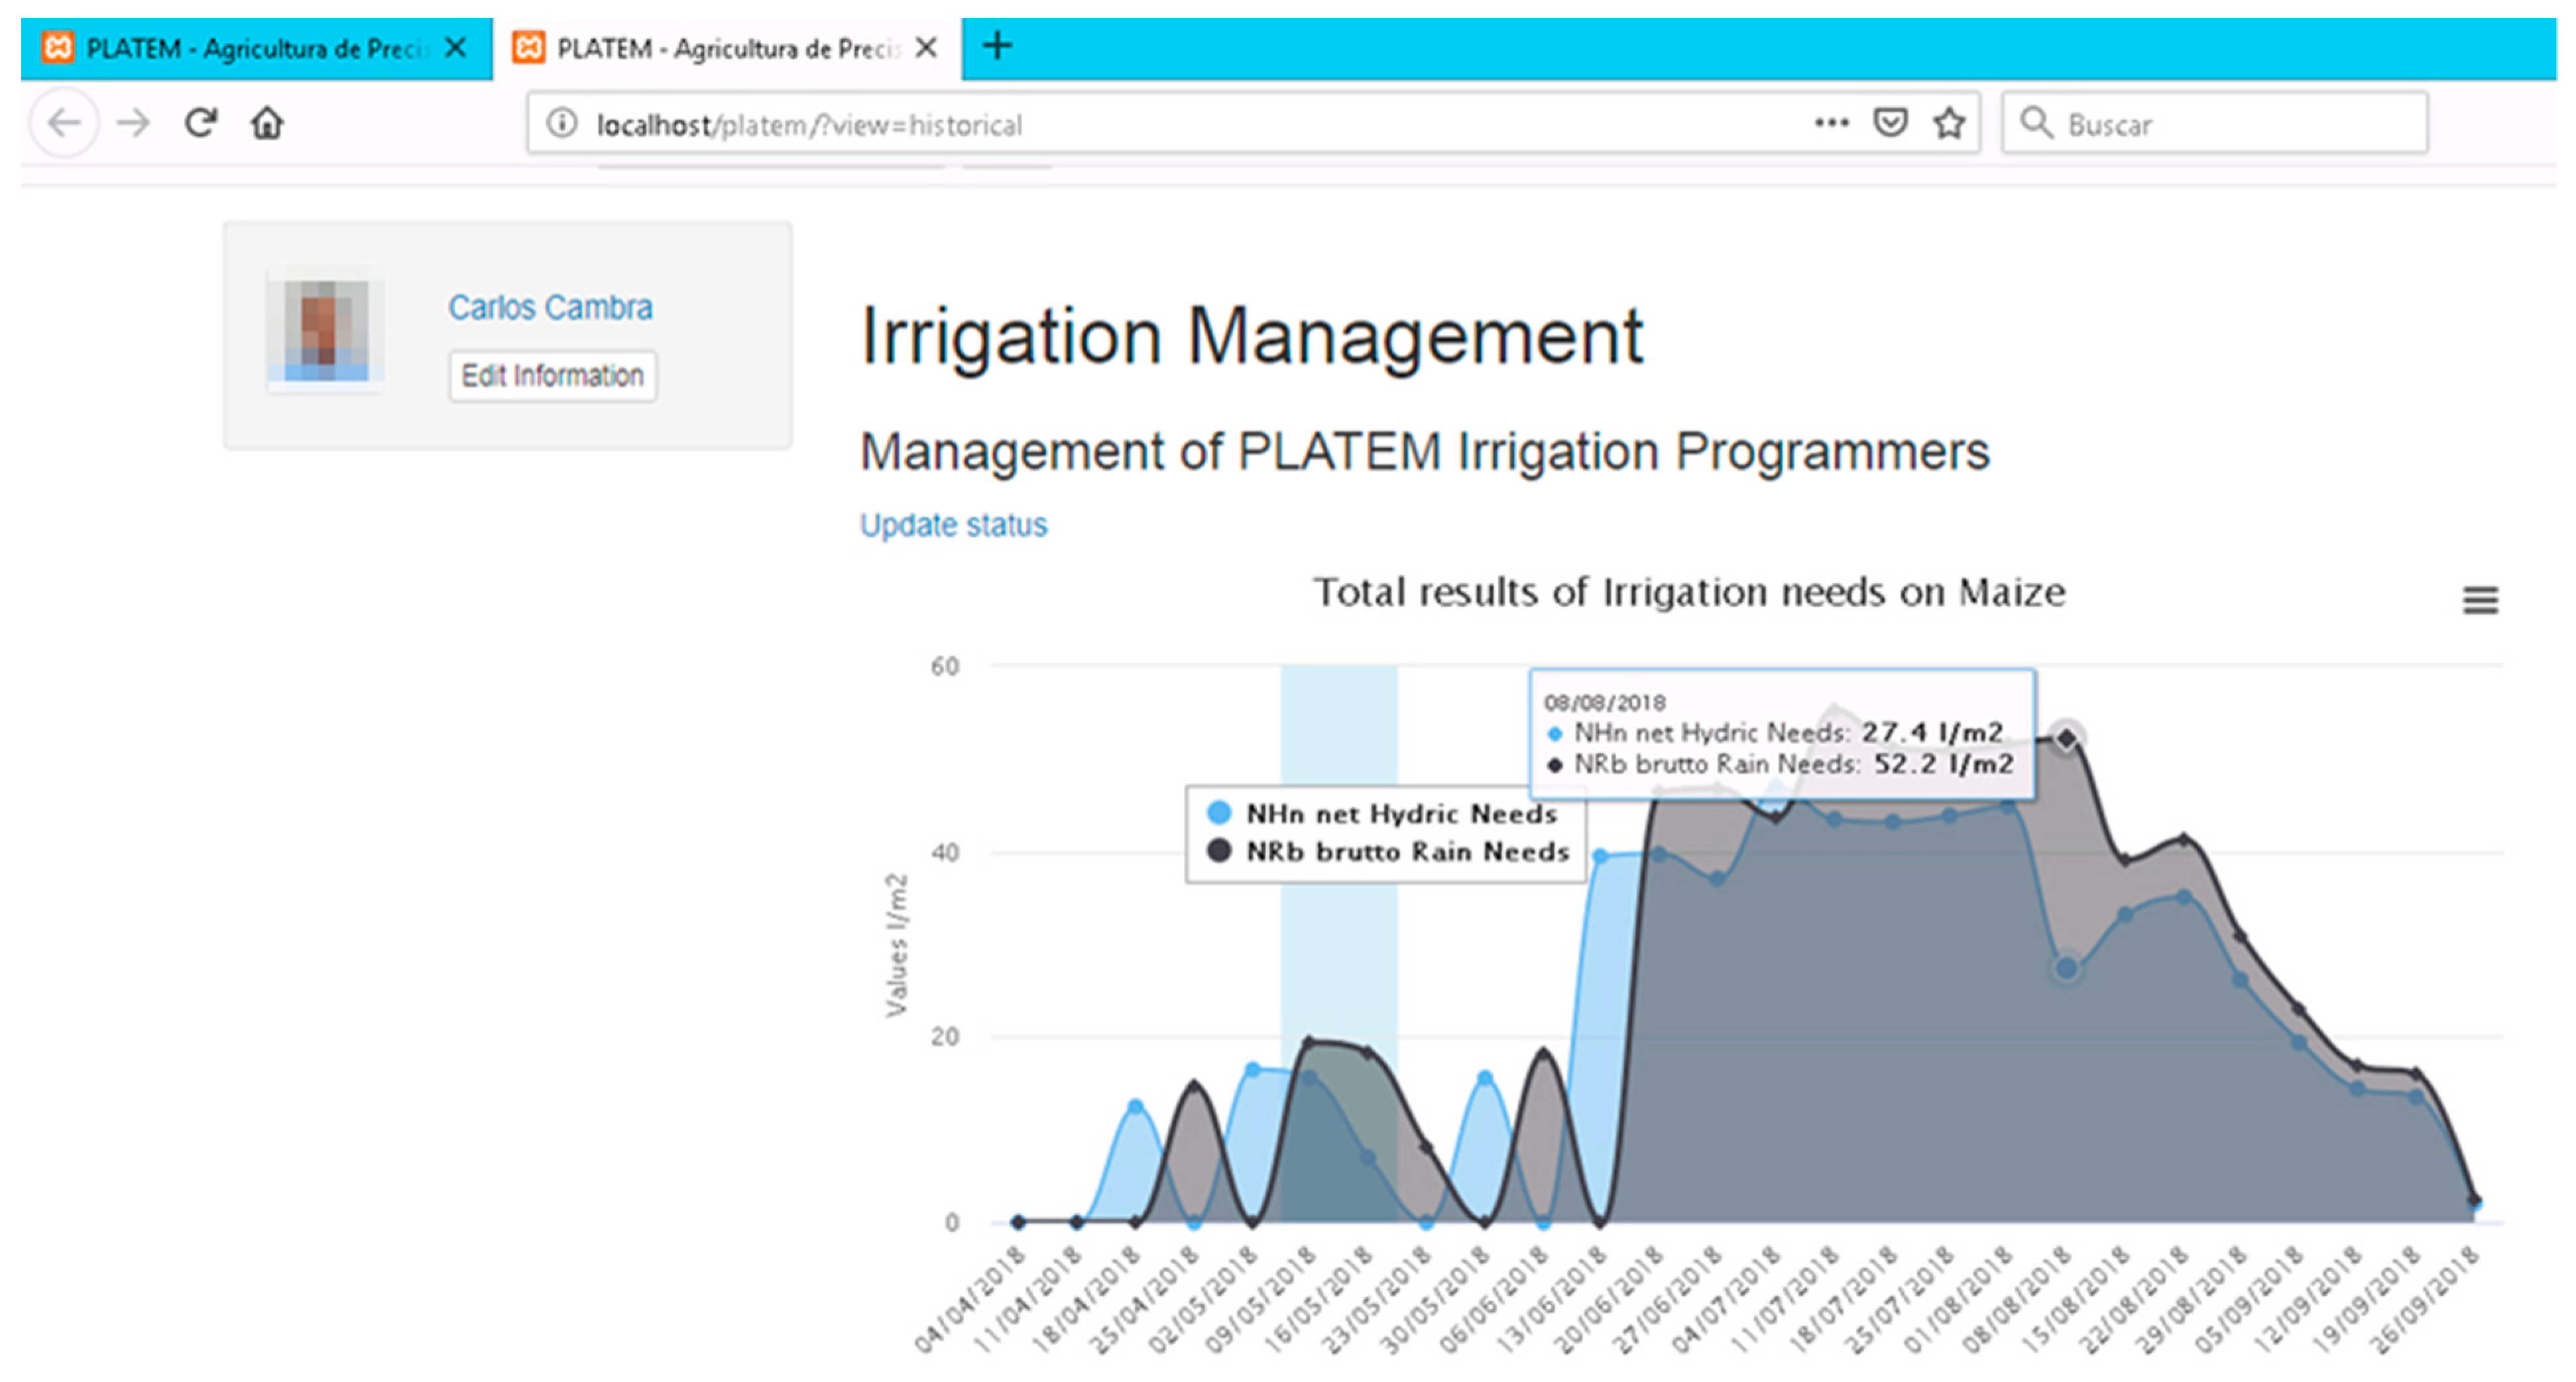
Finally, PLATEM allows the farmers to graphically see the irrigation needs as a function of the measured values in the field and weather (see
Figure 20).
6. Conclusions and Future Work
In this work, we have presented the results of new decision rules to create variable rate irrigation parameters and variable rate fertirrigation rules for parametric optimization of agricultural inputs. In addition, we tested a new multimedia platform for user manager (farmer) profiles to notify events, to share postings and data with the community, and to interact with the irrigation–fertirrigation system controller. Comparing our study with other applications, we can highlight the potential of PLATEM: that integrates all the tools that a farmer may need on a day-to-day basis, so that many fertirrigation operations can bring in results with a rule engine and a list of rules or models based on historical data acquisition and user-inserted values. Another important function is information sharing through forums with input from agronomists, agricultural technicians, and other farmers on doses, plagues, water restrictions, etc. Work continues on expansions of the rules for the integration of the business engine system. The goal of this integration is to present the basic user-demanded rules defined in the system, enabling a simple and unique functional platform for smart farming in irrigation areas, both under cover and in the field, for fertilization and pest control.
In future work, further development of smart system applications will be necessary, and is likely to produce two opposing supply chain scenarios: one with further integration of the supply chain, in which farmers have private data, and another in which farmers are empowered by big data and open collaboration and can easily switch between suppliers, sharing data with agricultural organizations and the Ministry of Agriculture, and participating in short supply chains rather than integrated long supply chains.
Currently, PLATEM is working well for relatively small data sets. A further action required to process bigger amount of data is to apply different decision-making tools, since the rule engine and decision tree become inefficient because of the swapping of training tuples in and out of the main memory.
The situation is likely to navigate a steady course between these two extremes differentiated by cropping methods, commodity, market structure, etc. In this work, the use of open data is fostered with the aim of promoting communication channels between farmer, researcher, commercial intermediary, and technological expert.
Another focus is on the extension of the system that would allow mixing rules from multiple datasets in a single knowledge base and a common communication protocol through various sources, e.g., manufacturers of irrigation controllers, real-time information from satellites, and weather forecasting servers. Finally, we have to consider supporting alternative backend rule learning adjusted to each user profile (horticulture, cereal, and fruit farmers, etc.) to classify the rules on use in the rule container. The promise of big data in agriculture is alluring, but the above challenges have to be addressed for increased uptake of big data applications. Although there are certainly technical issues to be resolved, we recommend focusing on the most significant obstacles above all, the initially identified governance issues, and the design of suitable business models.
