Article

Water-Saving Irrigation Strategies in Potato Fields: Effects on Physiological Characteristics and Water Use in Arid Region

by
Tarek K. Zin El-Abedin
1,2,
Mohamed A. Mattar
1,3,*,
Hussein M. Al-Ghobari
1 and
Abdulrahman A. Alazba
1,4
1
Agricultural Engineering Department, College of Food and Agriculture Sciences, King Saud University, Riyadh 11451, Saudi Arabia
2
Agricultural Engineering Department, College of Agriculture, Alexandria University, Alexandria 21545, Egypt
3
Agricultural Engineering Research Institute (AEnRI), Agricultural Research Centre, Giza 12618, Egypt
4
Alamoudi Water Research Chair, King Saud University, Riyadh 11451, Saudi Arabia
*
Author to whom correspondence should be addressed.
Agronomy 2019, 9(4), 172; https://doi.org/10.3390/agronomy9040172
Submission received: 19 February 2019 / Revised: 26 March 2019 / Accepted: 28 March 2019 / Published: 31 March 2019
(This article belongs to the Section Water Use and Irrigation)

Abstract

:
In this study, field experiments were conducted to investigate the effects of two water-saving practices—partial root-zone drying (PRD) and deficit irrigation (DI)—on potato growth and yield in comparison with full irrigation (FI). The required FI amount was applied to the potato plants to enable 100% crop evapotranspiration, and the plants received 70% and 50% of the irrigation amount of FI for DI (DI70 and DI50) and PRD (PRD70 and PRD50), respectively. The physiological characteristics of the potatoes during the 2014–2015 seasons indicated that the relative chlorophyll contents were not significantly higher for the DI and PRD treatments than for the FI treatment. The DI50 had the lowest net photosynthesis rate (p < 0.05) while DI50 and PRD50 had significantly lower stomatal conductance (gs) values in both years. Meanwhile, the values of the PRD treatments were lower than those of DI treatments based on the transpiration rates. The xylem (abscisic acid) based on PRD50 had an average increase of 0.38 mol/m2 s due to decreasing gs values compared with other water-saving irrigation treatments. However, the FI and DI treatments had increased fresh tuber yields compared with the yields of PRD treatments. Furthermore, the PRD70 and PRD50 treatments significantly reduced the water productivity (WP) values by 30.16% and 41.32%, respectively, relative to that of FI.

1. Introduction

The utilization of potato (Solanum tuberosum L. cv. Hermes) in human nourishment and the manufacture of starch distinguishes it among other vital crops on the planet [1]. Although it is sensitive to water stress, it can produce more and higher quality tubers when it is watered precisely by soil water tension rather than by under- or over-irrigation [2].
However, water-saving irrigation methods such as deficit irrigation (DI) and partial root-zone drying irrigation (PRD) permit a crop to tolerate some water deficit degrees to decrease the irrigation budget and increase potential revenue. These strategies have been successful for many crops all over the world. Such crops fairly avoid water stress either due to their nature or by deep rooting, which allows their roots to have access to soil moisture in the soil profile. Moreover, the whole root-zone is irrigated to a lesser degree than the maximum crop evapotranspiration in these irrigation methods. Hence, the crop is exposed to a certain level of water stress during the whole growing season, or at a particular stage of its growth [3,4]. Meanwhile, the PRD strategy is an improvement over the DI strategy in which irrigation is alternated spatially and temporally to produce wet–dry cycles in many parts of the root system. Chemical signals are then induced in the roots of the dry soil, thereby leading to a decrease in the stomatal conductance (gs), transpiration, and shoot growth. This preserves crop water supply from the wet soil through the roots to avoid acute water shortage [5,6]. The roots in dry soil produce chemical signals, such as abscisic acid (ABA), which are transported to the plant leaves, thereby playing a vital role in the chemical signaling of soil moisture and in the regulation of gs [5,7,8,9,10,11,12,13].
The physiological basis for improving water productivity (WP) in DI and PRD strategies involves decreasing gs using the ABA-based root-to-shoot signaling system, thereby curtailing the transpiration rate through temperate soil drying [14,15,16,17]. Various studies have shown that DI and PRD-induced signals regulate gs and leaf expansion growth to increase WP [12,18]. Hence, root-based ABA may indicate soil drying. This hormone can be transported through the roots in the drying soil before low-water conditions, which causes the production of leaf-induced ABA, are indicated. The hormone is then transported through the transpiration stream to the shoots, where it causes a decline in the leaf development rate and stomatal opening, as observed in wheat [19], tomatoes [20], maize [21], and potatoes [16]. Dodd [12,17] and Wang et al. [18] demonstrated that PRD plants process more prominent xylem (ABA) fixations than DI plants at a comparative level of soil water deficiency in the entire root zone. This prompts a superior control of plant water stress, thereby leading to an additional change in WP. However, photosynthetic rates (An) indicate the saturation response by an open stomata, while transpiration rates (T) indicate a more linear response. Thus, the partial closing of the stomata will substantially reduce water loss, with little effect on An [22]. Ahmadi et al. [23] observed that gs is more sensitive to water deficiency than An in potato plants.
Therefore, DI and PRD conserve irrigation water and increase WP simultaneously, with no yield reduction [15,16,24,25,26]. Shahnazari et al. [27] demonstrated that PRD and DI produced similar potato yields to full irrigation (FI), and improved WP by 60% due to the conservation of the applied irrigation water by ~30%. On the other hand, Liu et al. [15,16] discovered that PRD could not enhance yield and WP in potatoes in comparison with DI. They also demonstrated that potato tuber yields significantly decreased for DI and PRD than for FI. Moreover, Ahmadi et al. [28] demonstrated that fresh yields and the WP of potatoes are significantly affected by PRD and DI in comparison to the effect of FI. Furthermore, Yactayo et al. [29] demonstrated that the WP of potatoes improved with no yield decrease when an early PRD was performed six weeks after growing and with a watering level equal to half of FI, in comparison with FI.
However, the shortage of irrigation water and recurrent and extreme droughts have led to further research into water-saving irrigation strategies to increase crop productivity and the requirements for the optimization of irrigation management. Therefore, improvements are required to increase the efficient use of irrigation water. Thus, DI and PRD reduce the irrigation levels of crops in comparison to FI. The degree of irrigation reduction is crop-dependent. It controls excessive vegetative growth and is generally accompanied by minor yield loss [30,31,32,33], thereby increasing WP [28]. Hence, the objectives of this study are to (1) compare the physiological responses of potato crops with respect to DI, PRD, and FI irrigation methods in an arid environment, and (2) assess the effect of water-saving (i.e., DI and PRD) irrigation strategies on the yield and WP of potatoes.

2. Materials and Methods

2.1. Experimental Setup and Design

The field experiment was carried out over two successive years (2014–2015), from January to May, in Riyadh, Saudi Arabia. The site is located at 24°44′11.10″ N and 46°37′06.61″ E, at an altitude of 665 m above sea level. A meteorological station that stored weather data from the field location was set-up in the experimental field to measure climate parameters, such as air temperature, relative humidity, and rainfall. The seasonal divergence in weather parameters estimated throughout the whole period is delineated in Figure 1. These climate data were used to calculate daily reference evapotranspiration ( E T o ) using the Penman–Monteith FAO-56 equation [34], given by:
E T o = 0.408   Δ   ( R n G ) + γ   900 T a + 273   u 2   ( e s   e a ) Δ +   γ   ( 1 + 0.34   u 2 )
where E T o represents reference evapotranspiration (mm/day), R n represents net radiation (MJ/m2 day), Δ represents the slope of the saturation vapor pressure–temperature curve at mean air temperature (kPa/°C), u 2 represents the wind speed at a height of 2 m (m/s), G represents the soil heat flux (MJ/m2 day), T a represents the mean air temperature at a height of 2 m (°C), γ represents the psychrometric constant (kPa/°C), e a represents actual vapor pressure (kPa), and e s represents the saturation vapor pressure (kPa).
The actual crop evapotranspiration ( E T c ) was estimated at the initial stage, mid stage, and late-season stage using respective crop coefficient ( K c ) values of 0.5, 1.15, and 0.75 [35], as follows:
E T c = K c × E T o
The efficiency of the drip system was based on the crop water requirements (actual E T c ) for different growth stages, to estimate the amount of irrigation water applied to the crop.
The seed beds for the field experiment were prepared by plowing, grading, and leveling for the irrigation system. Furthermore, physical analysis of the soil was conducted to a depth of 60 cm, as shown in Table 1. The soil water content by weight at the field capacity (<0.3 bar) and wilting point (<15 bar) were also measured [36]. Moreover, the saturated hydraulic conductivity was determined by the constant head method [37] while the soil bulk density was determined by the core method [38]. The field was manually cultivated with potato seeds (Solanum tuberosum L. cv. Hermes) by digging small shallow holes into the ground surface and growing them ten centimeters deep below the soil, with a row spacing of 70 cm and plant spacing of 50 cm. The same fertilizer amount appropriate for the potatoes was applied to all the treatment plots. The fertilizers comprising of 230 kg/ha N–P2O5–K2O (20–20–20), 200 kg/ha N–P2O5–K2O (10–10–43), 40 L/ha H3PO4, and 4 kg/ha microelements, were applied using a drip irrigation system for five successive days each week.
The experimental area was 675 m2 (45 m × 15 m) and was divided into three replicate fields. Each field of area 195 m2 (13 m × 15 m) included five irrigation treatments: FI with 100% of E T c , DI70 and PRD70 with 70% of E T c , and DI50 and PRD50 with 50% of E T c , using a randomized complete block (RCB) design. The surface dripper lines were comprised of 26 emitters with a discharge rate of 8 L/h. Meanwhile, the PRD-based irrigation was alternately transferred between two sides of the plants on a weekly basis [15], and the irrigation was carried out daily. Furthermore, water-saving strategies such as DI70, DI50, PRD70, and PRD50 were applied at day 31 after planting till harvesting.

2.2. Physiological Measurements

The relative chlorophyll (Chl) content of the potato plants was measured with a portable CCM-200 plus chlorophyll content meter (ADC BioScientific Ltd., Hoddesdon, UK) after the onset of the treatments. An LI-6400XT portable photosynthesis system (LiCor Inc., Lincoln, NE, USA) was used to measure An (µmol/m2 s), gs (mol/m2 s), and T (mmol/m2 s). These measurements were monitored six times (4 April–9 May 2014 and 2 April–May 2015) during the treatment periods and were taken around solar midday. The diurnal measurements were performed in five rounds on 7 April 2015. Meanwhile, one-third of the fully expanded upper canopy leaflets were selected for measurement within each treatment, while samples were taken from 15 plants in each round which lasted ~1.5 h. The same leaves were used for leaf water potential (Ψleaf) measurements using a xylem-pressure chamber (mod. 301564, Eijkelkamp, Giesbeek, Netherlands).
Meanwhile, a novel and effective approach was adopted to obtain the xylem (ABA) sample from the potato plants [15,23]. One stem per irrigation treatment was sampled after completing the Chl content and gas-exchange measurements were completed for the same treatment. A pressure of ~0.2–0.4 MPa above the plant equilibrium pressure was applied to obtain ~0.5–1.0 mL of xylem sap using an appropriate pipette. The xylem (ABA) samples were then immediately frozen in liquid nitrogen and subsequently stored at −80 °C until they were analyzed. All the samples were used to determine the ABA content using an enzyme-linked immunosorbent assay (ELISA) [39].

2.3. Estimation of Yield and Water Productivity

Plants from three central rows of the plots were harvested on 21 May 2014 and 18 May 2015 to determine their total fresh tuber yields (Mg/ha). In addition, WP (kg/m3) was used to evaluate the comparative benefits of the irrigation treatments. The WP of each irrigation treatment was computed by dividing the whole mass of harvested fresh tubers (kg/ha) by the quantity of water applied to the crop (additional irrigation, m3/ha) [40].

2.4. Statistical Analysis

Statistical analyses were performed by CoStat [41] to test the equality means of the treatments under study using RCB design. If significant differences existed between the treatments, the least significant difference (LSD) method was used to test the significant differences between every two means. Hence, the point estimation of the treatment mean ± standard error (SE) was calculated from three replicates of each irrigation treatment. Meanwhile, the non-parametric Kolmogorov–Smirnov test was used to verify the assumption of the normality of the data, where the data had a normal distribution when the null hypothesis was Ho. Furthermore, the Levene test was used to verify the homogeneity of the variance, where all treatments variance were equal when the null hypothesis was Ho.

3. Results

3.1. Physiological Responses

3.1.1. Relative Chlorophyll

Table 2 summarizes the analysis of variances of the Chl content of potato plant for the water-saving irrigation treatments in the 2014 and 2015. The Chl content for DI and PRD treatments were increased, but this effect was often insignificant (p > 0.05). The Chl ranges decreased from 9.17–38.08 in 2014 to 8.32–32.67 in 2015. However, significant differences were observed between irrigation treatments in the third (p < 0.01) and sixth (p < 0.05) measurements in 2014, and in the fourth (p < 0.05), fifth (p < 0.05), and sixth (p < 0.01) measurements in 2015. Meanwhile, the Chl content of the PRD50 and FI treatments had the lowest values in 2014 and 2015, respectively. On the other hand, PRD70 had the highest values of Chl content in all measurements, except the fourth measurement in 2015.

3.1.2. Gas-Exchanges

Table 3, Table 4 and Table 5 show the variations in An, gs, and T across the six measurements in 2014 and 2015, respectively. The An of water-saving irrigation techniques (DI and PRD) decreased in all measurements in 2015 (Table 3). However, the An of the PRD treatments were significantly lower than the corresponding values of FI for 69 and 83 days after planting (DAP) in 2014 and 48, 55, 69, and 76 DAP in 2015. The DI50 treatment had the lowest An in all measurements, except in the last measurement in 2014.
Table 4 shows that FI had the highest significant gs values in both years, except at 48, 55, and 76 DAP in 2014, when these were not significantly different from DI and PRD. The average values of gs in different DI and PRD treatments varied mostly between 0.17 and 0.89 mol/m2 s in 2014, and between 0.25 and 0.55 mol/m2 s in 2015. Meanwhile, significant differences were observed between irrigation treatments in the third (p < 0.01), fourth (p < 0.01), and sixth (p < 0.01) measurements in 2014; and in all measurements, except in the third and sixth measurements in 2015. Meanwhile, PRD50 treatment exhibited the lowest values of gs during the experimental phase in 2015.
Table 5 shows that FI treatment had the highest T value among all treatments in 2014 and 2015. However, no significant difference was observed in the treatments when measured at 48, 55, 76, and 83 DAP in 2014, and 48 DAP in 2015. The T values decreased with increasing water restrictions as expected; however, the decrease was more prominent for DI50 and PRD50 than for DI70 and PRD70. Meanwhile, the T value of PRD-treated plants was significantly lower than the corresponding values of the DI-treated plants when measured at all DAP except the last measurement in 2015. In 2014, the T values of DI70 and PRD70 (average values of the third and fourth measurements) were less than the corresponding value of FI by 42.71% and 41.97%, respectively, while the T values of DI70 and PRD70 (average values of the fourth, fifth, and sixth measurements) decreased by 27.37% and 38.48% in 2015, respectively. The same trend was observed for PRD50, where the T values decreased by 52.17% and 53.62% in 2014 and 2015, respectively; and the corresponding value of DI50 decreased by 66.11% and 32.74% in 2014 and 2015, respectively.
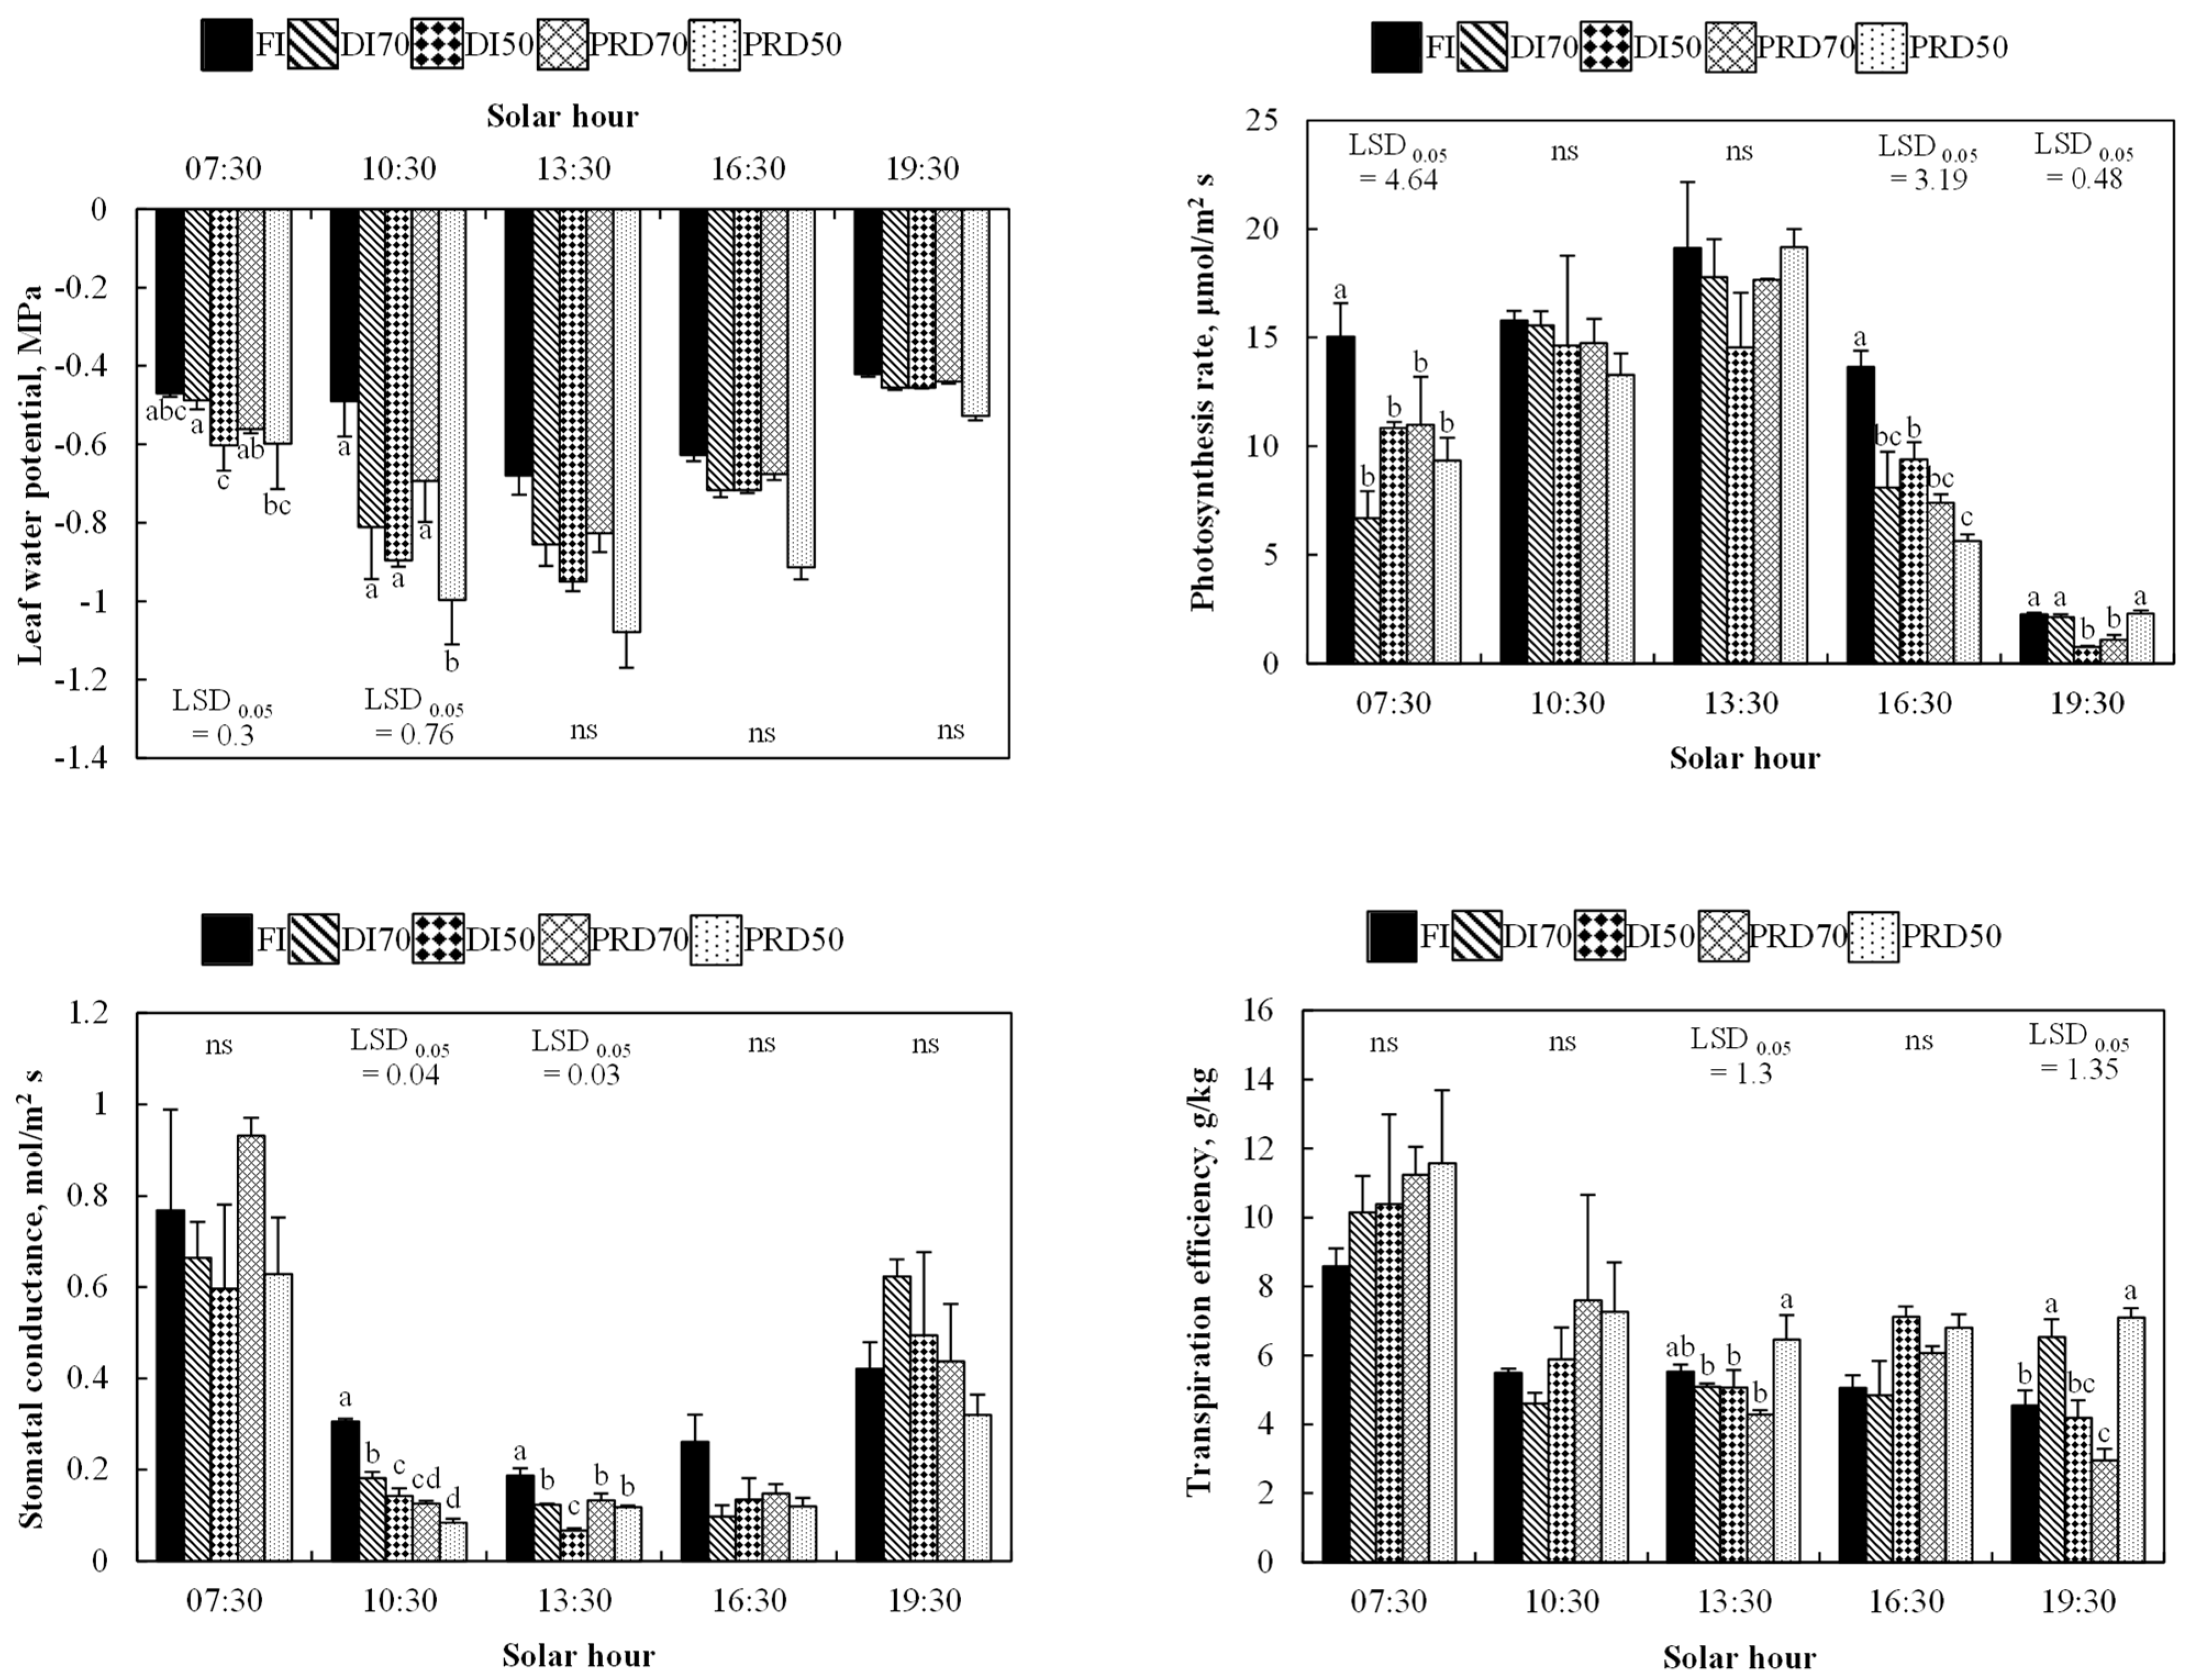
The diurnal variations of Ψleaf, An, gs, and transpiration efficiency (An/T) were measured on 7 April (53 DAP) in 2015, as shown in Figure 2. Significant differences (p < 0.05) in Ψleaf were observed among the treatments for experiments performed at 07:30 (early-morning) and 10:30 (mid-morning). However, the differences were minimal and insignificant at midday and late-evening. The values of Ψleaf varied based on the amount of water received (maximum in FI, minimum in DI50 and PRD50). Meanwhile, the lowest Ψleaf corresponded to PRD50 of −1.08 MPa at midday. However, the early-morning and late-evening measurements of An were significantly different (p < 0.01). Moreover, the values of An at midday were highest throughout the whole day for all irrigation treatments. Figure 2 shows the variation in gs values, which was less evident at early-morning (p > 0.05 among treatments). It decreased until midday (p < 0.001) and then increased at late-evening (p > 0.05). In this study, the values of gs for different irrigation treatments were affected by water stress because the minimum Ψleaf was −1.08 MPa. On the other hand, PRD50 treatment had the highest An/T values which was particularly significant at midday and late-evening (Figure 2). The An/T values of FI were lower in comparison with the values of PRD and DI during all diurnal periods. The average An/T values of DI70 and DI50 were higher than the corresponding value of FI by 6.80% and 11.73%, respectively, while the values of PRD70 and PRD50 decreased by 9.96% and 34.11%, respectively.

3.1.3. Xylem (ABA)

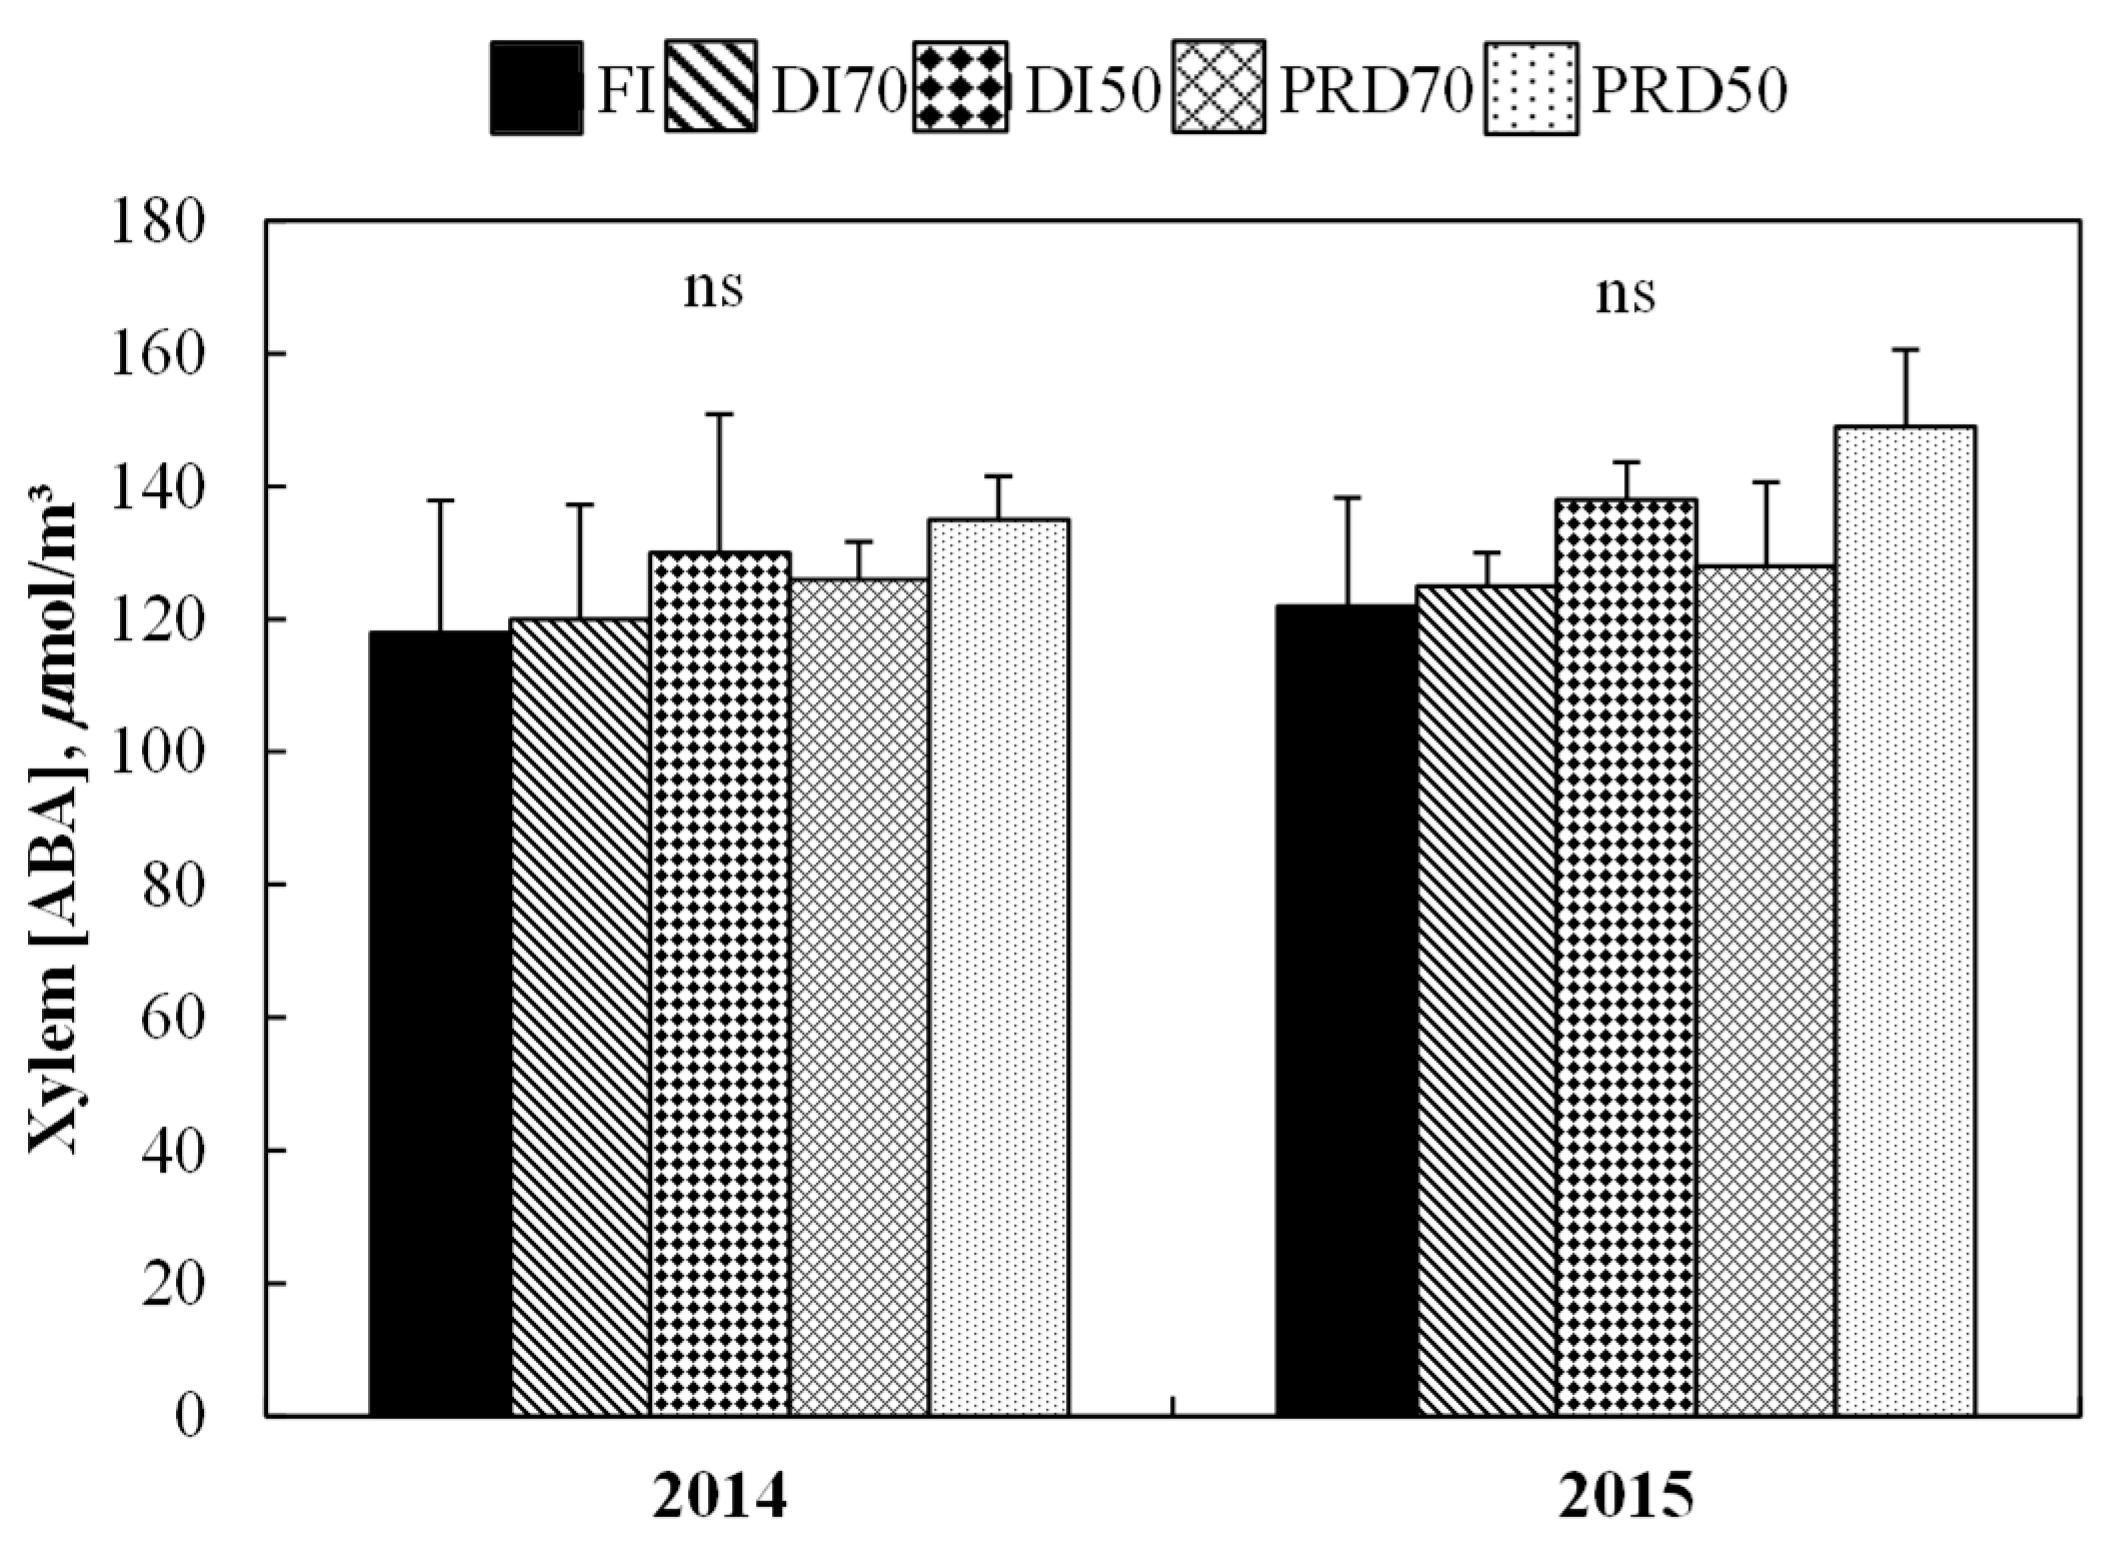
Figure 3 shows the effects of irrigation treatments on the xylem (ABA) of potato plants. The DI and PRD treatments increased the xylem (ABA) in plants in comparison with FI. Meanwhile, these values were statistically insignificant (p > 0.05) in both years. On the other hand, PRD50 treatment had the highest xylem (ABA) value while the values of DI70 treatment were equivalent to FI values in both years.

3.2. Tuber Yields

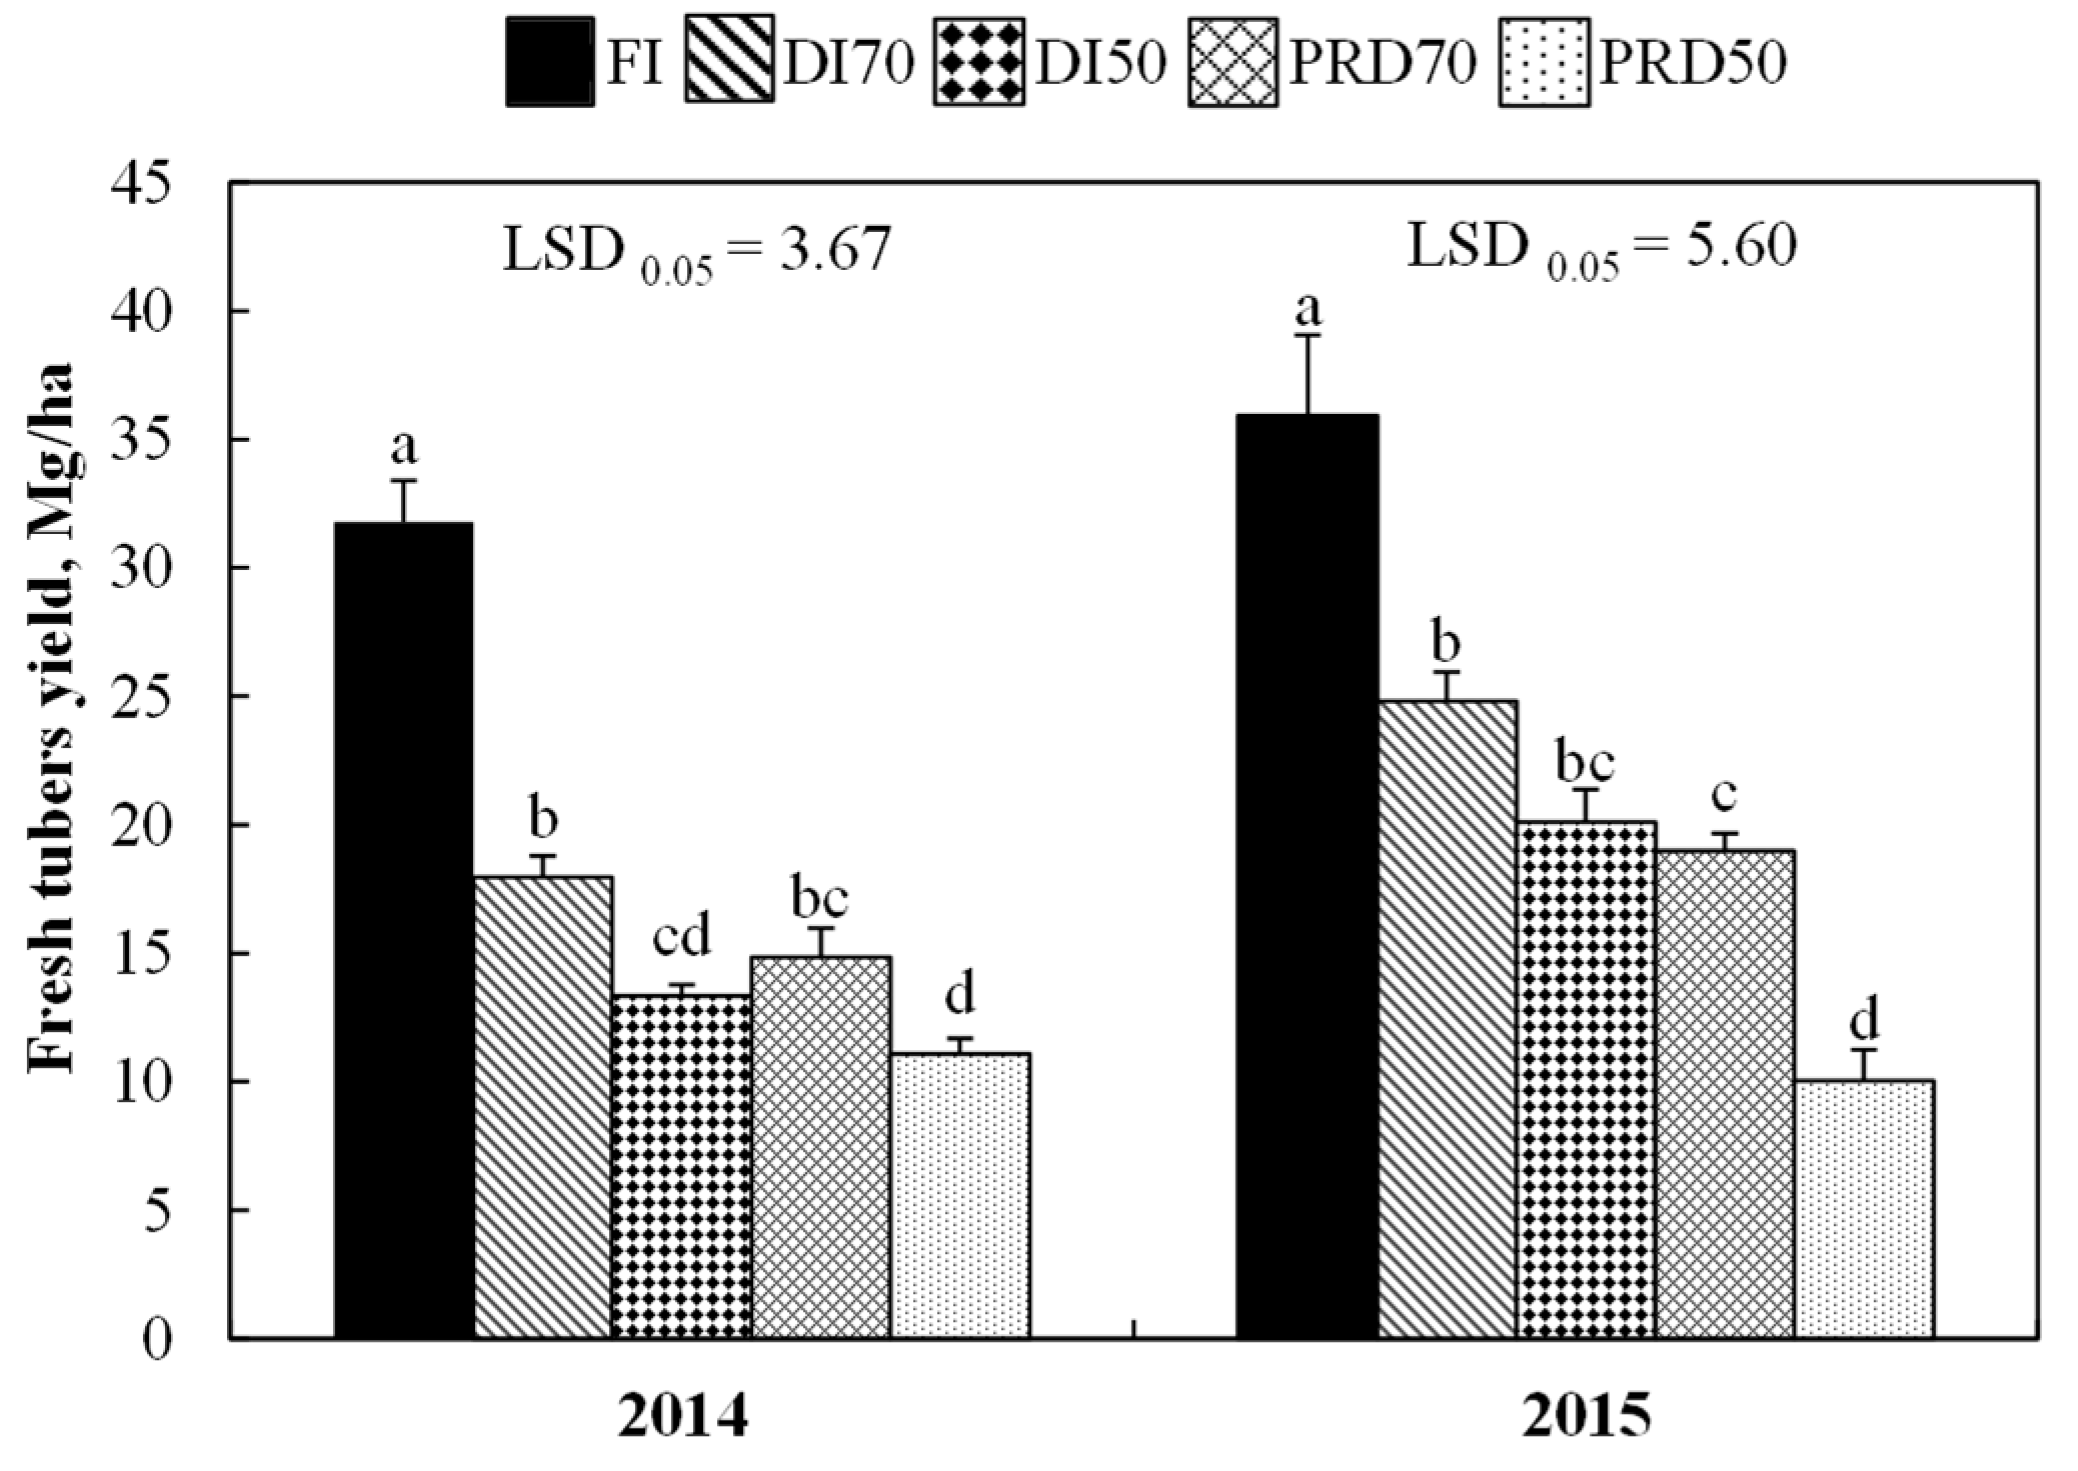
Figure 4 shows that significant differences (p < 0.01) exist for fresh tuber yields for all irrigation treatments in the 2014 and 2015. These differences are indicated by letters directly above the bar graphs. The FI treatment resulted in the highest fresh tuber yields of 31.77 Mg/ha in 2014 and 35.91 Mg/ha in 2015. However, the PRD treatments reduced the fresh yield in comparison with FI and DI treatments. The yields of PRD70- and PRD50-treated plants reduced by 53.24% and 65.15%, respectively, and by 47.18% and 72.02% in 2015, respectively. Meanwhile, DI70 treatment produced the highest fresh tuber yield among the water-saving treatments, while PRD50 had the lowest yield value. In addition, the fresh tuber yield values of PRD70 decreased by 17.28% and 23.54% in comparison with DI70 in 2014 and 2015, respectively. Furthermore, the fresh tuber yield values of PRD50 decreased by 17.03% in 2014 and by 50.02% in 2015 in comparison with DI50.

3.3. Water Productivity

The amounts of total irrigated water per hectare for FI, DI70, and DI50 treatments were 1505, 1049, and 812 mm, respectively, during the entire growing season of 2014. However, 1062 mm of PRD70-based water and 820 mm of PRD50-based water were received during the same year. On the other hand, 1495 mm of FI-based water, 1070 mm of DI70-based water, 797 mm of DI50-based water, 1075 mm of PRD70-based water, and 783 mm of PRD50-based water were received in 2015. The WP values of the water-saving treatments in both years were significantly (p < 0.01) lower than the corresponding value in 2015, except for the WP values of DI50 treatment (Figure 5). In 2014, the WP of PRD70 and PRD50 treatments were significantly reduced by 33.76% and 36.05%, respectively, in comparison to the WP of FI. However, PRD70 and PRD50 treatments decreased by 26.57% and 46.59% in 2015, respectively. When the WP of DI and PRD treatments were compared, DI70 (4.28 kg/m3) and DI50 (4.11 kg/m3) had higher WP values than PRD70 (3.50 kg/m3) and PRD50 (3.37 kg/m3) in 2014, respectively. A similar case was also observed in 2015.

4. Discussion

In this study, the Chl content values of PRD and DI were similar to the corresponding value of FI, which agree with the results of Yactayo et al. [29]. Generally, a decreasing trend in Chl content values was observed in the measurements during the growing season. Thus, the higher Chl content values obtained by DI and PRD treatments suggest that water restriction has a considerable effect on the onset and process of leaf senescence. Moreover, the An values of DI and PRD treatments were often statistically lower in comparison with the corresponding value of FI. This also agrees with earlier studies that presented lower An values for potatoes under drought stress situations in potatoes [23,42]. However, the An values of the PRD and FI treatments had insignificant differences for the same potato cultivar [42]. This inconsistency in results is found in other studies and could be attributed to climate variation [43] as the experiments were performed during hot summer conditions. Thus, the An of potatoes may only be affected when the water stress of the plants are under extremely severe conditions [44,45]. On the other hand, DI and PRD treatments did not have any significant effect on gs values in 2014, which is consistent with the results of Shahnazari et al. [27] and Ahmadi et al. [23], who discovered that no significant difference exists for most gs observations measured in stressed and unstressed field-grown. Moreover, the gs values in 2014 and 2015 were consistent with the results of Liu et al. [15,16]. The lowest gs corresponding to the PRD treatment caused stomatal closure, which occurs whenever the roots experience drought such that chemical signals involved in stomatal regulation are produced [9]. Generally, a water restriction of 50% reduced the T value by more than 30%, while the T values of DI and PRD treatments were lower than the corresponding value of FI treatment. Hence, our T values for DI and PRD are consistent with the results of Liu et al. [15,16].
Meanwhile, the An values for DI- and PRD-treated plants decreased due to exposure to sunlight intensity and other environmental factors. The lowest gs values at midday indicate that the plants experienced the highest water stress levels (i.e., lowest Ψleaf), which could be due to high atmospheric evaporation. In such conditions, root water uptake may be insufficient to cater for the water lost through transpiration [46]. In addition, low Ψleaf values affected the values of ga at midday, which is consistent with the results of Shimsi et al. [47] and Levy [48], who discovered that decreased gs values of potatoes were associated with Ψleaf values less than −0.6 MPa. However, Stark [49] reported a lower Ψleaf value of −1.0 MPa as the critical threshold value in a field study of potato. Furthermore, PRD and DI had the highest An/T values as gs reduced early and decreased more than An underwater stress, thereby increasing An/T [23,50]. The An/T values for PRD treatments were higher than the corresponding values of the DI treatments, because the gs value for PRD was lower than the corresponding value of DI while the An value for PRD was higher than the corresponding value of DI.
Furthermore, the FI had the highest fresh tuber yields in both years; these are common potato yields [28,51,52]. Meanwhile, the fresh tuber yields of PRD treatments were lower in comparison with the yields of DI treatments. This is attributed to two reasons: (1) the climate exhibited high air temperatures, thereby making the potatoes sensitive to drought; and (2) the soil water content within the root zone of the potatoes was different due to the application of different irrigation treatments [28,53]. Hence, the WP values of the water-saving treatments were lower than the value of FI in 2014, which agrees with the results of Ahmadi et al. [54] who discovered that the WP values of the PRD treatments significantly decreased by 31% to 41% in comparison with FI treatment. Moreover, DI treatments had higher WP values than PRD treatments, which is consistent with the results of Liu et al. [16] and Ahmadi et al. [54]. Hence, PRD and DI are ineffective in the arid environments under current field management. This is because water reduction in arid environments contributes ~30% of crop water requirements to soil evaporation [28,29,55,56], despite the prevailing idea that the yield and WP of PRD are better than those of FI and DI [57]. Therefore, PRD strategy can be made effective by reducing the wet/dry cycle to minimize severe water stress on the plants, as determined by Sepaskhah and Parand [58] and in arid and semi-arid regions.

5. Conclusions

The effects of DI and PRD on the physiological characteristics, yield, and WP of potato were studied in comparison with FI in an arid area of Saudi Arabia. The results clearly indicate that DI and PRD do not affect the relative chlorophyll contents of potato plants compared with FI, but have negative impacts on the gas-exchange. Moreover, a 50% water deficit for the PRD insignificantly reduced xylem (ABA) in comparison with FI. A comparison of the treatments where the potato plants received the same amount of water over the whole growing season showed that the fresh tuber yields of PRD treatments were lower than the yields of DI treatments. Meanwhile, the application of 50% water use in PRD decreased WP compared with the results of FI and DI. Thus, a high amount of the applied water in an arid environment might be lost due to soil evaporation, thereby resulting in poor crop performance and WP.

Author Contributions

T.K.Z.E.-A.: conceptualization, funding acquisition, investigation, supervision, project administration, methodology; M.A.M.: formal analysis, investigation, data curation, methodology, project administration, writing—original draft, writing—review and editing; H.M.A.-G.: supervision, visualization; A.A.A.: supervision, visualization.

Funding

This work was financially supported by the Deanship of Scientific Research at King Saud University through research group number RG- 1440-022.

Acknowledgments

The authors extend their appreciation to the Deanship of Scientific Research at King Saud University for their financial support of the present study.

Conflicts of Interest

The authors declare no conflict of interest.

References

  1. Fabeiro, C.; Martín de Santa Olalla, F.; de Juan, J.A. Yield and size of deficit irrigated potatoes. Agric. Water Manag. 2001, 48, 255–266. [Google Scholar] [CrossRef]
  2. Ati, A.S.; Iyada, A.D.; Najim, S.M. Water use efficiency of potato (Solanum tuberosum L.) under different irrigation methods and potassium fertilizer rates. Ann. Agric. Sci. 2012, 57, 99–103. [Google Scholar] [CrossRef]
  3. English, M.J.; Raja, S.N. Perspectives on deficit irrigation. Agric. Water Manag. 1996, 32, 1–14. [Google Scholar] [CrossRef]
  4. Andersen, M.N.; Asch, F.; Wu, Y.; Jensen, C.R.; Naested, H.; Mogensen, V.O.; Koch, K.E. Soluble invertase expression is an early target of drought stress during the critical abortion-sensitive phase of young ovary development in maize. Plant Physiol. 2002, 130, 591–604. [Google Scholar] [CrossRef]
  5. Davies, W.J.; Wilkinson, S.; Loveys, B.R. Stomatal control by chemical signaling and the exploitation of this mechanism to increase water use efficiency in agriculture. New Phytol. 2002, 153, 449–460. [Google Scholar] [CrossRef]
  6. Morison, J.I.L.; Baker, N.R.; Mullineaux, P.M.; Davies, W.J. Improving water use in crop production. Philos. Trans. R. Soc. Lond. B. Biol. Sci. 2008, 363, 639–658. [Google Scholar] [CrossRef] [PubMed]
  7. Loveys, B.R. Diurnal changes in water relations and abscisic acid in field-grown Vitisvinifera cultivars. III. The influence of xylem-derived abscisic acid on leaf gas exchange. New Phytol. 1984, 98, 563–573. [Google Scholar] [CrossRef]
  8. Zhang, J.; Davis, W.J. Change in the concentration of ABA in xylem sap as a function of changing soil water status can account for changes in leaf conductance and growth. Plant Cell Environ. 1990, 13, 277–285. [Google Scholar] [CrossRef]
  9. Davies, W.J.; Zhang, J. Root signals and the regulation of growth and development of plants in drying soil. Annu. Rev. Plant Physiol. Plant Mol. Biol. 1991, 42, 55–76. [Google Scholar] [CrossRef]
  10. Sauter, A.; Davies, W.J.; Hartung, W. The long-distance abscisic acid signal in the droughted plant: The fate of the hormone on its way from root-to-shoot. J. Exp. Bot. 2001, 52, 1991–1997. [Google Scholar] [CrossRef] [PubMed]
  11. Liu, F.L.; Jensen, C.R.; Andersen, M.N. A review of drought adaptation in crop plants: Changes in vegetative and reproductive physiology induced by ABA-based chemical signals. Aust. J. Agric. Res. 2005, 56, 1245–1252. [Google Scholar] [CrossRef]
  12. Dodd, I.C. Soil moisture heterogeneity during deficit irrigation alters root-to-shoot signaling of abscisic acid. Funct. Plant Biol. 2007, 34, 439–448. [Google Scholar] [CrossRef]
  13. Schachtman, D.P.; Goodger, J.Q.D. Chemical root to shoot signaling under drought. Trends Plant Sci. 2008, 13, 281–287. [Google Scholar] [CrossRef] [PubMed]
  14. Stoll, M.; Loveys, B.R.; Dry, P. Hormonal changes induced by partial root-zone drying of irrigated grapevine. J. Exp. Bot. 2000, 51, 1627–1634. [Google Scholar] [CrossRef] [PubMed]
  15. Liu, F.L.; Shahnazari, A.; Andersen, M.N.; Jacobsen, S.E.; Jensen, C.R. Physiological responses of potato (Solanumtuberosum L.) to partial root-zone drying: ABA signaling, leaf gas exchange, and water use efficiency. J. Exp. Bot. 2006, 57, 3727–3735. [Google Scholar] [CrossRef] [PubMed]
  16. Liu, F.L.; Shahnazari, A.; Andersen, M.N.; Jacobsen, S.E.; Jensen, C.R. Effects of deficit irrigation (DI) and partial root drying (PRD) on gas exchange, biomass partitioning, and water use efficiency in potato. Sci. Hortic. 2006, 109, 113–117. [Google Scholar] [CrossRef]
  17. Dodd, I.C. Rhizposphere manipulations to maximize ‘crop per drop’ during deficit irrigation. J. Exp. Bot. 2009, 60, 1–6. [Google Scholar] [CrossRef]
  18. Wang, Y.S.; Liu, F.L.; Andersen, M.N.; Jensen, C.R. Improved plant nitrogen nutrition contributes to higher water use efficiency in tomatoes under alternate partial root-zone irrigation. Funct. Plant Biol. 2010, 37, 175–182. [Google Scholar] [CrossRef]
  19. Ali, M.; Jensen, C.R.; Mogensen, V.O. Early signals in field grown wheat in response to hallow soil drying. Aus. J. Plant Physiol. 1998, 25, 871–882. [Google Scholar]
  20. Holbrook, N.M.; Shashidhar, V.R.; James, R.A.; Munns, R. Stomatal control in tomato with ABA-deficient roots: Response of grafted plants to soil drying. J. Exp. Bot. 2002, 53, 1503–1514. [Google Scholar]
  21. Bahrun, A.; Jensen, C.R.; Asch, F.; Mogensen, V.O. Drought-induced changes in xylem pH, ionic composition, and ABA concentration act as early signals in field-grown maize (Zea mays L.). J. Exp. Bot. 2002, 53, 251–263. [Google Scholar] [CrossRef] [PubMed]
  22. Kang, S.Z.; Zhang, J.H. Controlled alternate partial root-zone irrigation: Its physiological consequences and impact on water use efficiency. J. Exp. Bot. 2004, 55, 2437–2446. [Google Scholar] [CrossRef] [PubMed]
  23. Ahmadi, S.H.; Andersen, M.N.; Plauborg, F.; Poulsen, R.T.; Jensen, C.R.; Sepaskhah, A.R.; Hansen, S. Effects of irrigation strategies and soils on field grown potatoes: Gas exchange and xylem [ABA]. Agric. Water Manag. 2010, 97, 1486–1494. [Google Scholar] [CrossRef]
  24. Jensen, C.R.; Battilani, A.; Plauborg, F.; Psarras, G.; Chartzoulakis, K.; Janowiak, F.; Stikic, R.; Jovanovic, Z.; Li, G.; Qi, X.; et al. Deficit irrigation based on drought tolerance and root signaling in potatoes and tomatoes. Agric. Water Manag. 2010, 98, 403–413. [Google Scholar] [CrossRef]
  25. Shahabian, M.; Samar, S.M.; Talaie, A.; Emdad, M.R. Response of orange trees to deficit irrigation strategies in the north of Iran. Arch. Agron. Soil Sci. 2012, 58, 267–276. [Google Scholar] [CrossRef]
  26. Xie, K.; Wang, X.X.; Zhang, R.; Gong, X.; Zhang, S.; Mares, V.; Gavilán, C.; Posadas, A.; Quiroz, R. Partial root-zone drying irrigation and water utilization efficiency by the potato crop in semi-arid regions in China. Sci. Hortic. 2012, 134, 20–25. [Google Scholar] [CrossRef]
  27. Shahnazari, A.; Liu, F.; Andersen, M.N.; Jacobsen, S.E.; Jensen, C.R. Effects of partial root-zone drying on yield, tuber size and water use efficiency in potato under filed conditions. Field Crops Res. 2007, 100, 117–124. [Google Scholar] [CrossRef]
  28. Ahmadi, S.H.; Andersen, M.N.; Plauborg, F.; Poulsen, R.T.; Jensen, C.R.; Sepaskhah, A.R.; Hansen, S. Effects of irrigation strategies and soils on field grown potatoes: Yield and water productivity. Agric. Water Manag. 2010, 97, 1923–1930. [Google Scholar] [CrossRef]
  29. Yactayo, W.; Ramírez, D.A.; Gutiérrez, R.; Mares, V.; Posadas, A.; Quiroz, R. Effect of partial root-zone drying irrigation timing on potato tuber yield and water use efficiency. Agric. Water Manag. 2013, 123, 65–70. [Google Scholar] [CrossRef]
  30. Fernández, J.E.; Perez-Martin, A.; Torres-Ruiz, J.M.; Cuevas, M.V.; Rodriguez-Dominguez, C.M.; Elsayed-Farag, S.; Morales-Sillero, A.; García, J.M.; Hernandez-Santana, V.; Diaz-Espejo, A. A regulated deficit irrigation strategy for hedgerow olive orchards with high plant density. Plant Soil 2013, 372, 279–295. [Google Scholar] [CrossRef] [Green Version]
  31. Karandish, F. Improved soil–plant water dynamics and economic water use efficiency in a maize field under locally water stress. Arch. Agron. Soil Sci. 2016, 69, 1311–1323. [Google Scholar] [CrossRef]
  32. Padilla-Díaz, C.M.; Rodriguez-Dominguez, C.M.; Hernandez-Santana, V.; Perez-Martin, A.; Fernández, J.E. Scheduling regulated deficit irrigation in a hedgerow olive orchard from leaf turgor pressure related measurements. Agric. Water Manag. 2016, 164, 28–37. [Google Scholar] [CrossRef] [Green Version]
  33. Hernandez-Santana, V.; Fernández, J.E.; Cuevas, M.V.; Perez-Martin, A.; Diaz-Espejo, A. Photosynthetic limitations by water deficit: Effect on fruit and olive oil yield, leaf area and trunk diameter and its potential use to control vegetative growth of super-high density olive orchards. Agric. Water Manag. 2017, 184, 9–18. [Google Scholar] [CrossRef]
  34. Allen, R.G.; Pereira, L.S.; Raes, D.; Smith, M. Crop Evapotranspiration: Guidelines for Computing Crop Water Requirements; FAO Irrigation and Drainage Paper 56; FAO: Rome, Italy, 1998. [Google Scholar]
  35. Doorenbos, J.; Pruitt, W.O. Guidelines for Predicting Crop Water Requirements; Irrigation and Drainage Paper No. 24; FAO: Rome, Italy, 1977; p. 179. [Google Scholar]
  36. Klute, A. Water retention: Laboratory methods. In Methods of Soil Analysis. Part 1: Physical and Mineralogical Methods; Klute, A., Ed.; American Society of Agronomy: Madison, WI, USA, 1986. [Google Scholar]
  37. Dirksen, C. Soil Physics Measurements; Catena Verlag: Reiskirchen, Germany, 1999. [Google Scholar]
  38. Blacke, G.R. Bulk density. In Methods of Soil Analysis. Part 1: Physical and Mineralogical Methods; Black, C.A., Evans, D.D., Ensminger, L.E., White, J.L., Clark, F.E., Eds.; American Society of Agronomy: Madison, WI, USA, 1965; pp. 374–390. [Google Scholar]
  39. Asch, F. Determination of Abscisic Acid by Indirect Enzyme Linked Immunosorbent Assay (ELISA); Technical Report; Laboratory for Agrohydrology and Bioclimatology, Department of Agricultural Sciences, The Royal Veterinary and Agricultural University: Taastrup, Denmark, 2000. [Google Scholar]
  40. Kirda, C.; Topcu, S.; Kaman, H.; Ulger, A.C.; Yazici, A.; Cetin, M.; Derici, M.R. Grain yield response and N-fertilizer recovery of maize under deficit irrigation. Field Crops Res. 2005, 93, 132–141. [Google Scholar] [CrossRef]
  41. CoStat Version 6.311 Copyright_ 1998–2005 CoHort Software798 Lighthouse Ave; PMB 320; CoHort Software: Monterey, CA, USA, 2005.
  42. Liu, F.L.; Song, R.; Zhang, X.; Shahnazari, A.; Andersen, M.N.; Plauborg, F.; Jacobsen, S.E.; Jensen, C.R. Measurement and modeling of ABA signaling in potato (Solanumtuberosum L.) during partial root-zone drying. Environ. Exp. Bot. 2008, 63, 385–391. [Google Scholar] [CrossRef]
  43. Bowen, W.T. Water Productivity and Potato Cultivation. In Water Productivity in Agriculture: Limits and Opportunities for Improvement; Kijne, J.W., Barker, R., Molden, D., Eds.; CABI Publishing: Oxfordshire, England, 2003; p. 332. [Google Scholar]
  44. Vos, J.; Haverkort, A.J. Water availability and potato crop performance. In Potato Biology and Biotechnology: Advances and Perspectives; Vreugdenhil, D., Ed.; Elsevier: Amsterdam, The Netherlands, 2007; pp. 333–351. [Google Scholar]
  45. Vos, J.; Groenwold, J. Genetic differences in water-use efficiency, stomatal conductance and carbon isotope fractionation in potato. Potato Res. 1989, 32, 113–121. [Google Scholar] [CrossRef]
  46. Jones, H.G. Plants and Microclimate. In A Quantitative Approach to Environmental Plant Physiology, 2nd ed.; Cambridge University Press: Cambridge, UK, 1992. [Google Scholar]
  47. Shimsi, D.; Shalhavet, J.; Meir, T. Irrigation regime effects on some physiological responses of potato. Agron. J. 1983, 75, 262–267. [Google Scholar] [CrossRef]
  48. Levy, D. Varietal differences in the response of potatoes to repeated short periods of water stress in hot climates. 1. Turgor maintenance and stomatal behaviors. Potato Res. 1983, 26, 303–313. [Google Scholar] [CrossRef]
  49. Stark, J.C. Stomatal behavior of potatoes under nonlimiting soil water conditions. Am. Potato J. 1987, 64, 301–309. [Google Scholar] [CrossRef]
  50. Vos, J.; Groenwold, J. Characteristics of photosynthesis and conductance of potato canopies and the effects of cultivar and transient drought. Field Crops Res. 1989, 20, 237–250. [Google Scholar] [CrossRef]
  51. Darwish, T.M.; Atallah, T.W.; Hajhasan, S.; Haidar, A. Nitrogen and water use efficiency of fertigated processing potato. Agric. Water Manag. 2006, 85, 95–104. [Google Scholar] [CrossRef]
  52. Shae, J.B.; Steele, D.D.; Gregor, B.L. Irrigation scheduling methods for potatoes in the northern Great Plains. Trans ASABE 1999, 42, 351–360. [Google Scholar] [CrossRef]
  53. Kaman, H.; Kirda, C.; Sesveren, S. Genotypic differences of maize in grain yield response to deficit irrigation. Agric. Water Manag. 2011, 98, 801–807. [Google Scholar] [CrossRef]
  54. Ahmadi, S.H.; Agharezaee, M.; Kamgar-Haghighib, A.; Sepaskhah, A.R. Effects of dynamic and static deficit and partial root zone drying irrigation strategies on yield, tuber sizes distribution, and water productivity of two field grown potato cultivars. Agric. Water Manag. 2014, 134, 126–136. [Google Scholar] [CrossRef]
  55. De la Hera, M.L.; Romero, P.; Gomez-Plaza, E.; Martinez, A. Is partial root-zone drying an effective irrigation technique to improve water use efficiency and fruit quality in field–grown wine grapes under semiarid conditions? Agric. Water Manag. 2007, 87, 261–274. [Google Scholar] [CrossRef]
  56. Ferreira, T.C.; Goncalves, D.A. Crop-yield/water-use production function of potatoes (Solanum tubersoum L.) grown under differential nitrogen and irrigation treatments in a hot, dry climate. Agric. Water Manag. 2007, 90, 45–55. [Google Scholar] [CrossRef]
  57. Kriedmann, P.E.; Goodwin, I. Regulated Deficit Irrigation and Partial Root-Zone Drying; Irrigation Insights No. 4; Land and Water Australia: Canberra, Australia, 2003; p. 102. [Google Scholar]
  58. Sepaskhah, A.R.; Parand, A.R. Effects of alternate furrow irrigation with supplemental every-furrow irrigation at different growth stages on the yield of maize (Zea mays L.). Plant Prod. Sci. 2006, 9, 415–421. [Google Scholar] [CrossRef]
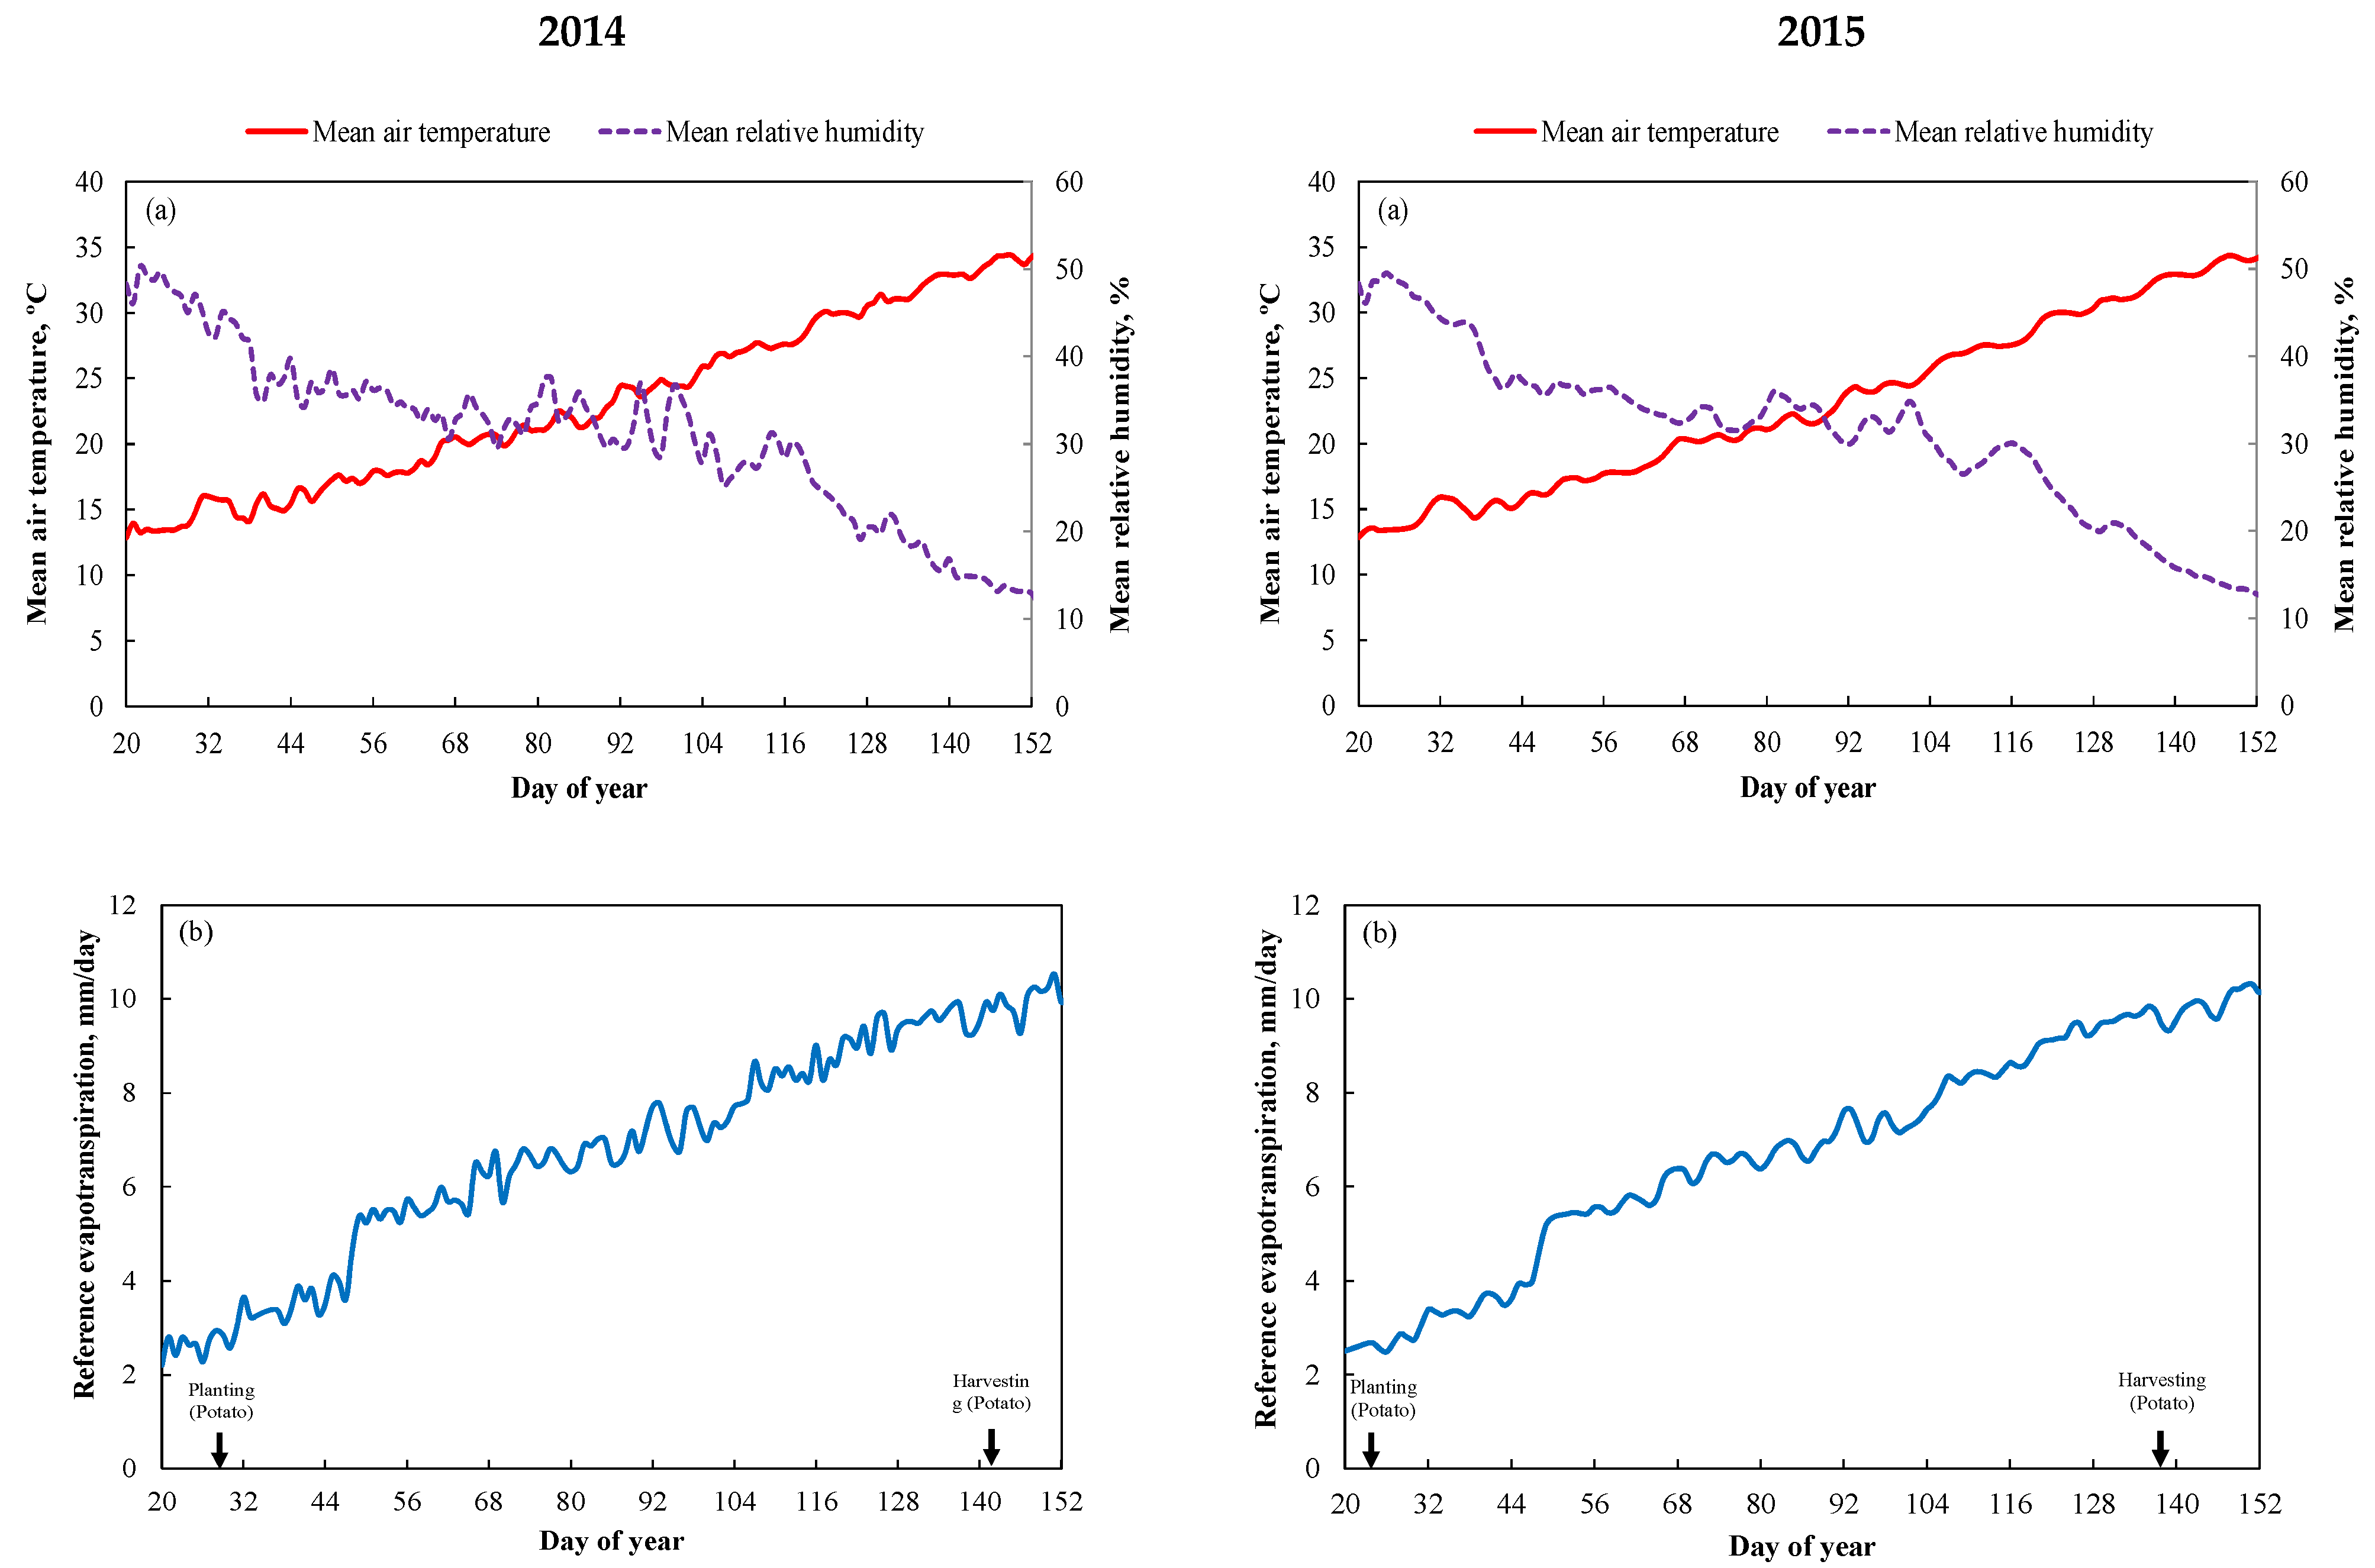
Figure 1. Meteorological variables of (a) mean air temperature and mean relative humidity, and (b) reference evapotranspiration during the 2014 and 2015 experimental periods.
Agronomy 09 00172 g001
Figure 2. Diurnal variations of leaf water potential, photosynthesis rate, stomatal conductance, and transpiration efficiency carried out on 7 April 2015. The bars give ± standard error of the mean (n = 3). The similar letters directly above the columns and the abbreviation of “ns” denote insignificant differences between irrigation treatments based on the LSD test at p < 0.05.
Agronomy 09 00172 g002
Figure 3. Xylem (ABA) values for potato on 15 April 2014 and 20 April 2015 for the different irrigation treatments. The bars give the mean ± standard error of the mean (n = 3). The abbreviation of “ns” denotes insignificant differences between irrigation treatments in each year based on the LSD test at p < 0.05.
Agronomy 09 00172 g003
Figure 4. Fresh tuber yield per hectare for different irrigation treatments in 2014 and 2015. The bars give the mean ± standard error of the mean (n = 3). The similar letters directly above the columns in each year denote insignificant differences between irrigation treatments based on the LSD test at p < 0.05.
Agronomy 09 00172 g004
Figure 5. Water productivity (WP) in potato for different irrigation treatments in 2014 and 2015. The bars give the mean ± standard error of the mean (n = 3). The similar letters directly above the columns in each year denote insignificant differences between irrigation treatments based on the LSD test at p < 0.05.
Agronomy 09 00172 g005
Table 1. Physical properties of soil used in the experiment.
Depth (cm)Particle Size (%)TextureFC (%)WP (%)Ks (mm/h)ρb, (g/cm3)
SandSiltClay
0–2071.816.311.9sandy loam14.2637.81.6
20–4066.71815.3sandy loam17.18.124.61.6
40–6069.118.312.6sandy loam18.59.919.61.6
FC: field capacity; WP: wilting point; Ks: saturated hydraulic conductivity; ρb: bulk density.
Table 2. Relative chlorophyll contents of potato for the different irrigation treatments in 2014 and 2015.
YearTreatments48 DAP55 DAP62 DAP69 DAP76 DAP83 DAP
2014FI29.63 (±3.44)32.25 (±3.78)18.76 (±0.04) b17.37 (±0.87)19.47 (±3.12)9.17 (±1.22) c
DI7033.15 (±2.28)36.12 (±2.51)18.52 (±2.69) b19.50 (±3.90)16.17 (±2.07)10.00 (±1.27) bc
DI5032.85 (±3.20)35.79 (±3.52)28.35 (±1.92) a19.90 (±3.42)23.73 (±1.47)12.10 (±1.60) abc
PRD7034.93 (±3.30)38.08 (±3.63)26.66 (±3.49) a15.80 (±1.37)22.43 (±2.69)13.17 (±1.94) ab
PRD5029.45 (±2.28)30.30 (±3.05)16.70 (±1.22) b15.30 (±1.48)14.77 (±0.94)14.95 (±1.24) a
p-Value0.720.590.010.700.060.05
LSD 0.05--6.93--3.96
2015FI24.40 (±2.17)27.40 (±1.38)19.37 (±0.84)14.77 (±1.14) b15.66 (±0.54) b9.32 (±0.63) b
DI7025.93 (±3.12)27.82 (±1.55)19.00 (±1.20)18.80 (±1.08) ab17.44 (±0.85) ab8.32 (±0.36) b
DI5026.70 (±2.32)29.12 (±0.82)24.57 (±0.32)22.18 (±1.64) a22.98 (±2.00) ab12.09 (±0.37) a
PRD7027.60 (±3.27)32.67 (±1.9924.95 (±1.05)21.98 (±1.15) a22.99 (±2.49) a12.91 (±0.52) a
PRD5024.43 (±2.00)29.43 (±1.51)19.37 (±2.71)17.8 (±1.79) ab18.97 (±0.94) ab9.56 (±1.18) b
p-Value0.880.080.060.030.05<0.01
LSD 0.05---4.575.571.86
The data represent the mean ± standard error of the mean (n = 3). Within each year, the mean values in columns followed by letters a, b, c are significantly different based on the LSD test at p < 0.05. DAP: days after planting; FI: full irrigation with 100% of E T c ; DI70: deficit irrigation with 70% of E T c ; DI50: deficit irrigation with 50% of E T c ; PRD70: partial root-zone drying irrigation with 70% of E T c ; PRD50: partial root-zone drying irrigation with 50% of E T c ; LSD: least significant difference.
Table 3. Net photosynthesis rate of potato for the different irrigation treatments in 2014 and 2015.
YearTreatments48 DAP55 DAP62 DAP69 DAP76 DAP83 DAP
2014FI26.2 (±1.57) ab28.38 (±1.72) ab21.60 (±2.86) a16.00 (±2.13) a14.92 (±0.73) a25.29 (±0.86) a
DI7019.00 (±1.22) bc20.45 (±1.35) bc16.15 (±2.75) b5.13 (±1.68) b9.98 (±1.52) b13.90 (±1.98) bc
DI5016.43 (±1.10) c17.63 (±1.21) c9.59 (±1.81) c8.25 (±0.99) b10.81 (±0.72) b16.97 (±0.27) b
PRD7028.77 (±0.87 a31.21 (±0.96) a21.83 (±1.44) a9.93 (±1.93) b15.93 (±1.51) a15.05 (±3.54) bc
PRD5027.77 (±4.84) a30.09 (±5.33) a23.08 (±0.90) a7.59 (±0.92) b14.71 (±0.99) a10.40 (±0.81) c
p-Value0.020.02<0.010.010.010.01
LSD 0.057.748.535.095.373.536.49
2015FI23.83 (±1.00) a23.81 (±0.52) a22.24 (±1.01)18.54 (±0.20) a16.99 (±0.64) a15.56 (±0.63)
DI7022.38 (±0.30) a22.01 (±1.12) b20.58 (±1.69)11.27 (±0.09) b13.38 (±0.17) b14.73 (±1.79)
DI5018.63 (±0.13) b18.33 (±0.50) c19.65 (±1.05)8.55 (±1.04) c13.56 (±0.29) b9.34 (±1.05)
PRD7021.37 (±1.28) ab20.60 (±1.10) b20.39 (±0.16)12.26 (±1.32) b14.01 (±0.23) b14.54 (±2.52)
PRD5023.45 (±1.44) a18.63 (±0.13) c21.26 (±0.76)11.29 (±0.24) b7.22 (±0.25) c11.69 (±1.47)
p-Value0.03<0.010.56<0.01<0.010.06
LSD 0.053.021.59-2.211.29-
The data represent the mean ± standard error of the mean (n = 3). Within each year, the mean values in columns followed by the letters a, b, c are significantly different based on the LSD test at p < 0.05. DAP: days after planting; FI: full irrigation with 100% of E T c ; DI70: deficit irrigation with 70% of E T c ; DI50: deficit irrigation with 50% of E T c ; PRD70: partial root-zone drying irrigation with 70% of E T c ; PRD50: partial root-zone drying irrigation with 50% of E T c ; LSD: least significant difference.
Table 4. Stomatal conductance of potato for the different irrigation treatments in 2014 and 2015.
YearTreatments48 DAP55 DAP62 DAP69 DAP76 DAP83 DAP
2014FI0.64 (±0.05)0.7 (±0.05)0.89 (±0.09) a0.79 (±0.18) a0.37 (±0.03)0.67 (±0.02) a
DI700.81 (±0.03)0.89 (±0.04)0.38 (±0.03) b0.28 (±0.07) b0.39 (±0.14)0.55 (±0.04) ab
DI500.47 (±0.07)0.51 (±0.08)0.17 (±0.04) c0.36 (±0.04) b0.31 (±0.03)0.43 (±0.10) bc
PRD700.66 (±0.14)0.73 (±0.15)0.56 (±0.03) b0.31 (±0.07) b0.27 (±0.06)0.32 (±0.01) c
PRD500.51 (±0.09)0.56 (±0.10)0.47 (±0.05) b0.28 (±0.01) b0.23 (±0.02)0.37 (±0.05) c
p-Value0.140.14<0.010.010.64<0.01
LSD 0.05--0.180.28-0.13
2015FI0.59 (±0.06) a0.64 (±0.14) a0.89 (±0.23)0.61 (± 0.08) a0.60 (±0.02) a0.62 (±0.04)
DI700.53 (±0.03) a0.52 (±0.04) abc0.52 (±0.15)0.44 (± 0.10) ab0.45 (±0.01) b0.39 (±0.11)
DI500.3 (±0.03) b0.28 (±0.04) c0.47 (±0.10)0.41 (± 0.03) ab0.36 (±0.00) c0.32 (±0.04)
PRD700.55 (±0.08) a0.53 (±0.02) ab0.52 (±0.04)0.29 (± 0.06) b0.29 (±0.01) d0.43 (±0.13)
PRD500.45 (±0.10) ab0.30 (±0.04) bc0.47 (±0.10)0.26 (± 0.03) b0.25 (±0.01) e0.36 (±0.08)
p-Value0.030.040.350.03<0.010.32
LSD 0.050.170.25-0.210.04-
The data represent the mean ± standard error of the mean (n = 3). Within each year, the mean values in columns followed by the letters a, b, c are significantly different based on the LSD test at p < 0.05. DAP: days after planting; FI: full irrigation with 100% of E T c ; DI70: deficit irrigation with 70% of E T c ; DI50: deficit irrigation with 50% of E T c ; PRD70: partial root-zone drying irrigation with 70% of E T c ; PRD50: partial root-zone drying irrigation with 50% of E T c ; LSD: least significant difference.
Table 5. Transpiration rate of potato for the different irrigation treatments in 2014 and 2015.
YearTreatments48 DAP55 DAP62 DAP69 DAP76 DAP83 DAP
2014FI3.40 (±0.24)3.29 (±0.26)4.82 (±0.41) a4.10 (±0.60) a2.38 (±0.15)2.51 (±0.49)
DI703.83 (±0.15)3.76 (±0.16)3.16 (±0.70) b2.01 (±0.41) b2.44 (±0.74)3.18 (±0.20)
DI502.60 (±0.33)2.41 (±0.36)1.21 (±0.25) c1.75 (±0.52) b2.03 (±0.18)2.66 (±0.56)
PRD703.09 (±0.43)2.95 (±0.48)3.36 (±0.17) b1.90 (±0.37) b1.80 (±0.35)1.97 (±0.08)
PRD502.85 (±0.28)2.69 (±0.30)2.53 (±0.34) bc1.77 (±0.06) b1.24 (±0.07)2.00 (±0.33)
p-Value0.110.10<0.010.010.320.27
LSD 0.05--1.401.21--
2015FI3.18 (±0.26)2.85 (±0.17) b5.17 (±0.52) a2.19 (±0.22) a3.27 (±0.08) a3.4 (±0.18) a
DI702.18 (±0.20)3.14 (±0.18) ab4.63 (±0.77) a1.76 (±0.38) ab2.65 (±0.04) b1.92 (±0.24) b
DI502.63 (±0.21)1.81 (±0.27) c3.48 (±0.31) b1.69 (±0.02) ab2.43 (±0.02) b1.71 (±0.21) b
PRD702.54 (±0.43)3.37 (±0.16) a3.38 (±0.22) b1.11 (±0.19) bc1.80 (±0.04) c2.68 (±0.53) ab
PRD502.67 (±0.23)1.87 (±0.25) c3.35 (±0.44) b0.91 (±0.02) c1.19 (±0.25) d2.05 (±0.16) b
p-Value0.24<0.010.020.02<0.010.03
LSD 0.05-0.461.120.690.371.04
The data represent the mean ± standard error of the mean (n = 3). Within each year, the mean values in columns followed by different letters a, b, c are significantly different based on the LSD test at p < 0.05. DAP: days after planting; FI: full irrigation with 100% of E T c ; DI70: deficit irrigation with 70% of E T c ; DI50: deficit irrigation with 50% of E T c ; PRD70: partial root-zone drying irrigation with 70% of E T c ; PRD50: partial root-zone drying irrigation with 50% of E T c ; LSD: least significant difference.