Article

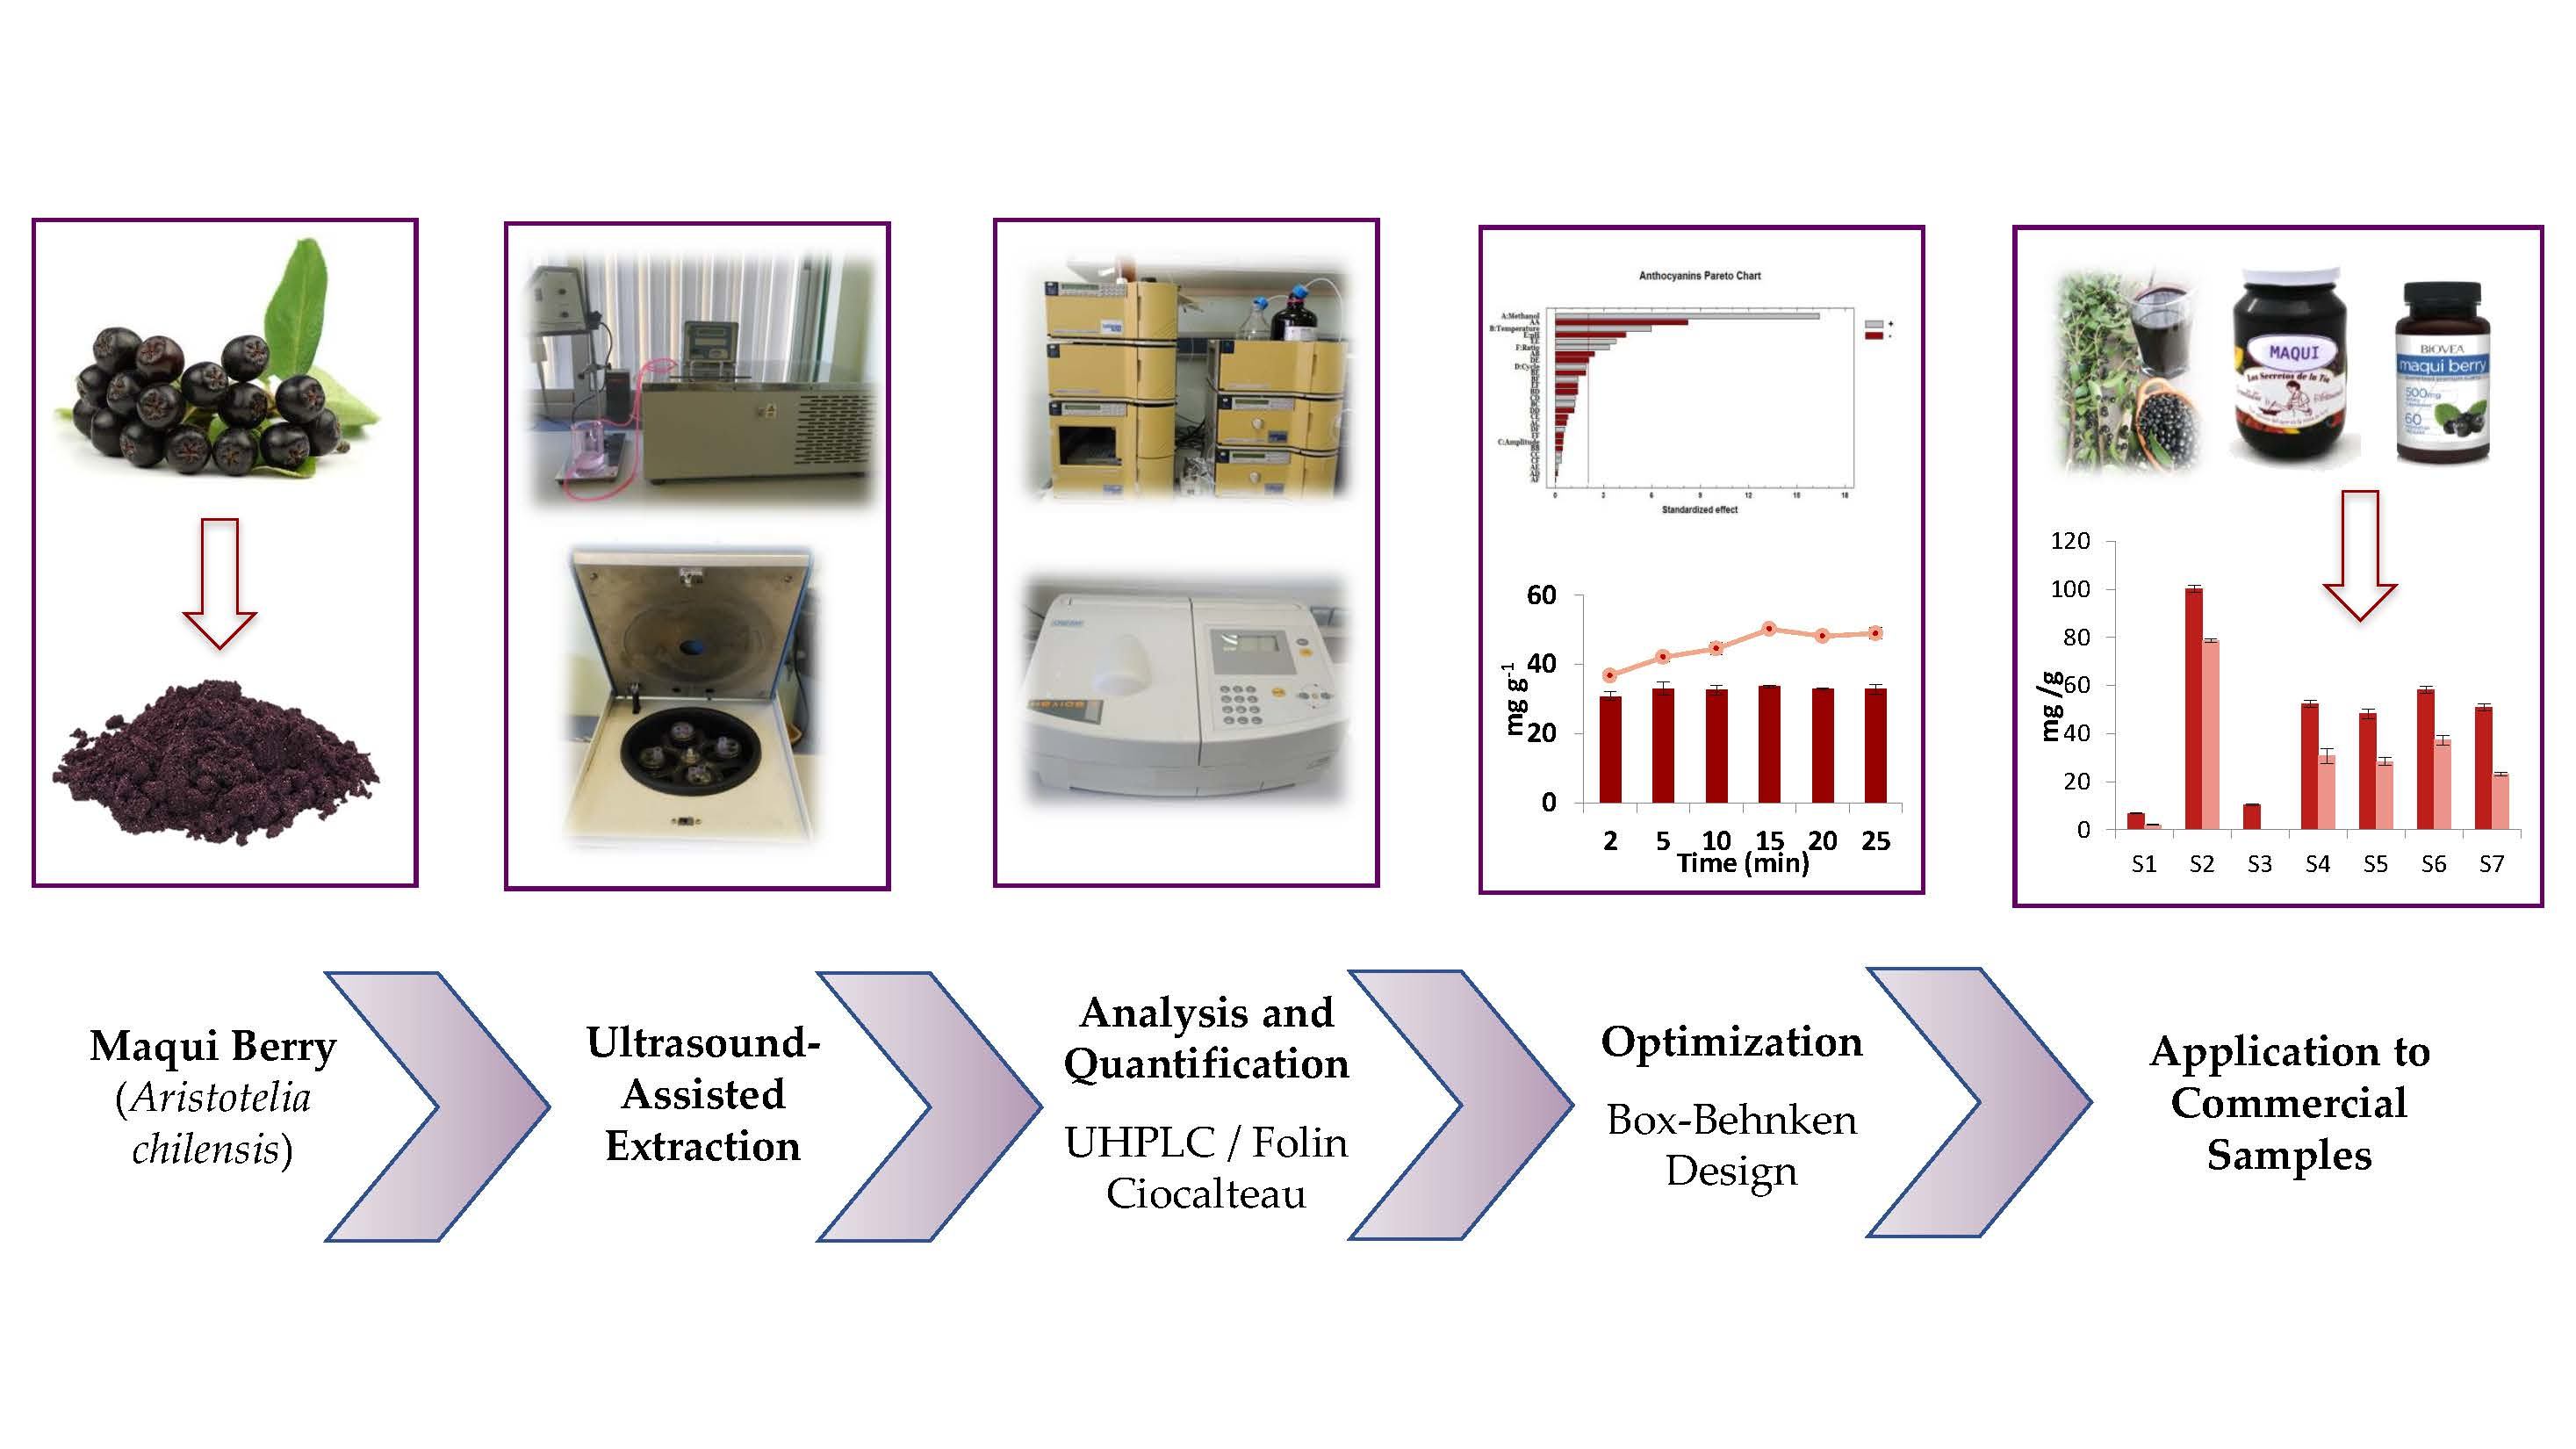
Assessment of Ultrasound Assisted Extraction as an Alternative Method for the Extraction of Anthocyanins and Total Phenolic Compounds from Maqui Berries (Aristotelia chilensis (Mol.) Stuntz)

by
Mercedes Vázquez-Espinosa
,
Ana V. González de Peredo
,
Marta Ferreiro-González
,
Ceferino Carrera
,
Miguel Palma
,
Gerardo F. Barbero
* and
Estrella Espada-Bellido
Department of Analytical Chemistry, Faculty of Sciences, University of Cadiz, Agrifood Campus of International Excellence (ceiA3), IVAGRO, 11510 Puerto Real, Cadiz, Spain
*
Author to whom correspondence should be addressed.
Agronomy 2019, 9(3), 148; https://doi.org/10.3390/agronomy9030148
Submission received: 15 February 2019 / Revised: 15 March 2019 / Accepted: 18 March 2019 / Published: 21 March 2019
(This article belongs to the Special Issue Berry Crop Production and Protection)

Abstract

:
Research interest regarding maqui (Aristotelia chilensis) has increased over the last years due to its potential health benefits as one of the most antioxidant-rich berries. Ultrasound-assisted extraction (UAE) is an advanced green, fast, and ecological extraction technique for the production of high quality extracts from natural products, so it has been proposed in this work as an ideal alternative extraction technique for obtaining extracts of high bioactivity from maqui berries. In order to determine the optimal conditions, the extraction variables (percentage of methanol, pH, temperature, ratio “sample mass/volume of solvent”, amplitude, and cycle) were analyzed by a Box-Behnken design, in conjunction with the response surface method. The statistical analysis revealed that the temperature and the percentage of methanol were the most influential variables on the extraction of the total phenolic compounds and total anthocyanins, respectively. The optimal extraction time was determined at 15 min for total phenolic compounds, while it was only 5 min for anthocyanins. The developed methods showed a high precision level with a coefficient of variation of less than 5%. Finally, the new methods were successfully applied to several real samples. Subsequently, the results were compared to those that were obtained in previous experiments by means of microwave assisted extraction (MAE). Similar extraction yields were obtained for phenolic compounds under optimized conditions. However, UAE proved to be slightly more efficient than MAE in the extraction of anthocyanins.

Graphical Abstract

1. Introduction

In recent years, there has been growing attention for the consumption of food rich in bioactive compounds that are associated to an improvement of health. Small berries, amongst other types of food, represent a diverse group that includes a number of rather small size, perishable, red, blue, and purple fruits, which are highly valued for their intense colour, delicate texture, and unique flavour [1]. Nowadays, there has been a considerable interest in finding natural antioxidants from plant materials to replace the synthetic ones. Berries are a rich source of bioactive compounds, which contribute to their antioxidant activity and different biological functions, so they can prevent diseases and health disorders [2]. Therefore, the interest on them and their analysis has grown enormously. Maqui (Aristotelia chilensis (Mol.) Stuntz), which is a shrub with reddish stems and evergreen leaves, is native to South America, and it grows in dense thickets forming wild populations, called “macales”. It is a dioic berry from the Elaeocarpaceae family and it can grow up to 3–5 m tall. Between December and January, it produces small edible berries of a purple/black colour [3,4].
These berries are extremely rich in phenolic compounds and mainly anthocyanins, which are antioxidant substances that can remove free radicals and by its oxidation inhibit chain reactions. These compounds give maqui berries their intense blackish colour making into one of the berries with the most intense antioxidant properties known so far [5,6]. Special attention has recently been paid to these biological compounds, not only for their use as natural colorants, but also for their use in food and pharmaceutical industries for their disease preventive properties [7,8], as well as a food supplement or functional food product [9,10]. Its consumption can protect you against some chronic diseases, such as cardiovascular disorders, since, thanks to their antioxidants content, can prevent cholesterol from oxidizing in blood. They can also contribute to obesity control by accelerating metabolism and fat burning. Anti-inflammatory, anticarcinogenic, and antidiabetic properties, as well as antibacterial activity have been confirmed among others [11,12].
The phenolic compounds in maqui can be divided into three groups: phenolic acids (gallic acid, hexahydroxydiphenic acid, granatin B, punicacortin C, etc.), flavonols (myricetin, quercetin, kaempferol, and its derivatives), and eight anthocyanins (delphinidin 3-O-sambubioside-5-O-glucoside, delphinidin 3,5-O-diglucoside, cyanidin 3-O-sambubioside-5-O-glucoside, cyanidin 3,5-O-diglucoside, delphinidin 3-O-sambubioside, delphinidin 3-O-glucoside, cyanidin 3-O-glucoside, and cyanidin 3-O-sambubioside) [9,13]. This extraordinary content in bioactive compounds has been granted its recognition as a “superfruit” [14].
However, despite the fact that maqui’s antioxidant capacity is much higher than that of other fruits, large scale plantations are yet to be found, since it is mainly consumed worldwide as an extract or supplement instead of as fresh fruit.
Moreover, maqui berries have only started to be commercialized and they are understudied to date, so hardly any extraction or analysis techniques have been specifically developed in the literature for this fruit. Due to the different characteristics of this fruit as compared to other similar berries, not only in the matrix, but also in the anthocyanins and phenolic compounds, the development, and optimization of extraction techniques specifically for maqui are required. In addition, due to its high cost, the use of other cheaper berries to replace maqui seems to be a serious problem for the food industry, developing adequate techniques that allow for us to control its quality and detecting possible food fraud is essential [15,16]. Due to their advantages when compared to conventional methods, more environmentally friendly, faster, cheaper, and more energy efficient methods, such as microwave-assisted extraction, ultrasonic-assisted extraction, supercritical fluid extraction, or pressurized liquid extraction, have been used to obtain extracts from plant materials [17,18].
In fact, ultrasound assisted extraction (UAE) has been used for the extraction of compounds of interest, since it is simple, rapid, low cost, and energy efficient [19]. Ultrasounds are very high frequency pressure waves, which are transmitted by materials, causing their contraction and subsequent expansion, and consequently the transmission of energy through those materials. The ultrasound signals generate physical and chemical changes in the medium, as they generate bubbles that subsequently collapse due to cavitation. This cavitation breaks the plant matrix cell walls and it favours the penetration of the solvent and the release of the analytes [20,21]. The solid and liquid particles vibrate and then accelerate, because of the ultrasonic action and, as a result, the solute rapidly passes from the solid phase to the solvent [22]. One of the main advantages of this method is its efficiency, since it can obtain greater extraction yields with a lower solvent consumption and in a shorter time that any other extraction technique [23]. This is a widely used technique that has been recently applied to the extraction of compounds of interest from other similar matrices, such as grapes [24], mulberries [25], or blueberries [26].
Several variables can affect efficiency levels of ultrasonic extraction, such as cycle, amplitude, temperature, or type and volume of solvent as well as its pH. In relation to the solvent, aqueous alcohol mixtures are the most commonly used solvents for the extraction of bioactive components from berries [27]. Temperature and pH can cause the degradation of these compounds, so they are to be kept under control [28,29]. Regarding the cycle, the amplitude or power may favour the destruction of the cell walls and improve the mass transfer during the extraction process [30]. Therefore, a study that is based on a Box-Behnken design was carried out to determine the optimal conditions for the extraction method and to evaluate the importance of each factor and the relationships between them [31,32]. The results were treated with a response surface method; a technique that generates a mathematical model where the response of the system can be observed in terms of the factors that are involved and the interactions between them [23,33].
The aim of this work is to develop, based on the comparison of multiple extraction variables, a green and efficient method to extract compounds of biological interest from maqui berries. The medicinal uses of this berry that are attributed by the plant’s secondary metabolites, the unique resources for pharmaceuticals, food additives, and fine chemicals, as well as the high commercial value and demand make the development of simple extraction techniques from this fruit of great interest for the food industry. Moreover, a comparison between UAE and microwave assisted extraction (MAE) performance was also carried out to determine the impact of cavitation in UAE and microwaves in closed systems in MAE.

2. Materials and Methods

2.1. Sample Preparation

Lyophilized maqui from organic farming that was purchased from SuperAlimentos, Mundo Arcoíris, (Besalú, Girona, Spain) was the biological material used for the experiments. The samples were in powder form to increase their contact surface with the solvent and improve the yields. Once the extraction methods had been optimized, several currently commercialized samples in different formats, including capsules, pills, and lyophilized matrix, which contained maqui, were also tested to verify the suitability of the method. Both, the experimental maqui sample and the commercial samples were stored at −20 °C prior to their analysis.

2.2. Chemicals and Reagents

The solvents that were used for the extractions were mixtures of methanol and water. The methanol employed (Fischer Scientific, Loughborough, UK) was HPLC grade. A Milli-Q water purification system from Millipore supplied ultra-pure water (Bedford, MA, USA). To adjust the pH, solutions of hydrochloric acid, and sodium hydroxide (Panreac Química S.A.U., Castellar del Vallés, Barcelona, Spain), grade “for analysis” were used. For the chromatographic separations of the anthocyanins, methanol, milli-Q water, and formic acid (Scharlau S.L., Sentmenat, Barcelona, Spain), HPLC grade, were used, and for its quantification, cyanidin chloride was used (Sigma-Aldrich Chemical Co., St Louis, MO, USA) as a standard pattern. For the quantification of the total phenolic compounds, distilled water, Folin-Ciocalteau reagent (Merck KGaA, EMD Millipore Corporation, Darmstadt, Germany), anhydrous sodium carbonate (Panreac Química S.A.U., Castellar del Vallés, Barcelona, Spain), and gallic acid as a standard (Sigma-Aldrich Chemical Co., St Louis, MO, USA) were used.

2.3. Ultrasound-Assisted Extraction Procedure

The extraction was performed by ultrasonic irradiation while using a Probe UP 200 S (Ultraschallprozessor Dr. Hielscher, Gmbh, Berlin, Germany), which allows for the control and modification of the cycle and the amplitude. This system was coupled with a thermostatic bath (FRIGITERM-10, Selecta, Barcelona, Spain) under controlled temperature. The variables that were to be studied in the different experiments were: percentage of methanol (25⎼50⎼75%), pH (2⎼4.5⎼7), temperature (10⎼40⎼70 °C), sample mass/solvent volume (ratio) (10⎼15⎼20 mL), cycle (0.2⎼0.45⎼0.7 s), and amplitude (30⎼50⎼70%).
Approximately, 0.5 grams of lyophilized sample was weighed in a 50 mL “Falcon” and the appropriate type and volume of solvent was added, depending on the experimental design. The “Falcon” was placed inside a double-walled vessel to control the extraction temperature. The extraction was carried out under controlled UAE conditions for 10 min. After the extraction, the extract was centrifuged twice for 5 min at 11,544× g. The supernatant was transferred in both cases to a 25 mL volumetric flask and then made up to the mark with the same solvent. Finally, the extracts were stored in a freezer at −20 °C prior to their analysis.

2.4. Identification of Anthocyanins

First, the anthocyanins in the extract were filtered through a 0.22-μm syringe filter (Nylon Syringe Filter, FILTER-LAB, Barcelona, Spain) and they were then identified by means of ultra-high-performance liquid chromatography equipment (UHPLC) coupled to a quadrupole-time-of-flight mass spectrometer (QToF-MS) (Xevo G2 QToF, Waters Corp., Milford, MA, USA). The separation was carried out using a C-18 analytical column (Acquity UHPLC BEH C18, Waters Corporation, Milford, MA, USA) of 100 mm × 2.1 mm and 1.7 μm particle size, working in reverse phase. The flow rate was 0.4 mL/min. The mobile phase was a binary solvent system consisting on Milli-Q water that was acidified with 2% formic acid as phase A and pure methanol as phase B, both filtered and degassed, and using the following gradient: 0 min, 15% B; 3.30 min, 20% B; 3.86 min, 30% B; 5.05 min, 40% B; 5.35 min, 55% B; 5.64 min, 60% B; 5.94 min, 95% B; 7.50 min, 95% B. For the determination of the analytes, an electrospray source operating in the positive ionization mode was used under the following conditions: desolvation gas flow = 700 L/h, desolvation temperature = 500 °C, cone gas flow = 10 L h−1, source temperature = 150 °C, capillary voltage = 700 V, cone voltage = 30 V, and collision energy = 20 eV. Full-scan mode was used (m/z = 100–1200). Under the above conditions, eight anthocyanins were identified in the maqui samples (compound, m/z): delphinidin 3-O-sambubioside-5-O-glucoside, 759; delphinidin 3,5-O-diglucoside, 627; cyanidin 3-O-sambubioside-5-O-glucoside, 743; cyanidin 3,5-O-diglucoside, 611; delphinidin 3-O-sambubioside, 597; delphinidin 3-O-glucoside, 465; cyanidin 3-O-glucoside, 449; and, cyanidin 3-O-sambubioside, 581.

2.5. Detection of Anthocyanins

Once the anthocyanins were identified in the maqui samples, their separation and quantification was carried out by a liquid chromatography equipment Elite LaChrom Ultra System (VWR Hitachi, Tokyo, Japan), which was composed by an L-2200 U autosampler, an L-2300 column oven set at 50 °C, two L-2160 U pumps, and a UV-Vis L-2420 U detector set at 520 nm, which is the maximum absorption of anthocyanins. The UHPLC chromatogram and the information about each peak assignment are shown in Figure S1 and Table S1, respectively.
As aforementioned, the extracts that were obtained were first filtered through a 0.22 μm syringe filter (Nylon Syringe Filter, FILTER-LAB, Barcelona, Spain). A C-18 column (Phenomenex Kinetex, CoreShell Technology, Torrance, CA, USA) of 100 × 2.1 mm and particle size of 2.6 μm was used, working in reverse phase. The injection volume was 15 μL. For its separation, Milli-Q water acidified at 5% with formic acid (solvent A) and pure methanol (solvent B) were used, both being filtered through a 0.22 μm filter and degassed by ultrasonic bath (Elma S300 Elmasonic, Singen, Germany). The gradient used was as follows: 0.0 min, 2% B; 2.0 min, 2% B; 3.5 min, 15% B; 5.5 min, 25% B; 6.5 min, 40% B; 7.0 min 100% B; 9.3 min, 100% B; 10.0 min, 2% B; 12.0 min, 2% B, and a flow of 0.7 mL/min. For its quantification, a calibration curve was generated, using cyanidin chloride as the reference standard between 0.05 and 30 mg L−1. The regression equation (y = 252,638.09x − 28,465.10) and the correlation coefficient (0.9998), as well as the detection and quantification limits (LOD = 0.179 mg L−1 and LOQ = 0.597 mg L−1, respectively), were calculated. Finally, assuming that the different anthocyanins have similar absorbance, the anthocyanins that were present in maqui were quantified from the calibration curve of cyanidin chloride, based on the structural similarities and taking their corresponding molecular weights into account. A calibration curve was generated for each anthocyanin present in the maqui berry, which allows for the quantification of each of them [34,35,36]. The results were expressed as a sum of individual anthocyanins as milligrams of cyanidin chloride equivalents per gram of dry fruit.

2.6. Total Phenolic Content (TPC)

The total phenolic content in maqui was expressed as mg of gallic acid equivalents per gram of fresh fruit, according to the modified Folin-Ciocalteau (FC) spectrophotometric method [37,38,39,40]. For this, a UV-Vis Helios Gamma (γ) Unicam (Thermo Fisher Scientific, Waltham, MA, USA) spectrophotometer was used. Prior to their analysis, the extracts were filtered through a 0.45 μm syringe filter (Nylon Syringe Filter, FILTER-LAB, Barcelona, Spain). Subsequently, 0.25 mL of extract, 12.5 mL of water, 1.25 mL of Folin-Ciocalteau reagent, and 5 mL of 20% anhydrous sodium carbonate solution were added to a 25 mL volumetric flask and the solution was made up to the mark with water. A blue colour complex was formed as the result of the reduction of the phenolic compounds that were present in the extract, and after 30 min, its absorbance was determined at 765 nm. The total phenolic content was calculated by means of a calibration curve under the same conditions, using standards of gallic acid of known concentration between 100 and 2000 mg L−1 and measuring their absorbance values. The regression equation (y = 0.0010x + 0.0065) and the correlation coefficient (R2 = 0.9998) were obtained. The results were expressed as mg of gallic acid equivalent per gram of dry fruit.

2.7. Response Surface Regression Analysis

A three-level, six factors Box-Behnken design (BBD), in conjunction with the surface response method, was employed to determine the optimum UAE conditions for the extractions of both types of compounds and their interactions. BBD is a spherical design structure that prevents carrying out the experiments under extreme conditions [41]. BBD ensures the maximum possible amount of data on the system’s response, while a lower number of experiments and smaller amounts of reagent are required [42]. The extraction variables were the percentage of methanol, pH, temperature, solvent volume: sample mass (ratio), cycle, and amplitude, which were coded at three different levels: −1 (low), 0 (medium), and +1 (high). Therefore, the design indicates the execution of 54 experiments, which were randomly carried out to avoid any preconceptions. The experimental data from the two responses—total anthocyanins and total phenolic compounds—were fitted into a second-order polynomial model, as in the following equation [43]:
y = β 0 + i = 1 k β i · x i + β ii · x i 2 + i i = 1 k β ij · x i x j + r
where, y represents the aforementioned responses; β0 is the constant coefficient; βi, βii, and βij are the regression coefficients of linear, quadratic, and interactive terms respectively; xi represent each factor; and, r is the residual value.

2.8. Statistical Analysis

The results were analyzed by means of the statistical program Design Expert software (Trial Version, Stat-Ease Inc., Minneapolis, MN, USA). An Analysis of Variance (ANOVA) was performed to evaluate the quality of the model fitted to the experimental response, the regression terms, and to determine any statistically significant differences (p < 0.05). A response surface method was employed to determine the optimum extraction conditions and the most influential parameters.

3. Results and Discussion

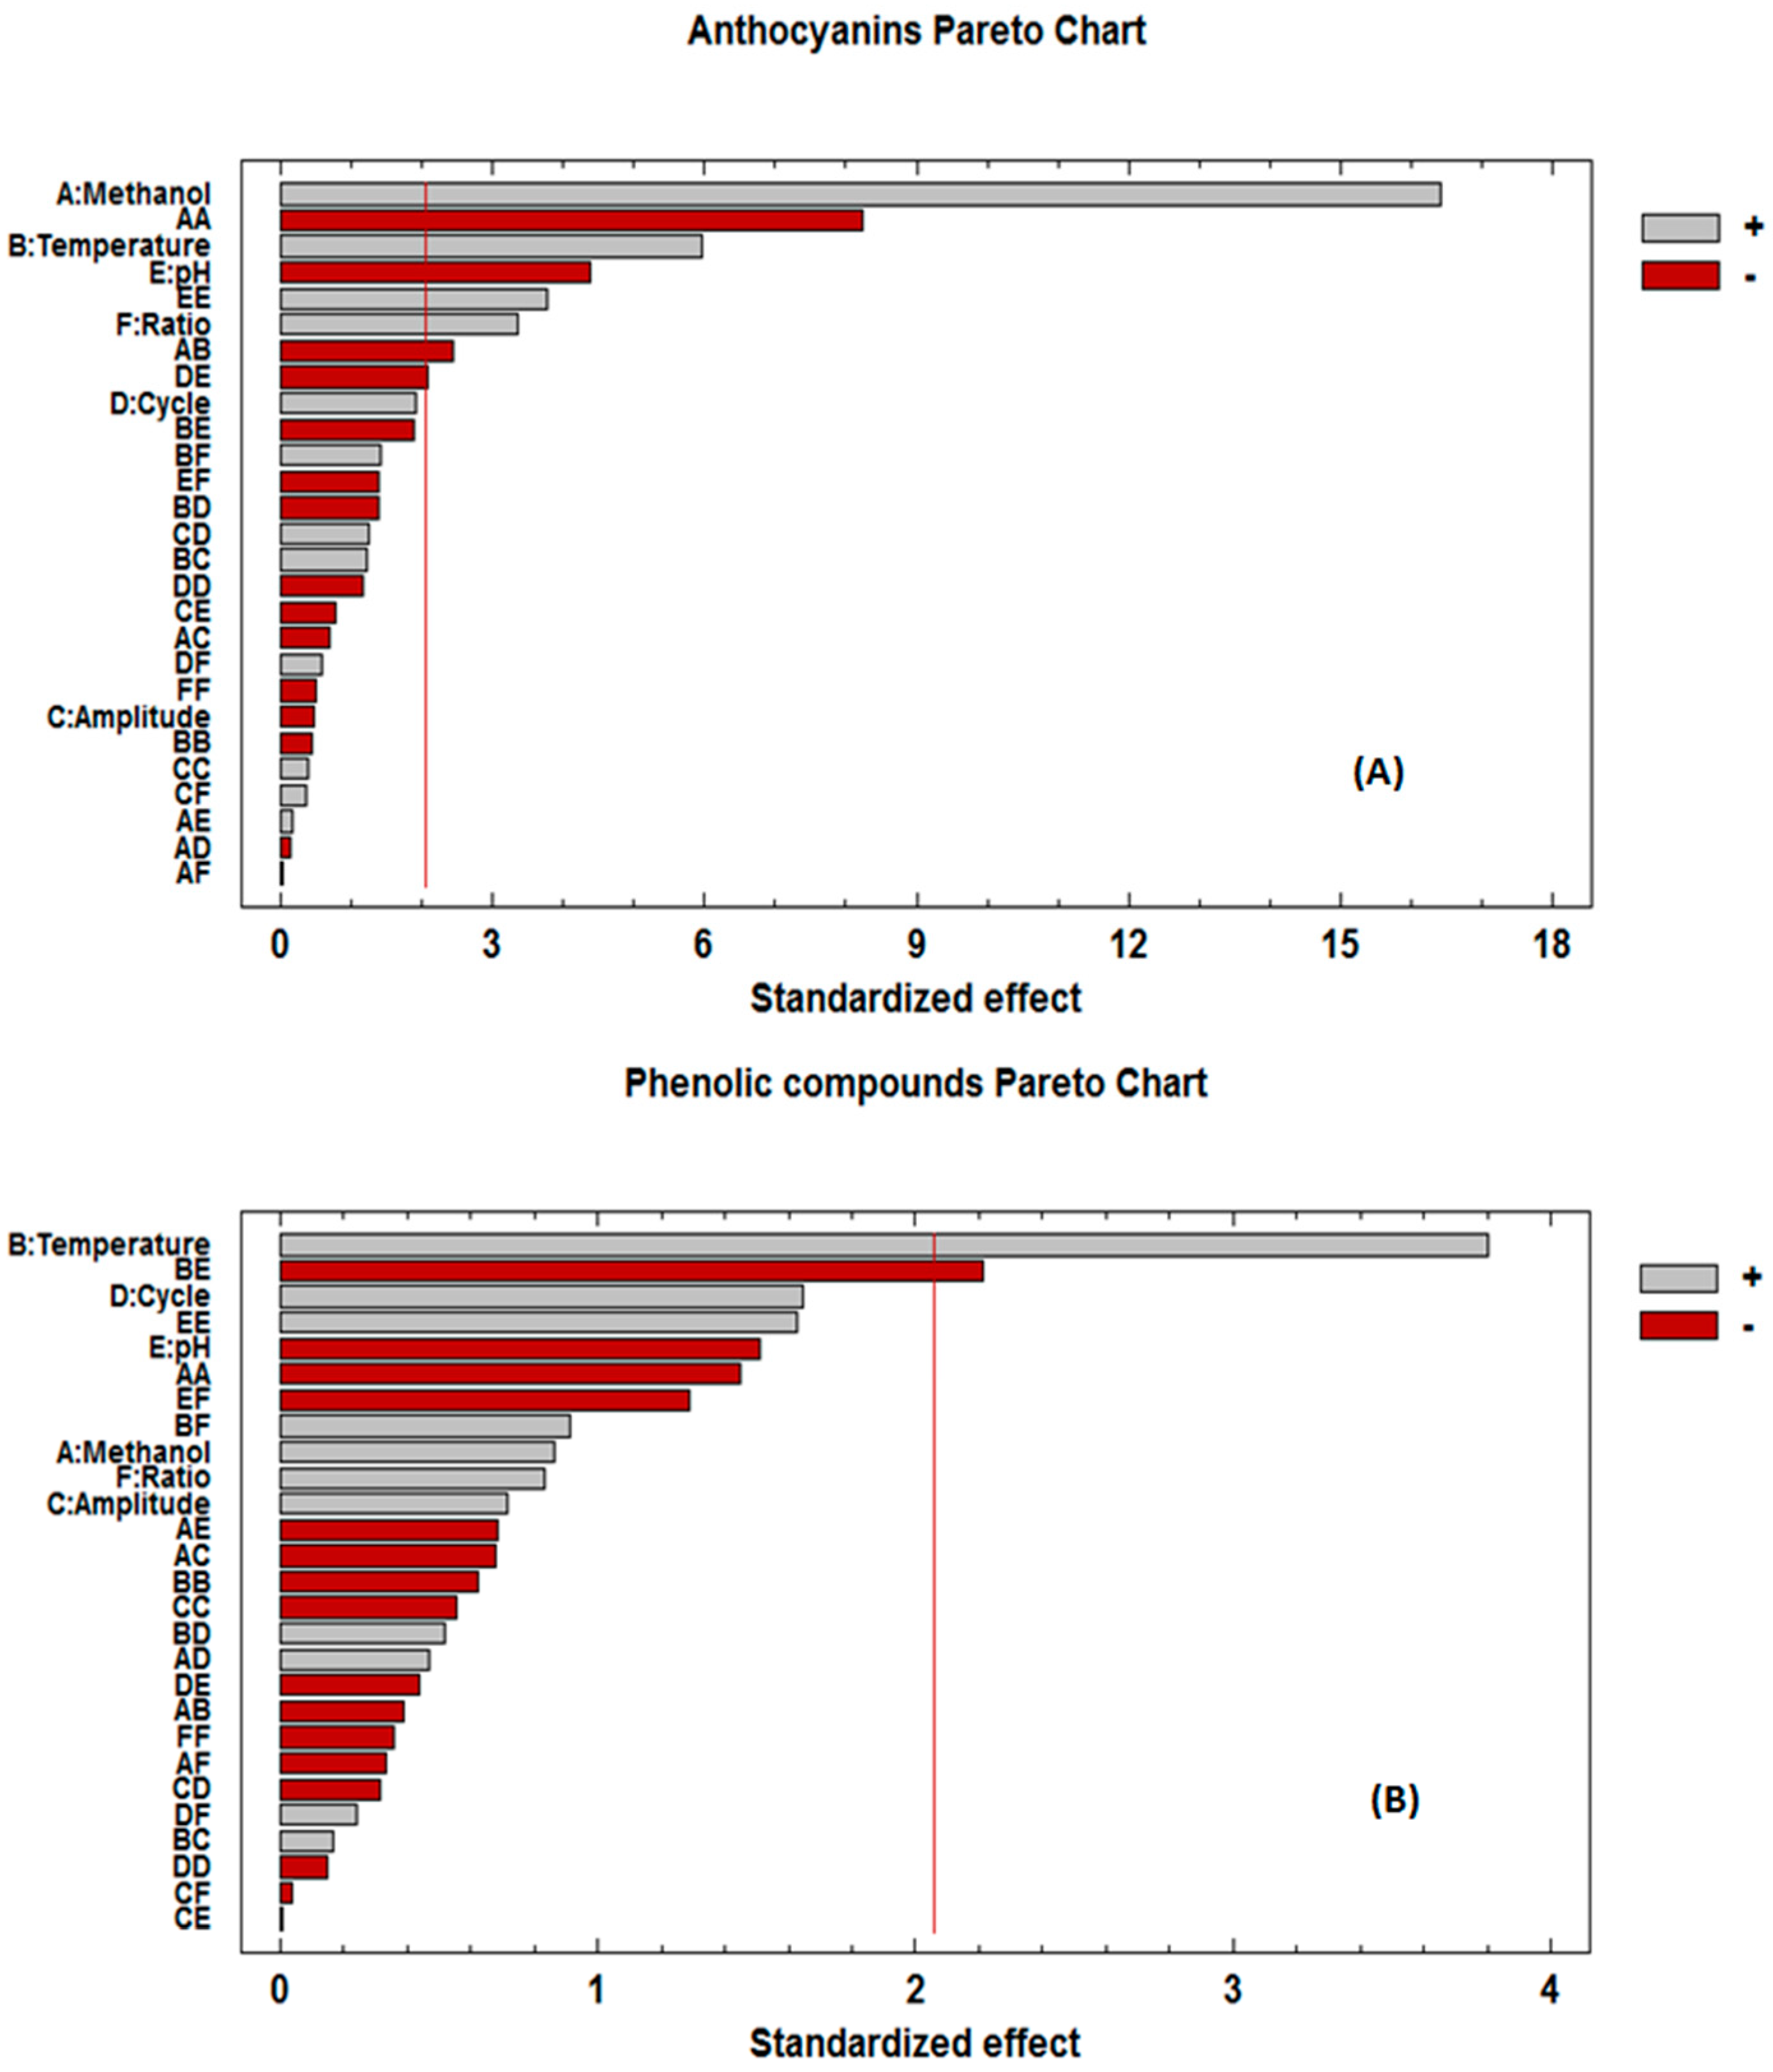
3.1. Fitting the Model of the Extraction Process

For the three-level Box-Behnken design that was employed to determine the optimal UAE conditions, six independent variables: percentage of methanol (25⎼50⎼75%), temperature (10⎼40⎼70 °C), amplitude (30⎼50⎼70%), cycle (0.2⎼0.45⎼0.7 s), pH (2⎼4.5⎼7), and solvent volume:sample mass ratio (10:0.5⎼15:0.5⎼20:0.5 mL:g) and two responses: total anthocyanins and total phenolic compounds, were optimized. The decoded values of the independent variables and the responses that were obtained in the multivariate study from each experiment are shown in Table 1.
Analysis of variance (ANOVA) validates the suitability of the model. This allows for evaluating the effect of the variables to identify the possible interactions between them and to assess the statistical significance of the model, whose results can be seen in Table 2. This analysis also provides information on the mathematical model that is generated from the experimental data. Once the 54 experiments were carried out, the coefficients for the full second-order polynomial equation for both types of compounds were established to predict the responses. In this way, two suitable mathematical models were obtained to describe the response values of the anthocyanins (YTA) and phenolic compounds (YTP), as a function of the independent variables.
YTA (mg g−1 ) = 32.34 + 5.68X1 + 2.07X2 − 0.16X3 + 0.66X4 − 1.52X5 + 1.16X6 − 4.35X12 − 1.46X1 × 2 − 0.42X1 × 3 − 0.06X1 × 4 + 0.10X1 × 5 + 0.02X1 × 6 − 0.24X22 + 0.74X2 × 3 − 0.83X2 × 4 − 0.81X2 × 5 + 0.85X2 × 6 + 0.21X32 + 0.76X3 × 4 − 0.46X3 × 5 + 0.15X3 × 6 − 0.62X42 − 1.25X4 × 5 + 0.36X4 × 6 + 2.00X52 − 0.84X5 × 6 − 0.27X62
YTP (mg g−1 ) = 45.28 + 1.08X1 + 4.74X2 + 0.89X3 + 2.05X4 − 1.88X5 + 1.04X6 − 2.76X12 − 0.84X1 × 2 − 1.46X1 × 3 + 0.71X1 × 4 − 1.48X1 × 5 − 0.72X1 × 6 − 1.18X22 + 0.36X2 × 3 + 1.12X2 × 4 − 3.37X2 × 5 + 1.97X2 × 6 − 1.05X32 − 0.68X3 × 4 + 0.01X3 × 5 − 0.06X3 × 6 − 0.28X42 − 0.95X4 × 5 + 0.52X4 × 6 + 3.01X52 − 2.78X5 × 6 − 0.69X62
As far as the total anthocyanins are concerned, the factors that had a significant linear influence on the response, with a 95% level of confidence, were the percentage of methanol, temperature, pH, and ratio, since their p-values were lower than 0.05. Besides, the lack of fit test showed a p-value that is higher than 0.05 (not significant), which means that the model fits well.
With regards to the phenolic compounds, the influential variables with a p-value lower than 0.05 were temperature and the interaction temperature-pH. In this case, the lack of fit test was significant, with a p-value < 0.05, which indicates that the regression seemed to be inadequate. However, it must be taken into account that phenolic compounds are a group of molecules of high diversity, with a wide range in terms of polarity and sizes. Therefore, the optimal conditions that were determined are a compromise status, where the greatest amount of the desired compounds can be extracted [44].
The Pareto charts in Figure 1 represent the significant effects of all the variables, both linear and quadratic, as well as their interactions. The effects are displayed in decreasing order of significance. The length of each bar is proportional to the absolute magnitude of the estimated effects coefficients, while the vertical line represents the minimal magnitude of statistically significant effects (95% confidence level) with respect to the response.
Regarding anthocyanins, the variable that had the greatest effect on the response was the percentage of methanol, which was determined by the polarity characteristics of both the solvent and the compounds that are present in maqui. Temperature, pH, and ratio also had significant effects, although to a less extent. The percentage of methanol, temperature, and ratio had a positive effect, which means that an increase in these factors favoured the recovery of anthocyanins in the extract. Higher extraction temperatures accelerate molecular motion, penetration, dissolution, and diffusion to favour the releasing of anthocyanins [45]. Regarding the ratio, a smaller amount of sample in a large volume of solvent (large variation in concentration) leads to a greater gradient and, therefore, to a greater extraction, favoured by the transfer of mass. On the contrary, pH has a negative effect on the response variable, i.e., the extraction of anthocyanins was more successful when the pH values were low. The recovery of the anthocyanins in an acidic medium increases due to their stable conformation thanks to the cation flavylium, which confers them their red colour [46,47]. Moreover, the percentage of methanol and pH had a significant quadratic influence on the response, as well as on the interactions methanol-temperature and pH-cycle. Once the influence of the different factors was known, the reduced second order polynomial equation was obtained, where only those variables and/or interactions that had shown a significant effect on the response were considered:
YTA = 32.34 + 5.68X1 + 2.07X2 − 1.52X5 + 1.16X6 − 4.35X12 − 1.46X1 × 2 − 1.25X4 × 5 + 2.00X52
As far as the total phenolic compounds are concerned, the Pareto chart that was obtained differs slightly from the previous one, since fewer influential variables were observed. The analysis of the model clearly showed that temperature was the most influential factor, with a marked positive effect on the extraction. High temperatures favour the breakage of Van der Waals, hydrogen, molecular, or dipole-dipole bonds between the compounds to be extracted, which in turn reduced the required energy that is necessary for their desorption. In addition, the viscosity and the surface tension of the solvent decreases at higher temperatures, which improves the penetration of the solvent into the matrix and a faster dissolution of the extract. This results in the subsequent increase in mass transfer and a greater overall yield [48,49]. The rest of the variables had a similar effect, but less significant effect in absolute terms, so they were not significant factors. Again, a simplified second order polynomial equation was obtained and the results were similar to those of the complete equation:
YTP = 30.19 + 3.16X2 − 2.25X2 × 5

3.2. Optimal Conditions

After the statistical treatment of the data, the optimization of the variables was evaluated while using the quadratic mathematical model within the experimental range studied. Table 3 shows the optimal UAE conditions for the extraction of both anthocyanins and phenolic compounds.
Firstly, it can be observed that, in both cases, the optimum percentage of methanol was an intermediate value between 45–65%. Several papers report an increase in anthocyanins and phenolic compounds extraction with sonication in moderately polar media, which can be explained by the degradation of cellular walls as a result of the cavitation bubbles collapse. Therefore, these compounds are removed from their original location and then transferred to the solvent volume, which favours greater extraction yields [46,50,51].
Temperature is an influential factor in the extraction of bioactive compounds that may affect the stability of phenolic compounds [52]. Using higher temperatures was discarded, because it may reduce the recovery, since these compounds are thermally sensitive, and thus can be easily degraded by the hydrolysis of glucoside compounds and form their corresponding unstable aglycones or by the hydrolytic opening of the heterocyclic ring that would form chalcone in the case of anthocyanins [53]. In addition, working at over 70 °C was not recommended, since methanol may undergo a change of phase and it can evaporate.
Regarding pH, levels that were below 2 were not considered to work, since the compounds of interest might undergo acid hydrolysis [29].
Regarding the ratio, the maximum volume of the range studied was the optimal value. No higher ratios were considered, since the compounds would be difficult to quantify when they are below their quantification limits.
Finally, although the energy that was provided by ultrasound is necessary to release the compounds from the matrix, it may also accelerate the degradation process of the phenolic compounds [54]. In general, the action of the ultrasounds would increase the solubility of the molecules by destroying the intramolecular and intermolecular bonds and by increasing the contact between the hydrophilic groups and the extraction solvents [55]. Although it is clear that the cycle also presents an extreme value, its modification was not considered, since it was not an influential variable.
When the above-mentioned optimal conditions were applied, the total average concentrations of anthocyanins and phenolic compounds were 33.02 mg g−1 and 50.26 mg g−1, respectively. Similar results were reported by other authors in some vegetable matrices [8,56]. It can be observed that the main phenolic compounds that are present in maqui berries are anthocyanins, unlike many other berries that have less anthocyanin content in comparison with the total phenolic compounds. This high anthocyanin’s content greatly contributes to their superior antioxidant capacity [7].

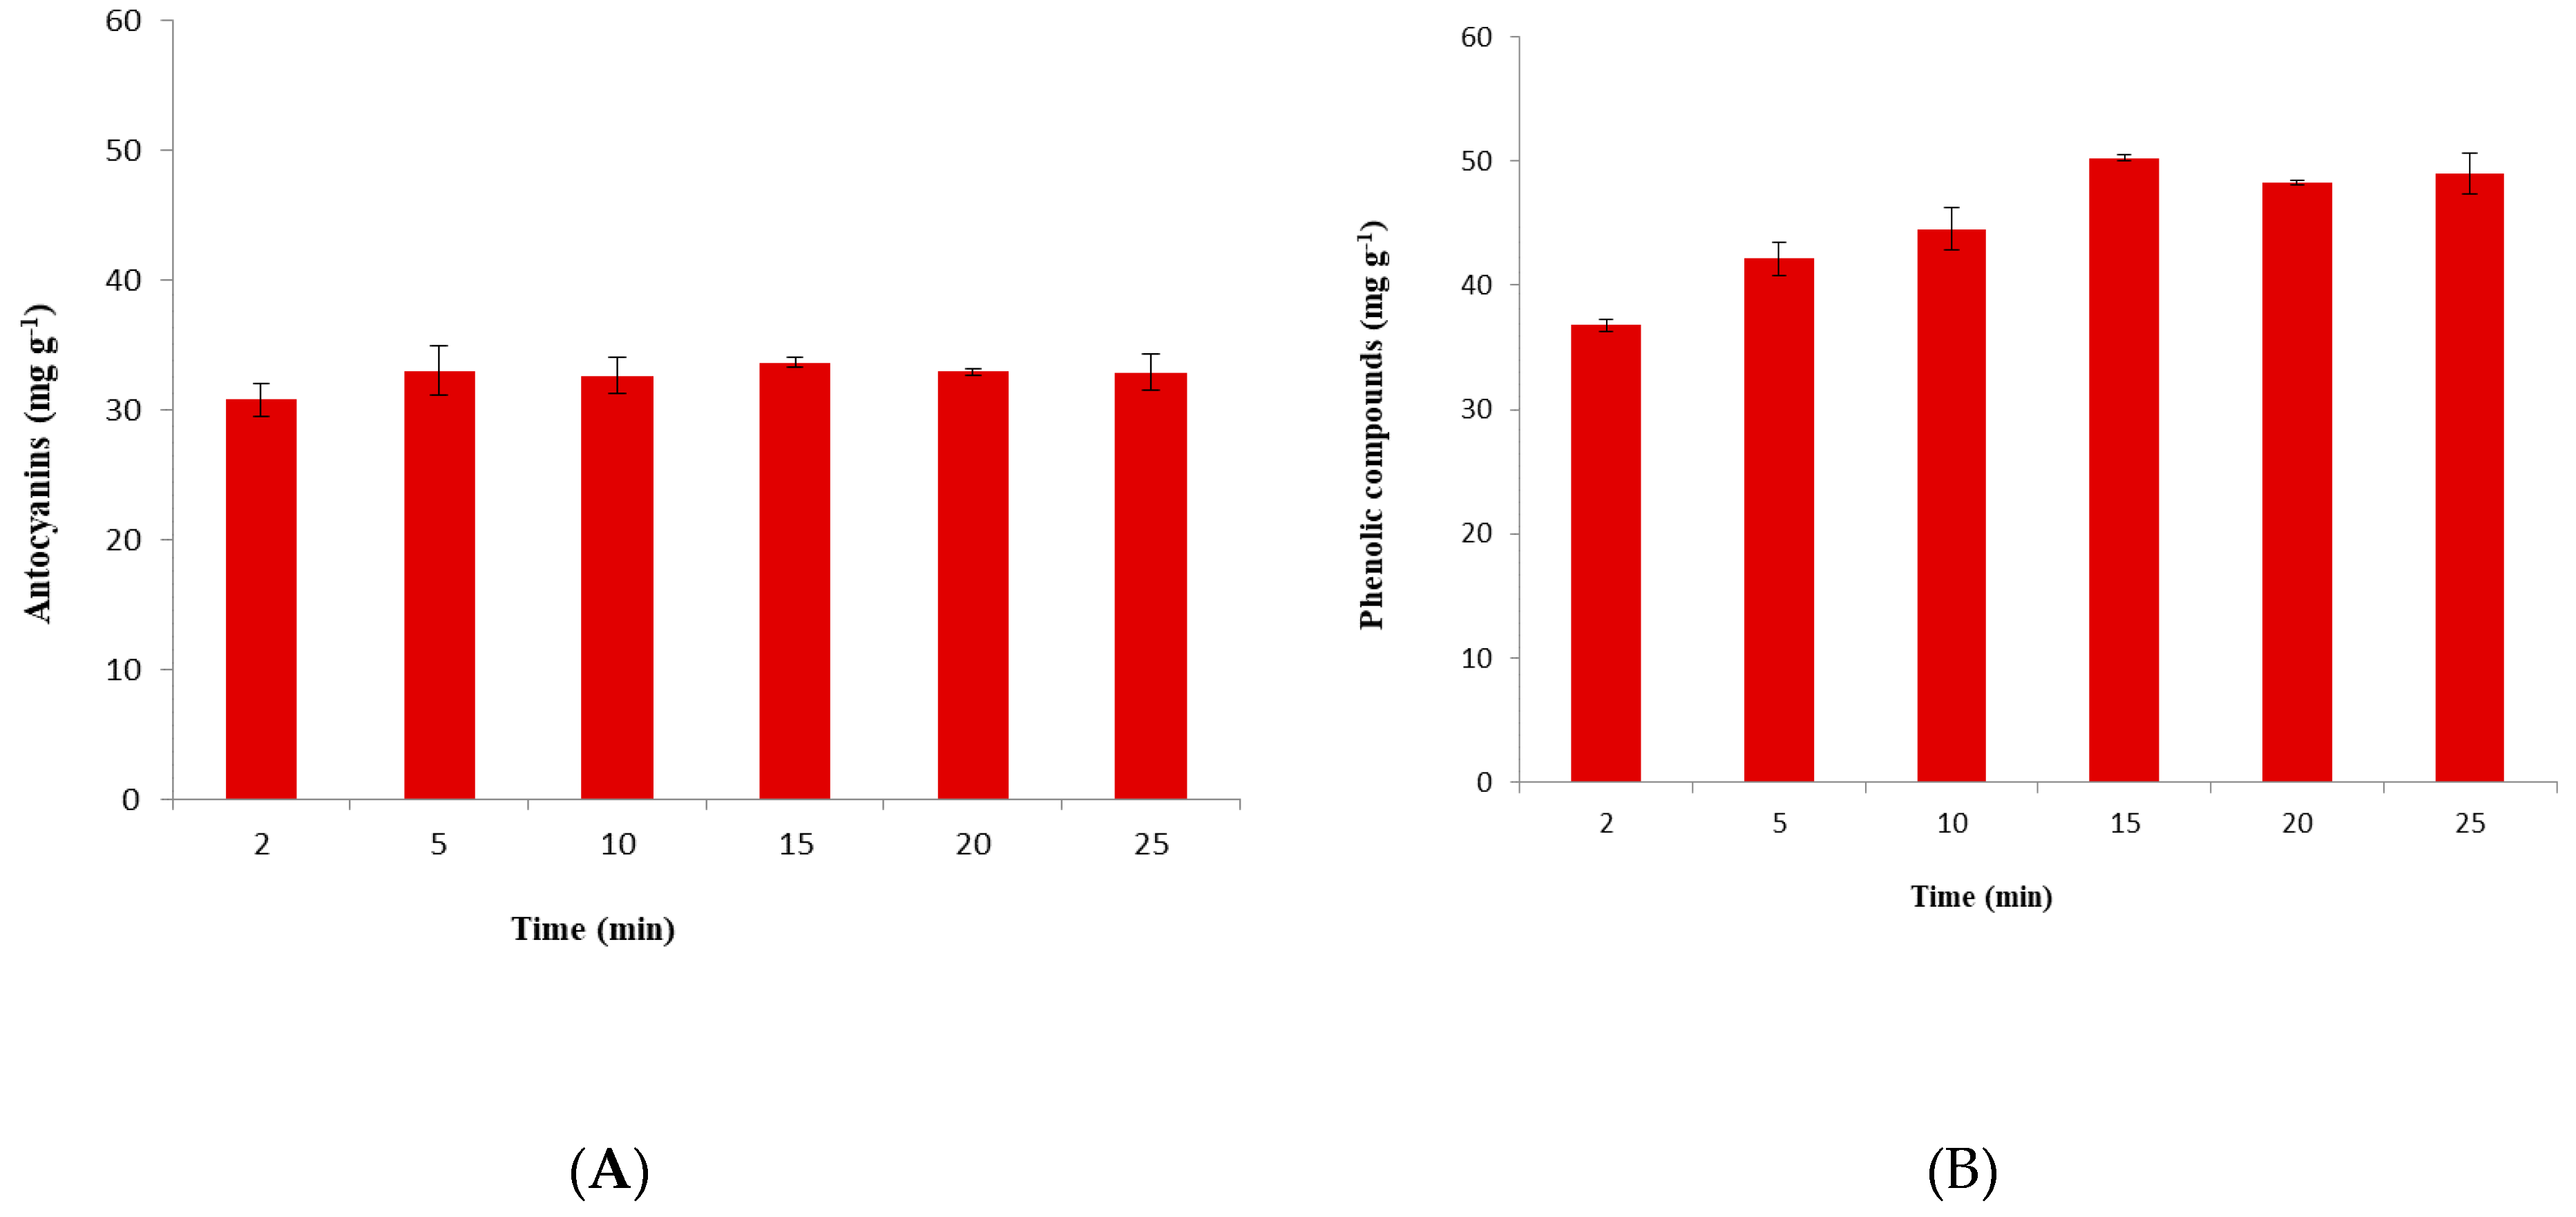
3.3. Extraction Kinetics

Time is another significant variable in the extraction of anthocyanins and phenolic compounds from different matrices [26]. In order to determine its impact on the process, a study of kinetics was carried out under the previously determined optimal UAE conditions. Different extraction times of 2, 5, 10, 15, 20, and 25 min were applied to the extraction process and each test was carried out in triplicate. The resulting recovery of anthocyanins and the total phenolic compounds are shown in Figure 2. In the case of the anthocyanins, it was observed that after 5 min there were no statistically significant differences. Thus, the extraction time was determined at 5 min, since it means saving both time and money. A different trend was obtained for total phenolic compounds, where the recovery reached its maximum at 15 min. In that case, a longer time was needed for the extraction of phenolic compounds.

3.4. Repeatability and Intermediate Precision

The reliability of the developed UAE methods was evaluated by repeatability and intermediate precision. The former was evaluated by 12 extractions on the same day and the latter based on 12 extractions per day during three consecutive days. A total of 36 extractions were performed under the optimal conditions that were previously determined. The results were expressed by the coefficient of variation, which was 2.48% and 3.37% in the case of repeatability, and 2.92% and 3.95% in the case of intermediate precision, for anthocyanins and phenolic compounds, respectively. These results, with coefficients lower than 5%, are within the acceptable limits that were defined by the Association of Official Analytical Chemists (AOAC) [57] and indicate satisfactory repeatability and intermediate precision of the method.

3.5. Application to Real Samples

The suitability of the newly developed methods was evaluated by applying them to the extraction of seven real samples (capsules (M-1 and M-2), pills (M-3), and lyophilized maqui (M-4, M-5, M-6, and M-7)) under the previously determined optimum conditions. The analyses were carried out in triplicate and Table 4 shows the extracted compounds. For the quantification of total anthocyanins and total phenolic compounds, the extracts were analyzed by UHPLC and the spectrophotometric method of Folin-Ciocalteau, respectively. The results from the different samples show the same trend for the extraction of anthocyanins and total phenolic compounds. Despite being M-1 and M-2 capsules of maqui, the highest concentration was obtained from M-2 and the lowest one for M-1. This may be due to the concentration of the raw material used. It can also be due to the different thermal or storage treatment of the samples. Both can cause changes in physical and nutritional properties, as well as the significant degradation of these compounds, particularly anthocyanins [58,59]. On the other hand, it should be noted that no anthocyanins were extracted from M-3. This is because only two anthocyanins (cyanidin 3-O-glucoside and delphinidin 3-O-glucoside) were detected, instead of the eight characteristic anthocyanins that were found in maqui. Therefore, M-3’s composition does not match that of the berries analyzed in this work. Based on these results, how important it is to count on the right extraction techniques and the adequate equipment to prevent any food fraud, and to ensure the quality of the product to consumers has been confirmed. Finally, the amount of compounds of biological interest extracted from the different lyophilized samples (M 4-7) was very similar and relatively high, since the lyophilized samples preserve their beneficial properties and characteristics during their storage and transport [60].
The results obtained by means of UAE were compared to those achieved by MAE methods. The samples were analyzed according to the optimal conditions determined in a previous work [61]. Approximately half of the commercial samples analyzed show statistically significant differences with regards to total phenolic compounds content. In turn, an increase in the extraction of phenolic compounds was observed when MAE was employed. This improved performance could be attributed to the ability of microwaves to penetrate into the cell matrix and cause strong absorption by polar molecules, which in turn produces an increase in temperature and pressure within the plant cell. Such an increase in pressure leads to the rupture of cell walls and to the release of analytes [62]. In addition, the decomposition of larger phenolic compounds into smaller ones with intact properties may lead to a greater yield, according to the Folin-Ciocalteau assay [63]. It should be noted that, when optimum conditions are applied to UAE for the extraction of phenolic compounds, the solvent demand is reduced (58% methanol for UAE vs. 65% methanol for MAE). In relation to each method’s efficiency to extract anthocyanins, only two of the samples presented a significant greater yield when UAE was applied. This may be because anthocyanins are extremely sensitive to degradation when exposed to high pressure and high temperature, and this has a negative impact on their recovery [64,65]. Finally, it is noteworthy to highlight that UAE is considered to be a fast, effective, and economic alternative, as long as industrial scale processing equipment is designed to obtain greater benefits [66]. Some of its relevant advantages are more rapid kinetics and a higher extraction efficiency and performance [67]. Therefore, the results that were obtained in this study show that UAE can be considered as an efficient alternative and a powerful means for the extraction of both anthocyanins and phenolic compounds.

4. Conclusions

Ultrasound-assisted extraction proved to be quite an effective and fast technique in the extraction of a wide range of polyphenols from maqui berries. BBD was also successfully used to establish the optimum parameters for the extraction of bioactive compounds. The most influential variables on the extraction of anthocyanins and phenolic compounds were methanol percentage and temperature, respectively. It took a longer time for optimal extraction of phenolic compounds, being 15 min, while for anthocyanins, it was only 5 min. Excellent repeatability and intermediate precision were found, with values that were lower than 5%. The developed methods were successfully applied to several commercial samples with maqui content. According to the results, UAE obtained extractions with a greater content in anthocyanins than MAE. It was also observed that, under optimal conditions, UAE used a smaller amount of solvent than MAE. Based on these data, it can be concluded that, when UAE is applied under optimal conditions, it can be considered as a simple and economical alternative method for the extraction of anthocyanins and total phenolic compounds from maqui.

Supplementary Materials

The following are available online at https://www.mdpi.com/2073-4395/9/3/148/s1, Figure S1: Ultra-high-performance liquid chromatography (UHPLC) chromatogram identified in the ultrasound-assisted extraction, Table S1: HPLC results for each of the anthocyanins found in maqui.

Author Contributions

Conceptualization, E.E.-B. and G.F.B.; methodology, M.V.-E. and A.V.G.d.P.; software, M.F.-G.; formal analysis, C.C.; M.V.-E. and A.V.G.d.P.; investigation, M.V.-E. and A.V.G.d.P.; resources, M.P.; data curation, E.E.-B., M.F.-G. and G.F.B.; writing—original draft preparation, M.V.-E. and A.V.G.d.P.; writing—review and editing, G.F.B. and E.E.-B.; supervision, E.E.-B. and G.F.B.; project administration, G.F.B. and E.E.-B.

Funding

The authors acknowledge V. la Andaluza and University of Cadiz for the support provided through the project OT2016/046.

Conflicts of Interest

The authors declare no conflicts of interest.

References

  1. Genskowsky, E.; Puente, L.A.; Pérez-Álvarez, J.A.; Fernández-López, J.; Muñoz, L.A.; Viuda-Martos, M. Determination of polyphenolic profile, antioxidant activity and antibacterial properties of maqui [Aristotelia chilensis (Molina) Stuntz] a Chilean blackberry. J. Sci. Food Agric. 2016, 96, 4235–4242. [Google Scholar] [CrossRef] [PubMed]
  2. Belhachat, D.; Mekimene, L.; Belhachat, M.; Ferradji, A.; Aid, F. Application of response surface methodology to optimize the extraction of essential oil from ripe berries of Pistacia lentiscus using ultrasonic pretreatment. J. Appl. Res. Med. Aromat. Plants 2018, 9, 132–140. [Google Scholar] [CrossRef]
  3. Fredes, C.; Robert, P. The powerful colour of the maqui (Aristotelia chilensis [Mol.] Stuntz) fruit. J. Berry Res. 2014, 4, 175–182. [Google Scholar] [CrossRef]
  4. Gironés-Vilaplana, A.; Mena, P.; García-Viguera, C.; Moreno, D.A. A novel beverage rich in antioxidant phenolics: Maqui berry (Aristotelia chilensis) and lemon juice. LWT Food Sci. Technol. 2012, 47, 279–286. [Google Scholar] [CrossRef]
  5. Fredes, C.; Yousef, G.G.; Robert, P.; Grace, M.H.; Lila, M.A.; Gómez, M.; Gebauer, M.; Montenegro, G. Anthocyanin profiling of wild maqui berries (Aristotelia chilensis [Mol.] Stuntz) from different geographical regions in Chile. J. Sci. Food Agric. 2014, 94, 2639–2648. [Google Scholar] [CrossRef]
  6. Brauch, J.E.; Buchweitz, M.; Schweiggert, R.M.; Carle, R. Detailed analyses of fresh and dried maqui (Aristotelia chilensis (Mol.) Stuntz) berries and juice. Food Chem. 2016, 190, 308–316. [Google Scholar] [CrossRef] [PubMed]
  7. Kumar, S.; Sharma, S.; Vasudeva, N. Review on antioxidants and evaluation procedures. Chin. J. Integr. Med. 2017, 1, 1–12. [Google Scholar] [CrossRef]
  8. Georgantzi, C.; Lioliou, A.E.; Paterakis, N.; Makris, D.P. Combination of Latic Acid-Based Deep Eutectic Solvents (DES) with β-Cyclodextrin: Performance Screening Using Ultrasound-Assisted Extraction of Polyphenols from Selected Native Greek Medicinal Plants. Agronomy 2017, 7, 54. [Google Scholar] [CrossRef]
  9. Escribano-Bailón, M.T.; Alcalde-Eon, C.; Muñoz, O.; Rivas-Gonzalo, J.C.; Santos-Buelga, C. Anthocyanins in berries of Maqui (Aristotelia chilensis (Mol.) Stuntz). Phytochem. Anal. 2006, 17, 8–14. [Google Scholar] [CrossRef]
  10. Quispe-Fuentes, I.; Vega-Gálvez, A.; Campos-Requena, V. Antioxidant Compound Extraction from Maqui (Aristotelia chilensis [Mol] Stuntz) Berries: Optimization by Response Surface Methodology. Antioxidants 2017, 6, 10. [Google Scholar] [CrossRef]
  11. Genskowsky, E.; Puente, L.A.; Pérez-Álvarez, J.A.; Fernandez-Lopez, J.; Muñoz, L.A.; Viuda-Martos, M. Assessment of antibacterial and antioxidant properties of chitosan edible films incorporated with maqui berry (Aristotelia chilensis). LWT Food Sci. Technol. 2015, 64, 1057–1062. [Google Scholar] [CrossRef]
  12. Zúñiga, G.E.; Tapia, A.; Arenas, A.; Contreras, R.A.; Zúñiga-Libano, G. Phytochemistry and biological properties of Aristotelia chilensis a Chilean blackberry: A review. Phytochem. Rev. 2017, 16, 1081–1094. [Google Scholar] [CrossRef]
  13. Brauch, J.E.; Reuter, L.; Conrad, J.; Vogel, H.; Schweiggert, R.M.; Carle, R. Characterization of anthocyanins in novel Chilean maqui berry clones by HPLC–DAD–ESI/MSnand NMR-spectroscopy. J. Food Compos. Anal. 2017, 58, 16–22. [Google Scholar] [CrossRef]
  14. Cespedes, C.L.; Pavon, N.; Dominguez, M.; Alarcon, J.; Balbontin, C.; Kubo, I.; El-Hafidi, M.; Avila, J.G. The chilean superfruit black-berry Aristotelia chilensis (Elaeocarpaceae), Maqui as mediator in inflammation-associated disorders. Food Chem. Toxicol. 2016, 108, 438–450. [Google Scholar] [CrossRef]
  15. Manning, L. Food fraud: Policy and food chain. Curr. Opin. Food Sci. 2016, 10, 16–21. [Google Scholar] [CrossRef]
  16. Van Ruth, S.M.; Huisman, W.; Luning, P.A. Food fraud vulnerability and its key factors. Trends Food Sci. Technol. 2017, 67, 70–75. [Google Scholar] [CrossRef]
  17. Medina-Torres, N.; Ayora-Talavera, T.; Espinosa-Andrews, H.; Sánchez-Contreras, A.; Pacheco, N. Ultrasound Assisted Extraction for the Recovery of Phenolic Compounds from Vegetable Sources. Agronomy 2017, 7, 47. [Google Scholar] [CrossRef]
  18. Castejón, N.; Luna, P.; Señoráns, F.J. Alternative oil extraction methods from Echium plantagineum L. seeds using advanced techniques and green solvents. Food Chem. 2018, 244, 75–82. [Google Scholar] [CrossRef]
  19. Bamba, B.S.B.; Shi, J.; Tranchant, C.C.; Xue, S.J.; Forney, C.F.; Lim, L.T. Influence of Extraction Conditions on Ultrasound-Assisted Recovery of Bioactive Phenolics from Blueberry Pomace and Their Antioxidant Activity. Molecules 2018, 23, 1685. [Google Scholar] [CrossRef]
  20. Espada-Bellido, E.; Ferreiro-González, M.; Carrera, C.; Palma, M.; Barroso, C.G.; Barbero, G.F. Optimization of the ultrasound-assisted extraction of anthocyanins and total phenolic compounds in mulberry (Morus nigra) pulp. Food Chem. 2017, 219, 23–32. [Google Scholar] [CrossRef]
  21. Khan, M.K.; Abert-Vian, M.; Fabiano-Tixier, A.S.; Dangles, O.; Chemat, F. Ultrasound-assisted extraction of polyphenols (flavanone glycosides) from orange (Citrus sinensis L.) peel. Food Chem. 2010, 119, 851–858. [Google Scholar] [CrossRef]
  22. Esclapez, M.D.; García-Pérez, J.V.; Mulet, A.; Cárcel, J.A. Ultrasound-Assisted Extraction of Natural Products. Food Eng. Rev. 2011, 3, 108–120. [Google Scholar] [CrossRef] [Green Version]
  23. Ali, A.; Lim, X.Y.; Chong, C.H.; Mah, S.H.; Chua, B.L. Optimization of ultrasound-assisted extraction of natural antioxidants from Piper betle using response surface methodology. LWT Food Sci. Technol. 2018, 89, 681–688. [Google Scholar] [CrossRef]
  24. Duan, L.L.; Jiang, R.; Shi, Y.; Duan, C.Q.; Wu, G.F. Optimization of ultrasonic-assisted extraction of higher fatty acids in grape berries (seed-free fruit sections). Anal. Methods 2016, 8, 6208–6215. [Google Scholar] [CrossRef]
  25. Nguyen, T.N.T.; Phan, L.H.N.; Le, V.V.M. Enzyme-assisted and ultrasound-assisted extraction of phenolics from mulberry (Morus alba) fruit: Comparison of kinetic parameters and antioxidant level. Int. Food Res. J. 2014, 21, 1937–1940. [Google Scholar]
  26. He, B.; Zhang, L.L.; Yue, X.Y.; Liang, J.; Jiang, J.; Gao, X.L.; Yue, P.X. Optimization of Ultrasound-Assisted Extraction of phenolic compounds and anthocyanins from blueberry (Vaccinium ashei) wine pomace. Food Chem. 2016, 204, 70–76. [Google Scholar] [CrossRef] [PubMed]
  27. Rezaei, E.; Abedi, M. Efficient Ultrasound-Assisted Extraction of Cichoric Acid from Echinacea purpurea Root. Pharm. Chem. J. 2017, 51, 471–475. [Google Scholar] [CrossRef]
  28. Patras, A.; Brunton, N.P.; O’Donnell, C.; Tiwari, B.K. Effect of thermal processing on anthocyanin stability in foods; mechanisms and kinetics of degradation. Trends Food Sci. Technol. 2010, 21, 3–11. [Google Scholar] [CrossRef]
  29. Ross, K.A.; Beta, T.; Arntfield, S.D. A comparative study on the phenolic acids identified and quantified in dry beans using HPLC as affected by different extraction and hydrolysis methods. Food Chem. 2009, 113, 336–344. [Google Scholar] [CrossRef]
  30. Wen, C.; Zhang, J.; Zhang, H.; Dzah, C.S.; Zandile, M.; Duan, Y.; Ma, H.; Luo, X. Advances in ultrasound assisted extraction of bioactive compounds from cash crops—A review. Ultrason. Sonochem. 2018, 48, 538–549. [Google Scholar] [CrossRef]
  31. Chen, S.X.; Li, K.K.; Pubu, D.; Jiang, S.P.; Chen, B.; Chen, L.R.; Yang, Z.; Ma, C.; Gong, X.J. Optimization of Ultrasound-Assisted Extraction, HPLC and UHPLC-ESI-Q-TOF-MS/MS Analysis of Main Macamides and Macaenes from Maca (Cultivars of Lepidium meyenii Walp). Molecules 2017, 22, 2196. [Google Scholar] [CrossRef] [PubMed]
  32. Wang, B.; Qu, J.; Luo, S.; Feng, S.; Li, T.; Yuan, M.; Huang, Y.; Liao, J.; Yang, R.; Ding, C. Optimization of Ultrasound-Assisted Extraction of Flavonoids from Olive (Olea europaea) Leaves, and Evaluation of Their Antioxidant and Anticancer Activities. Molecules 2018, 23, 2513. [Google Scholar] [CrossRef] [PubMed]
  33. Chen, S.; Zeng, Z.; Hu, N.; Bai, B.; Wang, H.; Suo, Y. Simultaneous optimization of the ultrasound-assisted extraction for phenolic compounds content and antioxidant activity of Lycium ruthenicum Murr. fruit using response surface methodology. Food Chem. 2018, 242, 1–8. [Google Scholar] [CrossRef] [PubMed]
  34. Ghosh, P.; Chandra-Pradhan, R.; Mishra, S.; Rout, P.K. Quantification and Concentration of Anthocyanidin from Indian Blackberry (Jamun) by Combination of Ultra- and Nano-filtrations. Food Bioprocess Technol. 2018, 11, 2194–2203. [Google Scholar] [CrossRef]
  35. Tardugno, R.; Pozzebon, M.; Beggio, M.; Del Turco, P.; Pojana, G. Polyphenolic profile of Cichorium intybus L. endemic varieties from the Veneto region of Italy. Food Chem. 2018, 266, 175–182. [Google Scholar] [CrossRef] [PubMed]
  36. Friščić, M.; Bucar, F.; Hazler-Pilepic, K. LC-PDA-ESI-MSn analysis of phenolic and iridoid compounds from Globularia spp. J. Mass Spectrom. 2016, 51, 1211–1236. [Google Scholar] [CrossRef] [PubMed]
  37. Singleton, V.L.; Orthofer, R.; Lamuela-Raventós, R.M. Analysis of total phenols and other oxidation substrates and antioxidants by means of folin-ciocalteu reagent. Methods Enzymol. 1999, 299, 152–178. [Google Scholar]
  38. Covarrubias-Cárdenas, A.G.; Martínez-Castillo, J.I.; Medina-Torres, N.; Ayora-Talavera, T.; Espinosa-Andrews, H.; García-Cruz, N.U.; Pacheco, N. Antioxidant Capacity and UPLC-PDA ESI-MS Phenolic Profile of Stevia rebaudiana Dry Powder Extracts Obtained by Ultrasound Assisted Extraction. Agronomy 2018, 8, 170. [Google Scholar] [CrossRef]
  39. Jakobek, L.; Boc, M.; Barron, A.R. Optimization of Ultrasonic-Assisted Extraction of Phenolic Compounds from Apples. Food Anal. Methods 2015, 8, 2612–2625. [Google Scholar] [CrossRef]
  40. Haya, S.; Bentahar, F.; Trari, M. Optimization of polyphenols extraction from orange peel. J. Food Meas. Charact. 2019, 13, 614–621. [Google Scholar] [CrossRef]
  41. Ferreira, S.L.C.; Bruns, R.E.; Ferreira, H.S.; Matos, G.D.; David, J.M.; Brandao, G.C.; da Silva, E.G.P.; Portugal, L.A.; dos Reis, P.S.; Souza, A.S.; et al. Box-Behnken design: An alternative for the optimization of analytical methods. Anal. Chim. Acta 2007, 597, 179–186. [Google Scholar] [CrossRef] [PubMed]
  42. Tan, M.C.; Chin, N.L.; Yusof, Y.A. A Box-Behnken Design for Determining the Optimum Experimental Condition of Cake Batter Mixing. Food Bioprocess Technol. 2012, 5, 972–982. [Google Scholar] [CrossRef]
  43. He, Q.; Du, B.; Xu, B. Extraction Optimization of Phenolics and Antioxidants from Black Goji Berry by Accelerated Solvent Extractor Using Response Surface Methodology. Appl. Sci. 2018, 8, 1905. [Google Scholar] [CrossRef]
  44. Paucar-Menacho, L.M.; Martínez-Villaluenga, C.; Dueñas, M.; Frias, J.; Peñas, E. Response surface optimization of germination conditions to improve the accumulation of bioactive compounds and the antioxidant activity in quinoa. Int. J. Food Sci. Technol. 2018, 53, 516–524. [Google Scholar] [CrossRef]
  45. Zhou, J.; Zhang, L.; Li, Q.; Jin, W.; Chen, W.; Han, J.; Zhang, Y. Simultaneous Optimization for Ultrasound-Assisted Extraction and Antioxidant Activity of Flavonoids from Sophora flavescens Using Response Surface Methodology. Molecules 2019, 24, 112. [Google Scholar] [CrossRef] [PubMed]
  46. Machado, A.P.D.F.; Pereira, A.L.D.; Barbero, G.F.; Martínez, J. Recovery of anthocyanins from residues of Rubus fruticosus, Vaccinium myrtillus and Eugenia brasiliensis by ultrasound assisted extraction, pressurized liquid extraction and their combination. Food Chem. 2017, 231, 1–10. [Google Scholar] [CrossRef]
  47. Ruenroengklin, N.; Zhong, J.; Duan, X.; Yang, B.; Li, J.; Jiang, Y. Effects of Various Temperatures and pH Values on the Extraction Yield of Phenolics from Litchi Fruit Pericarp Tissue and the Antioxidant Activity of the Extracted Anthocyanins. Int. J. Mol. Sci. 2008, 9, 1333–1341. [Google Scholar] [CrossRef] [Green Version]
  48. Mustafa, A.; Turner, C. Pressurized liquid extraction as a green approach in food and herbal plants extraction: A review. Anal. Chim. Acta 2011, 703, 8–18. [Google Scholar] [CrossRef] [PubMed]
  49. Wijngaard, H.; Hossain, M.B.; Rai, D.K.; Brunton, N. Techniques to extract bioactive compounds from food by-products of plant origin. Food Res. Int. 2012, 46, 505–513. [Google Scholar] [CrossRef]
  50. Heffels, P.; Weber, F.; Schieber, A. Influence of Accelerated Solvent Extraction and Ultrasound-Assisted Extraction on the Anthocyanin Profile of Different Vaccinium Species in the Context of Statistical Models for Authentication. J. Agric. Food Chem. 2015, 63, 7532–7538. [Google Scholar] [CrossRef]
  51. Cai, Z.; Qu, Z.; Lan, Y.; Zhao, S.; Ma, X.; Wan, Q.; Jing, P.; Li, P. Conventional, ultrasound-assisted, and accelerated-solvent extractions of anthocyanins from purple sweet potatoes. Food Chem. 2016, 197, 266–272. [Google Scholar] [CrossRef] [PubMed]
  52. Setyaningsih, W.; Saputro, I.E.; Palma, M.; Barroso, C.G. Stability of 40 Phenolic Compounds during Ultrasound-Assisted Extraction (UAE). AIP Conf. Proc. 2016, 1755, 080009. [Google Scholar] [CrossRef]
  53. Machado, A.P.D.F.; Pasquel-Reátegui, J.L.; Barbero, G.F.; Martínez, J. Pressurized liquid extraction of bioactive compounds from blackberry (Rubus fruticosus L.) residues: A comparison with conventional methods. Food Res. Int. 2015, 77, 675–683. [Google Scholar] [CrossRef]
  54. Carrera, C.; Ruiz-Rodríguez, A.; Palma, M.; Barroso, C.G. Ultrasound assisted extraction of phenolic compounds from grapes. Anal. Chim. Acta 2012, 732, 100–104. [Google Scholar] [CrossRef] [PubMed]
  55. Cui, F.J.; Qian, L.S.; Sun, W.J.; Zhang, J.S.; Yang, Y.; Li, N.; Zhuang, H.N.; We, D. Ultrasound-Assisted Extraction of Polysaccharides from Volvariella volvacea: Process Optimization and Structural Characterization. Molecules 2018, 23, 1706. [Google Scholar] [CrossRef] [PubMed]
  56. Rodríguez, K.; Ah-Hen, K.S.; Vega-Gálvez, A.; Vásquez, V.; Quispe-Fuentes, I.; Rojas, P.; Lemus-Mondaca, R. Changes in bioactive components and antioxidant capacity of maqui, Aristotelia chilensis [Mol] Stuntz, berries during drying. LWT Food Sci. Technol. 2016, 65, 537–542. [Google Scholar] [CrossRef]
  57. AOAC. AOAC Peer Verified Methods Program. In Manual on Policies and Procedures; AOAC International: Rockville, MD, USA, 1998. [Google Scholar]
  58. Fracassetti, D.; Del Bo, C.; Simonetti, P.; Gardana, C.; Klimis-Zacas, D.; Ciappellano, S. Effect of Time and Storage Temperature on Anthocyanin Decay and Antioxidant Activity in Wild Blueberry (Vaccinium angustifolium) Powder. J. Agric. Food Chem. 2013, 61, 2999–3005. [Google Scholar] [CrossRef] [PubMed]
  59. Sui, X.; Bary, S.; Zhou, W. Changes in the color, chemical stability and antioxidant capacity of thermally treated anthocyanin aqueous solution over storage. Food Chem. 2016, 192, 515–524. [Google Scholar] [CrossRef] [PubMed]
  60. Andrade, S.C.; Guiné, R.P.F.; Gonçalves, F.J.A. Evaluation of phenolic compounds, antioxidant activity and bioaccessibility in white crowberry (Corema album). J. Food Meas. Charact. 2017, 11, 1936–1946. [Google Scholar] [CrossRef]
  61. Vázquez-Espinosa, M.; Espada-Bellido, E.; González de Peredo, A.V.; Ferreiro-González, M.; Carrera, C.; Palma, M.; Barroso, C.G.; Barbero, G.F. Optimization of Microwave-Assisted Extraction for the Recovery of Bioactive Compounds from the Chilean Superfruit (Aristotelia chilensis (Mol.) Stuntz). Agronomy 2018, 8, 240. [Google Scholar] [CrossRef]
  62. Albuquerque, B.R.; Prieto, M.A.; Vazquez, J.A.; Barreiro, M.F.; Barros, L.; Ferreira, I.C.F.R. Recovery of bioactive compounds from Arbutus unedo L. fruits: Comparative optimization study of maceration/microwave/ultrasound extraction techniques. Food Res. Int. 2018, 109, 455–471. [Google Scholar] [CrossRef]
  63. Nayak, B.; Dahmoune, F.; Moussi, K.; Remini, H.; Dairi, S.; Aoun, O.; Khodir, M. Comparison of microwave, ultrasound and accelerate-assisted solvent extraction for recovery of polyphenols from Citrus sinensis peels. Food Chem. 2015, 187, 507–516. [Google Scholar] [CrossRef]
  64. Verbeyst, L.; Van Crombruggen, K.; Van der Plancken, I.; Hendrickx, M.; Van Loey, A. Anthocyanin degradation kinetics during thermal and high-pressure treatments of raspberries. J. Food Eng. 2011, 105, 513–521. [Google Scholar] [CrossRef]
  65. Corrales, M.; Butz, P.; Tauscher, B. Anthocyanin condensation reactions under high hydrostatic pressure. Food Chem. 2008, 110, 627–635. [Google Scholar] [CrossRef]
  66. Kovacevic, D.B.; Maras, M.; Barba, F.J.; Granato, D.; Roohinejad, S.; Mallikarjunan, K.; Montesano, D.; Lorenzo, J.M.; Putnik, P. Innovative technologies for the recovery of phytochemicals from Stevia rebaudiana Bertoni leaves: A review. Food Chem. 2018, 268, 513–521. [Google Scholar] [CrossRef]
  67. Chemat, F.; Rombaut, N.; Maullemiestre, A.; Turk, M.; Perino, S.; Fabiano-Tixier, A.S.; Abert-Vian, M. Review of Green Food Processing techniques. Preservation, transformation, and extraction. Innov. Food Sci. Emerg. Technol. 2017, 41, 357–377. [Google Scholar] [CrossRef] [Green Version]
Figure 1. Pareto charts for the standardized effects: (A) total anthocyanins and (B) total phenolic compounds.
Agronomy 09 00148 g001
Figure 2. Effect of the extraction time on the recovery. (A) Total anthocyanins; and, (B) Total phenolic compounds.
Agronomy 09 00148 g002
Table 1. Box-Behnken design matrix including both decoded variables and responses.
RunFactorsResponses
Solvent X1Temp.* X2Amplitude X3Cycle X4pH X5Ratio X6Total Anthocyanins (mg g−1)Total Phenolic Compounds (mg g−1)
15040300.4521034.2137.10
25040700.4521034.4838.49
35040300.4571031.2944.45
45040700.4571031.0047.68
55040300.4522038.1750.36
65040700.4522040.0055.15
75040300.4572033.1948.39
85040700.4572031.8851.44
95010500.221529.9638.07
105070500.221536.4760.46
115010500.721533.8635.18
125070500.721538.7771.07
135010500.271530.7338.89
145070500.271535.5446.32
155010500.771531.3541.21
165070500.771531.1244.11
172540300.24.51521.1139.51
187540300.24.51531.9537.39
192540700.24.51521.2040.57
207540700.24.51531.2238.26
212540300.74.51521.2041.96
227540300.74.51533.6646.65
232540700.74.51525.1745.97
247540700.74.51535.1039.14
255010300.454.51030.5347.25
265070300.454.51034.1937.92
275010700.454.51026.9246.70
285070700.454.51032.2645.80
295010300.454.52031.1136.72
305070300.454.52036.9142.25
315010700.454.52027.1741.08
325070700.454.52037.1941.07
332510500.4521521.5635.93
347510500.4521535.8844.42
352570500.4521528.7851.74
367570500.4521536.1056.54
372510500.4571521.7935.11
387510500.4571535.3437.37
392570500.4571524.8047.58
407570500.4571533.6846.77
412540500.24.51020.2637.54
427540500.24.51031.8939.78
432540500.74.51019.9138.76
447540500.74.51032.7648.22
452540500.24.52020.0837.56
467540500.24.52034.2139.58
472540500.74.52023.6043.52
487540500.74.52034.0947.47
495040500.454.51533.6643.97
505040500.454.51531.3046.44
515040500.454.51534.3744.78
525040500.454.51533.6445.63
535040500.454.51529.1644.08
545040500.454.51531.9046.76
* Temp.: Temperature; X1: Percentage of methanol; X2: Temperature; X3: Amplitude; X4: Cycle; X5: pH; X6: ratio “Sample mass/volume of solvent”.
Table 2. Analysis of variance (ANOVA) of the quadratic model adjusted to the extraction yield. (A) Total anthocyanins; and, (B) Total phenolic compounds.
(A)
SourceDegrees of FreedomSum of SquaresMean SquareF-ValueP-ValueCoefficient
Model271429.4952.9418.400.0000
Intercept1 32.34
X11775.46775.46269.440.00005.68
X21102.53102.5335.620.00002.07
X310.63240.63240.21970.6431−0.1623
X4110.6310.633.690.06570.6654
X5155.6155.6119.320.0002−1.52
X6132.5132.5111.290.00241.16
X1 × 2117.0617.065.930.0221−1.46
X1 × 311.401.400.48510.4923−0.4178
X1 × 410.05030.05030.01750.8958−0.0561
X1 × 510.07830.07830.02720.87030.0989
X1 × 610.00270.00270.00090.97590.0183
X2 × 314.344.341.510.23040.7366
X2 × 415.525.521.920.1780−0.8304
X2 × 5110.4410.443.630.0680−0.8077
X2 × 615.805.802.020.16760.8515
X3 × 414.584.581.590.21810.7570
X3 × 511.711.710.59420.4477−0.4624
X3 × 610.36220.36220.12590.72560.1505
X4 × 5112.5512.554.360.0467−1.25
X4 × 611.031.030.35910.55420.3594
X5 × 615.605.601.950.1749−0.8366
X121194.81194.8167.690.0000−4.35
X2210.61330.61330.21310.6482−0.2442
X3210.44690.44690.15530.69680.2084
X4213.923.921.360.2539−0.6172
X52141.1341.1314.290.00082.00
X6210.73660.73660.25590.6172−0.2676
Residual2674.832.88
Lack of fit2155.922.660.70420.7421
Pure error518.913.78
Total531504.32
(B)
SourceDegrees of FreedomSum of SquaresMean SquareF−ValueP−ValueCoefficient
Model271417.4952.501.410.1926
Intercept1 45.28
X1127.8327.830.74670.39541.08
X21538.78538.7814.460.00084.74
X3119.0619.060.51140.48090.8911
X41101.19101.192.720.11142.05
X5185.0985.092.280.1428−1.88
X6125.7925.790.69200.41311.04
X1 × 215.725.720.15350.6984−0.8455
X1 × 3117.1517.150.46040.5035−1.46
X1 × 418.198.190.21990.64310.7156
X1 × 5117.4717.470.46890.4995−1.48
X1 × 614.114.110.11030.7425−0.7168
X2 × 311.041.040.02780.86880.3600
X2 × 4110.0610.060.26990.60781.12
X2 × 51182.28182.284.890.0360−3.38
X2 × 6131.0031.000.83180.37011.97
X3 × 413.693.690.09900.7555−0.6791
X3 × 510.00170.00170.00000.99470.0145
X3 × 610.05200.05200.00140.9705−0.0570
X4 × 517.237.230.19400.6632−0.9506
X4 × 612.212.210.05920.80960.5252
X5 × 6161.6661.661.650.2097−2.78
X12178.2978.292.100.1592−2.76
X22114.4314.430.38730.5391−1.18
X32111.5011.500.30860.5833−1.06
X4210.80040.80040.02150.8846−0.2790
X52198.8198.812.650.11553.10
X6214.864.860.13050.7208−0.6876
Residual26968.8737.26
Lack of fit21961.7945.8032.340.0006
Pure error57.081.42
Total532386.36
Table 3. Optimal conditions for ultrasound-assisted extraction. (A) Total anthocyanins; and, (B) Total phenolic compounds.
(A) Total Anthocyanins(B) Total Phenolic Compounds
Percentage of methanol (%)61.550
pH2.12
Ratio (mL:g)20:0.520:0.5
Temperature (°C)69.470
Amplitude (%)4635
Cycle (s)0.70.7
Table 4. Total anthocyanins (mg g−1) and total phenolic compounds (mg g−1) extracted for each commercial samples by means of ultrasound assisted extraction (UAE) and microwave assisted extraction (MAE).
Foodstuff Made with MaquiTotal Anthocyanins (mg g−1)Total Phenolic Compounds (mg g−1)
UAEMAEUAEMAE
M-12.13 ± 0.16 a1.73 ± 0.16 b6.83 ± 0.23 a8.22 ± 0.34 b
M-278.73 ± 0.67 a75.55 ± 3.80 a100.27 ± 1.44 a103.30 ± 0.30 a
M-3-*-*10.46 ± 0.29 a11.45 ± 0.45 b
M-430.81 ± 3.13 a30.35 ± 3.25 a47.25 ± 1.44 a53.06 ± 1.53 b
M-528.39 ± 1.72 a27.66 ± 1.02 a43.40 ± 1.99 a49.29 ± 2.17 b
M-637.26 ± 2.08 a35.51 ± 1.40 a58.28 ± 1.33 a59.57 ± 0.70 a
M-723.21 ± 0.73 a19.89 ± 1.44 b50.95 ± 1.38 a52.13 ± 1.44 a
* The characteristic eight anthocyanins found in maqui were not detected. The use of different letters on the same line for each kind of compound indicates that the means differs significantly according to Tukey’s test (p < 0.05).

