Abstract
The estimation of the ripening state in orchards helps improve post-harvest processes. Picking fruits based on their stage of maturity can reduce the cost of storage and increase market outcomes. Moreover, aerial images and the estimated ripeness can be used as indicators for detecting water stress and determining the water applied during irrigation. Additionally, they can also be related to the crop coefficient (Kc) of seasonal water needs. The purpose of this research is to develop a new computer vision algorithm to detect the existing fruits in aerial images of an apple cultivar (of Red Delicious variety) and estimate their ripeness stage among four possible classes: unripe, half-ripe, ripe, and overripe. The proposed method is based on a combination of the most effective color features and a classifier based on artificial neural networks optimized with genetic algorithms. The obtained results indicate an average classification accuracy of 97.88%, over a dataset of 8390 images and 27,687 apples, and values of the area under the ROC (receiver operating characteristic) curve near or above 0.99 for all classes. We believe this is a remarkable performance that allows a proper non-intrusive estimation of ripening that will help to improve harvesting strategies.
1. Introduction
Non-destructive estimation of fruit ripeness in orchards is one of the most important challenges for agronomical engineering researchers worldwide, since many management decisions can be directly related with the maturity state of fruits. Establishing a relationship between maturity and the visual appearance of fruits—such as color and texture—allows for the development of new irrigation, harvesting, and post-harvesting strategies based on crop growth analysis as well as new yield prediction methods [1].
Different imaging systems in the field of non-destructive analysis of ripeness have already been applied by different authors, including hyperspectral, multi-spectral, and visible light [2,3], the last one being the cheapest. However, the images are usually high resolution and there is very little research in estimating the state of fruit ripening using low-resolution images, as those obtained with satellites or drones. For example, in [4], a system is presented to detect fruits in a crop of pomegranates to monitor its growth and estimate the yield, using quadcopters.
Some researchers have studied the changes of physical and chemical properties of different fruits during ripening [5,6,7,8]. For example, in [9], visible and near-infrared spectral images were used to determine the physicochemical properties and evaluate the internal quality of two nectarine varieties. Sixty hyperspectral pictures were taken at wavelengths between 450 and 1040 nm. This information was correlated with the physicochemical properties of the nectarines, by means of least partial squares regression, showing a coefficient of determination of 0.87. Another investigation was conducted in [10] about the ripening of Golden Delicious apples during storage. The apples were harvested green and stored in a chamber under controlled conditions. A total of 114 apples were studied over 40 days. To evaluate the color changes in apple skin, the process used the three channels of the L*a*b* color space; this is a uniform color space suitable for industrial applications which consists of a luminance channel, L*, and two chrominance channels, a* and b*. Results showed that L* increased slightly from Day 1 to Day 16, remained constant from Day 16 to Day 24, and decreased from Day 32 to Day 40.
Ultraviolet (UV) light has been used too as a method to measure the chlorophyll content of fruits, which is linked with the ripening of different types of climacteric fruits [11]. For example, in [12], a small low-cost portable spectrometer connected to a smartphone is presented; this device is used to measure the amount of chlorophyll in the skin of apples of different varieties using UV; these measures are correlated with destructive firmness tests on the fruits.
The process of fruit maturity has also been related to changes in their dielectric properties. In [13], the ripening of red banana is analyzed using features such as capacitance, relative permittivity and impedance, and image processing techniques such as local binary patterns (LBPs). The classifiers showed a high accuracy in predicting the different ripening stages. It has also been shown that chemical properties of the fruits are related to maturity [14]. In this research, carotene and chlorophyll levels at different ripening stages of tomato were studied using spectroscopic imaging. It was observed that there is a correlation between them, concluding that it is possible to predict these two characteristics without destructive measurements. In [15], gas sensors installed in drones are shown to be another feasible way to estimate the maturity of apples for optimal harvesting decisions, in particular by detecting ethylene emission. Other interesting applications of image analysis in apple crops include tasks, such as automatic pruning of the trees based on branch detection and 3D reconstruction [16].
On the other hand, regarding irrigation strategies, neural network techniques were applied on satellite images to manage a central pivot irrigation system in Colorado (USA) [17]. The use of several red and red-edge bands for predicting the crop coefficient, Kc, in cotton was studied in [18]. These prediction models were used for near-real-time irrigation decision support systems. Additional research was developed in [19] using color images from unmanned aerial vehicles (UAVs); a water deficit index (WDI) can provide accurate crop-water stress maps at different growth stages of barley and in differing weather situations. Another application of imaging in irrigation was published in [20], where the authors presented a device based on computer vision and multi-tasking processes to develop a small-scale smart agricultural machine that was able to automatically weed and perform variable rate irrigation within a field. Crop stress monitoring based on low altitude remote sensing technologies is proposed in [21]; a small UAV with multispectral and infrared thermal imaging sensors was used to collect data from bean field plots during 2015 and 2016. Indicators used included leaf area index (LAI), green normalized vegetation index (GNDVI), canopy cover (CC), and canopy temperature (CT). These indicators were suitable for detecting deficit irrigation treatments. In [22], another application of low-altitude UAVs is described; the system is called a Pheno-Copter and uses RGB, infrared, and thermal cameras to perform plant phenotyping on large areas.
Thus, detection of the ripeness stages of fruits in orchards under natural light and background using a computer vision system can allow precise irrigation planning and a proper management of fruits during harvesting, transportation, storage, and market delivery. For this reason, the aim of this study was to develop a new algorithm to detect apples and estimate their ripeness stages in apple cultivars of the Red Delicious variety, using images captured under natural light and background, like those obtained from drones flying at a medium-low altitude. The proposed approach is based on a combination of hybrid artificial neural networks, genetic algorithms, and extraction of the most effective color features. To emulate the conditions of drone acquisition systems, video analysis is used instead of still image processing.
2. Materials and Methods
The proposed method for estimating the maturation state of apples follows the standard scheme of computer vision algorithms, shown in Figure 1. First, the segmentation step separates the objects of interest (the apples) from the background. Second, a set of color features is extracted from each segmented object, based on a prior study of the most discriminant features. Third, a classifier is trained and validated using these features; the classifier follows a hybrid approach of artificial neural networks (ANNs) optimized with genetic algorithms (GAs). The dataset used for the experiments emulates the aerial images that would be obtained by a drone flying at a medium-low altitude. This is an important requirement since fruits would not be visible on a high-altitude flight, thus hindering ripeness estimation.
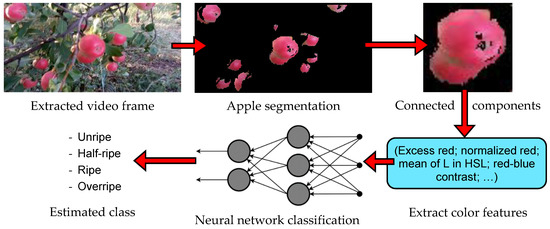
Figure 1.
Scheme of the proposed algorithm for apple ripening estimation using color features.
2.1. Image Acquisition of Different Apple Orchards
The acquisition process has been as close as possible to the conditions of a video captured by a drone. The videos were recorded in five orchards of Red Delicious apples in Kermanshah, Iran (34°18′48.87″ N, 47°4′6.92″ E) using a color GigE industrial camera model DFK-23GM021 (Imaging Source Europe GmbH, Bremen, Germany), with a 1/3 inch Aptina CMOS MT9M021 sensor (ON Semiconductor, Aurora, CO, USA) and a spatial resolution of 1280 × 960 pixels. The mounted lens was model H0514-MP2 (Computar CBC Group, Tokyo, Japan), with f = 5 mm and F1.4. As shown in Table 1, the videos were recorded at 11 different light intensities, always under natural outdoor conditions. The distance from the trees was between 0.5 and 2 m, the speed was around 1 m/s, and the viewing angle was nearly parallel to the ground. The camera was manually held, simulating a low-medium height flight of a drone. With the system described, which has a horizontal viewing angle around 80°, an apple about 7 cm would be observed with a size of 20 pixels at a distance about 3 m over the trees.

Table 1.
Description of the images of the dataset. Each case corresponds to a video, from which different frames were extracted. The videos are ordered from lower to higher luminous intensity.
As indicated in Table 1, there is a total of more than 8000 images in the dataset, showing a great variety in luminosity, background, size of the apples and maturity stage. More specifically, four possible ripening stages are defined: (1) unripe, (2) half-ripe, (3) ripe, and (4) overripe. This classification has been used in many previous studies [23]. Figure 2 shows four sample images of the different stages of apple ripeness (Malus Domestica L., var. Red Delicious). As can be seen, since maturation is a natural process that occurs continuously and progressively, the colors of the samples change gradually. In this way, the colors of unripe and half-ripe apples are very similar, and the same happens for ripe and overripe stages.
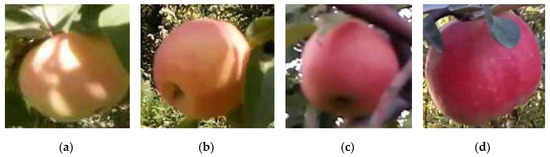
Figure 2.
Sample images of the four different apple ripening stages (Malus Domestica L., var. Red Delicious) extracted from the captured frames under natural lighting conditions. (a) Unripe. (b) Half-ripe. (c) Ripe. (d) Overripe.
2.2. Segmentation of the Apples in the Video Frames
The first step in the development of a complete computer vision system is image segmentation, that is, the separation of the object of interest from the background of the image. Different color spaces have been used for segmentation in agriculture; for example, the YCrCb space is used in [24] to segment rice seedlings with high accuracy; in this space, Y is the luma, and Cr and Cb are the blue and red-difference chroma components, respectively. In the present study, segmentation was done frame by frame using the L*u*v* color space. The process is based on a comprehensive segmentation algorithm presented in [25]. This segmentation algorithm is a combination of four main methods based on segmentation in the L*u*v* color space, texture segmentation using local standard deviation texture descriptor, luminosity segmentation using intensity transformation, and color segmentation in the RGB color space. Figure 3 shows an example of the different steps of apple segmentation in a typical video frame image.
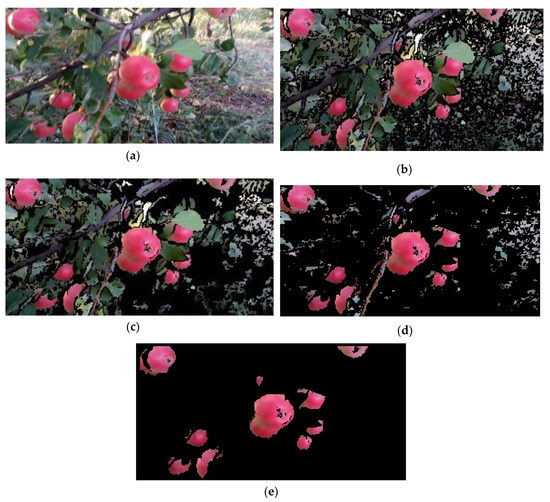
Figure 3.
Example of the steps in apple segmentation. (a) Original video frame. (b) First step of segmentation based on color thresholding in the L*u*v* color space. (c) Second step, based on texture features. (d) Third step, based on intensity transformation. (e) Final step, based on thresholding in RGB color space.
The first step of the process is depicted in Figure 3b, where the input frame is converted to the L*u*v* color space, and a threshold is then applied to remove bluish colors. The threshold value was obtained through a preliminary trial and error method and is set to 90 (for u* and v* in the range of a byte).
The second step (Figure 3c) is based on the local standard deviation texture descriptor. The original image is first converted to grayscale; then, the local standard deviation is computed for each pixel, that is, the standard deviation of the gray values for each neighborhood of 5 × 5 pixels around the given pixel. A threshold is applied to remove pixels with large texture values, meaning that pixels with a hard texture are supposed to belong to the background.
The third step of segmentation is shown in Figure 3d. It is based on intensity transformation using the R channel of RGB. It can be observed that most background pixels appear with darker colors, so they can be removed with this simple thresholding. In particular, a threshold level of 105 was applied to the R channel, meaning that all pixels with an R value lower than 105 are considered background.
The final segmentation result is presented in Figure 3e. This final step is based on 25 color tests in the RGB color space, as proposed in [25]. These 25 tests are applied sequentially, one after another, and combined with an OR Boolean operator. That is, the pixel is considered as background if one of the tests is true. The tests have the following form:
where (r, g, b) are the RGB values of the pixel in bytes. More information on the definition of these tests and the results of the method can be found in [25], where a segmentation accuracy near 99% was reported.
test1(r, g, b) = (185 ≤ r ≤ 195) and (170 ≤ g ≤ 185) and (170 ≤ b ≤ 185) and (r − b < 20)
2.3. Extraction of Different Color Features from the Objects
After the segmentation step, connected components are applied in order to find groups of pixels in the images. These connected components correspond mainly to apples, as shown in Figure 3e. Some errors may appear, such as partial occlusion of the apples, false negative pixels, and grouping together different apples due to overlapping. However, for the purpose of estimating the ripening stage, all these problems are negligible.
Color features are used to describe each detected object. Color has proved to be a very powerful feature to characterize objects in image analysis for agricultural purposes, where the selection of the optimal color space plays an essential role [26]. In this study, two groups of color features were extracted using color models: RGB, HSV, YCrCb, CMY, HSL, and L*u*v*; the definition of these models can be found in [26].
Let us consider a generic color space with channels (A, B, and C). The first group of extracted features is comprised of the mean of A, mean of B, mean of C, mean of A + B + C, standard deviation of A, standard deviation of B, and standard deviation of C. These values are computed for all the pixels in each object. Therefore, the total number of features extracted from each apple in this stage are 6 color spaces × 7 features = 42.
The second group of color features includes vegetation indices that have been commonly applied in previous studies [27,28,29,30,31,32]. Table 2 shows the definition of 14 indices that have previously been used in agricultural application to measure different properties of the objects. In order to obtain additional features, these equations are applied to the six color spaces defined above, although the indices were originally defined for the RGB color space. Thus, total number of features in this second group is 6 color spaces × 14 vegetation indices = 84. Summing up, the total number of color features for each apple object including both groups is 42 + 84 = 126.
Table 2.
Color features extracted for each object as vegetation indices.
2.4. Selecting the Most Effective Color Features
At the beginning of this step, a large number of 126 color features is available for each object. However, the use of all extracted features in classification is not feasible for working in real time, since the conversion to all color spaces would be a time-consuming step, besides the time required in the classifier. More importantly, the risk of overfitting during the learning phase would be very high, producing bad results in practice.
For this reason, a preceding study is performed with the purpose of selecting the most effective among the available color features. The approach is based on a hybrid of artificial neural networks (ANNs) and the simulated annealing (SA) algorithm for the selection of effective and discriminative features. The ANN is a classical multilayer perceptron (MLP), whose parameters are defined in Table 3. This classifier is controlled by a metaheuristic SA process that tests different combinations of the features in a controlled way.
Table 3.
Values of multilayer perceptron (MLP) neural network parameters used for the selection of the color features.
In detail, the process is as follows. First, all extracted scalar features are considered as a 126-vector; each of them is associated with a class label from 1 to 4, according to its ripening stage, by a human expert. In the next step, smaller size vectors of features are obtained, for example, vectors with 7, 12, or 18 features, by means of an automatic SA optimization algorithm. These reduced vectors (input) and the corresponding labels (output) are sent to the MLP neural network for training and testing. Specifically, the dataset is divided into disjoint sets of 70% for training, 15% for validation, and the remaining 15% for testing. As a result, the mean square error (MSE) obtained for the test set for each combination of features is measured, and used as the criterion for selecting the most effective features. The metaheuristic SA method controls the selection of the combination of features, according to the MSE values. Finally, the vector of features which has the lowest value of the MSE is selected as the optimal set of color features for the following step.
2.5. Classification of the Different Stages of Ripening
After obtaining the set of most effective color features, classification of the apples is the final step of the proposed method. Classification is performed with an MLP neural network, whose parameters are optimized with a genetic algorithm (GA). The input of the MLP is the vector of effective features and its output are the labels corresponding to the different ripening stages.
It is well known that setting the optimal parameters of an ANN can have an important effect on its effectiveness [33]. An incorrect setup of the network could produce inefficiency or poor results. The MLP artificial neural network has five adjustable parameters. Setting these parameters accurately ensures high precision in the final classification. These parameters are the number of hidden layers, the number of neurons per hidden layer, the transfer function in each layer, the backpropagation network training function, and the backpropagation weight/bias learning function.
In the proposed ANN-GA hybrid approach, the GA is responsible for selecting different possible configurations of the parameters. Each combination is sent to the MLP, producing an MSE measure in the classification of the test set. As in the previous step, the dataset is divided into the same three disjoint groups for training (70% of the data), validation (15%), and test (15%). The GA generates different combinations through the processes of crossover, mutation, and selection, and it ends when it reaches convergence or after a given number of iterations. At that point, the optimal configuration of the parameters in terms of the minimum MSE is obtained.
For instance, a sample vector of parameter could be y = {8, 10, 15, logsig, logsig, satlins, trainrp, learnp}, indicating that the MLP has an input layer, three hidden layers with 8, 10, and 15 neurons, respectively, and an output layer with 4 outputs (one for each class). The transfer functions of the layers are log-sigmoid, log-sigmoid, and saturating linear, respectively. Finally, the ANN uses a resilient backpropagation training function, and a perceptron weight and bias learning function. The process tests the 13 transfer functions, 19 backpropagation functions, and 15 learning functions included in the machine learning toolbox of MATLAB.
3. Results and Discussion
The experiments to assess the effectiveness of the proposed method are divided into the different steps of the process. First, the accuracy of the segmentation algorithm is shown. Then, the results of the selection of the most effective color features are presented. Next, the training of the classifier and the classification results are discussed. Last, the computational efficiency of the algorithm is evaluated.
3.1. Accuracy of the Segmentation Algorithm
In order to measure the accuracy of the segmentation algorithm, the 8390 input images of the dataset were previously analyzed, obtaining 45,306 objects; 27,687 correspond to apples (61.1%) and 17,619 to the background (38.9%). The segmentation step was then applied to the images, comparing the obtained results with the ground truth. Table 4 shows the confusion matrix and accuracy achieved in identifying background objects and apples over the test set.
Table 4.
Confusion matrix, segmentation error, and accuracy of the segmentation algorithm for identifying background objects and apples on the test set.
Based on this table, it can be observed that 98.51% of all samples belonging to the apple class and 98.31% of the background objects were detected correctly, producing a total accuracy of 98.43% in the segmentation process. This is a very remarkable result, allowing a potential use of the algorithm in practice under real environment conditions. Although these results are slightly worse than those reported in [25], with a 99.12% accuracy, they are still better than other state-of-the-art methods, as applied in [34,35], which achieved 92.5% and 95.72%, respectively, in segmentation of different agricultural products. Thus, this approach by itself can be applied to other problems of color segmentation for irrigation management, such as the study of crop canopy [36]. Moreover, since the purpose of the present research is to measure the overall ripeness state of the fruits, an error of only 1.5% false apples should not greatly affect the final result.
3.2. Most Effective Color Features Using the Hybrid ANN-SA Method
The 27,687 apples objects segmented in the previous step were manually labeled by a human operator in one of the four ripening classes defined (i.e., unripe, half-ripe, ripe, and overripe). The hybrid ANN-SA technique defined in Section 2 was used to select the most effective set of color features. A total of 19,092 samples were used for training, 4091 for validation and 4091 for testing, being all sets disjoint. As a result, six parameters were selected as the most effective features: excess red (EXR); normalized red of RGB (Rn); mean of L in HSL color space; standard deviation of Cb in YCbCr; color index for extracted vegetation cover in L*u*v* (CIVE); and red-blue color contrast (RBI).
As could be expected, the obtained results remark the importance of the red channel to distinguish the state of ripeness of the apples. However, this channel should not be used by itself, but compared to the other channels; for example, by using the normalized red (Rn) or comparing it to the blue (RBI) or the green channel (EXR). Other selected features indicate the importance of the luminance of the objects.
Unlike the steps of apple segmentation and object classification, that must be applied to all the frames captured by the drone in a practical use of the system, the selection of the most effective color features is a process that should only be applied once. In other words, these six features should be applied to all the video sequences obtained under similar conditions, without needing additional training.
3.3. Accuracy of the Hybrid ANN-GA Classifier
The step prior to the classification of the apples is to look for the optimal configuration of the ANN. To obtain the optimal parameters of the MLP neural network, the training phase described in Section 2 was repeated 30 times. Table 5 shows the optimal values of the ANN parameters of the hidden layers. As can be seen, the optimal network has 2 layers with 4 and 25 hidden neurons, respectively.
Table 5.
Optimal parameters of the MLP neural network obtained in the artificial neural network–genetic algorithm (ANN-GA) hybrid approach for the classification of the ripening stages of the apples.
These parameters of Table 5 define an MLP that is considered optimal for the problem of interest. Table 6 shows the results of classification of this optimal ANN configuration using the confusion matrix. In this case, 19,520 object samples were used for training the network, 3877 for validation, and 3877 for testing.
Table 6.
Confusion matrix resulting from the classification of the ripening stage of the apples using the hybrid ANN-GA approach. Classes: 1. unripe; 2. half-ripe; 3. ripe; 4. overripe.
The system classified 741 out of the 753 samples belonging to the unripe class correctly (98.4% accuracy). On the other hand, the maximum misclassification rate was in the overripe class with a 2.46% error. Analyzing these errors, 25 samples out of the 30 incorrectly classified samples of Class 1 were misclassified in Class 2, and 17 samples of Class 2 were misclassified in Class 1. This means that the samples in these two classes, unripe and half-ripe, have very similar properties. Moreover, the same happens between Classes 3 and 4, ripe and overripe, but to a lower extent. From the 2.11% total error, up to 1.88% corresponds to an error of rank 1 (i.e., real class x, predicted as x + 1 or x − 1), only 0.23% to an error of rank 2, and there is no error of rank 3. This is a very interesting result, indicating that, even in the case of misclassification, the error committed by the system is not very high. For example, if a harvesting strategy is defined differentiating the stages before ripening (1 and 2) and after ripening (3 and 4), the probability of confusing both groups would be only 0.31% (12 samples). Finally, the classifier reached an overall accuracy of 97.88% over the test set. It has to be observed that the decisions using ripening information should be based on the global state of a tree or an area of the crop, not on individual fruits. Thus, the risk of applying an incorrect strategy would be extremely low.
3.4. Classifier Performance Based on ROC, Sensitivity, Specificity and Accuracy
Two common and useful ways to analyze the performance of classifiers are the receiver operating characteristic (ROC) curve and the criteria of sensitivity, specificity, and accuracy [37]. Figure 4 depicts the ROC curves of the proposed system for the four defined classes. On the other hand, Table 7 shows the performance results of the hybrid ANN-GA classifier using the three above-mentioned criteria and the area under the ROC curve (AUC) for each class.
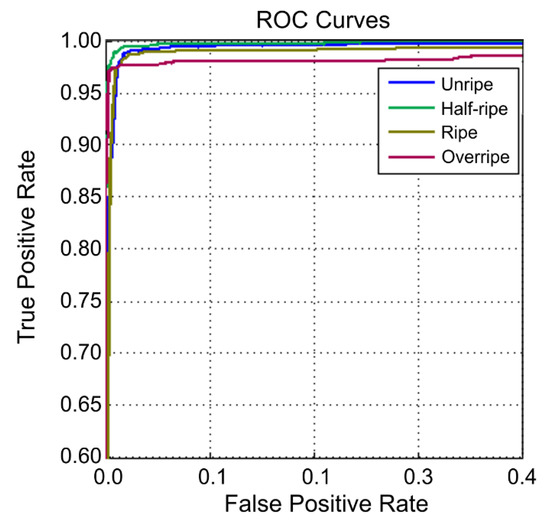
Figure 4.
ROC curves of the proposed hybrid ANN-GA classifier.
Table 7.
Performance results of the hybrid ANN-GA classifier using different criteria: sensitivity, accuracy, and specificity, and area under the ROC curve (AUC). Classes: 1. unripe; 2. half-ripe; 3. ripe; 4. overripe.
The maximum value of sensitivity is reached in the ripe class, with 98.41%. Table 6 proves this fact, since only 12 samples of this class were misclassified in other classes. The maximum value of specificity of the classifier is given in Class 4, with 99.02%, as only nine samples of Class 3 are misclassified as Class 4. To conclude, this table shows that the maximum accuracy of the classifier is also given in the overripe class with a 99.16% accuracy, although it has the lowest sensitivity. In general, all the classes achieve very similar results, so the system will be able to work correctly throughout the process of growing of the apples. The values of the AUC also indicate very good results, near or above 0.99. This proves that the obtained classifier is not only very accurate, but also very robust in relation to its parameters. Only Class 4 presents a lower AUC value, indicating a slight confusion with Class 3.
Figure 5 shows a sample result after segmentation and classification. In this case, all the 18 existing apple samples were correctly detected and classified. More sample results of the segmentation and classification algorithm are available in the indicated link. It can be observed that the system is able to work under very different conditions. In some cases, when the apples are overlapped, only one object is detected for two or more apples. This would be problematic for a fruit counting algorithm, although for the purpose of estimating the state of maturation it is not irrelevant. In most cases, both apples have the same ripeness stage, and the system will produce an average estimation.
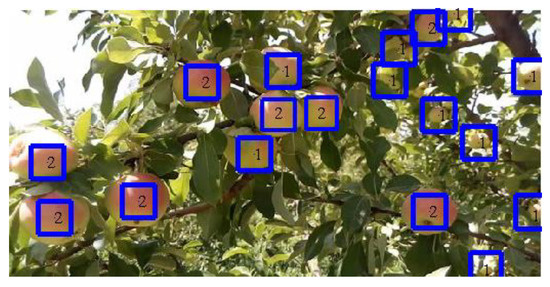
Figure 5.
A sample video frame after application of the proposed apple ripening classification. The number corresponds to the ripening label (1. unripe; 2. half-ripe). A sample video with more results is available at https://youtu.be/A3ROtqRy9os.
3.5. Computational Efficiency of the Proposed Algorithm
Finally, experiments were conducted to measure the computational efficiency of the proposed method for apple segmentation and ripening estimation. The speed of the algorithm is an important factor in agricultural applications, e.g., enabling that the process can be applied in real time on the videos captured by the drones. Moreover, if the drone has enough computational power, the algorithm could be applied in the drone itself. For this reason, the algorithms that are used in machine vision systems, in addition to the precision, must have a fast processing speed.
In this study, a laptop computer with an Intel Core i3 processor CFI, 330M at 2.13 GHz, 4 GB of RAM-4GB, and MATLAB 2015b was used to execute the proposed algorithms. The average CPU times to perform apple segmentation, feature extraction, and ripening classification for each frame were 0.591, 0.296, and 0.198 s, respectively. The total processing time was around 1 s per frame. In the case of a compiled and optimized C/C++ implementation, this time could be greatly reduced.
4. Conclusions
The use of drone and satellite imagery can bring great benefits in the agricultural domain, in applications such as water management, fertigation, monitoring, and harvesting decisions. In this study, a complete computer vision system has been proposed to recognize the different ripening stages of apples of the Red Delicious variety under natural outdoor conditions. The final purpose of the system is to enable an accurate irrigation strategy based on the current maturity state of the crop, as well as to determine the proper time to recollect the fruits from the trees.
The proposed computer vision system has three main parts: segmenting the apples in the video frames; extracting color features of the apples; and classifying them in a ripening class using an ANN. The first step is based on the combination of four basic methods and has shown a very high accuracy in detecting 98.4% of the apples. A reduced set of the six most effective color features are computed for each segmented object; these features indicate the importance of the red channel in the problem of interest, but always in relative terms to the other channels. Finally, classification is done with an ANN that has been optimally configured with a genetic algorithm. The obtained values of sensitivity, specificity, and accuracy for the four classes are always above 96% over the test set, achieving a global accuracy of 97.88%. These facts suggest that the system can be potentially applied under real-world industrial applications. The measure of the computational efficiency indicates that the process could be applied very fast in an average general-purpose processor. The adaptation to other types of apples or fruits should not require a change in the process—only the application of the most effective feature selection and the training of the hybrid ANN-GA classifier with the new data of the problem.
Several interesting future research lines arise from this work. First, defining the optimal irrigation strategy using the overall maturity state of the fruits would be necessary for a complete automation of water management. Second, it could be possible to predict the fruit production of the crop adding a counting and averaging algorithm able to solve the problems of occlusion and overlapping. Moreover, the size of the apples could also be estimated accurately by image processing after solving both issues.
Author Contributions
Conceptualization, S.S. and Y.A.-G.; Methodology, S.S., Y.A.-G., J.I.A., and G.G.-M.; Software, S.S.; Validation, S.S., Y.A.-G., J.I.A., and G.G.-M.; Formal Analysis, S.S., Y.A.-G., and J.I.A.; Investigation, S.S., Y.A.-G., J.I.A., G.G.-M., A.R.-C., and J.M.M.-M.; Resources, S.S. and Y.A.-G.; Writing—Original Draft Preparation, S.S. and J.I.A.; Writing—Review & Editing, J.I.A., G.G.-M., A.R.-C., and J.M.M.-M.; Supervision, Y.A.-G.; Project Administration, Y.A.-G.; Funding Acquisition, Y.A.-G., G.G.-M., A.R.-C., and J.M.M.-M.
Funding
This research was funded by the Iran National Science Foundation (INSF) through the research project 96007466 and by the Spanish MINECO, as well as European Commission FEDER funds, under grant numbers TIN2015-66972-C5-3-R and AGL2015-66938-C2-1-R.
Conflicts of Interest
The authors declare no conflict of interest. The funders had no role in the design of the study; in the collection, analyses, or interpretation of data; in the writing of the manuscript; or in the decision to publish the results.
References
- Li, B.; Lecourt, J.; Bishop, G. Advances in non-destructive early assessment of fruit ripeness towards defining optimal time of harvest and yield prediction—A review. Plants 2018, 7, 3. [Google Scholar]
- Arendse, E.; Fawole, O.A.; Magwaza, L.S.; Opara, U.L. Non-destructive prediction of internal and external quality attributes of fruit with thick rind: A review. J. Food Eng. 2018, 217, 11–23. [Google Scholar] [CrossRef]
- Lu, Y.; Huang, Y.; Lu, R. Innovative Hyperspectral Imaging-Based Techniques for Quality Evaluation of Fruits and Vegetables: A Review. Appl. Sci. 2017, 7, 189. [Google Scholar] [CrossRef]
- Duggal, V.; Sukhwani, M.; Bipin, K.; Reddy, G.S.; Krishna, K.M. Plantation monitoring and yield estimation using autonomous quadcopter for precision agriculture. In Proceedings of the IEEE International Conference on Robotics and Automation, Stockholm, Sweden, 16–21 May 2016. [Google Scholar]
- Rajkumar, P.; Wang, N.; EImasry, G.; Raghavan, G.S.V.; Gariepy, Y. Studies on banana fruit quality and maturity stages using hyperspectral imaging. J. Food Eng. 2012, 108, 194–200. [Google Scholar] [CrossRef]
- Ramos, P.J.; Prieto, F.A.; Montoya, E.C.; Oliveros, C.E. Automatic fruit count on coffee branches using computer vision. Comput. Electron. Agric. 2017, 137, 9–22. [Google Scholar] [CrossRef]
- Rungpichayapichet, P.; Nagle, M.; Yuwanbun, P.; Khuwijitjaru, P.; Mahayothee, B.; Müller, J. Prediction mapping of physicochemical properties in mango by hyperspectral imaging. Biosyst. Eng. 2017, 159, 109–120. [Google Scholar] [CrossRef]
- Santagapita, P.R.; Tylewicz, U.; Panarese, V.; Rocculi, P.; Dalla, M.; Dalla Rosa, M. Non-destructive assessment of kiwifruit physico-chemical parameters to optimise the osmotic dehydration process: A study on FT-NIR spectroscopy. Biosyst. Eng. 2016, 142, 101–109. [Google Scholar] [CrossRef]
- Munera, S.; Amigo, J.M.; Blasco, J.; Cubero, S.; Talens, P.; Aleixos, N. Ripeness monitoring of two cultivars of nectarine using VIS-NIR hyperspectral reflectance imaging. J. Food Eng. 2017, 214, 29–39. [Google Scholar] [CrossRef]
- Cárdenas-Pérez, S.; Chanona-Pérez, J.; Méndez-Méndez, J.V.; Calderón-Domínguez, G.; López-Santiago, R.; Perea-Flores, M.J.; Arzate-Vázquez, I. Evaluation of the ripening stages of apple (Golden Delicious) by means of computer vision system. Biosyst. Eng. 2017, 159, 46–58. [Google Scholar] [CrossRef]
- Seifert, B.; Pflanz, M.; Zude, M. Spectral shift as advanced index for fruit chlorophyll breakdown. Food Bioprocess Technol. 2014, 7, 2050–2059. [Google Scholar] [CrossRef]
- Das, A.J.; Wahi, A.; Kothari, I.; Raskar, R. Ultra-portable, wireless smartphone spectrometer for rapid, non-destructive testing of fruit ripeness. Sci. Rep. 2016, 6, 32504. [Google Scholar] [CrossRef] [PubMed]
- Mohapatra, A.; Shanmugasundaram, S.; Malmathanraj, R. Grading of ripening stages of red banana using dielectric properties changes and image processing approach. Comput. Electron. Agric. 2017, 143, 100–110. [Google Scholar] [CrossRef]
- Meyer, G.E.; Mehta, T.; Kocher, M.; Mortensen, D.A.; Samal, A. Textural imaging and discriminant analysis for distinguishing weeds for spot spraying. Trans. Asae 1998, 41, 1189–1197. [Google Scholar] [CrossRef]
- Valente, J.; Almeida, R.; Kooistra, L. A Comprehensive Study of the Potential Application of Flying Ethylene-Sensitive Sensors for Ripeness Detection in Apple Orchards. Sensors 2019, 19, 372. [Google Scholar] [CrossRef] [PubMed]
- He, L.; Schupp, J. Sensing and Automation in Pruning of Apple Trees: A Review. Agronomy 2018, 8, 211. [Google Scholar] [CrossRef]
- Zhang, C.; Yue, P.; Di, L.; Wu, Z. Automatic Identification of Center Pivot Irrigation Systems from Landsat Images Using Convolutional Neural Networks. Agriculture 2018, 8, 147. [Google Scholar] [CrossRef]
- Rozenstein, O.; Haymann, N.; Kaplan, G.; Tanny, J. Estimating cotton water consumption using a time series of Sentinel-2 imagery. Agric. Water Manag. 2018, 207, 44–52. [Google Scholar] [CrossRef]
- Hoffmann, H.; Jensen, R.; Thomsen, A.; Nieto, H.; Rasmussen, J.; Friborg, T. Crop water stress maps for an entire growing season from visible and thermal UAV imagery. Biogeosciences 2016, 13, 6545–6563. [Google Scholar] [CrossRef]
- Chang, C.L.; Lin, K.M. Smart agricultural machine with a computer vision-based weeding and variable-rate irrigation scheme. Robotics 2018, 7, 38. [Google Scholar] [CrossRef]
- Zhou, J.; Khot, L.R.; Boydston, R.A.; Miklas, P.N.; Porter, L. Low altitude remote sensing technologies for crop stress monitoring: A case study on spatial and temporal monitoring of irrigated pinto bean. Precis. Agric. 2018, 19, 555–569. [Google Scholar] [CrossRef]
- Chapman, S.; Merz, T.; Chan, A.; Jackway, P.; Hrabar, S.; Dreccer, M.; Holland, E.; Zheng, B.; Ling, T.; Jimenez-Berni, J. Pheno-Copter: A Low-Altitude, Autonomous Remote-Sensing Robotic Helicopter for High-Throughput Field-Based Phenotyping. Agronomy 2014, 4, 279–301. [Google Scholar] [CrossRef]
- Gómez, A.H.; Hu, G.; Wang, J.; Pereira, A.G. Evaluation of tomato maturity by electronic nose. Comput. Electron. Agric. 2006, 54, 44–52. [Google Scholar] [CrossRef]
- Liao, J.; Wang, Y.; Yin, J.; Liu, L.; Zhang, S.; Zhu, D. Segmentation of Rice Seedlings Using the YCrCb Color Space and an Improved Otsu Method. Agronomy 2018, 8, 269. [Google Scholar] [CrossRef]
- Sabzi, S.; Abbaspour-Gilandeh, Y.; García-Mateos, G.; Ruiz-Canales, A.; Molina-Martínez, J.M. Segmentation of apples in aerial images under sixteen different lighting conditions using color and texture for optimal irrigation. Water 2018, 10, 1634. [Google Scholar] [CrossRef]
- Hernández-Hernández, J.L.; García-Mateos, G.; González-Esquiva, J.M.; Escarabajal-Henarejos, D.; Ruiz-Canales, A.; Molina-Martínez, J.M. Optimal color space selection method for plant/soil segmentation in agriculture. Comput. Electron. Agric. 2016, 122, 124–132. [Google Scholar] [CrossRef]
- Woebbecke, D.M.; Meyer, G.E.; Von Bargen, K.; Mortensen, D.A. Color indices for weed identification under various soil, residue, and lighting conditions. Trans. ASAE 1995, 38, 259–269. [Google Scholar] [CrossRef]
- Raine, S.R.; Meyer, W.S.; Rassam, D.W.; Hutson, J.L.; Cook, F.J. Soil-water and solute movement under precision irrigation: Knowledge gaps for managing sustainable root zones. Irrig. Sci. 2007, 26, 91–100. [Google Scholar] [CrossRef]
- Kataoka, T.; Kaneko, T.; Okamoto, H.; Hata, S. Crop growth estimation system using machine vision. In Proceedings of the IEEE/ASME International Conference on Advanced Intelligent Mechatronics (AIM 2003), Kobe, Japan, 20–24 July 2003. [Google Scholar]
- Meyer, G.E.; Neto, J.C. Verification of color vegetation indices for automated crop imaging applications. Comput. Electron. Agric. 2008, 63, 282–293. [Google Scholar] [CrossRef]
- Woebbecke, D.M.; Meyer, G.E.; Bargen, K.V.; Mortensen, D.A. Plant species identification, size, and enumeration using machine vision techniques on near-binary images. Opt. Agric. For. 1993, 1836, 208–220. [Google Scholar]
- Golzarian, M.R.; Frick, R.A. Classification of images of wheat, ryegrass and brome grass species at early growth stages using principal component analysis. Plant Methods 2011, 7, 28. [Google Scholar] [CrossRef]
- Sabzi, S.; Abbaspour-Gilandeh, Y.; García-Mateos, G. A fast and accurate expert system for weed identification in potato crops using metaheuristic algorithms. Comput. Ind. 2018, 98, 80–89. [Google Scholar] [CrossRef]
- Sai, Z.; Fan, Y.; Tang, Y.; Lei, X.; Zhao, Y. Optimized algorithm of sensor node deployment for intelligent agricultural monitoring. Comput. Electron. Agric. 2016, 127, 76–86. [Google Scholar] [CrossRef]
- Aquino-Santos, R.; González-Potes, A.; Edwards-Block, A.; Virgen-Ortiz, R.A. Developing a new wireless sensor network platform and its application in precision agriculture. Sensors 2011, 11, 1192–1211. [Google Scholar] [CrossRef] [PubMed]
- González-Esquiva, J.M.; García-Mateos, G.; Escarabajal-Henarejos, D.; Hernández-Hernández, J.L.; Ruiz-Canales, A.; Molina-Martínez, J.M. A new model for water balance estimation on lettuce crops using effective diameter obtained with image analysis. Agric. Water Manag. 2017, 183, 116–122. [Google Scholar] [CrossRef]
- Wisaeng, K. A Comparison of Decision Tree Algorithms For UCI Repository Classification. Int. J. Eng. Trends Technol. 2013, 4, 3397–3401. [Google Scholar]


© 2019 by the authors. Licensee MDPI, Basel, Switzerland. This article is an open access article distributed under the terms and conditions of the Creative Commons Attribution (CC BY) license (http://creativecommons.org/licenses/by/4.0/).