Article

Simulated Assessment of Summer Maize Drought Loss Sensitivity in Huaibei Plain, China

1
School of Civil Engineering, Hefei University of Technology, Hefei 230009, China
2
Key Laboratory of Water Conservancy and Water Resources of Anhui Province, Water Resources Research Institute of Anhui Province and Huaihe River Commission, Ministry of Water Resources, Hefei 230088, China
3
Stage Key Laboratory of Hydraulic Engineering Simulation and Safety, Tianjin University, Tianjin 300072, China
*
Author to whom correspondence should be addressed.
Agronomy 2019, 9(2), 78; https://doi.org/10.3390/agronomy9020078
Submission received: 24 December 2018 / Revised: 31 January 2019 / Accepted: 1 February 2019 / Published: 12 February 2019
(This article belongs to the Section Water Use and Irrigation)

Abstract

:
In an agricultural drought risk system, crop drought loss sensitivity evaluation is a fundamental link for quantitative agricultural drought loss risk assessment. Summer maize growth processes under various drought patterns were simulated using the Cropping System Model (CSM)-CERES-maize, which was calibrated and validated based on pit experiments conducted in the Huaibei Plain during 2016 and 2017 seasons. Then S-shaped maize drought loss sensitivity curve was built for fitting the relationship between drought hazard index intensity at a given stage and the corresponding dry matter accumulation and grain yield loss rate, respectively. Drought stress reduced summer maize evapotranspiration, dry matter, and yield accumulation, and the reductions increased with the drought intensity at each stage. Moreover, the losses caused by drought at different stages were significantly different. When maize plants were exposed to a severe water deficit at the jointing stage, the dry matter and grain yield formation were greatly affected. Therefore, maize growth was more sensitive to drought stress at the jointing stage when the stress was serious. Furthermore, when plants encountered a relatively slight drought during the seedling or jointing stage, which represented as a lower soil water deficit intensity, the grain yield loss rates approached the maximum for the sensitivity curves of these two stages. Therefore, summer maize tolerance to water deficit at the seedling and jointing stages were weak, and yield formation was more sensitive to water deficit during these two stages when the deficit was relatively slight.

1. Introduction

Natural disasters are occurring frequently, and are affected by global climate change and warming tendencies around the world. Drought is a typical natural disaster with wide effects that causes great losses in worldwide agriculture [1]. Worldwide, the average annual economic losses in agricultural production due to drought have exceeded $ 6 billion, and still increasing [2]. China, a drought disaster-prone country located in the East Asian monsoon region, reports over 25 billion kg of annual grain losses due to drought [3], directly affecting agricultural production and directly threatening food security [4].
Quantitative risk evaluation is an effective tool to manage extreme climate and weather events [5]. Meanwhile, in order to effectively cope with drought events and reduce grain losses, it is necessary to assess agricultural drought risk quantitatively [6]. Furthermore, agricultural drought risk can be regarded as a complex system which is composed of drought disaster-inducing factor hazards and crop drought loss vulnerability [7,8]. Moreover, as the core component of vulnerability, crop drought loss sensitivity can be quantified as the responses of crop growth to varying drought levels without measures taken by humans to decrease drought damages [9]. Therefore, studying sensitivity can provide scientific guidance for agricultural drought warning [10].
Many quantitative studies about crop drought loss sensitivity have been developed, which provide a foundation for clarifying the process of transforming crop water deficit into agricultural drought loss [7]. At present, widely applied methods for quantifying the sensitivity mainly include multi-index comprehensive evaluation method [11] and disaster damage curve-based method [12]. However, for the multi-index evaluation method, the evaluation index, grade criteria, and index weight are determined mostly by experts or experiences subjectively, and the evaluation results cannot completely reflect the formation process and physical mechanism of agricultural drought. In contrast, the damage curve-based method aims at building a logistic function, to reflect the quantitative relationship between drought intensity at a given crop growth stage and the corresponding growth loss. This curve could depict the variation of crop loss with drought intensity during a given stage. In addition, some previous studies have found that crops have different tolerances to the same degree of water deficit during different stages [13]. Meanwhile, the crop growth sensitivity to the same drought stress at different growth stages could be quantitatively compared by the sensitivity curve during each stage. Therefore, the sensitivity curve is the main direction for quantitatively evaluating sensitivity from the perspective of risk formation process [7].
In general, establishing a crop drought loss sensitivity curve requires sufficient samples (different drought intensities at a given stage and the corresponding crop growth losses) from years of field experiments [14]. Although the crop water deficit experiments could reflect the actual crop growth characteristics under drought conditions, they need long test cycles and high costs to conduct a large number of experiments for obtaining enough drought patterns. Meanwhile, the experiment results do not completely reflect the continuous crop growth process under drought stress, especially for extreme severe drought situation. The crop growth model—which assimilates the results of multi-disciplinary scientific research in crop physiology, meteorology, and soil fertilization—can precisely simulate the entire processes of crop growth and yield formation based on sufficient data from crop experiments [15]. The commonly used decision support systems with crop growth simulation models include FAO Crop Model to Simulate Yield Response to Water (AquaCrop) [16], Agricultural Production System Simulator (APSIM) [17], Environmental Policy-Integrated Climate (EPIC) [18], and the Decision Support System for Agrotechnology Transfer (DSSAT) [15]. In recent years, various crop growth models have been effectively used to optimize irrigation schemes or irrigation modes, and also to quantitatively assess the influence of environmental stress (such as water stress, fertility stress, and air stress) on crop growth and yield formation. Araya et al. [19] simulated the barley yield and water use efficiency under different irrigation schemes based on AquaCrop. Attia et al. [20] used DSSAT software to predict the wheat yield and water use efficiency under irrigation management in the Texas High Plains. In addition, these models are used to assess crop drought loss vulnerability and agricultural drought loss risk based on the simulated yield results. Yue et al. [21] presented a vulnerability curve method to assess regional wheat drought loss risk by applying EPIC. Yin et al. [22] proposed a crop drought loss risk assessment model which was appropriate for large regional scale by combining EPIC and Geographic Information System. Sensitivity was the most basic link connecting drought events to agricultural production losses [23]. However, crop drought loss sensitivity has not been defined clearly and quantitatively [24]. Therefore, it is foundational to establish sensitivity curve at each crop growth stages by combining practical crop water deficit experiments with crop growth model.
DSSAT is one of the most widely used and effective software for crop growth simulation, it includes CERES series, GROPGRO series and other crop models. These models could simulate daily growth processes of many crop species under drought stress and reflect crop characteristics and driving mechanisms of agricultural drought. Furthermore, maize is an important crop in the world, which could be a major source of food, fodder, and industrial material [25]. Statistics indicate that, over the past 50 years in China, the sown area of maize has accounted for 23.7% of the total sown area of grain per year, and the annual maize yield has accounted for 26.4% of the total grain production [25]. Moreover, Huaibei Plain is one of the main maize production regions in China [26], and the maize is mostly cultivated in the summer. The distribution of precipitation in this area is uneven due to the semi-arid and sub-humid monsoon climate. Meanwhile, the temperatures in summer of this plain are relatively high. Therefore, in this region, agricultural drought events occur frequently during the summer maize growing period [27]. A sensitivity curve could identify the sensitivity of maize growth to drought stress at each crop growth stages, which contributes to formulate effective irrigation schedules and measures for reducing grain losses. In this study, two seasonal summer maize experiments in the Huaibei Plain region were implemented, the data about maize growth and yield formation was used to (1) calibrate CSM-CERES-maize model and then simulate the maize growth processes under different drought scenarios; (2) build the summer maize drought loss sensitivity curve by fitting the relationship between drought hazard and the corresponding maize growth loss for each stage; and (3) compare the sensitivity of maize growth to a given drought stress degree at different periods. These sensitivity curves, which are built based on the physical mechanism of agricultural drought and actual crop growth processes under drought conditions, provide important basis for quantitative assessment of crop drought loss vulnerability and regional agricultural drought loss risk.

2. Materials and Methods

This study established sensitivity curves for summer maize in the Huaibei Plain, by combining pit plot experiments with CSM-CERES-maize model. Figure 1 illustrates the process of building sensitivity curves. The sensitivity curve, which was the quantitative relationship between drought intensity during a given maize growth stage and the corresponding maize loss, was constructed based on the samples under various drought patterns. Furthermore, these drought patterns were obtained by setting different precipitation events during maize growth period in DSSAT according to the actual precipitation characteristics in this area. In addition, the model was calibrated and validated by the measured experimental results before running. Specifically, in this study, the drought hazard index (DHI) was chosen to quantify the drought intensity in each maize growth stage, the dry matter accumulation loss and yield loss were respectively selected to quantitatively reflect the influence of drought stress on maize growth. The DHI, maize dry matter accumulation, and yield were outputs of CSM-CERES-maize model. In the model, the maize genetic parameters were mainly calibrated and validated. In detail, these parameters were calibrated using the data from experiment during the 2016 season and then validated by the experimental results in 2017. Moreover, three types of input data for the model included: (1) soil data; (2) meteorological data; and (3) field management data, such as planting density and amount of fertilizer application.

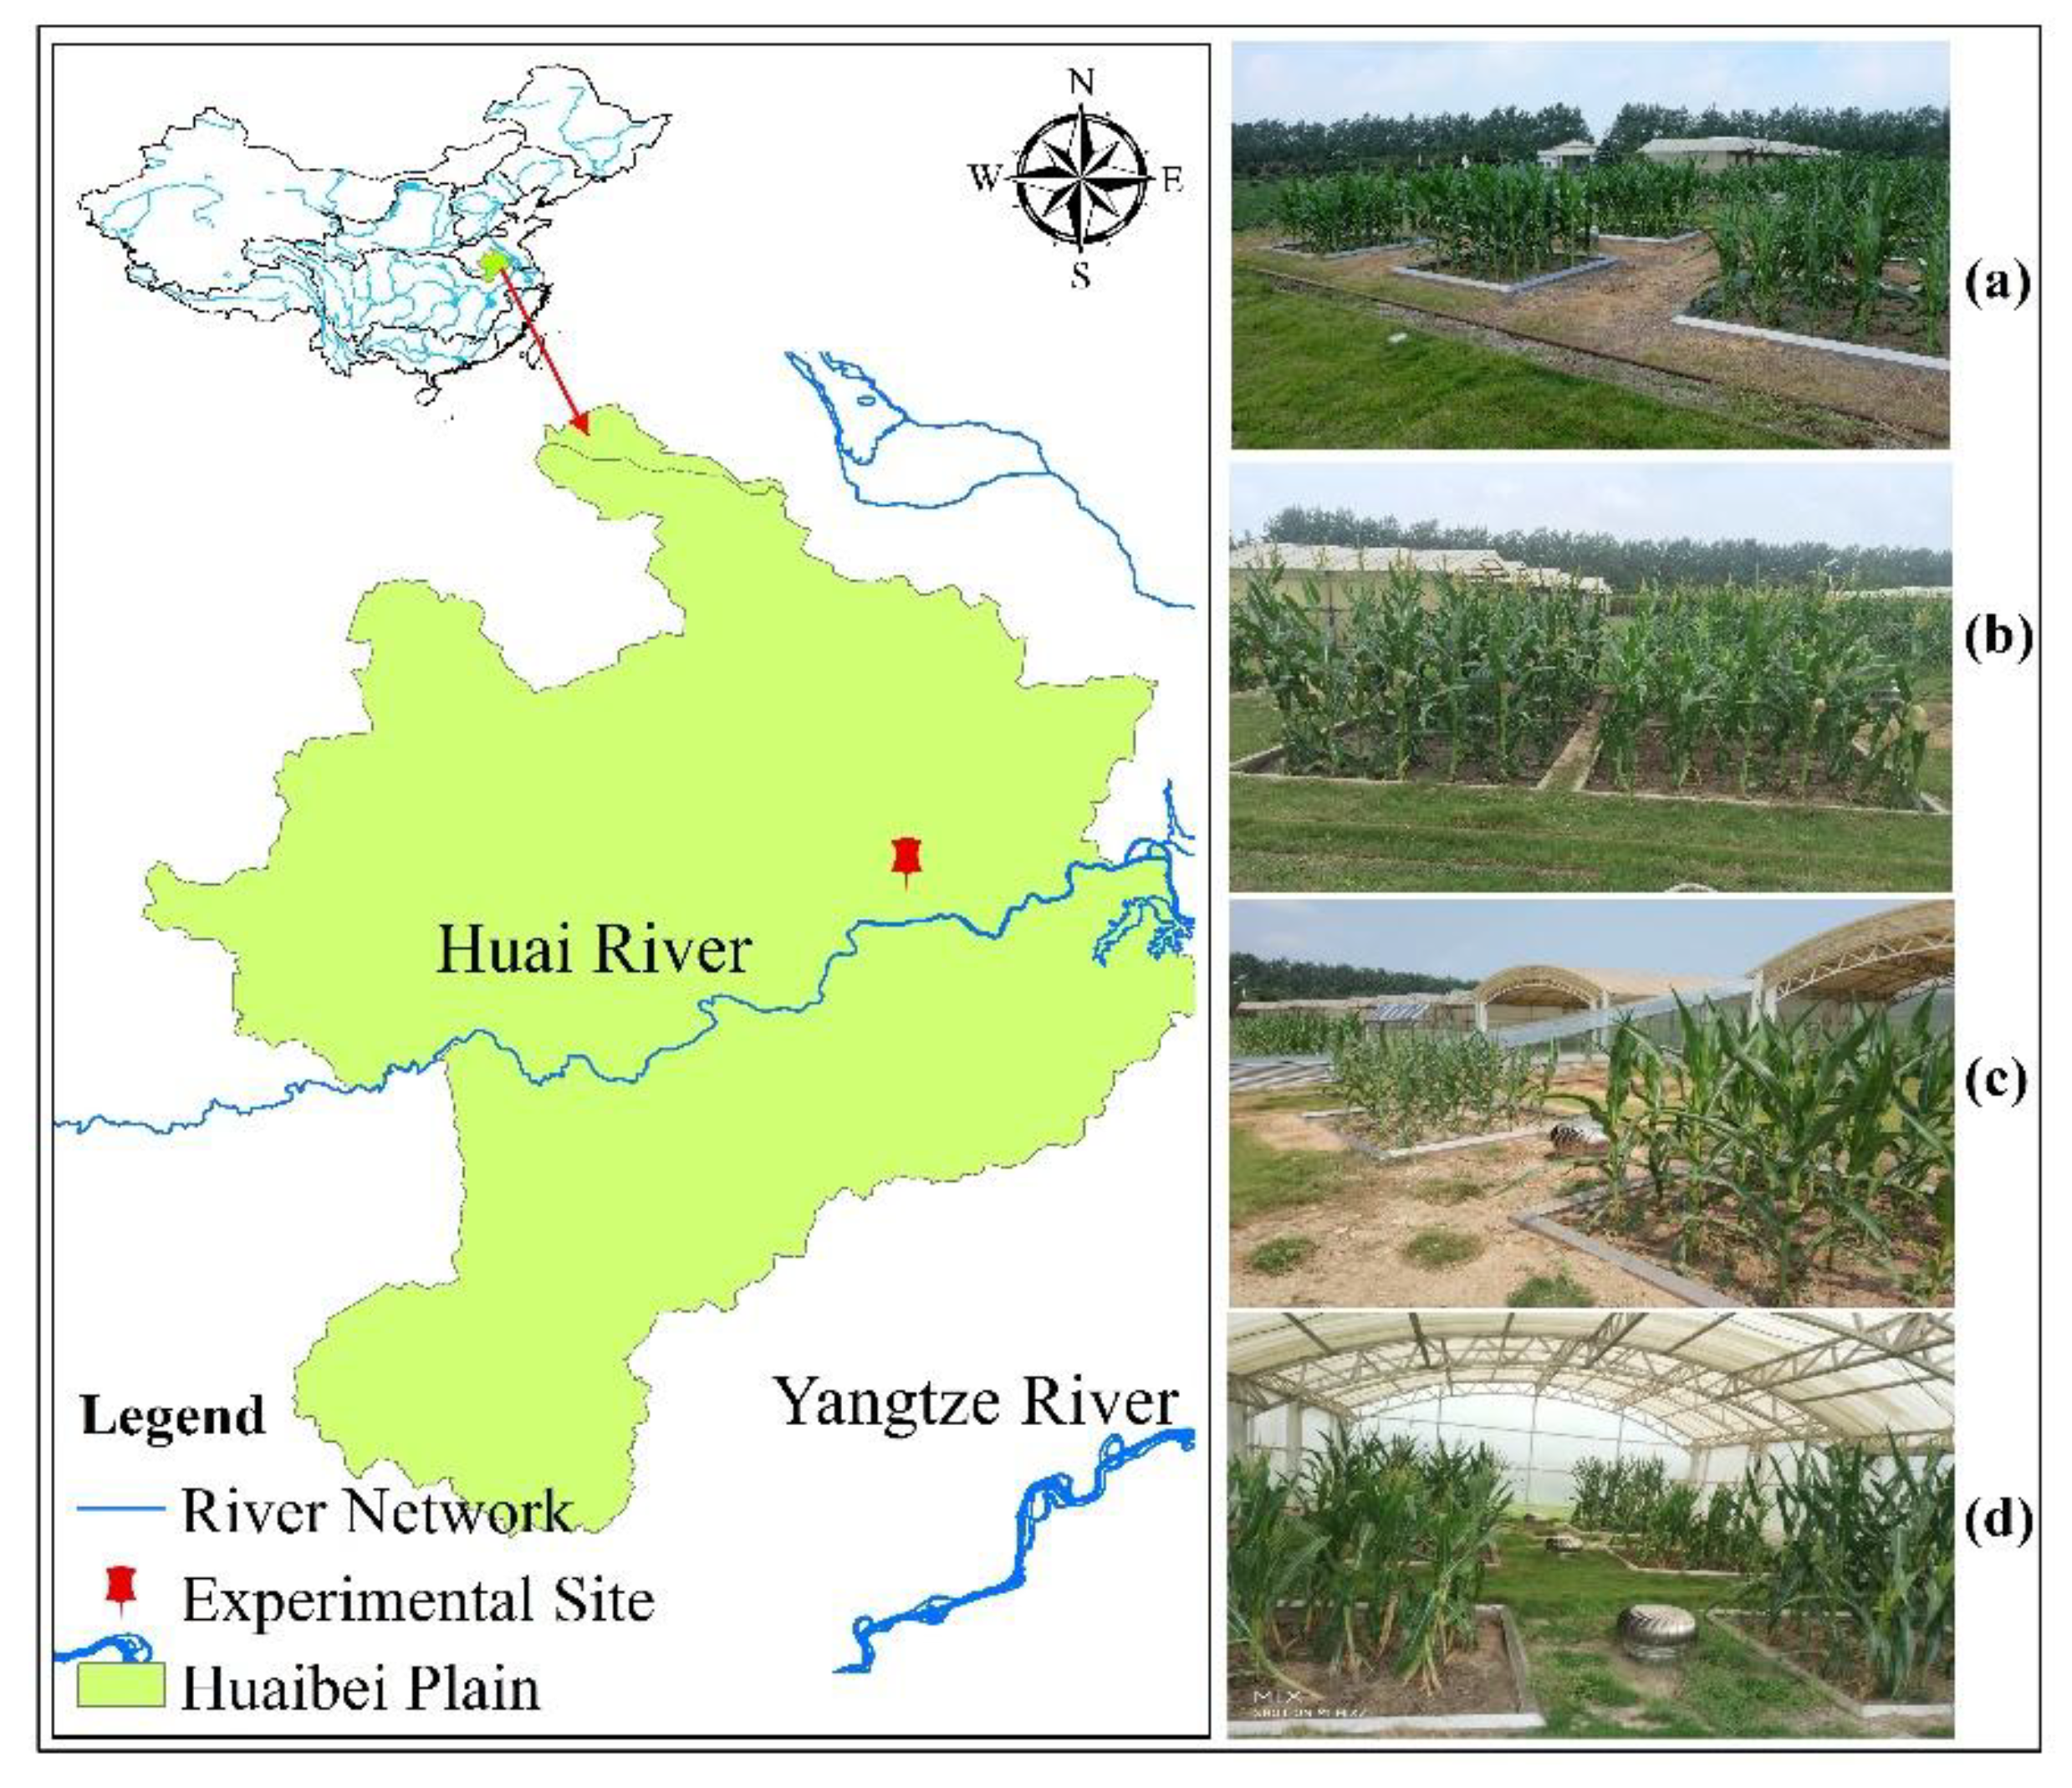
2.1. Summer Maize Pit Plot Experiments

Summer maize pit experiments were conducted at the Xinmaqiao Farmland Irrigation and Drainage Experiment Station, part of the Anhui and Huaihe River Institute of Hydraulic Research in Bengbu City, Anhui Province (33°09′ N and 117°22′ E) (Figure 2). This research site has a mean annual precipitation of 910 mm, a mean pan evaporation of 916 mm, a mean temperature of 15.0 °C, a mean sunshine duration of 1850 h, and a mean relative humidity of 73%. The experimental soil was Shajiang black soil, which was typical soil collected from this station. The soil water at field capacity was 0.38 (cm3/cm3), the soil water at wilting point was 0.12 (cm3/cm3) and the bulk density was 1.36 g/cm3. The two seasonal experiments were respectively implemented from 14 June (sowing) to 25 September (harvest) during the 2016 season, and from 9 June to 21 September in 2017.
Summer maize plants (cv. Longping-206) were cultivated in pit plots, and the size of each plot was 2.00 m (length) × 3.33 m (width) × 2.30 m (depth). There were four planting rows in each plot, and five maize plants were retained in each row. The seed spacing was 30 cm and the row spacing was 50 cm. Moreover, there were 500 g of compound fertilizer (N 15%, P2O5 15%, K2O 15%) and 200 g of urea were applied after sowing to promote the growth of seeds. All maize plots were placed under a movable rainout shelter (Figure 2), which was closed when precipitation occurred if the experiment requirement should be met. To eliminate the influence of rainfall, the experimental treatment in 2016 for summer maize was full irrigation without precipitation supplement, and the irrigation schemes were conducted based on the previous research [28] and crop experiments at this station for many years. However, for the treatment during the 2017 season, the summer maize grew completely under rain-fed conditions, the soil water was supplemented only by precipitation. Furthermore, three replications (three plots) were both arranged for the treatments in the two seasons. During the experimental period, all the field management practices except for irrigation or precipitation were the same for each maize plot.

2.2. Experimental Measurements

2.2.1. Soil Water Content

The soil water content at 0–40 cm in the experimental plot was measured via sampling and drying approximately every seven days during the 2016 and 2017 seasons. In each pit plot, two observation points were selected and the soil was sampled every 10 cm deep at each point. The weights of fresh and dry soil were both measured, and then the soil water content at four layers (0–10 cm, 10–20 cm, 20–30 cm, and 30–40 cm) were calculated, respectively.

2.2.2. Summer Maize Phenophase

The phenophases of summer maize in 2016 and 2017 were based on Zadoks’ method [29]. A given growth stage was considered when more than half of all maize plants in the plot had reached this period. The summer maize growth period in this study was further divided into four single growth periods (Table 1).

2.2.3. Maize Dry Matter Accumulation and Grain Yield

Dry matter accumulation (root, stem, leaf and fruit) and grain yield of all maize plants in each plot were measured after drying in the sun, with an electronic balance (TD30K-0.1, Tianjin Balance Instrument Co., LTD., Tianjin, China) in both seasons.

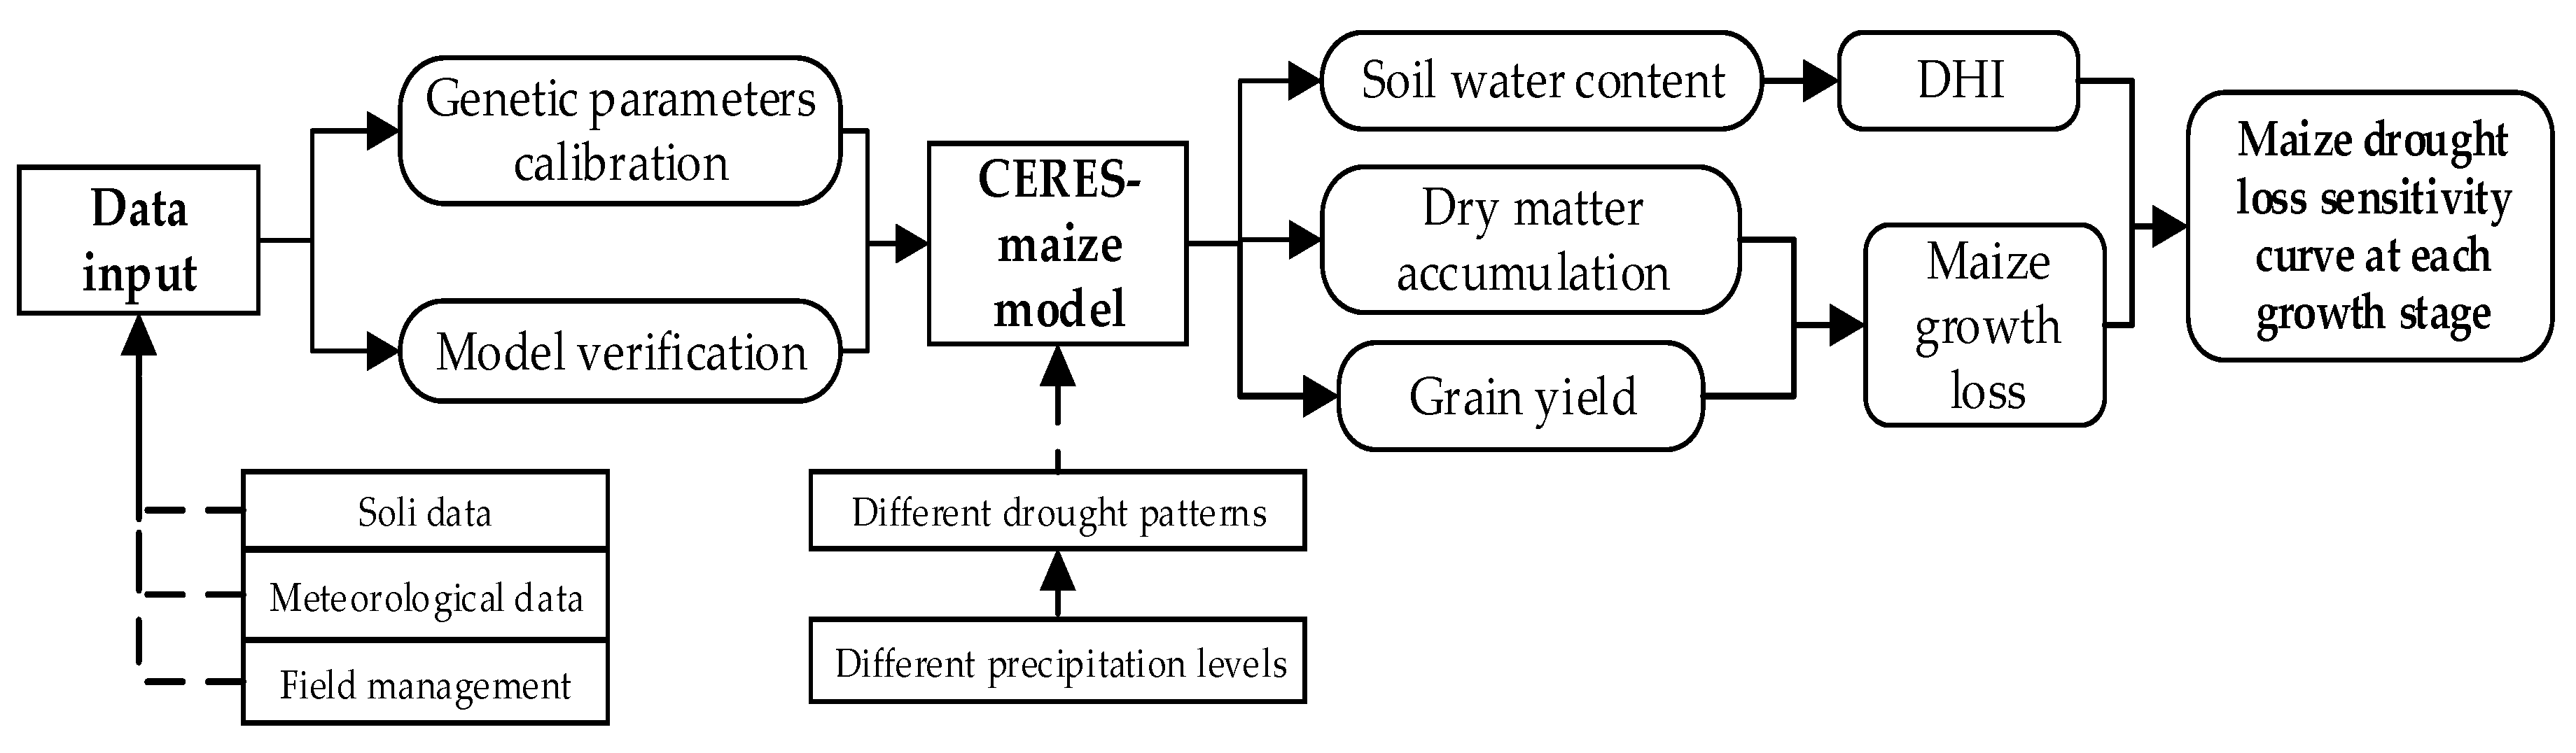
2.3. CSM-CERES-Maize Model Data Input

2.3.1. Soil Data

The experimental soil was divided into four layers from 0 to 40 cm, and part soil characteristics at each layer were respectively measured before experiments in this station during the 2016 and 2017 seasons. Results of soil bulk density, clay content, silt content, and initial soil water content are shown in Table 2, which were observed soil data for inputting in the CSM-CERES-maize model.

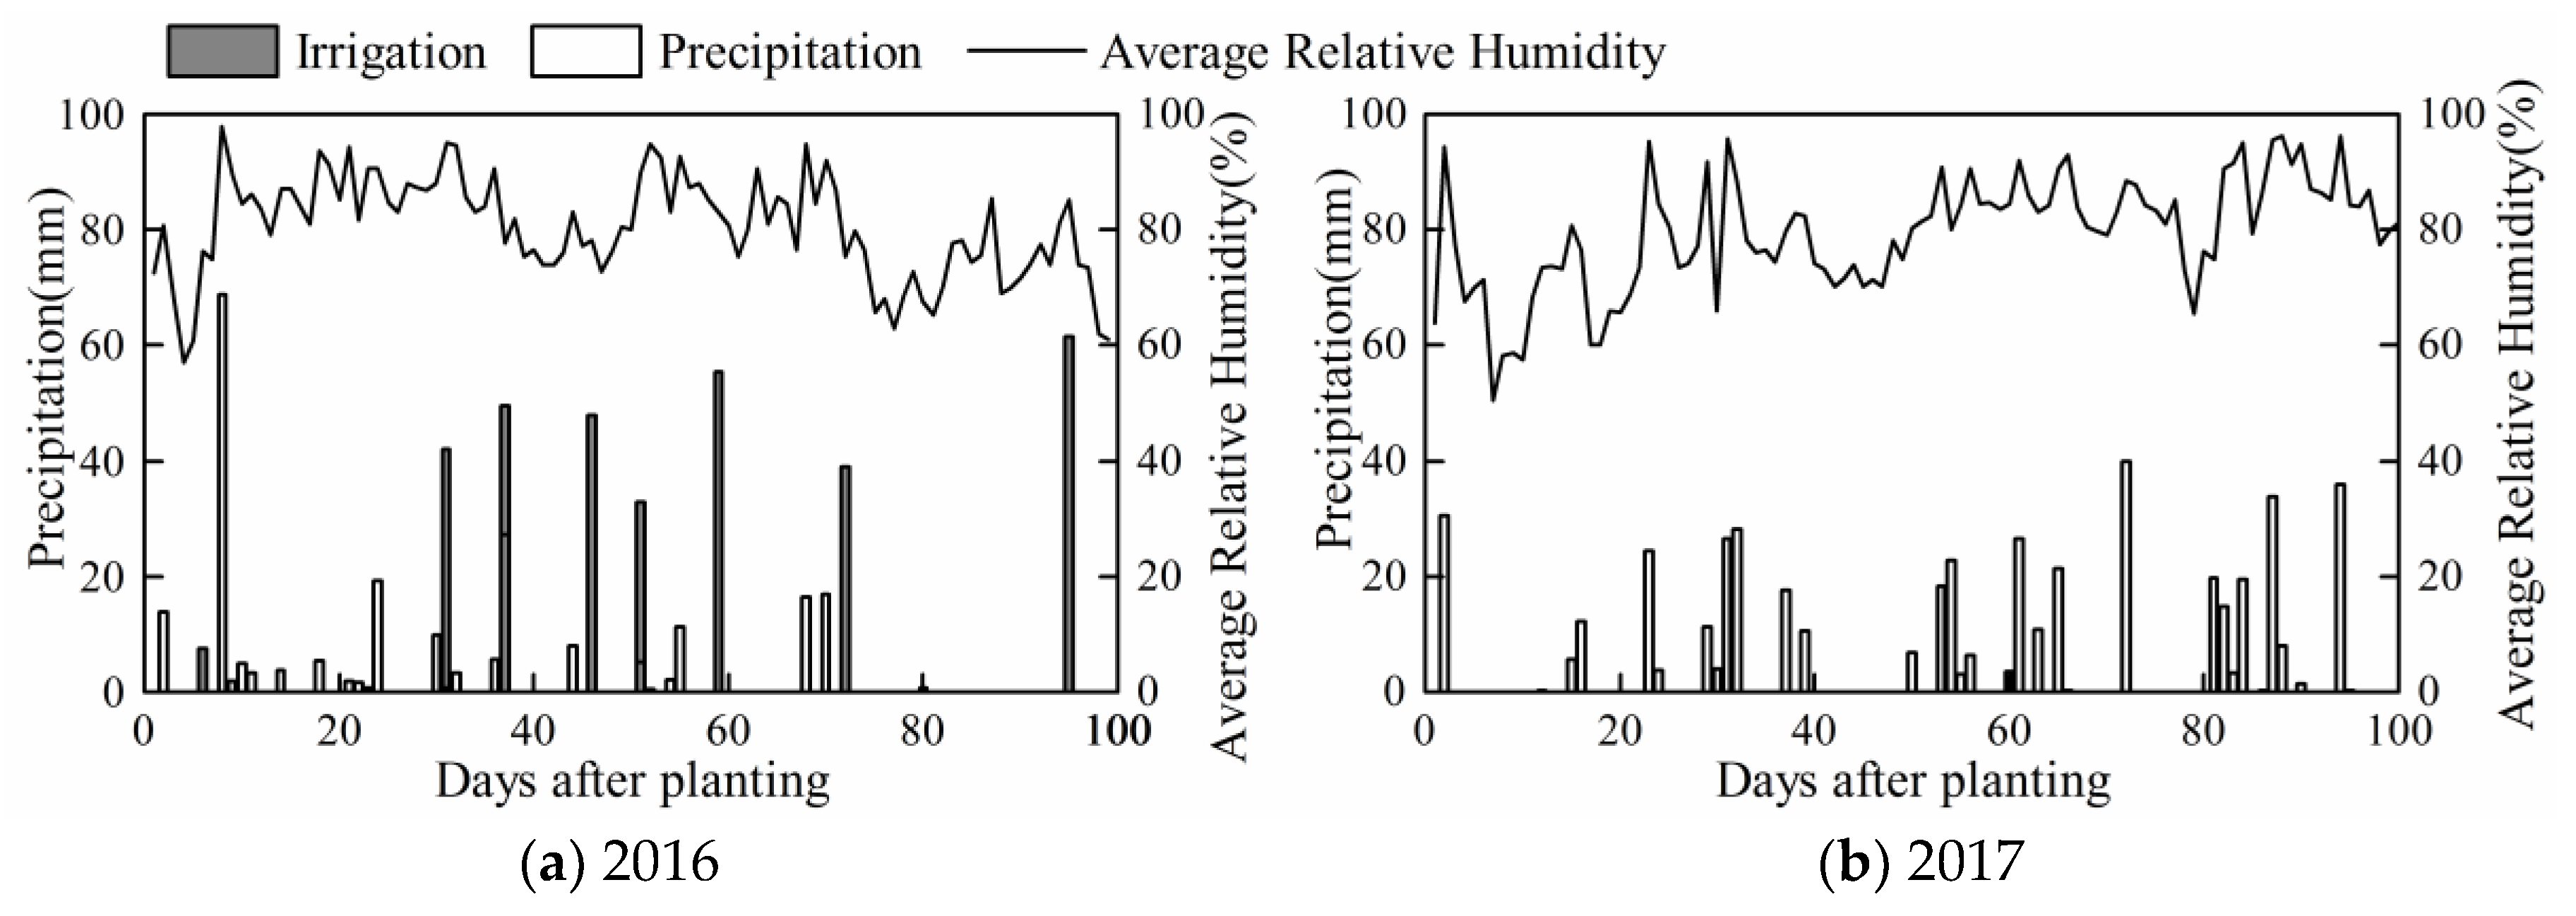
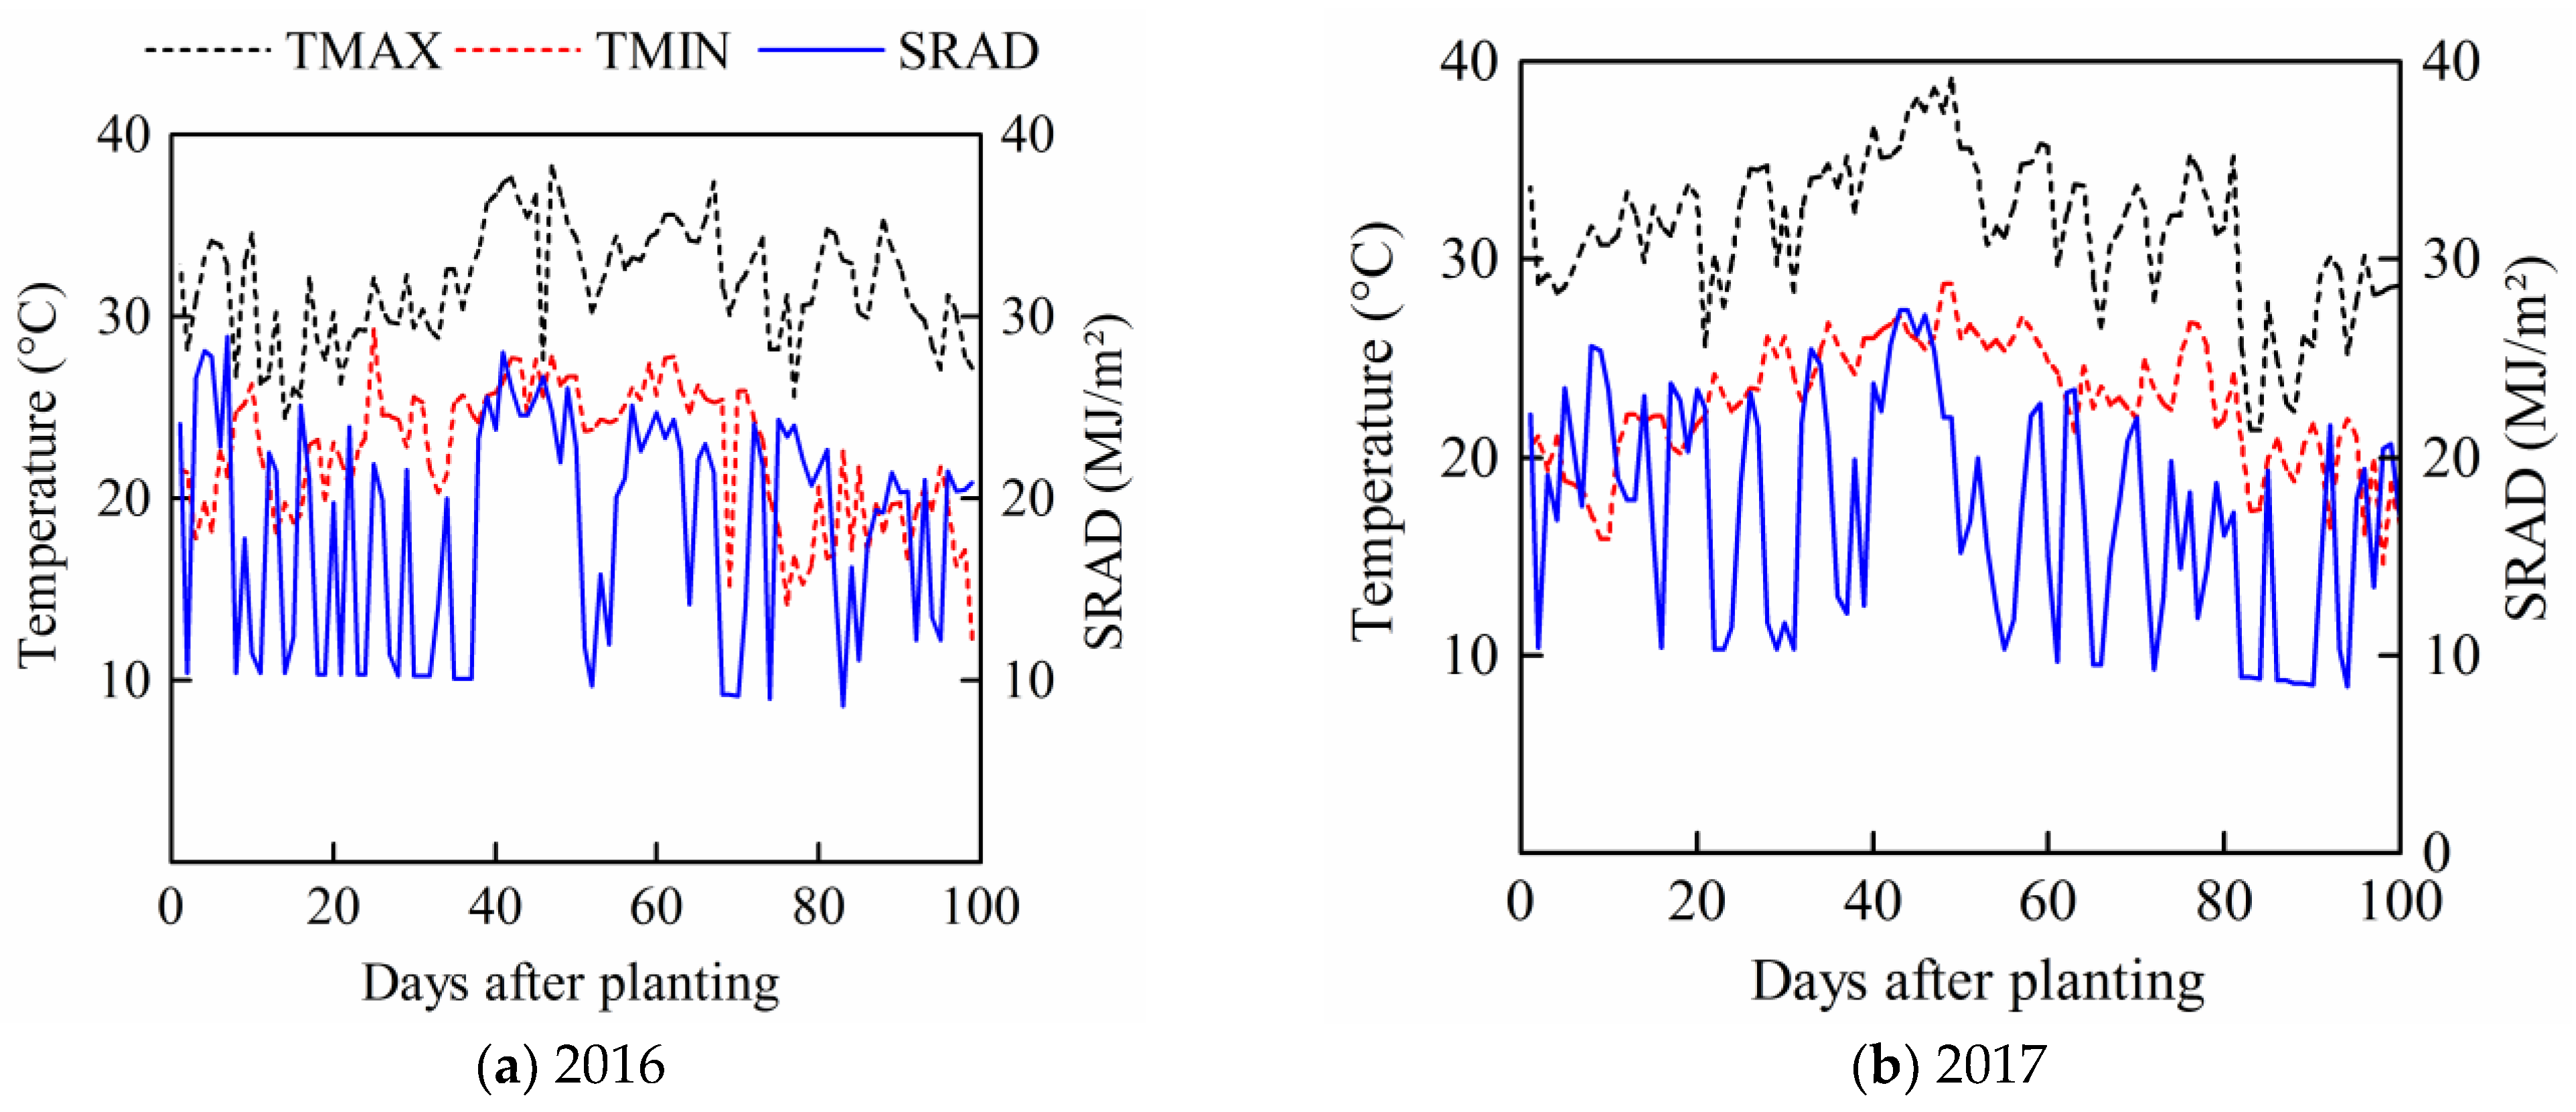
2.3.2. Meteorological Data

During the 2016 and 2017 growing seasons, precipitation was different, which may have affected the drought schemes set in this study. The actual daily precipitation, wind speed at a height of 2 m, maximum and minimum air temperatures, relative humidity, and sunshine duration during the whole summer maize growth periods in both seasons, were measured with automatic weather station located at the experimental site. In addition, daily solar radiation was calculated according to daily sunshine duration based on the Angstrom equation [30] (Figure 3 and Figure 4).
R s = R max ( a s + b s n N )
where Rs is the daily solar radiation (MJ/m2); Rmax is the daily extraterrestrial solar radiation on a horizontal surface (MJ/m2); n is the monthly average daily sunshine duration (h); N is the monthly average maximum possible daily sunshine duration (h); as and bs are the empirical parameters, which were 0.25 and 0.50 in this study, respectively, according to the recommendation of FAO-56.

2.4. Drought Patterns Setting

To study the effects of drought degree and drought occurrence time on maize growth and yield formation, and meanwhile to provide sufficient sample points for establishing maize drought loss sensitivity curve, different drought intensity scenarios were set at different stages. Furthermore, the drought conditions were controlled only by the amount of precipitation during the maize growth stage. In detail, for the 2016 and 2017 seasons, the actual amount of rainfall at each stage was regarded as 100% of precipitation level, and then 0, 20, 40, 60, and 80% of actual precipitation amounts were respectively assumed during each stage. Therefore, there were 21 drought patterns set in the CSM-CERES-maize model for each season (Table 3). Moreover, the date of rainfall event in each scenario was the same as the actual situation in both seasons.

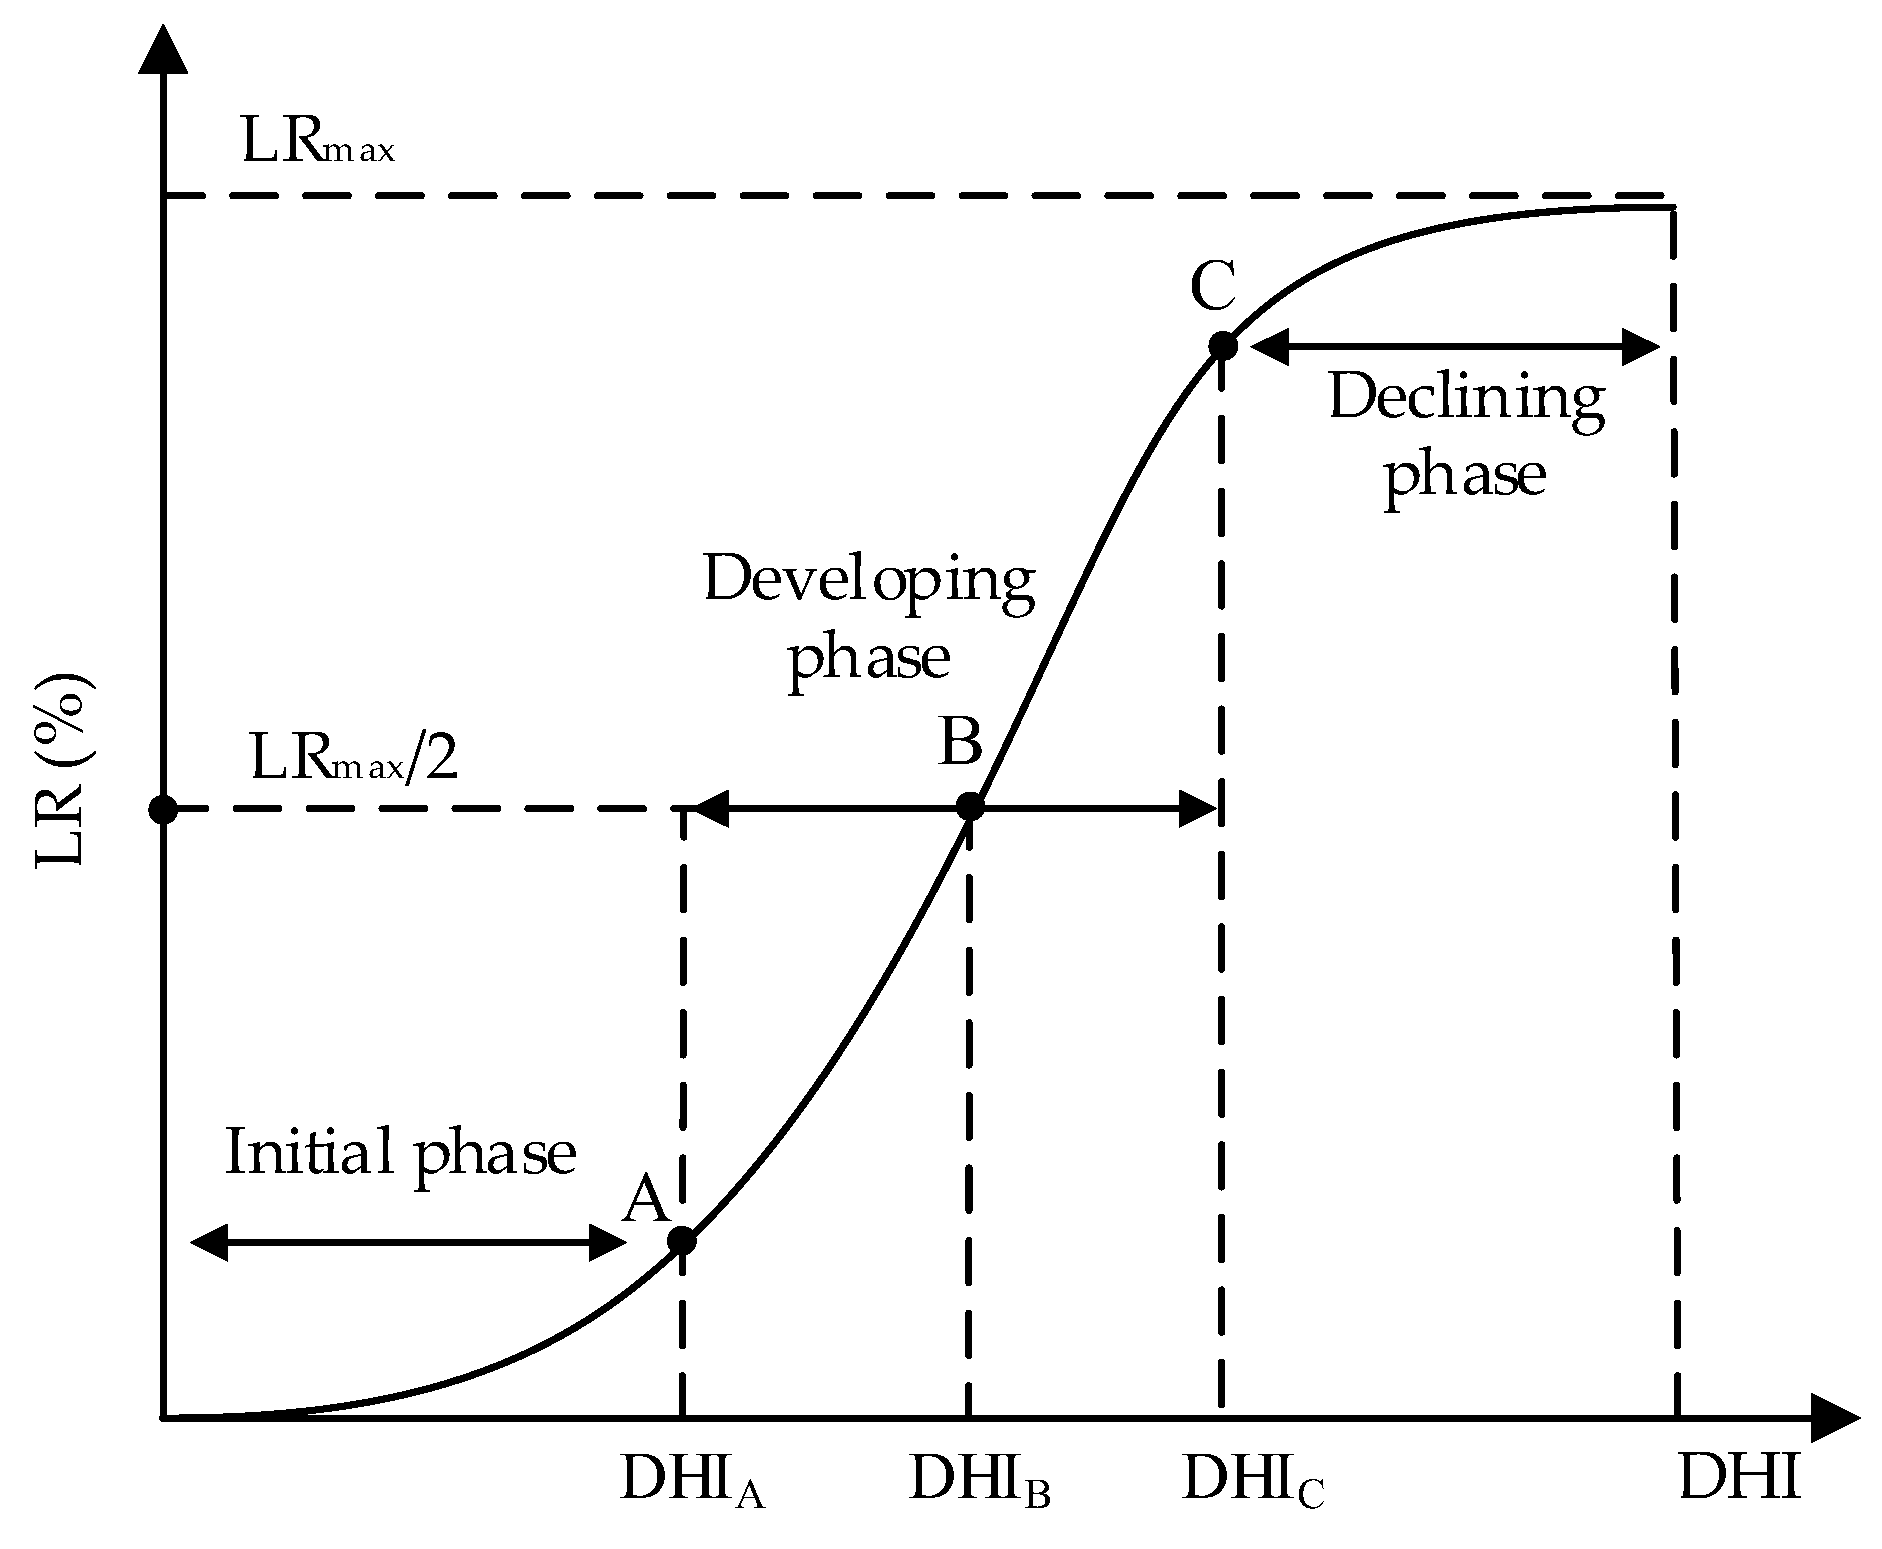
2.5. Maize Drought Loss Sensitivity Curve

Previous research about flood disaster damages assessment [31] had indicated that an S-shaped (logistic) function could be used to fit the relationship between flood hazard and the corresponding flood damage. Moreover, according to the formation process and physical mechanism of agricultural drought loss risk [7] and the current drought vulnerability curve studies [22,32,33], a logistic function was also used to fit the relationship between drought degree (quantified by drought hazard index, DHI) and the corresponding summer maize growth loss (quantified by dry matter accumulation loss rate and grain yield loss rate, LR) under various drought scenarios for each stage. The equation was expressed as
L R ( D H I ) = L R max / ( 1 + α × exp β × D H I )
where LR (DHI) is the summer maize grain yield (or dry matter accumulation) loss rate function that changes with the degree of drought hazard index for a given growth stage, that is the maize sensitivity curve; α, β, and LRmax are the curve parameters, their specific physical meanings could be referred to the relevant research [34].
A S-shaped curve, which was called summer maize drought loss sensitivity curve (Figure 5) was proposed based on a logistic function for assessing water-induced disaster damages expatiated by Chen et al. [35]. Moreover, according to the relevant research [34], the curve was divided into three parts by three inflection points as follows:
Point A was defined as the disaster-inducing point, at this point, the increasing speed of LR grew the fastest. From point A, the value of LR rapidly increased with DHI, which indicated that the drought started to develop. Thus, this point has crucial reference value for early drought forecast.
Point B was defined as the disaster-breaking point, and at this point, the increasing speed of LR was the fastest. The value of LR attained LRmax/2 at point B; therefore, it was important to avert reaching the water deficit intensity at this point during each summer maize growth stage.
Point C was defined as the disaster-ceasing point, at this point, the increase rate of LR decreased most rapidly. When the speed became small, the influence of drought on maize growth and yield formation was close to the upper limit for guaranteeing the plants survival.

2.5.1. Drought Hazard Index

The drought hazard index (DHI) was proposed to quantify the drought degree during a given maize growth stage, it reflected both the intensity and the duration of drought stress. The values of DHI under different drought patterns could be used as the abscissas for establishing maize drought loss sensitivity curve. Specifically, the DHI during a given stage was calculated based on the daily drought intensity at this stage, and the daily drought intensity was quantitatively described by soil water deficit index (SWD). Moreover, the daily SWD was obtained by the daily soil water content simulated by CSM-CERES-maize model, based on drought identification theory [36], relevant research about suitable soil moisture content for plant growing [37,38], and experimental research about deficit irrigation in this station for many years. The formulas were expressed as
D H I = j = 1 n ( S W D j min S W D j ) max S W D j min S W D j
S W D j = { 1 θ j θ W P 1 θ j θ W P θ F C θ W P θ W P < θ j < θ F C 0 θ j θ F C
where DHI represents the intensity of drought hazard index during a given maize growth stage; n is the number of days during this period; SWDj is the soil water deficit intensity on the jth day during this stage; maxSWDj and minSWDj are the maximum and minimum values of SWD during this stage; θj represents the simulated soil water content on the jth day at this stage; θFC and θWP are the soil water content at field capacity and wilting point in this study, respectively.

2.5.2. Drought Loss Rates of Maize Dry Matter Accumulation and Grain Yield

In this study, the drought loss rates of grain yield and dry matter accumulation at harvest time (LR) were selected as the variables for quantifying the effects of drought stress during each stage on maize growth and yield formation. The values of LR under different drought patterns were used as the ordinates for establishing maize drought loss sensitivity curve. The loss rates of maize grain yield and dry matter accumulation under each drought pattern was calculated as
L R = max G Y G Y max G Y × 100 % L R = max D M A D M A max D M A × 100 %
where LR represents the loss rate of maize grain yield or dry matter accumulation under a given drought pattern; GY and DMA are the simulated maize grain yield and dry matter accumulation at harvest time under this pattern, respectively; maxGY and maxDMA respectively represent the values of GY and DMA under the pattern with 100% of precipitation level during the whole maize growth period (drought pattern CK).

3. Results and Discussion

3.1. Calibration and Validation of Summer Maize Genetic Parameters

The calibration of CSM-CERES-maize model mainly focused on determining the variety and genetic parameters of summer maize cultivated in the experiments. The genetic parameters need to be calibrated and validated in this study included P1, P2, P5, G2, G3, and PHINT [39], and the detailed descriptions are indicated in Table 4. These parameters were adjusted using the generalized likelihood uncertainty estimation (GLUE) procedure of DSSAT set to 10,000 iterations.
The recorded dates of the beginning of flowering and maturity for summer maize in the experiments, dry matter accumulation and grain yield at harvest time were respectively selected as the output variables for calibrating and validating the genetic parameters. In detail, these observed results in the 2016 season were used to calibrate the parameters, and those in 2017 were used for validation. The absolute relative error (ARE) and relative root mean square error (RRMSE) were applied to assess the applicability and accuracy of the calibrated summer maize genetic parameters. In addition, the smaller the value of ARE or RRMSE, the lower the error between the observed and simulated output variable, and the more accurate the calibrated genetic parameters.
A R E = | S i m i O b s i | O b s i
R M S E = 1 k i = 1 k ( S i m i O b s i ) 2 R R M S E = R M S E O b s
where k represents the number of samples for an output variable; Simi is the simulated result of the ith sample by CSM-CERES-maize model; Obsi is the observed result of the ith sample by crop experiments; and Obs’ represents the average value of all observation samples for a output variable.
The results of calibration showed that the dates of the beginning of flowering and maturity were precisely simulated based on the calibrated and validated summer maize genetic parameters, the errors were both within four days relative to the observed values (Table 5). For these two outputs, the values of ARE and RRMSE in both seasons were all less than 5%. Similarly, the simulated grain yield and dry matter accumulation at harvest time during the calibration and verification phases were all close to the observed results. Therefore, the adjusted genetic parameters of summer maize in the experiments were accurate and reliable, the simulations of maize growth process under various drought patterns could be further carried out based on the calibrated and validated CSM-CERES-maize model with these parameters.
Furthermore, this study aimed at exploring the quantitative effects of different drought patterns on maize growth and yield formation by CSM-CERES-maize model. Meanwhile, the simulation precision of soil water content directly determined the reliability and accuracy of the entire simulated results under various drought conditions. Study had shown that 85–90% of maize roots during the whole growth period were mainly distributed in the columnar soil with a radius of 20 cm and a height of 40 cm [40]. Therefore, the observed soil water content at layer above 40 cm deep was selected to verify the simulated results in the model. Table 6 indicates the average value of simulated soil water content during the whole summer maize growth stage at two different layers based on the adjusted genetic parameters and observed results during the two seasons, and the values of the corresponding RRMSE were all less than 10%. Moreover, the tendency and distribution of simulated soil water content were both mostly close to the measured values (Figure 6); therefore, the model could accurately simulate the soil water content in time and space. Consequently, the simulated soil water deficit and maize growth processes under different drought patterns based on the calibrated and validated CSM-CERES-maize model could be reliably and reasonably used to build sensitivity curves.

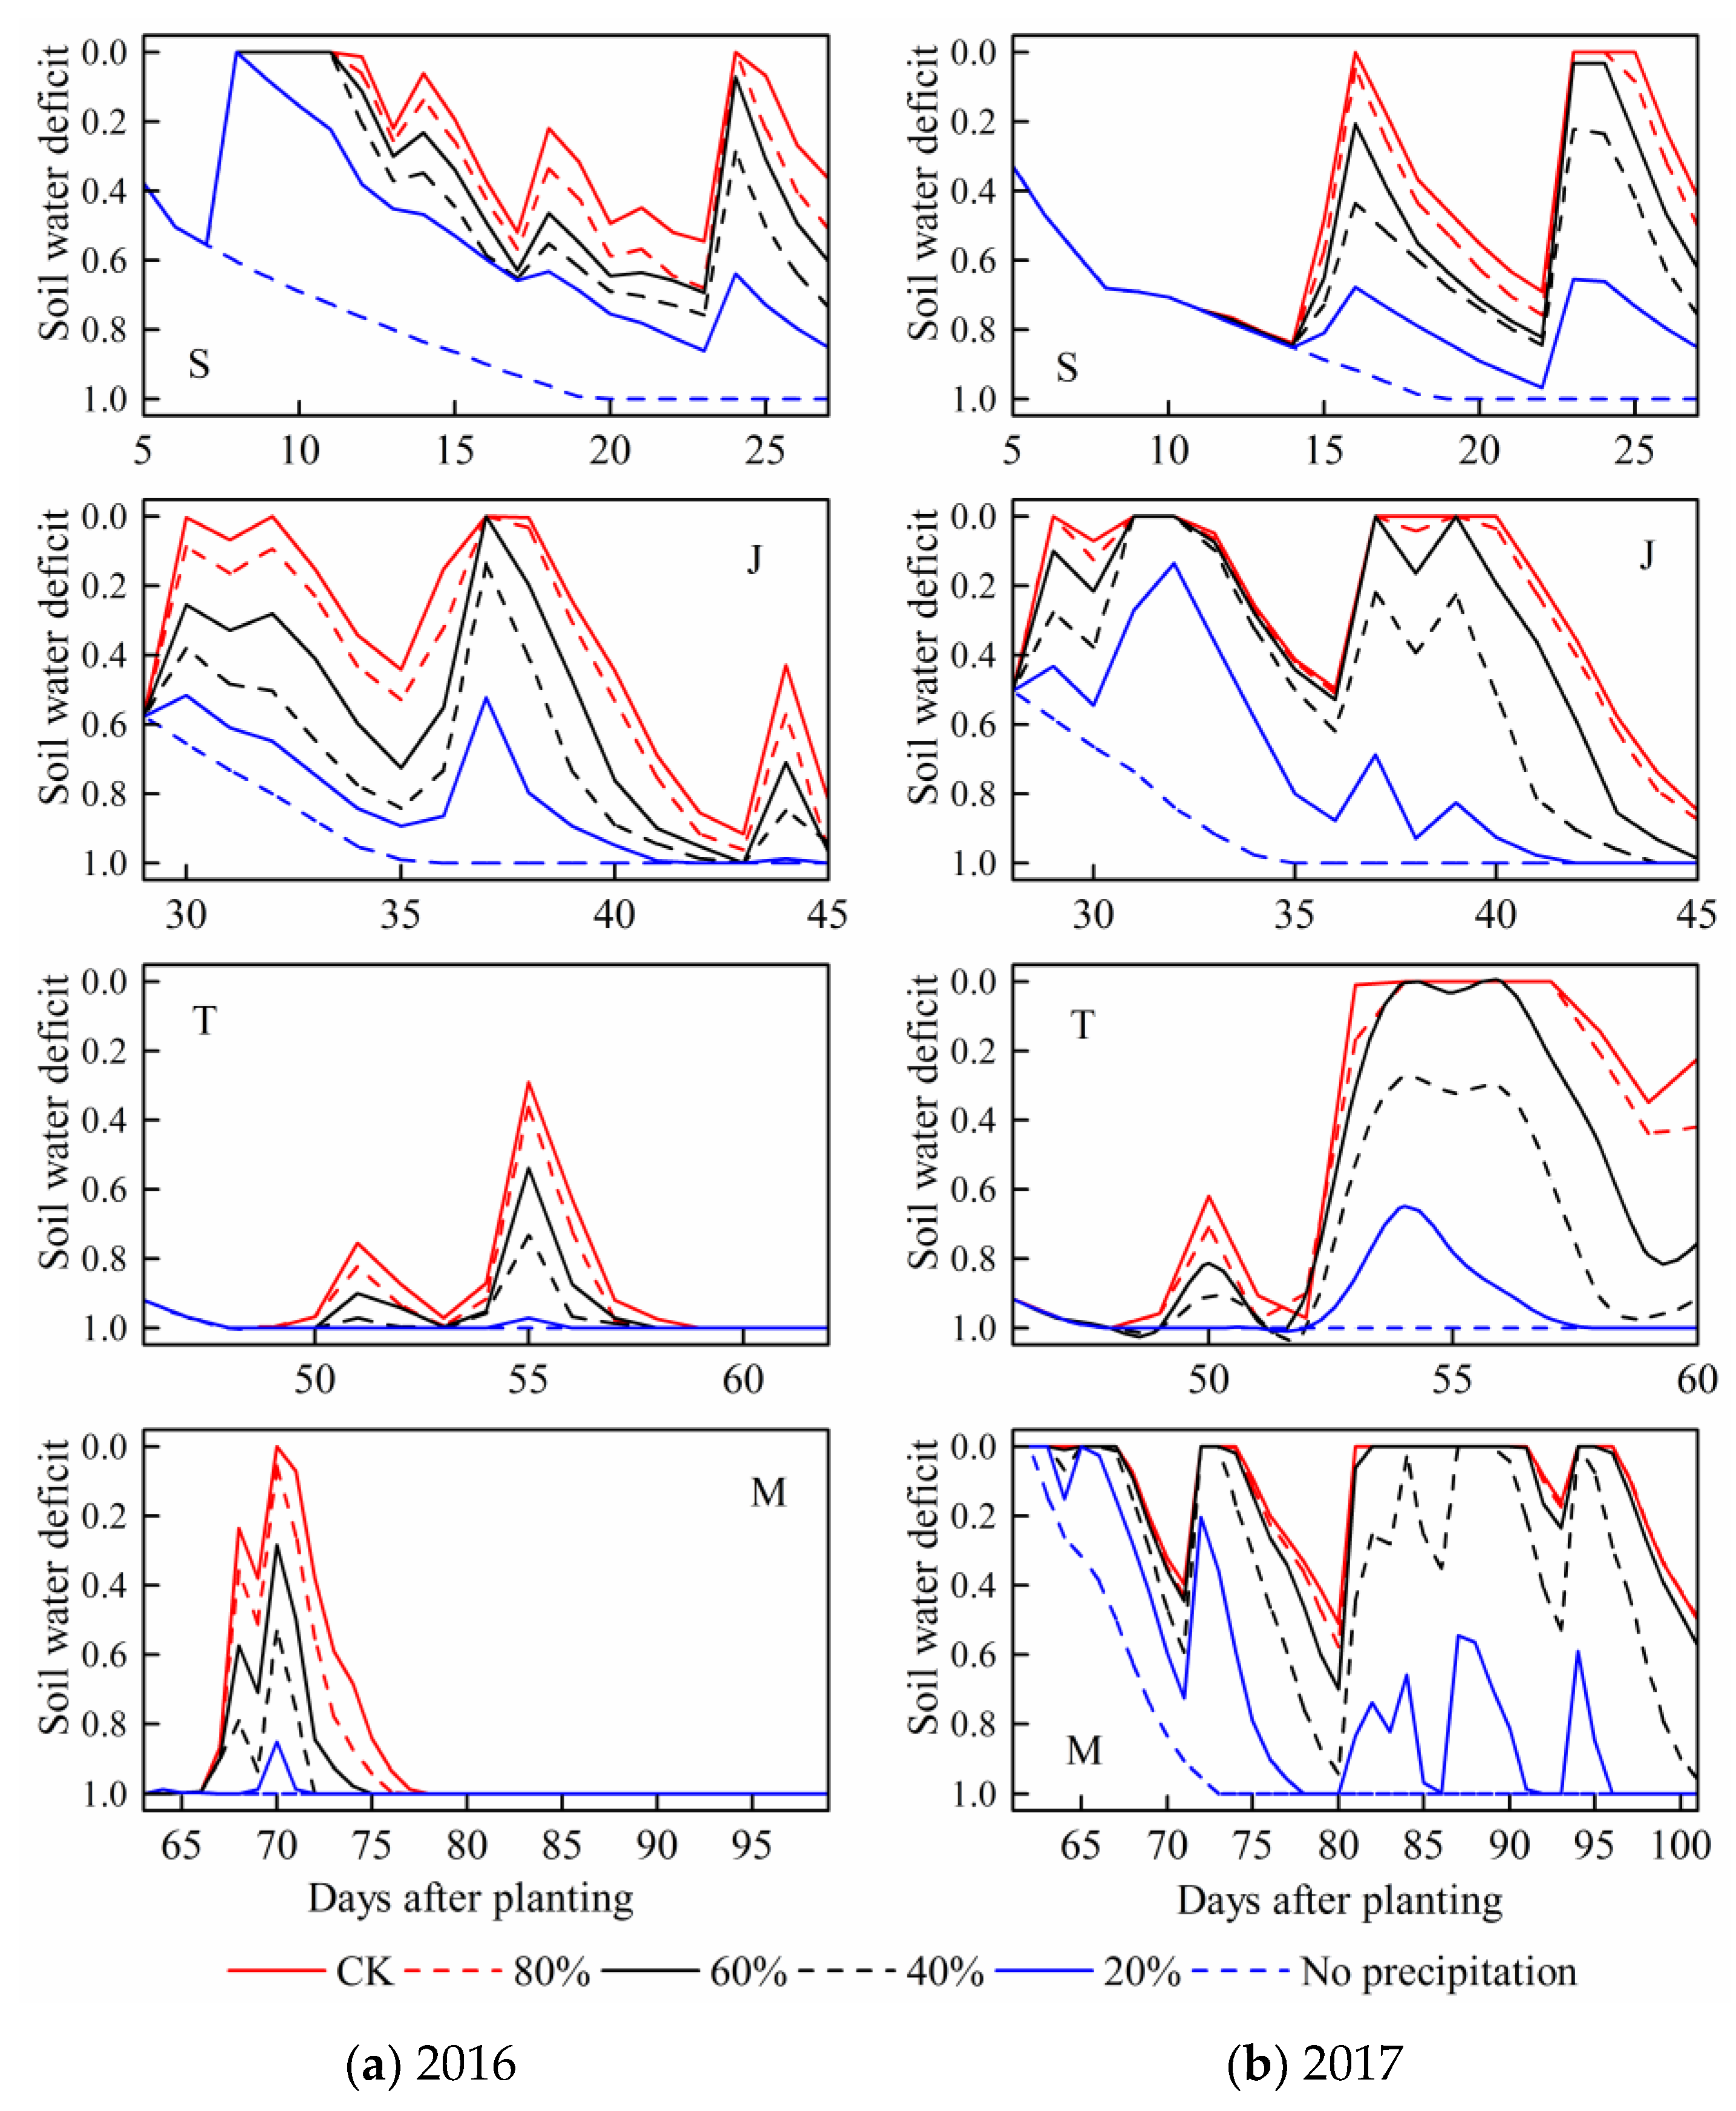
3.2. Soil Water Deficit (SWD)

For each stage, the daily soil water deficit under patterns with relatively sufficient precipitation were obviously lower. By contrast, SWD under no precipitation condition at each maize growth stage were basically the largest. The soil water content gradually decreased with the maize water consumption, then it increased after rainfall event, with SWD change accordingly (Figure 7).
SWD during the seedling and jointing stages fluctuated more frequently than those during the following two stages in the 2016 season. However, the values of SWD during the tasseling and milking stages were relatively higher. These results were accorded with the actual situation that the precipitation events mainly occurred at summer maize earlier growth period in 2016. The actual precipitation amount during the four stages in the 2016 season were respectively 111, 55, 19, and 34 mm. However, SWD fluctuated more frequently during the milking stage in 2017. Similarly, it was related to the precipitation during each maize growth stage. The actual precipitation amount at the milking stage in 2017 had reached 210 mm, which was the largest among four stages in the season. In a word, the simulated soil water content and corresponding SWD could accurately reflect the actual water deficit processes during maize growth period under various drought conditions, the calibrated and validated model was reliable and could be used for building sensitivity curves.

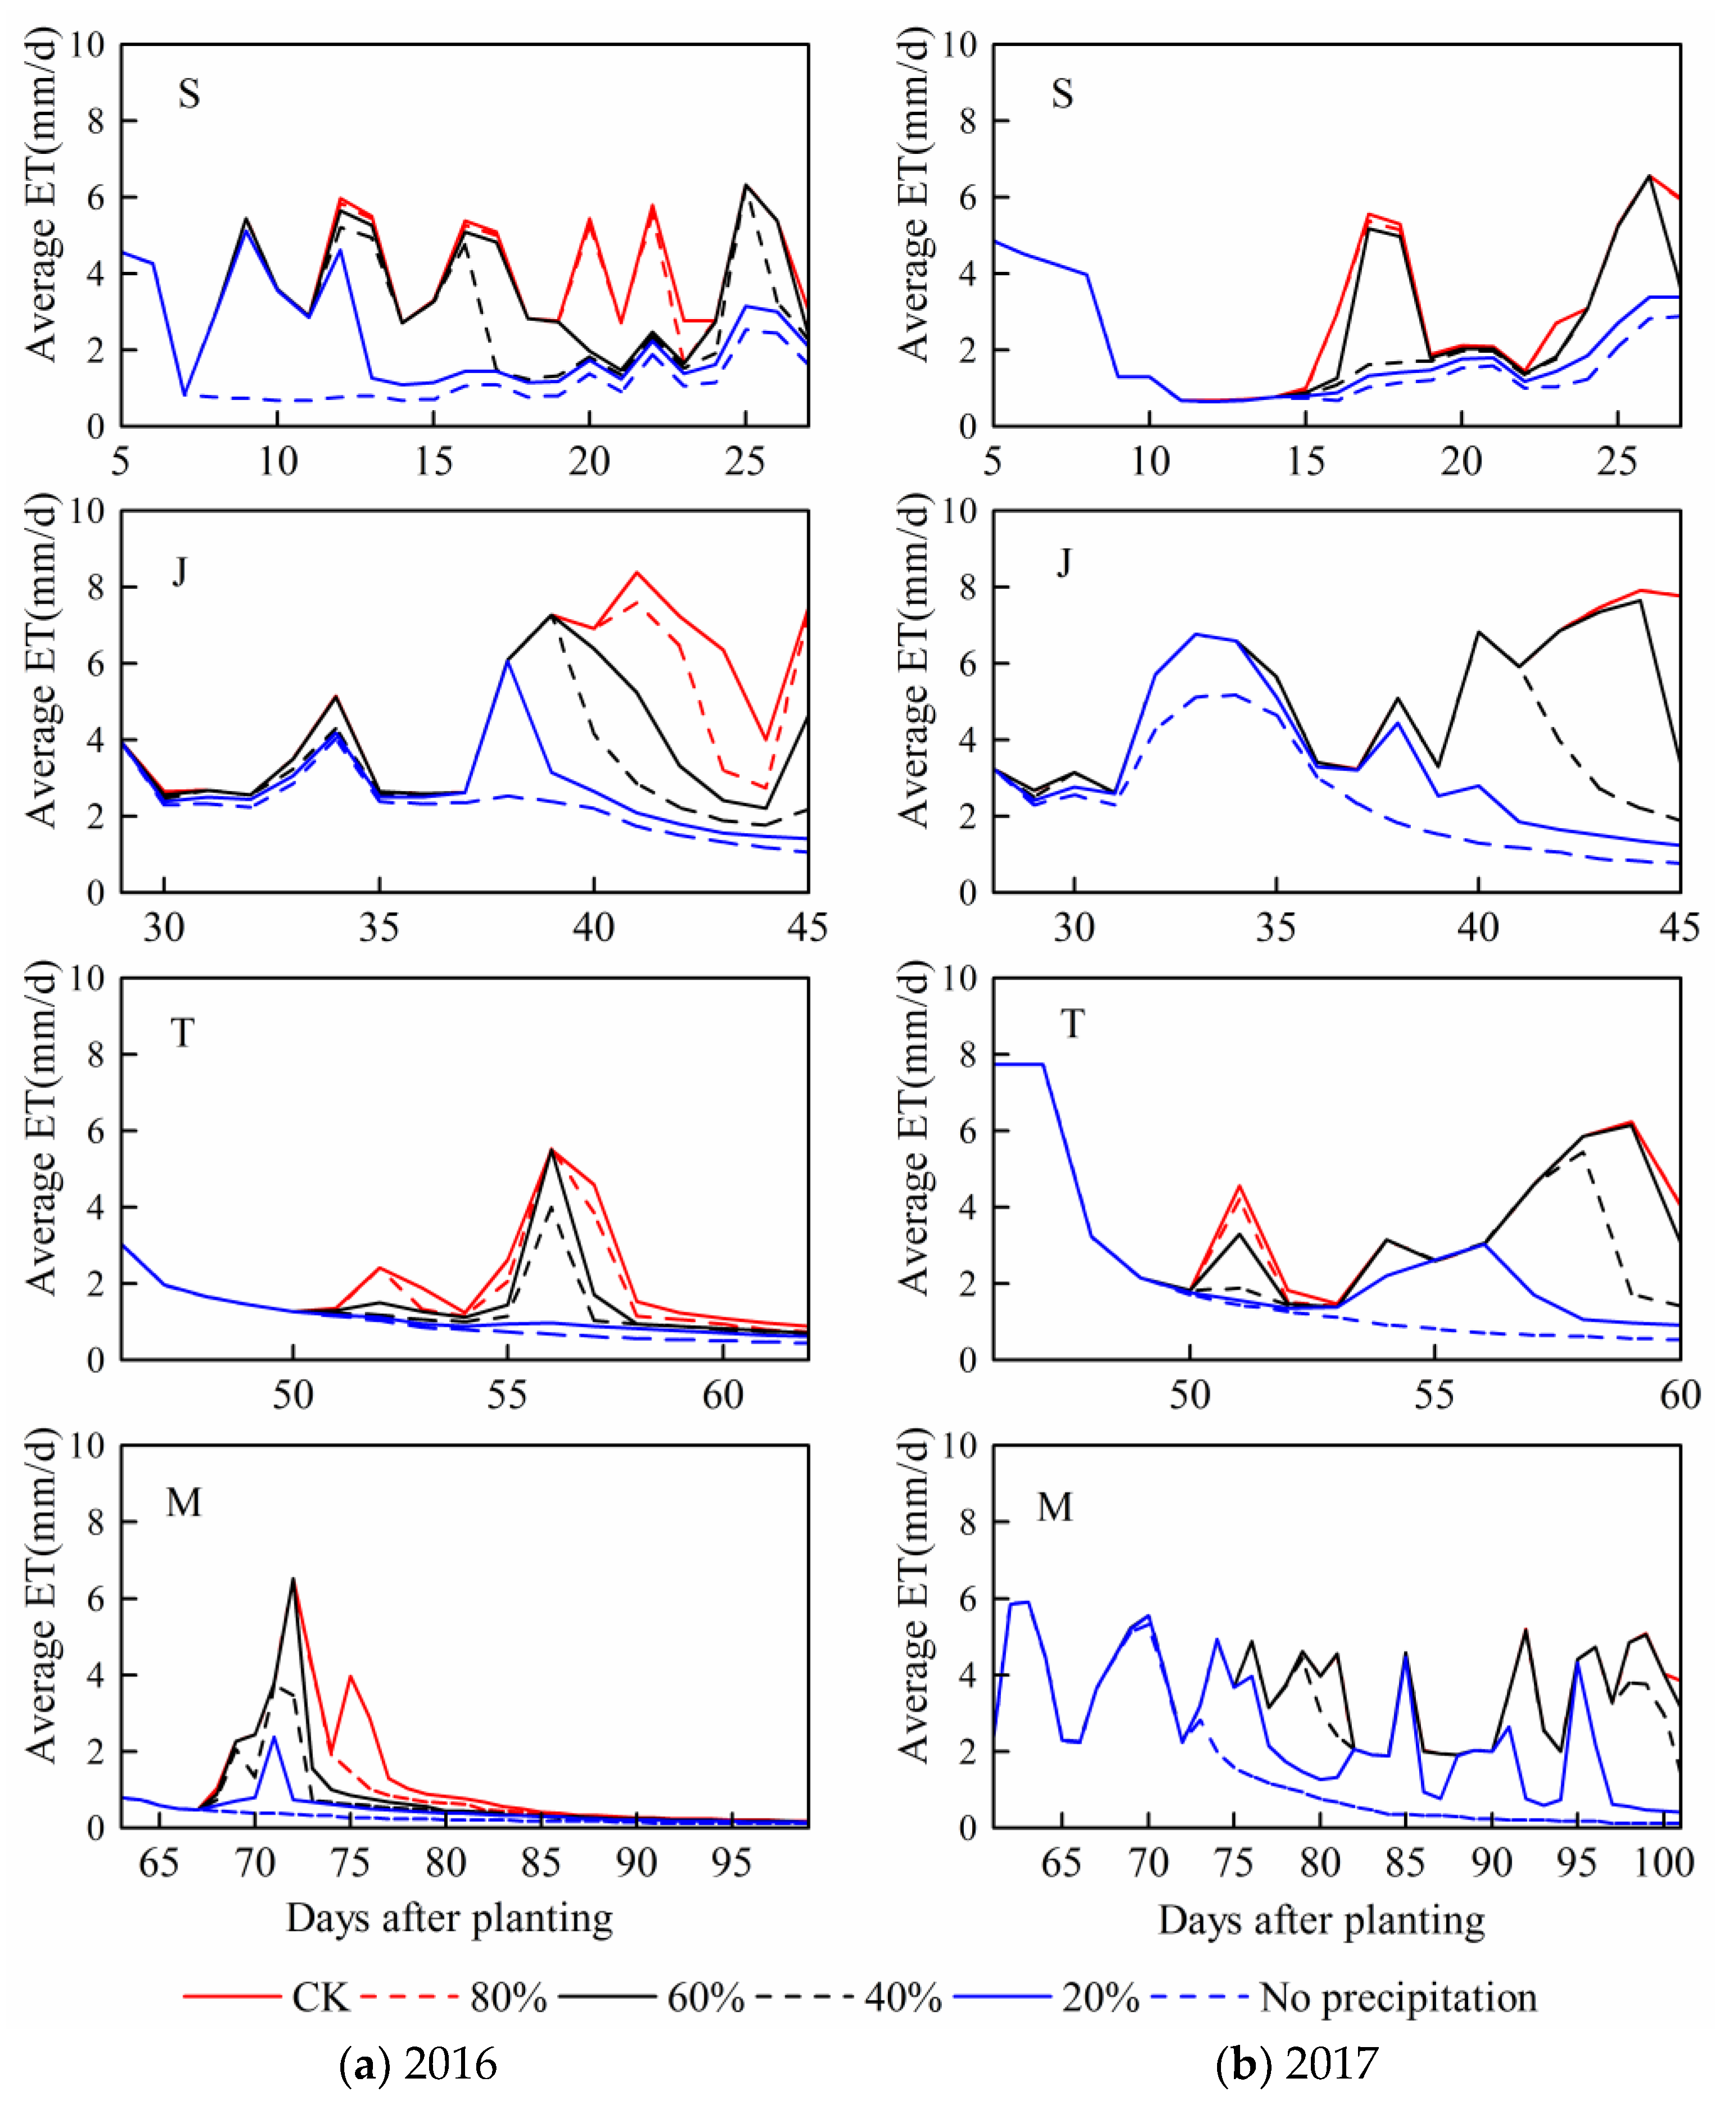
3.3. Maize Evapotranspiration

For each stage in both seasons, the daily average summer maize evapotranspiration (ET) under patterns with relatively less precipitation were obviously lower (Figure 8). Specifically, the value of ET under 100% of actual precipitation condition was the largest, while that without precipitation was basically the least. Moreover, ET at the seedling stage fluctuated more frequently in 2016, especially under pattern CK, while ET during the milking stage fluctuated more frequently in 2017. These results were consistent with the variations of the corresponding SWD for the two seasons, and also due to the distributions of actual precipitation during maize growth period. Therefore, drought stress reduced summer maize evapotranspiration at each stage, and the more severe the drought, the more significant the reduction. Furthermore, the simulated daily evapotranspiration by the calibrated and validated model precisely reflected the actual summer maize physiological status under different drought intensities and drought occurrence phases.

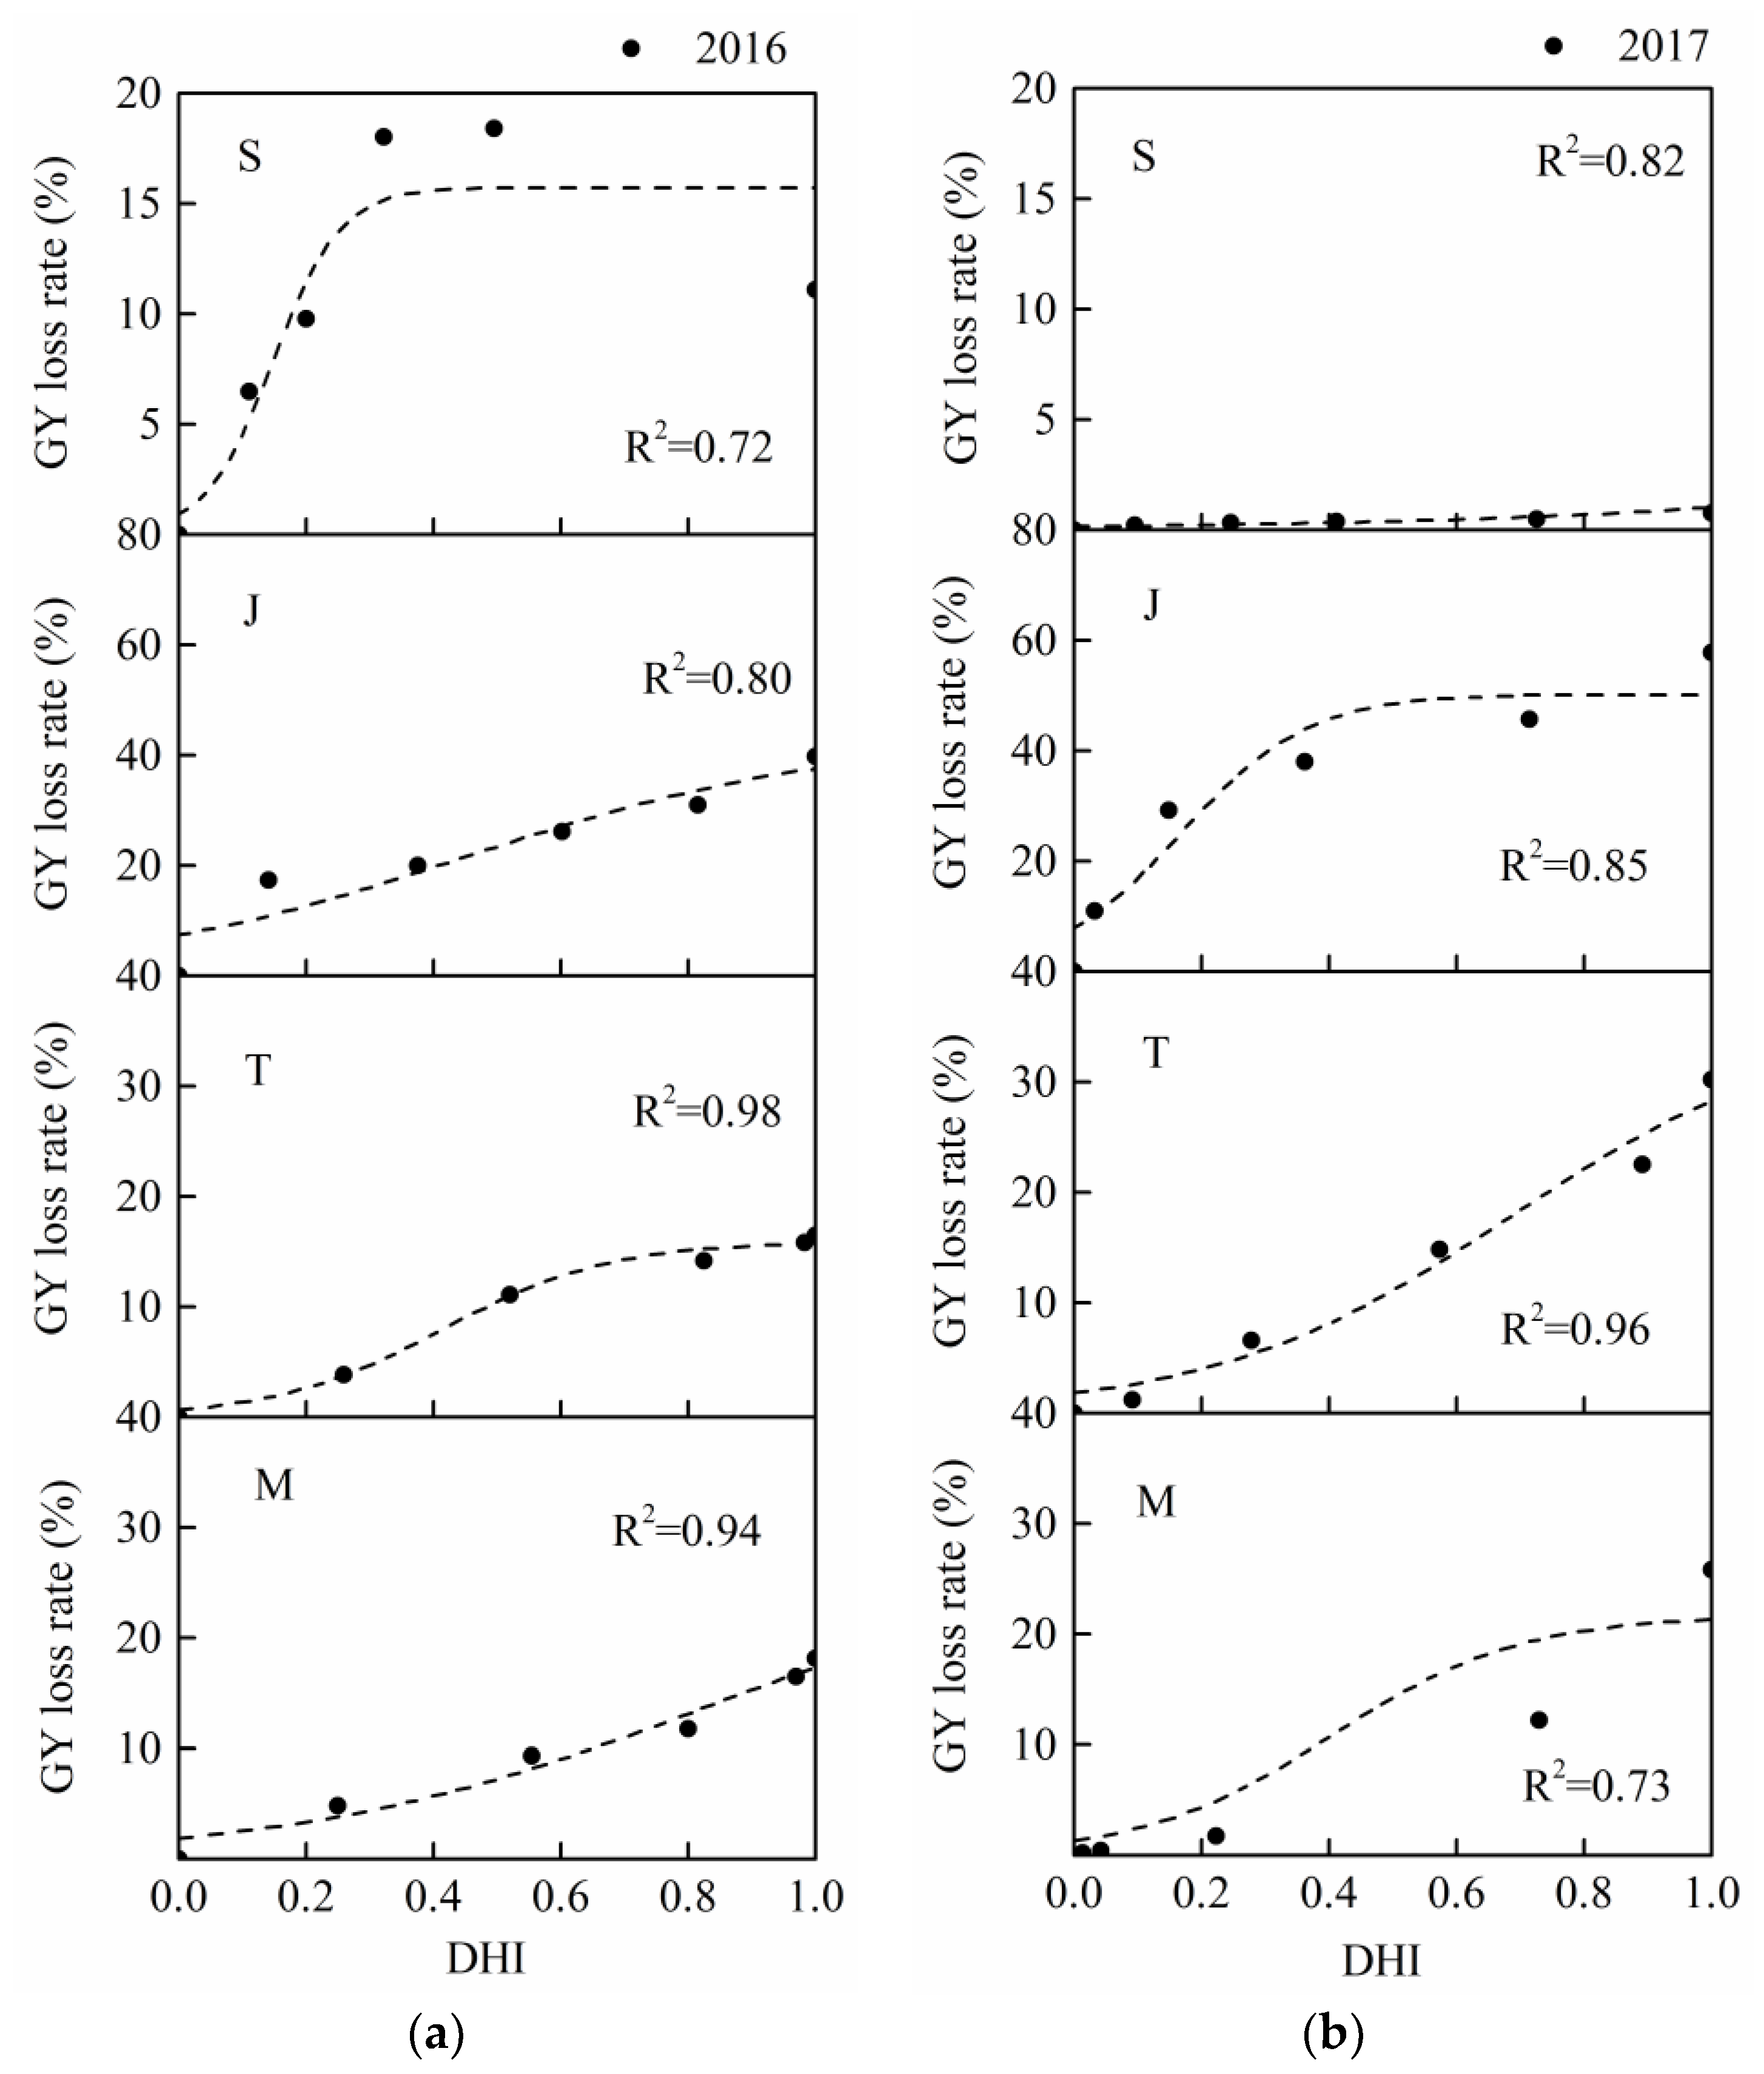
3.4. Summer Maize Sensitivity Curves

The coefficients of determination (R2) of summer maize drought loss sensitivity curves were all higher than 0.7 (Table 7 and Table 8), and this the S-shaped function had a clear physical meaning. This result also showed that it was suitable and accurate to describe the changes of maize growth damage with water deficit intensity (Figure 9 and Figure 10). The curves of four periods for the two seasons had the similar tendencies. According to the physical meanings of parameters in the S-shaped damage curve [35], LRmax reflects the upper limit of maize GY loss or DMA loss. The highest GY loss rates in the 2016 and 2017 seasons both occurred at the jointing stage, the values were 43% and 50% (Table 7), respectively. Moreover, the values of LRmax during the seedling stage were much lower (16% and 2% in 2016 and 2017, respectively). There were similar results for the DMA loss curves, the largest values of LRmax occurred at the jointing stage and those during the seedling stage were the lowest (Table 8). This result indicated that the growth damage was the most serious if the maize plants suffered severe drought stress during the jointing stage. Thus, maize growth was more sensitive to drought stress during the jointing stage when the drought degree was high, and water supply should be guaranteed. Meanwhile, maize had a less loss when the plants experienced a severe water stress during the seedling stage. Moreover, it reflected that the influences of serious drought stress during each maize growth on dry matter and yield formation were basically consistent. Similar results were reported by Cakir et al. [41], who found that drought stress during the maize jointing stage reduced the grain yield by 57–63%, while the reductions were only 20–38% caused by stress at other stages. Furthermore, previous studies found that the crops could partially recover from the previous drought stress after the stress was relieved during the following growth periods, the loss caused by the early drought may be compensated by this recovery ability [42,43].
The fact that water stress reduces plant leaf area has been shown in many studies [41,44]. Furthermore, deficit irrigation during plant vegetative growth phase may inhibit the leaf development, thereby limit the canopy development [45]. Stone et al. [46] studied the responses of sweet corn biomass and yield formation to duration and severity of water deficit, and found that the yield was strongly related to the biomass, and the biomass was reduced by water deficit because of the reduced total radiation interception, especially for the early water deficit treatments. Moreover, drought during plant vegetative growth phase may lead to a premature or postponed tendency of the following stages [47], which affects the reproductive growth and kernel development of plant. In addition, although the water deficit at vegetative stage may reduce biomass accumulation, the negative influence could be compensated by an adequate irrigation during the later growth periods [48]. Farré et al. [49] discovered that deficit irrigation at early vegetative phase reduced maize yield in 1995 but not in 1996, which was due to the much lower seasonal rainfall in 1995. Therefore, the effect of compensation may not be obvious if the irrigation at the following stages are not sufficient. Similarly, for the summer maize sensitivity curve results in this study, the upper limits of drought loss on sensitivity curves at the seedling stage in 2016 were both higher than those in 2017 (Figure 9 and Figure 10), which was consistent with the fact that the precipitation during the 2017 season was more adequate than that in 2016.
The parameter β indicates the speed to attain the upper limit of maize drought growth loss. At a given growth stage, a higher value of β indicates that the loss may reach the limit under a slighter drought intensity. Taking the grain yield loss sensitivity curves in the 2016 season (Figure 9) as an example, the largest value of β in the 2016 season was 18.80 and this value was found at the sensitivity curve during the seedling stage. However, the maximum value of β in 2017 was found at the jointing stage (9.98 in Table 7). This was likely due to a lower precipitation in 2016, which mainly happened at the early growth period, the influence of drought stress at the seedling stage was further exaggerated by the continued stress during the following stages. Moreover, although the upper limits of the sensitivity curves in these two stages were lower than those in other stages, the loss rate reached the corresponding limit more quickly (the value of DHI which corresponded to the disaster-ceasing point was lower). This finding may be explained by the fact that the resistance abilities to water deficit of summer maize during the vegetative growth period were small [41]. Thus, summer maize tolerance to water deficit at the seedling and jointing stages were relatively weak, and grain yield accumulation was more sensitive to drought stress during these two stages when the stress was slight, the intensity of water stress during the two periods should be controlled.
The DHI of the drought disaster-inducing points on maize GY loss sensitivity curves during the seedling, jointing, tasseling, and milking stages in the 2017 seasons were 0.30, 0.04, 0.38, and 0.21, respectively. For the DMA loss sensitivity curves, the corresponding DHI were 0.47, 0.08, 0.35, and 0.46. There were similar results in 2016, the smallest DHI of the disaster-inducing points on GY and DMA loss sensitivity curves were 0.07 and 0.11, respectively, which were also found during the jointing stage. Moreover, the DHI of the drought disaster-breaking points on GY loss sensitivity curves at the seedling, jointing, tasseling, and milking stages respectively were 0.82, 0.17, 0.69, and 0.40 in the 2017 season. For DMA curves, the corresponding DHI were 0.94, 0.26, 0.64, and 0.81, respectively. The minimum DHI for GY and DMA curves were both found during the jointing stage. However, the minimum DHI on the breaking points on GY and DMA curves were both discovered at the seedling stage in 2016 (0.15 and 0.23). This difference could be induced by a relatively uneven precipitation in 2016. The precipitation during the whole maize growth period was lower, and mainly occurred at the seedling stage. This may magnify the effects of drought during this stage.

4. Conclusions

This study simulated summer maize growth under various drought patterns and built maize sensitivity curves using CSM-CERES-maize model. Drought reduced maize evapotranspiration, dry matter and yield formation, and the reductions increased with the drought intensity at each stage. Moreover, the losses induced by drought at different growth periods differed obviously.
The negative impacts on dry matter and yield formation were both the greatest when maize plants were exposed to severe drought stress during the jointing stage. Maize growth was more sensitive to drought stress during the jointing stage when the stress was serious, thus it was necessary to ensure the irrigation at this period. Moreover, when plants encountered a relatively mild drought stress at the seedling or jointing stage, the yield damage accessed the maximum for the sensitivity curve of this stage. Therefore, tolerability of maize at the seedling and jointing stages were relatively weak, and yield accumulation was more sensitive to water deficit at these two stages when the deficit was slight; therefore, the deficit during the two stages should be strictly controlled.
A sensitivity curve is a basic function for building vulnerability curve and agricultural drought loss risk curve. However, the sensitivity curve during a given crop growth period is related to the distribution of drought events at this period, which should be considered in future research.

Author Contributions

Y.W., Y.C., and S.N. designed the experiments and wrote the paper; Y.W., J.J., Y.C., and S.J. completed the maize experiments and calibrated the crop growth model; Y.W., J.J., Y.C., and Y.Z. contributed to the experimental data analysis and maize drought loss sensitivity curve building. All authors read and approved the manuscript.

Funding

This research was funded by the National Key Research and Development Program of China (2017YFC1502405), the National Natural Science Foundation of China (51709071, 51579059, and 51579060) and the Key Research and Development Program of Shandong Province of China (2017GSF20101).

Acknowledgments

We are grateful to Hongwei Yuan for his technical assistance in the pit experiments.

Conflicts of Interest

The authors declare no conflicts of interest.

References

  1. IPCC (Intergovernmental Panel on Climate Change). IPCC Expert Meeting Report: Towards New Scenarios for Analysis of Emissions, Climate Change, Impacts, and Response Strategies; Intergovernmental Panel on Climate Change: Noordwijikerhout, The Netherlands, 2007.
  2. Mishra, A.K.; Singh, V.P. Drought modeling-A review. J. Hydrol. 2011, 403, 157–175. [Google Scholar] [CrossRef]
  3. Hao, L.; Zhang, X.Y.; Liu, S.D. Risk assessment to China’s agricultural drought disaster in county unit. Nat. Hazards 2012, 61, 785–801. [Google Scholar] [CrossRef]
  4. Leng, G.Y.; Tang, Q.H.; Rayburg, S. Climate change impacts on meteorological, agricultural and hydrological droughts in China. Glob. Planet. Chang. 2015, 126, 23–34. [Google Scholar] [CrossRef] [Green Version]
  5. IPCC (Intergovernmental Panel on Climate Change). Managing the Risks of Extreme Events and Disasters to Advance Climate Change Adaptation: Special Report of the Intergovernmental Panel on Climate Change; Cambridge University Press: New York, NY, USA, 2012.
  6. Wilhite, D.A.; Svoboda, M.D.; Hayes, M.J. Understanding the complex impacts of drought: A key to enhancing drought mitigation and preparedness. Water Resour. Manag. 2007, 21, 763–774. [Google Scholar] [CrossRef] [Green Version]
  7. Jin, J.L.; Song, Z.Z.; Cui, Y.; Jiang, S.M.; Zhou, Y.L. Research progress on the key technologies of drought risk assessment and control. J. Hydraul. Eng. 2016, 47, 398–412. [Google Scholar] [CrossRef]
  8. Shi, P.J. Theory on disaster science and disaster dynamics. J. Nat. Disasters 2002, 11, 1–9. [Google Scholar]
  9. Wilhelmi, O.V.; Wilhite, D.A. Assessing vulnerability to agricultural drought: A Nebraska case study. Nat. Hazards 2002, 25, 37–58. [Google Scholar] [CrossRef]
  10. Ganji, A.; Ponnambalam, K.; Khalili, D.; Karamouz, M. Grain yield reliability analysis with crop water demand uncertainty. Stoch. Environ. Res. Risk Assess. 2006, 20, 259–277. [Google Scholar] [CrossRef]
  11. Hao, Z.C.; Aghakouchak, A. Multivariate standardized drought index: A parametric multi-index model. Adv. Water Resour. 2013, 57, 12–18. [Google Scholar] [CrossRef]
  12. Cui, Y.; Jiang, S.M.; Jin, J.L.; Yuan, H.W.; Zhou, Y.L. Soybean drought loss sensitivity assessment based on water deficit experiment. J. Hydroelectr. Eng. 2017, 36, 50–61. [Google Scholar] [CrossRef]
  13. Boonjung, H.; Fukai, S. Effects of soil water deficit at different growth stages on rice growth and yield under upland conditions. 1. Growth during drought. Field Crops Res. 1996, 48, 37–45. [Google Scholar] [CrossRef]
  14. Wilhelmi, O.V. Methodology for Assessing Vulnerability to Agricultural Drought: A Nebraska Case Study. Ph.D. Thesis, University of Nebraska, Lincoln, NE, USA, 1999. [Google Scholar]
  15. Jones, J.W.; Hoogenboom, G.; Porter, C.H.; Boote, K.J.; Batchelor, W.D.; Hunt, L.A.; Wilkens, P.W.; Singh, U.; Gijsman, A.J.; Ritchie, J.T. The DSSAT cropping system model. Eur. J. Agronomy 2003, 18, 235–265. [Google Scholar] [CrossRef]
  16. Dirk, R.; Pasquale, S.; Theodore, C.H.; Elias, F. AquaCrop—The FAO crop model to simulate yield response to water: II. Main algorithms and software description. Agronomy J. 2009, 101, 448–459. [Google Scholar] [CrossRef]
  17. Asseng, S.; Keating, B.A.; Fillery, I.R.P.; Gregory, P.J.; Bowden, J.W.; Turner, N.C.; Palta, J.A.; Abrecht, D.G. Performance of the APSIM-wheat model in Western Australia. Field Crops Res. 1998, 57, 163–179. [Google Scholar] [CrossRef]
  18. Riboli, E. The EPIC project: Rationale and study design. Int. J. Epidemiol. 1997, 26, 6–14. [Google Scholar] [CrossRef]
  19. Araya, A.; Keesstra, S.D.; Stroosnijder, L. Corrigendum to “Simulating yield response to water of Teff (Eragrostis tef) with FAO’s AquaCrop model” [Field Crops Res. 116 (2010) 196–204]. Field Crops Res. 2010, 117, 265. [Google Scholar] [CrossRef]
  20. Attia, A.; Rajan, N.; Xue, Q.W.; Nair, S.; Ibrahim, A.; Hays, D. Application of DSSAT-CERES-Wheat model to simulate winter wheat response to irrigation management in the Texas High Plains. Agric. Water Manag. 2016, 165, 50–60. [Google Scholar] [CrossRef]
  21. Yue, Y.J.; Li, J.; Ye, X.Y.; Wang, Z.Q.; Zhu, A.X.; Wang, J.A. An EPIC model-based vulnerability assessment of wheat subject to drought. Nat. Hazards 2015, 78, 1629–1652. [Google Scholar] [CrossRef] [Green Version]
  22. Yin, Y.Y.; Zhang, X.M.; Lin, D.G.; Yu, H.; Wang, J.A.; Shi, P.J. GEPIC-V-R model: A GIS-based tool for regional crop drought risk assessment. Agric. Water Manag. 2014, 144, 107–119. [Google Scholar] [CrossRef]
  23. Wu, H.; Qian, H.; Chen, J.; Huo, C.C. Assessment of agricultural drought vulnerability in the Guanzhong Plain, China. Water Resour. Manag. 2017, 31, 1557–1574. [Google Scholar] [CrossRef]
  24. Kamali, B.; Abbaspour, K.C.; Lehmann, A.; Wehrli, B.; Yang, H. Spatial assessment of maize physical drought vulnerability in sub-Saharan Africa: Linking drought exposure with crop failure. Environ. Res. Lett. 2018, 13, 074010. [Google Scholar] [CrossRef] [Green Version]
  25. Chen, G.Q.; Liu, H.J.; Zhang, J.W.; Liu, P.; Dong, S.T. Factors affecting summer maize yield under climate change in Shandong Province in the Huanghuaihai Region of China. Int. J. Biometeorol. 2012, 56, 621–629. [Google Scholar] [CrossRef] [PubMed]
  26. Geng, S.M.; Yan, D.H.; Yang, Z.Y.; Zhang, B.Z.; Yang, M.J.; Kan, G.Y. Characteristics analysis of summer maize yield loss caused by drought stress in the Northern Huaihe Plain, China. Irrigation Drain. 2017, 67, 251–268. [Google Scholar] [CrossRef]
  27. Shen, S.Y.; Xi, C.F. Model and analysis of the natural productive potential of agriculture of the Guo River watershed in Northern Anhui, China. J. Nat. Resour. 1991, 1, 22–33. [Google Scholar] [CrossRef]
  28. Turner, N.C. Crop water deficits: A decade of progress. Adv. Agronomy 1986, 39, 1–51. [Google Scholar] [CrossRef]
  29. Zadoks, J.C.; Chang, T.T.; Konzak, C.F. A decimal code for the growth stages of cereals. Weed Res. 1974, 14, 415–421. [Google Scholar] [CrossRef]
  30. Angstrom, A.S. Solar and terrestrial radiation. Report to the international commission for solar research on actinometric investigations of solar and atmospheric radiation. Q. J. R. Meteorol. Soc. 2010, 50, 121–126. [Google Scholar] [CrossRef]
  31. Yu, J.J.; Qin, X.S.; Larsen, O. Joint Monte Carlo and possibilistic simulation for flood damage assessment. Stoch. Environ. Res. Risk Assess. 2013, 27, 725–735. [Google Scholar] [CrossRef]
  32. Jia, H.C.; Wang, J.A.; Cao, C.X.; Pan, D.H.; Shi, P.J. Maize drought disaster risk assessment of China based on EPIC model. Int. J. Digit. Earth 2012, 5, 488–515. [Google Scholar] [CrossRef]
  33. Wang, Z.Q.; He, F.; Fang, W.H.; Liao, Y.F. Assessment of physical vulnerability to agricultural drought in China. Nat. Hazards 2013, 67, 645–657. [Google Scholar] [CrossRef]
  34. Cui, Y.; Jiang, S.M.; Jin, J.J.; Ning, S.W.; Feng, P. Quantitative assessment of soybean drought loss sensitivity at different growth stages based on S-shaped damage curve. Agric. Water Manag. 2019, 213, 821–832. [Google Scholar] [CrossRef]
  35. Chen, M.J.; Ma, J.; Hu, Y.J.; Zhou, F.; Li, J.X.; Yan, L. Is the S-shaped curve a general law? An application to evaluate the damage resulting from water-induced disasters. Nat. Hazards 2015, 78, 497–515. [Google Scholar] [CrossRef]
  36. Nam, W.H.; Hayes, M.J.; Svoboda, M.D.; Tadesse, T.; Wilhite, D.A. Drought hazard assessment in the context of climate change for South Korea. Agric. Water Manag. 2015, 160, 106–117. [Google Scholar] [CrossRef]
  37. Chen, J.L.; Kang, S.Z.; Du, T.S.; Qiu, R.J.; Guo, P.; Chen, R.Q. Quantitative response of greenhouse tomato yield and quality to water deficit at different growth stages. Agric. Water Manag. 2013, 129, 152–162. [Google Scholar] [CrossRef]
  38. Sincik, M.; Candogan, B.N.; Demirtas, C.; Büyükcangaz, H.; Yazgan, S.; Göksoy, A.T. Deficit irrigation of soya bean [Glycine max (L.) Merr.] in a sub-humid climate. J. Agronomy Crop Sci. 2008, 194, 200–205. [Google Scholar] [CrossRef]
  39. Yakoub, A.; Lloveras, J.; Biau, A.; Lindquist, J.L.; Lizaso, J.I. Testing and improving the maize models in DSSAT: Development, growth, yield, and N uptake. Field Crops Res. 2017, 212, 95–106. [Google Scholar] [CrossRef]
  40. Costa, C.; Dwyer, L.M.; Zhou, X.M.; Dutilleul, P.; Hamel, C.; Reid, L.M.; Smith, D.L. Root morphology of contrasting maize genotypes. Agronomy J. 2002, 94, 96–101. [Google Scholar] [CrossRef]
  41. Cakir, R. Effect of water stress at different development stages on vegetative and reproductive growth of corn. Field Crops Res. 2004, 89, 1–16. [Google Scholar] [CrossRef]
  42. Acevedo, E.; Hsiao, T.C.; Henderson, D.W. Immediate and subsequent growth responses of maize leaves to changes in water status. Plant Physiol. 1971, 48, 631–636. [Google Scholar] [CrossRef]
  43. Xu, Z.Z.; Zhou, G.S.; Shimizu, H. Plant responses to drought and rewatering. Plant Signal. Behav. 2010, 5, 649–654. [Google Scholar] [CrossRef] [Green Version]
  44. Pandey, R.K.; Maranville, J.W.; Admou, A. Deficit irrigation and nitrogen effects on maize in a Sahelian environment: I. Grain yield and yield components. Agric. Water Manag. 2000, 46, 1–13. [Google Scholar] [CrossRef]
  45. Igbadun, H.E.; Salim, B.A.; Tarimo, A.K.P.R.; Mahoo, H.F. Effects of deficit irrigation scheduling on yields and soil water balance of irrigated maize. Irrigation Sci. 2008, 27, 11–23. [Google Scholar] [CrossRef]
  46. Stone, P.J.; Wilson, D.R.; Reid, J.B.; Gillespie, R.N. Water deficit effects on sweet corn. I. Water use, radiation use efficiency, growth, and yield. Aust. J. Agric. Res. 2001, 52, 103–113. [Google Scholar] [CrossRef]
  47. Ribaut, J.M.; Hoisington, D.A.; Deutsch, J.A.; Jiang, C.; Gonzalez-de-Leon, D. Identification of quantitative trait loci under drought conditions in tropical maize. 1. Flowering parameters and the anthesis-silking interval. Theoret. Appl. Genet. 1996, 92, 905–914. [Google Scholar] [CrossRef] [PubMed]
  48. Skirycz, A.; Inzé, D. More from less: Plant growth under limited water. Curr. Opin. Biotechnol. 2010, 21, 197–203. [Google Scholar] [CrossRef] [PubMed]
  49. Farré, I.; Faci, J.M. Deficit irrigation in maize for reducing agricultural water use in a Mediterranean environment. Agric. Water Manag. 2009, 96, 383–394. [Google Scholar] [CrossRef]
Figure 1. Flowchart of establishing maize drought loss sensitivity curves by combining actual maize experiments with CSM-CERES-maize model. DHI: drought hazard index intensity during a given summer maize growth stage.
Agronomy 09 00078 g001
Figure 2. Location of study station and planting plots for the summer maize.
Agronomy 09 00078 g002
Figure 3. Daily precipitation and relative humidity during the whole summer maize growth period in the (a) 2016 and (b) 2017 growing seasons.
Agronomy 09 00078 g003
Figure 4. Daily maximum air temperature (TMAX), minimum air temperature (TMIN) and total solar radiation (SRAD) during the whole summer maize growth period in the (a) 2016 and (b) 2017 growing seasons.
Agronomy 09 00078 g004
Figure 5. S-shaped summer maize sensitivity curve during a given stage. DHI: drought hazard index intensity at this stage. LR: grain yield (dry matter accumulation) loss rate induced by drought stress during this period.
Agronomy 09 00078 g005
Figure 6. Simulated daily soil water content at two layers during the whole summer maize growth period based on the adjusted maize genetic parameters and the corresponding observed values in the (a) 2016 and (b) 2017 growing seasons.
Agronomy 09 00078 g006
Figure 7. Trends of daily soil water deficit (SWD) during four summer maize growth periods under various drought patterns in (a) 2016 and (b) 2017. S: seedling stage, J: jointing stage, T: tasseling stage, M: milking stage.
Agronomy 09 00078 g007
Figure 8. Trends of daily average summer maize evapotranspiration at four stages under various drought patterns in (a) 2016 and (b) 2017. ET: maize evapotranspiration; S: seedling stage, J: jointing stage, T: tasseling stage, M: milking stage.
Agronomy 09 00078 g008
Figure 9. Summer maize drought loss sensitivity curves for grain yield formation at four growth periods in (a) 2016 and (b) 2017. DHI: drought hazard index intensity during a given stage; GY: grain yield; R2: coefficient of determination; S: seedling stage, J: jointing stage, T: tasseling stage, M: milking stage.
Agronomy 09 00078 g009
Figure 10. Summer maize drought loss sensitivity curves for dry matter formation at four growth periods in (a) 2016 and (b) 2017. DHI: drought hazard index intensity during a given stage; DMA: dry matter accumulation at harvest time; R2: coefficient of determination; S: seedling stage, J: jointing stage, T: tasseling stage, M: milking stage.
Agronomy 09 00078 g010
Table 1. Division of the summer maize growth periods in 2016 and 2017.
StageDescription20162017
SSeedling stage, from seed germination to plants with first detectable nodeFrom June 18 to July 11, 24 daysFrom June 14 to July 6, 23 days
JJointing stage, from plants with first detectable node to first visible ear tip appearanceFrom July 12 to July 29, 18 daysFrom July 7 to July 23, 17 days
TTasseling stage, from first visible ear tip appearance to the beginning of grain-fillingFrom July 30 to August 15, 17 daysFrom July 24 to August 8, 16 days
MMilking stage, from the beginning of grain-filling to plants maturationFrom August 16 to September 25, 31 daysFrom August 9 to September 21, 34 days
Table 2. Measured soil characteristics for inputting in the CSM-CERES-maize model.
Soil LayerBulk Density (g/cm3)Clay (%)Silt (%)Initial Soil Water Content (cm3/cm3)
2016 Season2017 Season
0–10 cm1.3325700.250.26
10–20 cm1.5630670.280.30
20–30 cm1.6123730.260.24
30–40 cm1.5525710.280.25
Table 3. Drought patterns set in the CSM-CERES-maize model during the 2016 and 2017 growing seasons.
Drought PatternPercentage of Actual Precipitation AmountDescription
Seedling StageJointing StageTasseling StageMilking Stage
CK100%100%100%100%Natural rain-fed condition during the whole summer maize growth period
T1-180%100%100%100%Five degrees of drought stress during the seedling stage
T1-260%100%100%100%
T1-340%100%100%100%
T1-420%100%100%100%
T1-50100%100%100%
T2-1100%80%100%100%Five degrees of drought stress during the jointing stage
T2-2100%60%100%100%
T2-3100%40%100%100%
T2-4100%20%100%100%
T2-5100%0100%100%
T3-1100%100%80%100%Five degrees of drought stress during the tasseling stage
T3-2100%100%60%100%
T3-3100%100%40%100%
T3-4100%100%20%100%
T3-5100%100%0100%
T4-1100%100%100%80%Five degrees of drought stress during the milking stage
T4-2100%100%100%60%
T4-3100%100%100%40%
T4-4100%100%100%20%
T4-5100%100%100%0
Table 4. Calibrated results of summer maize (cv. Longping-206) genetic parameters used in the CSM-CERES-maize model.
Genetic ParameterDescriptionRange of ValuesCalibrated Values
P1 (°C day)Thermal time from seed emergence to the end of juvenile phase during which the plant is not responsive to photoperiod100–400106.7
P2 (day)Delay in development (days) for each hour that day length is above 12.5 h. If the day length is less than 12.5 h, development occurs at maximum rate0–42.1
P5 (°C day)Thermal time from silking to physiological maturity600–1000995.5
G2 (kernel)Maximum possible number of kernels per plant500–1000502.3
G3 (mg kernel−1 day −1)Kernel growth rate during the linear grain-filling stage under optimum conditions5–1210.3
PHINT (°C day)The interval in thermal time between successive leaf tip appearances30–7538.9
Table 5. Simulated (Sim) dates of the beginning of flowering and maturity, grain yield and dry matter accumulation at harvest time based on the adjusted genetic parameters of summer maize in the experiments, and the corresponding observed results (Obs), absolute relative error (ARE) and relative root mean square error (RRMSE).
Cropping SeasonDate of Beginning of Flowering
(Day after Planting)
Date of Beginning of Maturity
(Day after Planting)
Grain Yield (kg/hm2)Dry Matter Accumulation at Harvest Time (kg/hm2)
SimObsARERRMSESimObsARERRMSESimObsARERRMSESimObsARERRMSE
2016 (calibration)45450.00%0.00%98953.16%3.55%498751172.54%2.17%12,72213,7537.50%6.29%
2017 (validation)46460.00%1001043.85%671768471.90%14,03514,7765.01%
Table 6. Average value of simulated (Sim) soil water content during the whole summer maize growth period at two layers based on the adjusted maize genetic parameters, and the corresponding observed results (Obs) and relative root mean square error (RRMSE).
Soil Layer2016 Season2017 Season
Sim (cm3/cm3)Obs (cm3/cm3)RRMSESim (cm3/cm3)Obs (cm3/cm3)RRMSE
0–20 cm0.2330.2359.47%0.2840.2858.68%
20–40 cm0.2250.2388.84%0.2750.2629.76%
Table 7. Equation parameters in S-shaped sensitivity curve that was used to fit the relationship between drought hazard index intensity (DHI) at each summer maize growth period and the corresponding grain yield loss rate (LR) in 2016 and 2017.
Maize Growth StageLR = LRmax/(1 + α×eβ × DHI)
Grain Yield Loss
LRmaxαβR2
20162017201620172016201720162017
Seedling stage16%2%16.118.0318.802.530.720.82
Jointing stage43%50%4.825.353.509.980.800.85
Tasseling stage16%36%22.8818.677.564.260.980.96
Milking stage27%22%13.3815.213.136.730.94 0.73
Table 8. Equation parameters in S-shaped sensitivity curve that was used to fit the relationship between drought hazard index intensity (DHI) at each maize growth period and the corresponding dry matter accumulation loss rate (LR) in 2016 and 2017
Maize Growth StageLR = LRmax/(1 + α×eβ × DHI)
Dry Matter Accumulation Loss
LRmaxαβR2
20162017201620172016201720162017
Seedling stage17%1%12.1814.1611.052.820.940.92
Jointing stage48%52%8.286.964.447.400.950.91
Tasseling stage6%17%22.4817.417.764.430.980.96
Milking stage14%21%13.7220.073.403.690.950.79

