Article

Optimizing Crop Load for New Apple Cultivar: “WA38”

Department of Horticulture, Tree Fruit and Research Extension Center (TFREC), Washington State University, 1100 N. Western Avenue, Wenatchee, WA 98801, USA
*
Author to whom correspondence should be addressed.
Agronomy 2019, 9(2), 107; https://doi.org/10.3390/agronomy9020107
Submission received: 24 January 2019 / Revised: 15 February 2019 / Accepted: 17 February 2019 / Published: 22 February 2019
(This article belongs to the Section Horticultural and Floricultural Crops)

Abstract

:
Crop load management is growing increasingly important as a factor related to biennial tendencies, post-harvest disorders, and inconsistent fruit quality in apples like “Honeycrisp”. Washington State University released a new apple cultivar, called “WA38”, in 2017. Limited literature is available about the productive characteristics of this new cultivar. An experimental trial evaluating the effect of crop load on leaf area, fruit quality, mineral composition, and return bloom of “WA38” was conducted for two consecutive years (2017 and 2018) to determine an optimal crop load. Trees were trained as a spindle and grafted on Malling-9 Nic29 (Nic29) rootstocks. Crop loads were adjusted to 2, 4, 6, and 8 fruits/cm2 of trunk cross-sectional area (TCSA). Crop load had a significant effect on production, with yields ranging from 28 to 83 MT/ha in 2017. Fruit quality was impacted by increasing crop load, with a reduction in fruit weight, soluble solid content, firmness, dry matter, titratable acidity, and a delay in maturity. Leaf-to-fruit ratios were higher in lower crop loads. Relatively consistent flower bud formation was seen at the 6 and 8 fruits/cm2 categories. A possible threshold for optimal fruit quality and consistent bloom was identified around 6 fruits/cm2 TCSA.

1. Introduction

Washington State University’s Apple Breeding Program developed a new cultivar, “WA38”, commercially traded as “Cosmic Crisp®”. It was released to the fruit industry for commercial production in 2017. Millions of trees are projected to be planted in Washington (WA) in the upcoming years (nearly seven million “WA38” trees were planted in spring 2018, and five million more are expected to be planted in 2019) [1]. A minimal amount of published research is available on how to best manage this new cultivar.
“WA38” is the result of a cross between “Enterprise” and “Honeycrisp” [2]. “WA38” is classified for its growth habit as a type IV cultivar [3], which indicates an acrotonic tree growth, with a natural tendency to produce on the outer part of the canopy, leaving “blind wood” or unproductive wood closer to the trunk.
To minimize the effect of “blind wood”, a “click” pruning technique can be applied to type IV cultivars [4]. This pruning technique is based on the dormant cutting of one-year-old wood in both the apical and basal zone, and requires branches oriented with an angle of 40–45° to the vertical. Mohammadi et al. [5] reported an increase of flower bud formation when using the click technique in apple. Click pruning requires that about 20% to 25% of the branches should be renovated every year to maintain high fruit quality.
“WA38” is also characterized by a self-thinning capacity with one or two fruitlets set per cluster after 4–6 weeks after full bloom (WAB) [6]. This peculiar trait requires only fine adjustments, with respect to crop load management. Harvest time is at the end of September to the beginning of October in WA (+4 weeks from Gala). “WA38” is a “bi-color” cultivar, capable of reaching 90% red overcolor (and a dark red hue) depending on the growing region and management practices [2]. It is noted to have remarkable eating quality, being large in size, crispy, juicy, and firm, and has a long-term storage capability with no significant incidence of important storage disorders [2].
It is well known that management practices in the orchard influence tree canopy balance and the production of high apple fruit quality. For this reason, defining the optimal crop load of a new cultivar characterized by the trait of setting one or two fruits per cluster requires a fine-tuning of all the management techniques [7]. In fact, pruning trees helps maintain a sufficient and well-illuminated canopy to act as a source for photosynthate production [8], whereas apple crop load management adjusts the number of sinks to reduce resource competition and have enough carbon for developing fruits [9]. Carbohydrates are transported and utilized across the tree to several competing locations. Tree growth and resource allocation is dependent upon the carbon availability and the demand strength of “sinks”, organs, and processes within the tree that require carbohydrates [10]. Physiological processes that are dependent upon sufficient carbohydrate supply include respiration, fruit development, bud formation, growth of shoots, leaves, branches, roots, and reserve allocation [11]. These processes and “sinks” demand resources at different “strengths” and change their needs throughout the growing season [12]. Kramer and Kozolowski [13] proposed a prioritized ranking in apple of “sink” strengths in the following order from strongest to weakest: fruits and seeds, new leaves and stems, mature leaves, vascular tissues, roots, and carbon reserves. After bloom, there is a high demand of carbon by a high number of developing fruits, competing and exponentially growing during their cell division phase (2–4 weeks after bloom, WAB) [14]. Apple fruit thinning ideally should take place during this phase so as to reduce the number of sinks dependent on a limited carbon availability. The removal of competing fruit at this phase encourages large fruit, as fruit size is more dependent upon cell number than cell volume [15,16,17,18].
The apple industry increasingly focused on crop load management in recent years. Cultivars like “Honeycrisp” present a strong biennial bearing tendency with negative effects on fruit quality [19,20]. Biennial bearing is the natural tendency of some apple cultivars to set a heavy crop load one year (“on” year), and a minimal crop load in the following year (“off” year) [21]. Crop load management techniques (i.e., bloom/green-fruit thinning) were shown to be effective in reducing biennial bearing, as well as enhancing canopy growth, increasing fruit size, and producing consistent high-quality fruit [9,18,22,23,24]. Also, some disorders like bitter pit can be related to poor crop load management [20].
Precision crop load management consists of three different steps: winter pruning (flower bud removal), blossom thinning at bloom, and green-fruit thinning during cell division [22]. The culmination of these horticultural tasks should aim to result in an appropriate number of fruit sinks for a balanced carbon supply and optimal fruit size, yield, and quality [25]. Palmer et al. [26] demonstrated that “Braeburn” trees with lower crop loads yielded fruit of higher quality, i.e., redder in color, higher soluble solids content, reduced starch content, and increased dry matter. In general, heavier crop loads delay maturity and negatively impact fruit quality with respect to sugar content, color development, titratable acidity, and firmness [9,20]. Higher crop loads can also lead to deleterious effects on vegetative parameters, especially the leaf-to-fruit ratio [9].
Higher leaf-to-fruit (L:F) and leaf-area-to-fruit (LA:F) ratios were shown to enhance the weight, size, color, sugar content, ripeness, and maturity in tree fruit, like cherries [27,28,29]. Trees with larger LA:F ratios yield higher-quality fruit in peach trees [30]. However, higher LA:F ratios may not always be desirable, as excessive leaf area can lead to intra-tree shading, which can result in reduced fruit quality, fruit abscission, undesired shoot growth, and a reduction in return bloom [21,31,32]. The relationship between leaf area and fruit quality remains to be fully investigated in apple. However, the appropriate number of fruits per tree and crop load management were researched more intensively, but these targets may be dependent upon the cultivar and the size/age of the tree [9].
Fruit from heavily cropped “Honeycrisp” trees were less firm, but had lower incidences of storage issues like bitter pit, scald, rot and senescent breakdown [33]. High crop loads in “Honeycrisp” led to reduced flower bud formation, delayed fruit ripening, and poor coloration, and lowered the overall quality, which negatively impacted fruit storage capability [20]. Fruits from lighter cropped trees produced higher-quality fruit and resulted in longer storability [20]. Embree et al. [22] noted that “Honeycrisp” can produce consistent high-quality fruit in Nova Scotia (Canada), but only under optimal crop level conditions. Embree et al.’s [22] results indicated that a crop load level of 6 fruits/cm2 of trunk cross-sectional area (TCSA) yielded high-quality fruit and mitigated biennial production. This target crop load level was confirmed by Serra et al. [20], with their suggestion ranging from 4.7 to 7.5 fruits/cm2 of TCSA in Washington State’s (WA) conditions.
Optimal crop load levels for consistent high-quality fruit in varieties like “Honeycrisp” were suggested [20,22]. However, further cultivar-specific research is needed, especially for newly released varieties, like “WA38”. To date, there remains no research published addressing its potential for biennial bearing, as well as the impact crop load has on “WA38” apples. This study was conducted to assess the impact of crop load management on fruit quality, vegetative parameters, mineral composition, and return bloom in “WA38”. In 2017, 24 trial trees were selected and adjusted to four crop load treatments (2, 4, 6, and 8 fruits/TCSA cm2). These trees and their fruit were evaluated for quality, leaf area, mineral composition, and flower bud development in the following spring of 2018.

2. Materials and Methods

2.1. Experimental Design

In June 2013, an orchard of Washington State University’s new apple (Malus domestica Borkh), variety “WA38”, was planted in an experimental trial in Rock Island, Wenatchee, WA, United States of America (USA) (47.309776 N, −120.064593 W). The tree was selected in a complete randomized design, assessing three training systems, two rootstocks, and two pruning methods. The selected “WA38” trees (24 in total across four separate blocks) for the study were trained to a spindle system (3.0 m × 0.9 m ≈ 3700 trees/ha), grafted on Malling-9 Nic29 (Nic29), and “click” pruned. The “click” pruning technique consists of simplifying branches, heading back on one-year-old dormant shoots, and training branches to a crotch angle of 45 degrees [4]. The orchard was irrigated through drip lines and sprinklers, and was fertilized and managed as per industry standards.
Trunk diameter was measured on 20 April 2017 (fifth leaf) and on 13 March 2018 (sixth leaf) at 15 cm above the graft union. TCSA was calculated starting from averaging two orthogonal diameter measures of the trunk and expressing it in cm2. Twenty-four trees were selected with an average TCSA of 12.26 ± 2.00 cm2. Flower buds were counted on each tree on 20 April 2017, prior to full bloom, which occurred on 6 May 2017. Flower buds were characterized into three categories based on bud location: terminal position on “brindilla” (one-year-old wood with an apical flower bud only) and “ramo misto” (one-year-old wood with apical and lateral flower buds) wood, laterals on “brindilla” and “ramo misto” wood, and buds on spurs located on branches and on the main axis [34]. An initial fruit set count was conducted on 12 June 2017 to determine the natural crop load capability. Initial crop loads across the selected 24 trees ranged from 3.0 to 9.3 fruits/cm2 TCSA. Trees were then thinned to the closest possible target crop load category. Four crop load levels 2, 4, 6, and 8 fruits/TCSA (cm2) were selected and manually adjusted on 17 June 2017 (seven WAB), with six trees per each crop load. At harvest, the real crop load levels were as follows: 2.1, 4.1, 6.0, and 7.8 fruits/TCSA (cm2).

2.2. Fruit Grading and Quality Analysis

Fruit was harvested on 9 October 2017 (third crop for the orchard at fifth leaf) and in the following year on 21 September 2018 (fourth crop, sixth leaf). Number of harvested fruit and yield (kg/tree) were assessed for each tree. In 2018, a few trees were excluded from harvest due to damages to the tree. Apples were sized by the following categories to account for larger fruit: <65.00, 65.00–69.99, 70.00–74.99, 75.00–79.99, 80.00–84.99, 85.00–89.99, 90.00–95.99, 95.00–99.99, 100.00–104.99, 105.00–109.99, and ≥110.00 mm in diameter using a customized fruit sizer (Figure S1, Supplementary Materials). Quality evaluation was assessed on the subsampled fruit when they exhibited an average starch grading of 1.64. Fruit quality analysis was not conducted on the fruit harvested in 2018, only sizing.
In 2017, fruit designated for quality analysis ranged from 80–90 mm (most representative size range for this harvest) to limit the variability due to effect of size on fruit quality. Fruit was also graded in the field for external disorders such as sunburn, green spot, bitter pit, stem split, insect damage, depression, bird damage, limb rub/bruise, leaf shade, russet, decay, and cracking accordingly to a customized “WA38” disorder guideline developed by authors over recent years. After all the apples were graded, 16 fruits (one tray of a 64-capacity box) from each experimental tree were selected showcasing no or minimal external defects (all fruit showing defects with cortex exposure were discarded for this purpose and assigned as a “cull”) and boxed (96 apples for each crop load level for a total of 384 fruit). All boxes were then immediately moved to storage under regular atmosphere (RA) conditions at approximately 1.0 °C until they could be processed for quality over the following two days.
Maturity and quality parameters were evaluated on all sampled apples. Maturity was measured using the DA Meter (Sinteleia, Bologna, Italy), which measures the index of absorbance difference (IAD), a non-destructive metric indicating fruit ripening/maturity by chlorophyll content estimation in the flesh below the skin, previously used for peaches [35] and other apple cultivars such as “Honeycrisp” [20,36]. IAD measurements were taken along the equatorial line of the shade and sun cheeks of the fruit and averaged.
Additional non-destructive quality parameters assessed included fruit weight (g), red overcolor surface (%), average red intensity of the blushed area (on a scale of 1–5), and the overcolor, background color, hue angle, and chroma were calculated for each fruit as per Serra et al. [20], using the Minolta colorimeter (Minolta CR-300 Chroma meter, Konica Minolta, Tokyo, Japan). The destructive quality parameters assessed were flesh firmness (kg/cm2), soluble solid content (SSC, °Brix), starch–iodine index (SI) [35], dry matter (%), and titratable acidity (TA).
Firmness was evaluated using the Fruit Texture Analyzer (FTA) (Guss Manufacturing Ltd., Strand, South Africa) on both the sun and shade side of the apple using a 10-mm puncturing probe after peeling the area of perforation. Sun and shade side firmness values were averaged to present the whole-fruit firmness.
Starch–iodine (SI) evaluations took place on approximately 1-cm-thick cross-sectional apple slices and were sprayed with iodine solution (15 g∙L−1 potassium iodine and 6 g∙L−1 iodine). Five minutes after application, SI was rated by the same operator for the entire assessment on a scale of 1–6 (1 = no starch hydrolysis (black cortex), 6 = starch degradation complete (clear cortex)) accordingly to the Washington Tree Fruit Research Commission’s SI scale [37].
Another cross-sectional slice ranging in weight between 15 g and 25 g was used to assess dry matter percentage (traditional destructive method). Each slice was cored (27 mm) to remove the seed cavities and peeled to sample only cortex tissue. Being a time-consuming procedure and requiring a lot of space to dry them out inside ovens, only three slices from each trial tree were sampled for this purpose (three slices per tree × six trees per crop load = 18 slices per crop load). Initial slice fresh weight (FW) was recorded and then the slices were placed into a forced air oven (model 179 L VWR®, Radnor, PA, USA) at 60 °C for approximately one–two weeks until weight fluctuation was minimal/absent. Dry weights (DW) were then recorded when slice weights were stable. Dry matter was calculated using the following formula: dry matter (DM)% = (DW (g) × 100)/FW (g).
Two opposite (sun and shade) thin wedges from the equatorial portion of the fruit were placed into a garlic press and juiced into a pocket refractometer (PAL-1; Atago USA Inc., Bellevue, WA, USA) to measure SSC and values expressed in Brix.
TA assessments were performed on juice samples that were obtained through the juicing of four wedges approximately 3 cm3 in size from the top and bottom, sun and shade sides of the apple. Three replications of juice (made from equally distributed fruit) from each treatment combination were obtained, placed into 50-mL Falcon centrifuge tubes avoiding the juicing foam and immediately frozen. Later juice samples were thawed, and 5-mL juice samples were analyzed using a Tiamo titrator (Metrohm AG, Herisau, Switzerland) 888 Titrando and Sample Processor Robotic Titrosampler. The titrant used was potassium hydroxide (0.1 N). TA units were expressed as % malic acid as reported in Serra et al. [20].

2.3. Leaf Area Quantification

Defoliation bags measuring 1.8 m × 7.0 m were made of 20% pearl shade netting (Green-Tek, Janesville, WI, USA). Nets were hung over the top wire and draped around each tree. The sides were sewn using mason line (100% nylon twine) and tied off at the bottom. Nets were hung on 30 October 2017, prior to any natural leaf drop. Leaves naturally abscised and accumulated in the basal portion of the net, where they were collected every seven to 10 days. Five leaf collections took place from 11 November 2017 to 11 December 2017.
Leaf area quantification and estimations (methodology and formulas) were conducted according to the Knerl et al. [38], and were also assessed with an SPAD 502 Chlorophyll Meter (Spectrum Technologies, Inc., Aurora, IL, USA).

2.4. Leaf-to-Fruit Ratio Calculations

  • Total leaf area per tree (TLA) (sum of five collections) = ∑ LA (m2) (collection 1 to collection 5);
  • Total no. of leaves per tree (TLN) = ∑ total no. of leaves in sample (collection 1 to collection 5);
  • Leaf-area-to-fruit (LA:F) ratio = TLA/number of fruits per tree [27];
  • Leaf-to-fruit ratio (L:F) = TLN/number of fruits per tree [27];
  • Specific leaf area (SLA) = average leaf area (cm2)/average leaf fresh weight (g) [39].

2.5. Leaf and Fruit Mineral Analysis

Leaf sampling took place during the growing season on 18 July 2017. Thirty leaves (pedicel included) from each tree were selected for sampling. Three leaves were selected from the middle portion of ten one-year-old shoots (five on the east side, and five on the west side of the canopy) between the second and third wire of the canopy, approximately 1.0–1.5 m from the ground. Leaves were bagged, placed in a cooler, and brought back to the lab. Leaves were then gently scrubbed with water and Tween20 (Amresco LLC, Solon, OH, USA) then rinsed through the following steps: tap water, deionized (DI) water, and distilled water. Leaf samples were then quickly dried with a salad spinner (OXO, Chambersburg, PA, USA) and placed into a forced air oven (model 179 L VWR®, Radnor, PA, USA) for approximately one week at 60 °C until weights were stable. After samples were fully dried, dry weight (g) was recorded and ground up to powder using the A11 Basic Analytical Mill (IKA Works, Inc. Wilmington, OH, USA). The ground-up leaf samples were packaged in 50-mL Falcon tubes and sent to a certified analytical laboratory for plant tissue mineral analysis for the following macro- and micro-nutrients: N, P, K, S, Ca, Mg, Zn, Mn, Cu, Fe, and B.
During fruit quality analysis, four apples from each trial tree (six trees per crop load = 24 fruits per crop load) were selected for mineral analysis. A cross-section was sliced from each of the mineral analysis fruits. These cross-sections typically ranged from approximately 15–25 g in weight. Slices were cored, chopped into pieces, placed into six 133-mL specimen cups (one per experimental tree) and placed into the −80 °C freezer. Fruits were then freeze-dried with a lyophilizer (FreeZone 12 plus, Labconco Corporation, Kansas City, MO, USA), ground up to powder, and sent out for fruit tissue mineral analysis for the following macro- and micro-nutrients: N, P, K, S, Ca, Mg, Zn, Mn, Cu, Fe, and B.

2.6. Return Bloom

In the spring of 2018, return bloom was evaluated on the trial trees at the tight pink cluster stage. Flower cluster counting was conducted on 17 April 2018. Four trees were excluded from the return bloom counts because they were accidentally pruned during the dormant season. Return bloom was assessed classifying flower clusters by their location on different types of fruiting wood. These three categories were (a) clusters coming from terminal buds on “brindilla” and “ramo misto”, (b) clusters from lateral buds on “ramo misto”, and (c) clusters located on spurs on older branches (2+ years old) or on the main axis/tree leader. The total number of flower clusters per tree was the sum of the count from each of the three categories. Fruit set was also counted on 14 June 2018 by totaling the number of fruits on each experimental tree. Fruit set percentage was calculated by the following formula:
Fruit set % = number of fruits counted/(total flower buds (at bloom) × 6 flowers per cluster) × 100.
Trees were then tracked until harvest, to assess for “return yield”. This was the amount of fruit naturally produced per tree after being adjusted for crop load in the summer of 2017 to assess for biennial bearing.

2.7. Statistical Analysis

Yield, fruit quality at harvest, leaf area, mineral analysis, return bloom, and return yield data were all analyzed using proc -GLM in SAS (SAS Inc. Cary, NC, USA). The effects of crop load on yield, fruit quality, leaf area, mineral analysis, and return bloom were assessed for significance with an analysis of variance (ANOVA) using the Proc GLM type III sum-of-squares test (model considered significant with p < 0.05). A Student–Newman–Keuls test was performed as a post hoc means separation test to assign differing letter groups where the model was significant.

3. Results

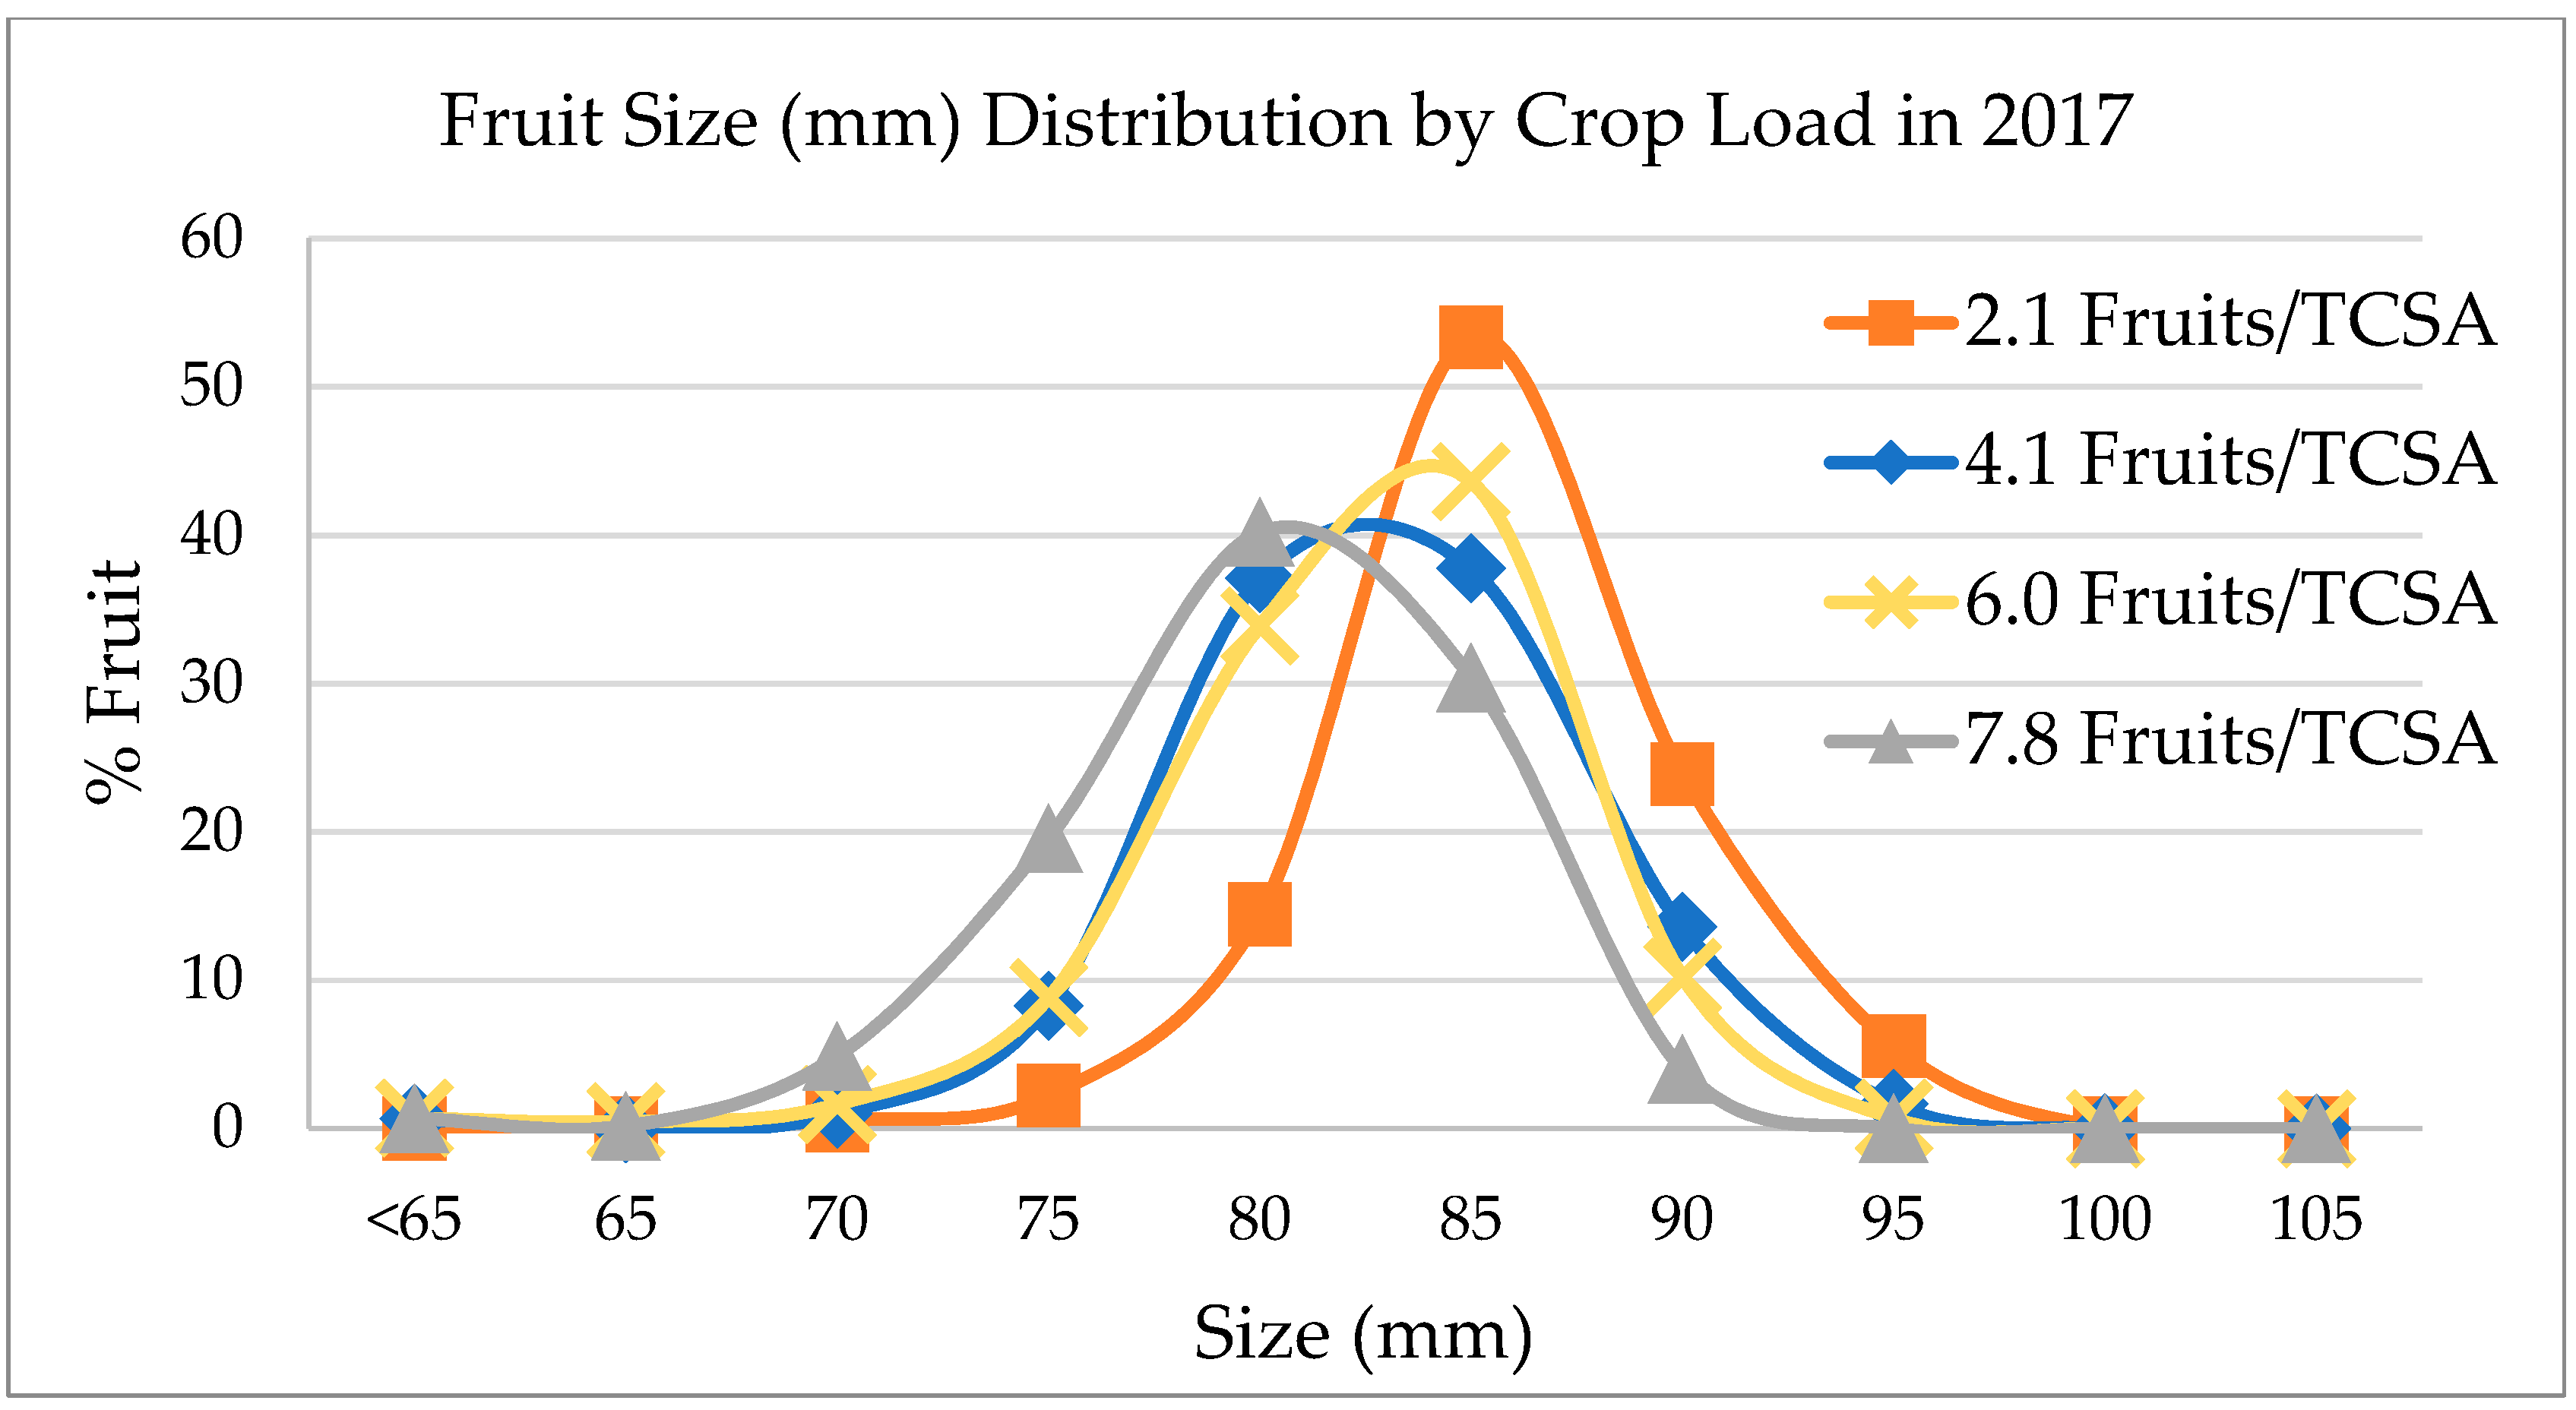
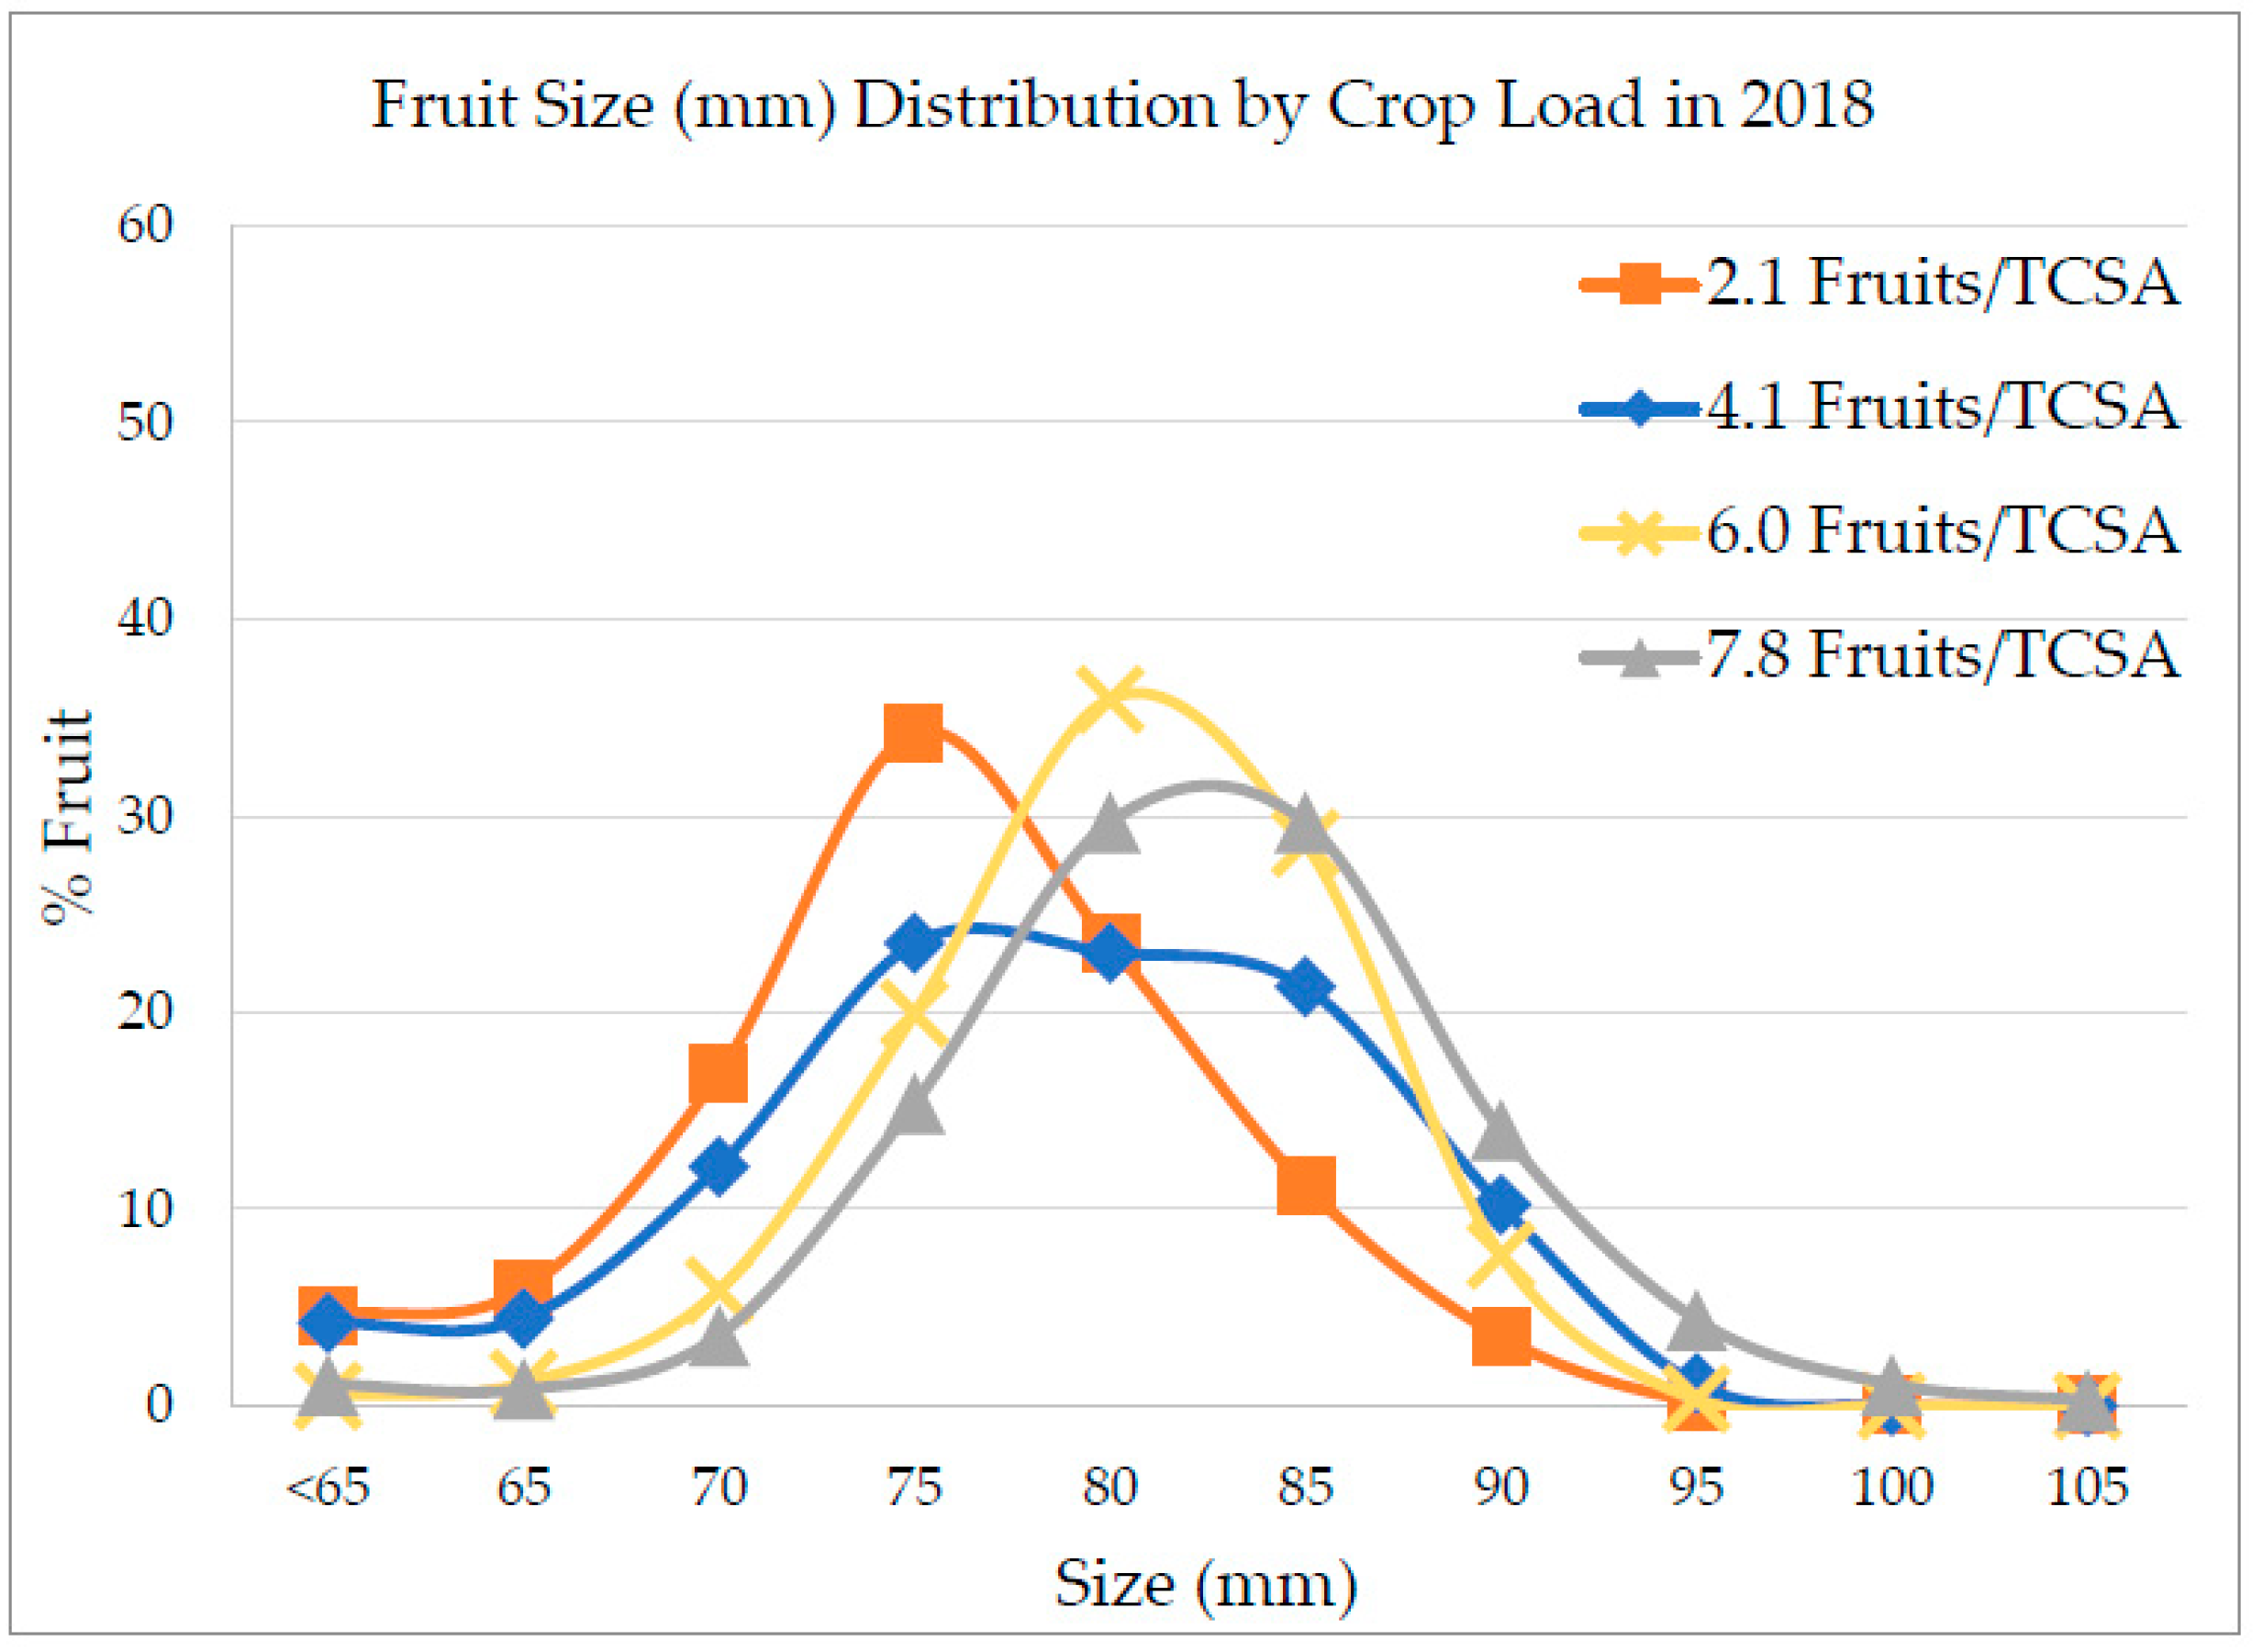
3.1. Crop Load Effect on Yield and Fruit Size

Crop load levels were adjusted to 2.1, 4.1, 6.0, and 7.8 fruits/cm2 TCSA in 2017. TCSA ranged from 10.5 to 14.2 cm2, and there was no statistical difference between trunk areas for the selected trees (data not shown). Average fruit number per tree corresponded to 26, 50, 72, and 95 apples for each crop load level of 2.1, 4.1, 6.0, and 7.8 fruits/cm2 TCSA, respectively (Table 1). Yield and production increased with increased crop load, with significant differences across each crop load category. Yield averaged 7.8, 13.3, 18.8, and 23.0 kg/tree. Production reached 28.2 and 82.8 MT/ha in the two extreme crop loads (the smallest to the largest, respectively). With respect to average apple fruit weight, a statistical difference emerged between the first crop load level (2.1 fruits/cm2) and the others, while 4.1, 6.0, and 7.8 fruits/cm2 did not differ from each other in their average fruit weight, but the higher crop load produced smaller fruit (20 g less) (Table 1). Fruit size decreased significantly with increased crop load, while 92%, 88%,88 %, and 75% of the fruit harvested was in the selected 80–90 mm size category across the 2.1, 4.1, 6.0, and 7.8 crop load levels (Figure 1).
In 2018, after trees were adjusted to their crop load category in 2017, the trees at the lower crop load category (2.1 fruits/cm2) demonstrated a large shift in production from 28.2 MT/ha in 2017 to 88.0 MT/ha in 2018 (Δ = 59.8) (Table 1 and Table 2). Higher crop loads at the 6.0 and 7.8 fruits/cm2 levels in 2017 produced 67.8 and 82.8 MT/ha, while producing 91.8 and 69.1 in the following year (Δ = 24.0; 137) (Table 1 and Table 2). The highest cumulate result of the two years was achieved applying the crop load of 6.0 fruits/cm2 with 159.6 MT/ha (Table 2). These differences in return yield, however, were not statistically significant. Fruit from the 2.1 fruits/cm2 crop load category in 2017 generated a higher percentage of smaller fruit in 2018 (Figure 2), whereas the higher crop loads generated similar sized fruit from year to year, with a large majority in the 80–90-mm range (Figure 1 and Figure 2).

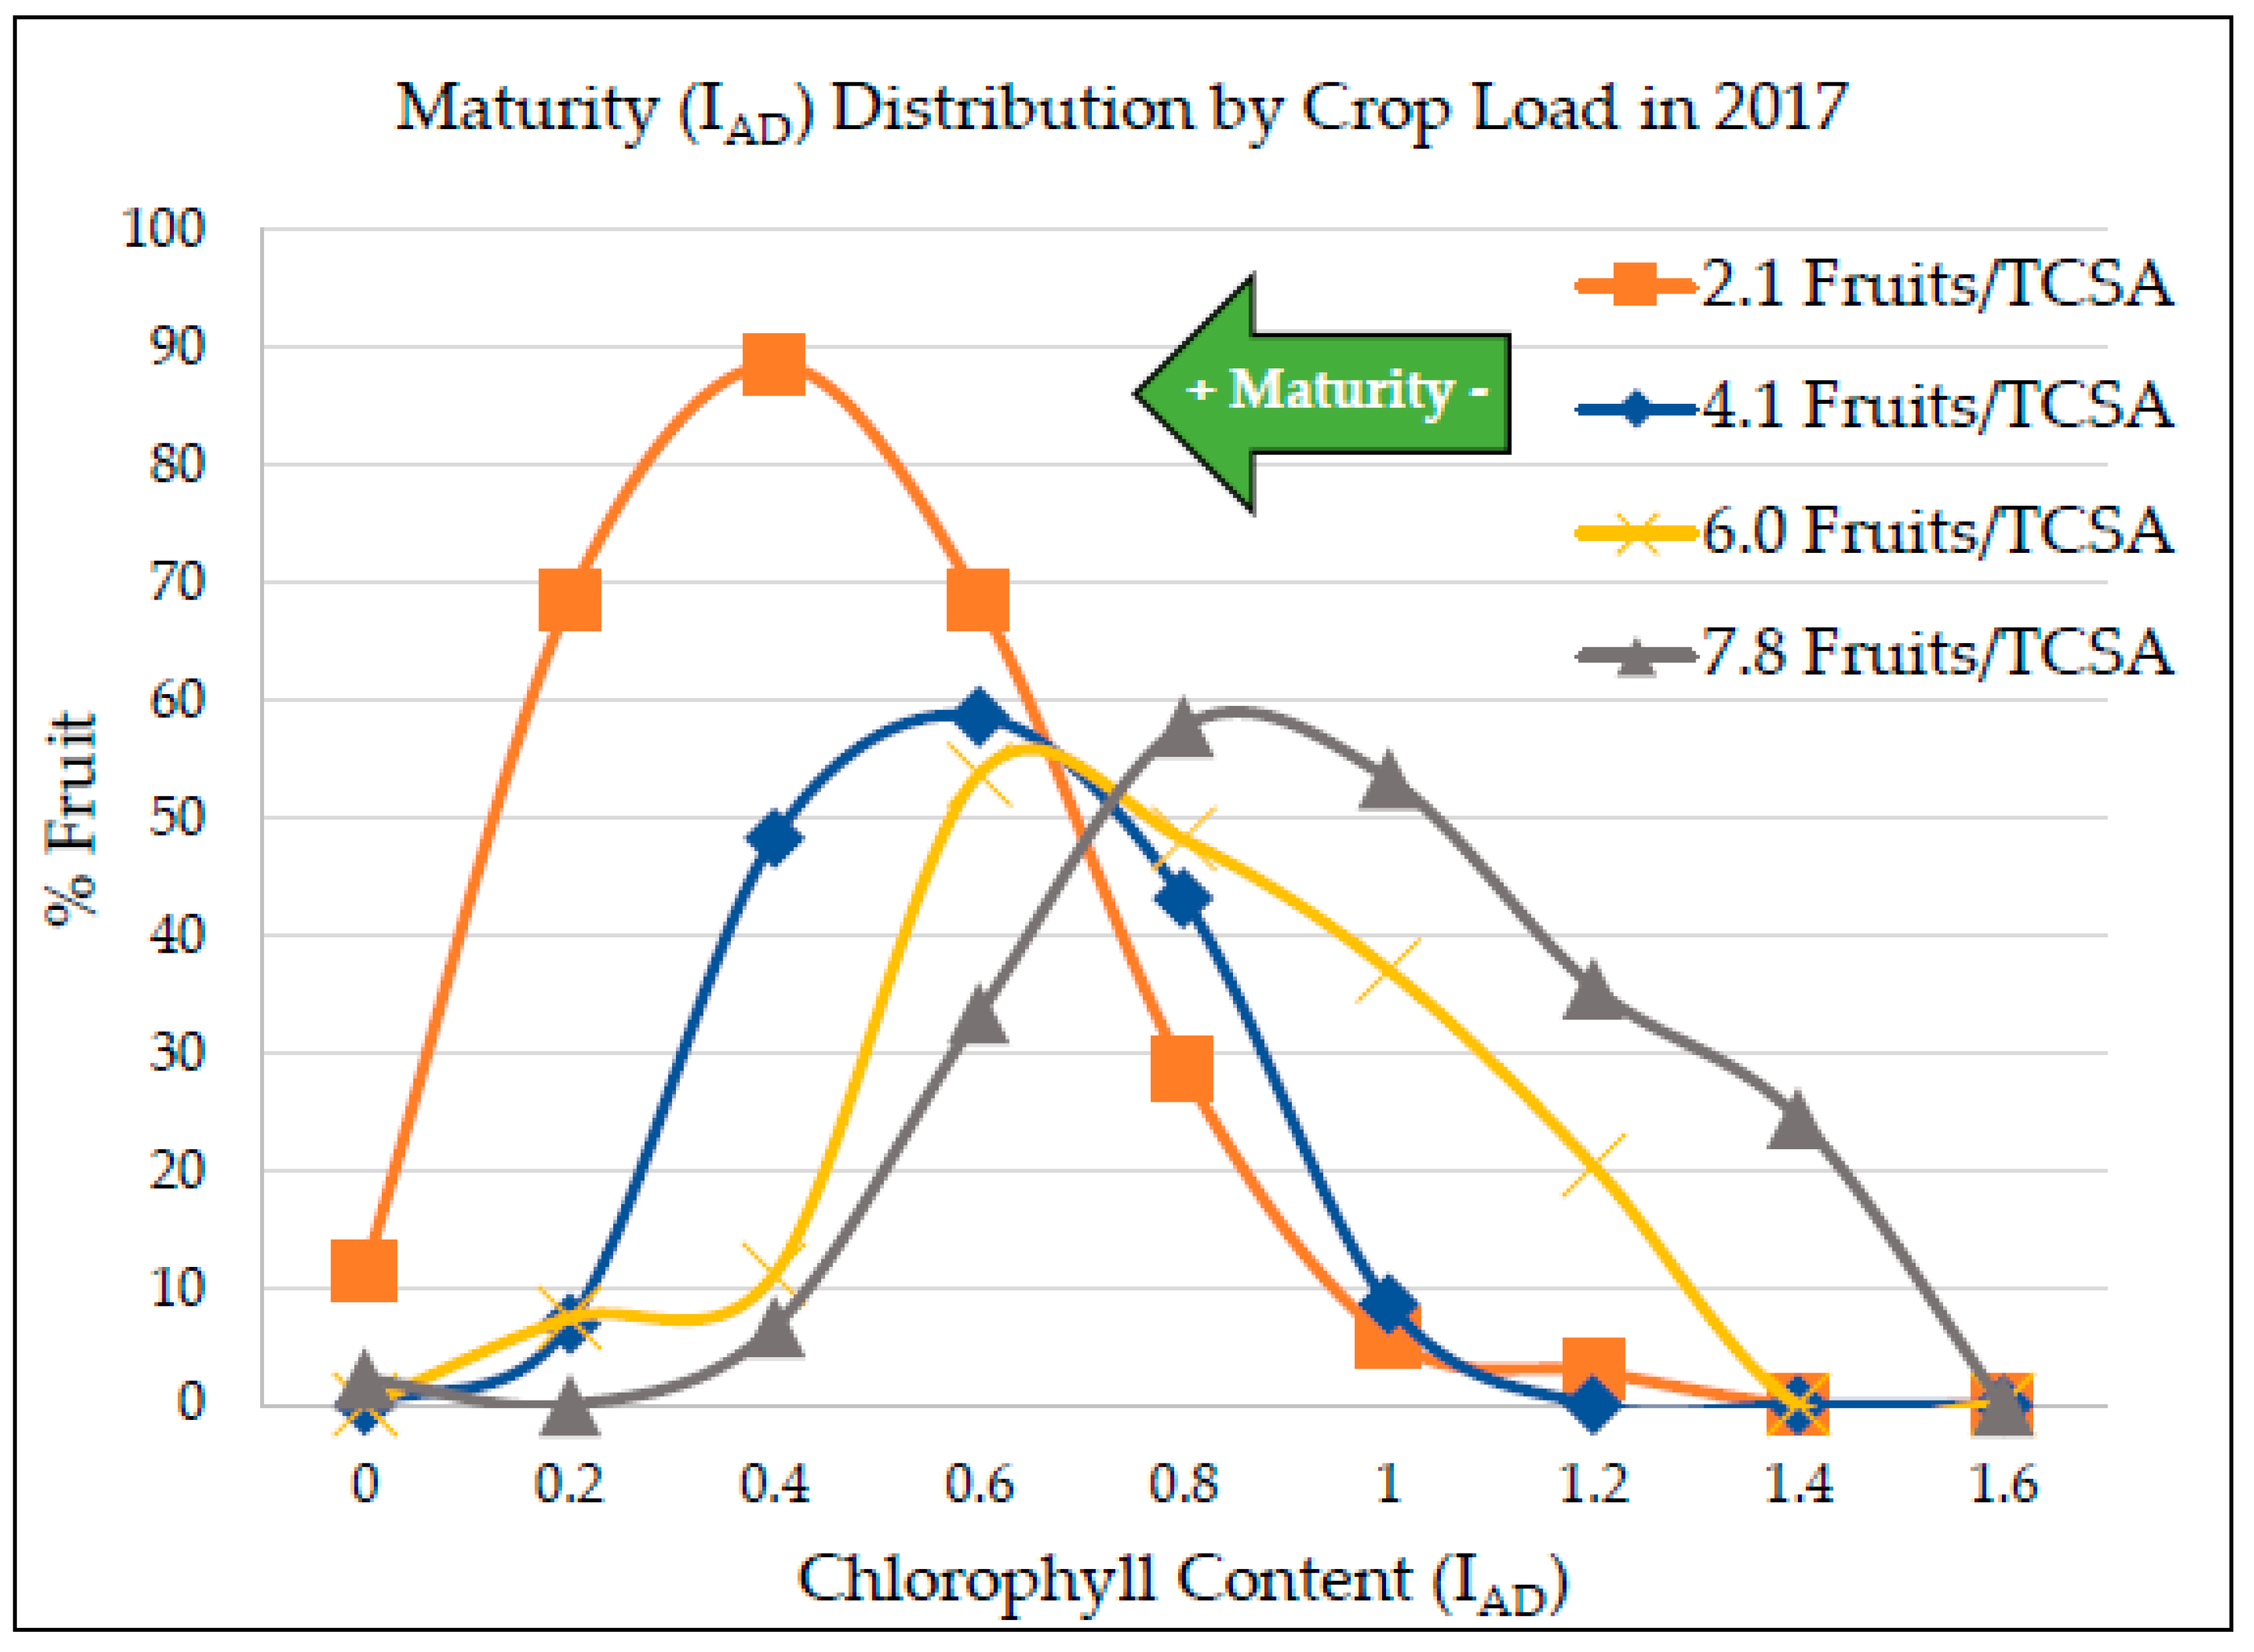
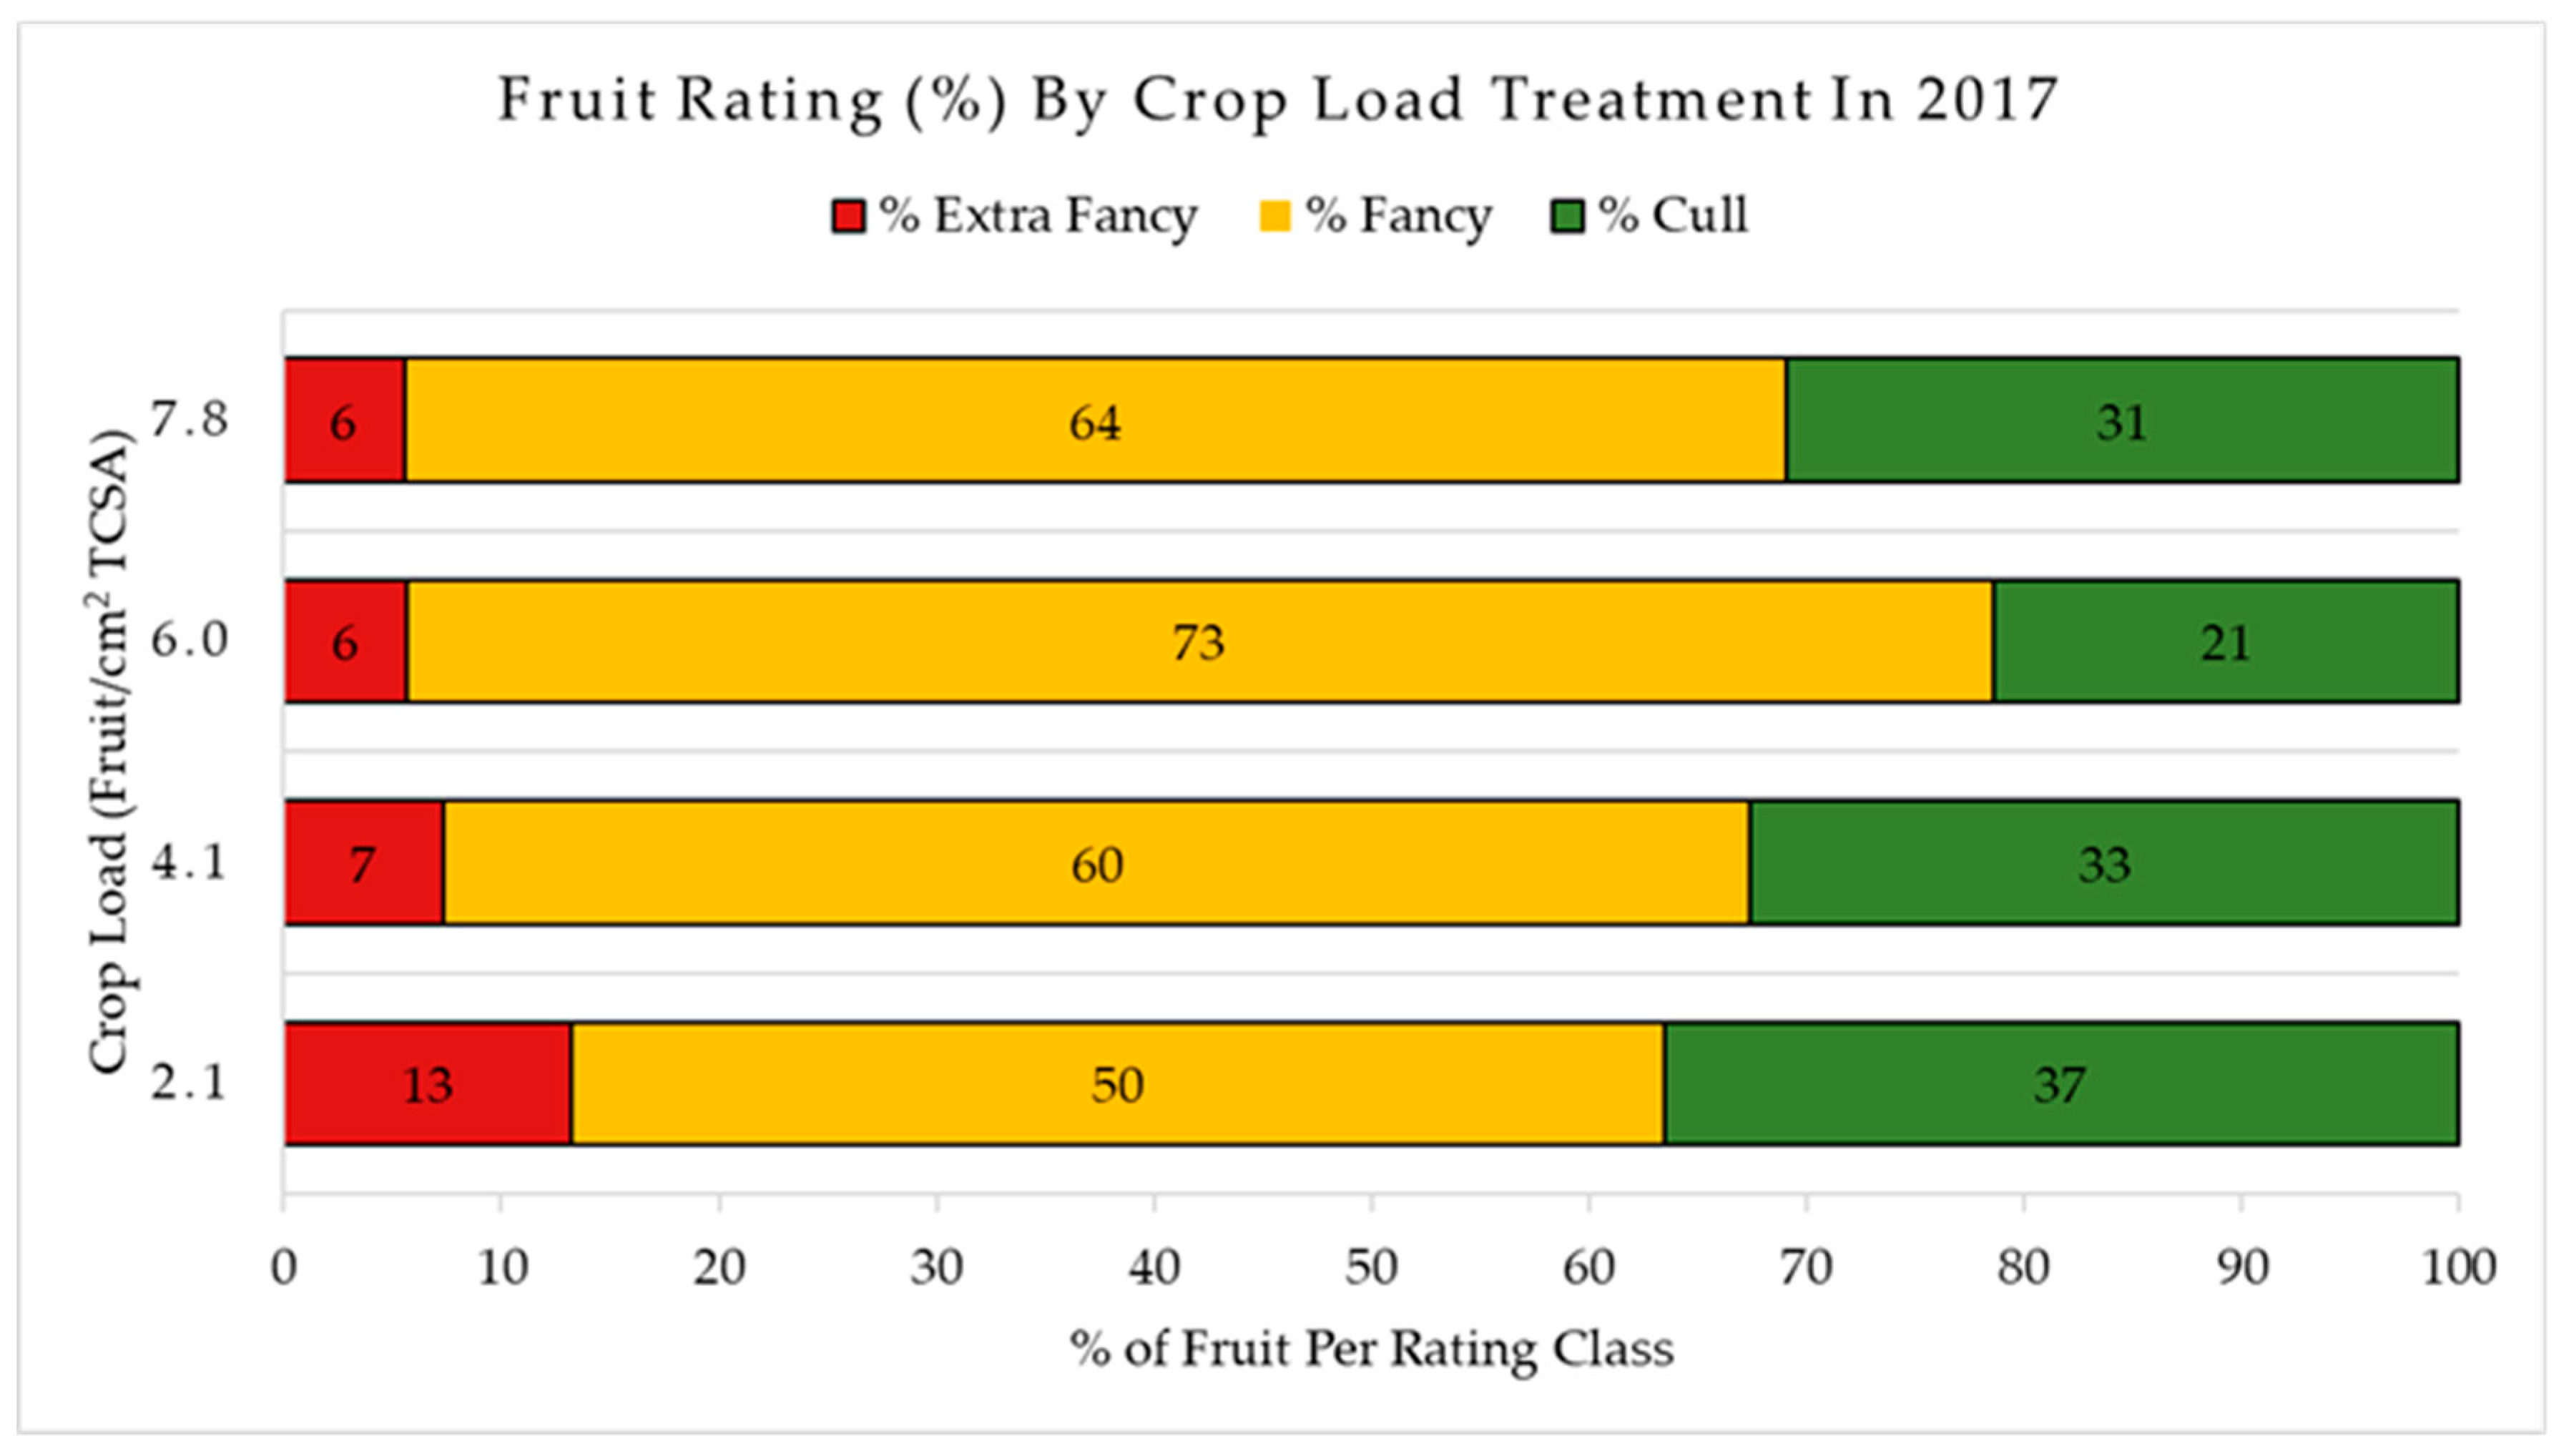
3.2. Crop Load Effect on Fruit Quality

Fruit quality parameters were observed to weaken as crop load density increased. Of the fruit assessed for quality analysis (80–90 mm), average fruit weight ranged from 302 g to 277 g (Table 3), from the lowest to the highest crop load evaluated. A significant difference across the four crop loads applied was observed regarding apple IAD measurements. IAD values increased with increasing crop load, ranging from 0.45 at 2.1 fruits/cm2 to 0.93 at 7.8 fruits/cm2 (Table 3). There were no differences in red overcolor surface area (%) across crop loads, and red intensity slightly varied, with a small decrease in the 6.0 fruits/cm2 category (Table 3). A small increase of chroma was detected by the Minolta in the 4.1 crop load; however, the hue angle was not impacted by crop load (Table S1, Supplementary Materials). A statistical threshold for SSC (°Brix) was identified between the 2.1 and 4.1 fruits/cm2 crop load categories. Crop loads 4.1 to 7.8 did not vary in SSC (Table 3). Firmness was higher in apples from lower crop loads, with fruit not differing in their firmness between the 6.0 and 7.8 crop load categories (Table 3). Overall, a decrease in SSC and firmness was observed with increasing crop load. Crop loads did not vary in their starch ratings with average values ranging from 1.5 to 2.0, according to the starch–iodine scale [37] (Table 3).
Fruit size and maturity (IAD) distribution (Figure 1 and Figure 3) indicate a shift toward larger and more ripe fruit in lower crop load levels. At 2.1 fruits/cm2, 53% of the fruit was ranked in the most representative size: 85 mm. Inversely, only 30% of the fruit reached this size at 7.8 fruits/cm2, with a shift toward smaller sizes in this crop load (Figure 1). With respect to fruit ratings (extra fancy, fancy, and culls), the highest incidence of extra fancy fruit was in the 2.1 crop load level, with 13%, whereas the 6.0 and 7.8 fruits/cm2 crop loads led to the least amount of extra fancy fruit (6%) (Figure 4). Inversely, the 2.1 fruits/cm2 crop load led with the highest percent of culls (37%), and the 6.0 crop load level led to the least amount (21%) (Figure 4). In crop load level 6.0 fruits/cm2, 73% of apples were deemed “fancy”, and resulted with, theoretically, the highest amount of marketable fruit overall when compared to the other crop loads examined in this study. The primary reasons for the higher percentage of culls in the 2.1 fruits/cm2 crop load category was the higher incidence of stem splits, bitter pit, and green spot disorder (data not shown). The 6.0 fruits/cm2 crop load had 16% more marketable fruit than the 2.1 fruits/cm2 level due to a smaller percentage of disorders present (Figure 4). The fruit harvested in 2018 reported the highest amount of “fancy” fruit originating from trees adjusted to 6.0 fruits/cm2 in 2017 (74%) (Figure 5). A similar amount of “fancy” fruit was found across the other crop load categories (2.1, 4.1, and 7.8 fruits/cm2) in 2018 (Figure 5).

3.3. Crop Load Effect on Vegetative Parameters

There were no differences in total leaf area (TLA), leaf number/tree, leaf area index (LAI), specific leaf area (SLA), average leaf area/leaf, or average leaf width between crop load categories (Table 4). LA:F and L:F ratios were significantly different across crop load categories and decreased with increasing crop load (Table 4). Trees in the lowest crop load category (2.1 fruits/cm2 TCSA) contained a significantly higher amount of leaf area and leaf number per fruit than for trees with heavier crop loads (Table 4). Differences in LA:F were found between 2.1 fruits/cm2 and the higher crop loads (Table 4). This statistical differentiation in SNK lettering between the first and second crop load, with respect to leaf-area-to-fruit ratios (Table 4), was mirrored in fruit firmness, SSC, dry matter, and titratable acidity (Table 3). With respect to annual growth, trees that were more heavily cropped tended to grow less, but there were no significant differences across any of the crop loads with respect to TCSA growth (Table 4).

3.4. Crop Load Effect on Leaf and Fruit Mineral Composition

Crop load did not significantly impact the leaf mineral status of the following elements: phosphorus (P%), calcium (Ca%), magnesium (Mg%), zinc (Zn ppm), manganese (Mn ppm), or Iron (Fe ppm) (Table 5). Significant differences were detected for leaf nitrogen (N%), potassium (K%), sulfur (S%), copper (Cu ppm), and boron (B ppm) across crop load treatments. Leaves sampled from trees adjusted to 6.0 and 7.8 fruits/cm2 contained a significantly higher amount of N than leaves sampled from trees that were adjusted to lower crop loads at 2.1 and 4.1 fruits/cm2. K decreased with increasing crop load, while S and Cu increased with increasing crop load (Table 5). Leaves from the lowest crop load trees contained a significantly higher amount of K (2.49%) when compared to the other higher crop loads (2.23%, 2.04%, 2.07%). Higher leaf Cu and S concentration were found in the higher crop loads (Table 5). B leaf concentrations were significantly lower at the 6.0 fruits/cm2 level than the other crop loads sampled (Table 5). All the macro- and micro-nutrients sampled across each of the crop loads were above the deficiency thresholds [40], except for Zn. Zn at the 4.1, 6.0, and 7.8 fruits/cm2 crop loads fell below the 15.0 ppm deficiency level [41], while leaves at the lowest crop load were close (15.2), although there were no significant differences across these crop loads (Table 5).
With respect to fruit mineral composition, crop load significantly influenced P, K, Mn, and B concentration inside the apples. P and K both increased with decreasing crop load level (Table 6). Mn concentration increased with increasing crop load. Mn at 7.8 fruits/cm2 was significantly higher than concentrations at the other lower three levels. Similar to the leaf mineral analysis, B concentration at the 6.0 fruits/cm2 level was significantly lower than the other 2.1 and 4.1 fruits/TCSA cm2, although it appeared that B concentration decreased with increasing crop load (Table 6). Crop load adjustment did not significantly impact N, S, Ca, Mg, Zn, Cu, or Fe in the fruit.

3.5. Crop Load Effect on Return Bloom

Although there was a slight diminishing trend of return bloom with increasing crop load, there was no significant difference in flower cluster counts across crop loads. The average number of flower buds in 2018 ranged from 289 at 2.1 fruits/cm2 to 145 at 7.8 fruits/cm2 (Figure S2, Supplementary Materials). Flower buds located at different positions on fruiting wood did not differ significantly across the crop loads. In total, 18–22% of the 2018 flower buds were located at the terminal position on “brindilla” or “ramo misto” wood, 32–35 % were located at the lateral position on “ramo misto” wood, and 43–50 % of the flower buds were located on spurs and/or on the central axis (Figure S2, Supplementary Materials). Bloom in 2017 averaged from 140 flower buds on the trees that were adjusted to 2.1 fruits/cm2 to 125 flower buds on the trees that were adjusted to 7.8 fruits/cm2 (Figure S2, Supplementary Materials). In 2018, the trees which held 2.1 fruits/cm2 on average throughout the growing season gave rise to 289 flower buds, whereas, at the other crop loads, the 2018 flower bud numbers were 215, 179, and 145 for crop loads 4.1, 6.0, and 7.8 fruits/cm2. The difference in buds from 2017 to 2018 was much higher in the trees with lower crop loads compared to heavier cropped trees. Trees in the 2.1 category had a difference of nearly 150 buds from 2017 to 2018, whereas, in the 7.8 category, the difference was about 20 buds (Figure S2, Supplementary Materials). Fruit set was also not significantly affected by crop load, both in the number of fruits and percentage of flowers set. The number of fruits counted on the experimental trees followed a descending trend from lowest to highest crop load, ranging from 126 to 110, 106, and 74 fruits/tree. The percentage of flowers set with fruits per tree did not follow a pattern and ranged from 7.5% at 2.1, to 9.0% at 4.0, 10.2% at 6.0, and 9.9% at 7.8 fruits/cm2.

4. Discussion

4.1. Crop Load Effect on Yield and Fruit Size

Crop loads were manually induced to a range of thresholds from a low 2.1 fruits/cm2 TCSA to the highest available, to examine its effect on production and fruit size in this new cultivar. Higher crop loads were not available as the orchard was still young (fifth leaf) and this cultivar typically will only set one to two fruits per cluster and tends to self-thin. The crop load ranges examined in this study resemble the thresholds seen in previous literature on cv. “Honeycrisp” [20,22].
Increased crop loads led to an increased yield per tree and per hectare. Crop loads 4.1, 6.0, and 7.8 reached and/or exceeded 50 MT/ha (Table 1) in 2017, making them potential targets for management strategies. Radivojevic et al. [43] concluded that both “Braeburn” and “Gala” could be loaded up to 13 fruits/cm2 TCSA in their third growing season to achieve this 50 MT/ha goal. This crop load is clearly much higher than what was assessed here, and what is demonstrated throughout literature. De Salvador et al. [44] set cropping standards for “Golden Delicious” at about 6 fruits/cm2, with an excessive threshold above 8 fruits/cm2, although other factors, like fruit quality and return bloom, must also be considered to determine an optimal crop load threshold.
Fruit size distributions showcase a decreasing shift in size with increased crop loads, as well as with fruit weight and maturity (Figure 1 and Figure 2), which is similar to findings in similar experiments and reviews [9,26,44,45]. Smaller fruit and, therefore, moderate to high crop loads may be desirable for “WA38” as it can produce considerably large fruit that may be difficult to handle for packaging and shipping operations. Excessive fruit size was also linked to quality disorders like splits and bitter pit [46]. Higher percentages of larger fruit were found in lower crop loads than in higher crop loads potentially due to reduced competition for resources during cell division, a period of high carbon demand and a determining stage for fruit size [47,48]. The trees were also relatively young, being five (2017) and six (2018) years old at the time of the trial. In fact, this trend of low crop density and large fruit size was observed in both 2017 and 2018. Fruit from the lowest cropped trees in 2017 exhibited the largest fruit at harvest (Figure 1); however, in 2018, these trees then demonstrated potential biennial tendencies, leading to a higher cropping density and, thus, much smaller fruit when compared to the other crop load categories (Figure 2). This large shift in production from year to year may negate low crop loads as a potential management strategy. Crop loads induced at 6.0 and 7.8 fruits/cm2 in 2017 appear to provide relatively stable production and fruit size from year to year (Table 1 and Table 2, Figure 1 and Figure 2). When assessed for bienniality, the only crop load that demonstrated “biennial” tendencies was the 2.1 fruits/cm2 category, while the rest of the higher crop loads were considered “consistent” bearers (Table S2, Supplementary Materials).

4.2. Crop Load Effect on Fruit Quality

With respect to fruit quality parameters, similar results were observed when comparing our results and previous literature reviews [9]. Overall, fruit quality diminished with increasing crop load. Commercial/marketing standards for “WA38” are yet to be set, but comparisons to other similar cultivars, like “Honeycrisp” (“WA38” parent), and within the cultivar across different crop loads can provide information as to determine optimal management strategies for “WA38” to ensure high fruit quality.
Maturity levels measured by the DA meter [35] highlighted a wide range of maturation across these four crop loads (Figure 3). Maturity by IAD was two times more advanced in the lowest crop load when compared with the highest (Table 3). According to the IAD levels, the higher crop loads would appear to have a higher storage potential, as maturity is delayed with increased fruit density on the tree [9,20]. Maturity was advanced in lower crop loads in both “Braeburn” and “Gala” [43]. Starch ratings did not mirror the IAD differences, but Doerflinger et al. [49] suggested that starch is a better indicator of seasonal accumulation rather than a harvest indicator and, thus, it may not be the most reliable index to assess maturity, and it may be better to associate it with other metrics. Robinson and Watkins [33] noted an increase in maturity with increased crop loads, although this was assessed by internal ethylene concentration (IEC), as opposed to IAD measurements in this trial and in the one reported by Serra et al. [20].
Similar fruit quality trends were observed compared to Robinson and Watkins’ [33] results, with respect to SSC, firmness, and TA reductions in “Honeycrisp” harvested from heavily cropped trees. Their explanation for this was not due to lack of maturation, but due to diminished L:F ratios [33]. “WA 38” L:F ratios did diminish with increasing crop load in the present study (Table 4); thus, this could potentially explain this relationship as well. Previous literature showed a diminishing trend in SSC with increasing crop load of “Elstar” in Norway [50]. Sensory analyses on apples demonstrated consumers’ ability to detect differences in sweetness at about 1.0 Brix [51]. Therefore, fruit in crop load range 4.1–7.8 fruits/cm2 would be noticeably less sweet than the fruit from the lowest crop load (Table 3). Nonetheless, with ideal “Honeycrisp” levels given at about 13.0 Brix [52], these higher crop loads are still yielding marketable and potentially sweet fruit, although these values would be expected to increase throughout storage as starch degradation and ripening advance. Firmness and dry matter values were higher in fruit from lower crop loads, where a significant difference occurred between the 4.1 and 6.0 crop load levels (Table 3). Opara et al. [53] observed an increase in fruit firmness and weight in “Gala” apples grown on trees with a low crop density (not numerically defined in that paper). Higher firmness, SSC, and dry matter content was also seen in lower crop loads in Wünsche et al.’s [45] experiment with cv. “Braeburn”, supporting quality trends observed in our trial with “WA38”. Crop load ranges for optimum fruit quality may be specific to cultivar and growing region, as cultural conditions and environmental factors can significantly alter tree physiology [54].
In Robinson and Watkins’ [33] and Serra et al.’s [20] studies, a negative impact on color was noticed with increased crop loads. Additionally, Stopar et al.’s [55] results showed increased fruit color on lower cropped trees. However, due to insignificant differences in fruit color coverage across crop loads, our results do not indicate a cropping threshold for superior red coloration, since this variety does not have an issue in this regard, although color was shown to be dependent on many factors like growing region, weather, training system, rootstock, pruning, and fruiting position in “WA38”. The lack of color differences in this analysis may be due to the fact that the fruits chosen for quality assessment were all selected for optimal external quality and between the sizes of 80 and 90 mm. These categories were selected with the intent of reducing variability related to fruit size. Fruits that were more poorly colored were found to be of smaller diameter and on the trees with higher crop loads (Figure S1, Supplementary Materials).
The increased fruit size and advanced maturity in the 2.1 fruits/cm2 category may explain the increased level of stem splits that was observed (data not shown). However, from a production and quality standpoint, such a low level of cropping density is not advised for “WA38”. The 6.0 fruits/cm2 category contained the least number of culls and highest number of fancy-ranked fruits in 2017 and 2018 (Figure 4 and Figure 5); this may be a suggested cropping density for a high percentage of marketable fruit.
Crop load recommendations for “Honeycrisp” in WA and Nova Scotia were maintained around 5 or 6 fruits/cm2 of TCSA as well [20,22]. However, given Honeycrisp’s high fruit setting ability, Robinson et al. [56] proposed that a crop load around 8 fruits/cm2 of TCSA could be feasible for consistent commercial yields, regardless of diminished floral buds in the years “off”. “WA38”, given its type IV habit, tends to set fruit terminally, and will usually only set one to two fruits per cluster. Thus, if high fruit loads diminish return bloom numbers in the following year [21], WA38’s low fruit set nature (one to two fruits per cluster) could reduce cropping potential. However, with the application of “click pruning”, this could reduce fluctuation from year to year. Furthermore, high crop loads were hard to find and maintain due to the self-thinning nature of “WA38”. With reduced fruit quality and size, a crop load of 7.8 fruits/cm2 may not prove to be less ideal for “WA38”, although, given our data, the return bloom and yield numbers do not indicate a high potential for alternate bearing at this threshold (Table 2, Table S2 and Figure S2, Supplementary Materials).

4.3. Crop Load Effect on Vegetative Parameters

Crop load management is of utmost importance for growers desiring a balanced tree with large, consistent, high-quality yields. The vegetative response to an increasing crop load was shown to decrease leaf area, vegetative dry matter, and shoot, root, and trunk growth [9,57]. In our study, there were no significant effects on leaf area, leaf number, or LAI due to crop load adjustments. At these moderate crop load levels, it could be hypothesized that there would be no negative influence on vegetation. Palmer et al. [26] also observed this lack of significant leaf area reduction due to increased fruiting. Further research is needed with higher crop load categories to determine if a negative vegetative threshold exists, and at what level this impacts “WA38”.
Different crop loads resulted in varying LA:F and L:F ratios. As crop load increased, a lesser amount of leaves and leaf area was available for each fruit. Increased cropping leads to inter-fruit competition of resources. Higher competition amongst sinks can lead to greater variation and diminished quality in fruit composition and quality, especially when carbohydrate sources are limited [58]. This is potentially why fruit from higher crop load thresholds exhibited inferior quality, as less photosynthates would be available for each fruit as the L:F and LA:F ratios diminished.

4.4. Crop Load Effect on Leaf and Fruit Mineral Composition

Reproductive and vegetative sinks are in competition for resources throughout the growing season. High fruit sink strength plays a key role in acquiring resources for high-quality fruit. Wünsche et al. [45] determined that crop load has a strong relationship with carbon and water allocation and how they are distributed to both fruit and leaves [46]. Nutrient deficiencies in leaves can lead to a reduction in yield [59]. High crop loads were shown to reduce leaf area and leaf weight, along with increasing chlorophyll content in peach leaves [60]. In our trial, leaf area and leaf weight (Table 4) were not significantly affected by crop load.
With respect to mineral analysis, Smith [61] stated that an increase in crop load generally leads to an increase in leaf N, P, Ca, and Mg, along with a decrease in K. Some of these trends were observed in our trial with an increase in N and a decrease in K. Additionally, with respect to macro-nutrients, a slight increase was noted in S with the highest crop load. Total N in the leaves sampled were significantly different between the 4.1 and 6.0 fruits/cm2 crop loads, indicating a potential cropping intensity for when leaves start to demand higher levels of N. However, there were no significant differences across crop loads with regard to SPAD units (Table S1, Supplementary Materials). Higher N in the leaves could be the result of the compensatory effect increased crop loads have on photosynthesis [26,62] or just a natural attitude to accumulate more nitrogen of this variety. However, none of the crop load treatments indicated a deficiency in leaf N. A linear increase of leaf N with crop load was affirmed by Wünsche and Ferguson [9] and Samuoliene et al. [63].
Leaf K was significantly reduced with increasing crop load. Atay [59] obtained similar results when adjusting trees to crop loads of 3.5, 3.9, and 5.1 fruits/cm2; leaf K decreased linearly as fruit load was increased. This was attributed to the large sink strength of fruit for potassium [24,59,61]. Samuoliene et al. [63] did not observe this inverse relationship between leaf K and crop load, although the various interacting rootstocks in that trial may have played a role in obscuring this trend. Havis and Gilkeson [64] indicated that, under high potash supply, this trend may not be detected as well. In our trial, potassium ranged from 2.49–2.04 %. Deficiency levels are noted to range from 0.8–1.5% [40,41]. Although increased crop load may reduce leaf K, it was potentially not an issue given the standard commercial fertilizing applications this orchard received. Fruit K also decreased with increased fruit load (Table 6). This may be due to a dilution effect, as there is a limited amount of K and a higher amount of fruit to disperse the K across in higher cropped trees. Fruit Ca, however, did not exhibit a significant reduction at lower crop loads, as larger fruit from “Honeycrisp” demonstrated in the past, which led to widespread bitter pit issues [65].
Atay [59] observed a reduction in leaf Mn with increasing fruit load. Although all of our crop loads yielded sub-optimal Mn levels, none of them were significantly different from each other nor did they fall below the deficiency levels. Leaf Cu concentration peaked at the highest crop load, while leaf B seemed to reach its maximum a 6.0 fruits/cm2 with a concentration significantly different from the other crop load categories. Similar to N demand in leaves, Cu may increase under high cropping intensity, as they have a strong sink demand for Cu [40]. B toxicity can occur easily; thus, it is suggested only to apply B under severe deficiencies, which none of the crop load categories tested indicated [40,41]. The reduction of B in the 6.0 fruits/cm2 crop load may have been a result of the specific trees sampled, as the fruit exhibited a similar reduction in B at this level as well (Table 5 and Table 6). With respect to the leaf mineral analysis, the significant trends that were supported with previous literature were the increase of N and the decrease of K with increasing crop load due to increased demand for photosynthesis and high fruit sink strength for potassium [59,61].

4.5. Crop Load Effect on Return Bloom

Return bloom and flower bud development, other than being a cultivar genetic trait, can be affected by temperature, rootstock, branch habit, hormones, light interception, pruning, spur leaf area, and crop load [8,22,66]. Crop load management arose to enhance fruit quality, mainly size, and to ensure consistent and profitable yields [43]. When trees are cropped too heavily, biennial bearing tendencies can occur and, thus, fruit thinning is a valuable practice, especially in the “on” year, to mitigate this alternate cycle [67]. Gibberellic acid (GA) exported from seeds in developing fruits (at 3–4 WAB) is known to inhibit flower bud initiation [66]. As crop load increases, so does the presence of GA inside the fruit seeds and its inhibiting impact on return bloom. Because of this, crop load management and the removal of fruitlets is now a prominent task in the orchard to maintain consistent yields [68]. Previous research showed diminished return bloom numbers and biennial bearing tendencies at higher crop load levels of 7.5, 9.0, 11.3, 12.5, and 16.0 fruits/cm2 (TCSA) in “Honeycrisp” [20,22]. Return bloom was non-existent on “Honeycrisp” trees cropped higher than 9 fruits/cm2 [33]. Fruit set was significantly diminished at crop loads above 7.5 fruits/cm2 [20]. The number and percentage of fruit set was not significantly affected by crop load in this study, although trees that were cropped heavier had fewer apples in 2018 than lighter cropped trees (Table 2 and Figure S2, Supplementary Materials). The lack of significant differences with return bloom and fruit set in this experiment may be a result of variability across a small sample size and/or our moderate crop load levels (maximum at 7.8 fruits/TCSA cm2).
Embree et al. [22] recommended 6 fruits/cm2 TCSA for consistent annual production and sufficient return bloom in “Honeycrisp”, which coincides with our 6 fruits/cm2 crop load being the most consistent bearer that was evaluated in this trial (Table S2, Supplementary Materials). Higher crop loads with an increased sample size over multiple consecutive years needs to be evaluated in “WA38” to deduce if a cropping intensity exists where return bloom numbers begin to decrease as a function of excessive crop load and lead to biennial bearing.

5. Conclusions

“WA38” is a new variety, with many Washington State growers that planted it for the first time in 2017. Apples harvested from trees adjusted to 2.1 fruits/cm2 seem to produce a high number of culls and fruit that are more advanced in their maturity, along with demonstrating an alternate bearing potential, whereas fruit from 7.8 fruits/cm2 cropped trees were of inferior quality and lower maturity. Lower crop loads could lead to inadequate production across the orchard (~30 MT/ha), or large shifts in production from year to year, which may not be economically sustainable for growers. Increased cropping (7.8 fruits/cm2) led to higher production (~83 MT/ha) in 2017, but its inferior fruit quality may suggest this is not an ideal crop load target, although there does not seem to be a strong potential for biennial bearing at this level (Table S2, Supplementary Materials). With respect to production, fruit quality, maturity, vegetative parameters, and return bloom, an ideal crop load range for “WA38” may exist around 6 fruits/ TCSA cm2. Further research is needed to determine and verify biennial tendencies for “WA38” with increased crop load categories, as well as the impact that higher crop loads may have on vegetative and fruit quality parameters.

Supplementary Materials

The following are available online at https://www.mdpi.com/2073-4395/9/2/107/s1: Table S1: The effects of crop load on leaf SPAD units, and fruit hue and chroma from the Minolta color meter from “WA38” apple trees grown in Rock Island, Washington in 2017; Table S2: The effect of crop load on the biennial index and classification as assessed by Hoblyn et al. [69] for “WA38” trees grown in Rock Island, Washington across 2017–2018. Biennial index ratings assessed by fruit number/tree; Figure S1: The effect of crop load on fruit size and red coloration of fruit positioned on their sun exposed side (the darkest part of the apple) from “WA38” apple trees adjusted to various crop loads grown in Rock Island, Washington in 2017; Figure S2: Average flower bud count on experimental trees in the spring of 2018 (sixth leaf) and their position (terminal on “brindilla”/“ramo misto”, lateral on “ramo misto”, and spur/central axis) on “WA38” trees grown in Rock Island, WA.

Author Contributions

Conceptualization, S.M., S.S., and B.M.A.; methodology, S.M., S.S., and B.M.A.; software, S.S.; validation, S.M., S.S., and B.M.A.; formal analysis, S.M., S.S., and B.M.A.; investigation, S.M., S.S., and B.M.A.; resources, S.M.; data curation, S.S. and B.M.A.; writing—original draft preparation, B.M.A.; writing—review and editing, S.M. and S.S.; visualization, S.M., S.S., and B.M.A.; supervision, S.M.; project administration, S.M. and S.S.; funding acquisition, S.M.

Funding

This research was funded by the Washington Tree Fruit Research Commission, grant number AP14-103A and by the USDA National Institute of Food and Agriculture—Specialty Crop Research Initiative project “AppleRoot2Fruit: Accelerating the development, evaluation and adoption of new apple rootstocks” (2016-51181-25406).

Acknowledgments

The authors would like to acknowledge Stefan Roeder, Ryan Sheick, and Nicolas Vanoli for the technical support and help in data collection. The authors want to thank also Alexander Goke for his critical editing contribution.

Conflicts of Interest

The authors declare no conflicts of interest.

References

  1. Cosmic Crisp Plantings Beat Estimate. Available online: https://www.cosmiccrisp.com/news/2018/4/30/cosmic-crisp-plantings-beat-estimate (accessed on 10 January 2019).
  2. Evans, K.M.; Barritt, B.H.; Konishi, B.S.; Brutcher, L.J.; Ross, C.F. ‘WA 38’apple. HortScience 2012, 47, 1177–1179. [Google Scholar] [CrossRef]
  3. Lespinasse, J.M.; Chol, P.; Dupin, J.; Terenne, E. La conduite du Pommier: Types de Fructification, Incidence sur la conduite de l’arbre; Brochure INVUFLEC: Paris, France, 1977; p. 80. [Google Scholar]
  4. Musacchi, S.; Greene, D. Innovations in apple tree cultivation to manage crop load and ripening. In Achieving Sustainable Cultivation of Apples; Evans, K., Ed.; Burleigh Dodds Science Publishing: Cambridge, UK, 2017; pp. 195–237. [Google Scholar]
  5. Mohammadi, A.; Mahmoudi, M.J.; Rezaee, R. Vegetative and reproductive responses of some apple cultivars (Malus domestica Borkh.) to heading back pruning. Int. J AgriSci. 2013, 3, 628–635. [Google Scholar]
  6. ‘WA38’ Horticulture: Characteristics and Preliminary Results. Available online: http://treefruit.wsu.edu/web-article/wa38-horticulture/ (accessed on 10 January 2019).
  7. Celton, J.M.; Kelner, J.J.; Martinez, S.; Bechti, A.; Touhami, A.K.; James, M.J.; Durel, C.E.; Laurens, F.; Costes, E. Fruit self-thinning: A trait to consider for genetic improvement of apple tree. PLoS ONE 2014, 9, e91016. [Google Scholar] [CrossRef] [PubMed]
  8. Corelli, L.; Sansavini, S. Light interception and photosynthesis related to planting density and canopy management in apple. Acta Horticulturae (Netherlands) 1989, 243, 159–174. [Google Scholar] [CrossRef]
  9. Wünsche, J.N.; Ferguson, I.B. Crop load interactions in apple. Hort. Rev. 2005, 31, 231–290. [Google Scholar]
  10. Pallas, B.; Da Silva, D.; Valsesia, P.; Yang, W.; Guillaume, O.; Lauri, P.E.; Vercambre, G.; Génard, M.; Costes, E. Simulation of carbon allocation and organ growth variability in apple tree by connecting architectural and source–sink models. Ann. Bot. 2016, 118, 317–330. [Google Scholar] [CrossRef] [PubMed]
  11. Landsberg, J.J. Orchard Microclimate and Its Effect on The Growth Cycle of Apple Trees. Ph.D. Thesis, University of Bristol, Bristol, UK, 1974. [Google Scholar]
  12. Hansen, P. Source/sink effects in fruit: An evaluation of various elements. In Manipulation of Fruiting; Wright, C.J., Ed.; Butterworth & Co. (publishers), The Anchor Press Ltd.: Tiptree, UK, 1989; pp. 29–37. [Google Scholar]
  13. Kramer, P.J.; Kozlowski, T.T. Physiology of Woody Plants; Academic Press: New York, NY, USA, 1979. [Google Scholar]
  14. Lakso, A.N.; Wünsche, J.N.; Palmer, J.W.; Corelli Grappadelli, L. Measurement and modeling of carbon balance of the apple tree. HortScience 1999, 34, 1040. [Google Scholar] [CrossRef]
  15. Coombe, B.G. The development of fleshy fruits. Ann. Rev. Plant Physiol. 1976, 27, 207–228. [Google Scholar] [CrossRef]
  16. Goffinet, M.C.; Robinson, T.L.; Lakso, A.N. A comparison of ‘Empire’ apple fruit size and anatomy in unthinned and hand-thinned trees. J. Horticul. Sci. 1995, 70, 375–387. [Google Scholar] [CrossRef]
  17. Lakso, A.N.; Corelli Grappadelli, L. Implications of pruning and training practices to carbon partitioning and fruit development in apple. Acta Hort. 1992, 322, 231–239. [Google Scholar] [CrossRef]
  18. Williams, M.W. Chemical thinning of apples. Horticul. Rev. 1979, 1, 270–300. [Google Scholar]
  19. Delong, M.J.; Prange, K.R.; Harrison, A.P.; Embree, G.C.; Nichols, S.D.; Harrison, W.A. The influence of crop-load, delayed cooling and storage atmosphere on post-storage quality of ‘Honeycrisp™’ apples. J. Horticul. Sci. Biotechnol. 2006, 81, 391–396. [Google Scholar] [CrossRef]
  20. Serra, S.; Leisso, R.; Giordani, L.; Kalcsits, L.; Musacchi, S. Crop Load Influences Fruit Quality, Nutritional Balance, and Return Bloom in ‘Honeycrisp’ Apple. HortScience 2016, 51, 236–244. [Google Scholar] [CrossRef]
  21. Faust, M. Physiology of Temperate Zone Fruit Trees; John Wiley & Sons, Inc.: New York, NY, USA, 1989. [Google Scholar]
  22. Embree, C.G.; Myra, M.T.; Nichols, D.S.; Wright, A.H. Effect of blossom density and crop load on growth, fruit quality, and return bloom in ‘Honeycrisp’ apple. HortScience 2007, 42, 1622–1625. [Google Scholar] [CrossRef]
  23. Link, H. Significance of flower and fruit thinning on fruit quality. Plant Growth Regul. 2000, 31, 17–26. [Google Scholar] [CrossRef]
  24. Tough, H.J.; Park, D.G.; Crutchley, K.J.; Bartholomew, F.B.; Craig, G. August. Effect of crop load on mineral status, maturity and quality of ‘Braeburn’ (Malus domestica Borkh.) apple fruit. In International Postharvest Science Conference Postharvest 96; ISHS: Leuven, Belgium, 1996; pp. 53–58. [Google Scholar] [CrossRef]
  25. Oliveira, C.M.; Priestley, C.A. Carbohydrate reserves in deciduous fruit trees. Horticul. Rev. 1988, 10, 403–430. [Google Scholar]
  26. Palmer, J.W.; Giuliani, R.; Adams, H.M. Effect of crop lead on fruiting and leaf photosynthesis of ‘Braeburn’/M. 26 apple trees. Tree Physiol. 1997, 17, 741–746. [Google Scholar] [CrossRef]
  27. Usenik, V.; Orazem, P.; Stampar, F. Low leaf to fruit ratio delays fruit maturity of “Lapins” sweet cherry on Gisela 5. Sci. Horticul. 2010, 126, 33–36. [Google Scholar] [CrossRef]
  28. Cittadini, E.D.; de Ridder, N.; Peri, P.L.; van Keulen, H. Relationship Between Fruit Weight and the Fruit-To-Leaf Area Ratio, At the Spur and Whole-Tree Level, for Three Sweet Cherry Varieties. Acta Horticult. 2008, 795, 669–672. [Google Scholar] [CrossRef]
  29. Whiting, M.D.; Lang, G.A. ‘Bing’ sweet cherry on the dwarfing rootstock Gisela 5′: Thinning affects fruit quality and vegetative growth but not net CO2 exchange. J. Am. Soc. Horticul. Sci. 2004, 129, 407–415. [Google Scholar] [CrossRef]
  30. Mohamed, M.; Fayed, T.; Hussein, A.; Maged, S.M. Effect of Some Pruning Applications on Leaf to Fruit Ratio, Yield and Fruit Quality of “Florda Prince” Peach Trees. J. Horticul. Sci. Ornamental Plants 2014, 6, 18–26. [Google Scholar]
  31. Corelli-Grappadelli, L.C.; Lakso, A.N.; Flore, J.A. Early season patterns of carbohydrate partitioning in exposed and shaded apple branches. J. Am. Soc. Horticul. Sci. 1994, 119, 596–603. [Google Scholar] [CrossRef]
  32. Jackson, J.E. Utilization of light resources by HDP systems. In Symposium on High Density Planting; International Society for Horticultural Science: Leuven, Belgium, 1976; pp. 61–70. [Google Scholar]
  33. Robinson, T.L.; Watkins, C.B. Cropload of ‘Honeycrisp’ affects not only fruit size but many quality attributes. New York Fruit Quart. 2003, 11, 7–10. [Google Scholar]
  34. Costes, E.; Lauri, P.E.; Regnard, J.L. Analyzing fruit tree architecture: Implications for tree management and fruit production. Horticul. Rev. 2006, 32, 1–61. [Google Scholar]
  35. Ziosi, V.; Noferini, M.; Fiori, G.; Tadiello, A.; Trainotti, L.; Casadoro, G.; Costa, G. A new index based on vis spectroscopy to characterize the progression of ripening in peach fruit. Postharvest Biol. Technol. 2008, 49, 319–329. [Google Scholar] [CrossRef]
  36. DeLong, J.; Prange, R.; Harrison, P.; Nichols, D.; Wright, H. Determination of optimal harvest boundaries for Honeycrisp™ fruit using a new chlorophyll meter. Can. J. Plant Sci. 2014, 94, 361–369. [Google Scholar] [CrossRef]
  37. Hanrahan, I. Starch Iodine Index Honeycrisp. Washington Tree Fruit Research Commission. 24 April 2015. Available online: https://www.treefruitresearch.com/resources-a-downloads/starch-iodine-index-for-honeycrisp (accessed on 18 February 2019).
  38. Knerl, A.; Anthony, B.; Serra, S.; Musacchi, S. Optimization of Leaf Area Estimation in a High-Density Apple Orchard Using Hemispherical Photography. HortScience 2018, 53, 799–804. [Google Scholar] [CrossRef]
  39. Wilson, P.J.; Thompson, K.E.N.; Hodgson, J.G. Specific leaf area and leaf dry matter content as alternative predictors of plant strategies. New Phytol. 1999, 143, 155–162. [Google Scholar] [CrossRef]
  40. Hanson, E. Apple Nutrition: Diagnosing and Avoiding Nutrient Deficiencies. Michigan State University Extension. Available online: https://www.canr.msu.edu/uploads/files/Applenutrition-EricHanson.pdf (accessed on 18 February 2019).
  41. Peck, G.M.; Andrews, P.K.; Reganold, J.P.; Fellman, J.K. Apple orchard productivity and fruit quality under organic, conventional, and integrated management. HortScience 2006, 41, 99–107. [Google Scholar] [CrossRef]
  42. Dow, A.I. Critical Nutrient Ranges in Northwest Crops; In WREP-Western Region Extension Publication-Cooperative Extension Service (USA); Washington State University: Pullman, WA, USA, 1980. [Google Scholar]
  43. Radivojevic, D.D.; Milivojevic, J.M.; Oparnica, C.D.; Vulic, T.B.; Djordjevic, B.S.; ERCİŞLİ, S. Impact of early cropping on vegetative development, productivity, and fruit quality of Gala and Braeburn apple trees. Turk. J. Agric. For. 2014, 38, 773–780. [Google Scholar] [CrossRef]
  44. De Salvador, F.R.; Fisichella, M.; Fontanari, M. Correlations between fruit size and fruit quality in apple trees with high and standard crop load levels. J. Fruit Ornam. Plant Res. 2006, 14, 113–122. [Google Scholar]
  45. Wünsche, J.N.; Palmer, J.W.; Greer, D.H. Effects of crop load on fruiting and gas-exchange characteristics of “Braeburn”/M.26 apple trees at full canopy. J. Am. Soc. Horticul. Sci. 2000, 125, 93–99. [Google Scholar] [CrossRef]
  46. Ferguson, I.B.; Watkins, C.B. Crop load affects mineral concentrations and incidence of bitter pit in ‘Cox’s Orange Pippin’ apple fruit. J. Am. Soc. Horticul. Sci. 1992, 117, 373–376. [Google Scholar] [CrossRef]
  47. Lakso, A.N.; Robinson, T.L. Principles of orchard systems management optimizing supply, demand and partitioning in apple trees. Acta Hortic. 1997, 451, 405–416. [Google Scholar] [CrossRef]
  48. Lakso, A.N.; Robinson, T.L.; Pool, R.M. Canopy microclimate effects on patterns of fruiting and fruit development in apples and grapes. In Manipulation of Fruiting; 47th Nottingham Easter School: Butterworths, UK, 1989; pp. 263–274. [Google Scholar]
  49. Doerflinger, F.C.; Miller, W.B.; Nock, J.F.; Watkins, C.B. Relationships between starch pattern indices and starch concentrations in four apple cultivars. Postharvest Biol. Technol. 2015, 110, 86–95. [Google Scholar] [CrossRef]
  50. Meland, M. Effects of different crop loads and thinning times on yield, fruit quality, and return bloom in Malus × domestica Borkh. ‘Elstar’. J. Horticul. Sci. Biotech. 2009, 84, 117–121. [Google Scholar] [CrossRef]
  51. Harker, F.R.; Marsh, K.B.; Young, H.; Murray, S.H.; Gunson, F.A.; Walker, S.B. Sensory interpretation of instrumental measurements 2: Sweet and acid taste of apple fruit. Postharvest Biol. Technol. 2002, 24, 241–250. [Google Scholar] [CrossRef]
  52. Warner, G. Crop Load Affects Flavor of Honeycrisp. Available online: http://www.goodfruit.com/crop-load-affects-flavor-of-honeycrisp/ (accessed on 18 February 2019).
  53. Opara, L.U.; Studman, C.J.; Banks, N.H. Physico-mechanical Properties of “Gala” apples and Stem-end Splitting as Influenced by Orchard Management Practices and Harvest Date. J. Agric. Eng. Res. 1997, 68, 139–146. [Google Scholar] [CrossRef]
  54. Gallardo, R.K.; Hanrahan, I.; Hong, Y.A.; Luby, J.J. Crop load management and the market profitability of ‘Honeycrisp’ apples. HortTechnology 2015, 25, 575–584. [Google Scholar] [CrossRef]
  55. Stopar, M.; Bolcina, U.; Vanzo, A.; Vrhovsek, U. Lower crop load for cv. Jonagold apples (Malus× domestica Borkh.) increases polyphenol content and fruit quality. J. Agric. Food Chem. 2002, 50, 1643–1646. [Google Scholar] [CrossRef]
  56. Robinson, T.; Lopez, S.; Iungerman, K.; Reginato, G. Crop load management for consistent production of Honeycrisp apples. N. Y. Fruit Q. 2009, 17, 24–28. [Google Scholar]
  57. Lenz, F. Fruit effects on transpiration and dry matter production in apples. In The Regulation of Photosynthesis in Fruit Trees; Symp. Procee Publ.; New York State Agricultural Experiment Station: Geneva, NY, USA, 1986; pp. 101–104. [Google Scholar]
  58. Parker, A.K.; Hofmann, R.W.; van Leeuwen, C.; Mclachlan, A.R.G.; Trought, M.C.T. Leaf area to fruit mass ratio determines the time of veraison in Sauvignon Blanc and Pinot Noir grapevines. Aust. J. Grape Wine Res. 2014, 20, 422–431. [Google Scholar] [CrossRef]
  59. Atay, E. Which Nutrients in The Leaf Decrease Linearly as Fruit Load Increases in Apples? A Preliminary Study. Presented at the International Academic Research Congress, Antalya, Turkey, 24–25 June 2016; pp. 656–659. [Google Scholar]
  60. Nii, N. Changes of starch and sorbitol in leaves before and after removal of fruits from peach trees. Ann. Bot. 1997, 79, 139–144. [Google Scholar] [CrossRef]
  61. Smith, P.F. Mineral analysis of plant tissues. Ann. Rev. Plant Physiol. 1962, 13, 81–108. [Google Scholar] [CrossRef]
  62. Palmer, J.W. Effects of varying crop load on photosynthesis, dry matter production and partitioning of Crispin/M. 27 apple trees. Tree Physiol. 1992, 11, 19–33. [Google Scholar] [CrossRef] [PubMed]
  63. Samuolienė, G.; Viškelienė, A.; Sirtautas, R.; Kviklys, D. Relationships between apple tree rootstock, crop-load, plant nutritional status and yield. Sci. Horticul. 2016, 211, 167–173. [Google Scholar] [CrossRef]
  64. Havis, L.; Gilkeson, A.L. Interrelationships of nitrogen and potassium fertilization and pruning practice in mature peach trees. In Proceedings of the American Society for Horticultural Science, Minneapolis, MN, USA, 10–12 September 1951; Amer Soc Horticultural Science: Alexandria, VA, USA, 1951; pp. 24–30. [Google Scholar]
  65. Telias, A.; Hoover, E.; Rosen, C.; Bedford, D.; Cook, D. The effect of calcium sprays and fruit thinning on bitter pit incidence and calcium content in ‘Honeycrisp’apple. J. Plant Nutr. 2006, 29, 1941–1957. [Google Scholar] [CrossRef]
  66. Koutinas, N.; Pepelyankov, G.; Lichev, V. Flower induction and flower bud development in apple and sweet cherry. Biotechnol. Biotec. Eq. 2010, 24, 1549–1558. [Google Scholar] [CrossRef]
  67. Monselise, S.P.; Goldschmidt, E.E. Alternate bearing in fruit trees. Horticul. Rev. 1982, 4, 128–173. [Google Scholar]
  68. Treder, W. Crop loading studies with ‘Jonagold’apple tree. J. Fruit Ornamental Plant Res. 2010, 18, 59–69. [Google Scholar]
  69. Hoblyn, T.N.; Grubb, N.H.; Painter, A.C.; Wates, B.L. Studies in Biennial Bearing—I. J. Pomol. Horticul. Sci. 1937, 14, 39–76. [Google Scholar] [CrossRef]
Figure 1. Distribution (% fruit) of fruit size (mm) by each crop load (2.1, 4.1, 6.0, 7.8 fruits/cm2) level at harvest for “WA38” apples grown in Washington State, Wenatchee area in 2017.
Agronomy 09 00107 g001
Figure 2. Distribution (% fruit) of fruit size (mm) by each crop load (2.1, 4.1, 6.0, 7.8 fruits/cm2) level induced in 2017 at harvest for “WA38” apples grown in Washington State, Wenatchee area in 2018. Crop loads were manually induced in 2017, but the trees were left to bear naturally in 2018.
Agronomy 09 00107 g002
Figure 3. Distribution (% fruit) of index of absorbance difference (IAD) measurements by DA meter [35] for “WA38” apples grown in the different crop load (2.1, 4.1, 6.0, 7.8 fruits/cm2) levels observed immediately after harvest (no storage) in Washington State, Wenatchee area in 2017.
Agronomy 09 00107 g003
Figure 4. Fruit class rankings (extra fancy, fancy, and cull) for “WA38” fruit harvested in the fall of 2017 in Washington State, Wenatchee area, across each crop load (2.1, 4.1, 6.0, 7.8 fruits/cm2) category. All fruits per trial tree were rated immediately after harvest on 9 October 2017.
Agronomy 09 00107 g004
Figure 5. Fruit class rankings (fancy and cull) for “WA38” fruit harvested in the fall of 2018 in Washington State, Wenatchee area, across each crop load (2.1, 4.1, 6.0, 7.8 fruits/cm2) category that was set in 2017. All fruits per trial tree were rated immediately after harvest on 21 September 2018. Fancy and extra fancy rankings were combined due to a minimal number of extra fancy fruit. Crop loads were not induced in 2018; this was the natural bearing tendency after crop load was induced in 2017.
Agronomy 09 00107 g005
Table 1. The effects of crop load on the number (no.) of apples/tree, yield (kg/tree), average fruit weight (g), and production (MT/ha) for “WA38” apples grown in Washington State, Wenatchee area in 2017. TCSA—trunk cross-sectional area.
Crop Load (no. fruits/cm2 TCSA)Fruit (no.)/tree 2017Yield (kg/tree) 2017Average Fruit Weight a (g) 2017Yield (MT/ha) 2017
2.126 D7.8 D303 A28.2 D
4.150 C13.3 C265 B47.8 C
6.072 B18.8 B262 B67.8 B
7.895 A23.0 A242 B82.8 A
Significance************
ns, *, **, *** indicate no significance or significance at p-values of <0.05, <0.01, or <0.001; a Student–Newman–Keuls (SNK) test was used for mean comparisons; means in columns with the same letter indicate non-significance at p < 0.05; a average fruit weight was derived from the total yield divided by the number of apples harvested per tree.
Table 2. The effects of induced crop load in 2017 on the number of apples/tree, yield (kg/tree), average fruit weight (g), and production (MT/ha) for “WA38” apples grown in Washington State, Wenatchee area in 2018.
Crop Load (no. fruits/cm2 TCSA) in 2017Fruit (no.)/tree 2018Yield (kg/tree) 2018Average Fruit Weight a (g) 2018Yield (MT/ha) 2018
2.111424.4521388.0
4.19021.7823578.3
6.010225.5124591.8
7.87319.2128069.1
Significancensnsnsns
ns, *, **, *** indicate no significance or significance at p-values of <0.05, <0.01, or <0.001; a Student–Newman–Keuls (SNK) test was used for mean comparisons; means in columns with the same letter indicate non-significance at p < 0.05; crop loads were induced in 2017, and left to bear naturally in 2018 to assess bienniality; a average fruit weight was derived from the total yield divided by the number of fruit harvested per tree.
Table 3. The effects of crop load on fruit quality and maturity (according to index of absorbance difference (IAD) by DA meter) immediately after harvest for “WA38” apples grown in Washington State, Wenatchee area in 2017. SSC—soluble solid content.
Crop load (no. fruits/cm2 TCSA)Average Fruit weight aIAD bRed Overcolor (%)Average Red Intensity (1–5)Firmness (kg/cm2)SSC (°Brix)Dry Matter (%)Starch c (1–6)Titratable Acidity (malic acid %)
2.1302 A0.45 D96.24.03 A9.07 A14.59 A16.02 A1.770.80 A
4.1282 B0.60 C96.54.02 A8.84 B13.40 B15.33 B1.560.54 B
6.0282 B0.78 B94.63.81 B8.23 C13.29 B14.50 C1.660.54 B
7.8277 B0.93 A95.63.95 A8.25 C13.18 B14.39 C1.550.56 B
Significance******ns*********ns**
ns, *, **, *** indicate no significance or significance at p-values of < 0.05, < 0.01, or < 0.001; a Student–Newman–Keuls (SNK) test was used for mean comparisons; means in columns with the same letter indicate non-significance at p < 0.05; fruit quality analysis parameters were assessed on 80–90-mm fruit; a average fruit weight was derived from the fruit that were selected for fruit quality analysis and were weighed individually; b index of absorbance difference measured by DA meter [35]; c starch–iodine scale from Washington Tree Fruit Research Commission for “Honeycrisp” [37].
Table 4. The effects of crop load on total leaf area (TLA) (cm2) per tree, total leaf number/tree, leaf-area (cm2)-to-fruit ratio (LA:F), leaf-number-to-fruit ratio (L:F), leaf area index (LAI) (m2/m2), specific leaf area (SLA) (cm2/g), average leaf area (cm2), and individual leaf width (cm) for “WA38” apple trees grown in Washington State, Wenatchee area in 2017.
Crop Load (no. fruits/cm2 TCSA)Total Leaf Area (TLA) (cm2) per treeTotal Leaf no. per TreeLeaf-Area-to-Fruit (LA:F) ratioLeaf-to-Fruit (L:F) RatioLAI (m2/m2)SLA (cm2/g)Leaf Area (cm2) per Individual LeafIndividual Leaf Width (cm)TCSA Annual Growth 2017–2018 (cm2)
2.13650612681375 A48 A1.3143.328.95.011.78
4.1362721367707 B27 B1.3047.826.74.891.62
6.0424921408585 B19 BC1.5243.830.55.091.12
7.8404101470401 B15 C1.4544.026.64.791.02
Significancensns******nsNsnsnsns
ns, *, **, *** indicate no significance or significance at p-values of <0.05, <0.01, or <0.001; a Student–Newman–Keuls (SNK) test was used for mean comparisons; means in columns with the same letter indicate non-significance at p < 0.05.
Table 5. The effects of crop load on leaf mineral composition (macro- and micro-nutrients) in leaves sampled from “WA38” trees in the summer of 2017 in Washington State, Wenatchee area.
Macro-NutrientsMicro-Nutrients
Crop Load (no. fruits/cm2 TCSA)Total N (%)P (%)K (%)S (%)Ca (%)Mg (%)Zn (ppm)Mn (ppm)Cu (ppm)Fe (ppm)B (ppm)
2.12.06 B0.332.49 A0.14 B1.900.2815.231.78.77 B183.832.7 A
4.12.09 B0.312.23 B0.14 B1.870.2913.932.58.56 B211.731.2 A
6.02.32 A0.292.04 B0.14 B2.020.2813.630.48.98 B189.826.8 B
7.82.30 A0.292.07 B0.15 A2.070.2914.630.39.63 A201.730.6 A
Significance**ns*****nsnsnsns*ns**
CNR a1.7–2.0<0.10.8–1.50.01–0.025<1.20.2–0.315–2025–305–6<10020–25
Deficiency threshold2.00.11.0-0.50.215.020.04.025.025.0
ns, *, **, *** indicate no significance or significance at p-values of <0.05, <0.01, or <0.001; a Student–Newman–Keuls (SNK) test was used for mean comparisons; means in columns with the same letter indicate non-significance at p < 0.05; n = 6 technical rep samples per crop load category; a critical nutrient range (CNR) for apple leaves [42]. Values above or in range indicate sufficient supply, while those below range indicate deficiency [41]; b deficiency thresholds sourced from Reference [40].
Table 6. The effects of crop load on fruit mineral composition (macro- and micro-nutrients) in fruit harvested from “WA38” trees in the fall of 2017 in Washington State, Wenatchee area.
Macro-NutrientsMicro-Nutrients
Crop load (no. fruits/cm2 TCSA)Total N (%)P (%)K (%)S (%)Ca (%)Mg (%)Zn (ppm)Mn (ppm)Cu (ppm)Fe (ppm)B (ppm)
2.10.240.08 A0.82 A0.020.030.040.802.06 B2.7827.420.2 A
4.10.220.07 B0.78 B0.020.030.040.692.18 B3.0614.916.1 AB
6.00.230.06 C0.72 C0.020.030.041.262.45 B2.8415.312.3 C
7.80.250.06 C0.67 D0.020.040.040.862.95 A2.8520.414.1 BC
Significancens******nsnsnsns**nsns**
ns, *, **, *** indicate no significance or significance at p-values of <0.05, <0.01, or <0.001; a Student–Newman–Keuls (SNK) test was used for mean comparisons; means in columns with the same letter indicate non-significance at p < 0.05; n = 6 samples per crop load category.

