Article

Transcriptome Profiles of Contrasting Potato (Solanum tuberosum L.) Genotypes Under Water Stress

1
National Institute for Agriculture Research (INIA), La Platina, Casilla 439-3, Correo Central, Santiago, Chile
2
Centro de Biotecnología Vegetal, Universidad Andres Bello, República 217, Santiago, Chile
3
Universidad Estatal de O’Higgins, Av. Cachapoal N 90, Rancagua, Chile
4
Agriculture and Agri-Food Canada, Fredericton Research and Development Centre, P.O. Box 20280, 850 Lincoln Rd., Fredericton, New Brunswick E3B 4Z7, Canada
*
Authors to whom correspondence should be addressed.
Agronomy 2019, 9(12), 848; https://doi.org/10.3390/agronomy9120848
Submission received: 27 August 2019 / Revised: 8 November 2019 / Accepted: 26 November 2019 / Published: 4 December 2019
(This article belongs to the Special Issue Potato Genetics and Breeding in the Genomics Era)

Abstract

:
The potato is susceptible to water stress at all stages of development. We examined four clones of tetraploid potato, Cardinal, Desirée, Clone 37 FB, and Mije, from the germplasm bank of the National Institute of Agricultural Research (INIA) in Chile. Water stress was applied by suspending irrigation at the beginning of tuberization. Stomatal conductance, and tuber and plant fresh and dry weight were used to categorize water stress tolerance. Cardinal had a high susceptibility to water stress. Desirée was less susceptible than Cardinal and had some characteristics of tolerance. Mije had moderate tolerance and Clone 37 FB had high tolerance. Differential gene expression in leaves from plants with and without water stress were examined using transcriptome sequencing. Water stress-susceptible Cardinal had the fewest differentially expressed genes at 101, compared to Desirée at 1867, Clone 37 FB at 1179, and Mije at 1010. Water stress tolerance was associated with upregulation of the expression of transcription factor genes and genes involved in osmolyte and polyamine biosynthesis. Increased expression of genes encoding late embryogenesis abundant (LEA) and dehydrin proteins along with decreased expression of genes involved in nitrate assimilation and amino acid metabolism were found for clones showing water stress tolerance. The results also show that a water deficit was associated with reduced biotic stress responses. Additionally, heat shock protein genes were differentially expressed in all clones except for highly susceptible Cardinal. Together, the gene expression study demonstrates variation in the molecular pathways and biological processes in response to water stress contributing to tolerance and susceptibility.

1. Introduction

Potato (Solanum tuberosum L.), due to its high caloric, protein, and vitamin content, is today an indispensable food source, representing the third largest food crop in the world [1]. Given its limited root development, which is shallow and consequently has limited capacity for water extraction, it is considered to be a crop that is susceptible to water stress in all stages of development, from its emergence to tuber bulking. However, water stress early in crop development reduces the number and size of leaves, and plant height, which ultimately affects the yield and quality of the plant [2].
The water stress impact on plant yield is related to decreased photosynthesis, which is a product of stomatal closure, reduced photosynthetic area, altered osmotic potential of the cell, and decreased CO2 assimilation rate. These processes lead to reduced carboxylation of ribulose-1,5-bisphosphate and promotes the production of reactive oxygen substances (ROS) that generate oxidative stress [3]. The great genetic diversity of native potato species represents an important genetic resource in the search for traits of interest in breeding commercial varieties, including tolerance to water stress [4].
Andean potato native species have been evaluated and characterized by their high nutritional content, variety of compounds with high antioxidant activity, and organoleptic qualities that make them attractive for use as a functional food [5,6,7]. It has also demonstrated the potential of resistance and multi-resistance to viruses, bacteria, fungi, and nematodes, as well as great potential for adaptation under severe heat, high radiation, drought, frost, and nutritional deficits [6,8,9].
Water stress is the main limiting factor of the crop yield and natural distribution of plant species [10]. It comprises a complex response mechanism that results in a variety of biochemical, molecular, physiological, and morphological changes that affect plant growth, development, and productivity [11]. Water stress usually occurs together with other types of stress, such as high temperatures, high salinity, and oxidative stress, which is often reflected in similar cell signaling and regulation [12].
The identification of genetic traits and response mechanisms specific to water stress would improve the adaptation of potato to adverse conditions [13]. Several studies have focused on elucidating the involvement of genes induced by water stress and those most relevant features of tolerance [14,15]. To improve water stress tolerance, potato breeders have been limited by a complex biological system that includes the type of vegetative propagation, autotetraploidy, and high levels of heterozygosity [16]. Furthermore, it has been reported that the response can vary depending on the genotype, severity of the stress, state of plant development, and tissue assessed, so the response mechanism is not yet fully defined [17,18,19]. Nevertheless, different studies have generated much information describing various components to the adaptive response, such as proteins activating the response to stress and signaling factors, proline accumulation, accumulation of osmolytes, osmotic adjustment, ion transport alteration, increase of the efficient use of the water, increase in the oxidative metabolism, adjustment in the hormonal balance, increase in the root growth, inhibition of the foliar growth, water changes of xylem, and the maintenance of turgor [4,8].
Additionally, two main groups of genes involved in water stress response and tolerance have been described. They are made up of functional proteins, such as chaperones, late embryogenesis proteins (LEA), antifreeze proteins, and mRNA-binding proteins. One group includes key enzymes for osmolyte biosynthesis, water transport proteins, sugar and proline transporters, detoxification enzymes, and various proteases, while the other group includes regulatory proteins, such as various transcription factors, protein kinases, protein phosphatases, enzymes involved in the metabolism of phospholipids, and other signaling molecules [20].
The generation of a gene expression profile to characterize the response to stress by the RNA-seq technique provides fundamental information for the analysis of metabolic pathways, classification of patterns of expression, and discovery of new genes. It also permits the exploration of mechanisms of molecular regulation under various kinds of stress [18,19,20,21]. Studies of gene expression profiles in potato have indicated candidate drought tolerance traits in Andean-native potato clones, highlighting osmotic adjustment, changes in carbohydrate metabolism, membrane modifications, cuticle strengthening, cell rescue mechanisms, detoxification of radicals, and stabilization of proteins [8]. Additionally, some families of transcription factors with significant changes in response to severe water stress, such as bHLH, ERF, MYB, C2H2, NAC, WRKY, HD-ZIP, and bZIP, have been described [18]. Also, gene ontology (GO) analysis of upregulated functional groups during drought treatment have revealed genes related to transcription, regulation of transcription, and response to stresses, while the downregulated groups are related to proteolysis, catalytic activity, and photosynthesis. Biochemical pathways with a higher representation of differentially expressed drought response genes have also been identified in clades, such as ’carbohydrate metabolism’, ’translation’, ’amino acid metabolism’, ’folding, classification, and degradation’, and ’energy metabolism’ [21].
In this study, we evaluated transcriptomic profiles using RNA-seq in two landraces (Mije and Clone 37 FB) and two varieties (Cardinal and Desirée) with contrasting responses to water stress. Our results will be useful for the potential identification of candidate genes for marker-assisted selection within genetic improvement programs and the identification of functional groups that allow a deeper understanding of water stress tolerance mechanisms in tetraploid potato.

2. Materials and Methods

2.1. Biological Material

The potato clones used (Solanum tuberosum 2n = 4x = 48) were part of the INIA-Chile germplasm bank and were composed of four clones, Cardinal, Desirée, Mije, and Clone 37 FB, with variation in water stress tolerance in vitro [22]. The four clones were selected for their similar cycle (120 days). All of them were cultivated under in vitro conditions in Murashige and Skoog (MS) solid medium [23] (3% sucrose, pH 5.6 ± 0.1, and 7 g agar-agar). This material was used to obtain potato minitubers by the method described by Toledo et al. (1998) [24]. In order to obtain true tubers, every tuber was planted in 6-L pots for two growing seasons in 2010–2011 and 2012–2013. Finally, the multiplication of the tubers in the field during the season 2014–2015 was performed using standard conditions of agronomic management and fertilization (150 N kg N ha−1; 130 kg K2O ha−1). After harvest, every tuber was measured and used as seed.

2.2. Greenhouse Stress Assays

The greenhouse tests were established in July 2016, in 6-L pots, using four replicates per clone. Plants were grown in pots under greenhouse conditions (25 °C ± 3, 16/8 h day/night photoperiod) and two watering treatments: (Control) well-watered with 100% to 96% irrigation and (treatment) a controlled water stress cycle with a 21-day period were applied. Control pots were irrigated corresponding to a field capacity (CC) between a 100% and 96% volumetric content (VWC). For the water deficit treatment, irrigation was suspended once the first open flowers were observed (113 days after sowing), which coincides with the beginning of the tuberization in the evaluated clones. Water stress was applied at the beginning of tuberization as this was the stage most susceptible to water stress in potatoes [8]. The timing of tuberization was similar for the four clones. Potting soil moisture was monitored using EC-5 type moisture sensors (Decagon Devices Inc., Pullman, WA, USA). Volumetric soil water content (θ.% Vv) in the four potato genotypes (Cardinal, Desiree, Mije, and Clone 37 FB) was measured every day in 10 repetitions using the moisture sensors. The moisture sensor measures were used from the moment the irrigation was suspended at 113 days after sowing until the time when moisture content was reduced to approximately 50% of the volumetric content in the soil. At this time, leaf samples were taken on the third leaf of the plants (120 days after sowing). The tuber harvest was made three weeks after the beginning of water stress (134 days after sowing) in October 2016.
Drought tolerance indices were calculated using the following ratios: Mean productivity (MP) = (Yp + Ys)/2 [25]; geometric mean productivity (GMP) = (Yp × Ys) 0.5 [26]; tolerance (TOL) = Yp − Ys [27]; drought tolerance index (DTI) = (Ys × Yp )/(Yp)2 [26]; and drought susceptibility index (DSI) = [1 − (Ys/Yp)]/[1 − (SI)] [28], where stress intensity (SI) = 1 − (Ys/Yp). Yield stability index (YSI) = Ys/Yp [29]. In all these equations, Ys and Yp were calculated as the mean yield of a given clone under water stress and non-stress conditions, respectively.
The biomass measurements of fresh and dry weight (leaf, root and tuber) were quantified using a semi-analytical balance (0.01 g to 2 Kg, Radwag, Radom, Polonia). In addition, the number of tubers was counted. Stomatal conductance (gs) using the SC-1 porter (Decagon Devices Inc., Pullman, WA USA) was also measured. For the extraction of RNA, samples were taken 120 days after sowing.

2.3. Experimental Design and Statistical Analysis

The experimental design was a randomized complete block with four replicates and a factorial analysis of variance (ANOVA). The treatments were: Irrigated (control) and not irrigated at the beginning of tuberization (treatment). In order to compare the effect of water stress among clones, it was measured as treatment/control × 100. Relatives values were used to reduce the bias caused by differences in vigor between genotypes [30].
Statistical analyses were performed in R-3.5.2 (https://www.r-project.org/). The assumptions of normality and homogeneity of variances were verified using the Shapiro–Wilk and Lilliefors test (Kolmogorov–Smirnov). Significant differences between the means of the genotypes within each treatment were compared by a Tukey multiple comparison analysis (p < 0.05). Analyses and graphical visualization of the data were performed in the statistical program R, using the ggplot2, Rmisc and lattice packages. The criterion was to choose the number of clusters with the highest F value in accordance with a multivariate analysis of the variance (MANOVA).

2.4. RNA Extraction

The third leaf from the top of the plant was sampled for three of the four replicates of the plant for each cultivar and each treatment from the greenhouse for a total of 24 samples used for RNA extraction. The samples were taken once after one week under water stress, which corresponded to 120 days after sowing. For each sample, 100 mg of leaf material were sampled from the apical leaflet using a hole punch. The leaf disks were ground with plastic pestles in liquid nitrogen inside 1.5-mL Eppendorf Tubes. RNA was extracted according to the manufacturer’s instruction using a TRIzol™ Plus RNA Purification Kit (Invitrogen™ Thermo Fisher Scientific Inc, New York, NY, USA). The RNA pellet was allowed to dry and resuspended in 30 µL of DEPC water. It was incubated for 10 min at 65 °C and stored at −20 °C until analyzed.

2.5. Library Preparation and Sequencing

The libraries were prepared for the three biological replicates for each of the cultivars and treatments for a total of 24 transcriptome libraries using the TruSeq RNA kit (Illumina, San Diego, CA, USA). The mRNA was purified from 1 μg of total RNA using oligo-dT beads, and then fragmented using divalent cations at 95 °C. Reverse transcription was performed to obtain cDNA fragments of approximately 200 bp. After repair, adenylation, and ligation of the indexed adapters, the libraries were completed and amplified by PCR. The libraries were analyzed by capillary electrophoresis in the Fragment Analyzer (AATI Technologies, Markham, Ontario, Canada), and quantified by fluorometry with a Qubit 2.0 instrument, (Thermo Fisher Scientific Inc., New York, NY, USA). The libraries were sequenced on a HiSeq 2500 instrument (Illumina, San Diego, CA, USA) in paired-end mode (2 × 125bp). The raw sequencing quality statistics are presented in Supplementary Table S1.
Sequencing data were aligned to the reference genome of S. tuberosum v3_2.1.10 using the TopHat v. 2.0.9 [31] with the “fr-unstranded” library mode. The quality of the alignments was verified using the ’flagstat’ tool of the SAMtools v software. 0.1.19 [32]. Transcripts were then assembled with CuffLinks v. 2.1.1 [33], using the ITAG1.0 annotation system of S. tuberosum from Sol Genomics Network [34,35]. The assembly of the transcriptome was performed with the "multi read correct" and "bias correct" modes activated. Finally, assembled transcripts of different replicates and treatments were combined into a single reference transcriptome for each variety using the CuffMerge tool included in CuffLinks. Raw and processed transcriptome sequence data were deposited at the National Centre for Biotechnology Information Gene Expression Omnibus (NCBI GEO) accession number GSE140083. Differentially expressed genes between control and water-stressed plants were identified for each cultivar using CuffDiff, and the fragment per kilobase per million mapped reads (FPKM) was calculated [33]. FPKM was calculated for each of the three biological replicates for each cultivar and treatment and used in the CuffDiff negative binomial test for differential expression between control and water-stressed samples. The same reference genome of S. tuberosum as well as the single fused transcriptome was used as a reference for differential gene expression. Finally, differentially expressed genes in each cultivar were compared using custom perl scripts, and a single list of upregulated and downregulated genes was generated in all cultivars at the points evaluated. The log2 ratio of water stressed FPKM:control FPKM gene expression was calculated for each gene. Genes with log2 > 1 were classified as upregulated with water stress and those with log2 < −1 were classified as downregulated with water stress. TheGO terms from the iTAG1.0 annotation files were used for functional analysis using topGO [36] for the up- and downregulated genes from CuffDiff analysis. Enriched GO terms were those where p ≤ 0.05 in the topGO Fisher’s exact test. The enrichment score (−log10 (p-value)) was also calculated. Functional annotations from SpudDB [37] http://solanaceae.plantbiology.msu.edu/cgi-bin/annotation_report.cgi were used to search the scientific literature for information on the biological function of genes (Supplementary Table S2–S5).

2.6. nCounter mRNA Quantification

Multiplex analysis of the expression of genes was examined using nCounter Digital Analyzer (Nanostring Technologies, Seattle, WA, USA.). Details of the nCounter multiplex gene expression analysis are described elsewhere [38,39]. In total, 100 ng of total RNA were used for each nCounter quantification reaction. An nCounter codeset was designed for 24 random genes that were previously found to be expressed in potato leaves [40] (Supplementary Table S6). Gene expression of five housekeeping genes 18S rRNA, Cox1-B (X83206.1) [41], EF-1-alpha (AB061263.1) [42], cyclophilin (AF126551.1) [43], and actin (X55749) was measured and their geometric mean was used to normalize the gene expression of the 24 test genes. mRNA abundance was log2-transformed and averaged across replications for each cultivar and treatment combination. The nCounter data was compared to log2-transformed FPKM for the 24 genes averaged over each cultivar and treatment combination from the transcriptome sequencing data using Pearson correlation with SYSTAT v. 13 (Systat Software, San Jose, CA, USA).

3. Results

3.1. Soil Water Content

In irrigated (control) plants, the soil water content (θ) was close to 100% to 96% during the entirety of the experimental period in the four potato genotypes. In the non-irrigated soil (treatment), θ decreased by 57% to 55% until day 9, then θ decreased by 76% to 72% until day 16, and finally, θ decreased by 82% to 86% until the end of treatment (day 21) (Figure 1). The stress was continuous but gradual for a week followed by two weeks of a more intense water deficit.

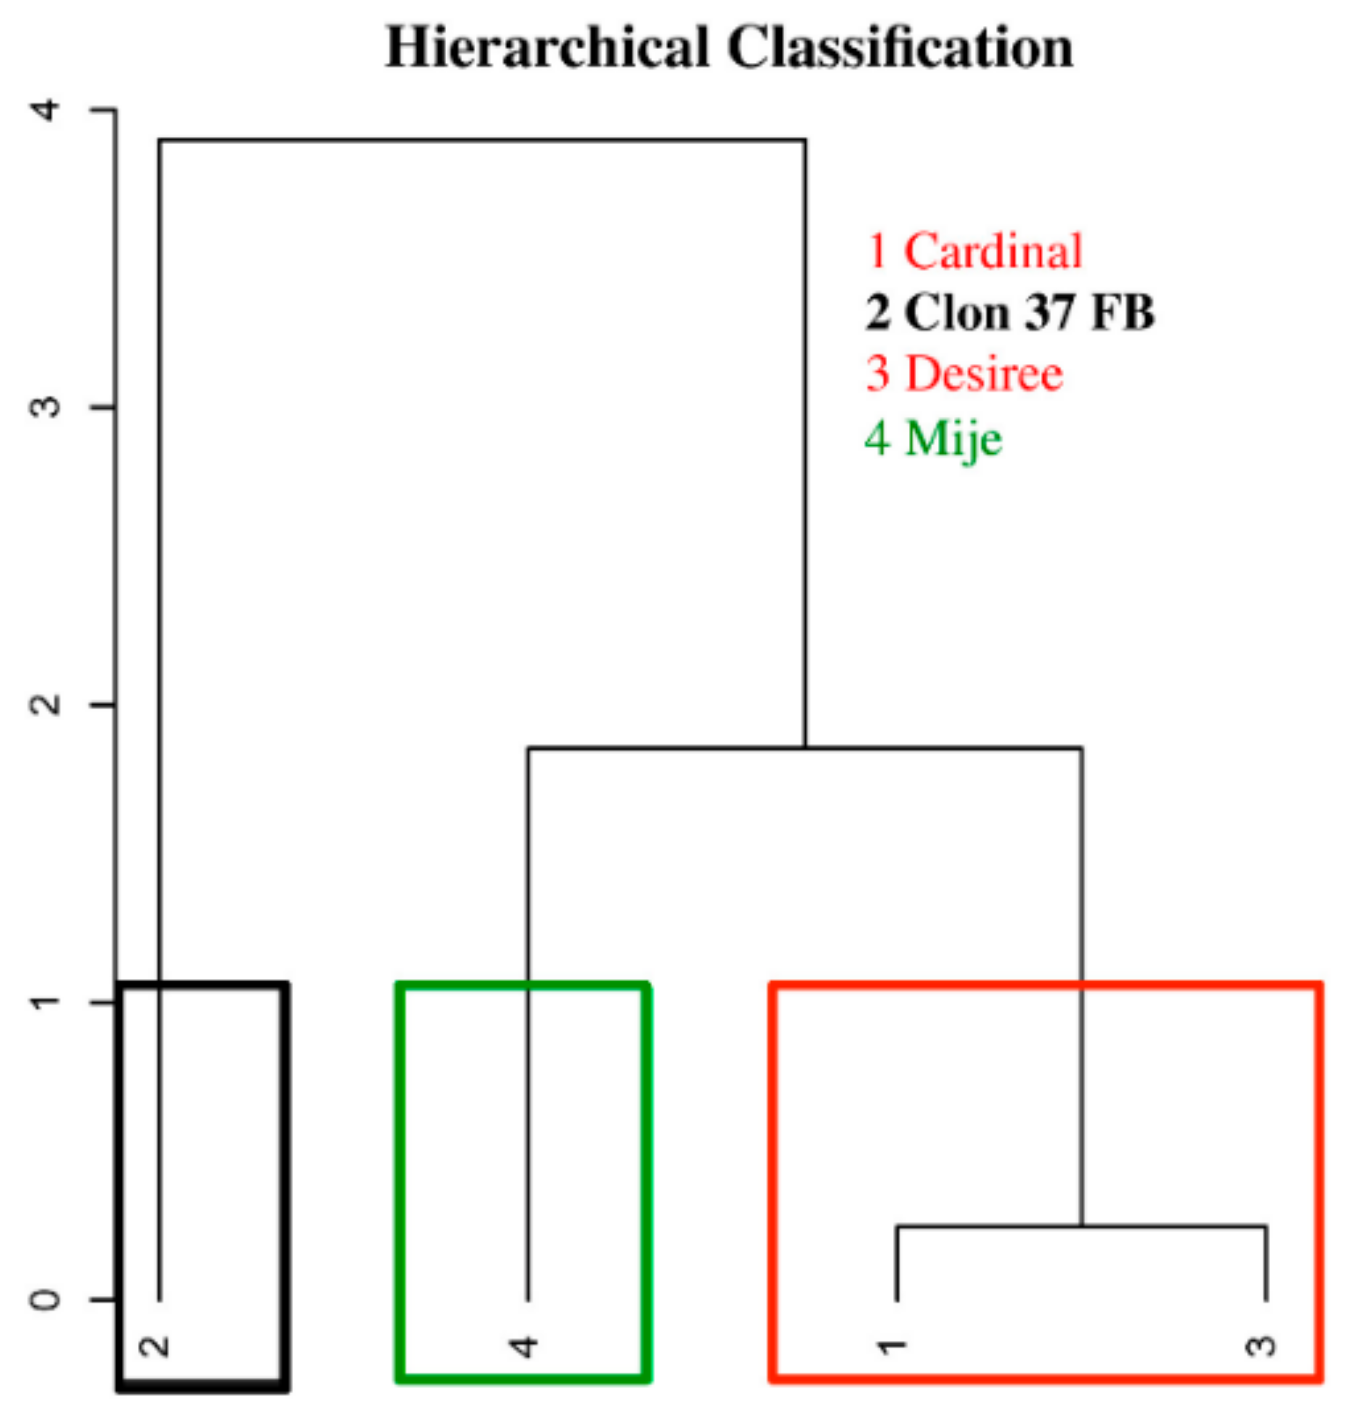
3.2. Relationship Between Performance Under Water Stress by Plant and Selection of Water Stress Tolerance Indices

Hierarchical classification using water stress indices separated the genotypes into three groups. The first group included Clone 37 FB, which was less affected in the yield stability index (YSI); and the second group included Mije, which was less affected in mean productivity (MP), geometric mean productivity (GMP), and drought tolerance index (DTI). Finally, a third group included the Desirée and Cardinal clones that had more similar yield-based indices (Figure 2).

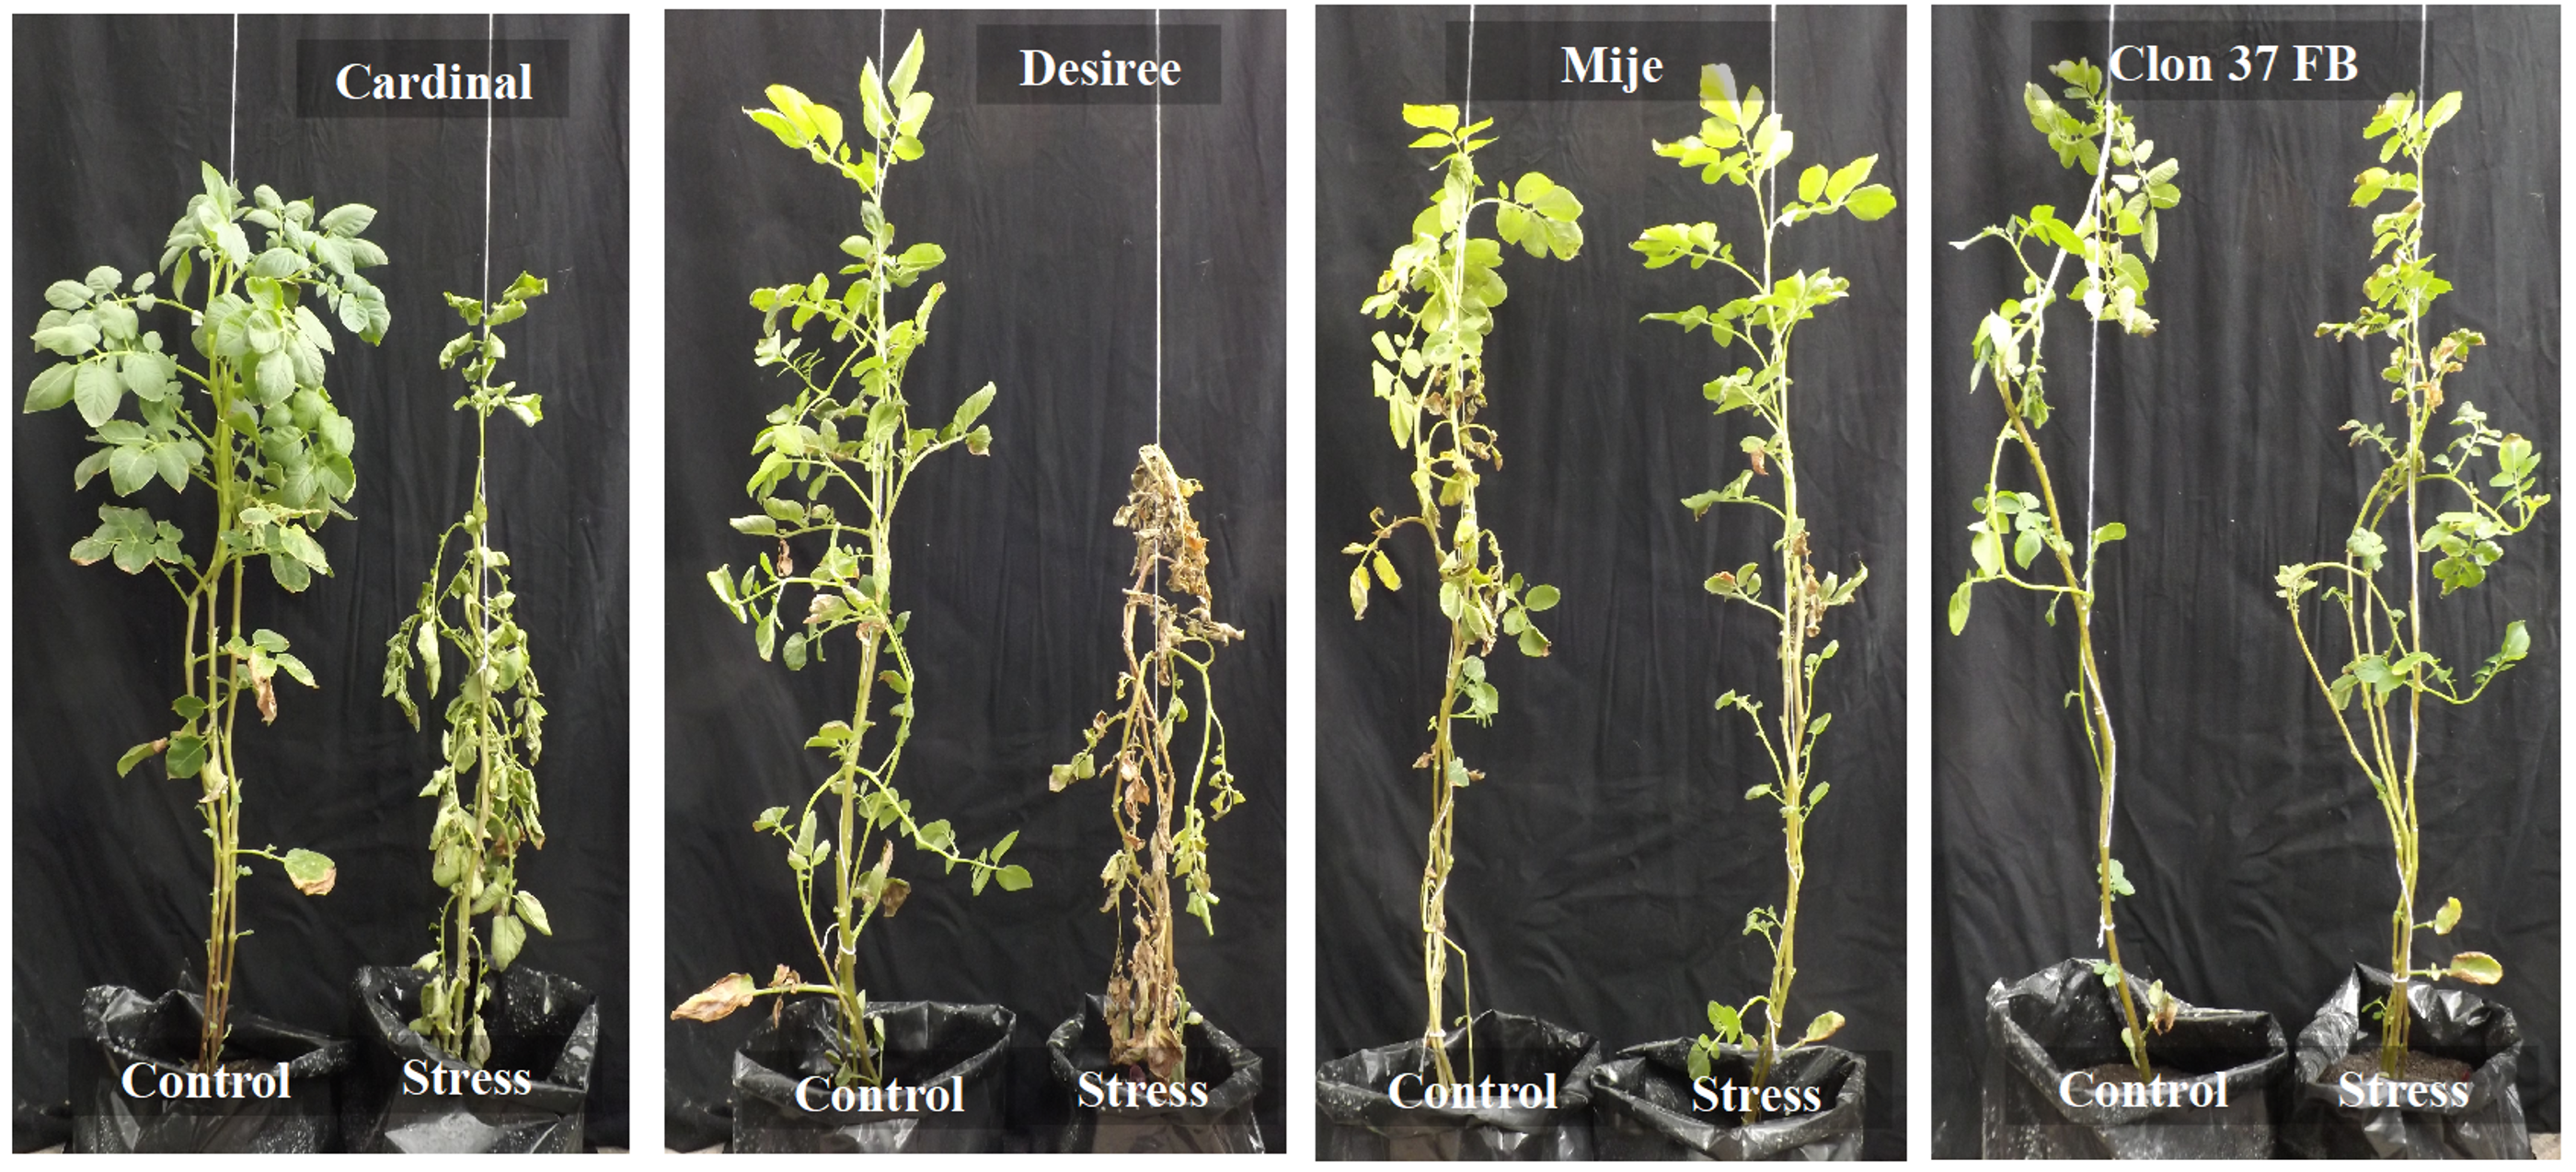
3.3. Agronomic Characteristic Changes in Potato Plants Under Water Stress

Table 1, Table 2, Table 3, Table 4 and Table 5 show the ANOVA result for the response of the four clones in a greenhouse as a function of irrigation (control) and cessation of irrigation from the beginning of tuberization (water stress treatment) (Figure 3).
As shown in Table 1, Clone 37 FB under control conditions produced significantly less fresh tuber weight (g/plant) than the commercial varieties Desirée and Cardinal, which denotes genetic differences between the clones. The fresh weight of tubers (g/plant) in Cardinal and Desirée under water stress decreased whereas it was increased in Clone 37 FB (Table 1). The differential response on fresh tuber weight among clones could be due to a larger number of tubers. Using the number of tubers and fresh tuber weight, the average fresh weight of a tuber (g/tuber) was determined. When subjected to water stress, Cardinal displayed a decreased average tuber weight and Desirée and Mije did not show significant differences. In contrast, the effect of water stress on the Clone 37 FB genotype increased its average tuber weight (Table 2). The dry weight of tubers was also decreased in Cardinal but was not significantly different for Desirée and Mije and increased for Clone 37 FB. These results show that the clones vary in water stress tolerance (Table 3). The accumulation of water in the tuber differed in Clone 37 FB. Under water stress, this clone was able to increase the amount of water in the plant (Table 4). Plant water content was measured as the sum of the water content in the shoot and roots. The results show that the genotypes lose water under water stress, with the exception of Clone 37 FB, which increased its average water content in the plant (shoot + root (g/plant)) (Table 5).
Clone 37 FB was classified as tolerant under conditions of stress treatment as it increased its tuber fresh weight by 2.5 g/plant and average tuber weight (g/tuber) by 1 g/tuber. In this genotype, the accumulation of dry matter in the tuber (g/plant) was increased by 0.1 g/plant and the average per tuber (g/tuber) by 0.1 g/tuber.
The fresh weight increase of Clone 37 FB tubers was correlated with increased water content in the tuber by 2.5 g/plant. The water content in the tuber and shoot + root presented significant differences in the genotype Clone 37 FB, increasing, respectively, by 0.9 g/tuber and 5.8 g/plant (Table 4 and Table 5).

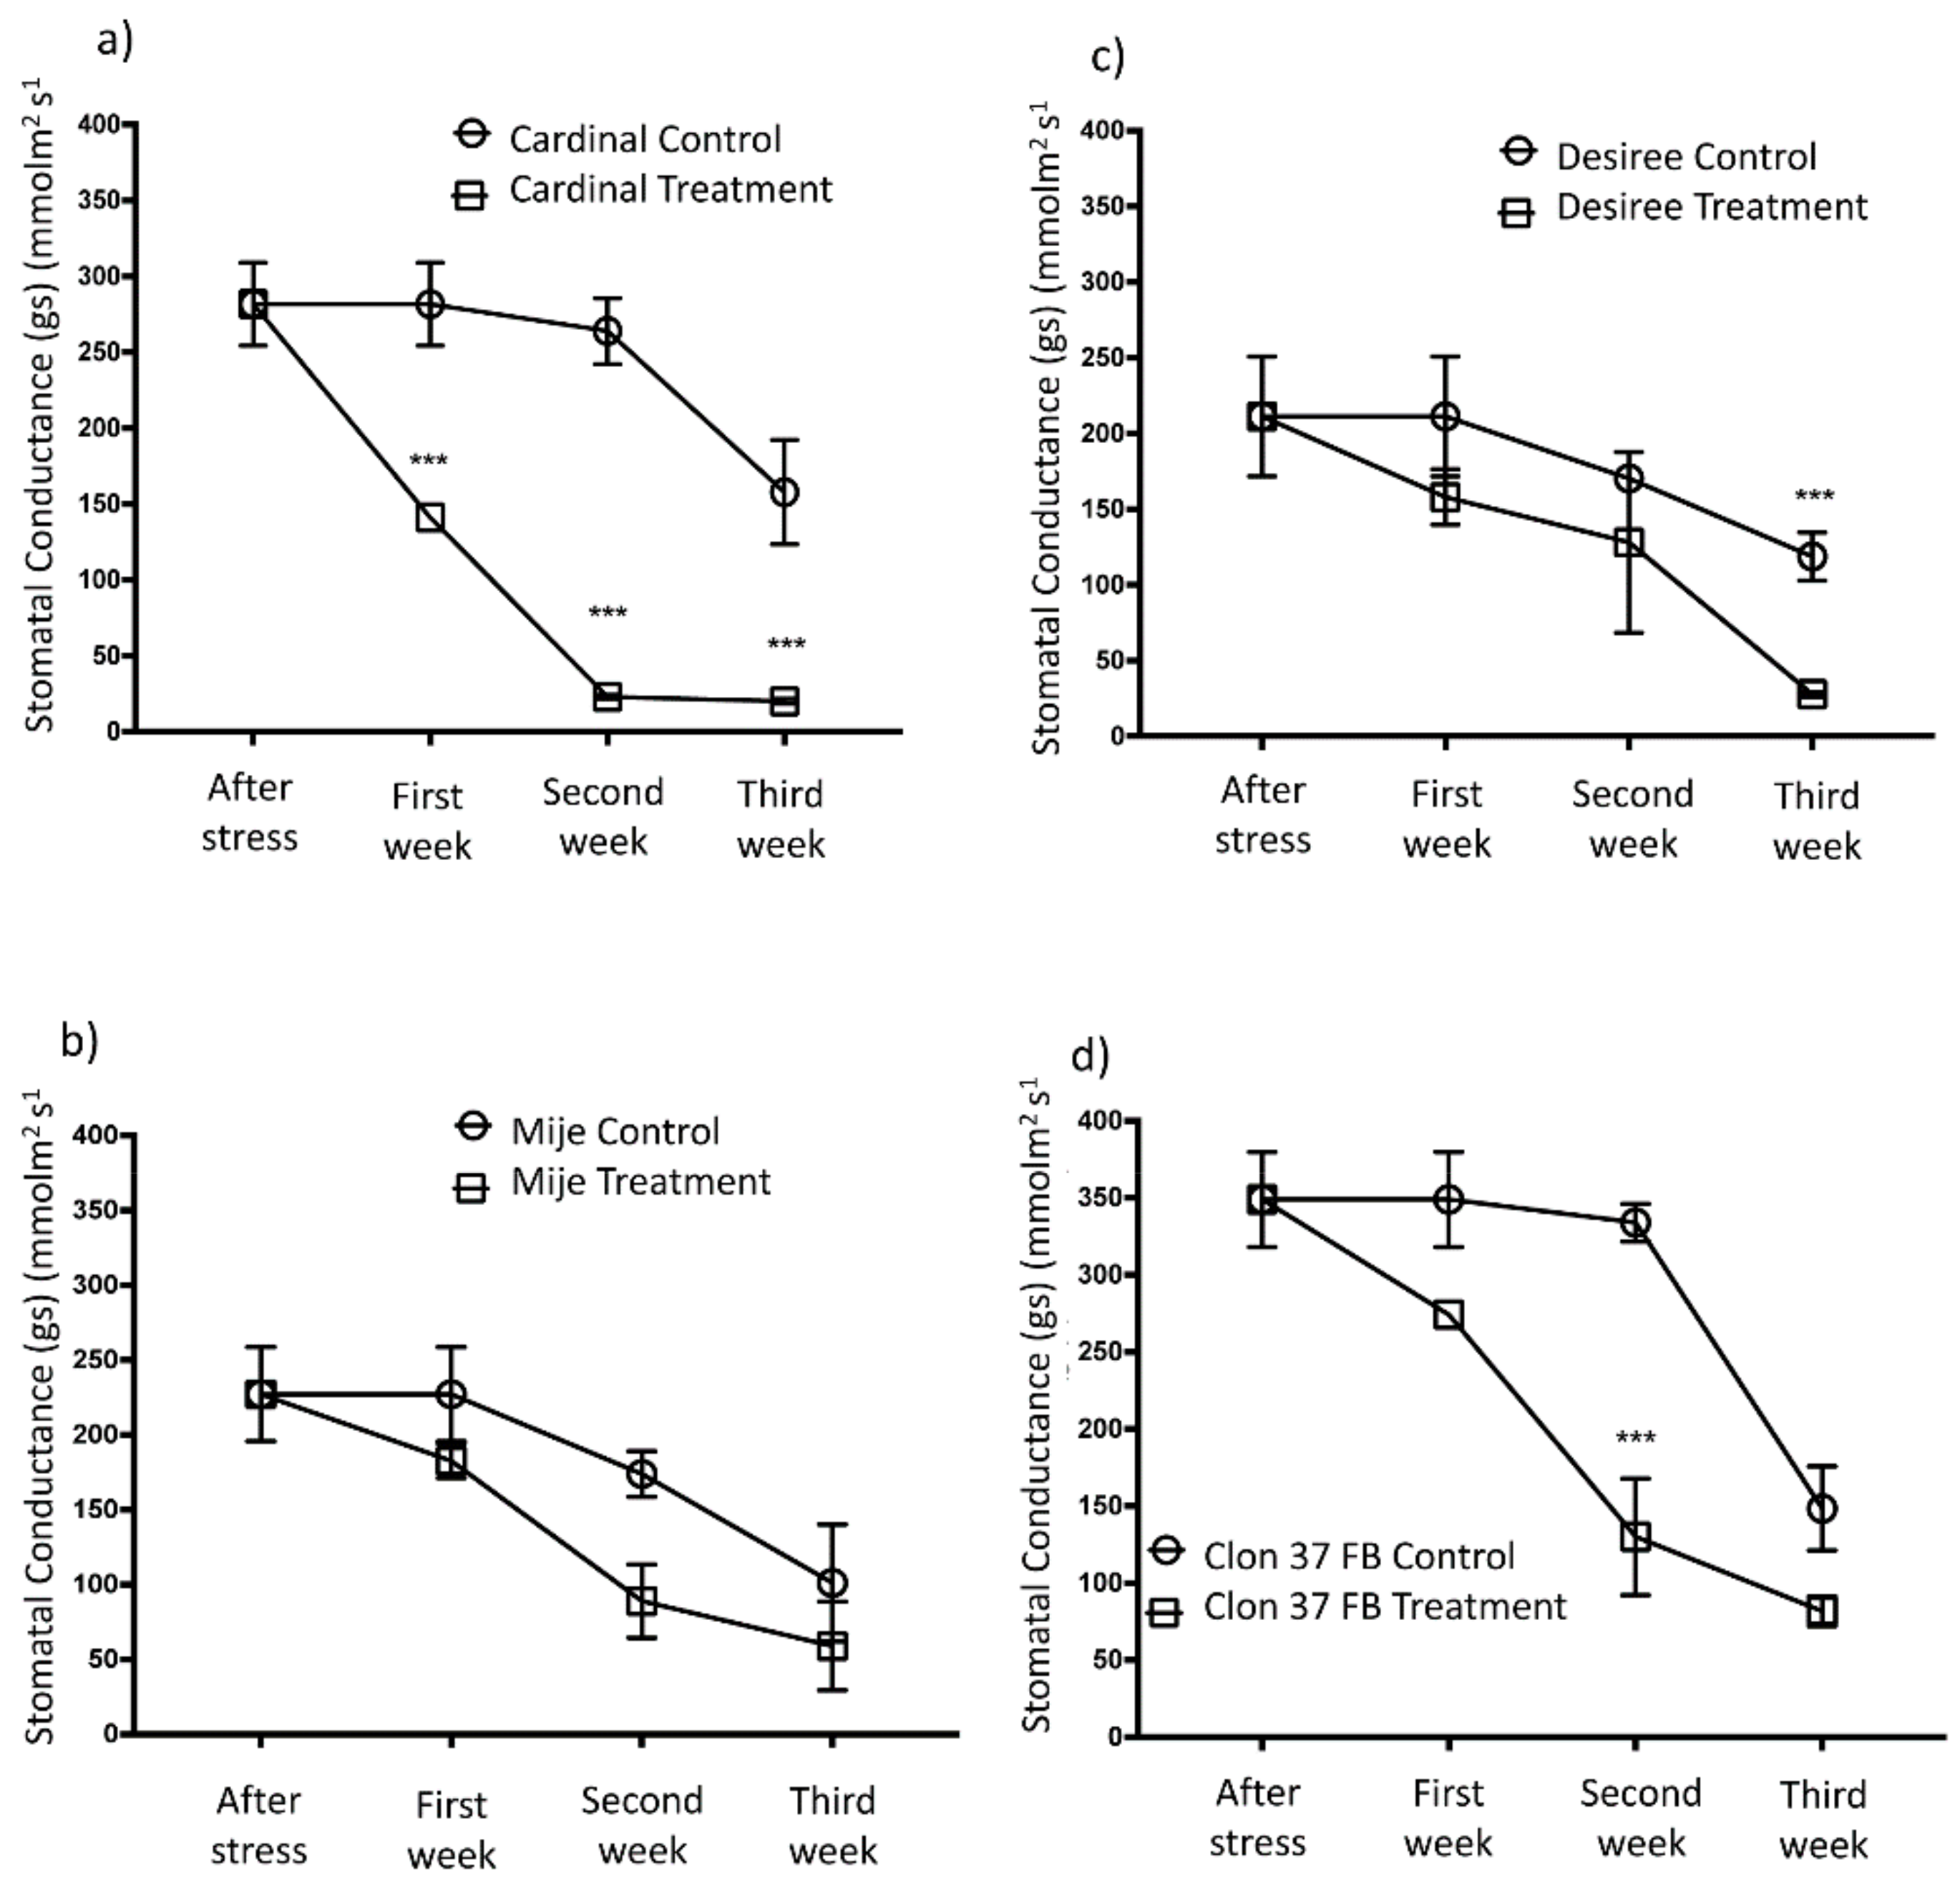
3.4. Gas Exchange in Potato Plants Under Water Stress

Gas exchange decreases as water stress increases, and stomatal conductance (gs) was the first to be affected by this type of stress in the clones evaluated (Figure 4). The Cardinal genotype, during the three weeks of evaluation, had reduced stomatal conductance, showing closure of stomata in the face of water stress. In contrast, the response of Desiree and Mije was to maintain their stomatal conductance during the first two weeks of stress by keeping their stomata open even under water stress. Finally, Clone 37 FB decreased stomatal conductance on the second week of stress (Figure 4a–d).

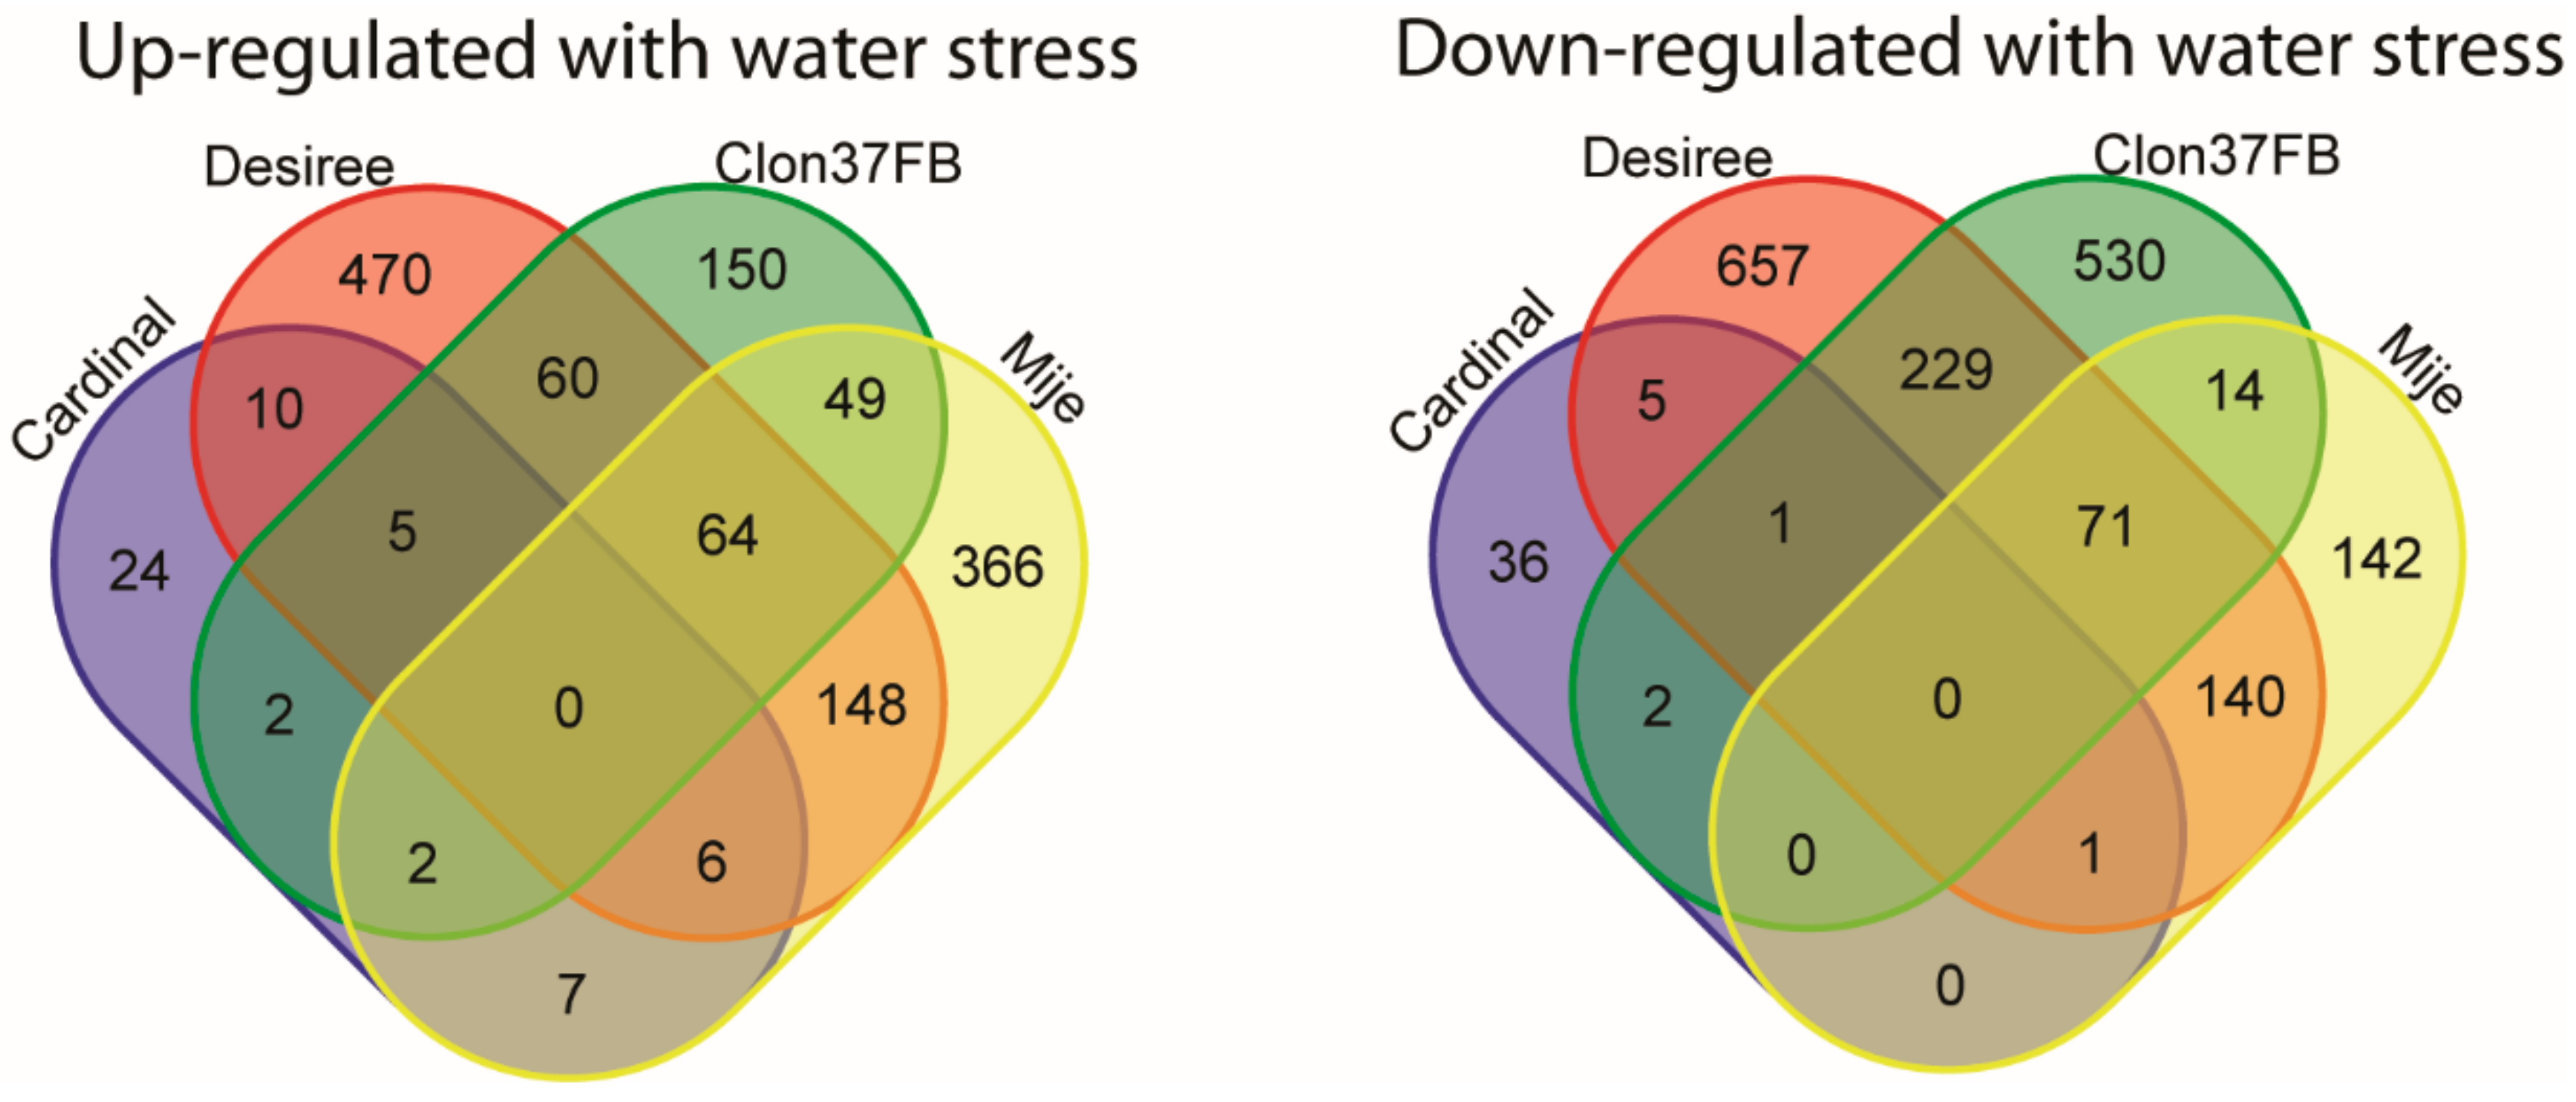
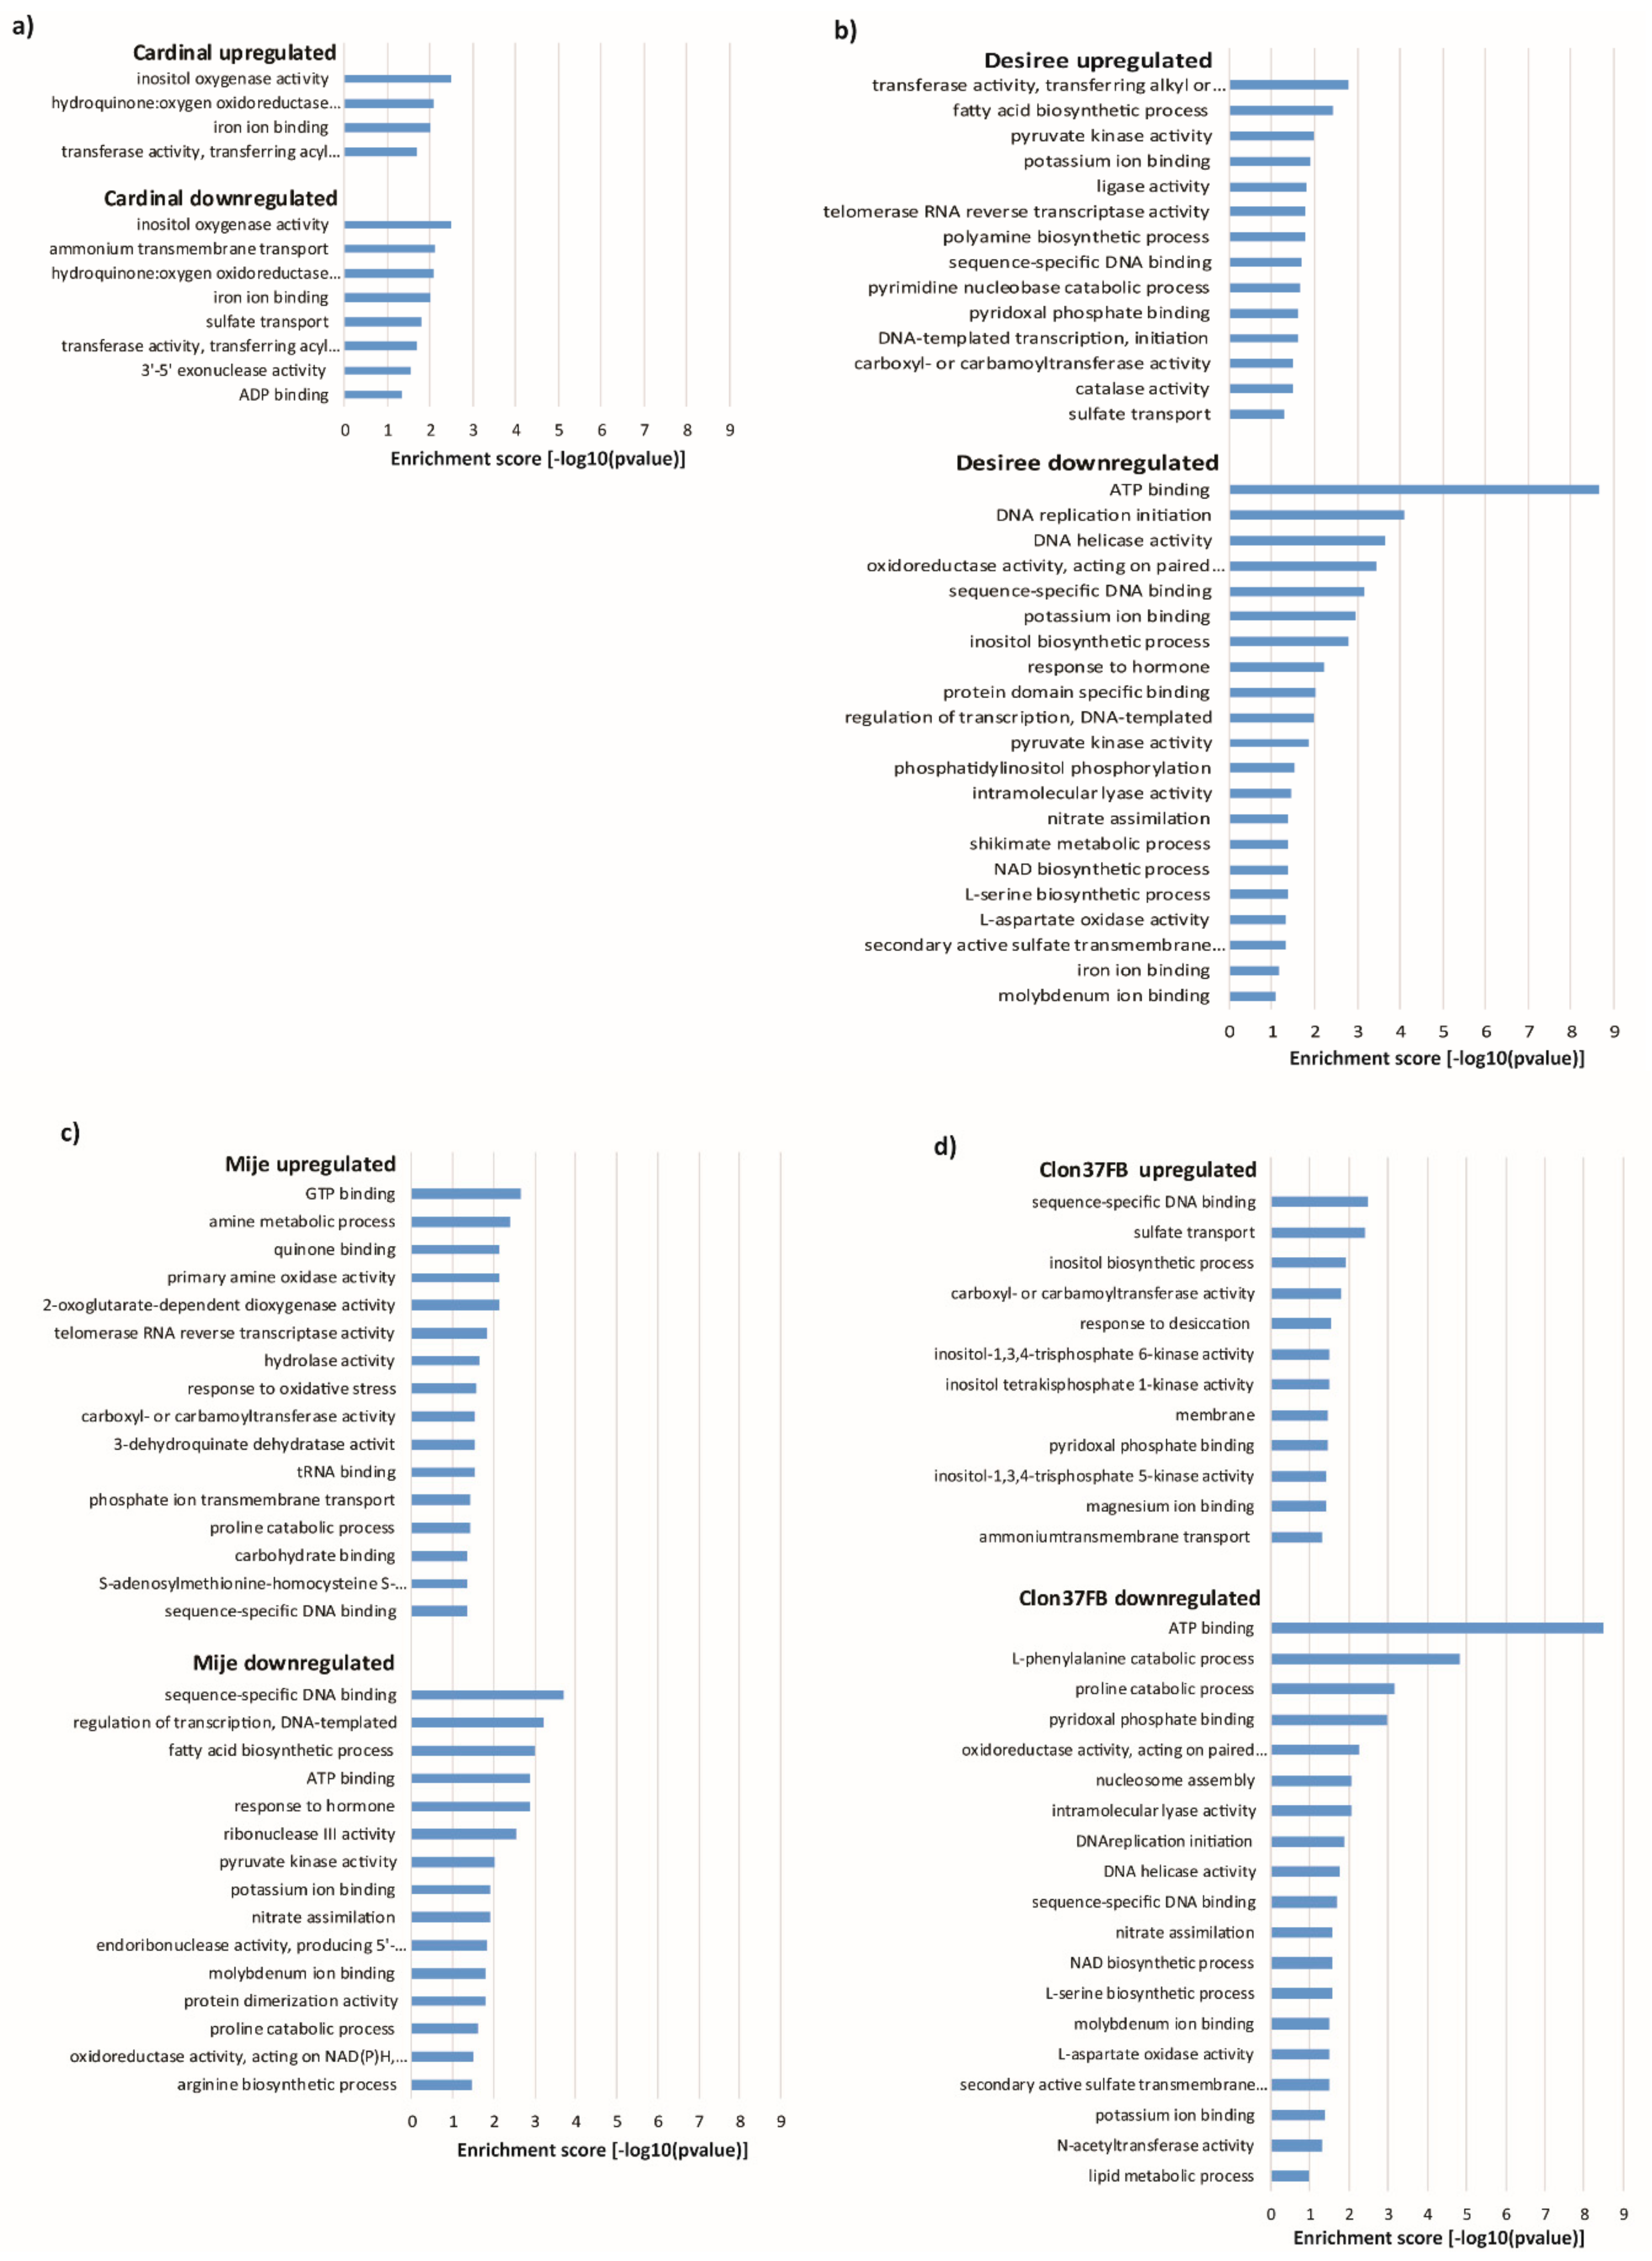
3.5. Transcriptome Sequencing Reveals Water Stress Responsive Genes

Differences in gene expression were found with water stress treatment for all clones (Figure 5 and Supplementary Tables S2–S5). Desirée had the largest number of differentially expressed genes at 1867, followed by Clone 37 FB at 1179 and Mije at 1010, with Cardinal with the fewest at 101. Venn diagrams of differentially expressed genes from CuffDiff show that the largest number of genes up- and downregulated in a given clone is unique for that clone (Figure 5). These results show gene expression responses are dependent on genetic variation between clones. Clone 37 FB and Mije showed similar upregulation for 117 genes and downregulation for 85 genes. Both of these clones had even higher numbers of up- and downregulated genes in common with Desirée, with 439 with Clone 37 FB and 450 with Mije. Cardinal had fewer differentially expressed genes compared with the other clones and a small number of genes overlapping in expression.
The functional annotation of differentially expressed genes were analyzed using GO annotations (Figure 6). Cardinal had a high susceptibility to water stress and the fewest gene expression changes, as such there were very few GO terms showing enrichment. All of the GO terms for Cardinal’s upregulated genes were also enriched for Cardinal’s downregulated genes. The GO term 3’,5’-exonuclease activity was enriched in Cardinal’s downregulated genes but not upregulated. Genes annotated with this term are involved in DNA repair.
Desirée had the highest number of differentially expressed genes and the term with the highest GO enirichment score was “ATP binding” for downregulated genes (Figure 6b). Many of these genes were kinases that were involved in intracellular signaling (Supplementary Table S3). Additionally, both up- and downregulated genes showed an enrichment of GO terms associated with the regulation of gene expression, which supports the observation that Desirée had a strong gene expression response to water stress. Desirée showed upregulation of genes involved in the biosynthesis of polyamines (GO terms “polyamine biosynthetic process” and ‘carboxyl and carboxyltransferase activity”) associated with stress responses. Downregulated genes were found to be enriched for the GO term” nitrate assimilation”, which was likely due to decreased nitrate uptake under a water deficit. The GO term “shikimate metabolic process” was also enriched among downregulated genes. The shikimate pathway is involved in amino acid biosynthesis.
Mije had a tolerance to water stress and was found to have enrichment of the GO term “sequence-specific DNA binding” associated with transcription factor genes for both up- and downregulated genes, indicating changes in gene expression were induced with stress (Figure 6c and Supplementary Table S4). Genes upregulated for Mije were enriched for GO terms “primary amine oxidase activity”, “amine metabolic process”,”carbohydrate binding”, and “carboxyl- or carbomoyltransferase activity” that included genes involved in S-adenosyl methionine polyamine biosynthesis, which is increased in response to stress in plants. S-adenosylmethionine was also involved in functions covered by the GO term “S-adenosylmethionine-homocysteine S-methyltransferase activity”, which was also enriched for Mije upregulated genes. This enzyme functions in the synthesis of methionine from S-adenosyl methionine. The GO analysis indicates that S-adenosylmethionine metabolism was important in Mije responses to water stress. Downregulated genes for Mije were enriched with the term “nitrate assimilation”, which is likely associated with the decreased nitrate uptake that occurs under water stress. Decreased amino acid biosynthesis was also noted. The GO term “response to hormone” was enriched among the downregulated genes, which included several genes involved in auxin and ethylene responses (Supplementary Table S4). Fatty acid biosynthesis was also found to be downregulated with water stress with the enrichment of the GO term “fatty acid biosynthesis.”
Clone 37 FB was the clone with the highest tolerance to water stress in the study. Like Mije and Desirée, there was enrichment of the GO term “sequence specific DNA binding” associated with transcription factors in both up- and downregulated genes (Figure 6d and Supplementary Table S5). These results concur with the large number of differentially regulated genes with water stress in Clone 37 FB. There were several GO terms associated with inositol that were enriched among the upregulated genes. The GO terms “inositol biosynthetic process,” “inositol 1,3,4-trisphosphate 6-kinase activity”, “inositol 1,3,4-trisphosphate 5-kinase activity”, and “inositol tetrakisphosphate 1-kinase activity” were associated with the production of inositol intracellular signaling molecules. The GO term “inositol biosynthetic process” was also associated with biosynthesis of galactinol and raffinose, which are osmolytes involved in abiotic stress tolerance in plants. The GO term “response to dessication” was also enriched among the upregulated genes. Interestingly, only clone 37 FB showed enrichment for this term. Genes upregulated in Clone 37 FB related to desiccation responses include dehydrins, LEA, and ABA response genes (Supplementary Table S5). The downregulated genes for clone 37 FB showed high enrichment for the GO term “ATP binding.” This was due to the large number of kinase genes found among the downregulated genes. GO terms for downregulated genes were also associated with DNA replication and several were associated with amino acid metabolism, including “L-phenylalanine catabolic process”, “proline catabolic process”, “L-serine biosynthetic process”, and “L-aspartate oxidase activity.” Additionally, the GO term “nitrate assimilation” was also enriched among the downregulated genes similarly to Desirée and Mije, which concurs with the decrease in amino acid biosynthesis (Supplementary Table S5).
Genes involved in plant defense were differentially expressed in all clones (Supplementary Table S2–S5). Annotations carrying the keyword “resistance” were searched for in the gene lists to find resistance genes. The keywords “pathogenesis”, “glucanase”, “osmotin”, and “thaumatin” were searched for in the gene lists for each of the clones to find pathogenesis-related genes. Water stress-susceptible Cardinal downregulated six disease resistance genes and one pathogenesis-related gene with no genes upregulated. Desirée upregulated three disease resistance genes and nine pathogenesis-related genes. This clone also downregulated 17 disease resistance genes and 11 pathogenesis-related genes. The moderately water stress tolerant clone, Mije, showed downregulation of six disease resistance genes and none were upregulated. There were also 15 upregulated pathogenesis-related genes and three downregulated. The highly water stress-tolerant clone 37 FB showed upregulation of one disease resistance gene and downregulation of three. For this clone, two pathogenesis-related genes that were upregulated and 24 genes were downregulated. These results show that downregulation of pathogen defense genes was associated with water stress in all the clones.
Heat shock proteins are chaperone proteins that contribute to protein stability under stress. Cardinal showed upregulation of a single heat shock protein gene. However, the other clones had more extensive differential expression of heat shock protein genes (Supplementary Table S2–S5). Desirée upregulated 31 heat shock protein genes and downregulated two. Mije upregulated 33 heat shock protein genes with none being downregulated. Clone 37 FB upregulated five and also downregulated another five.

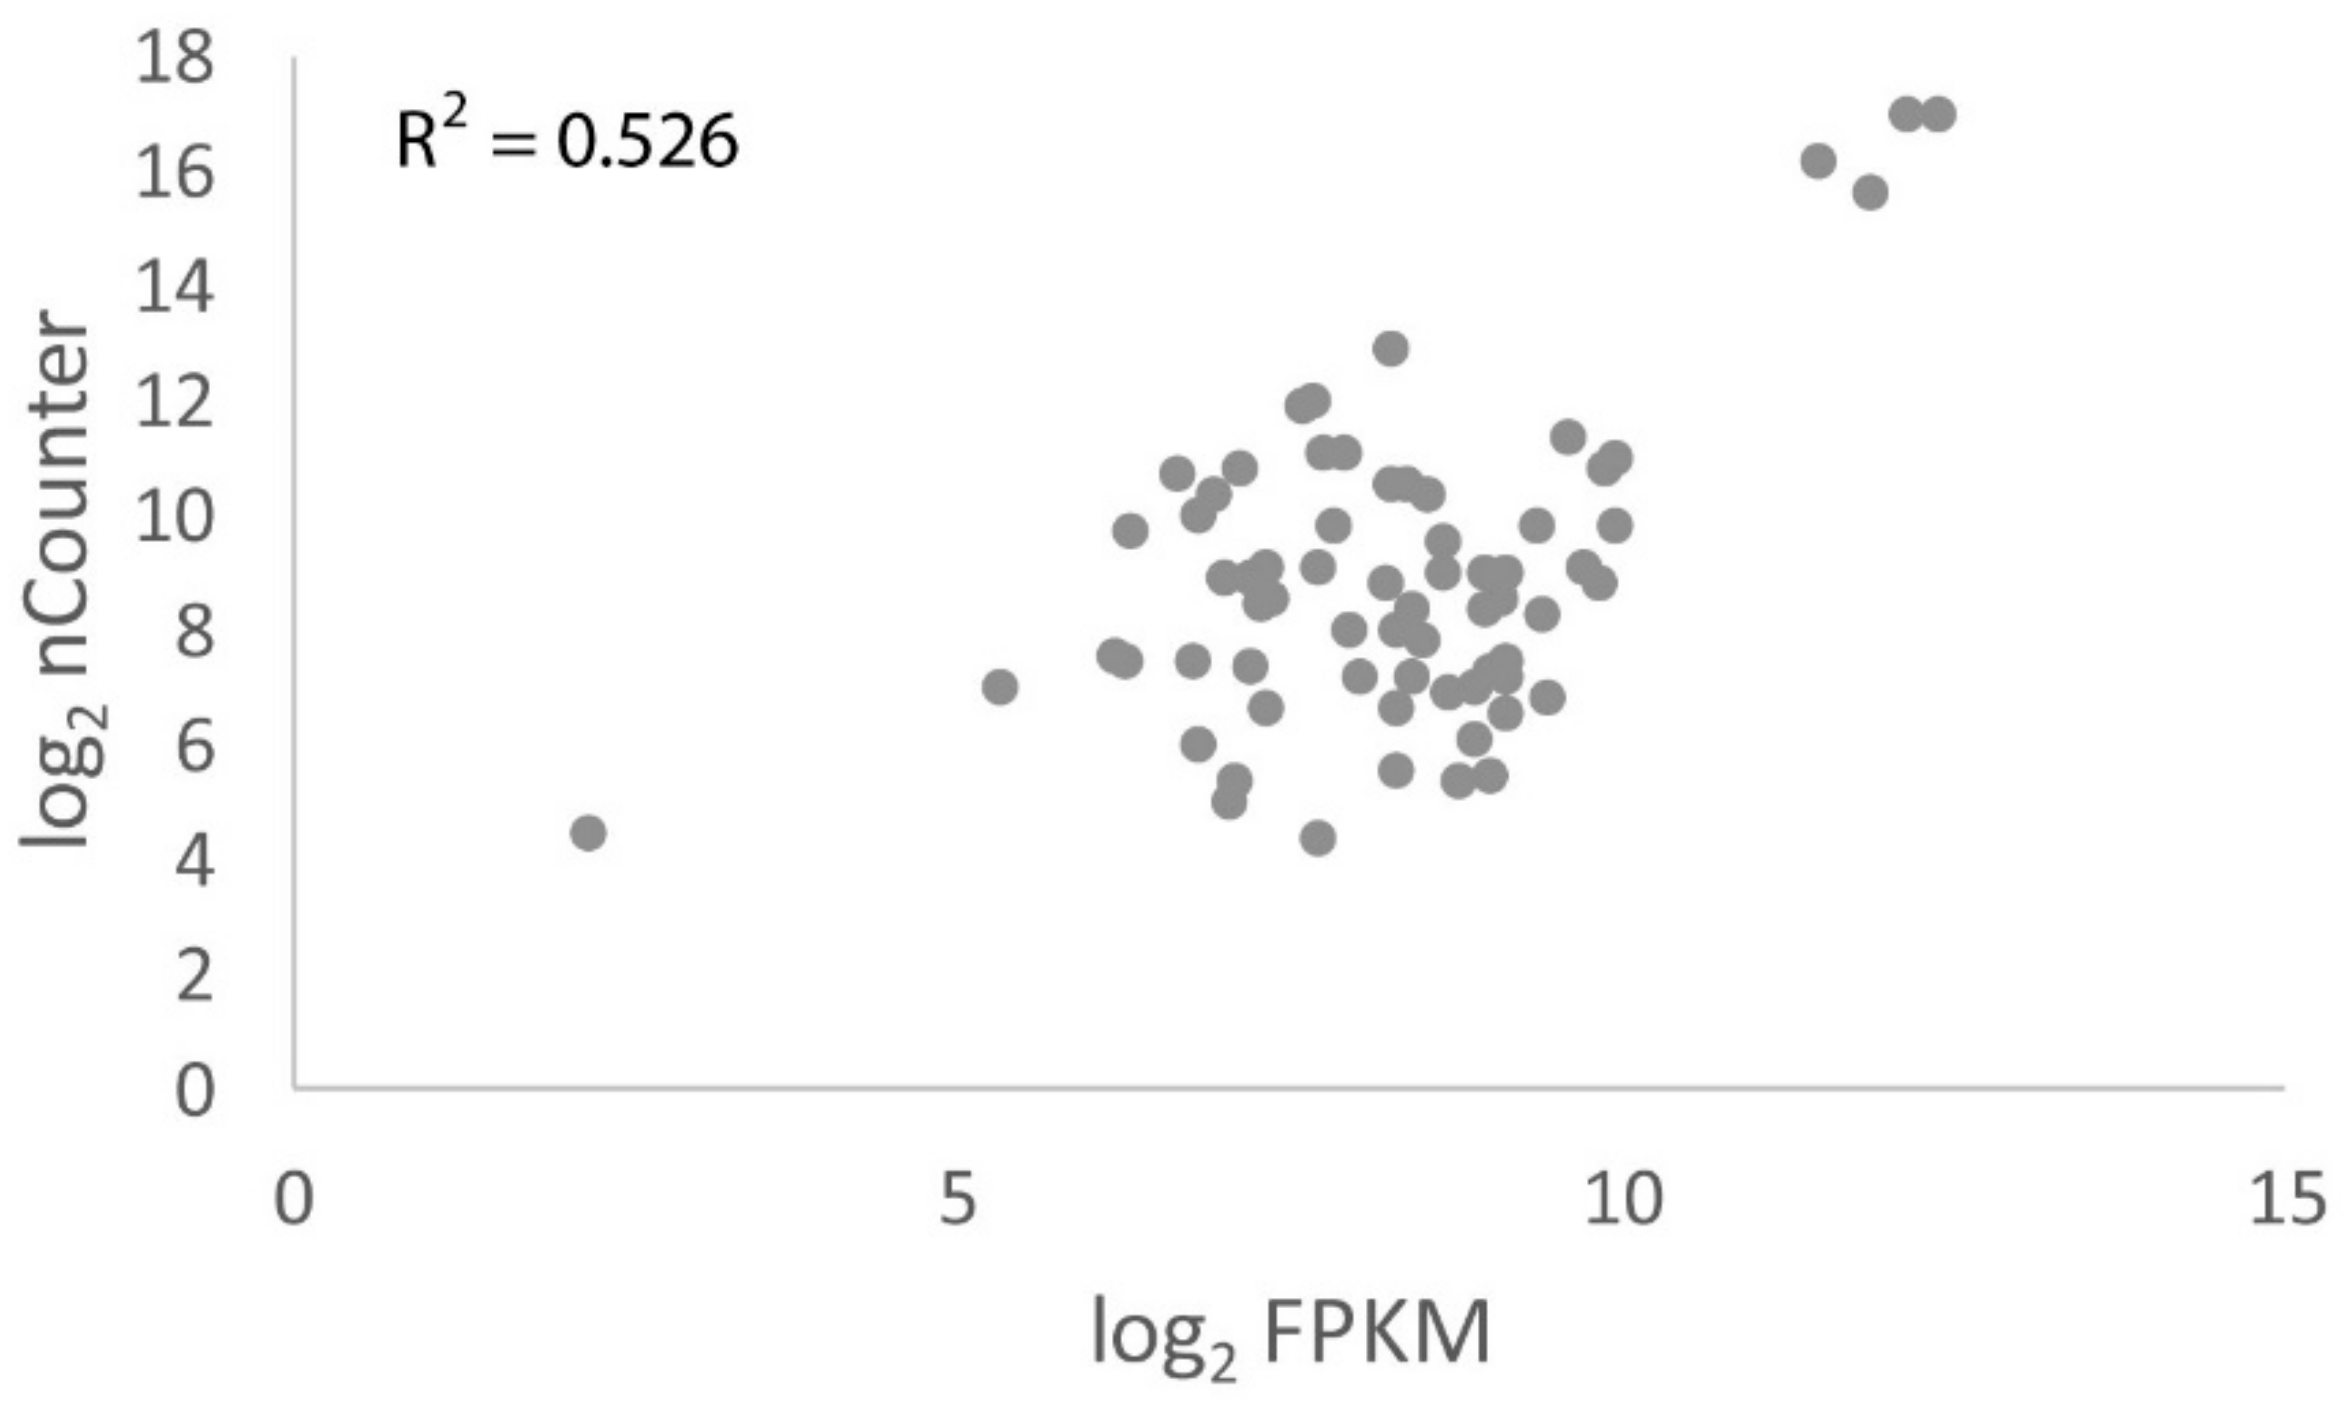
3.6. nCounter Validation

Gene expression analysis for 24 random genes previously found to be expressed in leaves [40] was examined using nCounter and compared to FPKM from the transcriptome sequencing analysis. The analysis demonstrated that there was a positive correlation between the gene expression measured using transcriptome sequencing and nCounter (Figure 7). These results are a validation of the transcriptome sequencing FPKM measures of gene expression.

4. Discussion

The results showed that clone 37 FB had a tolerance to water stress and even had increases in tuber fresh weight under stress. Cardinal was the most susceptible, with the greatest loss of fresh tuber weight. Desirée was less susceptible and even moderately tolerant on some measures of tuber yield. Mije had moderate tolerance, with a maintenance of tuber fresh weight compared to Cardinal but was much less tolerant than clone 37 FB. The effects of water stress in potato have been widely studied at the phenotypic and physiological level [44,45,46], which includes analysis at the level of gene expression [18,47]. In our study, two landraces with tolerance to water stress in vitro [22] from southern Chile were analyzed for water stress tolerance in the greenhouse and, for the first time, RNAseq was used along with two commercial varieties the findings show differentially expressed genes in the tissue of leaf of plants grown under optimal irrigation compared to water-deficit conditions in the greenhouse. Our results show a similarity to published studies, including differential expression of genes involved in osmolyte and polyamine biosynthesis, LEA and dehydrin genes, transcriptional regulation factors, kinases, and genes controlling amino acid biosynthesis.
Cardinal was the most susceptible to water stress and was found to have reduced stomatal conductance (gs). There are many pathways that induce stomatal closure, which has negative effects on CO2 absorption, photosynthesis, transpiration, cooling, and water [48]. These pathways can be divided into hydro-passive and active stomatal closure [48]. In the case of the cultivated potato, several studies have shown that gas exchange is significantly affected by water deficit. Cardinal also had the least number of differentially expressed genes compared to other clones. These results suggest that susceptible responses to water stress do not require large changes in gene expression.
The current study found that clone 37 FB plants responded tolerantly to water stress in the greenhouse. The results showed a moderate increase in tuber weight, water accumulation, and dry biomass under water stress. Clone 37 FB also had a low tuber yield under the control irrigated conditions compared to the other clones. The low allocation of resources to tuber production may have contributed to its tolerance to the water stress applied to clone 37 FB. There was evidence to support this hypothesis from the differential gene expression analysis. The GO enrichment analysis demonstrated that clone 37 FB increased the expression of genes involved in response to desiccation, including genes encoding LEA and dehydrin proteins that accumulate with water deficit [49]. This clone also increased the expression of genes involved in the biosynthesis of osmolytes, which are protective against drought stress [50]. These functions likely contributed to the comparatively increased capacity to tolerate water stress for clone 37 FB.
Desirée was found to be the most similar to Cardinal using yield-based indices for comparison. However, the similarities may be based more on tuber size rather than the percentage of tuber weight loss under water stress. Tuber weight loss under water stress for Desirée was moderate and in a similar range as Mije. The total loss of tuber weight was higher for Desirée, but the average loss of weight per tuber was higher for Mije. The functional analysis also showed similarities in enriched GO terms between Desirée and Mije, including the upregulation of genes involved in tthe production of polyamines involved in stress responses [51]. Clone 37 FB, Desirée, and Mije shared enrichment of the GO term “nitrate assimilation” among downregulated genes. These clones also showed downregulation of genes involved in amino acid biosynthesis. These results concur with findings that a water deficit is associated with a nitrogen nutrient deficit, leading to reduced amino acid biosynthesis [52].
Biotic stress responses were also altered under water stress in the four clones. The results showed that all of the clones had decreased defense responses to pathogens under water stress. All clones showed decreased expression of disease resistance (R) genes. R genes are involved in pathogen recognition in eliciting plant defense [53]. Cardinal showed the highest proportion of downregulated R genes, with 6 out of a total of 101 differentially expressed genes. Differential expression of pathogenesis-related genes that encode anti-microbial proteins [54] was also observed. Clone 37 FB had the largest number of downregulated pathogenesis-related genes at 24, but also upregulated two. Desirée up- and downregulated nine pathogenesis related genes each. Mije downregulated one and upregulated 15. Cardinal had one downregulated pathogenesis-related and none were upregulated. These results suggest that reduced pathogenesis responses may be related to an increased capacity for tolerance to water stress. A reduced pathogenesis response can save cellular energy and resources for repartitioning to counter damage induced by abiotic stress.
Heat shock proteins function to maintain protein folding and stability under stress [55]. Interestingly, Cardinal, which was the most susceptible to water stress, showed differential expression of just one heat shock protein gene while the other clones showed differential expression of several genes with this function. For Desirée and Mije, most of the heat shock genes were upregulated with water stress and few were downregulated. Clone 37 FB had similar numbers of heat shock genes showing up- and downregulation. These results suggest that there is a role for heat shock proteins in maintaining cellular function under stress, particularly for Desirée and Mije. The results also suggest that Cardinal’s lack of a heat shock protein response may be related to it susceptibility and low tuber yield under water stress.

Supplementary Materials

The following are available online at https://www.mdpi.com/2073-4395/9/12/848/s1. Table S1 Raw sequencing statistics. Table S2 List of differentially expressed genes in the Cardinal clone. Table S3 List of differentially expressed genes in the Desiree clone. Table S4 List of differentially expressed genes in the Mije clone. Table S5 List of differentially expressed genes in the Clone 37 FB clone. Table S6 nCounter CodeSet probes.

Author Contributions

Conceptualization, M.B., C.M., M.P. and H.H.T.; Methodology, M.B., C.M., S.R., M.P., C.D., and H.H.T.; Software, M.L., H.H.T.; Validation, M.B., C.D., H.H.T.; Formal Analysis, M.B., C.M., M.P., M.L. and H.H.T..; Investigation, M.B., S.R., M.L., C.D., H.H.T.; Resources, M.B., M.P., M.L., H.H.T; Data Curation, M.B., C.M., M.P., M.L. and H.H.T.; Writing – Original Draft Preparation, M.B.; Writing – Review & Editing, M.B., C.M., M.P., H.H.T.; Visualization, M.B., C.M., M.P., H.H.T.; Supervision, C.M., M.P., H.T.; Project Administration, M.B.; Funding Acquisition, C.M., M.P., H.T.

Funding

Comisión Nacional de Investigación Científica y Tecnológica de Chile: -Fondo Nacional de Desarrollo Científico y Tecnológico de Chile: FONDECYT Post - Doctoral Project No. 3140066. Agriculture and Agri-Food Canada: A-base.

Acknowledgments

A-based funds from AAFC contributed to the study. Funding was als0 provided by Comisión Nacional de Investigación Científica y Tecnológica de Chile and Fondo Nacional de Desarrollo Científico y Tecnológico de Chile (FONDECYT Post – Doctoral project No. 3140066).

Conflicts of Interest

The authors declare no conflict of interest.

References

  1. De Haan, S.; Rodriguez, F. Potato Origin and Production. In Advances in Potato Chemistry and Technology, 2nd ed.; Singh, J., Kaur, L., Eds.; Academic Press: London, UK, 2016; pp. 1–32. [Google Scholar]
  2. Deblonde, P.M.K.; Ledent, J.F. Effects of moderate drought conditions on green leaf number, stem height, leaf length and tuber yield of potato cultivars. Eur. J. Agron. 2001, 14, 31–41. [Google Scholar] [CrossRef]
  3. Andre, C.M.; Ghislain, M.; Bertin, P.; Oufir, M.; del Rosario Herrera, M.; Hoffmann, L.; Hausman, J.-F.; Larondelle, Y.; Evers, D. Andean Potato Cultivars (Solanum tuberosum L.) as a Source of Antioxidant and Mineral Micronutrients. J. Agric. Food Chem. 2007, 55, 366–378. [Google Scholar] [CrossRef] [PubMed]
  4. Obidiegwu, J.E.; Bryan, G.J.; Jones, H.G.; Prashar, A. Coping with drought: Stress and adaptive responses in potato and perspectives for improvement. Front. Plant Sci. 2015, 6, 542. [Google Scholar] [CrossRef] [PubMed] [Green Version]
  5. Campos, D.; Noratto, G.; Chirinos, R.; Arbizu, C.; Roca, W.; Cisneros-Zevallos, L. Antioxidant capacity and secondary metabolites in four species of Andean tuber crops: Native potato (Solanum sp.), mashua (Tropaeolum tuberosum Ruiz & PavónPav´Pavón), Oca (Oxalis tuberosa Molina) and ulluco (Ullucus tuberosus Caldas). J. Sci. Food Agric. 2006, 86, 1481–1488. [Google Scholar]
  6. Ritter, E.; Barandalla, L.; López, R.; de Galarreta, J.I.R. Exploitation of Exotic, Cultivated Solanum Germplasm for Breeding and Commercial Purposes. Potato Res. 2008, 51, 301–311. [Google Scholar] [CrossRef]
  7. André, C.M.; Schafleitner, R.; Legay, S.; Lefèvre, I.; Aliaga, C.A.A.; Nomberto, G.; Hoffmann, L.; Hausman, J.-F.; Larondelle, Y.; Evers, D. Gene expression changes related to the production of phenolic compounds in potato tubers grown under drought stress. Phytochemistry 2009, 70, 1107–1116. [Google Scholar] [CrossRef]
  8. Schafleitner, R.; Gutierrez Rosales, R.O.; Gaudin, A.; Alvarado Aliaga, C.A.; Martinez, G.N.; Tincopa Marca, L.R.; Bolivar, L.A.; Delgado, F.M.; Simon, R.; Bonierbale, M. Capturing candidate drought tolerance traits in two native Andean potato clones by transcription profiling of field grown plants under water stress. Plant Physiol. Biochem. 2007, 45, 673–690. [Google Scholar] [CrossRef]
  9. Vacher, J. Responses of two main Andean crops, quinoa (Chenopodium quinoa Willd) and papa amarga (Solanum juzepczukii Buk.) to drought on the Bolivian Altiplano: Significance of local adaptation. Agric. Ecosyst. Environ. 1998, 68, 99–108. [Google Scholar] [CrossRef]
  10. Chaves, M.M.; Pereira, J.S.; Maroco, J.; Rodrigues, M.L.; Ricardo, C.P.P.; Oso, M.L.; Rio, Â.; Carvalho, I.; Faria, T.; Pinheiro, C. How Plants Cope with Water Stress in the Field. Photosynthesis and Growth. Ann. Bot. 2002, 89, 907–916. [Google Scholar] [CrossRef] [Green Version]
  11. Moore, J.P.; Le, N.T.; Brandt, W.F.; Driouich, A.; Farrant, J.M. Towards a systems-based understanding of plant desiccation tolerance. Trends Plant Sci. 2009, 14, 110–117. [Google Scholar] [CrossRef]
  12. Zhu, J.-K. Cell signaling under salt, water and cold stresses. Curr. Opin. Plant Biol. 2001, 4, 401–406. [Google Scholar] [CrossRef]
  13. Cabello, R.; Monneveux, P.; Bonierbale, M.; Khan, M.A. Heritability of yield components under irrigated and drought conditions in andigenum potatoes. Am. J. Potato Res. 2014, 91, 492–499. [Google Scholar] [CrossRef]
  14. Ramirez-Vallejo, P.; Kelly, J.D. Traits related to drought resistance in common bean. Euphytica 1998, 99, 127–136. [Google Scholar] [CrossRef]
  15. Seki, M.; Narusaka, M.; Ishida, J.; Nanjo, T.; Fujita, M.; Oono, Y.; Kamiya, A.; Nakajima, M.; Enju, A.; Sakurai, T.; et al. Monitoring the expression profiles of 7000 Arabidopsis genes under drought, cold and high-salinity stresses using a full-length cDNA microarray. Plant J. 2002, 31, 279–292. [Google Scholar] [CrossRef] [PubMed]
  16. Massa, A.N.; Childs, K.L.; Lin, H.; Bryan, G.J.; Giuliano, G.; Buell, C.R. The Transcriptome of the Reference Potato Genome Solanum tuberosum Group Phureja Clone DM1-3 516R44. PLoS ONE 2011, 6, e26801. [Google Scholar] [CrossRef] [PubMed] [Green Version]
  17. Evers, D.; Lefèvre, I.; Legay, S.; Lamoureux, D.; Hausman, J.-F.; Rosales, R.O.G.; Marca, L.R.T.; Hoffmann, L.; Bonierbale, M.; Schafleitner, R. Identification of drought-responsive compounds in potato through a combined transcriptomic and targeted metabolite approach. J. Exp. Bot. 2010, 61, 2327–2343. [Google Scholar] [CrossRef] [Green Version]
  18. Gong, L.; Zhang, H.; Gan, X.; Zhang, L.; Chen, Y.; Nie, F.; Shi, L.; Li, M.; Guo, Z.; Zhang, G.; et al. Transcriptome profiling of the potato (Solanum tuberosum L.) plant under drought stress and water-stimulus conditions. PLoS ONE 2015, 10, e0128041. [Google Scholar] [CrossRef]
  19. Watkinson, J.I.; Hendricks, L.; Sioson, A.A.; Vasquez-Robinet, C.; Stromberg, V.; Heath, L.S.; Schuler, M.; Bohnert, H.J.; Bonierbale, M.; Grene, R. Accessions of Solanum tuberosum ssp. andigena show differences in photosynthetic recovery after drought stress as reflected in gene expression profiles. Plant Sci. 2006, 171, 745–758. [Google Scholar] [CrossRef]
  20. Shinozaki, K.; Yamaguchi-Shinozaki, K. Gene networks involved in drought stress response and tolerance. J. Exp. Bot. 2006, 58, 221–227. [Google Scholar] [CrossRef] [Green Version]
  21. Zhang, N.; Liu, B.; Ma, C.; Zhang, G.; Chang, J.; Si, H.; Wang, D. Transcriptome characterization and sequencing-based identification of drought-responsive genes in potato. Mol. Biol. Rep. 2014, 41, 505–517. [Google Scholar] [CrossRef]
  22. Barra, M.; Correa, J.; Salazar, E.; Sagredo, B. Response of Potato (Solanum tuberosum L.) Germplasm to Water Stress Under In Vitro Conditions. Am. J. Potato Res. 2013, 90, 591–606. [Google Scholar] [CrossRef]
  23. Murashige, T.; Skoog, F. A Revised Medium for Rapid Growth and Bio Assays with Tobacco Tissue Cultures. Physiol. Plant. 1962, 15, 473–497. [Google Scholar] [CrossRef]
  24. Toledo, J.; Espinoza, N.; Golmirzaie, A. Cultivo de Tejidos: Manejo de Plantulas In Vitro en la Produccion de Semilla de Papa; Martínez, E., Ed.; Centro internacional de la Papa: Lima, Peru, 1998; pp. 1–13. [Google Scholar]
  25. Rosielle, A.A.; Hamblin, J. Theoretical Aspects of Selection for Yield in Stress and Non-Stress Environment1. Crop Sci. 1981, 21, 943–946. [Google Scholar] [CrossRef]
  26. Fernandez, G.C. Effective selection criteria for assessing plant stress tolerance. In Proceedings of the International Symposium on Adaptation of Vegetables and other Food Crops in Temperature and Water Stress, Shanhua, Taiwan, 13–16 August 1992; pp. 257–270. [Google Scholar]
  27. Hossain, A.B.S.; Sears, R.G.; Cox, T.S.; Paulsen, G.M. Desiccation Tolerance and Its Relationship to Assimilate Partitioning in Winter Wheat. Crop Sci. 1990, 30, 622–627. [Google Scholar] [CrossRef]
  28. Fischer, R.; Maurer, R. Drought resistance in spring wheat cultivars. I. Grain yield responses. Aust. J. Agric. Res. 1978, 29, 897–912. [Google Scholar] [CrossRef]
  29. Bouslama, M.; Schapaugh, W.T. Stress Tolerance in Soybeans. I. Evaluation of Three Screening Techniques for Heat and Drought Tolerance. Crop Sci. 1984, 24, 933–937. [Google Scholar] [CrossRef]
  30. Levy, D.; Coleman, W.K.; Veilleux, R.E. Adaptation of Potato to Water Shortage: Irrigation Management and Enhancement of Tolerance to Drought and Salinity. Am. J. Potato Res. 2013, 90, 186–206. [Google Scholar] [CrossRef]
  31. Kim, D.; Pertea, G.; Trapnell, C.; Pimentel, H.; Kelley, R.; Salzberg, S.L. TopHat2: Accurate alignment of transcriptomes in the presence of insertions, deletions and gene fusions. Genome Biol. 2013, 14, R36. [Google Scholar] [CrossRef] [Green Version]
  32. Li, H.; Handsaker, B.; Wysoker, A.; Fennell, T.; Ruan, J.; Homer, N.; Marth, G.; Abecasis, G.; Durbin, R. The Sequence Alignment/Map format and SAMtools. Bioinformatics 2009, 25, 2078–2079. [Google Scholar] [CrossRef] [Green Version]
  33. Trapnell, C.; Hendrickson, D.G.; Sauvageau, M.; Goff, L.; Rinn, J.L.; Pachter, L. Differential analysis of gene regulation at transcript resolution with RNA-seq. Nat. Biotechnol. 2013, 31, 46–53. [Google Scholar] [CrossRef]
  34. Fernandez-Pozo, N.; Menda, N.; Edwards, J.D.; Saha, S.; Tecle, I.Y.; Strickler, S.R.; Bombarely, A.; Fisher-York, T.; Pujar, A.; Foerster, H.; et al. The Sol Genomics Network (SGN)—From genotype to phenotype to breeding. Nucleic Acids Res. 2015, 43, D1036–D1041. [Google Scholar] [CrossRef] [PubMed]
  35. Tomato Genome Consortium The tomato genome sequence provides insights into fleshy fruit evolution. Nature 2012, 485, 635–641. [CrossRef] [PubMed] [Green Version]
  36. Alexa, A.; Rahnenfuhrer, J. topGO: Enrichment Analysis for Gene Ontology. R Package Version 2. 2010. Available online: https://bioconductor.org/packages/release/bioc/html/topGO.html (accessed on 15 July 2019).
  37. Hirsch, C.D.; Hamilton, J.P.; Childs, K.L.; Cepela, J.; Crisovan, E.; Vaillancourt, B.; Hirsch, C.N.; Habermann, M.; Neal, B.; Buell, C.R. Spud DB: A Resource for Mining Sequences, Genotypes, and Phenotypes to Accelerate Potato Breeding. Plant Genome 2014, 7, 42. [Google Scholar] [CrossRef] [Green Version]
  38. Geiss, G.K.; Bumgarner, R.E.; Birditt, B.; Dahl, T.; Dowidar, N.; Dunaway, D.L.; Fell, H.P.; Ferree, S.; George, R.D.; Grogan, T.; et al. Direct multiplexed measurement of gene expression with color-coded probe pairs. Nat. Biotechnol. 2008, 26, 317–325. [Google Scholar] [CrossRef] [PubMed]
  39. Tai, H.H.; Zebarth, B.J. Effect of Time of Day of Sampling on Potato Foliar Gene Expression Used to Assess Crop Nitrogen Status. Am. J. Potato Res. 2015, 92, 284–293. [Google Scholar] [CrossRef]
  40. Gálvez, J.H.; Tai, H.H.; Lagüe, M.; Zebarth, B.J.; Strömvik, M.V. The nitrogen responsive transcriptome in potato (Solanum tuberosum L.) reveals significant gene regulatory motifs. Sci. Rep. 2016, 6, 26090. [Google Scholar] [CrossRef] [Green Version]
  41. Quiñones, V.; Zanlungo, S.; Holuigue, L.; Litvak, S.; Jordana, X. The cox1 initiation codon is created by RNA editing in potato mitochondria. Plant Physiol. 1995, 108, 1327–1328. [Google Scholar] [CrossRef] [Green Version]
  42. Nakane, E.; Kawakita, K.; Doke, N.; Yoshioka, H. Elicitation of primary and secondary metabolism during defense in the potato. J. Gen. Plant Pathol. 2003, 69, 378–384. [Google Scholar] [CrossRef]
  43. Drouin, G.; Dover, G.A. Independent gene evolution in the potato actin gene family demonstrated by phylogenetic procedures for resolving gene conversions and the phylogeny of angiosperm actin genes. J. Mol. Evol. 1990, 31, 132–150. [Google Scholar] [CrossRef]
  44. Romero, A.P.; Alarcón, A.; Valbuena, R.I.; Galeano, C.H. Physiological Assessment of Water Stress in Potato Using Spectral Information. Front. Plant Sci. 2017, 8, 1608. [Google Scholar] [CrossRef]
  45. Saravia, D.; Farfán-Vignolo, E.R.; Gutiérrez, R.; De Mendiburu, F.; Schafleitner, R.; Bonierbale, M.; Khan, M.A. Yield and Physiological Response of Potatoes Indicate Different Strategies to Cope with Drought Stress and Nitrogen Fertilization. Am. J. Potato Res. 2016, 93, 288–295. [Google Scholar] [CrossRef] [Green Version]
  46. Rudack, K.; Seddig, S.; Sprenger, H.; Köhl, K.; Uptmoor, R.; Ordon, F. Drought stress-induced changes in starch yield and physiological traits in potato. J. Agron. Crop Sci. 2017, 203, 494–505. [Google Scholar] [CrossRef]
  47. Pieczynski, M.; Wyrzykowska, A.; Milanowska, K.; Boguszewska-Mankowska, D.; Zagdanska, B.; Karlowski, W.; Jarmolowski, A.; Szweykowska-Kulinska, Z. Genomewide identification of genes involved in the potato response to drought indicates functional evolutionary conservation with Arabidopsis plants. Plant Biotechnol. J. 2018, 16, 603–614. [Google Scholar] [CrossRef] [PubMed] [Green Version]
  48. Pirasteh-Anosheh, H.; Saed-Moucheshi, A.; Pakniyat, H.; Pessarakli, M. Stomatal responses to drought stress. In Water Stress and Crop Plants; Ahmad, P., Ed.; John Wiley & Sons, Ltd.: Chichester, UK, 2016; pp. 24–40. [Google Scholar]
  49. Olvera-Carrillo, Y.; Luis Reyes, J.; Covarrubias, A.A. Late embryogenesis abundant proteins: Versatile players in the plant adaptation to water limiting environments. Plant Signal. Behav. 2011, 6, 586–589. [Google Scholar] [CrossRef] [PubMed] [Green Version]
  50. Sengupta, S.; Mukherjee, S.; Basak, P.; Majumder, A.L. Significance of galactinol and raffinose family oligosaccharide synthesis in plants. Front. Plant Sci. 2015, 6, 656. [Google Scholar] [CrossRef] [Green Version]
  51. Chen, D.; Shao, Q.; Yin, L.; Younis, A.; Zheng, B. Polyamine Function in Plants: Metabolism, Regulation on Development, and Roles in Abiotic Stress Responses. Front. Plant Sci. 2019, 9, 1945. [Google Scholar] [CrossRef]
  52. He, M.; Dijkstra, F.A. Drought effect on plant nitrogen and phosphorus: A meta-analysis. New Phytol. 2014, 204, 924–931. [Google Scholar] [CrossRef]
  53. Hammond-Kosack, K.E.; Jones, J.D.G. Plant Disease Resistance Genes. Annu. Rev. Plant Physiol. Plant Mol. Biol. 1997, 48, 575–607. [Google Scholar] [CrossRef] [Green Version]
  54. Breen, S.; Williams, S.J.; Outram, M.; Kobe, B.; Solomon, P.S. Emerging Insights into the Functions of Pathogenesis-Related Protein 1. Trends Plant Sci. 2017, 22, 871–879. [Google Scholar] [CrossRef]
  55. Sung, D.Y.; Vierling, E.; Guy, C.L. Comprehensive Expression Profile Analysis of the Arabidopsis Hsp70 Gene Family. Plant Physiol. 2001, 126, 789–800. [Google Scholar] [CrossRef] [Green Version]
Figure 1. Volumetric soil water content (θ. % vv) in four genotypes of potato (Cardinal, Desiree, Mije, and Clone 37 FB). During water stress experiments, plants were grown in pots under greenhouse conditions (25 °C ± 3. 16/8 h day/night photoperiod) and two watering treatments: (Control) well-watered, with 100% to 96% irrigation; and (treatment), a controlled water stress cycle with a 21-day period. The values are the means ± SD (n = 8; four sensors per block and two per clone).
Agronomy 09 00848 g001
Figure 2. Relations among yield-based selection indices and genotypes of potato. Hierarchical classification of genotypes of potato using yield-based selection indices during the 2016 season in a greenhouse.
Agronomy 09 00848 g002
Figure 3. Comparative effects of water stress 21 days after the beginning of tuberization in two varieties, Cardinal and Desirée, and two landraces, Mije and Clone 37 FB, under greenhouse conditions (23 °C ± 3. 16/8 h day/night photoperiod).
Agronomy 09 00848 g003
Figure 4. Profile of stomatal conductance (gs) (mmol m−2 s−1) measured once per week for three weeks of water stress in four potato genotypes, (a) Cardinal and (b) Desiree, (c) Mije, and (d) Clone 37 FB genotypes, under greenhouse conditions (23 °C ± 3. 16/8 h day/night photoperiod). (*** shows differences between treatments).
Agronomy 09 00848 g004
Figure 5. Venn diagram of differentially expressed genes. Up- and downregulated genes with water stress for each of the cultivars were compared.
Agronomy 09 00848 g005
Figure 6. GO term enrichment. topGO was used to analyze the enrichment of GO terms for up- and downregulated genes for (a) Cardinal, (b) Desirée, (c) Mije, and (d) Clone 37 FB.
Agronomy 09 00848 g006
Figure 7. Correlation between gene expression measured using transcriptome sequencing and the nCounter Digital Analyzer. Pearson correlation of the log2 differences between FPKM and nCounter Digital Analyzer measurements for the 24 genes.
Agronomy 09 00848 g007
Table 1. Effects of water stress on the total fresh weight of tubers (g/plant) and response (%) for four potato genotypes, Cardinal, Desiree, Clone 37 FB, and Mije, under greenhouse conditions (23 °C ± 3. 16/8 h day/night photoperiod). The letters indicate the results of the Tukey multiple comparisons post-hoc test. The same letters after each value indicates that no significant differences were found.
Total Fresh Weight of Tuber
GenotypeControl (g/plant)Treatment (g/plant)Response
(treatment/control) × 100 (%)
Cardinal35.1±12.7Ba13.4±1.2Bb42.24±12.9A
Desiree32.5± 3.7Ba25.7± 2.4Cb83.15± 7.9A
Mije24.9± 2.1Ba24.7± 1.4Ca99.84± 7.4AB
Clone 37 FB5.3± 0.9Aa7.8± 1.2Ab151.7± 45.6B
Table 2. Effects of water stress on the average fresh weight per tuber (g/tuber) and response (%) for four potato genotypes, Cardinal, Desiree, Clone 37 FB, and Mije, under greenhouse conditions (23 °C ± 3. 16/8 h day/night photoperiod).
Average Fresh Weight of Tubers
GenotypeControl (g/tuber)Treatment (g/tuber)Response
(treatment/control) × 100 (%)
Cardinal7.0 ± 2.5Ba3.01 ± 0.4Ab44.65 ± 9.39A
Desiree9.9 ± 2.3Ca8.6 ± 0.8Ba92.43 ± 18.23A
Mije3.2 ± 0.3ABa2.8 ± 0.1Aa88.77 ± 13.5A
Clone 37 FB1.6 ± 0.3Aa2.6 ± 0.4Ab165.3 ± 38.2B
Table 3. Effects of water stress on the average dry weight per tuber (g/tuber) and response (%) for four potato genotypes, Cardinal, Desiree, Clone 37 FB, and Mije, under greenhouse conditions (23 °C ± 3. 16/8 h day/night photoperiod). The letters indicate the results of the Tukey multiple comparisons post-hoc test. The same letters after each value indicates that no significant differences were found.
Average Dry Weight of Tubers
GenotypeControl (g/tuber)Treatment (g/tuber)Response
(treatment/control) × 100 (%)
Cardinal1.5 ± 0.7ABa0.7 ± 0.1Aa53.61 ± 21.32A
Desiree2.1 ± 0.7Ba1.7 ± 0.4Bb93.60 ± 18A
Mije0.5 ± 0.1Aa0.6 ± 0.04Aa121.15 ± 26.74A
Clone 37 FB0.2 ± 0.1Aa0.3 ± 0.1Aa64.83 ± 75.02A
Table 4. Effects of water stress on the average water content per tuber (g/tuber) and response (%) for four potato genotypes, Cardinal, Desiree, Clone 37 FB, and Mije, under greenhouse conditions (23 °C ± 3. 16/8 h day/night photoperiod). The letters indicate the results of the Tukey multiple comparisons post-hoc test. The same letters after each value indicates that no significant differences were found.
Average Water Content of Tubers
GenotypeControl (g/tuber)Treatment (g/tuber)Response
(treatment /control) × 100 (%)
Cardinal5.5 ± 2.4ABa2.3 ± 0.4Aa44.20 ± 10.10A
Desiree7.8 ± 2.0Ba6.8 ± 0.4Ba93.25 ± 21.1A
Mije2.7 ± 0.3Aa2.2 ± 0.1Aa82.98 ± 15.64A
Clone 37 FB1.4 ± 0.4Aa2.3 ± 0.5Aa179.65 ± 54.09B
Table 5. Effects of water stress on the average water content of shoot + root (g/tuber) and response (%) for four potato genotypes, Cardinal, Desiree, Clone 37 FB, and Mije, under greenhouse conditions (23 °C ± 3. 16/8 h day/night photoperiod). The letters indicate the results of the Tukey multiple comparisons post-hoc test. The same letters after each value indicates that no significant differences were found.
Average Water Content of Shoot + Root
GenotypeControl (g/tuber)Treatment (g/tuber)Response
(treatment /control) × 100 (%)
Cardinal12.02 ± 2.9Aa8.5 ± 2.9ABa71.59 ± 22.67A
Desiree23.6 ± 6.1Ba14.7 ± 2.8Cb64.17 ± 12.66A
Mije6.3 ± 1.4Aa4.2 ± 1.9Ab57.13 ± 24.74A
Clone 37 FB6.1 ± 0.7Aa11.9 ± 1.5BCa196.81 ± 44.66B

