Article

Comparing the Grain Yields of Direct-Seeded and Transplanted Rice: A Meta-Analysis

1
MARA Key Laboratory of Crop Ecophysiology and Farming System in the Middle Reaches of the Yangtze River, College of Plant Science and Technology, Huazhong Agricultural University, Wuhan 430070, China
2
National Key Laboratory of Crop Genetic Improvement, Wuhan 430070, China
3
Hubei Collaborative Innovation Center for Grain Industry, Yangtze University, Jingzhou 434023, China
*
Author to whom correspondence should be addressed.
Agronomy 2019, 9(11), 767; https://doi.org/10.3390/agronomy9110767
Submission received: 28 October 2019 / Revised: 13 November 2019 / Accepted: 15 November 2019 / Published: 17 November 2019

Abstract

:
Conventional transplanted rice (TPR) has been increasingly replaced by direct-seeded rice (DSR) because of its low water and labour requirements. Whether and how DSR can be as productive as TPR has received widespread attention. Here, a comprehensive meta-analysis was performed to quantify the effects of direct seeding on rice yield and identify the management and environmental factors that contribute to the yield gap between DSR and TPR. The results showed that, overall, the yield of DSR was 12% lower than that of TPR. However, the yield loss of DSR relative to TPR was highly variable depending on management practices, soil type, and climate conditions, ranging from −2% to −42%. Weed and water management and climatic stress had the largest impact on yield performance, resulting in over 15% yield variation. With respect to soil properties, the yield gap can be significantly reduced by planting in areas with high organic carbon content, such as clayed and acidic soils. Furthermore, the DSR yield penalty was only 4% in a high-yielding condition compared to 14% in a low-yielding condition. All these factors indicate that optimizing management practices is necessary to improve DSR yield performance and narrow the yield gap between DSR and TPR. In conclusion, DSR could produce comparable yields to TPR but is more prone to yield losses due to inappropriate management practices, unsuitable soil properties, and climatic stresses.

1. Introduction

Rice is the staple food crop for more than half of the world’s population, while accounting for only 11% of the planet’s cultivated land [1]. Global grain production is expected to increase by 50%, to meet the growing food demands, from 2010 to 2030 [2]. This is not an easy task, as it not only requires crop genetic improvement and management optimization but is also influenced by socioeconomic and physical factors related to rice production [3]. Rapid economic development in Asia has increased the labour demand for non-agricultural sectors, leading to a considerable decline in labour availability and increased labour wages in agriculture [4]. Meanwhile, water scarcity for rice cultivation has been serious and widespread, with approximately 18 million hectares of irrigated rice in Asia being projected to suffer from water scarcity by 2025 [5]. Therefore, rice cultivation technology must be developed to simultaneously reduce labour and water input while maintaining yield potential [6].
At present, over 70% of global rice is grown in wetlands with puddling followed by transplanting [4,7]. In a conventional transplanted rice (TPR) system, large quantities of water are applied (ca. 2500 litres) to produce 1 kg of rough rice [8]. Crop establishment consists of the following four basic steps: nursery bed preparation, seedling raising, seedling uprooting, and transplanting the seedling into the main field. These practices are highly labour- and water-intensive and are becoming less profitable, as these resources are increasingly scarce [9]. Direct-seeded rice (DSR) has emerged as a feasible alternative establishment method to deal with water and labour shortages [10]. Direct seeding of rice refers to the process of establishing a rice crop by sowing seeds directly into the field. There are three methods of rice direct seeding: dry seeding (sowing dry seeds into dry soil), wet seeding (sowing pre-germinated seeds on wet puddled soil), and water seeding (sowing seeds into standing water) [11]. Because of its lower planting cost, DSR is more easily adopted by rice growers whose goal is to maximize economic returns. At the beginning of the 21st century, DSR occupied 21% of the total rice planting area in Asia [12]. In recent years, DSR cultivation has been increasingly adopted by famers in many traditional TPR regions [10]. However, this cultivation transformation has aroused governments’ concerns about the underlying risk of yield loss, which may threaten food security [13].
To determine whether yields can be successfully maintained, numerous field experiments have been conducted to determine yield differences between DSR and TPR under various climate, soil, and management conditions. Some studies have indicated that the DSR yield matched, or even exceeded, the TPR yield and should, therefore, be widely promoted to farmers because of high net economic returns [14,15]. However, this viewpoint has been challenged by many other studies, which observed apparent yield losses for DSR on farmers’ fields and in plot-scale experiments [16]. These conflicting results may be attributed to variations in environmental (e.g., soil property and climate condition) and management factors (e.g., tillage method, weed control, and nitrogen input). Given these uncertainties, we performed a comprehensive meta-analysis to synthesize previous studies. At present, there have been synthesis papers on evaluated yield, water use efficiency, and greenhouse gas emission between DSR and TPR [4]. However, to what extent each management practice and environment factor affects the yield performance of DSR relative to TPR is still obscure. Therefore, the objectives of this study were to (1) quantify the effect of direct seeding on rice yield relative to transplanting and (2) to identify management and environmental factors that contribute to the yield gap between DSR and TPR. This information will provide scientific support for evidence-based crop management.

2. Materials and Methods

2.1. Data Collection

A literature search was conducted in Google Scholar and Web of Science to collect articles published from 1980 to 2017 that compared rice yields of DSR and TPR in field experiments. The following keywords were used in the search: “transplanted rice”, “direct-seeded rice”, “yield”, and “field”. Then, the articles were restricted by the following three requirements: (1) the experiment must be conducted in field conditions and not in pot or greenhouse conditions, (2) the yield data for the DSR and TPR were available, and (3) DSR and TPR must be compared side-by-side and keep all other management practices the same. The detailed procedure used for the selection of research papers in this meta-analysis is presented in the Systematic Reviews and Meta-Analyses (PRISMA) flow diagram (Figure S1).
Experimental information and yield-related data were extracted directly from tables and text or indirectly from figures using WinDIG 2.5 (Express Compression Laboratories, Melbourne, Australia). In total, 440 paired observations from 53 studies that included both indica and japonica varieties were used in the meta-analysis. The field sizes of the DSR and TPR plots were the same within each paired observation, ranging from 10 to 200 m2. For each study, all comparisons between DSR and TPR on yield were separately included in our meta-analysis. Multi-factorial studies (i.e., studies in which DSR and TPR treatments were combined with other treatments in a factorial design) and studies that reported results for multiple years contribute more than one comparison to our dataset. To evaluate how the effect size varies with management and environmental factors, we recorded and categorized the following moderating variables: (1) dry seeding or wet seeding, i.e., if the crop establishment was completed by sowing dry seeds into dry soil or pre-germinated seeds into wet puddled soil (there was no available water-seeded experiment to include in the meta-analysis); (2) dibble seeding, row seeding, or manual broadcast; (3) intensive weed control, i.e., when weeds were intensively controlled to avoid any yield loss, moderate weed control, i.e., when experimental plots implemented a weed control practice, but weed infestation still remained, or no weed control, i.e., when no control practice was implemented; (4) zero, reduced, or conventional tillage; (5) no water stress, i.e., when the soil moisture of the plots maintained a continuous level of flooding or remained above the field holding capacity, mild water stress, i.e., when the soil water potential was not allowed to drop below −20 kPa, or severe water stress, i.e., when the soil water potential was allowed to drop below −20 kPa; (6) low, moderate or high nitrogen input, i.e., when field nitrogen input was <60, 60–120, or >120 kg ha−1, respectively; (7) soil pH < 7 or ≥7; (8) soil organic carbon content (SOC) ≤1% or >1%; (9) soil texture divided into clay or non-clay. The seeding time of TPR and DSR is usually different, which may lead to unbalanced climatic stress and cause different yield losses between TPR and DSR. Therefore, we categorized (10) the presence or absence of climatic stress induced by improper seeding time, i.e., if DSR and TPR sowed rice seeds on the same day, they experienced the same climatic condition, and then these observations were classified as “climatic stress absented”. In contrast, if the papers reported unbalanced climatic stress occurring due to different seeding times, the observations were classified as “climatic stress occurred”. Transplanting time was not considered here. The observations of “climatic stress occurred” were excluded from the database, and the rest was divided into three groups based on TP yield (i.e., below 6 t ha−1, from 6 to 8 t ha−1, or above 8 t ha−1) to investigate how DSR yield performance varies at different yielding and management levels. Yielding level is considered to be dependent on the knowledge- and input-intensiveness of management practices.

2.2. Data Analysis

Meta-analysis procedures using Comprehensive Meta-Analysis V2.0 software (Biostat, Inc., Englewood, New Jersey, USA) were conducted to compare TPR and DSR yield performance. The log-ratios between TPR and DSR yields were analysed for normality using the Kolmogorov–Smirnov test and quantile-quantile plot, and the results of the test (p = 0.07) and quantile-quantile plot (Figure S2) confirmed the normal distribution. A random-effects model was used to compute the summary effect. First, the effect size was calculated as a response ratio (R) on a log scale for each paired observation (Equation (1)), as follows:
ln   R = ln   ( X D S R X T P R )
where XDSR is the mean yield of DSR, and XTPR is the mean yield of TPR. The variance of the ln R for study (i) (Vi) was approximated using the following formula:
V i = ( S D 1 ) 2 n 1 X T P R + ( S D 2 ) 2 n 2 X D S R
where SD1 and SD2 are the standard deviation for the TPR and DSR treatment in study (i), respectively; n1 and n2 are the sample sizes for the TPR and DSR treatments, respectively. Next, a weight was assigned to each study under the inverse scheme (Equation (3)), as follows:
W i = 1 V i + T 2
where Wi is the weight assigned to study (i), Vi is the within-study variance for study (i), and T2 is the between-study variance that is common to all studies. The T2 estimation is made using the DerSimonian and Laird method [17]. Given that some studies fail to provide standard deviation (SD) for their outcomes, we imputed the SD for each study by calculating the pooled SD from all other studies in this meta-analysis that provided the SD in their results, according to the established method [18]. The pooled SD was determined by using the formula below:
SD pooled = ( n j 1 ) S D j 2 ( n j 1 )
where SDj and nj are the standard deviation and replication number of study (j), respectively. This practice may result in a biased point estimate of the treatment effect if the studies with missing SD information are not a random subset of all the available studies. Therefore, we examined the validity of this imputation practice using the method of Furukawa [18]. First, the studies that reported SD information were selected, and we calculated the actual effect size of each individual study in the random model. Secondly, 27 studies that missed SD were substituted with the imputed SD to estimate the hypothetical effect size of each individual study. Then, the concordance between individual effect sizes was examined by using the analysis of variance (ANOVA) intraclass correlation coefficient. The determination coefficient turned out to be 0.87 (Figure S3), implying that this imputation was less likely to change the overall effect size. Thus, the imputed SD was used in the subsequent analysis. The weighted summary effect size was then computed as follows:
M = ( l n R i × W i ) W i
where M is the weighted summary effect size, and Ri and Wi are the response ratio and the weight for study (i), respectively. Finally, the variance of the summary effect was estimated as the reciprocal of the sum of the weights, and the 95% confidence interval (CI) for the effect was calculated as follows:
L L M = M 1.96 × V M
U L M = M + 1.96 × V M
where LLM and ULM are the 95% lower and upper limits for the summary effect, respectively, and M and VM are the summary effect and its variance, respectively. For ease of interpretation, the response effects were expressed as the percentage yield change of DSR relative to TPR using the equation A = ( e lnM 1 ) × 100 % , which we also refer to in the text as “DSR relative yield”.
To test whether the effect size was significantly different between groups, the homogeneity was examined using a Q-test based on analysis of variance, where total heterogeneity (QTotal) was divided into within-group (QW) and between-group (QB) heterogeneity. Under the null hypothesis that the effect size is the same for all groups, 1 to p, QB would be distributed as chi-squared with a degree of freedom equal to p-1. QB rather than QW is of considerable scientific interest [19]. The significance of QB was tested by comparing it against the critical value of the χ2 distribution. A significant QB denotes that the cumulative effect size is not the same for different groups. Differences were considered to be statistically significant when p < 0.05.
For yield components, an unweighted meta-analysis was conducted because most studies did not report information on the variance of observations; therefore, all experiments were considered to have equivalent statistical precision [20]. In an unweighted meta-analysis, the summary effect was considered to be significantly different when the 95% confidence intervals did not overlap with zero. To simplify our interpretation, the effect size was expressed as the percentage change in all comparisons.
Regression analysis using a multiple linear model was applied to examine the associations between yields (ln R) with the major moderating variables. The adjusted r-squared statistic value was used to represent the goodness of fit, and its statistical significance was examined using an F test and its corresponding p level. The regression coefficients were calculated to obtain the prediction equation. To test whether a confounding effect exists between the moderating variables, the collinearity statistics were tested, including the variance inflation factor (VIF) and tolerance. Multi-collinearity was considered to exist if variables with VIF was greater than 10 [21].

2.3. Publication Bias
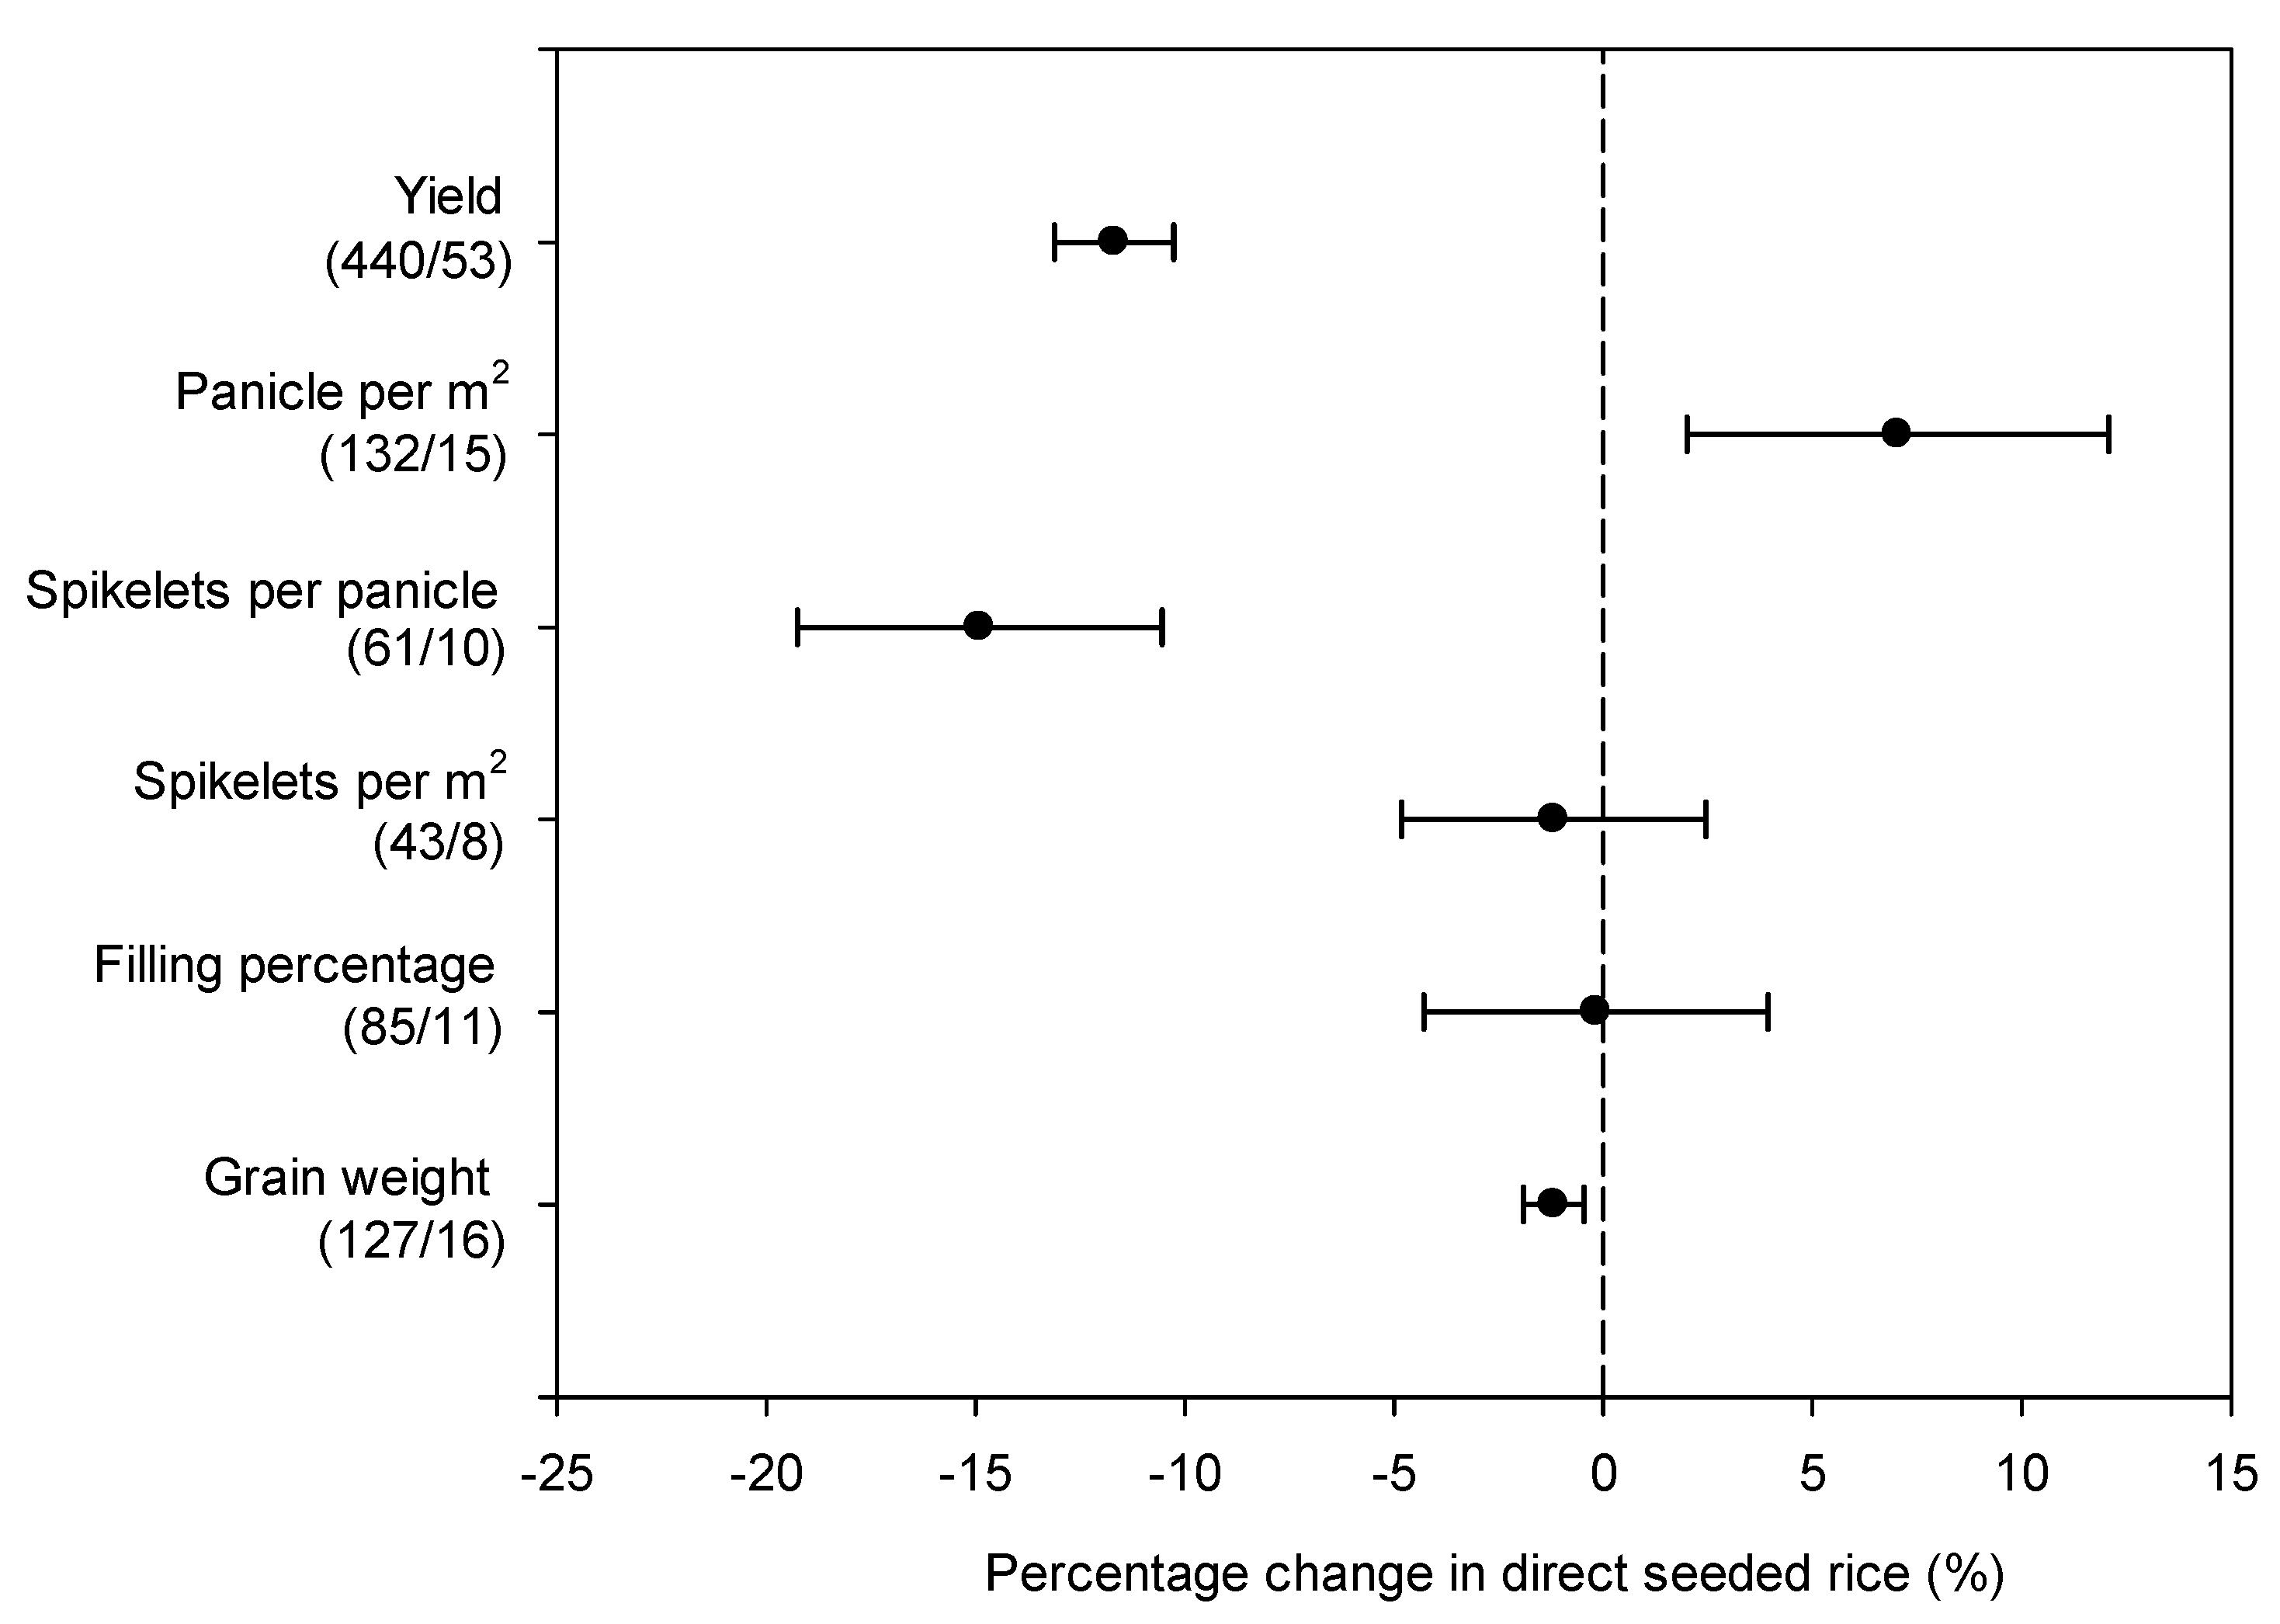
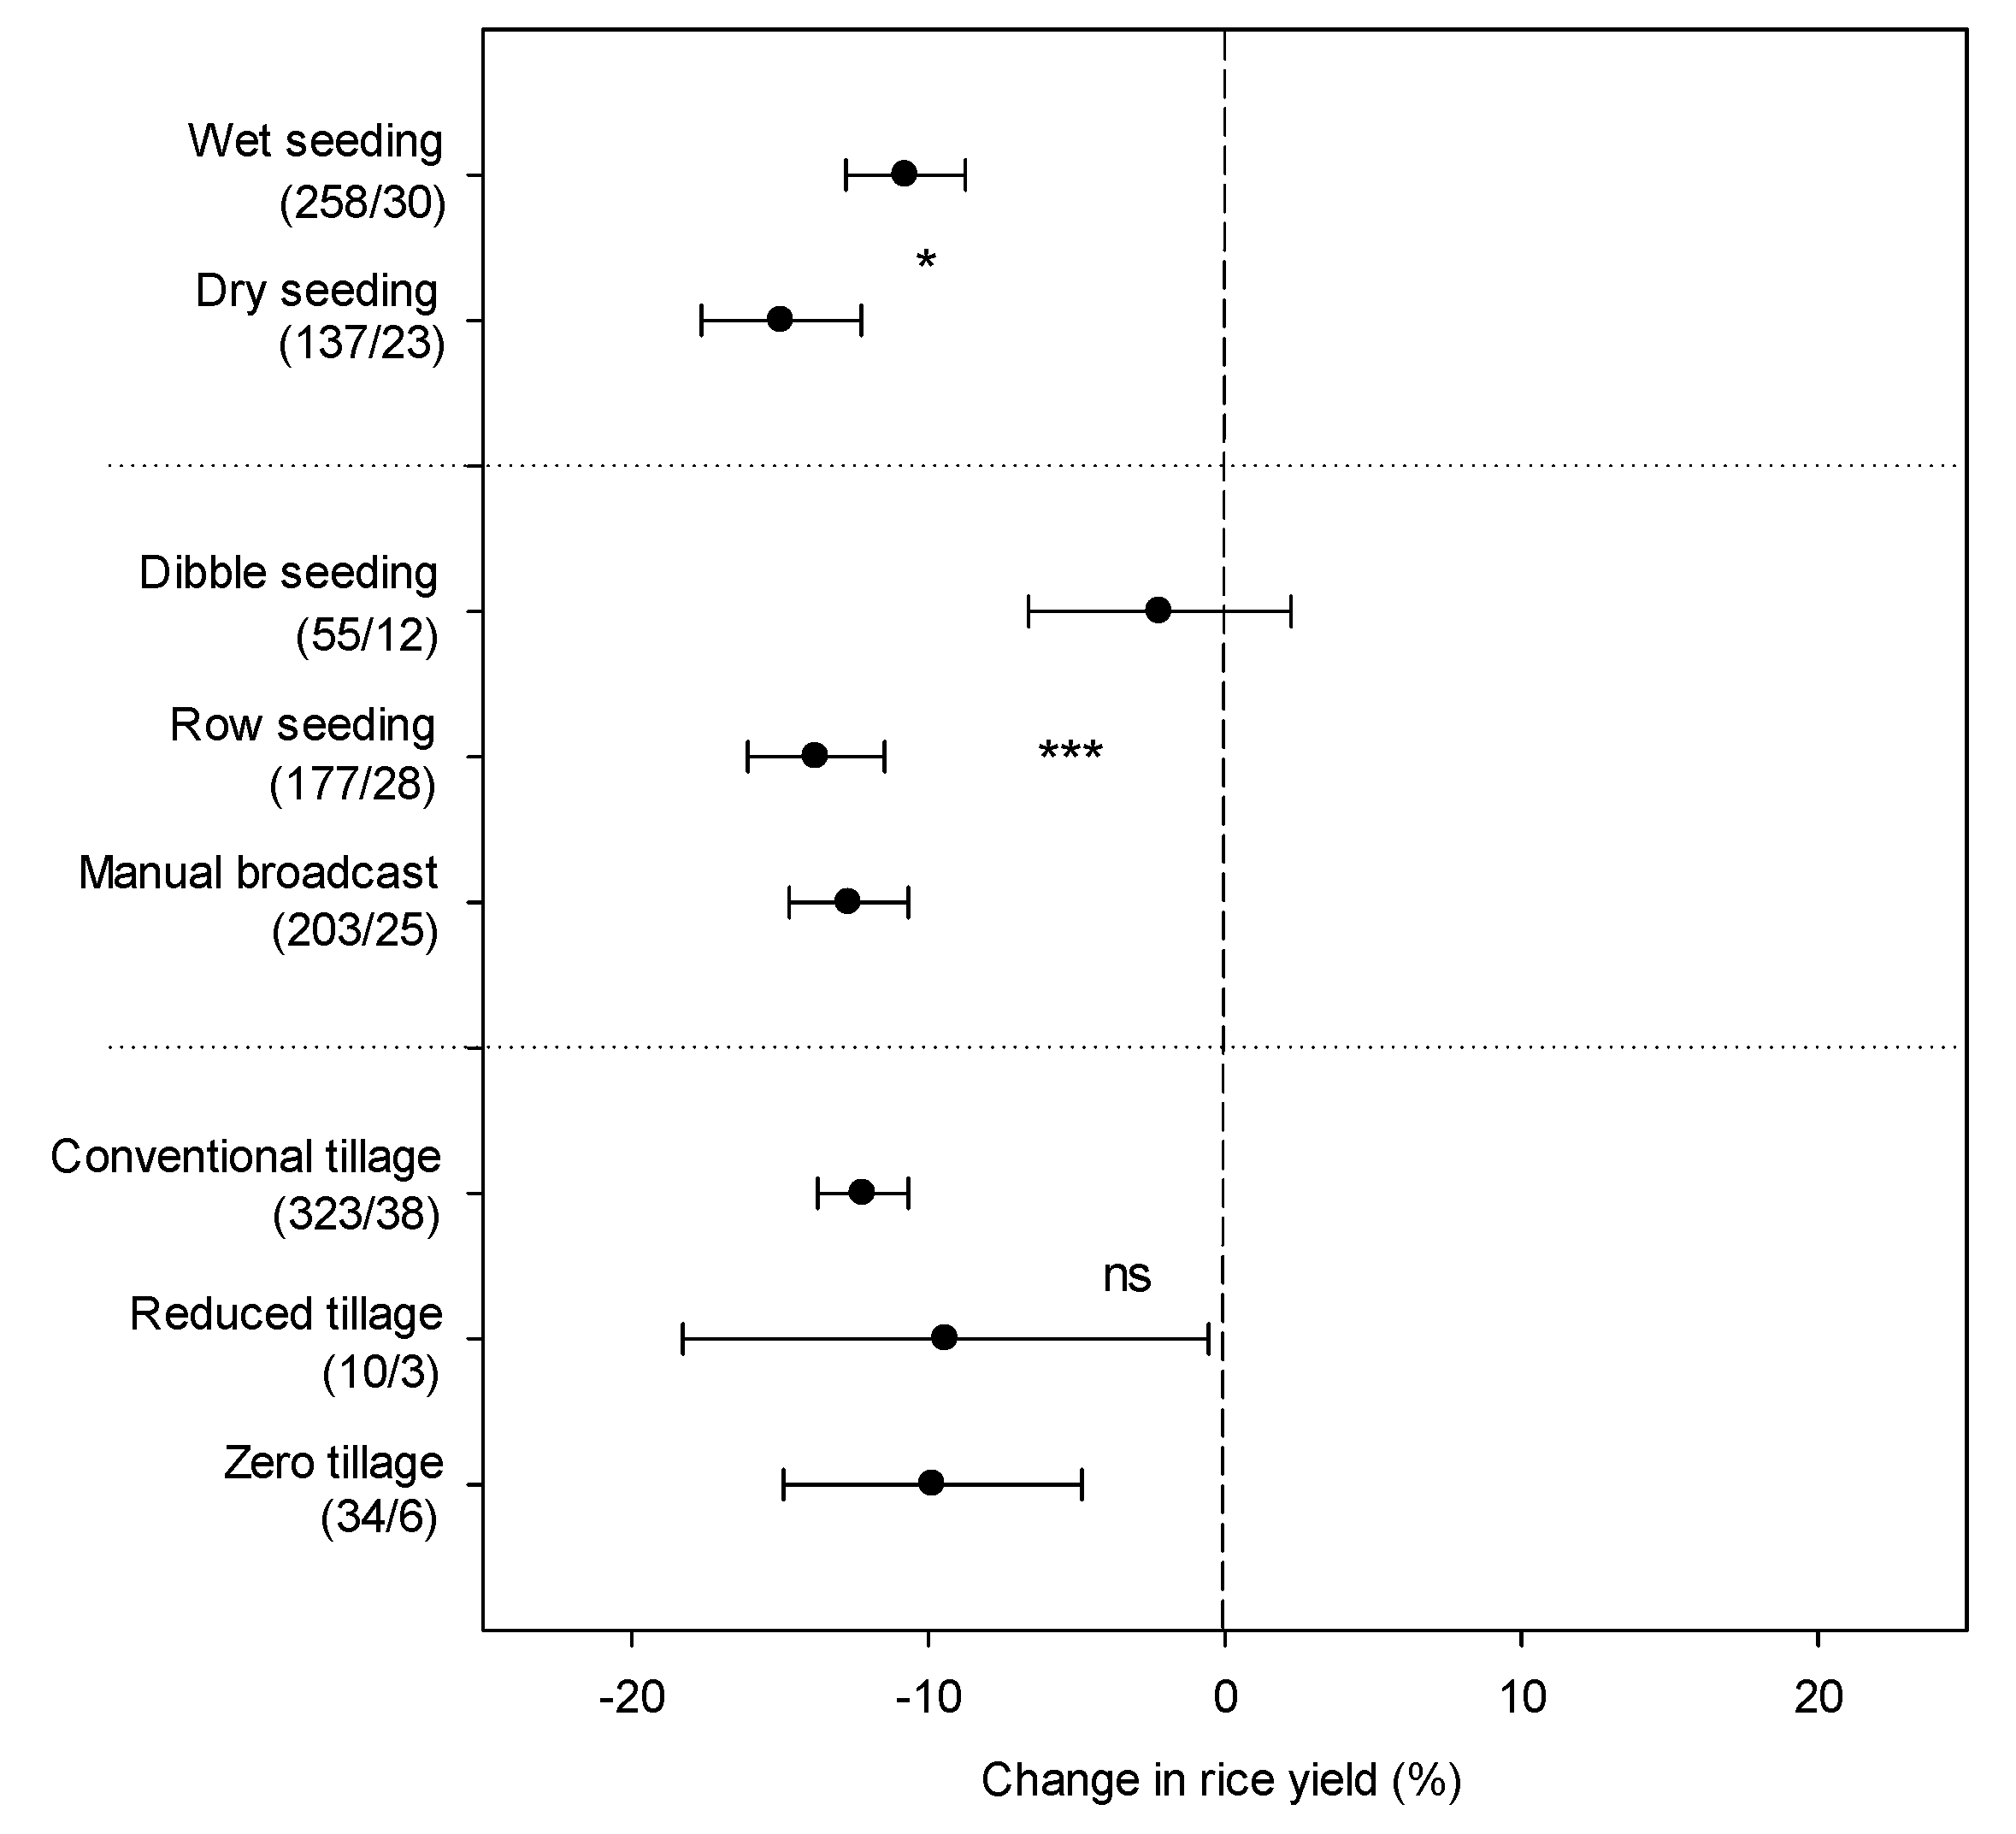
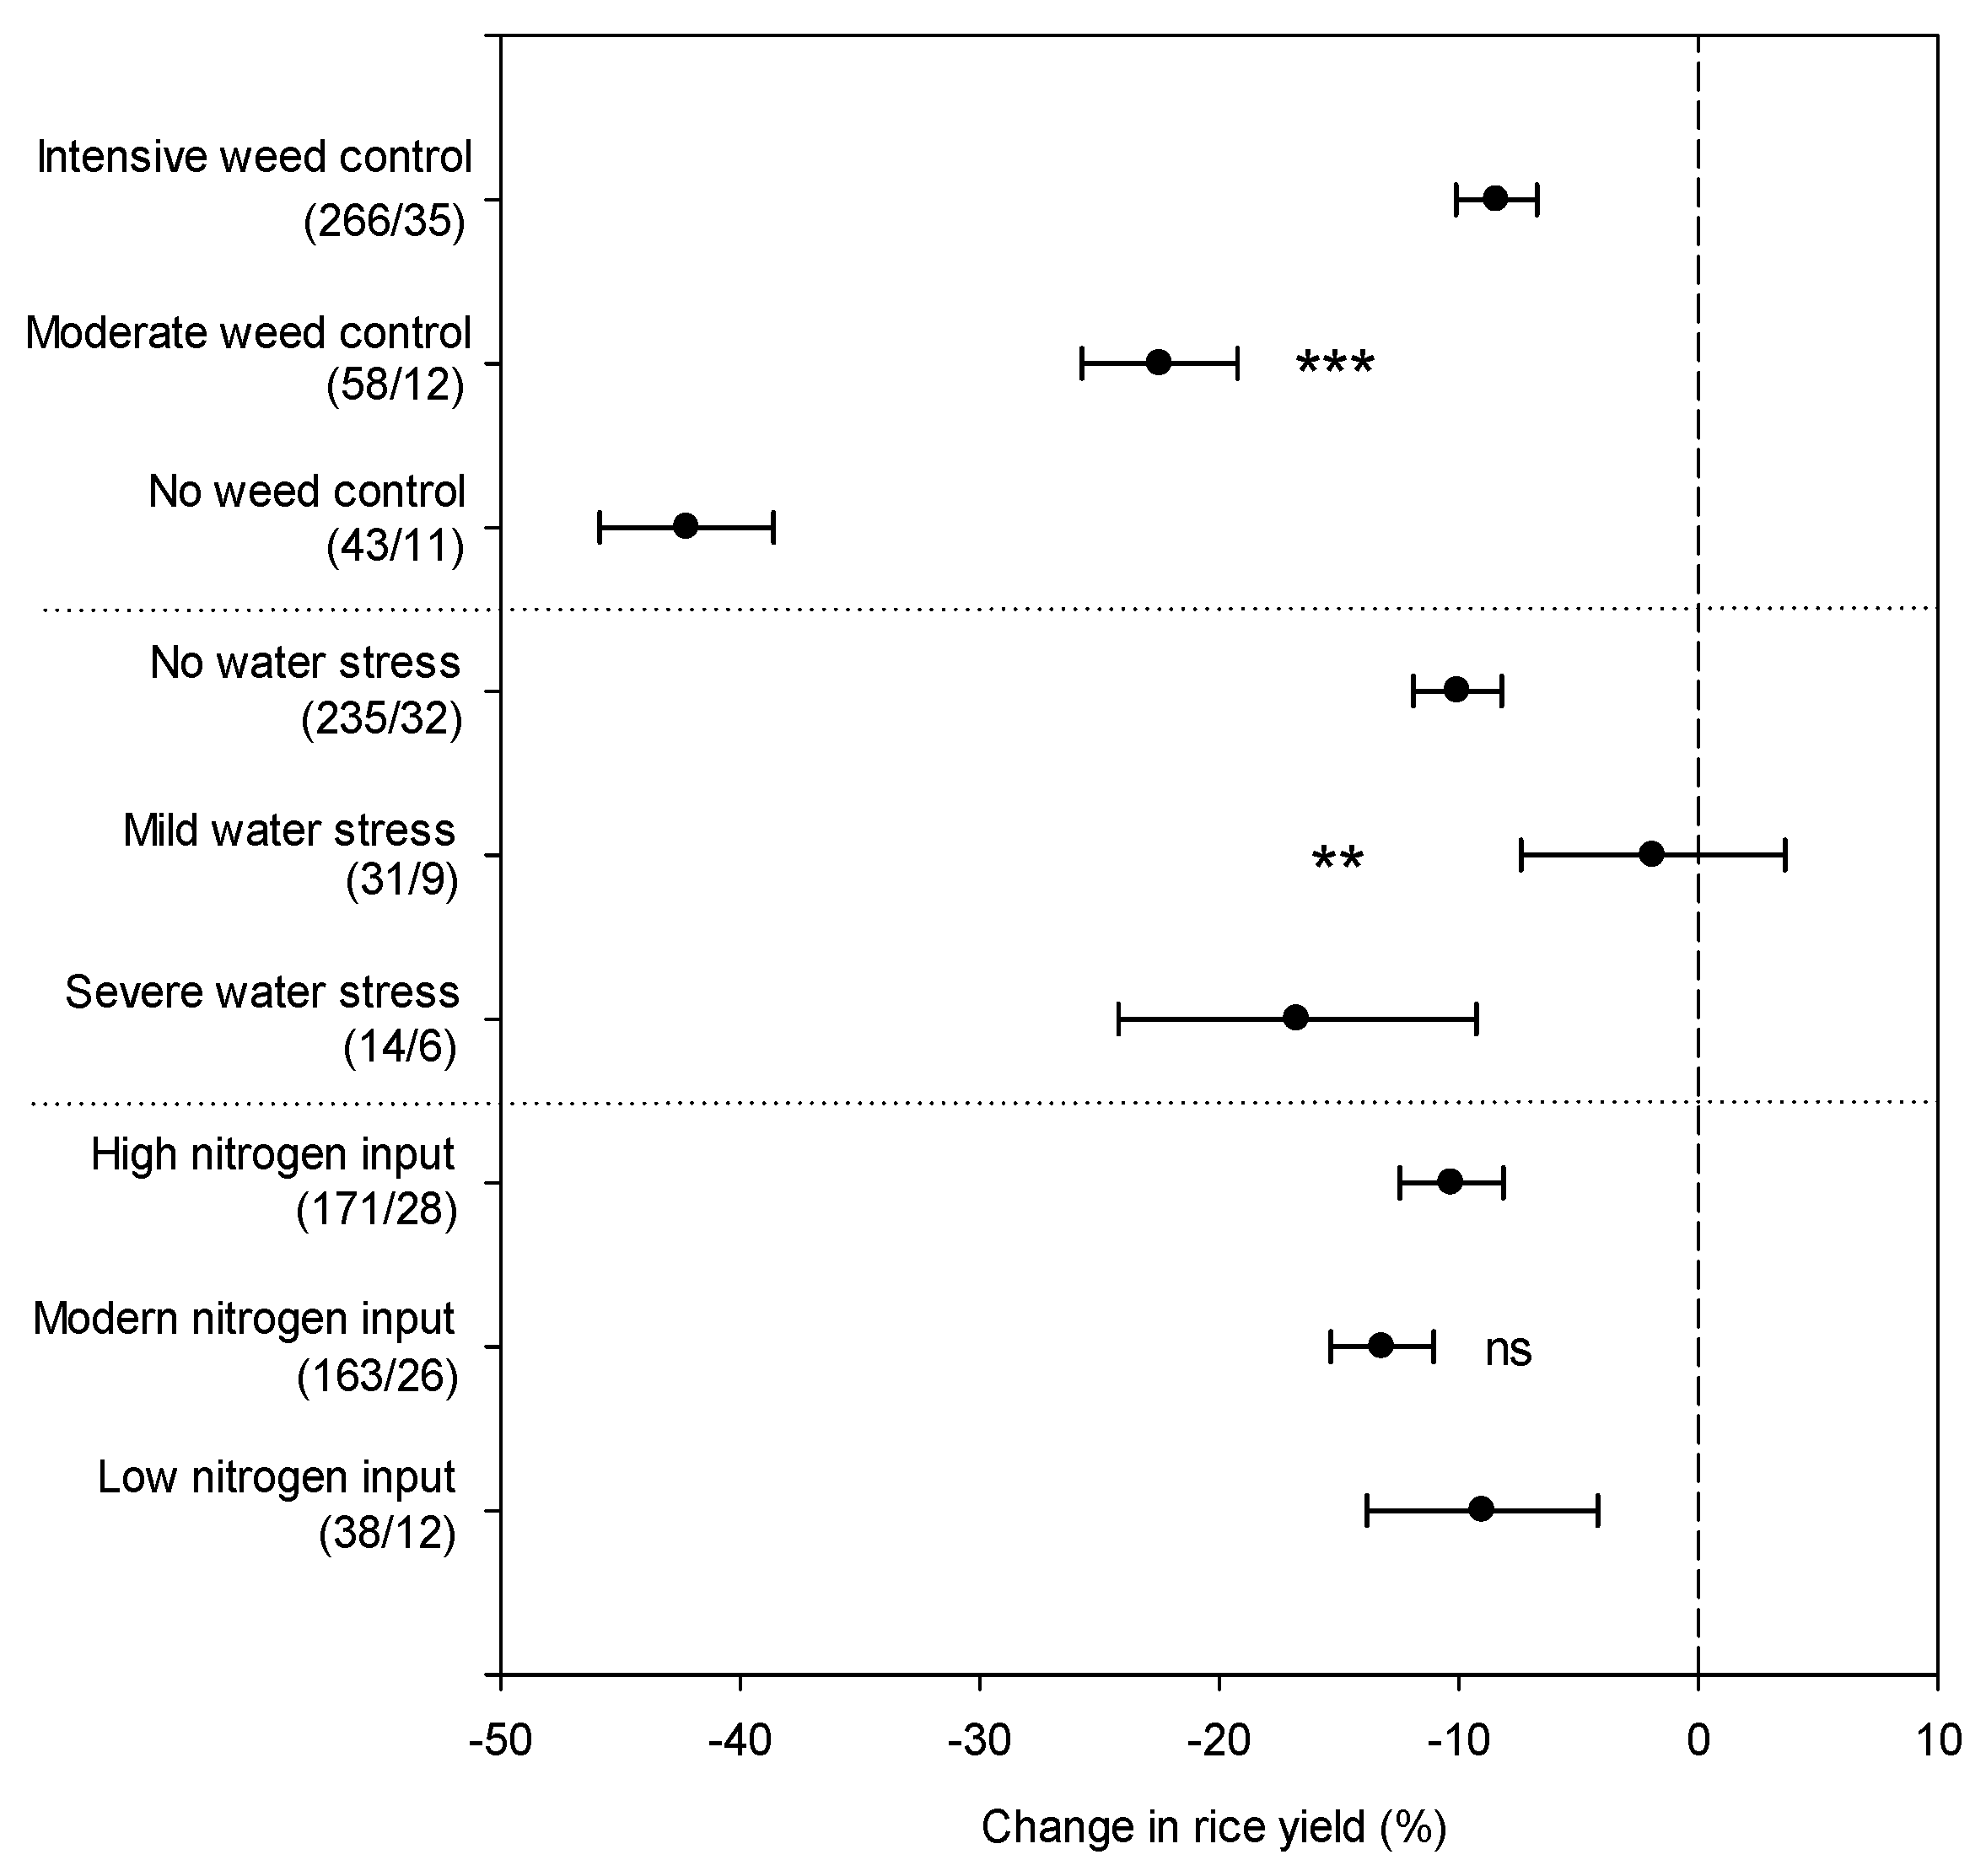
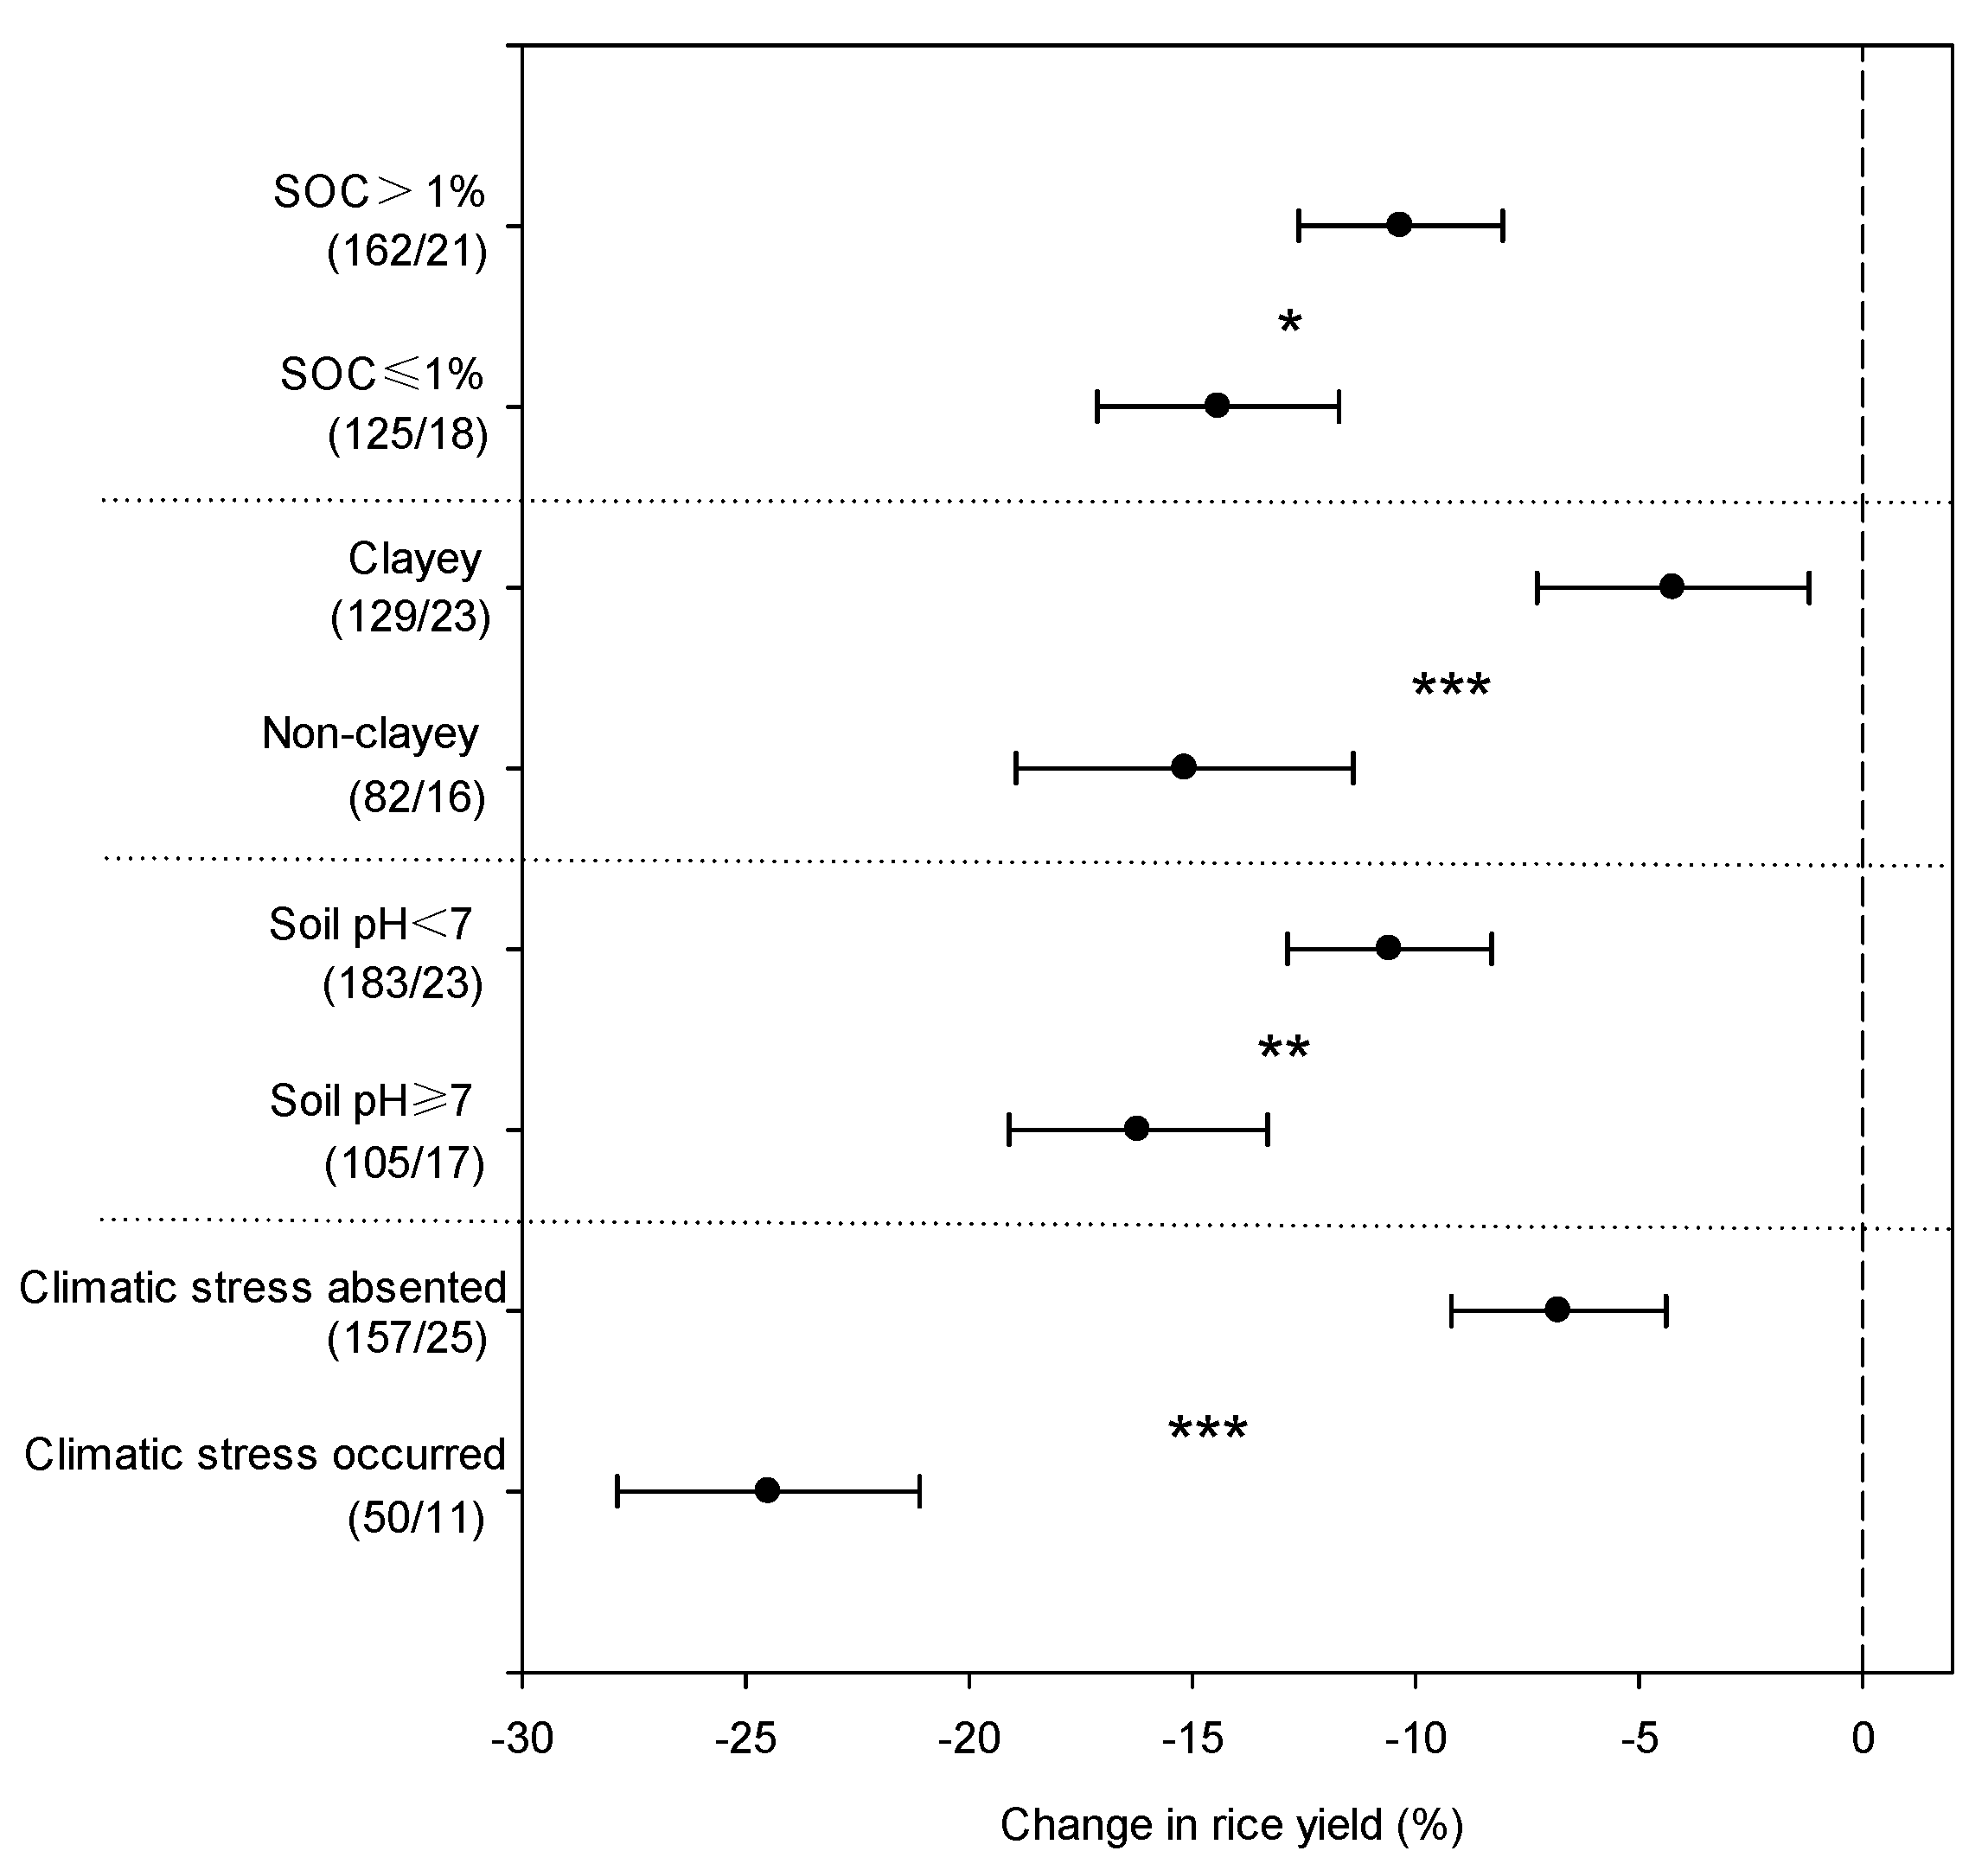
Publication bias is a common problem in meta-analyses because studies that report relatively high effect sizes are more likely to be published than studies that report lower effect sizes. In this study, publication bias was assessed with the funnel plot approach and Rosenthal’s fail-safe number method [22]. The funnel plot shows the absence of publication bias when, with visual inspection, observations distribute symmetrically about the summary effect size. To estimate how much impact the bias had, we generated an unbiased funnel plot and re-computed the imputed effect size, following Duval and Tweedie’s Trim and Fill method [23], to determine whether the imputed observations could nullify the summary effect size. Given that some non-significant studies are less likely to be published, Rosenthal’s fail-safe number was computed (i.e., the number of paired observations in the present study that would be required to nullify the summary effect). We can be confident in the results when the fail-safe number is more than 5N + 10, where N is the number of paired observations [24].

3. Results

The literature search initially resulted in a total of 2503 articles, of which 53 peer-reviewed articles met our criteria (Appendix S1). A total of 440 paired data was extracted from these articles to conduct comparisons between DSR and TPR. Most of the observations were from Asia, with 38% being from India and 25% being from China (Table 1).
Across all observations, the DSR yield was 12% lower than the TPR yield on average (CI: −13% to −10%) (Figure 1). In an unweighted analysis, the panicle number per m2 showed a positive and significant response to direct rice seeding, whereas the spikelet number per panicle was significantly reduced. There was no significant difference in the spikelet number per m2 and the grain filling percentage between DSR and TPR. Grain weight (the weight of one kernel seed) exhibited a slightly negative but significant response to direct seeding (Figure 1).
DSR yields were lower than TPR yields in most cases (Figure 2 and Figure 3). However, the yield gap between DSR and TPR could be narrowed by adjusting management practices (Table 2). Compared to TPR, the yield in DSR was −11% lower in wet seeding, whereas the yield penalty was −15% under dry seeding (Figure 2). When row seeding or manual broadcast was changed to dibble seeding, the 13% yield loss could be minimized to 2%. The tillage method had no significant effect on the DSR’s relative yield (Figure 2). The responses of yield to direct seeding varied greatly according to weed management. In the case of no weed control, the yield reduction of DSR was as high as 42%. With intensified weed control, the yield of DSR was only 8% lower than that of TPR. Among water management, the DSR performed best under mild water stress conditions, matching or exceeding the TPR yield. In contrast, consistent yield declines were observed for DSR for the other two water conditions. The N fertilizer rate had no significant effect on the yield difference between DSR and TPR (Figure 3).
The yield loss of DSR relative to TPR was significantly lower on high SOC (>1%) soil than in low SOC (<1%) soil (Table 2 and Figure 4). The yield significantly decreased under direct seeding, i.e., by −15% on non-clayey soils. The yield declines, by contrast, were much smaller on clayey soils (−4%). The magnitude of the yield reduction was significantly greater on soils with pH ≥7 (−16%) than on soils with pH <7 (−11%). Moreover, the unbalanced climatic stress induced by seeding time also caused large yield difference between DSR and TPR. When climatic stress was absent, the DSR relative yield was −7% compared to −25% when climatic stress occurred.
The importance of management and environmental factors to DSR relative yield was quantified and ranked based on the difference in effect size before and after optimization of the corresponding factor. As shown in Figure 5, weed management was the most important variable influencing yield response to direct seeding, resulting in over 30% DSR relative yield variation. Climate stress, water management, seeding method, and soil all led to yield variations greater than 10%. With management practices optimized, the yield gap between DSR and TPR could be significantly minimized. As shown in Figure 6, the magnitude of the decline in DSR yield was much greater at a low yielding level (DSR relative yield: −14%) than at a high yielding level (DSR relative yield: −4%) (Table 2 and Figure 6).
We incorporated three major variables (i.e., weed management, climatic stress, and seeding method) into the multiple liner regression with 174 pared observations. In the linear model, a combination of weed management, climatic stress, and seeding method accounted for 40% of the variance in yield (p < 0.001) The VIF and tolerance of these three variables ranged from 1.04 to 1.20 and 0.84 to 0.96, respectively. Based on the acceptable levels of VIF and tolerance, the confounding effect between variables was negligible. The funnel plots revealed that the studies appearing in the bottom of the plot were distributed asymmetrically around the summary effect size (Figure S4). To evaluate the effect of the asymmetric distribution on effect size, the trim and fill method was used in the present study. The results suggested that under the random effects model, the effect size was −12%, which was the same as the input effect size estimated by the trim and fill method (Figure S4). Moreover, the fail-safe number (258,005) was much greater than the threshold value (5 × 440 + 10 = 2210). These results indicate that the impact of publication bias was trivial, and the effect size was valid.

4. Discussion

The direct seeding of rice is known as a labour- and water-saving cultivation technique; therefore, it is not surprising that the overall DSR yield was 12% lower than that of TPR (Figure 1). This was inconsistent with previous studies because different studies were involved in the meta-analysis [4]. In the present study, in order to evaluate the specific effect of each management or environment factor on the yield comparison, only studies in which DSR and TPR were compared side-by-side, and other management practices kept the same, were selected.
The lower yield of DSR was mainly due to fewer spikelets per panicle (Figure 1). Although there was a compensation relationship between the panicle number per m2 and spikelet number per panicle, here the increase in panicle number m−2 was not large enough to compensate for the decrease in spikelet number per panicle in DSR, and grain weight under DSR was slightly but significantly lower than that under TPR. This might be attributed to heavy shading before the heading reduced the hull size in DSR due to its higher plant density than TPR [25].
Although the overall yield of DSR was lower than that of TPR, the yield response to direct seeding varied widely depending on management practices. Weed management was identified as the most important factor limiting the productivity of DSR, and the variation in DSR relative yield exceeded 30% under different weed control levels (Figure 5). DSR tends to suffer more from weed infestation than TPR, because TPR seedlings have a competitive advantage over early weeds in early vegetative growth stage [26]. Moreover, early weeds in TPR can be efficiently controlled by flooding (but not in DSR) [27]. Therefore, to be as productive as TPR, DSR requires skilled and integrated management to suppress weed growth. Rice rotated with weed-smothering crops such as soybean, barley, and rapeseed can suppress weeds effectively through competition and allelopathy [28,29]. Clearfield rice, an imidazolinone-resistant variety, offers a valuable strategy to selectively control weeds and weedy rice with imidazolinone herbicides [30]. Integrated management also includes burying pre-germinated seeds through land preparation, mulching with crop residues, the application of herbicides suitable for DSR, and the selection of competitive rice varieties [31,32]. This integrated management, including both chemical and biological weed suppression methods, needs to be promoted for sustainable weed management in DSR [9].
DSR performed best under a mild water stress condition, matching or exceeding TPR yield (Figure 3). For the other water conditions, consistent yield declines were observed. Rice is sensitive to non-saturated soil conditions, and water depletion could cause a decline in the tiller number and panicle number, consequently leading to a reduction in yield. Compared to TPR, a higher plant density in DSR can counteract the negative effect of water stress on tiller development and prevent yield loss to some extent. However, the DSR yield loss under severe water stress was much higher than that for TPR (Figure 3). This might result from a severe iron deficiency in the DSR field, and the negative effect can be reversed with several sprays of iron sulphate [33]. In the rainfed region, TPR needs sufficient rain to help puddle the soil. However, monsoon rains vary greatly. When the rains start late, it results in transplanting seedlings older than the optimum age and delayed heading, consequently leading to a reduced yield or even a failed harvest [34]. Unlike TPR, dry and wet seeding without transplanting shock delay takes a shorter time for heading. Its lower water requirement for establishment also allows earlier planting and harvesting, so DSR could potentially produce a higher yield than TPR under certain water conditions [35]. These results suggest that DSR could be an alternative cultivation method in rainfed areas.
Poor and uneven crop establishment is a critical problem in DSR production. The DSR relative yield under wet seeding was significantly higher than that under dry seeding (Figure 2), which is consistent with previous studies [4,5]. In dry seeding, dry seeds are sown into dry soil, and seed germination and early seedling growth are sometimes limited by unsatisfactory soil moisture conditions. In contrast, wet seeding, where pre-germinated seeds are sown onto wet puddled soil, makes it easier to achieve a uniform crop establishment [36,37]. Less biomass accumulation has been commonly reported to explain the lower yield of dry seeding [5]. The poor germination of dry seeding could be overcome by using seed-priming technology [38]. Crop establishment quality is also affected by seed distribution. In this study, the DSR relative yield in dibble seeding was 10% higher than that in manual broadcast. Yadav et al. [39] also reported a 44% higher yield in direct-drilled plots than in random broadcasting plots. Seeding with optimal plant geometry and space distance could enhance stand establishment and weed control but also reduce the seed rate from 80–200 kg ha−1 to about 25 kg ha−1, thereby helping to overcome spikelet sterility and lodging due to high plant density [9]. The development of precise seeding technology is able to guarantee desired DSR yield performance, especially on a farm scale [40].
The yield difference between DSR and TPR was highly affected by climate and soil properties. Many studies incorporated into our analysis observed large yield declines in DSR due to climatic stress. The seeding time of DSR is usually different from that of TPR, so they grow in quite different climates. Farmers and researchers are richly experienced in determining the proper seeding time for TPR to prevent climatic stress, but often fail to do so for DSR. For example, in central China, germinated seeds or young seedlings of DSR are sometimes exposed to low temperatures and waterlogging after sowing, while in TPR, they are protected in a seedling nursery with a plastic film covering [41,42]. In addition, it can be frequently seen that grain filling in DSR encounters periodic cold damage, but TPR avoids this damage [16]. In this study, the DSR relative yield was −25% when unbalanced climate stress occurred, whereas it was only −7% without climate stress (Figure 4). These factors suggest that when rice cultivation shifts from TPR to DSR in a particular region, the seeding time of DSR must be determined with adequate consideration of climate patterns to avoid substantial yield losses.
The high plant density of DSR requires more mineral nutrients compared to TPR [43]. Moreover, the farmland in DSR is prepared in dry conditions and the soil stays aerobic for some time, so soil nutrient dynamics are quite different from the TPR where soil is kept flooded during most of the growing season. Therefore, macronutrient and micronutrient deficiencies are of concern in DSR [11]. Soil properties are an important factor for rice root development and nutrient supply, and the present study indicated that the DSR relative yield was higher under high SOC, clay, and acidic soils (Figure 4). High SOC is often related to aggregate stability, high porosity, and improved soil structure, which allow DSR roots to grow deeper [44]. Chakraborty et al. [4] also observed that DSR relative yield in clay soil was higher than that in sandy soil, which may be attributed to the faster nutrient release and increased microbial activity in clay soil [45,46]. Saleque and Kirk [47] pointed out that a soil pH below neutral could increase the solubility and bioavailability of P and Zn, which might be the reason for the higher DSR relative yield in acidic soils. Therefore, it is necessary to evaluate the dynamics of macro- and micronutrients in the soil and then apply specific nutrient management methods to harvest the maximum rice yield when TPR is replaced by DSR.
In a DSR system, inbred rice varieties are commonly used by farmers with very high seeding rates, whereas hybrids are rarely used because of its higher seed price [10]. The yield potential of hybrid rice is 9–12% higher than that of inbred rice [48,49]. Therefore, it is vital to develop precise seeding technology to lower seeding rates, so as to adopt hybrid varieties and further improve crop productivity in DSR. Moreover, at present, most rice varieties are bred for TPR systems [8]. Given this, there is a genetic component to the observed yield difference between DSR and TPR. Hence, breeders should develop rice varieties suitable for direct-seeding environments with desirable plant traits (i.e., improved early vigour, weed competitiveness, drought tolerance under dry conditions during germination and later growth stages, short growth duration, and strong lodging resistance at maturity [8]). Bird damage to direct-seeded rice might be one of the major factors of yield loss. However, no evidence of bird injury could be found in the cited papers. Because bird injury is a very interesting factor, specific experiments must be carried out to evaluate its effects on direct-seeded rice yield. On the other hand, researchers in some cases may be quite new to DSR practices, so some practices may not be managed properly. Moreover, most of the observations in the meta-analysis were from Asia, but there were not enough from the Americas, Africa, and Oceania (although the rice planting area in Asia accounts for more than 87% of the world’s total [50]). These effects on the yield comparison should be noted.
In conclusion, this meta-analysis indicated that DSR yield was 12% lower than that of TPR on average. The lower yield of DSR might result from the reduction in spikelets per panicle and grain weight. Weed infestation, climatic stress occurrence, improper water management, and seeding methods all led to an over 10% DSR relative yield reduction. To obtain a comparable yield with TPR, an integrated package of management technologies should be applied to deal with the major constraints of DSR. Sustainable weed management for DSR must integrate chemical and biological suppression (e.g., rotate with weed-smothering crops, mulch with crop residues, bury weed seeds through land preparing, and select suitable competitive varieties), which could mitigate weed resistance to herbicides. To avoid climatic stress, the seeding time of DSR is supposed to be optimized based on regional climate pattern, and using the high-yielding rice variety with suitable growth duration. For water-deficient areas, the application of alternate wetting and drying irrigation technology on DSR could not only reduce water consumption but also achieve good yield performance. Seed-priming combined with precise seeding technology can be used to improve germination rates and reduce the seed rate of DSR. These results suggest that DSR is a promising alternative planting system in the face of looming global water scarcity and labour shortages, but more effort should be made to implement appropriate management strategies and breeding innovations.

Supplementary Materials

The following are available online at https://www.mdpi.com/2073-4395/9/11/767/s1: Figure S1: Flowchart of Preferred Reporting Items for Systematic Reviews and Meta-Analyses (PRISMA). This flowchart summarized the sequence of information gathering and selection, Figure S2: Normal quantile-quantile plot of the yield response ratio on log scale (In R) between transplanted and direct-seeded rice, Figure S3: The correlation of actual individual effect size with imputed individual effect size in this meta-analysis, Figure S4: The funnel plot to examine publication bias for comparing yield of direct seeded rice and transplanting rice.

Author Contributions

Conceptualization, L.X. and F.W.; Data Collection and Analysis, L.X., X.L., and X.W.; Writing, L.X.; Review and Editing, D.X. and F.W.

Funding

This research was funded by the National Key Research and Development Program of China (2016YFD0300208-03), the earmarked fund for China Agriculture Research System (CARS-01-20), the Program of Introducing Talents of Discipline to Universities in China (the 111 Project no. B14032), the National High Technology Research and Development Program of China (the 863 Project no. 2014AA10A605), the Program for Changjiang Scholars and Innovative Research Team in University of China (IRT1247), and a grant from the Bill and Melinda Gates Foundation (OPP51587).

Acknowledgments

The authors thank Shen Yuan and Zhifeng Chen for their technological support.

Conflicts of Interest

The authors declare no conflict of interest. The sponsors had no role in the design, execution, interpretation, or writing of the study.

References

  1. Khush, G.S. Strategies for increasing the yield potential of cereals: Case of rice as an example. Plant Breed. 2013, 132, 433–436. [Google Scholar] [CrossRef]
  2. Avnery, S.; Mauzerall, D.L.; Fiore, A.M. Increasing global agricultural production by reducing ozone damages via methane emission controls and ozone-resistant cultivar selection. Glob. Chang. Biol. 2013, 19, 1285–1299. [Google Scholar] [CrossRef] [PubMed]
  3. Peng, S.; Tang, Q.; Zou, Y. Current status and challenges of rice production in China. Plant Prod. Sci. 2009, 12, 3–8. [Google Scholar] [CrossRef]
  4. Chakraborty, D.; Ladha, J.K.; Rana, D.S.; Jat, M.L.; Gathala, M.K.; Yadav, S.; Rao, A.N.; Ramesha, M.S.; Raman, A. A global analysis of alternative tillage and crop establishment practices for economically and environmentally efficient rice production. Sci. Rep. 2017, 7, 9342. [Google Scholar] [CrossRef] [PubMed]
  5. Tuong, T.P.; Castillo, E.G.; Cabangon, R.C.; Boling, A.; Singh, U. The drought response of lowland rice to crop establishment practices and N-fertilizer sources. Field Crops Res. 2002, 74, 243–257. [Google Scholar] [CrossRef]
  6. Yuan, S.; Nie, L.; Wang, F.; Huang, J.; Peng, S. Agronomic performance of inbred and hybrid rice cultivars under simplified and reduced-input practices. Field Crops Res. 2017, 210, 129–135. [Google Scholar] [CrossRef]
  7. Pandey, S.; Velasco, L.; Toriyama, K.; Heong, K.L.; Hardy, B. Trends in crop establishment methods in Asia and research issues. In Rice is Life: Scientific Perspectives for the 21st Century; International Rice Research Institute: Los Baños, Philippines, 2005; pp. 178–181. [Google Scholar]
  8. Tuong, T.; Bouman, B. Rice production in water scarce environments. In Water Productivity in Agriculture: Limits and Opportunities for Improvement; Kijne, J., Barker, R., Molden, D., Eds.; CABI Publishing: Wallingford, UK, 2003; pp. 53–67. [Google Scholar]
  9. Kumar, V.; Ladha, J.K. Direct Seeding of Rice: Recent Developments and Future Research Needs. Adv. Agron. 2011, 111, 297–413. [Google Scholar]
  10. Sun, L.; Hussain, S.; Liu, H.; Peng, S.; Huang, J.; Cui, K.; Nie, L. Implications of low sowing rate for hybrid rice varieties under dry direct-seeded rice system in central China. Field Crops Res. 2015, 175, 87–95. [Google Scholar] [CrossRef]
  11. Farooq, M.; Siddique, K.H.M.; Rehman, H.; Aziz, T.; Lee, D.J.; Wahid, A. Rice direct seeding: Experiences, challenges and opportunities. Soil Tillage Res. 2011, 111, 87–98. [Google Scholar] [CrossRef]
  12. Pandey, S.; Velasco, L. Economics of Direct Seeding in Asia: Patterns of Adoption and Research Priorities; International Rice Research Institute: Los Banos, Philippines, 2002; pp. 6–7. [Google Scholar]
  13. Peng, S. Reflection on China’s rice production strategies during the transition period. Sci. Sin. Vitae 2014, 44, 845–850. [Google Scholar] [CrossRef]
  14. Bhushan, L.; Ladha, J.K.; Gupta, R.K.; Singh, S.; Tirolpadre, A.; Saharawat, Y.S.; Gathalaa, M.; Pathaka, H. Saving of water and labor in a rice–wheat system with no-tillage and direct seeding technologies. Agron. J. 2007, 99, 1288–1296. [Google Scholar] [CrossRef]
  15. Liu, H.; Hussain, S.; Zheng, M.; Peng, S.; Huang, J.; Cui, K.; Nie, L. Dry direct-seeded rice as an alternative to transplanted-flooded rice in central China. Agron. Sustain. Dev. 2015, 35, 285–294. [Google Scholar] [CrossRef]
  16. Chen, S.; Ge, Q.; Chu, G.; Xu, C.; Yan, J.; Zhang, X.; Wang, D. Seasonal differences in the rice grain yield and nitrogen use efficiency response to seedling establishment methods in the middle and lower reaches of the Yangtze River in China. Field Crops Res. 2017, 205, 1–13. [Google Scholar] [CrossRef]
  17. DerSimonian, R.; Laird, N. Meta-analysis in clinical trials. Control. Clin. Trials. 1986, 7, 177. [Google Scholar] [CrossRef]
  18. Furukawa, T.A.; Barbui, C.; Cipriani, A.; Brambilla, P.; Watanabe, N. Imputing missing standard deviations in meta-analyses can provide accurate results. J. Clin. Epidemiol. 2006, 59, 7–10. [Google Scholar] [CrossRef] [PubMed]
  19. Gurevitch, J.; Hedges, L.V. Statistical Issues in Ecological Meta-Analyses. Ecology 1999, 80, 1142–1149. [Google Scholar] [CrossRef]
  20. Kallenbach, C.; Grandy, A.S. Controls over soil microbial biomass responses to carbon amendments in agricultural systems: A meta-analysis. Agric. Ecosyst. Environ. 2011, 144, 241–252. [Google Scholar] [CrossRef]
  21. Kline, R.B. Data preparation and screening. In Principles and Practice of Structural Equation Modeling; The Guilford Press: New York, NY, USA, 1998; pp. 67–94. [Google Scholar]
  22. Rosenthal, R. The file drawer problem and tolerance for null results. Psychol. Bull. 1979, 86, 638–641. [Google Scholar] [CrossRef]
  23. Duval, S.; Tweedie, R. Trim and fill: A simple funnel-plot–based method of testing and adjusting for publication bias in meta-analysis. Biometrics 2000, 56, 455. [Google Scholar] [CrossRef]
  24. Xiong, D.; Ling, X.; Huang, J.; Peng, S. Meta-analysis and dose-response analysis of high temperature effects on rice yield and quality. Environ. Exp. Bot. 2017, 141, 1–9. [Google Scholar] [CrossRef]
  25. Yoshida, S. Fundamentals of Rice Crop Science; International Rice Research Institute: Los Baños, Philippines, 1981; pp. 238–239. [Google Scholar]
  26. Singh, V.P.; Dhyani, V.C.; Singh, S.P.; Kumar, A.; Manalil, S.; Chauhan, B.S. Effect of herbicides on weed management in dry-seeded rice sown under different tillage systems. Crop Prot. 2016, 80, 118–126. [Google Scholar] [CrossRef]
  27. Rao, A.N.; Johnson, D.E.; Sivaprasad, B.; Ladha, J.K.; Mortimer, A.M. Weed management in direct-seeded rice. Adv. Agron. 2007, 93, 153–255. [Google Scholar]
  28. Wu, H.; Pratley, J.; Lemerle, D.; Haig, T. Crop cultivars with allelopathic capability. Weed Res. 1999, 39, 171–180. [Google Scholar] [CrossRef]
  29. Narwal, S.S. Weed management in rice: Wheat rotation by allelopathy. Crit. Rev. Plant Sci. 2000, 19, 249–266. [Google Scholar] [CrossRef]
  30. Sudianto, E.; Beng-Kah, S.; Ting-Xiang, N.; Saldain, N.E.; Scott, R.C.; Burgos, N.R. Clearfield rice: Its development, success, and key challenges on a global perspective. Crop Prot. 2013, 49, 40–51. [Google Scholar] [CrossRef]
  31. Teosdale, J.R.; Beste, C.E.; Potts, W.E. Response of weeds to tillage and cover crop residues. Weed Sci. 1991, 39, 195–199. [Google Scholar] [CrossRef]
  32. Zimdahl, R.L. Fundamentals of Weed Science; Academic Press Inc.: San Diego, CA, USA, 1999. [Google Scholar]
  33. Sudhir-Yadav Gill, G.; Humphreys, E.; Kukal, S.S.; Walia, U.S. Effect of water management on dry seeded and puddled transplanted rice. Part 1: Crop performance. Field Crops Res. 2011, 120, 112–122. [Google Scholar] [CrossRef]
  34. Timsina, J.; Singh, U.; Badaruddin, M.; Meisner, C.; Amin, M.R. Cultivar, nitrogen, and water effects on productivity, and nitrogen-use efficiency and balance for rice-wheat sequences of Bangladesh. Field Crops Res. 2001, 72, 143–161. [Google Scholar] [CrossRef]
  35. Ahmed, S.; Humphreys, E.; Salim, M.; Chauhan, B.S. Optimizing sowing management for short duration dry seeded aman rice on the High Ganges River Floodplain of Bangladesh. Field Crops Res. 2014, 169, 77–88. [Google Scholar] [CrossRef]
  36. Villegas, A.N.; Zandstra, H.G. Identification of soil moisture requirement for germination and emergence of dry seeded rice. Philipp. J. Crop Sci. 1979, 4, 142–145. [Google Scholar]
  37. Wmw, W.; Mmp, M.; Bandara, C.; Rao, A.N.; Bhandari, D.C.; Ladha, J.K. Direct-seeded rice culture in Sri Lanka: Lessons from farmers. Field Crops Res. 2011, 121, 53–63. [Google Scholar]
  38. Zheng, M.; Tao, Y.; Hussain, S.; Jiang, Q.; Peng, S.; Huang, J.; Cui, K.; Nie, L. Seed priming in dry direct-seeded rice: Consequences for emergence, seedling growth and associated metabolic events under drought stress. Plant Growth Regul. 2016, 78, 167–178. [Google Scholar] [CrossRef]
  39. Yadav, D.B.; Yadav, A.; Malik, R.K.; Gurjeet, G. Efficacy of PIH 2023, penoxsulam and azimsulfuron for post-emergence weed control in wet direct seeded rice. In Proceedings of the Biennial Conference, Indian Society of Weed Science, Hisar, India, 2–3 November 2007; Department of Agronomy, CCS Haryana Agricultural University: Hisar, India, 2007. [Google Scholar]
  40. Gopal, R.; Jat, R.K.; Malik, R.K.; Kumar, V.; Alam, M.M.; Jat, M.L.; Mazid, M.A.; Saharawat, Y.S.; McDonald, A.; Gupta, R. Direct Dry Seeded Rice Production Technology and Weed Management in Rice Based Systems; Technical Bulletin; International Maize and Wheat Improvement Center: New Delhi, India, 2010; p. 28. [Google Scholar]
  41. Miro, B.; Ismail, A.M. Tolerance of anaerobic conditions caused by flooding during germination and early growth in rice (Oryza sativa L.). Front. Plant Sci. 2013, 4, 269. [Google Scholar] [CrossRef] [PubMed]
  42. Xu, L.; Zhan, X.; Yu, T.; Nie, L.; Huang, J.; Cui, K.; Wang, F.; Li, Y.; Peng, S. Yield performance of direct-seeded, double-season rice using varieties with short growth durations in central China. Field Crops Res. 2018, 227, 49–55. [Google Scholar] [CrossRef]
  43. Schnier, H.F.; Dingkuhn, M.; De Datta, S.K.; Mengel, K.; Faronilo, J.E. Nitrogen fertilization of direct-seeded flooded vs. transplanted rice: I. nitrogen uptake, photosynthesis, growth, and yield. Crop Sci. 1990, 30, 1276–1284. [Google Scholar] [CrossRef]
  44. Murphy, B. Effects of Soil Organic Matter on Functional Soil Properties—Review of the Literature and Underlying Data; Department of the Environment: Canberra, Australia, 2014.
  45. Yao, S.H.; Zhang, B.; Hu, F. Soil biophysical controls over rice straw decomposition and sequestration in soil: The effects of drying intensity and frequency of drying and wetting cycles. Soil Biol. Biochem. 2011, 43, 590–599. [Google Scholar] [CrossRef]
  46. Suriyagoda, L.; Costa, W.A.J.M.D.; Lambers, H. Growth and phosphorus nutrition of rice when inorganic fertiliser application is partly replaced by straw under varying moisture availability in sandy and clay soils. Plant Soil 2014, 384, 53–68. [Google Scholar] [CrossRef]
  47. Saleque, M.A.; Kirk, G.J.D. Root-induced solubilization of phosphate in the rhizosphere of lowland rice. New Phytol. 1995, 129, 325–336. [Google Scholar] [CrossRef]
  48. Peng, S.; Cassman, K.G.; Virmani, S.S.; Sheehy, J.; Khush, G.S. Yield potential trends of tropical rice since the release of ir8 and the challenge of increasing rice yield potential. Crop Sci. 1999, 39, 1552–1559. [Google Scholar] [CrossRef] [Green Version]
  49. Zhang, Y.; Tang, Q.; Zou, Y.; Li, D.; Qin, J.; Yang, S.; Chen, L.; Xia, B.; Peng, S. Yield potential and radiation use efficiency of “super” hybrid rice grown under subtropical conditions. Field Crops Res. 2009, 114, 91–98. [Google Scholar] [CrossRef]
  50. FAOSTAT. FAO Statistical Databases; Food and Agriculture Organization (FAO) of the United Nations: Rome, Italy, 2019; Available online: www.fao.org/faostat/en/#data (accessed on 24 October 2019).
Figure 1. Percentage changes in yield and yield components comparing direct-seeded rice to transplanted rice across a wide range of management and environmental conditions. The number of paired observations/number of studies included in each dataset are presented in parenthesis.
Agronomy 09 00767 g001
Figure 2. Influence of different crop establishment, seeding methods, and tillage practices on the yield change of direct-seeded rice relative to transplanted rice. The number of paired observations/number of studies included in each dataset are presented in parenthesis. Significant differences by categories are based on randomization tests; ns denotes non-significance at 0.05, * denotes significant at p ≤ 0.05, ** denotes significant at p ≤ 0.01, and *** denotes significant at p ≤ 0.001.
Agronomy 09 00767 g002
Figure 3. Influence of different weed infestation, water regimes, and nitrogen input on the yield change of direct-seeded rice relative to transplanted rice. The number of paired observations/number of studies included in each dataset are presented in parenthesis. Significant differences by categories are based on randomization tests. ns denotes non-significance at 0.05, * denotes significant at p ≤ 0.05, ** denotes significant at p ≤ 0.01, and *** denotes significant at p ≤ 0.001.
Agronomy 09 00767 g003
Figure 4. Influence of different soil organic carbon content (SOC), soil texture, soil pH, and climatic stress occurrence on the yield change of direct-seeded rice relative to transplanted rice. The number of paired observations/number of studies included in each dataset is presented in parenthesis. Significant differences by categories are based on randomization tests. ns denotes non-significance at 0.05, * denotes significant at p ≤ 0.05, ** denotes significant at p ≤ 0.01, and *** denotes significant at p ≤ 0.001.
Agronomy 09 00767 g004
Figure 5. Relative variable importance ranking for the yield impacts of direct-seeded rice relative to transplanted rice. Significant differences by categories are based on randomization tests. ns denotes non-significance at 0.05, * denotes significant at p ≤ 0.05, ** denotes significant at p ≤ 0.01, and *** denotes significant at p ≤ 0.001.
Agronomy 09 00767 g005
Figure 6. Percentage changes in direct-seeded rice yield relative to transplanted rice for different yielding levels. The number of paired observations/number of studies included in each dataset are presented in parenthesis. Significant differences by categories are based on randomization tests.
Agronomy 09 00767 g006
Table 1. Locations and observation number of the studies included in the meta-analysis.
RegionObservation NumberProportion (%)
India16738
China11125
Philippines7918
Pakistan225
Cambodia123
Iran123
Sri Lanka123
Korea82
Bangladesh41
Nepal41
Thailand31
Ivory Coast31
Malaysia2<1
Japan1<1
Total440100
Table 2. Heterogeneity (QB) and p value for the direct seeding effect size on grain yield across different categorical variables.
VariableQBdfp Value
Crop establishment5.8510.016
Seeding method24.7320.000
Tillage method1.1120.573
Weed control221.4120.000
Water management11.5020.003
Nitrogen input4.6020.100
Soil organic carbon5.0710.024
Soil texture18.8810.000
Soil pH8.8010.003
Climatic stress63.8210.000
Yielding level27.0120.000

