Article

Genetic Analysis and Gene Mapping for a Short-Petiole Mutant in Soybean (Glycine max (L.) Merr.)

National Center for Soybean Improvement, Key Laboratory of Biology and Genetics and Breeding for Soybean, Ministry of Agriculture, State Key Laboratory for Crop Genetics and Germplasm Enhancement, Nanjing Agricultural University, Nanjing 210095, China
*
Author to whom correspondence should be addressed.
Agronomy 2019, 9(11), 709; https://doi.org/10.3390/agronomy9110709
Submission received: 15 October 2019 / Revised: 28 October 2019 / Accepted: 28 October 2019 / Published: 1 November 2019
(This article belongs to the Special Issue Genetics, Genomics, and Breeding of Legume Crops)

Abstract

:
Short petiole is a valuable trait for the improvement of plant canopy of ideotypes with high yield. Here, we identified a soybean mutant line derived short petiole (dsp) with extremely short petiole in the field, which is obviously different from most short-petiole lines identified previously. Genetic analysis on 941 F2 individuals and subsequent segregation analysis of 184 F2:3 and 172 F3:4 families revealed that the dsp mutant was controlled by two recessive genes, named as dsp1 and dsp2. Map-based cloning showed that these two recessive genes were located on two nonhomologous regions of chromosome 07 and chromosome 11, of which the dsp1 locus was mapped at a physical interval of 550.5-Kb on chromosome 07 near to centromere with flanking markers as BARCSOYSSR_07_0787 and BARCSOYSSR_07_0808; whereas, the dsp2 locus was mapped to a 263.3-Kb region on chromosome 11 with BARCSOYSSR_11_0037 and BARCSOYSSR_11_0043 as flanking markers. A total of 36 and 33 gene models were located within the physical genomic interval of dsp1 and dsp2 loci, respectively. In conclusion, the present study identified markers linked with genomic regions responsible for short-petiole phenotype of soybean, which can be effectively used to develop ideal soybean cultivars through marker-assisted breeding.

1. Introduction

Plant canopy architecture is an important agronomic trait for improving the yield potential in soybean and other legumes crops [1,2]. Ideal canopy structure with suitable leaf area index values has advantages of increasing light interception efficiency, that leads to increased photosynthesis as well as accumulation of photosynthetic assimilates, and eventually results in a higher yield [3,4]. It has been suggested that the desirable leaf area index of a population can be achieved by developing new cultivars for dense planting [1]. The interception capacity of crops on both direct and diffuse solar radiation is expected to increase under a horizontal canopy of dense seeding [5]. However, closed canopy profile also results in large within-canopy shading, which subsequently induces shade avoidance response and promotes lodging by excessive vegetative growth [6]. Kokubun (1988) investigated the characteristics of high-yielding soybean cultivars and proposed a high-yield ideotype model with the upper leaves vertically closed. The fraction of light absorption by the lower surface will be increased in this model [7]. Hence, it is an immediate prerequisite to modify plant canopy in a desirable direction through genetic manipulation for increasing crop yield.
Petiole length is an important trait that influences canopy architecture besides leaf petiole angle and branching capacity [8,9]. The short petiole changes geometric architecture of soybean plants and makes it possible for group canopy closing in a vertical plane when applied in dense seeding. Although the petiole length in soybean varies depending on photoperiod and light quality [9], environmental factors do not have much effect on this trait. Therefore, investigating short-petiole genetic resources is an efficient way to understand petiole development for further plant canopy improvement. Until now, various soybean mutants with short petiole have been identified as well as characterized. For example, D76-1609 and SS98206SP are two short-petiole lines which are controlled by two different single recessive genes, lps1 and lps3, respectively [10,11]. You (1998) described a short-petiole line NJ90L-1SP, which is controlled by two duplicated loci of a recessive gene, lps1, that also controls short-petiole trait in D76-1609, and lps2, which controls the abnormal pulvinus [12]. These findings suggest that lps1 and lps2 might control different stages of petiole development. In addition, Cary and Nickell (1999) described a short petiole LN89-3502TP that is controlled by a single gene with incomplete dominance (lc), fitting a 1:2:1 segregation ratio in F2 population [13]. So far, only lps3 gene has been mapped on chromosome 13 within the flanking markers Sat_234 and Sct_033 [14]. Hence, identifying short-petiole mutant in soybean as well as the underlying gene will be helpful in promoting ideotype breeding in soybean for increasing yield.
By keeping the above in view, the present study identified a short-petiole mutant named as dsp. The objectives of our study were to elucidate the inheritance of the genes controlling short-petiole trait in dsp and to map underlying genes by using bulked segregant analysis (BSA) method.

2. Materials and Methods

2.1. Plant Material

The dsp is a derived soybean mutant with extremely short petiole, which is identified during soybean breeding in the field. Two crosses were made by crossing two soybean cultivars, viz., HDS-1 and BW-2, with the common dsp short-petiole mutant for genetic analysis and gene mapping of dsp. All F1 seeds were planted and single-plant threshed. The 703 and 238 F2 seeds were planted for HDS-1 × dsp and BW-2 × dsp F2 populations, respectively (Table 1). All the 941 F2 lines together with three parents were evaluated by visual inspection in the summer of 2014. In the summer of 2015, 50 seeds of 184 random F2:3 progenies of HDS-1 × dsp were sown and used to determine the genotype of each F2 plant.
To further validate the inheritance of dsp controlled by two loci, F2 plants of HDS-1 × dsp with one locus as recessive homozygous and the other locus as heterozygotic were specifically selected by simple sequence repeats (SSR) markers according to gene mapping results. In this process, the flanking markers BARCSOYSSR_07_0787 and BARCSOYSSR_07_0808 for dsp1 locus and BARCSOYSSR_11_0037 and BARCSOYSSR_11_0049 for dsp2 locus were used to screen out those F2 plants of which genotypes as Dsp1dsp1dsp2dsp2 or dsp1dsp1Dsp2dsp2. Then 81 and 91 F2:3 dominant individuals derived from the above selected F2 plants were randomly harvested, and 50 seeds for each F3:4 progenies were grown to evaluate the genotype of above F2:3 individuals in the summer of 2016 (Table 1). A total of 30 mutant individuals from F2 populations of HDS-1 × dsp and BW-2 × dsp were collected for gene mapping. There were 132 F2:3 recessive individuals derived from Dsp1dsp1dsp2dsp2 or dsp1dsp1Dsp2dsp2 F2 plants used to verify the mapping results of dsp1 and dsp2 loci.
The dsp mutant has extremely short petiole, however, a very small, nonsignificant variation exists for petiole length at different leaf positions, and thus were ignored. Therefore, short petiole of dsp was regarded as a qualitative trait in our study, and the petiole length was phenotypically evaluated as mutant-type (MT) and wild-type (WT) by visual inspection.
All materials were planted at the research field in Jiangpu Experimental Station of Nanjing Agricultural University (Nanjing, China).

2.2. Genetic Analysis of dsp

A Chi-square (χ2) test (1) was used to analyze the segregation ratio of alleles with the expected ratio at a significance threshold of p-value>0.05 (χ2 < 3.84) [15,16]. The formulas used are shown as below
χ 2 = O E 0.5 2 E
where O and E represent observed and expected value, respectively, under the expected ratio.

2.3. DNA Extraction and SSR Markers Analysis

A plant tissue kit from Tiangen Biotech (Beijing, China) was used to extract DNA from the young and healthy fresh leaves of three parents, F2 generations, and 132 F2:3 individuals derived from the crosses HDS-1 × dsp and BW-2 × dsp. PCR amplifications were performed in 10 µL reactions containing 50–100 ng of template DNA, 1 × PCR buffer, 2.0 mM MgCl2, 75 µM of each dNTP, 0.2 µM each of the forward and reverse primers, and 0.1 U of Taq DNA polymerase. DNA polymerase, deoxy-ribonucleoside triphosphate (dNTP) mix, and DNA Ladder (50 base pairs) were purchased from Tiangen Biotech (Beijing, China). Primer sequences were obtained from SoyBase website (http://www.soybase.org) and were synthesized by Invitrogen Biological Technology (Shanghai, China). The PCR reaction was performed under the following condition: Initial denaturation at 95 °C for 5 min, followed by 29 cycles with 30 seconds of denaturation at 94 °C, 30 seconds of annealing at 43–56 °C, depending on the optimum annealing temperature for each primer pair, and 30 seconds of extension at 72 °C, with a final 10 min extension at 72 °C on a Peltier thermal cycler (PTC-225, MJ Research, Quebec, QC, Canada). The PCR products were separated by electrophoresis through 8% non-denaturing polyacrylamide gels, and then the gels were stained with 1 g L−1 AgNO3 for 15 min, followed by a 1% NaOH and 1% CH3OH solution for 10 min before visualizing under LED light box.

2.4. Bulked Segregant Analysis (BSA) and Target Gene Mapping of the dsp Mutant

Bulked segregant analysis (BSA) was performed to identify SSR markers potentially linked to the genes responsible for short-petiole trait [17]. A total of 1015 pairs of SSR (simple sequence repeat) primers covering all the 20 chromosomes were included in this process. The normal bulk was formed by pooling DNA of six individuals with normal petiole from the F2 populations. Similarly, the mutant bulk was created with the DNA of six individuals with short petiole. The normal and mutant DNA bulks as well as the DNA of two parents for the F2 population of HDS-1 × dsp cross were screened with 1015 SSR markers to identify polymorphic markers that are potentially linked to the short-petiole trait of dsp. Linkage relationship of the locus and SSR markers were calculated with the program Mapmaker 3.0 [18], using a minimum LOD (logarithum of the odds) score of 3.0 and a maximum recombination value of 0.4 as a threshold. Linkage calculations were completed using the Kosambi mapping function [19]. SSR markers identified to be linked were consequently screened against the entire mapping population. Then subsequent mapping processes were conducted according to Song (2004) [20]. Searching of the physical position of the primer sequence was performed via BLASTN engine on National Center for Biotechnology Information database (NCBI) (http//www.ncbi.nlm.nih.gov/) and converting the genetic map to a physical map based on the physical position of SSR markers.

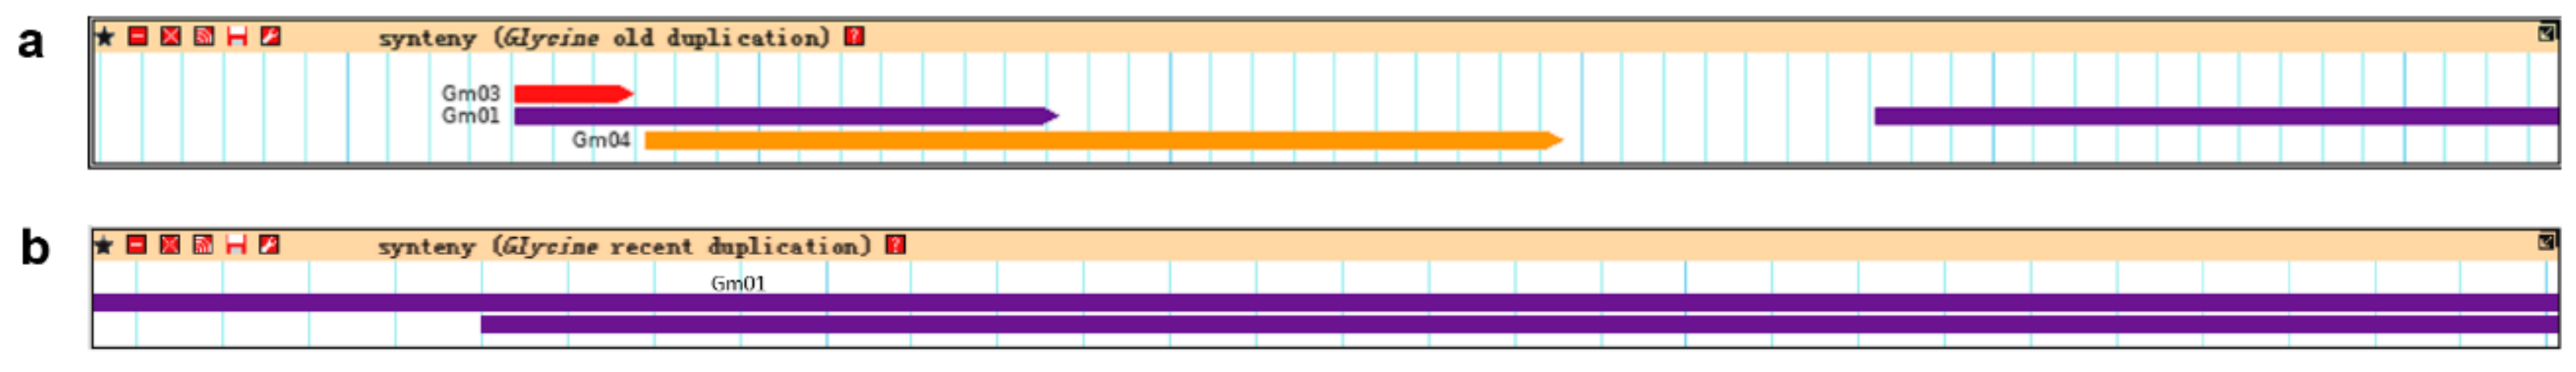
2.5. Synteny Information and Homologous Protein Information Retrieval

For every locus, the synteny information on genome was retrieved from the SoyBase website (https://soybase.org/) through “Genome Browser” [21]. The duplicated region of this locus (if it exists) would be displayed under the precondition of checking “old duplicated blocks” or “recent duplicated blocks” options in select track. Phytozome website (http://www.phytozome.net) [22] was used to retrieve the corresponding homologous proteins information of every candidate protein.

3. Results and Discussion

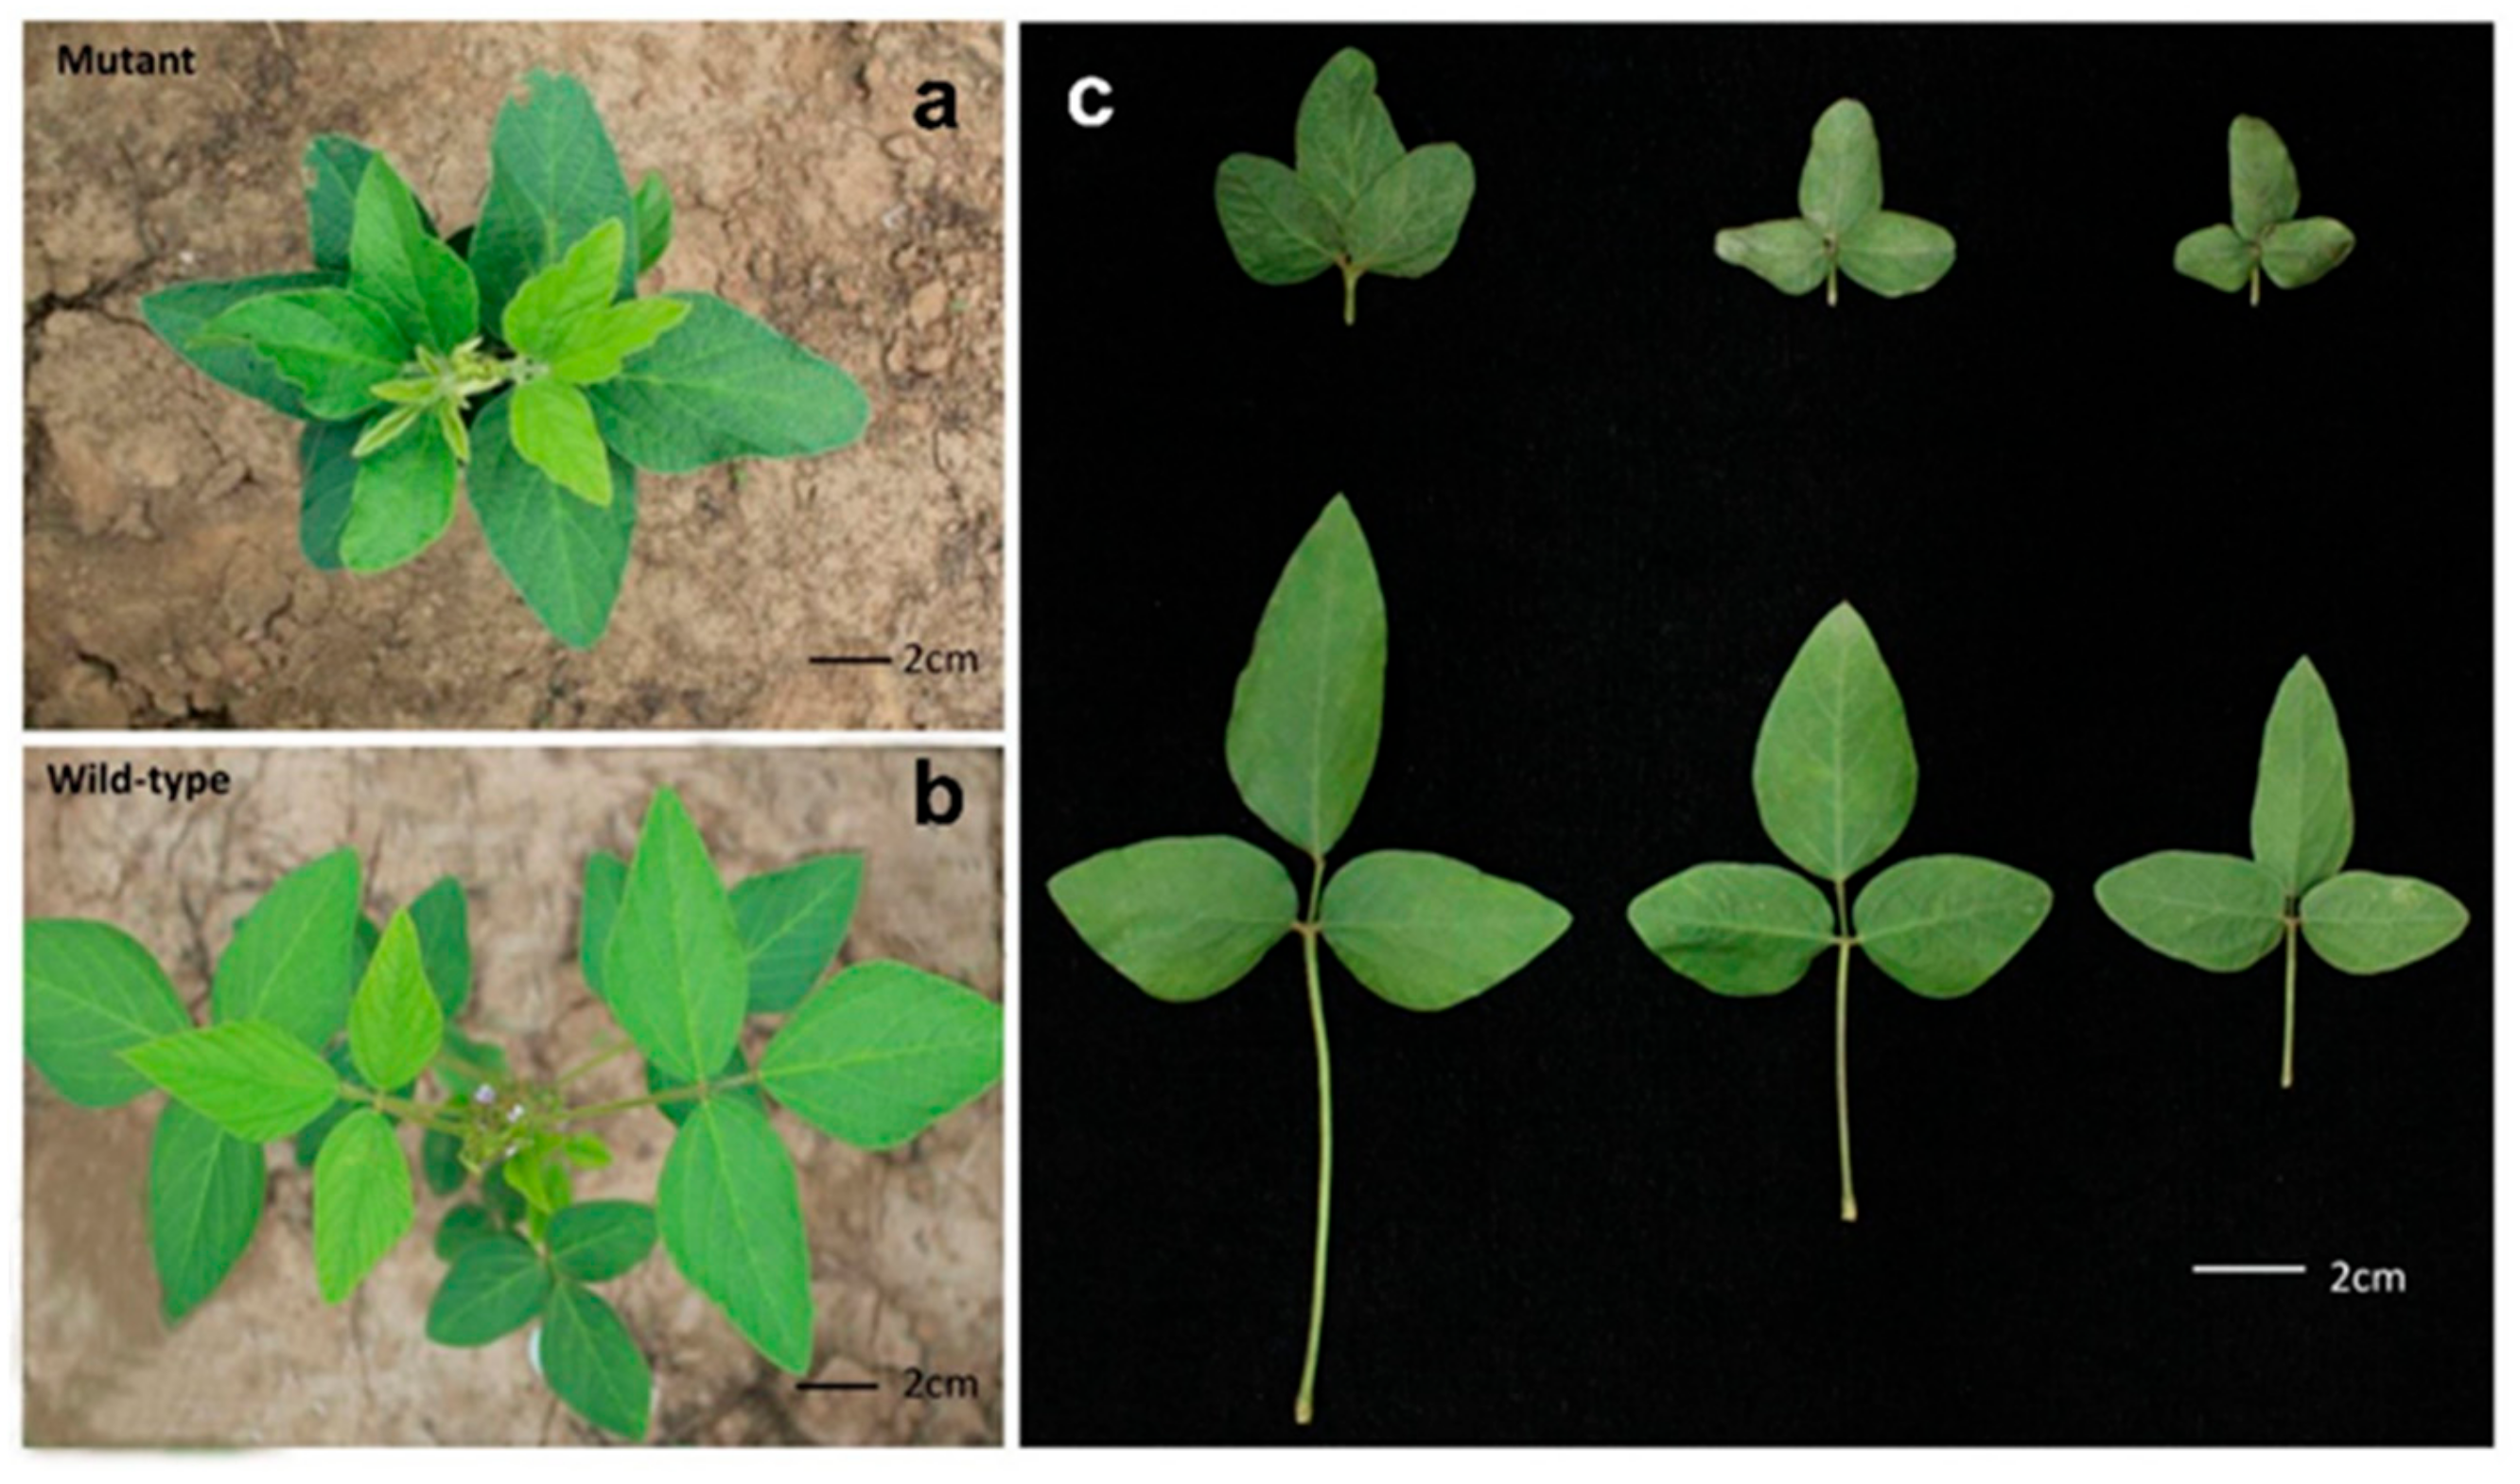
3.1. Characteristics of Short-Petiole Trait in the dsp Mutant

Soybean short-petiole mutant dsp has a compact stature in the natural field conditions (Figure 1), and also revealed different levels of dwarfing under different genetic background and environments (plant height variation data not shown). The petiole length of dsp was less than 2 cm, showing a difference from previously described short-petiole mutants, for instance D76-1609 (8.59 ± 0.93 cm) [10], NJ90L-1SP (7–13 cm) [12], and LN89-3502TP (5–12 cm) [13]. Moreover, dsp was relatively more valuable for progenies selection compared with NJ90-1SP and LN89-3502TP, which have inferior agronomic characters including abnormal leaf and pulvinus trait. Considering the ideal soybean architecture model proposed as compact plants with a small stature as well one or two branches [1], dsp mutant provides a valuable genetic resource for the development of a soybean ideal plant-type.

3.2. Genetic Analysis of Petiole Length in the dsp Mutant

Two crosses were made between the common short-petiole dsp mutant and two soybean cultivars with normal petiole, HDS-1 and BW-2, respectively. All the F1 plants obtained from the two populations (HDS-1 × dsp and BW-2 × dsp) had normal petioles, indicating that the short petiole of dsp mutant was recessive to the normal petiole. This result was consistent with that of previous genetic studies based on short-petiole lines, which also revealed the recessive nature of short-petiole length in soybean [10,11,12]. However, the results of Cary and Nickell (1999) [13] were in contrast. They reported that a short petiole was controlled by a single gene with incomplete dominance.
In the F2 population from the cross BW-2 × dsp, eight out of 238 F2 individuals had the mutant-type phenotype the same as the dsp parent (MT plants). However, the ratio of wild-type plants (WT plants) relative to mutant-type plants (MT plants) was not significantly different from a 15:1 ratio (χ2 = 2.91, p = 0.09) (Table 1). In the case of HDS-1 × dsp cross, segregation for petiole-length trait was observed in 87 of the 184 F2:3 rows derived from 184 F2 WT plants, which was not significantly different from a 8:7 ratio for segregating and nonsegregating in long-petiole rows (χ2 = 2.47, p = 0.12) (Table 1). According to subsequent mapping results of genes responsible for dsp, F2 WT plants with genotype as Dsp1dsp1dsp2dsp2 or dsp1dsp1Dsp2dsp2 from HDS-1 × dsp cross were screened out based on flanking markers of two mapping regions (Figure 2 and Figure 3), and random 81 and 91 F2:3 WT plants were grouped to validate the inheritance of dsp mutant. As a result, both ratios between those segregating and homozygous (nonsegregating) F3 individuals fit a 2:1 ratio based on F3:4 families (χ2 = 0.01, p = 0.91; χ2 = 0.07, p = 0.80) (Table 1).
These results demonstrated that the short-petiole trait of dsp mutant is controlled by two recessive genes even though the segregation ratio in F2 population of HDS-1 × dsp was significantly different from a 15:1 ratio (χ2 = 11.16, p = 0.00) in the 2014 field experiment. That is probably attributed to poor emergence by poor seed quality of mutant plants (Table 1). This is somewhat similar to the case of genetic analysis for SS98206SP, a short-petiole line controlled by a single recessive gene and fit a 15:1 ratio of F2 progenies between long and short petioles based on bad seed quality in 2006 [11].

3.3. Mapping Genes dsp1 and dsp2 with SSR Markers

Out of a total 1015 SSR markers screened for polymorphism, only 67 markers distributed to 12 chromosomes were found to be polymorphic between WT and MT DNA pools derived from F2 population of HDS-1 × dsp cross. Finally, polymorphic markers on chromosome 07 (linkage group M) and chromosome 11 (linkage group B1) were detected to be linked with the short-petiole mutant phenotype of dsp. These genomic regions governing the mutant phenotype of dsp was named as dsp1 and dsp2, respectively.
A total of 22 and 8 F2 MT plants from HDS-1 × dsp and BW-2 × dsp, respectively, were genotyped using linked markers screened from chromosome 07 and chromosome 11. New SSR markers from Song (2010) [23] were synthesized to narrow the mapping regions of dsp1 and dsp2 loci. Eventually, the dsp1 locus was mapped to a 550.5-Kb region on chromosome 07 with flanking markers as BARCSOYSSR_07_0787 and BARCSOYSSR_07_0808 (Figure 2). The mapping region is near to centromere according to SoyBase database [21]. A total of 36 gene models were present within this region (Glyma.Wm82.a1.v1.1) (Table 2). The dsp2 locus was mapped within a 263.3-Kb region between BARCSOYSSR_11_0037 and BARCSOYSSR_11_0049 markers on the front of chromosome 11, harboring 33 gene models (Figure 3, Table 3). Furthermore, these F2:3 MT plants from Dsp1dsp1dsp2dsp2 or dsp1dsp1Dsp2dsp2 F2 individuals were used to confirm the mapping regions. Among them, 86 F2:3 MT plants from Dsp1dsp1 dsp2dsp2 F2 plants were utilized to validate the mapping result of dsp1. Then dsp1 was mapped to the same genomic region as identified earlier using F2 populations (Figure 2). Similarly, 46 F2:3 MT plants from dsp1dsp1 Dsp2dsp2 F2 plants confirmed the locus dsp2. The right boundary of dsp2 is definite with BARCSOYSSR_11_0049, which is also consistent with the mapping result of dsp2 in F2 populations (Figure 3). The petiole length of dsp mutant is very similar to another SS98206SP line, while the lps3 locus underlying short petiole of SS98206SP was reported to be mapped on chromosome 13 [14]. Hence, dsp is a novel short-petiole line different from SS98206SP.
Based on the synteny information obtained from SoyBase [21], the mapping region of dsp1 and dsp2 belongs to two nonhomologous fragments on chromosome 07 and chromosome 11, respectively (Figure 4). Furthermore, homologous protein information retrieved from Phytozome [22] revealed that none of the encoding proteins within both regions displayed homology (Table 2 and Table 3). Hence, these two above loci identified to be responsible for short-petiole phenotype of the dsp mutant did not function as duplicated genes.
As a paleopolyploid, the genome of soybean contains 70.3% duplicate regions due to two whole genome duplication (WGD) events [24,25,26,27]. Duplicated genes may undergo pseudogenization, sub-functionalization, or neo-functionalization [28], and the divergence of duplicated genes is thought to provide the basis for adaptive evolution [29]. For example, among the four homologous genes of the Arabidopsis terminal flower gene (TFL1) in soybean, only one has been found to control growth habit; the other copies may have additional functions because they have been reported to show different transcriptional patterns [30]. A disease-like rugose leaf phenotype in soybean was attributed to two recessive duplicated loci of rl1 and rl2 [31]. In our study, all genes located within the mapping regions of dsp1 and dsp2 loci have one or more duplicated copies in other chromosomes. The duplicated effect of dsp1 and dsp2 candidate genes on the short petiole of dsp mutant indicated the possible functional differentiation or genetic interaction during petiole development. Therefore, the short petiole of dsp mutant is a complex trait, and the identification of candidate genes underlying dsp1 and dsp2 loci will greatly help to clarify the mechanism of petiole development.

4. Conclusions

In summary, we identified a novel short-petiole mutant line “dsp” that was demonstrated to be controlled by two recessive gene designated as dsp1 and dsp2. The mapping of dsp1 and dsp2 revealed a redundant function between two nonhomologous loci on the formation of short petiole. Hence, the present study provides potential genetic resources, linked markers as well as genes governing the short petiole in dsp mutant, and these valuable genes will be in turn used for rapid introgression into elite soybean backgrounds for developing cultivars with short petiole and high yield via marker-assisted breeding. Therefore, the availability of these resources could greatly facilitate the dream of developing soybean ideotype.

Author Contributions

Conceptualization: M.L. and T.Z.; Data curation: M.L. and Y.W.; Formal analysis: J.A.B. and Y.L.; Funding acquisition: T.Z.; Methodology: Y.L. and J.K.; Software: Y.W.; Writing—original draft: M.L.; Writing—review and editing: T.Z. and J.G.

Funding

This research was funded by the National Natural Science Foundation of China (Grant Nos. 31571691, 31871646), the Fundamental Research Funds for the Central Universities (KYT201801), the MOE Program for Changjiang Scholars and Innovative Research Team in University (PCSIRT_17R55), the MOE 111 Project (B08025), and the Jiangsu Collaborative Innovation Center for Modern Crop Production (JCIC-MCP) Program.

Conflicts of Interest

The authors declare no conflict of interest.

References

  1. Chavarria, G.; Caverzan, A.; Müller, M.; Rakocevic, M. Soybean architecture plants: From solar radiation interception to crop protection. In Soybean-The Basis of Yield, Biomass and Productivity; InTechOpen: London, UK; p. 15.
  2. Mwanamwenge, J.; Siddique, K.H.M.; Sedgley, R.H. Canopy development and light absorption of grain legume species in a short season mediterranean-type environment. J. Agron. Crop Sci. 1997, 179, 1–7. [Google Scholar] [CrossRef]
  3. Isoda, A.; Mori, M.; Matsumoto, S.; Li, Z.; Wang, P. High yielding performance of soybean in Northern Xinjiang, China. Plant Prod. Sci. 2015, 9, 401–407. [Google Scholar] [CrossRef]
  4. Liu, X.; Jin, J.; Wang, G.; Herbert, S.J. Soybean yield physiology and development of high-yielding practices in Northeast China. Field Crop Res. 2008, 105, 157–171. [Google Scholar] [CrossRef]
  5. Muraoka, H.; Takenaka, A.; Tang, Y.; Koizumi, H.; Washitani, I. Flexible leaf orientations of Arisaema heterophyllum maximize light capture in a forest understorey and avoid excess irradiance at a deforested site. Ann. Bot. 1998, 82, 297–307. [Google Scholar] [CrossRef]
  6. Junior, C.P.; Kawakami, J.; Bridi, M.; Conte, M.V.D.; Michalovicz, L. Phenological and quantitative plant development changes in soybean cultivars caused by sowing date and their relation to yield. Afr. J. Agric. Res. 2015, 10, 515–523. [Google Scholar] [CrossRef]
  7. Kokubun, M. Design and evaluation of soybean ideotypes. Bull. Tohoku Natl. Agric. Exp. Stn. 1988, 77, 77–142. [Google Scholar]
  8. Niinemets, Ü.; Fleck, S. Petiole mechanics, leaf inclination, morphology and investment in support in relation to light availability in the canopy of Liriodendron tulipifera. Oecologia 2002, 132, 21–33. [Google Scholar] [CrossRef]
  9. Thomas, J.F.; Raper, C.D. Internode and petiole elongation of soybean in response to photoperiod and end-of-day light quality. Bot. Gaz. 1985, 146, 495–500. [Google Scholar] [CrossRef]
  10. Jun, T.H.; Kang, S.T.; Moon, J.K.; Seo, M.J.; Yun, H.T.; Lee, S.K.; Lee, Y.H.; Kim, S.J. Genetic analysis of new short petiole gene in soybean. J. Crop Sci. Biotechnol. 2009, 12, 87–89. [Google Scholar] [CrossRef]
  11. Kilen, T. Inheritance of a short petiole trait soybean. Crop Sci. 1983, 23, 1208–1210. [Google Scholar] [CrossRef]
  12. You, M.; Zhao, T.; Gai, J.; Yen, Y. Genetic analysis of short petiole and abnormal pulvinus in soybean. Euphytica 1998, 102, 329–333. [Google Scholar] [CrossRef]
  13. Jun, T.H.; Kang, S.T. Genetic map of lps3: A new short petiole gene in soybeans. Genome 2012, 55, 140–146. [Google Scholar] [CrossRef] [PubMed]
  14. Cary, T.R.; Nickell, C.D. Genetic analysis of a short petiole-type soybean, LN89-3502TP. J. Hered. 1999, 90, 300–301. [Google Scholar] [CrossRef]
  15. Pearson, K.X. On the criterion that a given system of deviations from the probable in the case of a correlated system of variables is such that it can be reasonably supposed to have arisen from random sampling. Philos. Mag. 1900, 50, 157–175. [Google Scholar] [CrossRef]
  16. Yates, F. Contingency tables involving small numbers and the χ2 test. J. R. Stat. Soc. 1934, 1, 217–235. [Google Scholar]
  17. Michelmore, R.W.; Paran, I.; Kesseli, R.V. Identification of markers linked to disease-resistance genes by bulked segregant analysis: A rapid method to detect markers in specific genomic regions by using segregating populations. Proc. Natl. Acad. Sci. USA 1991, 88, 9828–9832. [Google Scholar] [CrossRef]
  18. Lander, E.S.; Green, P.; Abrahamson, J.; Barlow, A.; Daly, M.J.; Lincoln, S.E.; Newburg, L. MAPMAKER: An interactive computer package for constructing primary genetic linkage maps of experimental and natural populations. Genomics 1987, 1, 174–181. [Google Scholar] [CrossRef]
  19. Kosambi, D.D. The estimation of ma distance from recombination values. Ann. Eugen. 1944, 12, 172–175. [Google Scholar] [CrossRef]
  20. Song, Q.J.; Marek, L.F.; Shoemaker, R.C.; Lark, K.G.; Concibido, V.C.; Delannay, X.; Specht, J.E.; Cregan, P.B. A new integrated genetic linkage map of the soybean. Theor. Appl. Genet. 2004, 109, 122–128. [Google Scholar] [CrossRef]
  21. Grant, D.; Nelson, R.T.; Cannon, S.B.; Shoemaker, R.C. SoyBase, the USDA-ARS soybean genetics and genomics database. Nucleic Acids Res. 2010, 38, D843–D846. [Google Scholar] [CrossRef]
  22. Goodstein, D.M.; Shu, S.; Howson, R.; Neupane, R.; Hayes, R.D.; Fazo, J.; Mitros, T.; Dirks, W.; Hellsten, U.; Putnam, N.; et al. Phytozome: A comparative platform for green plant genomics. Nucleic Acids Res. 2012, 40, D1178–D1186. [Google Scholar] [CrossRef] [PubMed]
  23. Song, Q.; Jia, G.; Zhu, Y.; Grant, D.; Nelson, R.T.; Hwang, E.Y.; Hyten, D.L.; Cregan, P.B. Abundance of SSR motifs and development of candidate polymorphic SSR markers (BARCSOYSSR_1.0) in soybean. Crop Sci. 2010, 50, 1950–1960. [Google Scholar] [CrossRef]
  24. Chan, C.; Qi, X.; Li, M.W.; Wong, F.L.; Lam, H.M. Recent developments of genomic research in soybean. J. Genet. Genom. 2012, 39, 317–324. [Google Scholar] [CrossRef] [PubMed]
  25. Schlueter, J.A.; Lin, J.Y.; Schlueter, S.D.; Vasylenko-Sanders, I.F.; Deshpande, S.; Yi, J.; O’bleness, M.; Roe, B.A.; Nelson, R.T.; Scheffler, B.E.; et al. Gene duplication and paleopolyploidy in soybean and the implications for whole genome sequencing. BMC Genom. 2007, 8, 330. [Google Scholar] [CrossRef]
  26. Schmutz, J.; Cannon, S.B.; Schlueter, J.; Ma, J.; Mitros, T.; Nelson, W.; Hyten, D.L.; Song, Q.; Thelen, J.J.; Cheng, J.; et al. Genome sequence of the palaeopolyploid soybean. Nature 2010, 463, 178. [Google Scholar] [CrossRef]
  27. Shoemaker, R.C.; Schluete, J.; Doyle, J.J. Paleopolyploidy and gene duplication in soybean and other legumes. Curr. Opin. Plant Biol. 2006, 9, 104–109. [Google Scholar] [CrossRef]
  28. Innan, H.; Kondrashov, F. The evolution of gene duplications: Classifying and distinguishing between models. Nat. Rev. Genet. 2010, 11, 97–108. [Google Scholar] [CrossRef]
  29. Flagel, L.E.; Wendel, J.F. Gene duplication and evolutionary novelty in plants. New Phytol. 2009, 183, 557–564. [Google Scholar] [CrossRef]
  30. Tian, Z.; Wang, X.; Lee, R.; Li, Y.; Specht, J.E.; Nelson, R.L.; McClean, P.E.; Qiu, L.; Ma, J. Artificial selection for determinate growth habit in soybean. Proc. Natl. Acad. Sci. USA 2010, 107, 8563–8568. [Google Scholar] [CrossRef] [Green Version]
  31. Wang, Y.; Chen, W.; Zhang, Y.; Liu, M.; Kong, J.; Yu, Z.; Jaffer, A.M.; Gai, J.; Zhao, T. Identification of two duplicated loci controlling a disease-like rugose leaf phenotype in soybean. Crop Sci. 2016, 56, 1611. [Google Scholar] [CrossRef]
Figure 1. Canopy architecture and petiole morphology of the dsp mutant (ab). Aerial view of the dsp mutant (a) and BW-2 wild-type plant (b). (c) The morphology and petiole length of wild type and mutant. Scale bars represent 2cm in all pictures.
Agronomy 09 00709 g001
Figure 2. Mapping of the dsp1 locus. (ad) Two F2 populations of HDS-1 × dsp (b) and BW-2 × dsp (d) were used here. One F2:3 population derived from Dsp1dsp1dsp2dsp2 F2 plants of HDS-1 × dsp cross was used to verify the mapping result of dsp1 (c). The dsp1 locus was mapped to a 550.5-kb region nearby centromere on chromosome 07 with BARCSOYSSR_07_0787 and BARCSOYSSR_07_0808 as flanking markers (e). Black spot represents centromere. Number below every SSR marker means recombinant individual number.
Agronomy 09 00709 g002
Figure 3. Mapping of the dsp2 locus. (ad) Two F2 populations of HDS-1 × dsp (b) and BW-2 × dsp (d) were used here. One F2:3 population derived from dsp1dsp1Dsp2dsp2 F2 plants of HDS-1 × dsp was used to verify the mapping result of dsp2 (c). The dsp2 locus was mapped between BARCSOYSSR_11_0037 and BARCSOYSSR_11_0043, a 263.3-kb region in the front end of chromosome 11 (e). Black spot represents centromere. Number below every SSR marker means recombinant individual number.
Agronomy 09 00709 g003
Figure 4. The duplicated regions of dsp1 and dsp2 locus from SoyBase. (a) The duplicated regions of the dsp1 locus. (b) The duplicated regions of the dsp2 locus.
Agronomy 09 00709 g004
Table 1. Genetic analysis of the short-petiole trait in the F2 and F3:4 populations.
PopulationYearNo. of Wild-type PlantsNo. of Mutant-type PlantsTotal NumberExpected Ratioχ2p-Value
F2(HDS-1 × dsp)20146812270315:111.160.00
F2(BW-2 × dsp)2014230823815:12.910.09
No. of Segregating LinesNo. of Non-segregating LinesTotal NumberExpected Ratioχ2p-Value
F2:3(HDS-1 × dsp)201587971848:72.470.12
F3:4(HDS-1 × dsp)-Dsp1_ dsp2dsp220165427812:10.010.91
F3:4(HDS-1 × dsp)-dsp1dsp1 Dsp2_20165932912:10.070.80
Table 2. List of gene models in the 550.5-Kb physical interval of the derived short-petiole1 (dsp1) locus.
Glyma.Wm82.
a1.v1.1 Gene Models
Glyma.Wm82.
a2.v1 Gene Models
Description
Glyma07g16731Glyma.07g139000Mitochondrial carrier protein
Glyma07g16740Glyma.07g139100Major Facilitator Superfamily
Glyma07g16750Glyma.07g139200Uncharacterized protein
Glyma07g16760Glyma.07g139300Uncharacterized protein
Glyma07g16770Glyma.07g139400Probable lipid transfer
Glyma07g16790Glyma.07g139500PRONE (Plant-specific Rop nucleotide exchanger)
Glyma07g16800Glyma.07g139600Glutathione S-transferase, C-terminal domain
Glyma07g16810Glyma.07g139700Glutathione S-transferase, C-terminal domain
Glyma07g16830Glyma.07g139800Glutathione S-transferase, C-terminal domain
Glyma07g16840Glyma.07g139900Glutathione S-transferase, C-terminal domain
Glyma07g16850Glyma.07g140000Glutathione S-transferase, C-terminal domain
Glyma07g16860Glyma.07g140200Glutathione S-transferase, C-terminal domain
Glyma07g16876Glyma.07g140300Glutathione S-transferase, C-terminal domain
Glyma07g16893-Cytochrome P450 CYP4/CYP19/CYP26 subfamilies
Glyma07g16910Glyma.07g140400Glutathione S-transferase, C-terminal domain
Glyma07g16925Glyma.07g140500Glutathione S-transferase, C-terminal domain
Glyma07g16940Glyma.07g140700Glutathione S-transferase, C-terminal domain
Glyma07g16950Glyma.07g140800Universal stress protein family
Glyma07g16970Glyma.07g141000Uncharacterized protein
Glyma07g16980Glyma.07g141100Myb-like DNA-binding domain
Glyma07g16990Glyma.07g141200Ctr copper transporter family
Glyma07g17000Glyma.07g141300Probable lipid transfer
Glyma07g17010Glyma.07g141400Non-specific serine/threonine protein kinase.
Glyma07g17030Glyma.07g141500Probable lipid transfer
Glyma07g17060Glyma.07g141600Ctr copper transporter family
Glyma07g17080Glyma.07g141700Hsp20/alpha crystallin family
Glyma07g17090Glyma.07g141800Uncharacterized protein
Glyma07g17101Glyma.07g141900Domain of unknown function (DUF3527)
Glyma07g17110Glyma.07g142000PAP2 superfamily C-terminal
Glyma07g17116Glyma.07g142100Ubiquitinyl hydrolase 1.
Glyma07g17130Glyma.07g142300RING-variant domain
Glyma07g17140Glyma.07g142400Multicopper oxidase
Glyma07g17150Glyma.07g142500Multicopper oxidase
Glyma07g17170Glyma.07g142600Multicopper oxidase
Glyma07g17180Glyma.07g142700Fructose-1-6-bisphosphatase
Glyma07g17190Glyma.07g142800Uncharacterized protein
Table 3. List of gene models in the 263.3-Kb physical interval of the dsp2 locus.
Glyma.Wm82.
a1.v1.1 Gene Models
Glyma.Wm82.
a2.v1 Gene Models
Description
Glyma11g01300Glyma.11G011000RNA-binding proteins
Glyma11g01310Glyma.11G011100Uncharacterized protein
Glyma11g01320Glyma.11G011200NADH: ubiquinone oxidoreductase, B17.2 subunit
Glyma11g01330Glyma.11G011300E3 ubiquitin ligase
Glyma11g01340Glyma.11G011400Translin-associated protein X
Glyma11g01350Glyma.11G011500Chalcone and stilbene synthases
Glyma11g01360Glyma.11G011600PPR repeat
Glyma11g01370Glyma.11G011700Nuclear transport receptor CRM1/MSN5 (importin beta superfamily)
Glyma11g01380Glyma.11G011800GTP-binding ADP-ribosylation factor Arf1
Glyma11g01390Glyma.11G011900Plant protein of unknown function (DUF946)
Glyma11g01405Glyma.11G012000Guanosine-3′,5′-bis(diphosphate)3′-pyrophosphohydrolase
Glyma11g01420Glyma.11G012100Ribonuclease P
Glyma11g01430Glyma.11G012200DEAD/DEAH box helicase/Helicase conserved C-terminal domain
Glyma11g01441Glyma.11G012300Pwwp domain-containing protein
Glyma11g01450Glyma.11G012400Cell division cycle 20 (CDC20) (Fizzy)-related
Glyma11g01460Glyma.11G012500Putative u4/u6 small nuclear ribonucleoprotein
Glyma11g01470Glyma.11G012700Mitochondrial outer membrane protein
Glyma11g01480Glyma.11G012800Galactosyltransferases
Glyma11g01491Glyma.11G012900Aspartyl proteases
Glyma11g01501Glyma.11G013000Aspartyl proteases
Glyma11g01510Glyma.11G013100Aspartyl proteases
Glyma11g01520Glyma.11G013200Uncharacterized protein
Glyma11g01530Glyma.11G013300PLAC8 family
Glyma11g01536Glyma.11G013400DYW family of nucleic acid deaminases (DYW_deaminase)
Glyma11g01543Glyma.11G013500PPR repeat (PPR)
Glyma11g01550Glyma.11G013600PPR repeat (PPR)
Glyma11g01570Glyma.11G013700leucine-rich PPR motif-containing protein, mitochondrial (LRPPRC)
Glyma11g01580Glyma.11G013800Complex 1 protein (LYR family)
Glyma11g01595Glyma.11G013900KH domain containing RNA binding protein
Glyma11g01610Glyma.11G014000Protein Phosphatase methylesterase-1 related
Glyma11g01620Glyma.11G014100Cytochrome c
Glyma11g01640Glyma.11G014200Ethylene-responsive transcription factor ERF021
Glyma11g01650Glyma.11G014300Nuclear transport factor 2 (NTF2) domain

