Article

Understanding the Interactions between Biomass, Grain Production and Grain Protein Content in High and Low Protein Wheat Genotypes under Controlled Environments

1
School of Agriculture Food and Wine, University of Adelaide, Glen Osmond 5064, South Australia
2
ARC Industrial Transformation Research Hub for Wheat in a Hot and Dry Climate, Waite Research Institute, University of Adelaide, Glen Osmond SA 5064, Australia
3
Rothamsted Research, Harpenden, Hertfordshire AL5 2JQ, UK
4
The Plant Accelerator, Australian Plant Phenomics Facility, Waite Research Institute, University of Adelaide, Adelaide SA 5064, Australia
5
Wheat Initiative, Julius-Kühn-Insititute, 14195 Berlin-Dahlem, Germany
*
Author to whom correspondence should be addressed.
Agronomy 2019, 9(11), 706; https://doi.org/10.3390/agronomy9110706
Submission received: 30 September 2019 / Revised: 29 October 2019 / Accepted: 29 October 2019 / Published: 1 November 2019
(This article belongs to the Section Soil and Plant Nutrition)

Abstract

:
Grain protein content (GPC) is a key quality attribute and an important marketing trait in wheat. In the current cropping systems worldwide, GPC is mostly determined by nitrogen (N) fertilizer application. The objectives of this study were to understand the differences in N response between high and low GPC wheat genotypes, and to assess the value of biomass growth analysis to assess the differences in N response. Six wheat genotypes from a range of high to low GPC were grown in low, medium and high N, under glasshouse conditions. This experiment was designed around non-destructive estimation of biomass using a high throughput image-based phenotyping system. Results showed that Spitfire and Mace had higher grain N% than Gazelle and QAL2000, and appeared to demand more N to grow their biomass. Moreover, at low N, Spitfire grew faster and achieved the maximum absolute growth rate earlier than high N-treated plants. High grain N% genotypes seem able to manage grain N reserves by compromising biomass production at low N. This study also indicated the importance of biomass growth analysis to show the differences in the N responsiveness of high and low GPC wheat.

1. Introduction

Wheat is the most widely cultivated crop in the world and a substantial source of carbohydrate and protein in human diets [1]. Increasing grain weight and grain quality are the two main goals in improving wheat production. In this context, grain protein content (GPC) is a key quality attribute and an important marketing trait [2]. Increasing GPC is positively correlated with grain hardness in both hard and soft wheats [3,4,5]. Changes in kernel hardness can affect milling, downstream processing and consequently end products [6]. Due to the negative correlation between grain weight and GPC [7,8,9], grain weight increase may reduce the end-use quality of hard wheats [1,10]. However, lower GPC for soft wheats, which have different quality targets and end products compared to hard wheats, can be a desirable trait [11]. Soft wheat lines produce substantially lower GPC compared with hard wheats [12,13]. In the current world cropping systems, GPC is mostly determined by nitrogen (N) fertilizer application [14,15]. Therefore the nitrogen use efficiency (NUE) of soft genotypes may be genetically defined.
Only 40%–60% of the applied N is taken up by wheat plants [16], which inflates production costs and environmental impacts [17,18]. Consequently, there is considerable interest in improving NUE [19,20]. NUE, which can be defined as the ratio of grain weight to N supplied, has been mostly improved by indirect selections for high grain weight [21,22]. In fact, efforts to improve NUE in wheat has focused on increasing grain weight response to higher N inputs [23]. In this context, comparing the N responses of high and low GPC wheats may reveal the mechanisms used by the contrasting genotypes in their N use at high and low N input [24,25].
Due to the challenges of destructive harvests, NUE evaluations in the field are usually based on measuring grain weight at given N supply [22,26]. Controlled environment phenotyping platforms can help to dissect complex traits into simple components under reduced environmental variation. Therefore, controlled environment experiments allow the examination of traits that may be difficult to measure in the field [27,28,29]. In this respect, the above-ground biomass can be a suitable indicator for N response since it is highly N responsive, and corresponds with grain weight under glasshouse conditions [19,30,31,32,33].
Growth curves of single plants resemble consecutive measurements of biomass during the season, and give a view of plant growth dynamics. Monitoring growth dynamics without the need for periodic destructive harvests improves the precision of measurements [34]. Destructive methods, on the other hand, require frequent harvests at specific time points and do not allow continuous growth measurement from individual plants [35]. Therefore, deploying imaging platforms, which allow for consecutive measurements, reduces the number of required plants and improves the precision of growth analysis. Phenotyping based on imaging can also help to analyze plant nutrient status. Plant nutrient status influences the time point of the switch from the vegetative to reproductive stage [36,37]. Extended nutrient starvation can induce the early shift from vegetative to generative growth, and consequently compresses the phenology of plants [35,38,39]. Maximum absolute growth rate (max-AGR) indicates the transition point from vegetative to generative growth [40]. Accordingly, the interval of the plant life cycle required to reach the max-AGR, which is known as the time of max-AGR (t-maxAGR), can be studied as a trait for N response. These traits, max-AGR and t-maxAGR, can be measured with imaging techniques and represent important physiological responses to N that cannot be feasibly measured by destructive methods [35,41]. Also the requirement of day-to-day imaging, for precise measurement of t-maxAGR makes this trait hard to assess in the field conditions.
Here, we report on a study based on growth measurement of single wheat plants under controlled conditions with different N supply. The objectives of this study were: (1) to understand the differences in N response between high and low GPC wheats; (2) to assess the value of biomass growth analysis for the examination of differences in N response in high and low GPC wheats. To address these objectives, a set of six genotypes differing in GPC were selected based on available data from National Variety Trials (NVT) (Supplementary Figure S2).

2. Materials and Methods

2.1. Plant Material, Growth Conditions and N Treatment

Based on the NVT data from 11 years (Supplementary Figure S2), six wheat (Triticum aestivum L.) genotypes were selected to cover a range of high to low GPC. The six genotypes, Spitfire, Mace, Gregory, Impala, Gazelle and QAL2000, were grown at three N levels under greenhouse conditions. The experiment was carried out in The Plant Accelerator (Australian Plant Phenomics Facility, University of Adelaide, Australia; Latitude: −34.97113, Longitude: 138.63989) during spring and summer (June–November 2016). Temperature in the greenhouse was regulated based on a sinusoidal cycle with 22 °C day/15 °C night.
Three seeds were sown in 150 mm pots (2.5 litre) with drainage holes, in 50:50 (v/v) coco-peat mix: UC Davis potting soil with adequate fertilizers except nitrogen. The three levels of nitrogen comprised of 25 (low), 75 (medium) and 150 (high) mg N per kg soil and were applied in the form of urea during soil mixing. Soil surface was covered with blue poly-vinyl chloride mats to reduce soil moisture evaporation while providing a favourable background colour for image analysis. A blue carnation frame was placed in the pot to support the plant. Five days after emergence, seedlings were thinned to one uniformly sized plant per pot.

2.2. Experimental Design

A spilt-plot design was used to assign the genotypes and N treatments to 108 plant carts (that is pots) on a conveyor belt system. Each cart held one pot with a single plant, arranged in 6 lanes by 18 plant carts (Supplementary Figure S1). Automatic imaging started on 29 days after sowing (DAS) (before stem elongation) by transferring the pots to the conveyor system, where the plants remained until 61 DAS. Water levels were monitored and adjusted daily to field capacity through an automated weighing and watering system (LemnaTec GmbH, Aachen, Germany). After 61 DAS, plants were returned to the greenhouse and grown to maturity. When mature, the plants were destructively harvested for biomass measurements and N analysis of grain and non-grain tissues.

2.3. Red, Green, Blue (RGB) Image Capture and Image Analysis

Shoot images were taken using the LemnaTec 3D Scanalyzer system. Plants were imaged daily with two 5-megapixel visible/RGB cameras (Basler Pilot piA2400-17gm). One image from the top and two from the side at a 90 degrees rotation were prepared at each imaging session. All captured images were analysed using the LemnaTec Grid software package (LemnaTec GmbH, Aachen, Germany).
The projected shoot area (PSA) was extracted from all three RGB images, and the sum of PSA from the three images was used to estimate shoot biomass. Absolute growth rates (AGRs) were calculated from the estimated PSA between two time points of tk and tj, [42]:
  AGR   ( t j , t k )   = PSA t k PSA t j t k t j
Projected shoot area values were smoothed by fitting a cubic smoothing spline to the data for each plant. Smoothed absolute growth rates were calculated from the smoothed PSA [42].

2.4. N Measurements

Nitrogen content in grain (grain N%) and non-grain (non-grain N%) tissues were determined by using a nitrogen analyser (Rapid N exceed®, Elementar, Germany). Accordingly, grain and non-grain tissues were ground to a fine powder using ball mills after being dried at 60 °C. Non-grain tissues, including vegetative tissues and the non-grain parts of spikes, were shredded before grinding.

2.5. Statistical Analysis
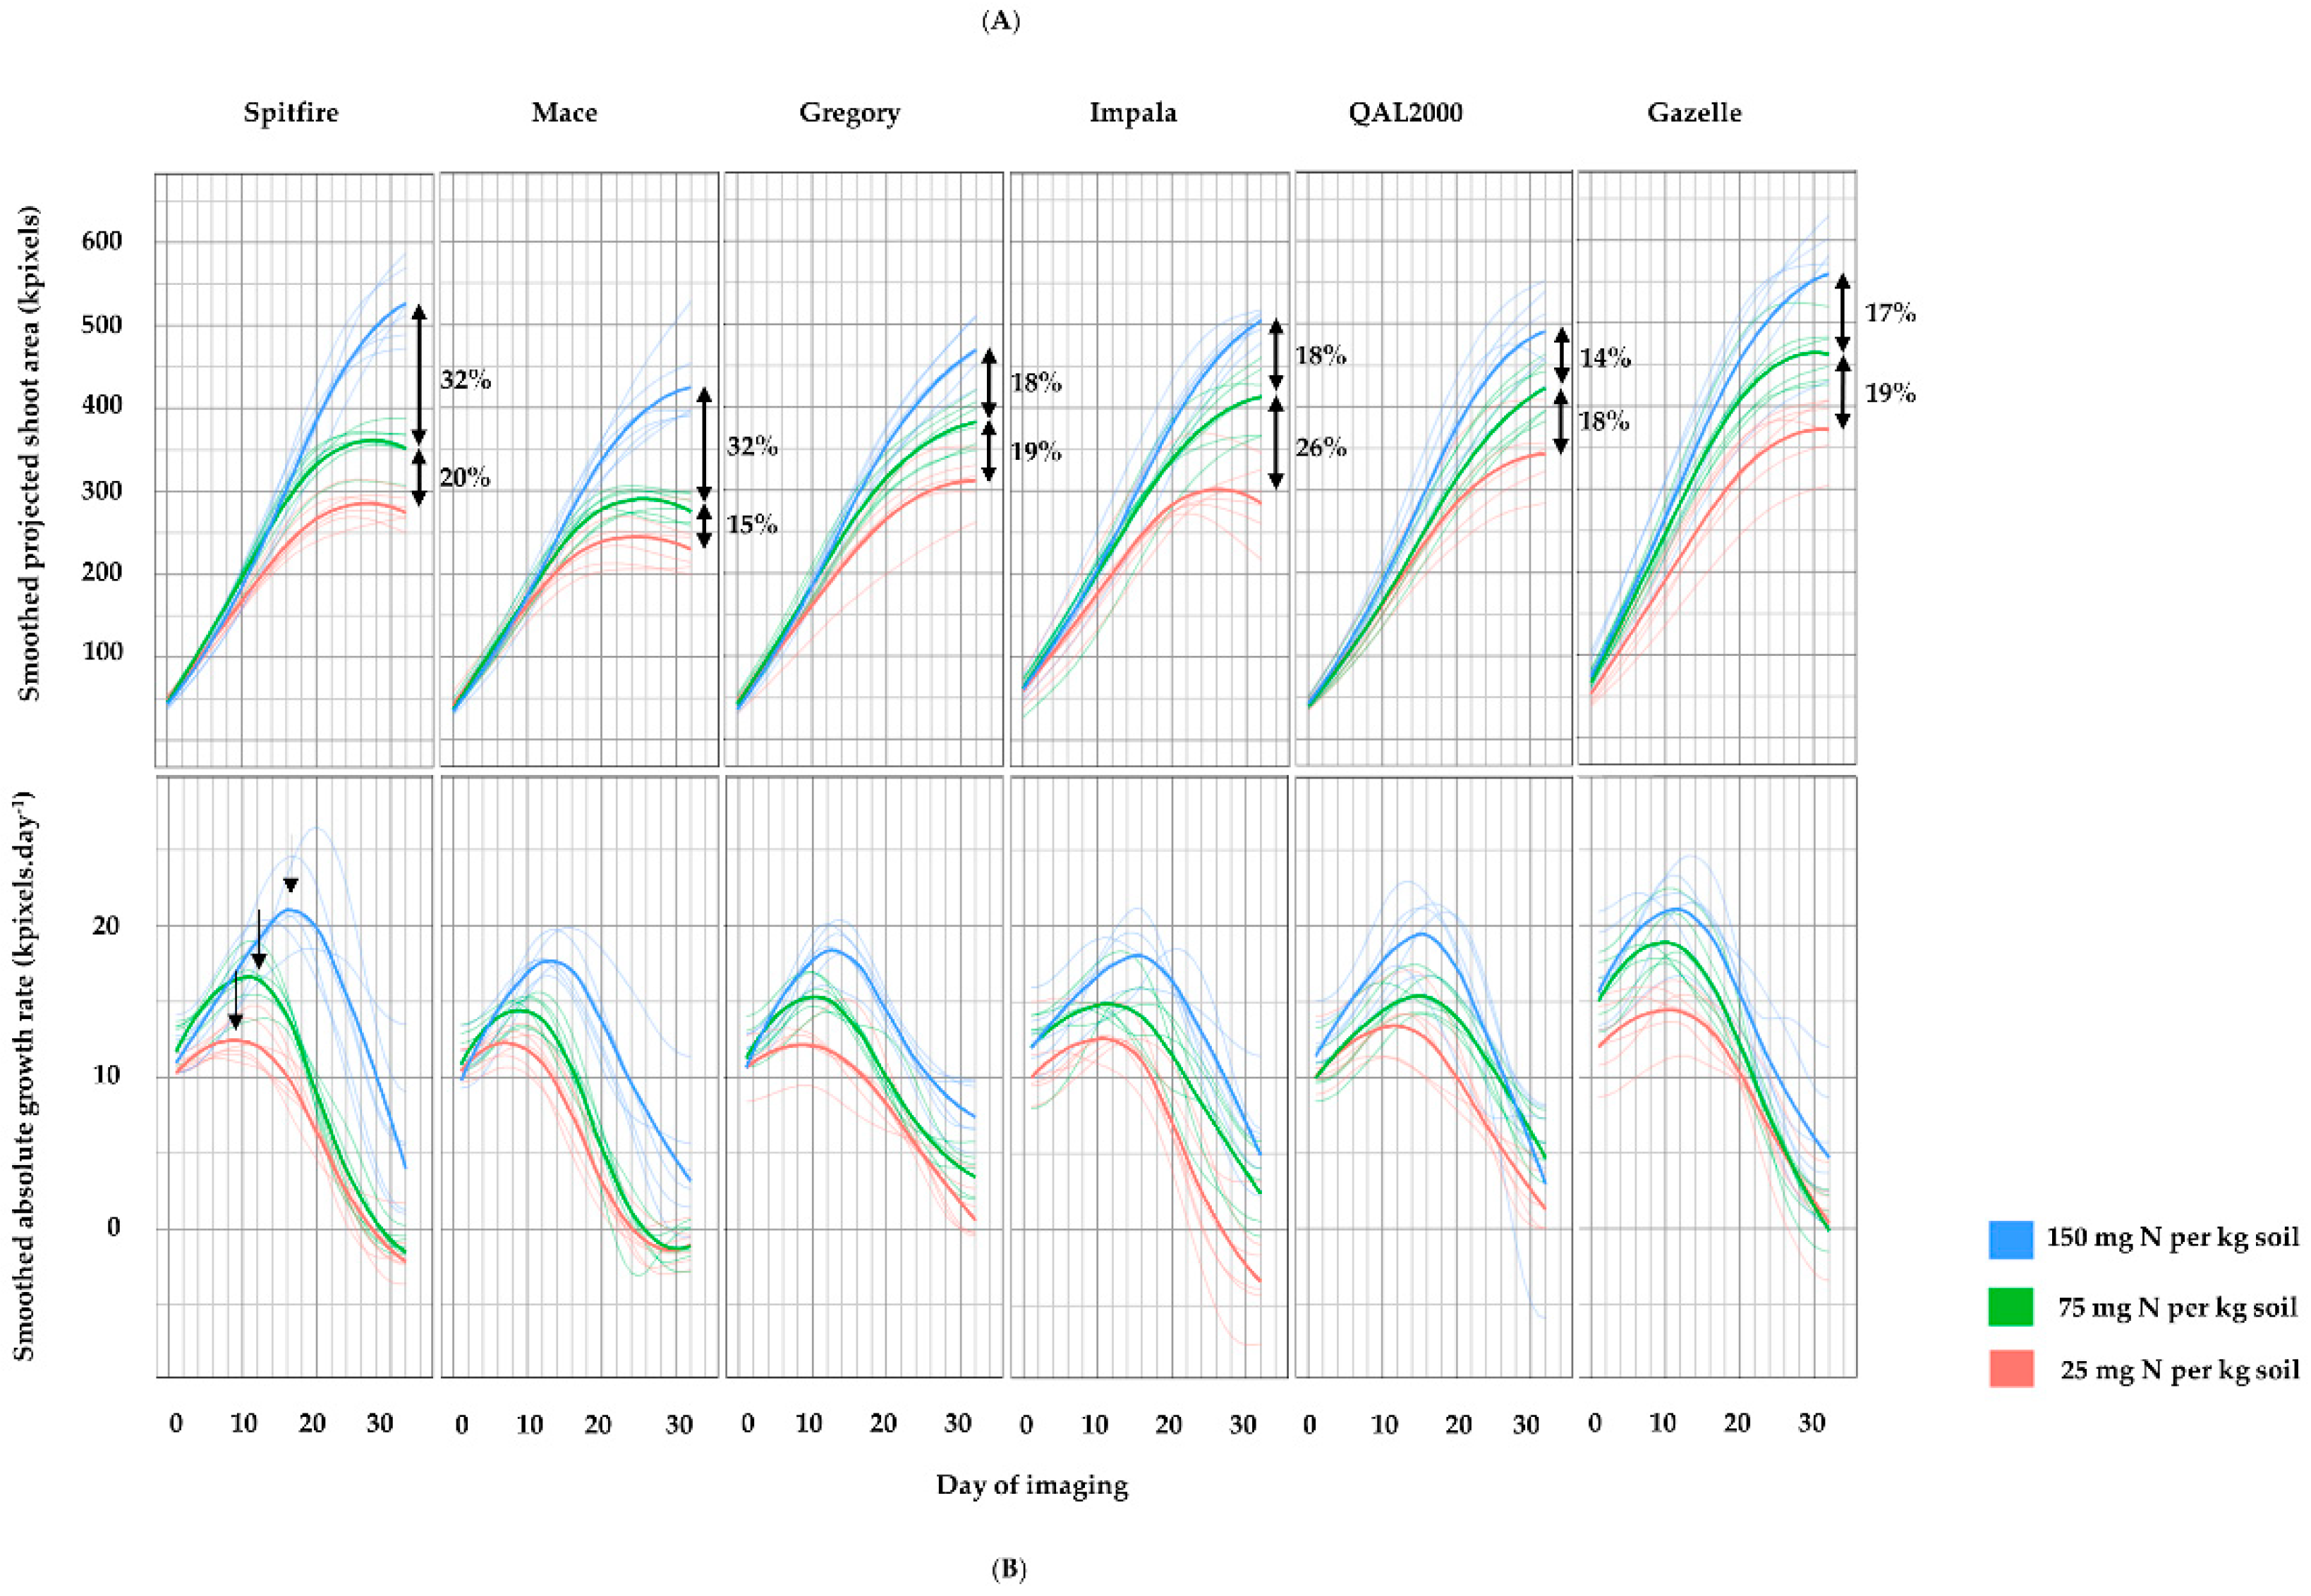
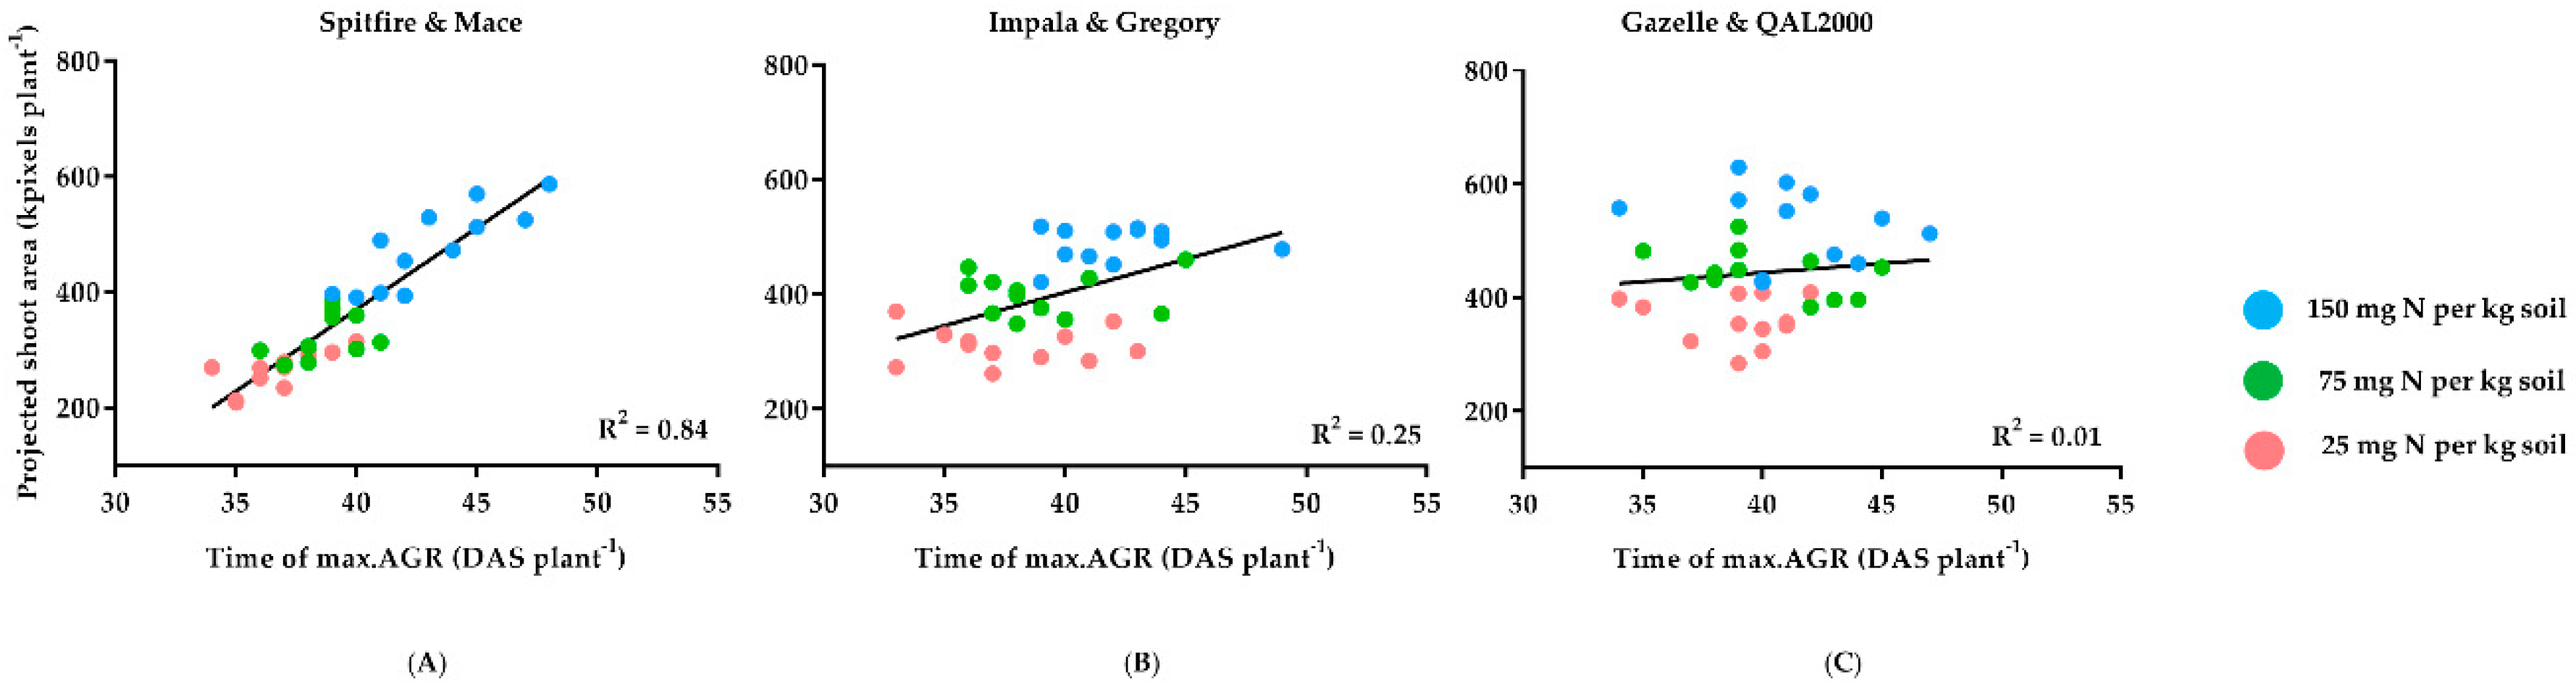
The design of the plots was generated using DAE [43], a package for the R [44] statistical computing environment. The need for unequal residual variance for the imaging was tested through restricted maximum likelihood estimation (REML) ratio tests using ASReml-R [45] and ASRemlPlus [46], packages for the R statistical computing environment. If non-significant, then equal residual variances were assumed. The phenotypic means were obtained using the resulting model. Significant differences were accepted at p ≤ 0.05.

3. Results

NVT data analysis showed that Spitfire produced the highest GPC, with Gazelle and QAL2000 showing the lowest compared to the other genotypes (Supplementary Figure S2). Mace was also selected as it was reported to be highly N responsive [47,48].
As mentioned above, plants were imaged daily from 29 to 61 DAS. Over the course of imaging, differences in PSA between the three N treatments increased over time. Maximum projected shoot area (max-PSA), which was the curve vertex, was reduced for all genotypes as N supply decreased (Figure 1A and Supplementary Figure S4A).
However, the biggest reduction in max-PSA from high to low N was in Spitfire and Mace with 46% and 43% decrease, respectively. In this context, maximum projected shoot area from high to medium nitrogen was more reduced in Spitfire and Mace with 32% compared to other genotypes. Conversely, less PSA reductions from high to low N were found in Gazelle and QAL2000 (Figure 1A and Figure 2, and Table 1).
After Spitfire and Mace, max-PSA declined more in Impala compared to other genotypes. However, PSA in Spitfire and Mace were mostly reduced from high to medium N, while PSA in Impala was highly restricted by reducing N inputs from medium to low (Figure 1A, and Table 1).
Max-AGR was also reduced as N level decreased in all genotypes (Figure 1B and Supplementary Figure S4B). Spitfire showed the highest decrease in maximum absolute growth rate from high to low N (Figure 1B and Table 1). Accordingly, the time to max-AGR (t-maxAGR) declined with reducing N supply in most of the genotypes, except Gazelle where t-maxAGR was not significantly reduced (Figure 3).
All genotypes, other than Gazelle, grew faster and achieved maximum absolute growth rate earlier at low N compared to high N-treatment. Under low N condition, QAL2000 showed the lowest reduction in the time of max-AGR after Gazelle, whereas the highest t-maxAGR decline was in Spitfire and Mace.
The post-harvest analysis showed that the above-ground biomass and grain weight were enhanced by increasing N inputs (Figure 4G–I and Supplementary Figure S3).
At low and medium N, Gazelle and QAL2000 produced relatively higher above-ground biomass and grain weight compared with other genotypes. However, at high N there was no difference in above-ground biomass and grain weight production between genotypes (Figure 4G–I and Supplementary Figure S3A–C). There was a positive correlation between above-ground biomass and grain weight in all N treatments and genotypes (Figure 5A).
Grain N% was negatively correlated with above-ground biomass and grain weight particularly at low N (Figure 5B,C). This negative relationship was stronger at low and medium compared to high N treatments. In other words, there was a tendency for decreased GPC with increased grain weight at high N for all genotypes.
In this study, the grain N% of all genotypes were not increased from low to high N. Consistent with NVT data (Supplementary Figure S2), N analysis showed that Spitfire tended to produce higher grain N% at low, medium and high N relative to the low GPC genotypes Gazelle and QAL2000 (Figure 4A–C, and Table 1). Interestingly, the N% in the non-grain tissues of Mace was higher than for Spitfire (Figure 4D–F).
There were no differences between the grain N% of Impala, Gazelle and QAL2000 in this study. However, results from 11 years of NVT data in different environments (Supplementary Figure S2A) showed that Impala and Gregory produced higher GPC compared to Gazelle and QAL2000, and lower GPC relative to Spitfire. Grain N% constituted most of the N reserves in all genotypes (Figure 4A–C). Based on the average of grain N% in all nitrogen supplies, genotypes in this study were categorized into three groups; high (Spitfire and Mace), medium (Impala and Gregory), and low (QAL2000 and Gazelle) grain N% genotypes. Genotypes were grouped solely based on the grain N% results obtained in this study. However, NVT data showed that the average GPC of Mace was not higher than Gregory and Impala (Table 1). The lower average GPC of Mace in NVT data might be due to its higher yield at some of the sites compared with Gregory and Impala. Mace is adapted to the low-yielding environments of southern Australia [49] and its GPC tends to drop at high yielding sites [50]. In this context, the grain protein deviation of Mace, after Spitfire, was higher than the other four genotypes (Supplementary Figure S2B).
Overall, the influence of N treatments on t-maxAGR was related to the difference from high to low grain N concentration genotypes (Table 1 and Figure 6A–C).
In Spitfire and Mace, which are considered as high grain N concentration genotypes, the time to maximum absolute growth rate was strongly correlated with projected shoot area. However, the strength of the relationship between t-maxAGR and PSA diminished in Gregory and Impala (medium grain N concentration) and was entirely lost in Gazelle and QAL2000 (low grain N concentration). The absence of a linear relationship between t-maxAGR and grain N% in Spitfire and Mace is shown in Figure 7A,B. Despite the high influence of the time to maximum absolute growth rate on biomass production in Spitfire and Mace, grain N% were unaffected at different N inputs.

4. Discussion

4.1. Biomass Can Indicate the Impact of Nitrogen on Grain Weight

As noted in previous studies [30,31,33], the strong correlation between above-ground biomass and grain weight (Figure 5A) showed that biomass can be used as an indicator of grain weight responses to N in the six wheat genotypes evaluated in this experiment. The relationship between above-ground biomass and grain weight is likely to be due to the positive correlation between leaf surface area and total photosynthesis per unit ground area [33,51]. Previous studies using destructive methods also showed a strong relationship between biomass and grain weight in both hard and soft wheat genotypes [25,52,53].
The high positive correlation between above-ground biomass and grain weight (Figure 5A) is counteracted by the negative correlation between biomass and grain N% (Figure 5B,C). Consequently, increasing grain weight appears to result in a grain N% penalty, particularly at low N. The reduction in grain N% with increasing grain weight may reflect the high priority placed on elevating grain weight by wheat breeders rather than grain N% accumulation under low N conditions. The results suggest that once the maximum level of grain weight has been achieved, the additional N is invested in increasing grain N%, particularly, for high GPC genotypes [54,55]. The relatively low grain N% seen for all varieties in this study (Figure 4A–C) may be due to the favourable growth conditions in the greenhouse and, consequent, increase in biomass. It appears that the high N requirements of plants seen in this experiment, meant that the applied N at low and medium N was mostly used for grain weight production rather than to increase grain N%.

4.2. Differences in Nitrogen Responsiveness between High and Low GPC Genotypes

Spitfire and Mace produced less biomass at low N than the other genotypes and were more responsive at high N compared with the low grain N% genotypes (Figure 1A and Figure 4G–I). Related studies on wheat and oilseed spring rape indicate that genotypes, which show reduced yield at low N may show greater responses to higher N levels compared to other genotypes [48,56,57]. It is shown that high compared to low GPC wheat genotypes require higher N rates to show favourable yield responses [58].
In accordance with previous studies [39,59,60,61], reducing N supply diminished the total biomass and growth rate. However, by reducing N inputs, biomass and growth rate declined more in high than in low grain N concentration genotypes. In fact, the biomass of genotypes that were selected for high GPC was more vulnerable to low N in comparison with the biomass of low GPC genotypes (Figure 1A, Figure 2, and Figure 4G–I). The high reduction of biomass growth in high GPC genotypes at low N was previously observed in wheat [62,63]. In high GPC genotypes, biomass growth under limited N may be reduced in favour of root growth to support N uptake after anthesis [62].
This study showed that shortening t-maxAGR was the key limiting factor for PSA production for high grain N genotypes (Figure 6A). In other words, high N genotypes appear to reach the peak of growth and terminate the vegetative stage earlier in low N than high N-treated plants (Figure 1B, Figure 3 and Table 1). Compressing phenology at low N, which decreases N requirement, has been previously observed in different species [39,60,64,65,66]. However, the low impact of N shortage on the t-maxAGR and biomass growth of Gazelle and QAL2000 was a new finding in this study.
Our results indicated that the rate of t-maxAGR reduction from high to low N was related to the grain N concentration (Table 1 and Figure 6A–C). Spitfire and Mace had higher grain N than Gazelle and QAL2000, and appeared to demand more N to grow their biomass. It might be that high grain N% genotypes sense the low N status early in development and shorten their vegetative growth phase to maintain sufficient N for grain development and filling. Hence, Spitfire responded to low N by reducing growth rate, possibly to conserve N for grains (Figure 1B and Table 1). In this context, the grain N% of Spitfire and Mace were not influenced by t-maxAGR at different N treatments (Figure 7A,B). Therefore, high grain N% genotypes in this study were able to prevent grain N loss at low N conditions regardless of the variations in the time to maximum absolute growth rate.
Accelerating the life cycle is a typical response of plants to low N [39]. N translocation corresponds with senescence since senescing leaf and stem tissues are an important N source for grains [67,68,69]. Therefore, the increase of shoot biomass and carbon assimilation after flowering can compete with grain demand for N [70]. In Gazelle and QAL2000, which are genotypes used for low GPC purposes [11], low N supply did not trigger accelerated development and a decrease in the time to maxAGR (Figure 6C). This suggests that Gazelle and QAL2000 use the available N primarily for biomass production and do not show the conservative strategy used by Spitfire and Mace.
Increases of max-AGR and t-maxAGR from low to high N in Mace were not as high as in Spitfire (Figure 1B and Table 1). Spitfire is known to produce higher GPC compared to Mace and many other genotypes (Supplementary Figure S2A) [71,72]. Therefore, Mace may be less sensitive to low N in comparison with Spitfire. The modest max-AGR increase in Mace from low to high N could be due to mechanisms that help the plants adapt to unfavourable conditions late in the season. In contrast to Spitfire, Mace is mostly grown in regions where late-season drought is common [19,48,73]. In such regions, characterized by terminal drought, compressing phenology may be a beneficial trait [65]. Extending the time to maxAGR and increasing max-AGR at high N in summer for Mace could raise the risk of drought and haying-off at late season. Increasing t-maxAGR under high N supply conditions may be an effective trait for building biomass provided that the available time for full development is not limited.
Differences in N responsiveness between genotypes may be due to their history of selection Dhugga and Waines [74] suggested that selection of new wheat genotypes in high N soils would improve the breeding efficiency for high GPC. Over 20 years, N fertiliser application was steadily increased [75] and wheat breeders have tended to select for high yielding genotypes under high N supply. Applying N beyond the demand for maximum yield can raise the GPC (Figure 5B), which would be undesirable for low GPC soft genotypes [76,77,78,79]. Soft wheats can be downgraded if they have more than 9.5% GPC in Australia [13]. Thus, the rate of applied N for producing low-protein soft wheats is less than for high GPC hard wheats [80,81]. Consequently, soft wheats are bred primarily for high yield and GPC is a low priority since this can be managed by maintaining low N supply [82]. Selection under high N may have resulted in the higher sensitivity of Spitfire and Mace to low N in comparison with Gazelle and QAL2000. Therefore, it is possible that Australian hard wheat breeders have unintentionally selected for increased N demand in modern hard genotypes.
Gazelle and QAL2000 are grown mostly in east coast regions with high rainfall or irrigation [83,84,85]. Frequent rainfall or watering can lead to N leaching into deeper soil layers that reduces the amount of available N in the soil [86]. Therefore, plants grown on such soils with poor available N, may respond strongly to even low amounts of N [19,87]. In addition, several Australian soft wheat genotypes originate from Western Australian regions characterized by light and sandy soils [88,89]. Sandy soils have low water retention capacity, which reduces the amount of available N compared with finer textured soils [19,87,88]. Consequently, Western Australian soils are potentially N-deficient [88,90].
Although Impala is a biscuit soft wheat, it is known to produce slightly higher GPC compared to QAL2000 and Gazelle (Supplementary Figure S2A) [83]. Therefore, the higher decline in the biomass and t-maxAGR of Impala from high to low N, compared to QAL2000 and Gazelle, may be due to the higher N demand of Impala (Table 1). However, due to different selection purposes, less N% was required in the grain of Impala compared to Spitfire and Mace. Consequently, PSA in Impala was mostly reduced from medium to low N, whereas in Spitfire and Mace it was from high to medium N (Figure 1A).

5. Conclusions

Accelerated development appeared to reduce the effect of low N supply on the grain N concentration of genotypes with high GPC. High grain N% genotypes seem able to manage grain N reserves by reducing biomass production at low N. This mechanism may sacrifice biomass and, consequently, yield but helps to ensure the required amounts of N are available for grains to maintain high GPC. Breeders appear to have selected for this trait through selection for high GPC in low yielding environments. Conversely, for the low grain N% genotypes, Gazelle and QAL2000, low N has little impact on the biomass production, and the yield of these genotypes shows greater tolerance to N deficiency [91,92]. Consistent with the previous NUE studies on wheat and maize [25,63,93], the current results suggest that there is value in including screening and selection at low N supply rather than focusing only on high N environments in breeding programs. This can be beneficial for identifying N-use efficient genotypes and novel NUE traits in wheat. This study also confirms the importance of non-destructive method for biomass growth analysis to show the differences in the N responsiveness of high and low GPC wheat.

Supplementary Materials

The following are available online at https://www.mdpi.com/2073-4395/9/11/706/s1.

Author Contributions

Conceptualization, V.R.E., T.G., P.L., S.M.H.; methodology, V.R.E., T.G., P.L., M.O., S.M.H., C.B.; formal analysis, V.R.E., N.J. and C.B.; Statistical supervision, C.B.; investigation, V.R.E.; writing—original draft preparation, V.R.E., T.G., P.L., M.O.; writing—review and editing, V.R.E, T.G., P.L, M.O.; supervision, T.G., P.L, M.O, S.M.H. All authors have read and approved the final manuscript.

Funding

This work was supported by ARC Industrial Transformation Research Hub for Wheat in a Hot and Dry Climate grant number IH130200027, and the Australian Plant Phenomics Facility.

Acknowledgments

The authors would like to thank the staff at NUE lab of The University of Adelaide, and Australian Plant Phenomics Facility. We acknowledge Dr. Bettina Berger and Dr. Marie Appelbee for their assistance and advice, and Kate Dowling for preparing the experimental design. The authors acknowledge the use of the facilities of the Australian Plant Phenomics Facility, which is supported by the Australian Government’s National Collaborative Research Infrastructure Strategy (NCRIS) scheme and particularly the support of a Plant Accelerators student internship for Vahid Rahimi Eichi.

Conflicts of Interest

The authors declare no conflict of interest.

Abbreviations

AGRAbsolute growth rate
DASDays after sowing
GPCGrain protein content
NNitrogen
NUENitrogen use efficiency
NVTNational variety trials
PSAProjected shoot area
t-maxAGRTime to maximum growth rate

References

  1. Shewry, P.R.; Hey, S.J. The contribution of wheat to human diet and health. Food Energy Secur. 2015, 4, 178–202. [Google Scholar] [CrossRef] [PubMed]
  2. Husenov, B.; Makhkamov, M.; Garkava-Gustavsson, L.; Muminjanov, H.; Johansson, E. Breeding for wheat quality to assure food security of a staple crop: The case study of tajikistan. Agric. Food Secur. 2015, 4, 9. [Google Scholar] [CrossRef]
  3. Kuhn, J.C.; Stubbs, T.L.; Carter, A.H. Effect of the gpc-b1 allele in hard red winter wheat in the us pacific northwest. Crop Sci. 2016, 56, 1009–1017. [Google Scholar] [CrossRef]
  4. Hong, B.H.; Rubenthaler, G.L.; Allan, R.E. Wheat pentosans. 1. Cultivar variation and relationship to kernel hardness. Cereal Chem. 1989, 66, 369–373. [Google Scholar]
  5. Bettge, A.D.; Morris, C.F. Relationships among grain hardness, pentosan fractions, and end-use quality of wheat. Cereal Chem. 2000, 77, 241–247. [Google Scholar] [CrossRef]
  6. Saint Pierre, C.; Peterson, C.J.; Ross, A.S.; Ohm, J.B.; Verhoeven, M.C.; Larson, M.; Hoefer, B. White wheat grain quality changes with genotype, nitrogen fertilization, and water stress. Agron. J. 2008, 100, 414–420. [Google Scholar] [CrossRef]
  7. Kibite, S.; Evans, L. Causes of negative correlations between grain yield and grain protein concentration in common wheat. Int. J. Plant. Breed. 1984, 33, 801–810. [Google Scholar] [CrossRef]
  8. Simmonds, N.W. The relation between yield and protein in cereal grain. J. Sci. Food Agric. 1995, 67, 309–315. [Google Scholar] [CrossRef]
  9. Bogard, M.; Allard, V.; Brancourt-Hulmel, M.; Heumez, E.; Machet, J.-M.; Jeuffroy, M.-H.; Gate, P.; Martre, P.; Le Gouis, J. Deviation from the grain protein concentration–grain yield negative relationship is highly correlated to post-anthesis n uptake in winter wheat. J. Exp. Bot. 2010, 61, 4303–4312. [Google Scholar] [CrossRef]
  10. Ortiz-Monasterio, R.J.I.; Sayre, K.D.; Rajaram, S.; McMahon, M. Genetic progress in wheat yield and nitrogen use efficiency under four nitrogen rates. Crop Sci. 1997, 37, 898. [Google Scholar] [CrossRef]
  11. Huebner, F.R.; Bietz, J.A.; Nelsen, T.; Bains, G.S.; Finney, P.L. Soft wheat quality as related to protein composition. Cereal Chem. 1999, 76, 650–655. [Google Scholar] [CrossRef]
  12. Moss, H.J. Quality standards for wheat varieties. J. Aust. Inst. Agric. Sci. 1973, 39, 109–115. [Google Scholar]
  13. Anderson, W.K.; Sawkins, D. Production practices for improved grain yield and quality of soft wheats in western australia. Aust. J. Exp. Agric. 1997, 37, 173–180. [Google Scholar] [CrossRef]
  14. Triboi, E.; Abad, A.; Michelena, A.; Lloveras, J.; Ollier, J.L.; Daniel, C. Environmental effects on the quality of two wheat genotypes: 1. Quantitative and qualitative variation of storage proteins. Eur. J. Agron. 2000, 13, 47–64. [Google Scholar] [CrossRef]
  15. Sinclair, T.R.; Rufty, T.W. Nitrogen and water resources commonly limit crop yield increases, not necessarily plant genetics. Glob. Food Secur. 2012, 1, 94–98. [Google Scholar] [CrossRef]
  16. Sylvester-Bradley, R.; Kindred, D.R. Analysing nitrogen responses of cereals to prioritize routes to the improvement of nitrogen use efficiency. J. Exp. Bot. 2009, 60, 1939–1951. [Google Scholar] [CrossRef] [PubMed] [Green Version]
  17. Harrison, R.; Webb, J. A review of the effect of n fertilizer type on gaseous emissions. Adv. Agron. 2001, 73, 65–108. [Google Scholar]
  18. Bouwer, H. Agricultural contaminants: Problems and solutions. J. Water Environ. Technol. 1989, 1, 292–297. [Google Scholar]
  19. Sadras, V.O.; Hayman, P.T.; Rodriguez, D.; Monjardino, M.; Bielich, M.; Unkovich, M.; Mudge, B.; Wang, E. Interactions between water and nitrogen in australian cropping systems: Physiological, agronomic, economic, breeding and modelling perspectives. Crop Pasture Sci. 2016, 67, 1019–1053. [Google Scholar] [CrossRef]
  20. Birch, C.J.; Long, K.E. Effect of nitrogen on the growth, yield and grain protein-content of barley (Hordeum vulgare). Aust. J. Exp. Agric. 1990, 30, 237–242. [Google Scholar] [CrossRef]
  21. Sadras, V.O.; Richards, R.A. Improvement of crop yield in dry environments: Benchmarks, levels of organisation and the role of nitrogen. J. Exp. Bot. 2014, 65, 1981–1995. [Google Scholar] [CrossRef] [PubMed]
  22. Cormier, F.; Foulkes, J.; Hirel, B.; Gouache, D.; Moenne-Loccoz, Y.; Le Gouis, J. Breeding for increased nitrogen-use efficiency: A review for wheat (T. aestivum L.). Plant Breed. 2016, 135, 255–278. [Google Scholar] [CrossRef]
  23. Sanford, D.; MacKown, C. Variation in nitrogen use efficiency among soft red winter wheat genotypes. Int. J. Plant. Breed. Res. 1986, 72, 158–163. [Google Scholar] [CrossRef] [PubMed]
  24. Bogard, M.; Jourdan, M.; Allard, V.; Martre, P.; Perretant, M.R.; Ravel, C.; Heumez, E.; Orford, S.; Snape, J.; Griffiths, S.; et al. Anthesis date mainly explained correlations between post-anthesis leaf senescence, grain yield, and grain protein concentration in a winter wheat population segregating for flowering time QTLS. J. Exp. Bot. 2011, 62, 3621–3636. [Google Scholar] [CrossRef] [PubMed]
  25. Hitz, K.; Clark, A.J.; Van Sanford, D.A. Identifying nitrogen-use efficient soft red winter wheat lines in high and low nitrogen environments. Field Crops Res. 2017, 200, 1–9. [Google Scholar] [CrossRef] [Green Version]
  26. Araus, J.L.; Slafer, G.A.; Reynolds, M.P.; Royo, C. Plant breeding and drought in c3 cereals: What should we breed for? Ann. Bot. 2002, 89, 925–940. [Google Scholar] [CrossRef]
  27. Tardieu, F.; Tuberosa, R. Dissection and modelling of abiotic stress tolerance in plants. Curr. Opin. Plant Biol. 2010, 13, 206–212. [Google Scholar] [CrossRef]
  28. Dunbabin, V. Simulating the role of rooting traits in crop-weed competition. Field Crops Res. 2007, 104, 44–51. [Google Scholar] [CrossRef]
  29. Hansen, N.J.S.; Plett, D.; Berger, B.; Garnett, T. Tackling nitrogen use efficiency in cereal crops using high-throughput phenotyping. In Engineering Nitrogen Utilization in Crop Plants; Shrawat, A., Zayed, A., Lightfoot, D.A., Eds.; Springer International Publishing: Cham, Switzerland, 2018; pp. 121–139. [Google Scholar]
  30. Sharma, R. Selection for biomass yield in wheat. Int. J. Plant Breed. 1993, 70, 35–42. [Google Scholar] [CrossRef]
  31. Oscarson, P. The strategy of the wheat plant in acclimating growth and grain production to nitrogen availability. J. Exp. Bot. 2000, 51, 1921–1929. [Google Scholar] [CrossRef]
  32. Alzueta, I.; Abeledo, L.G.; Mignone, C.M.; Miralles, D.J. Differences between wheat and barley in leaf and tillering coordination under contrasting nitrogen and sulfur conditions. Eur. J. Agron. 2012, 41, 92–102. [Google Scholar] [CrossRef]
  33. Richards, R.A. Selectable traits to increase crop photosynthesis and yield of grain crops. J. Exp. Bot. 2000, 51, 447–458. [Google Scholar] [CrossRef] [PubMed]
  34. Furbank, R.T.; Tester, M. Phenomics—Technologies to relieve the phenotyping bottleneck. Trends Plant Sci. 2011, 16, 635–644. [Google Scholar] [CrossRef] [PubMed]
  35. Berger, B.; De Regt, B.; Tester, M. High-throughput phenotyping of plant shoots. In High-throughput Phenotyping in Plants; Normanly, J., Ed.; Humana Press: Totowa, NJ, USA, 2012; Volume 918. [Google Scholar]
  36. Koelewijn, H.P. Rapid change in relative growth rate between the vegetative and reproductive stage of the life cycle in plantago coronopus. New Phytol. 2004, 163, 67–76. [Google Scholar] [CrossRef]
  37. Kozłowski, J. Optimal allocation of resources to growth and reproduction: Implications for age and size at maturity. Trends Ecol. Evol. 1992, 7, 15–19. [Google Scholar] [CrossRef]
  38. Hawkesford, M.J.; Kopriva, S.; De Kok, L.J. Nutrient Use Efficiency in Plants: Concepts and Approaches; Springer International Publishing: Cham, Switzerland, 2014; Volume 10. [Google Scholar]
  39. Marschner, H.; Marschner, P.; Marschner, H. Marschner’s Mineral Nutrition of Higher Plants, 3rd ed.; Elsevier Academic Press: London, UK, 2012. [Google Scholar]
  40. Neilson, E.H.; Edwards, A.M.; Blomstedt, C.K.; Berger, B.; Moller, B.L.; Gleadow, R.M. Utilization of a high-throughput shoot imaging system to examine the dynamic phenotypic responses of a c-4 cereal crop plant to nitrogen and water deficiency over time. J. Exp. Bot. 2015, 66, 1817–1832. [Google Scholar] [CrossRef]
  41. Shi, P.-J.; Men, X.-Y.; Sandhu, H.S.; Chakraborty, A.; Li, B.-L.; Ou-Yang, F.; Sun, Y.-C.; Ge, F. The “general” ontogenetic growth model is inapplicable to crop growth. Ecol. Model. 2013, 266, 1–9. [Google Scholar] [CrossRef]
  42. Al-Tamimi, N.; Brien, C.; Oakey, H.; Berger, B.; Saade, S.; Ho, Y.S.; Schmöckel, S.M.; Tester, M.; Negrão, S. Salinity tolerance loci revealed in rice using high-throughput non-invasive phenotyping. Nat. Commun. 2016, 7, 13342. [Google Scholar] [CrossRef] [Green Version]
  43. Brien, C.J. Dae: Functions Useful in the Design and Anova of Experiments. R Package Version 3.0-32. Available online: https://cran.at.r-project.org/package=dae (accessed on 17 June 2019).
  44. R: A Language and Environment for Statistical Computing; R Foundation for Statistical Computing, R Development Core Team: Vienna, Austria, 2009.
  45. Butler, D.G.; Cullis, B.R.; Gilmour, A.R.; Gogel, B.J.; Thompson, R. Asreml-R Reference Manual. Version 4. Available online: http://asreml.org (accessed on 2 February 2018).
  46. Brien, C.J. Asremlplus: Augments Asreml-R in Fitting Mixed Models and Packages Generally in Exploring Prediction Differences. R Package Version 4.1-28. Available online: https://cran.at.r-project.org/package=asremlPlus (accessed on 17 June 2019).
  47. Davis, L.; Ware, A.; Cook, A. Port. Kenny, Franklin Harbour, Elliston and Wharminda Wheat and Barley Variety Trials in 2015; PIRSA: Adelaide, SA, Australia, 2016. [Google Scholar]
  48. Mahjourimajd, S.; Kuchel, H.; Langridge, P.; Okamoto, M. Evaluation of australian wheat genotypes for response to variable nitrogen application. Int. J. Plant Soil Relatsh. 2016, 399, 247–255. [Google Scholar] [CrossRef]
  49. Eagles, H.A.; McLean, R.; Eastwood, R.F.; Appelbee, M.J.; Cane, K.; Martin, P.J.; Wallwork, H. High-yielding lines of wheat carrying Gpc-B1 adapted to mediterranean-type environments of the south and west of australia. Crop Pasture Sci. 2014, 65, 854–861. [Google Scholar] [CrossRef]
  50. Mosleth, E.F.; Wan, Y.; Lysenko, A.; Chope, G.A.; Penson, S.P.; Shewry, P.R.; Hawkesford, M.J. A novel approach to identify genes that determine grain protein deviation in cereals. Plant Biotechnol. J. 2015, 13, 625–635. [Google Scholar] [CrossRef] [PubMed]
  51. Cowling, S.A.; Field, C.B. Environmental control of leaf area production: Implications for vegetation and land-surface modeling. Glob. Biogeochem. Cycles 2003, 17, 1–14. [Google Scholar] [CrossRef]
  52. White, E.M.; Wilson, F.E.A. Responses of grain yield, biomass and harvest index and their rates of genetic progress to nitrogen availability in ten winter wheat varieties. Ir. J. Agric. Food Res. 2006, 45, 85–101. [Google Scholar]
  53. Kato, Y. Grain nitrogen concentration in wheat grown under intensive organic manure application on andosols in central japan. Plant Prod. Sci. 2012, 15, 40–47. [Google Scholar] [CrossRef]
  54. Jones, C.; Olson-Rutz, K. Practices to Increase Wheat Grain Protein; Extension; Montana State University: Bozeman, MT, USA, 2012. [Google Scholar]
  55. McKenzie, R.H.; Bremer, E.; Grant, C.A.; Johnston, A.M.; DeMulder, J.; Middleton, A.B. In-crop application effect of nitrogen fertilizer on grain protein concentration of spring wheat in the canadian prairies. Crop Appl. Eff. Nitrogen Fertil. Grain Protein Conc. Spring Wheat Can. Prairies 2006, 86, 565–572. [Google Scholar] [CrossRef]
  56. Yau, S.K.; Thurling, N. Variation in nitrogen response among spring rape (brassica napus) cultivars and its relationship to nitrogen uptake and utilization. Field Crops Res. 1987, 16, 139–155. [Google Scholar] [CrossRef]
  57. Ulas, A.; Behrens, T.; Wiesler, F.; Horst, W.J.; Erley, G.S.A. Does genotypic variation in nitrogen remobilisation efficiency contribute to nitrogen efficiency of winter oilseed-rape cultivars (Brassica napus L.)? Plant Soil 2013, 371, 463–471. [Google Scholar] [CrossRef]
  58. Johnson, V.A.; Dreier, A.F.; Grabousk, P. Yield and protein responses to nitrogen fertilizer of two winter wheat varieties differing in inherent protein content of their grain. Agron. J. 1973, 65, 259–263. [Google Scholar] [CrossRef]
  59. Poorter, H.; Niklas, K.J.; Reich, P.B.; Oleksyn, J.; Poot, P.; Mommer, L. Biomass allocation to leaves, stems and roots: Meta-analyses of interspecific variation and environmental control. New Phytol. 2012, 193, 30–50. [Google Scholar] [CrossRef]
  60. Broadley, M.R.; Escobar-Gutiérrez, A.J.; Burns, A.; Burns, I.G. What are the effects of nitrogen deficiency on growth components of lettuce? New Phytol. 2000, 147, 519–526. [Google Scholar] [CrossRef]
  61. Xiao, J.; Yin, X.; Ren, J.; Zhang, M.; Tang, L.; Zheng, Y. Complementation drives higher growth rate and yield of wheat and saves nitrogen fertilizer in wheat and faba bean intercropping. Field Crops Res. 2018, 221, 119–129. [Google Scholar] [CrossRef]
  62. Cox, M.C.; Qualset, C.O.; Rains, D.W. Genetic variation for nitrogen assimilation and translocation in wheat. I. Dry matter and nitrogen accumulation. Genet. Var. Nitrogen Assim. Translocat. Wheat. I. Dry Matter Nitrogen Accumul. 1985, 25, 430–435. [Google Scholar]
  63. Brancourt-Hulmel, M.; Heumez, E.; Pluchard, P.; Beghin, D.; Le Gouis, C.; Depatureaux, A.; Giraud, J. Indirect versus direct selection of winter wheat for low-input or high-input levels. Crop Sci. 2005, 45, 1427–1431. [Google Scholar] [CrossRef]
  64. Shepherd, K.D.; Cooper, P.J.M.; Allan, A.Y.; Drennan, D.S.H.; Keatinge, J.D.H. Growth, water-use and yield of barley in mediterranean-type environments. J. Agric. Sci. 1987, 108, 365–378. [Google Scholar] [CrossRef]
  65. Nord, E.A.; Lynch, J.P. Plant phenology: A critical controller of soil resource acquisition. J. Exp. Bot. 2009, 60, 1927–1937. [Google Scholar] [CrossRef]
  66. Thies, J.E.; Singleton, P.W.; Bohlool, B.B. Phenology, growth, and yield of field-grown soybean and bush bean as a function of varying modes of n-nutrition. Soil Biol. Biochem. 1995, 27, 575–583. [Google Scholar] [CrossRef]
  67. Aerts, R. Nutrient resorption from senescing leaves of perennials: Are there general patterns? J. Ecol. 1996, 84, 597–608. [Google Scholar] [CrossRef]
  68. Gobert, S.; Lejeune, P.; Lepoint, G.; Bouquegneau, J.M. C, n, p concentrations and requirements of flowering posidonia oceanica shoots. Hydrobiologia 2005, 533, 253–259. [Google Scholar] [CrossRef]
  69. Milla, R.; Castro-Diez, P.; Maestro-Martinez, M.; Montserrat-Marti, G. Relationships between phenology and the remobilization of nitrogen, phosphorus and potassium in branches of eight mediterranean evergreens. New Phytol. 2005, 168, 167–178. [Google Scholar] [CrossRef]
  70. Lynch, J.; White, J.W. Shoot nitrogen dynamics in tropical common bean. Crop Sci. 1992, 32, 392–397. [Google Scholar] [CrossRef]
  71. Dechorgnat, J.; Kaiser, B.N. Grain nitrogen filling in two contrasting australian wheat cultivars. In COMBIO Symposium; Adelaide, 2 October 2017. [Google Scholar]
  72. Fettell, N.; Brill, R.; Gardner, M.; McMullen, G. Yield and Protein Relationships in Wheat; Grains Research & Development Corporation: Canberra, Australia, 2012. [Google Scholar]
  73. Savin, R.; Slafer, G.A.; Cossani, C.M.; Abeledo, L.G.; Sadras, V.O. Cereal yield in mediterranean-type environments: Challenging the paradigms on terminal drought, the adaptability of barley vs. wheat and the role of nitrogen fertilization. In Crop Physiology, 2nd ed.; Sadras, V.O., Calderini, D.F., Eds.; Elsevier: Amsterdam, The Netherlands, 2014; pp. 141–158. [Google Scholar]
  74. Dhugga, K.S.; Waines, J.G. Analysis of nitrogen accumulation and use in bread and durum wheat. Crop Sci. 1989, 29, 1232–1239. [Google Scholar] [CrossRef]
  75. Anderson, W.K.; Hamza, M.A.; Sharma, D.L.; D’Antuono, M.F.; Hoyle, F.C.; Hill, N.; Shackley, B.J.; Amjad, M.; Zaicou-Kunesch, C. The role of management in yield improvement of the wheat crop—A review with special emphasis on western australia. Aust. J. Agric. Res. 2005, 56, 1137–1149. [Google Scholar] [CrossRef]
  76. Rao, A.C.S.; Smith, J.L.; Jandhyala, V.K.; Papendick, R.I.; Parr, J.F. Cultivar and climatic effects on the protein content of soft white winter wheat. Agron. J. 1993, 85, 1023–1028. [Google Scholar] [CrossRef]
  77. Sullivan, D.M.; Bary, A.I.; Cogger, C.G.; Shearin, T.E. Predicting biosolids application rates for dryland wheat across a range of northwest climate zones. Commun. Soil Sci. Plant Anal. 2009, 40, 1770–1789. [Google Scholar] [CrossRef]
  78. Cogger, C.G.; Bary, D.M.; Sullivan, A.I.; Kropf, J.A. Matching plant-available nitrogen from biosolids with dryland wheat needs. J. Prod. Agric. 1998, 11, 41–47. [Google Scholar] [CrossRef]
  79. Hunter, A.; Gerard, C.; Waddoups, H.; Hall, W.; Cushman, H.; Alban, L. The effect of nitrogen fertilizers on the relationship between increases in yields and protein content of pastry-type wheats. Agron. J. 1958, 50, 311. [Google Scholar] [CrossRef]
  80. Mahler, R.L.; Guy, S.O. Soft wheat spring wheat. In Northern Idaho Fertilizer Guide; University of Idaho: Moscow, ID, USA, 2007. [Google Scholar]
  81. Stewart, W.M. Fertilizer for better bread. Better Crops 2003, 87, 15–17. [Google Scholar]
  82. Swanston, J.S.; Newton, A.C.; Brosnan, J.M.; Fotheringham, A.; Glasgow, E. Determining the spirit yield of wheat varieties and variety mixtures. J. Cereal Sci. 2005, 42, 127–134. [Google Scholar] [CrossRef]
  83. Matthews, P.; McCaffery, D.; Jenkins, L. Winter Crop Variety Sowing Guide 2017; Department of Primary Industries: Orange, NSW, Australia, 2017. [Google Scholar]
  84. Fuller, P. New wheat varieties meet the quality challenge. In Grain Business; Glencore Grain Pty Ltd.: Melbourne, VIC, Australia, 2013. [Google Scholar]
  85. Lush, D.; Forknall, C.; Neate, S.; Sheedy, J. Queensland Wheat Varieties 2017; GRDC: Canberra, Australia; DAF: Brisbane, QLD, Australia, 2017. [Google Scholar]
  86. Wang, Q.; Li, F.R.; Zhao, L.; Zhang, E.H.; Shi, S.L.; Zhao, W.Z.; Song, W.X.; Vance, M.M. Effects of irrigation and nitrogen application rates on nitrate nitrogen distribution and fertilizer nitrogen loss, wheat yield and nitrogen uptake on a recently reclaimed sandy farmland. Plant Soil 2010, 337, 325–339. [Google Scholar] [CrossRef]
  87. Oliver, Y.M.; Robertson, M.J. Quantifying the benefits of accounting for yield potential in spatially and seasonally responsive nutrient management in a mediterranean climate. Aust. J. Soil Res. 2009, 47, 114. [Google Scholar] [CrossRef]
  88. Chen, W.; Bell, R.W.; Brennan, R.F.; Bowden, J.W.; Dobermann, A.; Rengel, Z.; Porter, W. Key crop nutrient management issues in the western australia grains industry: A review. Aust. J. Soil Res. 2009, 47, 1–18. [Google Scholar] [CrossRef]
  89. Simmonds, D.H. Wheat and Wheat Quality in Australia; CSIRO Publishing: Clayton, Australia, 1989. [Google Scholar]
  90. Mason, M.G. Nitrogen. In Soil Guide: A Handbook for Understanding and Managing Agricultural Soils; Moore, G., Ed.; Department of Agriculture and Food Western Australia: Kensington, Australia, 1998; Volume 4343, pp. 164–167. [Google Scholar]
  91. Girondé, A.; Poret, M.; Etienne, P.; Trouverie, J.; Bouchereau, A.; Le Cahérec, F.; Leport, L.; Orsel, M.; Niogret, M.-F.; Deleu, C.; et al. A profiling approach of the natural variability of foliar n remobilization at the rosette stage gives clues to understand the limiting processes involved in the low n use efficiency of winter oilseed rape. J. Exp. Bot. 2015, 66, 2461–2473. [Google Scholar] [CrossRef] [PubMed]
  92. Sorin, C.; Leport, L.; Cambert, M.; Bouchereau, A.; Mariette, F.; Musse, M. Nitrogen deficiency impacts on leaf cell and tissue structure with consequences for senescence associated processes in Brassica napus. Bot. Stud. 2016, 57, 11. [Google Scholar] [CrossRef] [PubMed]
  93. Presterl, T.; Seitz, G.; Landbeck, M.; Thiemt, E.M.; Schmidt, W.; Geiger, H.H. Improving nitrogen-use efficiency in european maize: Estimation of quantitative genetic parameters. Crop Sci. 2003, 43, 1259. [Google Scholar] [CrossRef]
Figure 1. Smoothed projected shoot area (PSA) (A) and smoothed absolute growth rate (AGR) (B). 6 wheat genotypes were grown in low (red), medium (green) and high (blue) nitrogen supply. Each line represents the average of 6 replicates. Numbers with % show the reduce rates from high to medium and from medium to low. Black arrows in Figure B indicate the maximum absolute growth rate. The unit of projected shoot area is kilo pixels, and the unit of absolute growth rate is kilo pixels per day.
Agronomy 09 00706 g001
Figure 2. Red, green, blue (RGB) camera images from side views showing phenotypic changes of the 6 wheat genotypes in response to high, medium and low N treatments 61 days after sowing. Samples are selected from low and high nitrogen treatments.
Agronomy 09 00706 g002
Figure 3. Predictions from full interaction model of the time of maximum absolute growth rate (t-maxAGR) of 6 wheat genotypes grown in low (red), medium (green) and high (blue) nitrogen supply. The unit of t-maxAGR is day after sowing (DAS). Each columns represents 6 replicate plants. The error bars are half of the least significant differences (p = 0.05) so that non-overlapping bars indicate significant differences.
Agronomy 09 00706 g003
Figure 4. Grain (A, B and C) and non-grain (D, E and F) nitrogen concentration (N%), and the dry weight of above-ground biomass (G, H and I) measured at maturity in 6 wheat genotypes grown in low (red), medium (green) and high (blue) nitrogen supply. Columns represent the average of 6 replicates and the error bars are the sample standard errors. Each column represents 6 replicate plants. Different letters indicate significant differences between genotypes according to the Tukey’s test (p < 0.05).
Agronomy 09 00706 g004
Figure 5. Relationships between above-ground biomass weight and grain weight (A), grain weight and the percentage of nitrogen in grains (B), and above-ground biomass weight and the percentage of nitrogen in grains (C) in low (red), medium (green) and high (blue) nitrogen supply. Each shape represents a single plant. Plants were the 6 wheat genotypes used in this study.
Agronomy 09 00706 g005
Figure 6. Relationships between the day of maximum absolute growth rate (t-maxAGR) and projected shoot area (PSA) in high (A), medium (B) and low (C) grain N concentration genotypes. The unit of t-maxAGR is day after sowing (DAS). Different colours indicate the nitrogen treatments. Each shape represents a single plant.
Agronomy 09 00706 g006
Figure 7. Relationships between the day of maximum absolute growth rate (t-maxAGR) and grain nitrogen concentration per plant in Spitfire (A) and Mace (B). Different colours indicate the nitrogen treatments. The unit of t-maxAGR is days after sowing (DAS). Each shape represents a single plant.
Agronomy 09 00706 g007
Table 1. Table of grain protein content (GPC) from National Variety Trials (NVT) trials, grain and non-grain nitrogen concentration measured in this study, total reduction of maximum projected shoot area (max-PSA), maximum absolute growth rate (max-AGR) and the time of max-AGR (t-maxAGR) in 6 wheat genotypes. GPC is the average of all NVT trials across the Australian wheat belt between 2008 to 2018. Total reduction rate in max-PSA, max-AGR and t-maxAGR were calculated as: ((high N-lowN)/(high N)) × 100.
SpitfireMaceGregoryImpalaQAL2000Gazelle
Average of GPC from 11 years of NVT data13.411.31211.610.910.9
Average of grain N% in all N treatments1.71.71.61.51.31.4
Average of non-grain N% in all N treatments0.30.40.30.20.20.2
% total reduction of max-PSA from high to low N464334393033
% total reduction of tmax from high to low N44352532198
% total reduction of max-AGR from high to low N433333313232

