Article

Theoretical and Experimental Analysis of Nutrient Variations in Electrical Conductivity-Based Closed-Loop Soilless Culture Systems by Nutrient Replenishment Method

Department of Plant Science and Research Institute of Agriculture and Life Sciences, Seoul National University, Seoul 08826, Korea
*
Author to whom correspondence should be addressed.
Agronomy 2019, 9(10), 649; https://doi.org/10.3390/agronomy9100649
Submission received: 11 September 2019 / Revised: 15 October 2019 / Accepted: 16 October 2019 / Published: 17 October 2019
(This article belongs to the Special Issue Soilless Culture, Growing Media and Horticultural Plants)

Abstract

:
In closed-loop soilless culture systems, variation in nutrients can lead to instability in the nutrient management and forced discharge of nutrients and water. Total nutrients absorbed by plants are replenished in an electrical conductivity-based closed-loop system, and fluctuation in electrical conductivity within a certain range around the initial value can be expected. However, this is not always observed in systems using conventional nutrient-replenishment methods. The objectives of this study were to analyze nutrient variation in a closed-loop soilless culture system based on a theoretical model and derive an alternative nutrient-replenishment method. The performance of the derived alternative method was compared with a conventional nutrient-replenishment method through simulation analysis. A demonstration experiment using sweet peppers was then conducted to confirm whether the theoretical analysis results can be reproduced through actual cultivation. The average amounts of injected nutrients during the experimental period of four months in the conventional and alternative methods were 2257 and 1054 g, respectively. There was no significant difference in the yield of sweet peppers between the two methods. The substrate electrical conductivity in the alternative method was maintained at 2.7 dS⋅m−1 ± 0.5 within the target electrical conductivity value, while that in the conventional method gradually increased to 5.0 dS⋅m−1 ± 1.2. In a simulation study, results similar to the demonstration experiment were predicted. Total nutrient concentrations in the alternative method showed fluctuations around the target value but did not continuously deviate from the target value, while those in the conventional method showed a tendency to increase. As a whole, these characteristics of the alternative method can help in minimizing nutrients and water emissions from the cultivation system.

1. Introduction

Closed-loop nutrient-management techniques are essential for sustainable soilless cultures with resource savings [1]. Nutrients in soilless culture systems are managed primarily with an open-loop nutrient supply [2,3]. Open-loop soilless culture systems are easier to implement, but resource losses are inevitable. Moreover, due to the intensive use of fertilizers, the threat posed to aquatic environments by repeated discharging a certain ratio of drainage is serious enough to warrant regulation by national governments [3,4,5,6]. Since a closed-loop soilless culture system reuses its drainage, the resulting variation in nutrient concentration can significantly affect the plant growth as the reuse period becomes longer [5,7,8,9]. It is therefore difficult to intuitively explain or interpret nutrient-variation management techniques, unlike open-loop systems. In order to appropriately apply those techniques, theoretical models are required and the problems should be precisely defined [10].
In both closed-loop and open-loop soilless culture systems, the electrical conductivity (EC) of the nutrient solution in the mixing tank is adjusted to a target value before the solution is applied to the plant [9,11,12]. However, unlike an open-loop system, the mixing ratio of tap water to stock solution in a closed-loop system is adjusted by considering the change in nutrient concentration due to the inflow of drainage [12]. Alternatively, in simple systems, a premixed standard nutrient solution of a certain EC is supplied based on the difference between initial and current water levels in the circulation tank, which simultaneously performs drainage collection and nutrient-solution feeding [13,14]. In an EC-based closed-loop soilless culture system, supply of stock solution or standard nutrient solution and tap water is intended to replenish nutrients and water consumed in the system [12]. For a single system in which the plants are grown directly in a nutrient solution container, the nutrients and water consumed due to absorption of plants in the system can be estimated almost exactly [15]. However, errors may occur in systems in which the root zone and nutrient supply are separate from drainage collection. Both elements are widely used in commercial farming conditions.
Considering the functional objective of nutrient and water replenishment in a closed-loop soilless culture system, relatively stable fluctuations within a certain range around the initial EC value should be observed. However, EC changes far exceeding the initial values in the system have generally been observed [13,14,16]. In addition, the effects of these fluctuations are linked to forced discharge of recirculated nutrient solution outside of the system [13,14]. The problems associated with variations in nutrient concentration or EC observed in soilless culture systems are presumed to be inevitable due to the nutrient uptake concentration affected by the environment [5,14]. The experimental results are interpreted depending on the responses of the system according to the treatment application [9,14,16,17,18], and these have proven difficult to interpret in an integrated way. As a result, technical approaches to managing nutrient variation and the design of experiments are limited. To block nutrient emissions from a soilless culture system, nutrient reuse practices must be standardized, which requires a precise problem definition based on variations of nutrient concentrations or EC.
The objectives of this study were to analyze the cause of EC variation in closed-loop soilless culture systems based on a theoretical model, to derive an alternative nutrient-replenishment method for managing nutrient fluctuation, and to evaluate the performance through theoretical and experimental analyses.

2. Materials and Methods

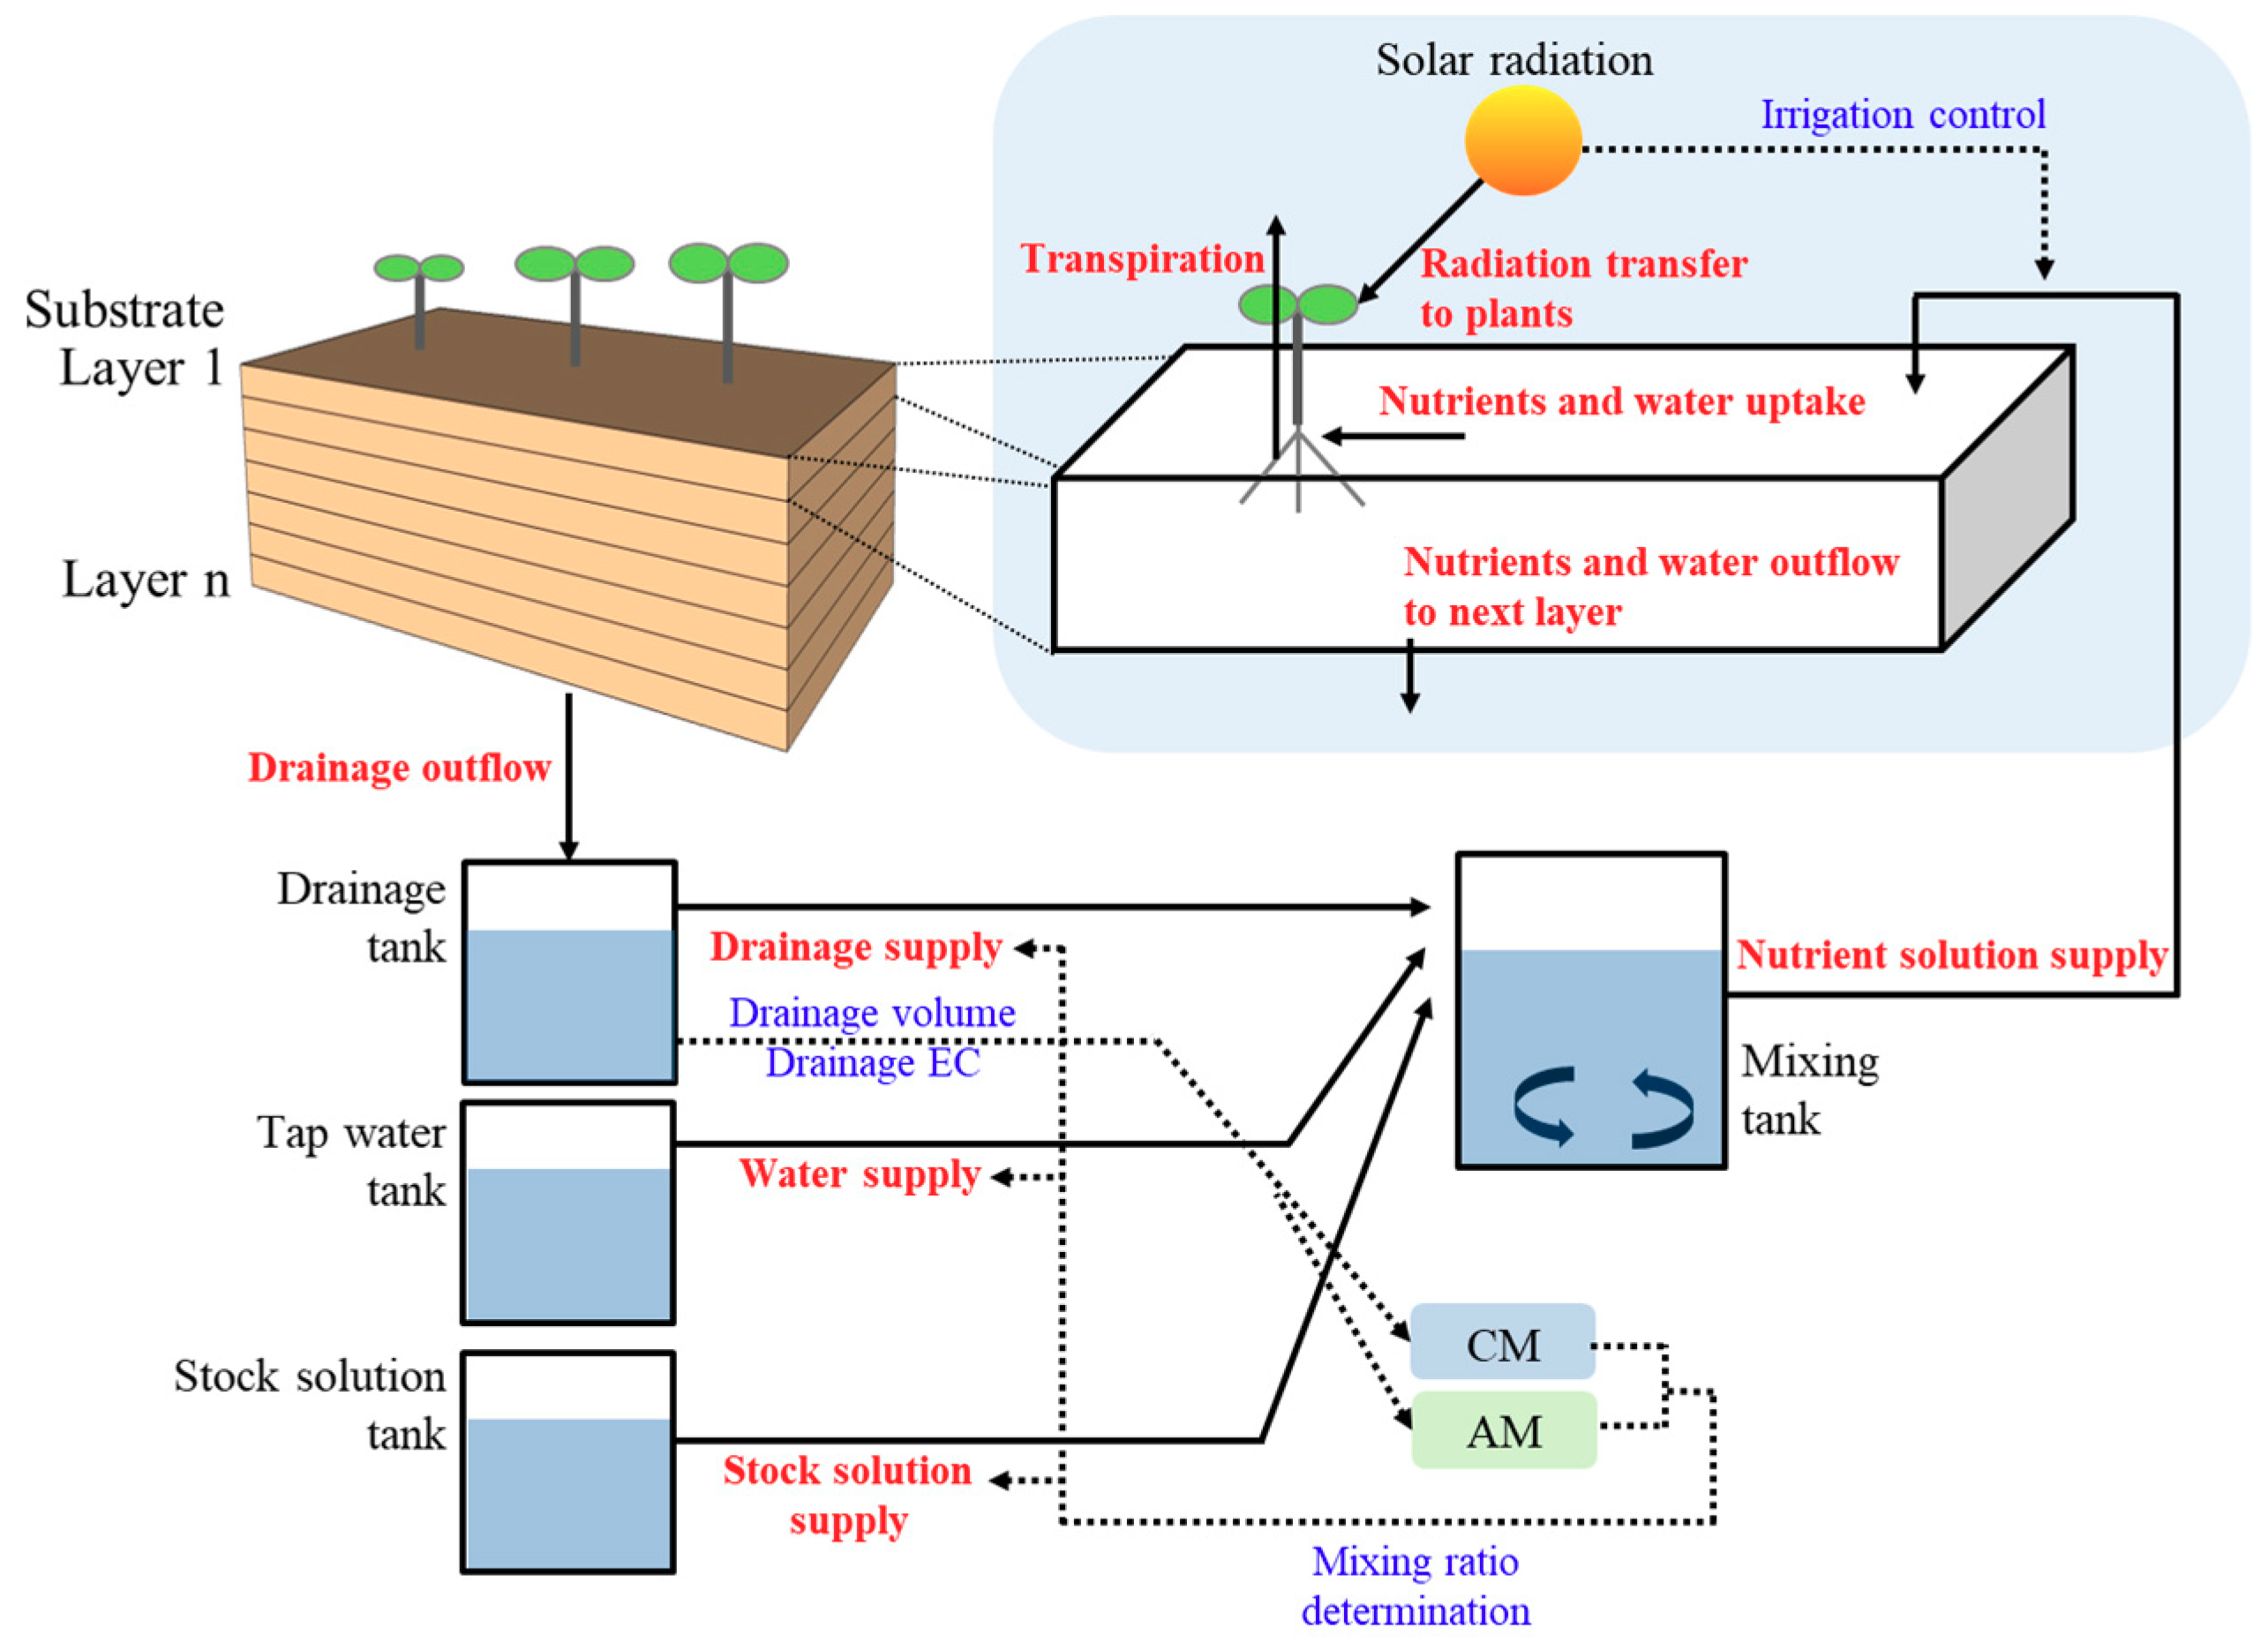
2.1. Soilless Culture System Model

The model used in this study simulated nutrient changes in a soilless culture system with an automated nutrient-mixing system (Figure 1). The basic structures of the soilless culture system and plant growth models were constructed by referring to the nutrient transport model in a substrate condition [6,19,20,21]. The measured data of incident radiation intensity in the greenhouse from 10 September 2011 to 9 March 2012 were used as an input variable of transpiration and irrigation control in the simulation. Some units of parameters and variables were converted from the references for simulating the minute-based time scale of the automated soilless culture system. Values and description of the parameters used in the simulation were summarized in Table 1.

2.2. Water and Nutrient Transport in a Substrate

According to standard practices for automated irrigation of a soilless culture system, the mixing process for a nutrient solution is initiated in the mixing tank, and the nutrient solution is supplied to the substrate after mixing. The target nutrients for the simulation were selected as macronutrient cations (K+, Ca2+, and Mg2+).
d V n d t = Q n 1 Q n T n
The volume of water in a substrate layer ( V n , L) was calculated depending on the flow rate of the water from the former ( Q n 1 , L min−1) and to the next layer ( Q n , L min−1) and the evapotranspiration rate ( T n , L min−1). The flow rate of the water to the first substrate layer ( V 1 ) was the irrigation flow rate ( Q 0 ). Q n is the difference between the flow rate of the water from the former layer and the evapotranspiration rate ( Q n 1 T n ) or the difference between the irrigation rate and the evapotranspiration rate in the first substrate layer ( Q 0 T 1 ) [23]. The field capacity ( F , dimensionless) and difficult available water ( W D A W , dimensionless), respectively restrict Q n and T n . The flow for Q n occurs only when V n > S s u b , n F , and T n flows only when V n > S s u b , n W D A W . S s u b , n (L) is volume of the substrate layer n .
The flow of nutrients in the medium is generated by the flow rate of water.
V n d C n I d t = Q n 1 C n 1 I Q n C n I P R S A J n I
C is the molar concentration of nutrient (mM), superscript I is the type of ions (K+, Ca2+, Mg2+), J n I is the uptake rate of nutrients (mmol m−2 min−1), and P R S A is the specific root surface area (m2), which is described as the root length density and specific root surface area.

2.3. Plant Variables and Growth Parameters

In this simulation, evapotranspiration and nutrient uptake rates were applied as plant variables in the substrate. In general, the plant parameters relate to changes in evapotranspiration and nutrient uptake rates with plant growth. The relationship between solar radiation and evapotranspiration is adjusted by the leaf area index [24]. The parameters related to the nutrient uptake rate are derived from the characteristics of the plant ion transporters and are modeled as increasing with growth of the root surface area [25].

2.3.1. Leaf Area Index

The Boltzmann sigmoid equation was used to apply changes in the leaf area index to the evapotranspiration rate:
P L A I , t = a L A I [ 1 + e x 0 t b L A I ]
where a L A I , b L A I , and x 0 are constants, and t is time.

2.3.2. Evapotranspiration

The evapotranspiration rate was modeled using the simplified Penman-Monteith equation by Baille et al. (1994) [24].
T n = a T [ 1 e k L A I P L A I ] R λ + b T
T n (L min−1, numbers were converted from kg min−1) was calculated depending on the radiation for a minute ( R , MJ m−2 min−1), the latent heat of vaporization ( λ , MJ kg−1), the light extinction coefficient ( k L A I ), and the leaf area index ( P L A I ). a T (dimensionless) and b T (kg m−2 min−1) are regression parameters.

2.3.3. Root Length Density and Specific Root Surface Area

Root length density was used to calculate the specific root surface area and modeled using a logistic function of time [20,26]:
P l e n , t = R L D m a x 1 + K 1 e k 1 t
P R S A , t = 2 π r 0 P l e n , t
where R L D m a x (m m−3) is the maximal root length density, and K 1 and k 1 are coefficients. r 0 is the mean root radius (m). Root length density was set to start at the top layer of the substrate and be sequentially assigned to the subsequent layer as the value increased. The allocation of root length density for each layer was calculated by dividing R L D m a x by the total number of layers.

2.3.4. Nutrient Uptake

The nutrient uptake rate of the plant in the substrate was simulated as a function of Michaelis–Menten:
J n I = J m a x I ( C n I C m i n I ) K m I + ( C n I C m i n I )
where J m a x I (mmol m−2 min−1) is the maximum absorption rate of nutrient I , K m I (mM) is the Michaelis-Menten constant, and C m i n I (mM) is the minimal concentration at which J n I = 0.

2.4. Mixing of Nutrient Solutions

The conventional mixing process for stock solution, tap water, and drainage under the automated closed-loop soilless culture system is performed in the mixing tank [11,12]. When the system receives an irrigation command, the entire volume of collected drainage is diluted with tap water within the range of the irrigation volume, and the stock solution is added to the target EC.
However, because drainage is included in the automated mixing process in closed-loop soilless culture systems, the Equation needs to solve for target EC with mixing stock solution, drainage, and water [12]. The nutrient solution mixing process occurs intermittently according to the irrigation interval, and the basic Equation for conventional nutrient replenishment can be summarized based on the dilution Equation:
V T C T = V D C D + V W C W + V S C S
V w = V T V D V S
V S = C T V T C w V T + C W V D C D V D C S C W
where V T (L) is the target irrigation volume per event, C T (mEq L−1) is the target total equivalent concentration, V D is the drainage volume, C D (mEq L−1) is the total equivalent concentration in drainage, V W (L) is the amount of tap water input to the mixing tank, V S (L) is the amount of stock solution input to the mixing tank, C w (mEq L−1) is the total equivalent concentration in tap water, and C S (mEq L−1) is the total equivalent concentration of the stock solution. Equation (8) can be summarized as Equation (10) by substituting Equation (9) for V W . Equation (10) is calculating the amount stock solution input based on the total equivalent concentration. In this simulation, we assumed the total equivalent concentration as EC based on the linear relationship between EC and the total equivalent concentration of nutrient solution presented by Savvas and Manos (1999) [27].
The amount of stock solution input to the mixing tank was calculated through this process, and when the irrigation control command was generated during the simulation, the mixing process began based on the volume of drainage stored in the drainage tank at that moment. If the calculated value of the Equation (10) was less than zero, dilution using tap water could not be adjusted to the target concentration within the range of irrigation amount. In this case, the amount of tap water required for diluting the drainage to target total equivalent concentration ( C T ) was calculated, and then the ratio between the drainage and calculated tap water was multiplied by V T . When the doses of V D , V W , and V S were determined through the abovementioned calculation, a flow rate was generated until the corresponding amount was transferred to V M according to Q d r g , Q w t r , and Q s t k , respectively. In the simulation, irrigation was controlled by a radiation integral method, which is conventionally used in automated irrigation control [28]. 140 mL of nutrient solution per plant in the mixing tank were supplied whenever the accumulated radiation reached 100 J m−2.

2.5. Experimental Analysis

2.5.1. Cultivation Conditions

Three sweet pepper (Capsicum annuum L. “Derby”) plants were grown in a rockwool slab, and seven slabs were used per row. Four cultivation lines were installed in a Venlo-type greenhouse at the experimental farm of Seoul National University (Suwon, Korea, Lat. 37.3° N, long. 127.0° E). Each line was an independent closed-loop soilless culture system with a mixing tank, drainage tank, and stock solutions. The stock solution was prepared based on the PBG nutrient solution of the Netherlands. In the greenhouse, daytime temperature was maintained at 25–35 °C and nighttime temperature at 17–22 °C. The solar radiation-based irrigation control was applied; when the cumulative radiation measured by a pyranometer (SP-110-L10, Apogee Instruments, Logan, Utah, USA) reached 100 J cm−2, 150 mL of the nutrient solution was supplied to each plant. However, the irrigation amounts were adjusted according to meteorological conditions to maintain a drainage ratio of approximately 30%. The composition of nutrient solution was 14.17 mM of NO3, 1.14 mM of H2PO, 5.92 mM of K+, 4.43 mM of Ca2+, 1.59 mM of Mg2+, and 1.6 mM of SO42– as macro-elements; and 0.019 mM of Fe2+, 0.01 mM of Zn2+, 0.002 mM of Cu2+, 0.01 mM of Mn2+, and 0.0005 mM of MoO42– as micro-elements. After an irrigation event, the drainage solution was returned to the drainage tank (11.7 L). The EC and pH of tap water were 0.17 dS⋅m−1 and 7.11, respectively, and contained 0.21 mM of Na+, 0.29 mM of Cl, 0.04 mM of K+, 0.36 mM of Ca2+, 0.11 mM of Mg2+, 0.10 mM of SO42−, 0.39 mM of NO3, and 0.0 mM of PO43–.

2.5.2. Measurement of Fruit Yield and Analyses of Nutrient Content in Leaves and Substrate

The total yield and average fruit weight during the experimental period were measured. The proportion of blossom-end rot (BER) fruits on a sweet pepper plant was measured. At the end of the experiment, 18 leaves (including petiole) from the middle to the top nodes of a sweet pepper were randomly collected from each treatment. Leaves were washed in tap water and dried for 48 h at 70 °C in an oven. The dried leaves were ground, and 0.5 g of each ground sample was digested using concentrated nitric acid. Next, 1 mL of concentrated perchloric acid was added to maintain a set solution temperature of 180 °C, and the digestion process was accelerated on a hot plate at 90 °C for approximately one h, until a clear-colored solution was obtained. After digestion, the tube was cooled, filled with 25 mL deionized water, and the total contents of K+, Ca2+, and Mg2+ in the leaves were determined with an inductively coupled plasma-optical emission spectrometer (ICP-730ES, Varian, Mulgrave, Australia). To determine the nutrient concentrations in the rockwool substrate, samples of nutrient solution in the rockwool slabs were extracted using a syringe. The collection points of the nutrient solution in the rockwool slab were randomly selected to ensure representative samples of the overall concentration in the rockwool slabs. Five 10 mL samples of a rockwool slab nutrient solution were collected for each extraction, for a final volume of 50 mL sample. Four 50 mL samples per treatment were collected every week. SAS (version 9.2, SAS Institute, Cary, NC, USA) was used for statistical analysis.

2.5.3. Nutrient-Replenishment Method

A conventional nutrient-replenishment method (CM) and an alternative nutrient-replenishment method (AM) derived from the theoretical analysis in this study were performed in the mixing tank with two applied nutrient solution mixing modules. In the CM, as explained in Section 2.4, when the system received an irrigation command, the entire drainage volume was diluted with tap water within the range of irrigation volume, and the stock solution was added to match the fixed target EC [12]. In the case when the calculated volume of the diluted drainage exceeds the irrigation volume, the injection ratio of drainage and water was multiplied by the irrigation volume, and the converted drainage and water volumes were injected into the mixing tank without injection of the stock solution. In the AM, the additional volume of the stock solution was determined by the equation derived from the simulation study at every irrigation event (Equation (14)).

2.5.4. Nutrient Solution Mixing Module and Data Collection

The ECs of the nutrient solutions in the mixing tank and drainage tank were measured by EC sensors (SCF-01A, DIK, Chuncheon, Korea). Light intensity in the greenhouse was measured with a pyranometer (SP-110, Apogee, Logan, UT, USA) and used for input data for solar radiation-based irrigation control. Data were measured every 10 s from 15 October to 31 December 2014. Mean values for every hour were used. A datalogger (CR1000, Campbell Scientific, Logan, UT, USA) was used to measure and control the drainage and nutrient mixing process. Water levels of the stock solution tanks and the drainage tanks were monitored by ultrasonic sensors (UHA-300, Unics, Daegu, Korea) and used to estimate the stored volume changes of stock and drainage solutions. ECs in the substrates were measured at intervals of two to five days using a multimeter (Multi 3420 SET C, WTW, Weilheim, Germany).

3. Results and Discussion

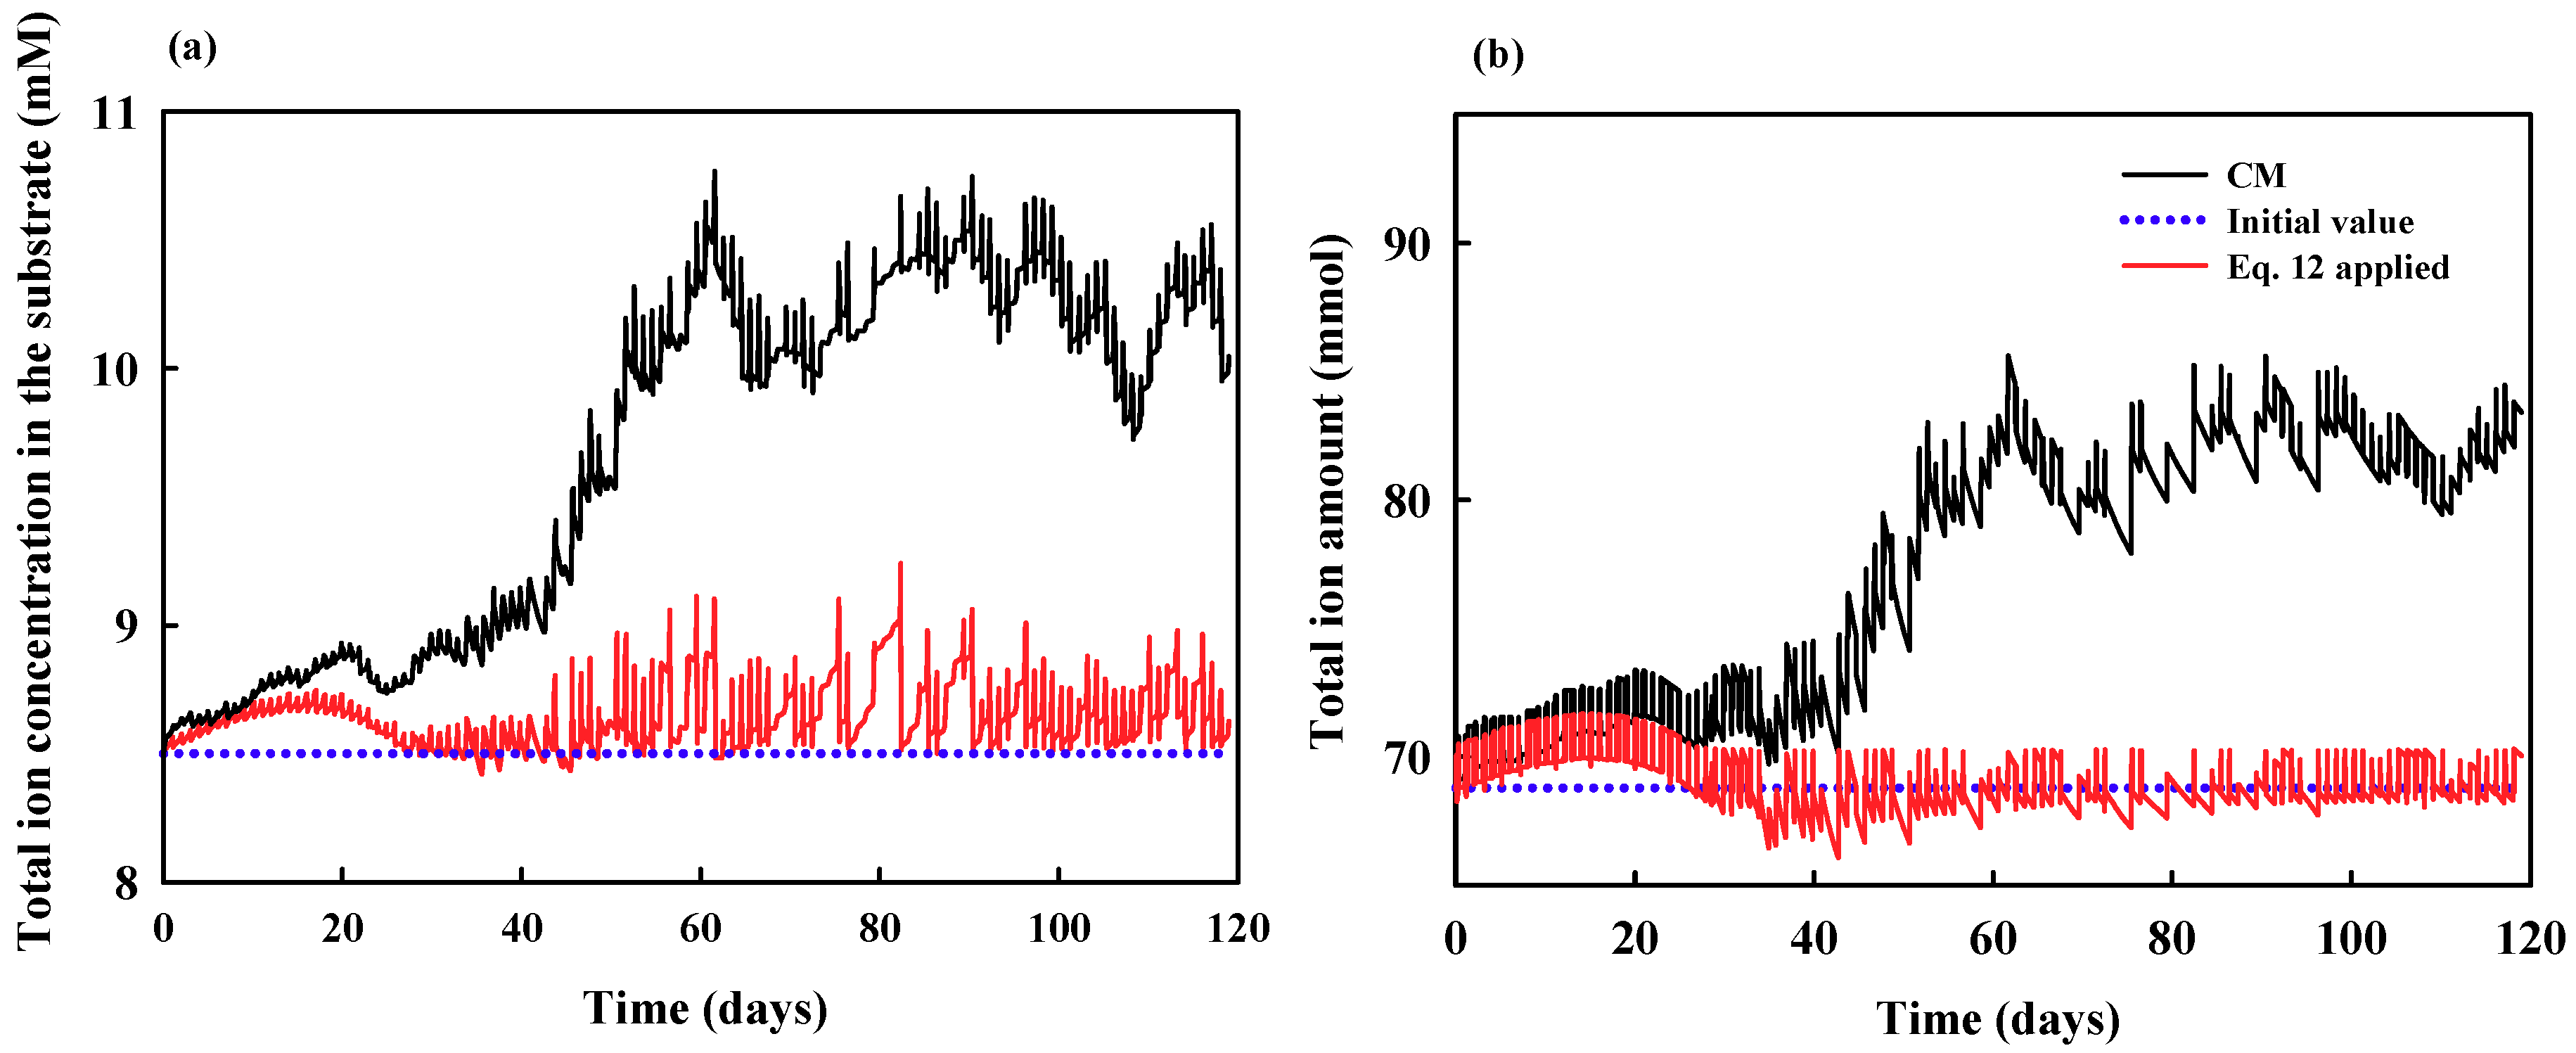
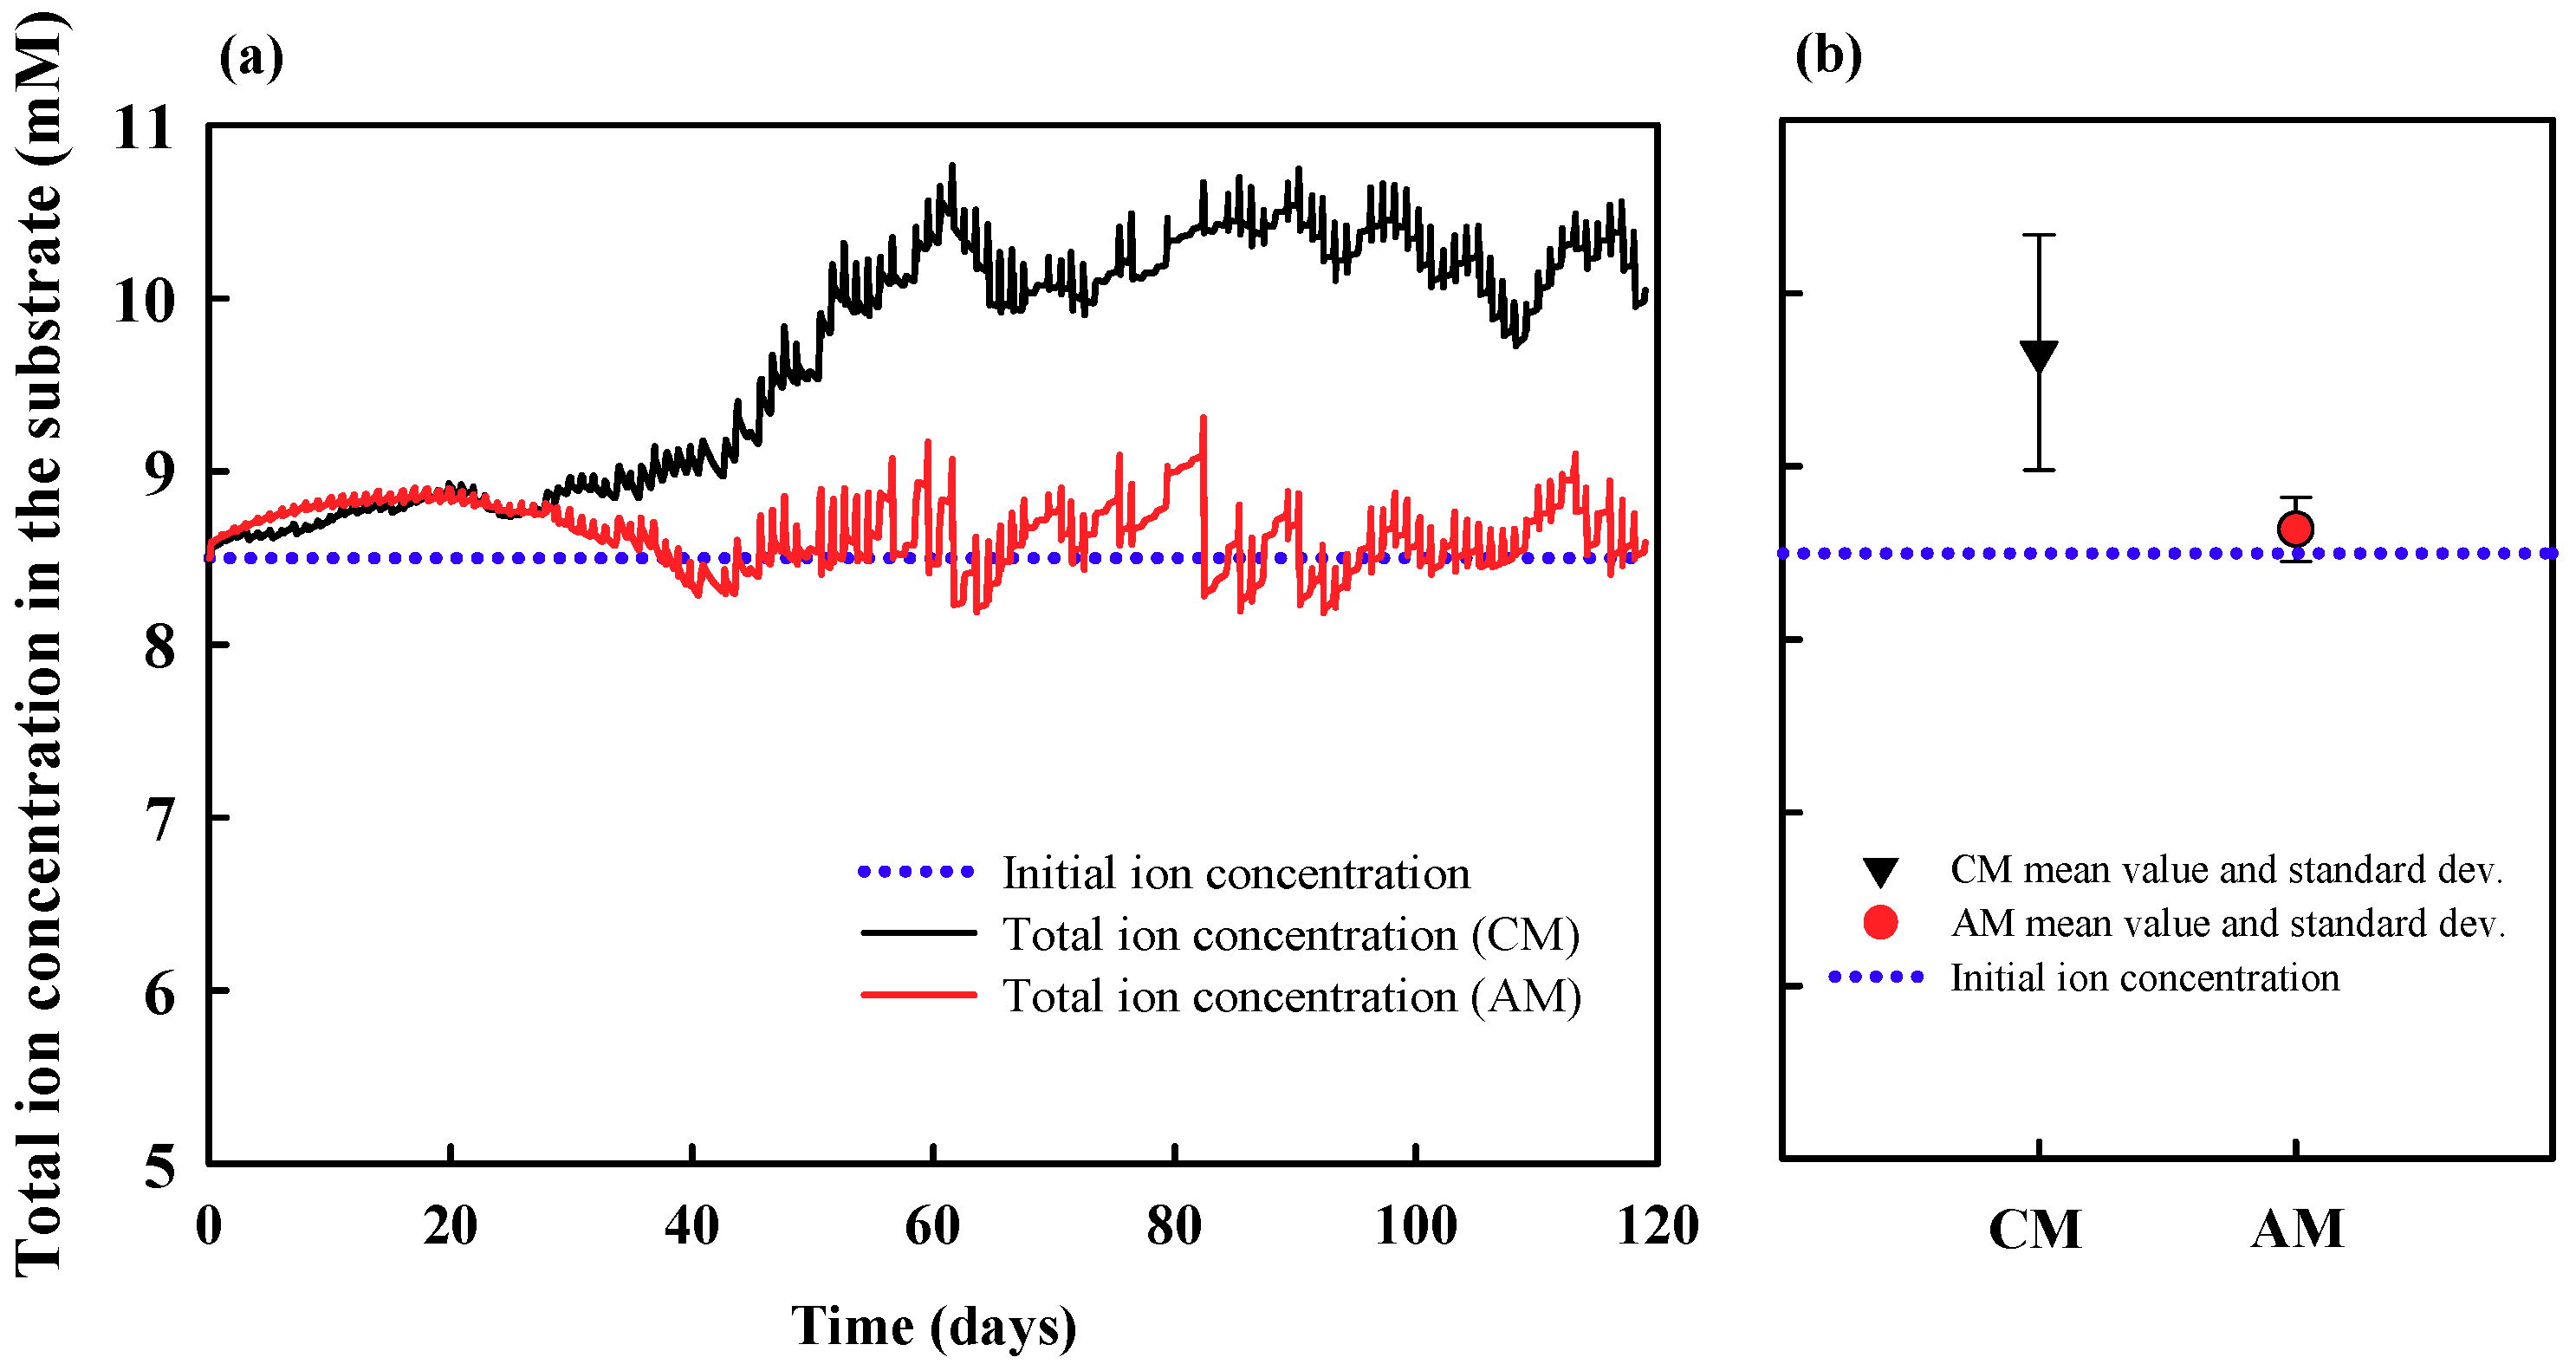
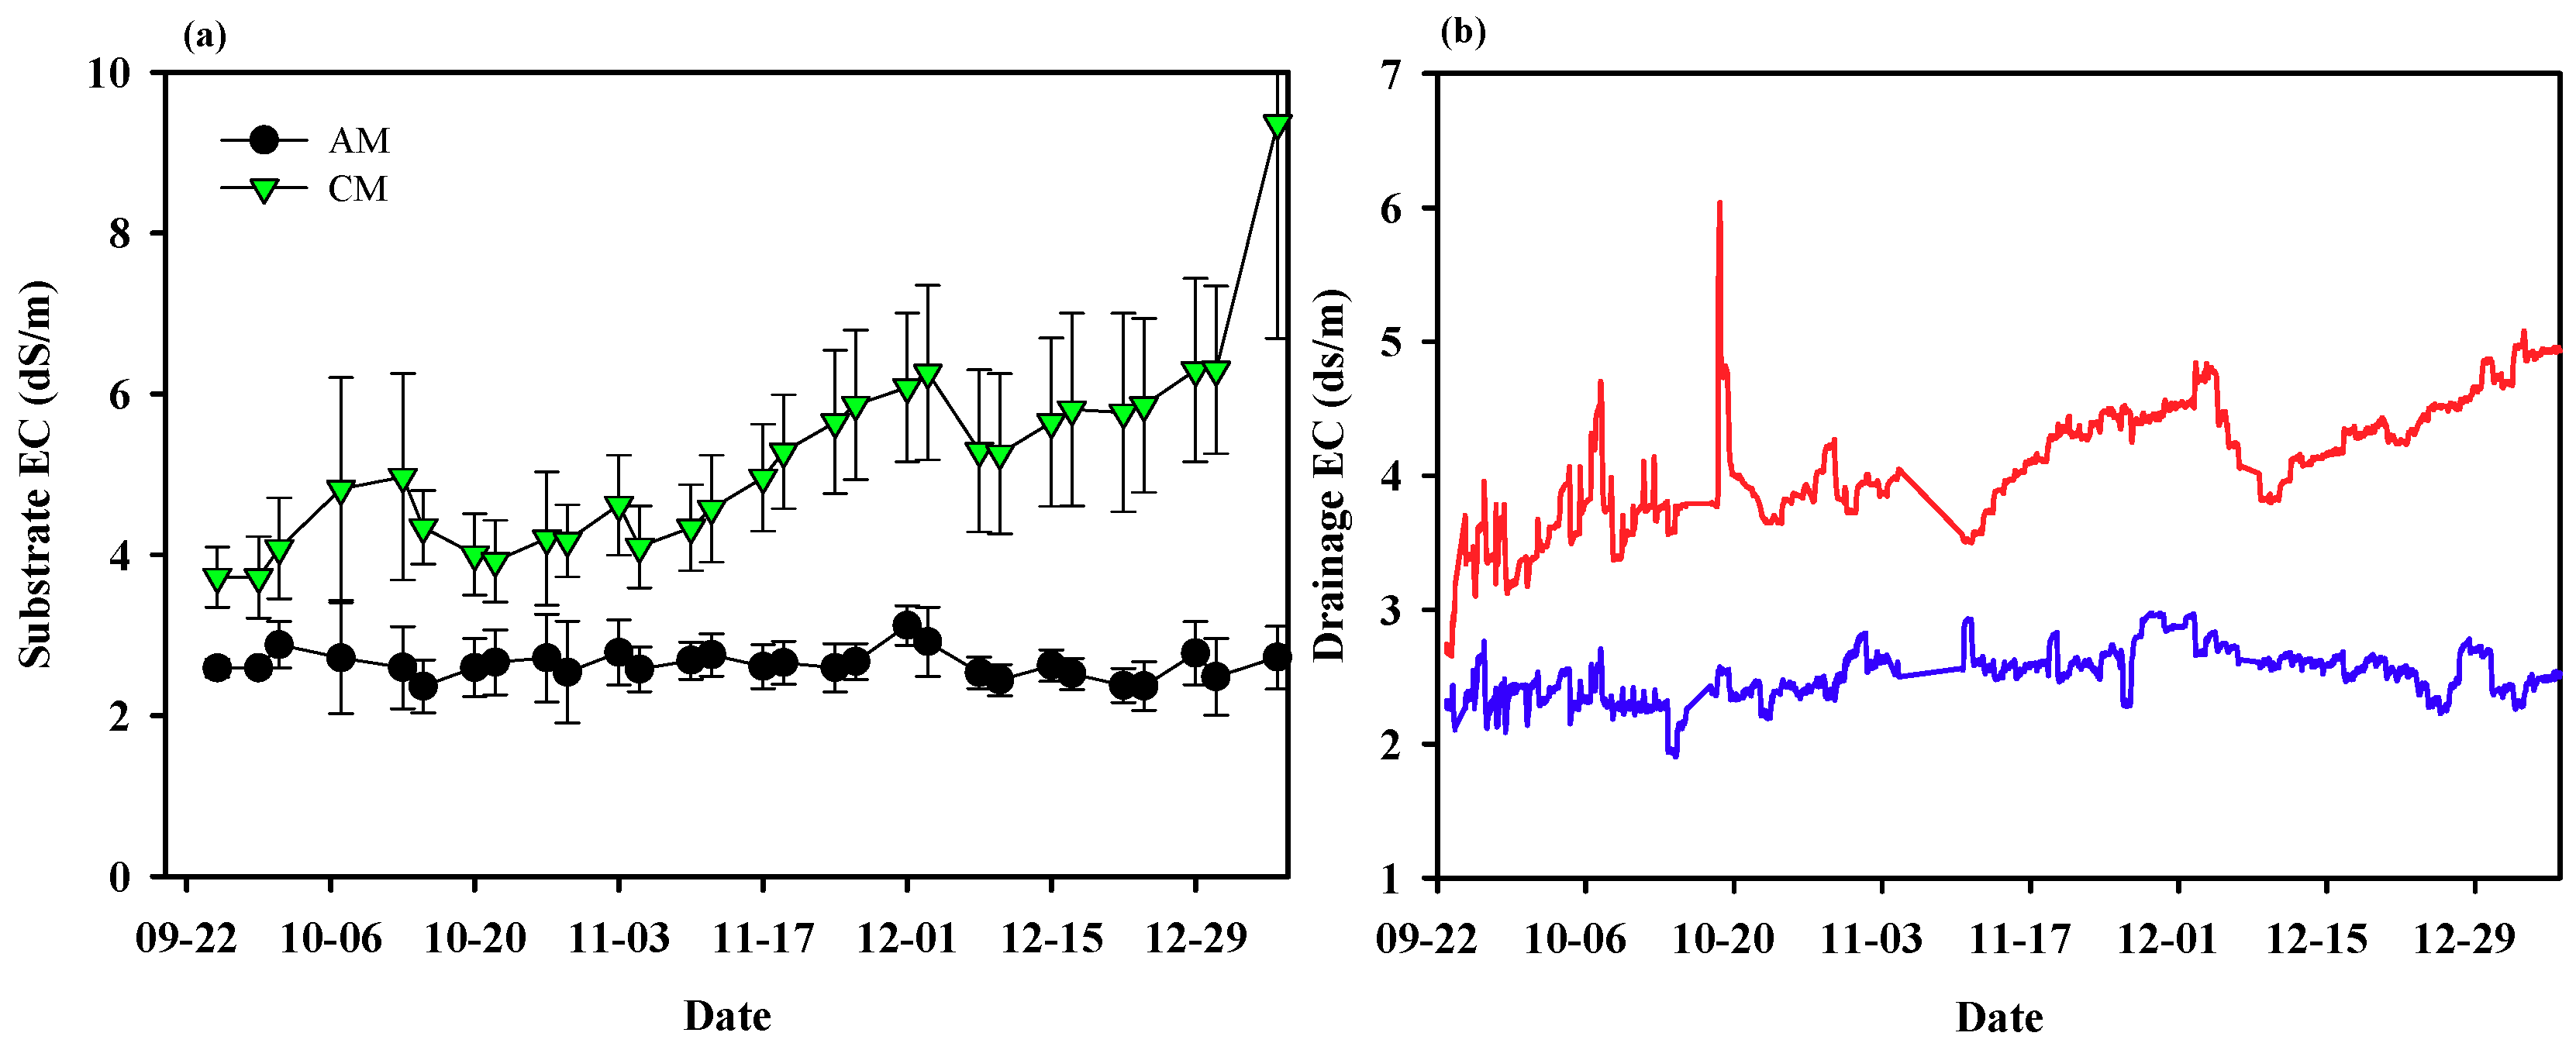
3.1. Theoretical Analysis: Reconsideration of Problem and Derivation of Possible Solution

The total concentration of nutrients in the system using CM for nutrient replenishment gradually increased with diurnal level fluctuations, and after approximately 60 days, the total concentration showed repeated fluctuations within a certain range (Figure 2a). The changes with an increasing tendency in total nutrient concentrations relative to initial values have been typically reported in most EC-based closed-loop, semi-closed-loop, and open-loop soilless culture systems [8,13,14,16,29]. Theoretically, the concentration of nutrient solutions in the substrates can be explained by the difference between the concentration of irrigated solution and the concentration of nutrient uptake when the boundary area is limited to a substrate [5]. This can simply explain the nutrient variations in open-loop soilless culture systems. In closed-loop soilless culture systems, on the other hand, the concentration of irrigated solution is also affected by the drained solution, but most of studies on nutrient variations in closed-loop systems have been carried out with a premise that nutrient variations are the result of the changing dynamics of uptake concentrations [5,14,16,30,31,32].
The total amount of nutrients in the system using CM also increased with time (Figure 2b). In a closed-loop system, the changes in the total amount of nutrients can be interpreted more straightforwardly. The increasing tendency in the total amount of nutrients indicates the accumulation of surplus nutrients supplies. However, most of the previous studies did not attempt to interpret the fluctuations from the perspective of total amount of nutrients. Thus, our theoretical analyses reconsider problems for the nutrient concentration changes in the closed-loop soilless culture system; the nutrient fluctuation with increasing tendency is mainly caused by the accumulated difference between nutrient uptake and replenishment.
In a simple cultivation system sharing root-zone and nutrient solutions in a single container, measurement of changes in nutrient concentration, and water volume in the container corresponds to the actual amount of consumed nutrients in the system [15]. On the other hand, a typical soilless culture system consists of subsystems, including mixing tank, drainage tank, and substrates [6,12]. However, in the conventional nutrient solution mixing method of closed-loop soilless culture, the amount of nutrients replenishment has been mainly determined as a function of EC and volume of irrigation water and drainage [12]. Thus, to remove the errors between the actual nutrient consumption by plants and nutrients supplies in the closed-loop soilless culture system, the determination of the replenishment amount should consider the system-wide nutrients and water. We summarized equations for the estimation of nutrient consumption in the typical soilless culture system as Equation (11) and for the determination of nutrient replenishment as Equation (12)
V i n i t C i n i t = V d r g C d r g + V s u b C S u b + V m i x C m i x + V U C U
V s t k = C i n i t V i n i t C d r g V d r g C m i x V m i x C s u b V s u b C s t k
where V i n i t is the initial volume of water in the system; V U is the amount of water absorbed by the plant; C i n i t is the initial total concentration of the system; C U is the average total nutrient uptake concentration; V d r g , V s u b , V m i x , and V s t k are the volumes of water stored in the drainage tank, substrate, mixing tank, and the input volume of stock solution, respectively; and C d r g , C s u b , C m i x , and C s t k are the total nutrient concentrations in the drainage tank, substrate, mixing tank, and the stock solution concentration, respectively.
In the calculation using Equation (12) for nutrient replenishment by stock solution, the total nutrient concentration showed repeated fluctuations near the initial concentration (Figure 2a). The amount of total nutrients in the system also stayed near the initial value without any apparent increasing or decreasing tendency (Figure 2b).
Precise measurements for the variables in Equation (12) in a real cultivation system have technical limitations. In particular, the amounts of total nutrients C s u b and V s u b in the substrate are difficult to estimate. In a soilless culture system, the field capacity ( F ) of a substrate corresponds to the parameters of the system, and the volume of water cannot exceed the volume of the substrate multiplied by the field capacity. The EC of the drainage ( C d r g ) can be indicative of a change in concentration of substrate. Considering this, we can modify Equation (12) as follows for an alternative nutrient-replenishment method (AM):
V s t k = C i n i t V i n i t C d r g V d r g C m i x V m i x C d r g F C s t k
When the EC of the drainage ( C d r g ) and the field capacity ( F ) are substituted for C s u b and V s u b , respectively, errors may occur. However, in this case, total ion concentration fluctuated around the initial concentration (Figure 3).
In the existing problem definition, the EC variation in the closed-loop soilless culture system was derived from the dynamic change in nutrient uptake concentration [14,16,30,31,32]; thus, there were restrictions on active control and interpretation. However, a series of analysis steps leading to Equation (13) makes it possible to convert EC control in the closed-loop soilless culture system to the problem of proper gain search through arbitrary adjustment of system parameters. That is, in Equation (13), all but C d r g can be viewed as parameters and the process of calculating the difference between C i n i t V i n i t and the product of the parameters and C d r g is performed in every mixing process.

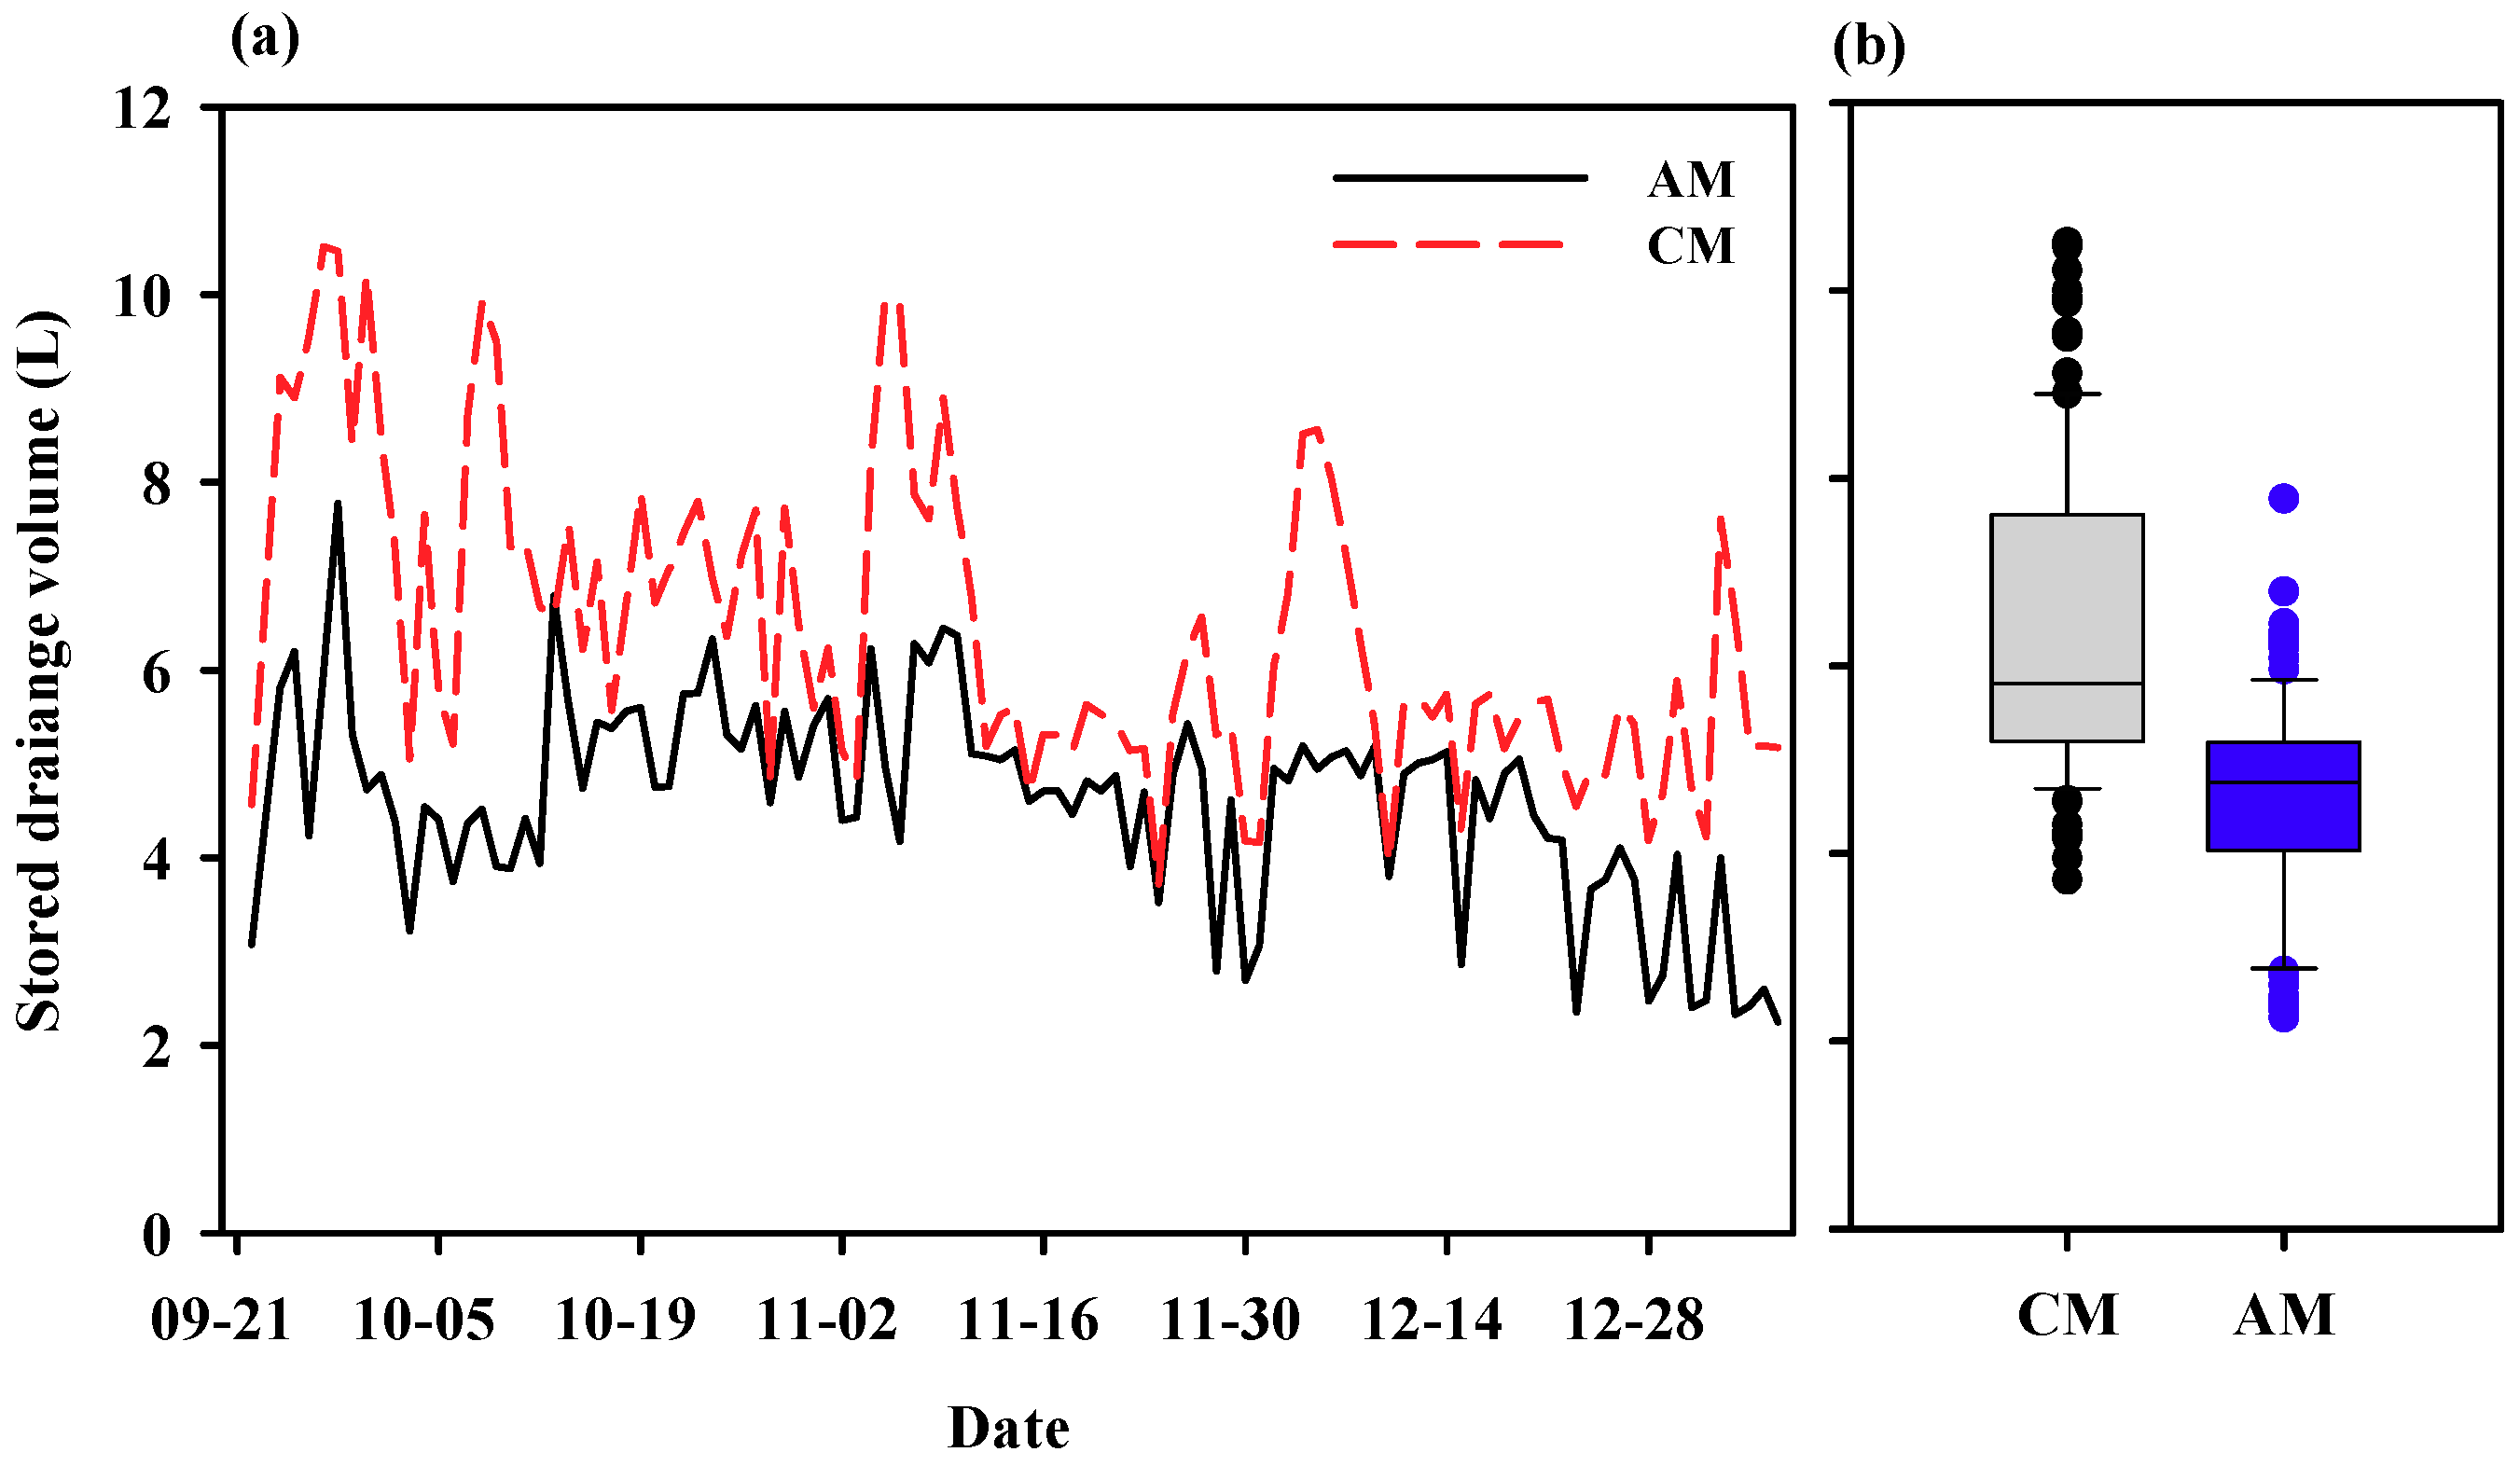
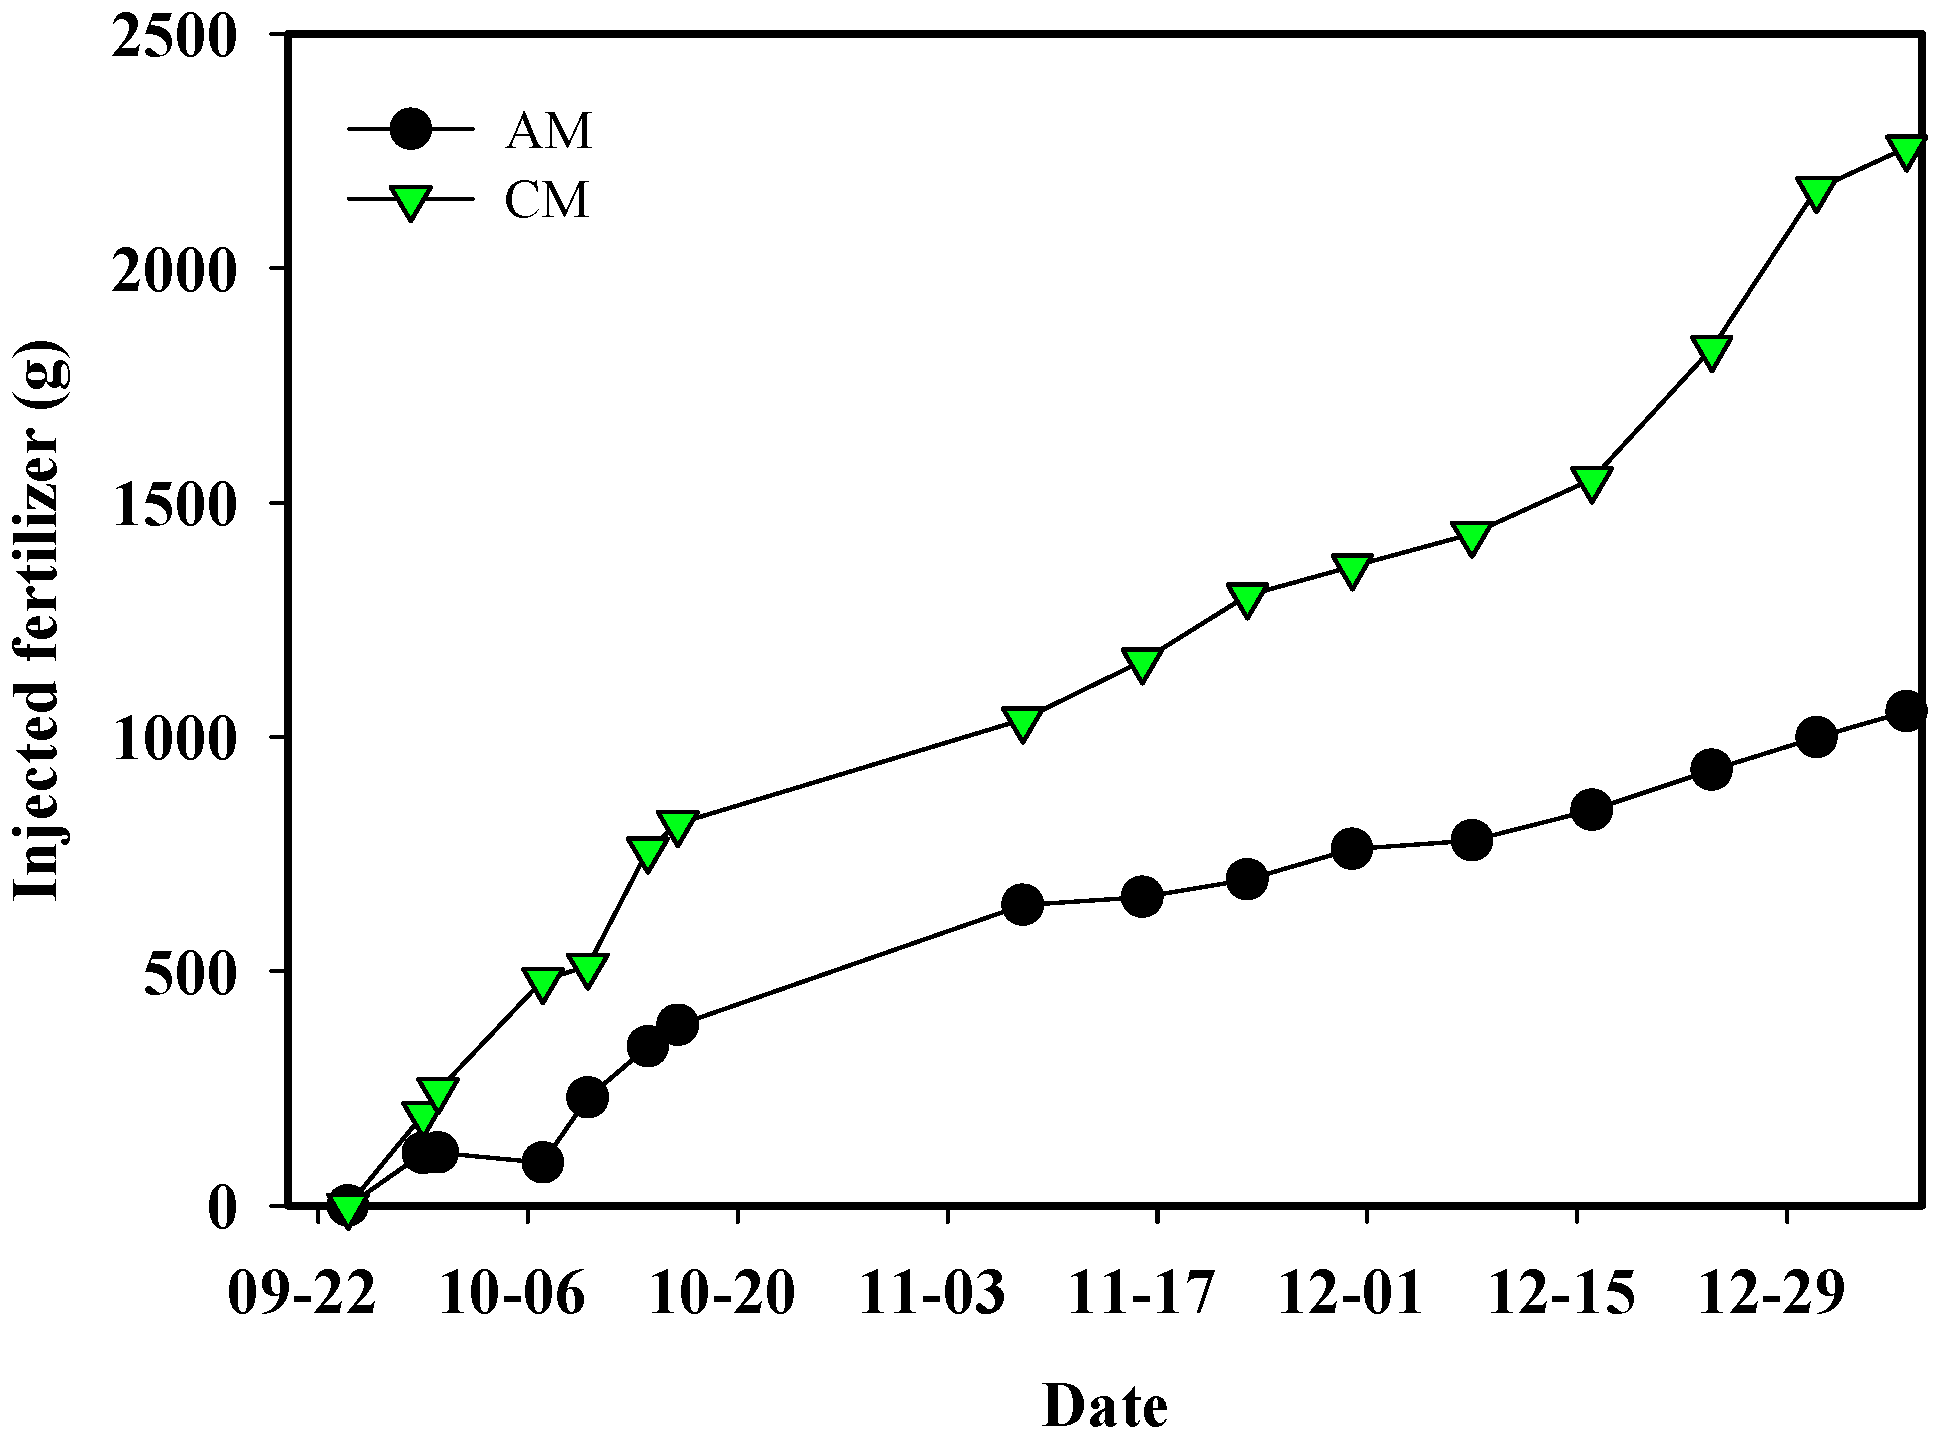
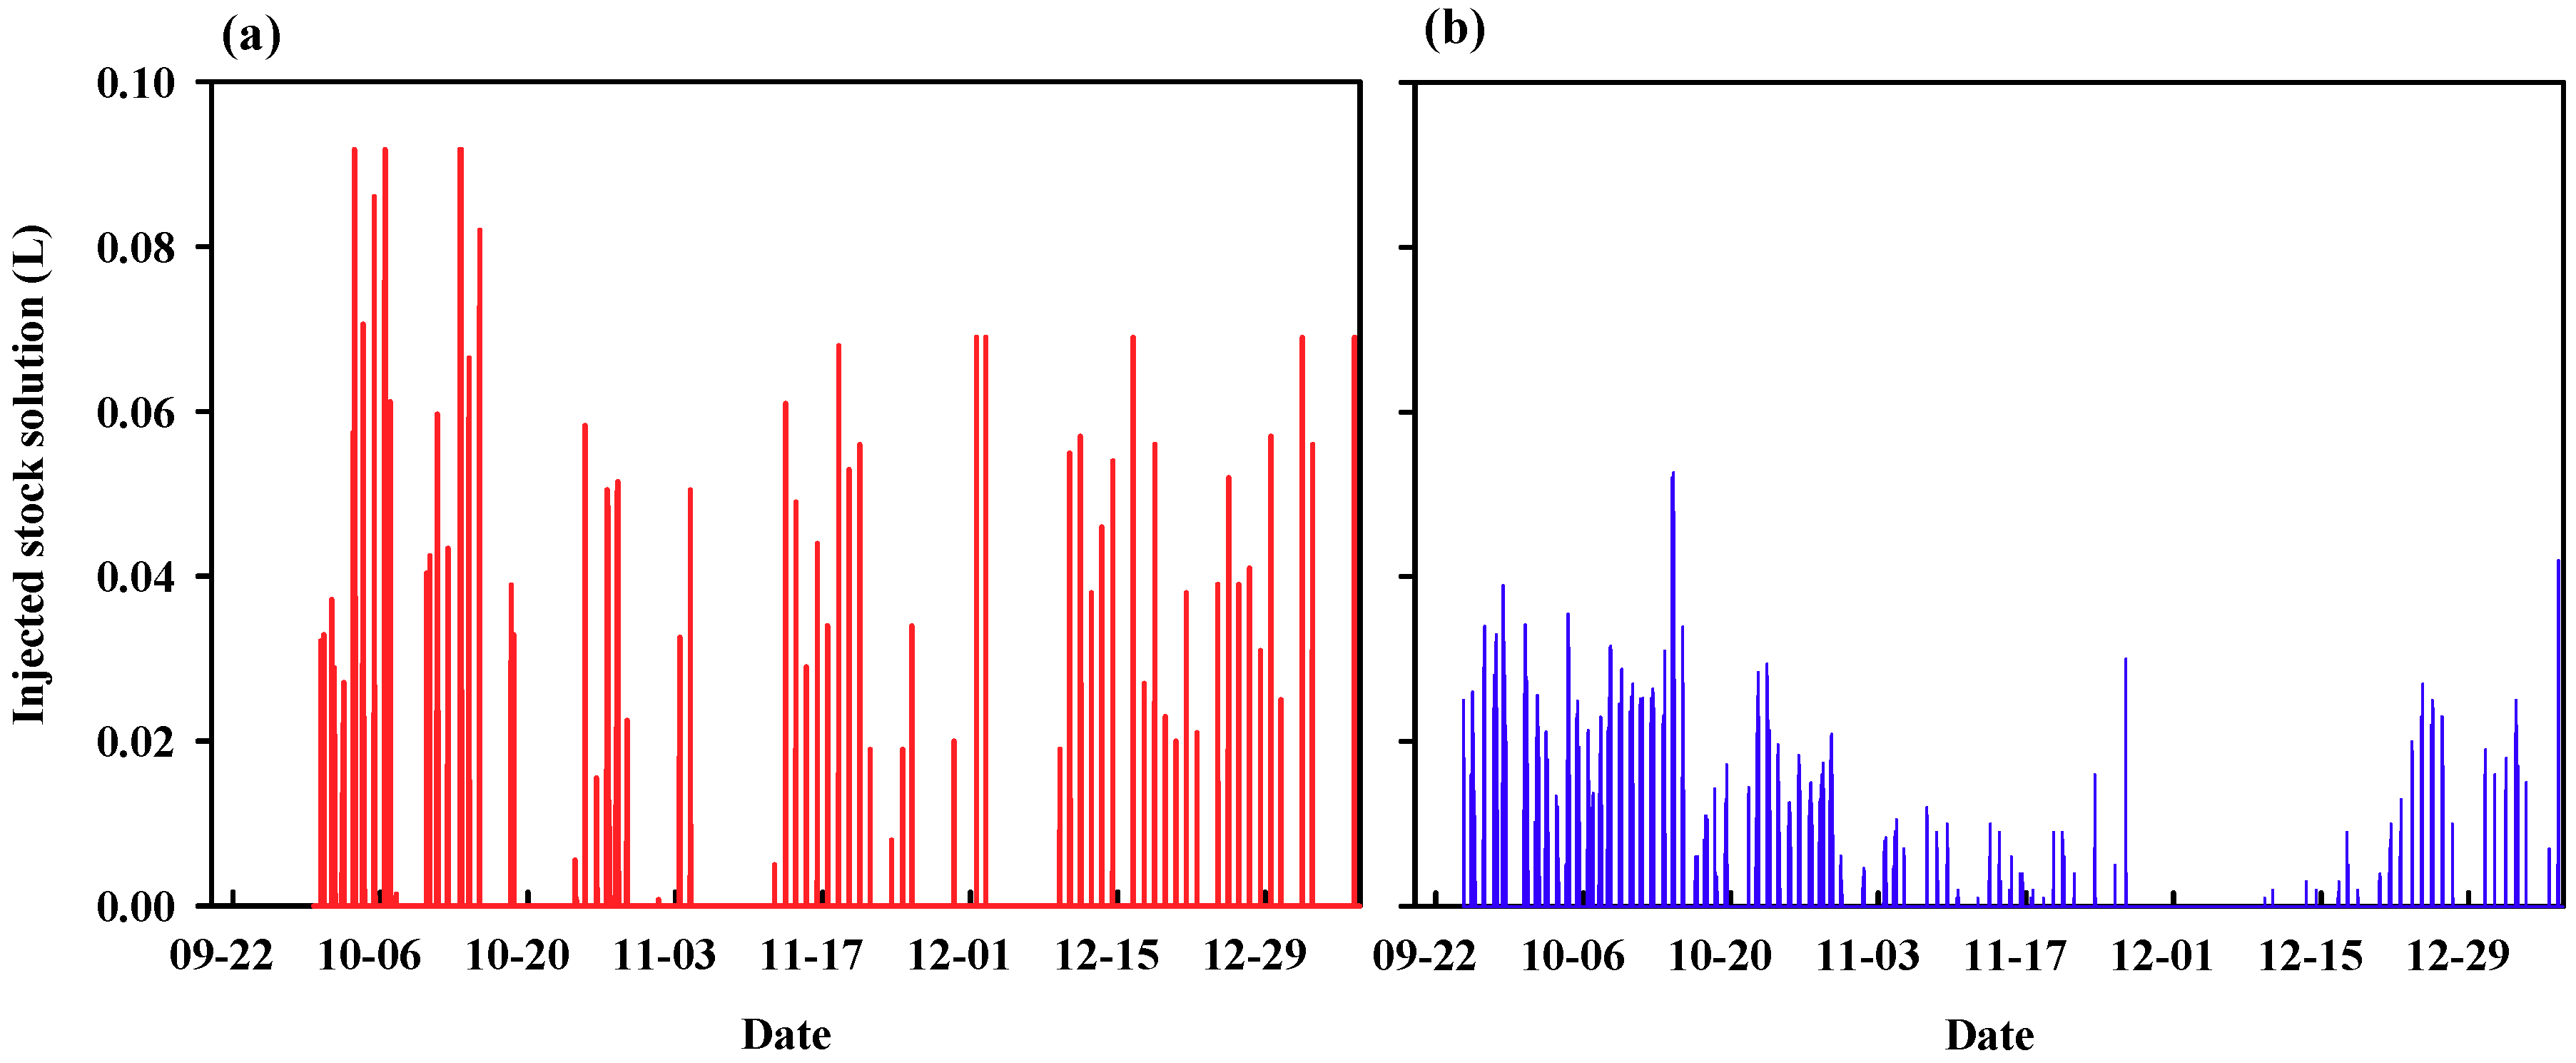
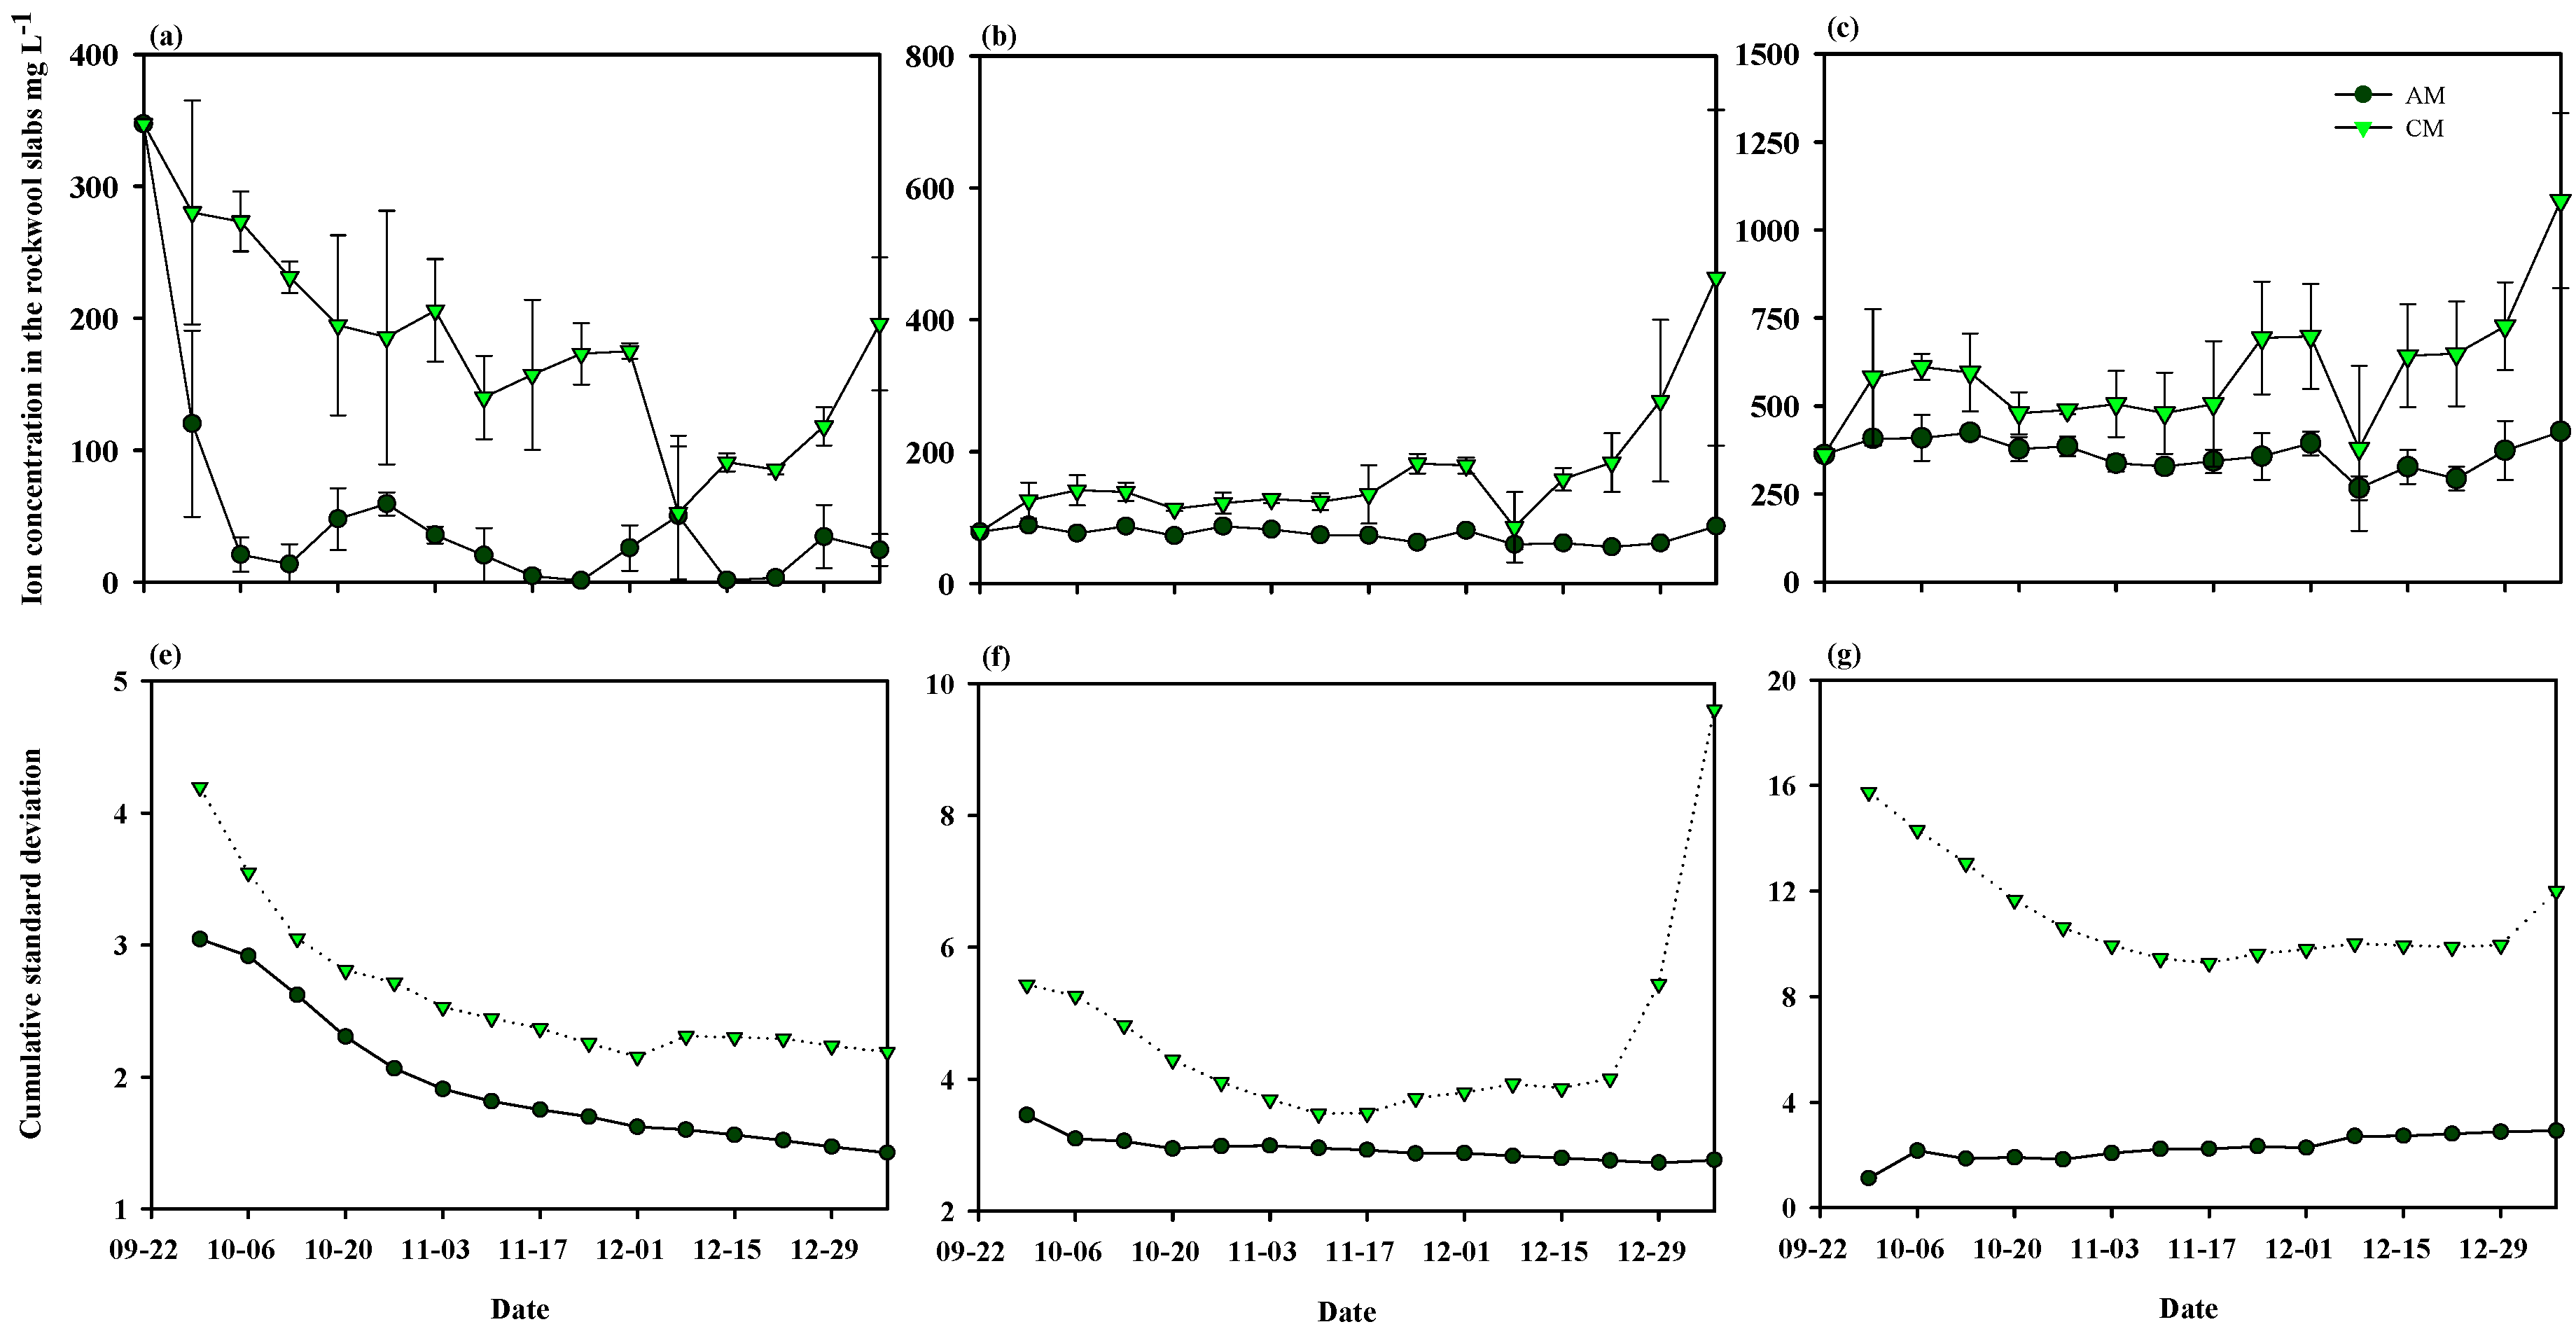
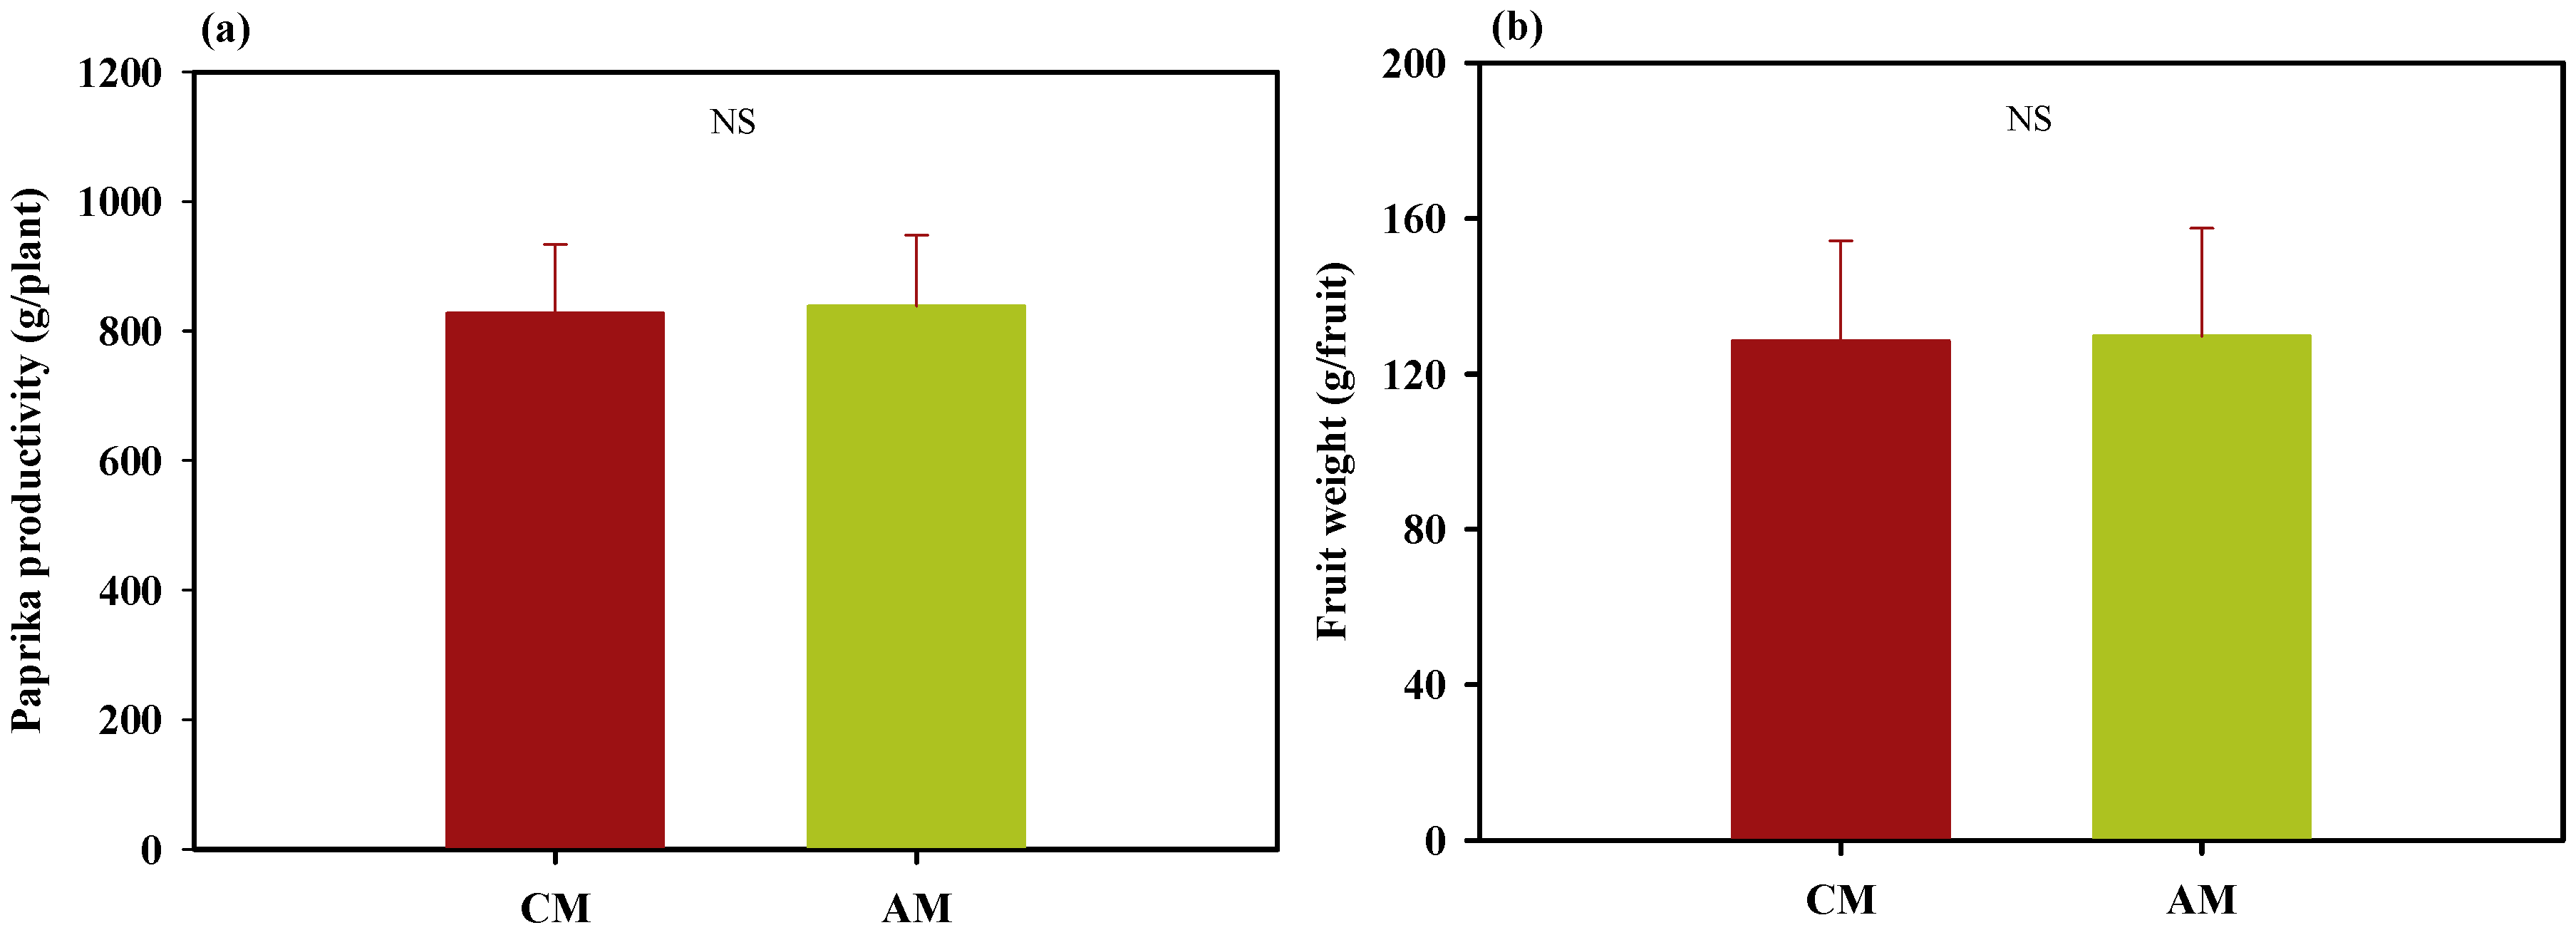
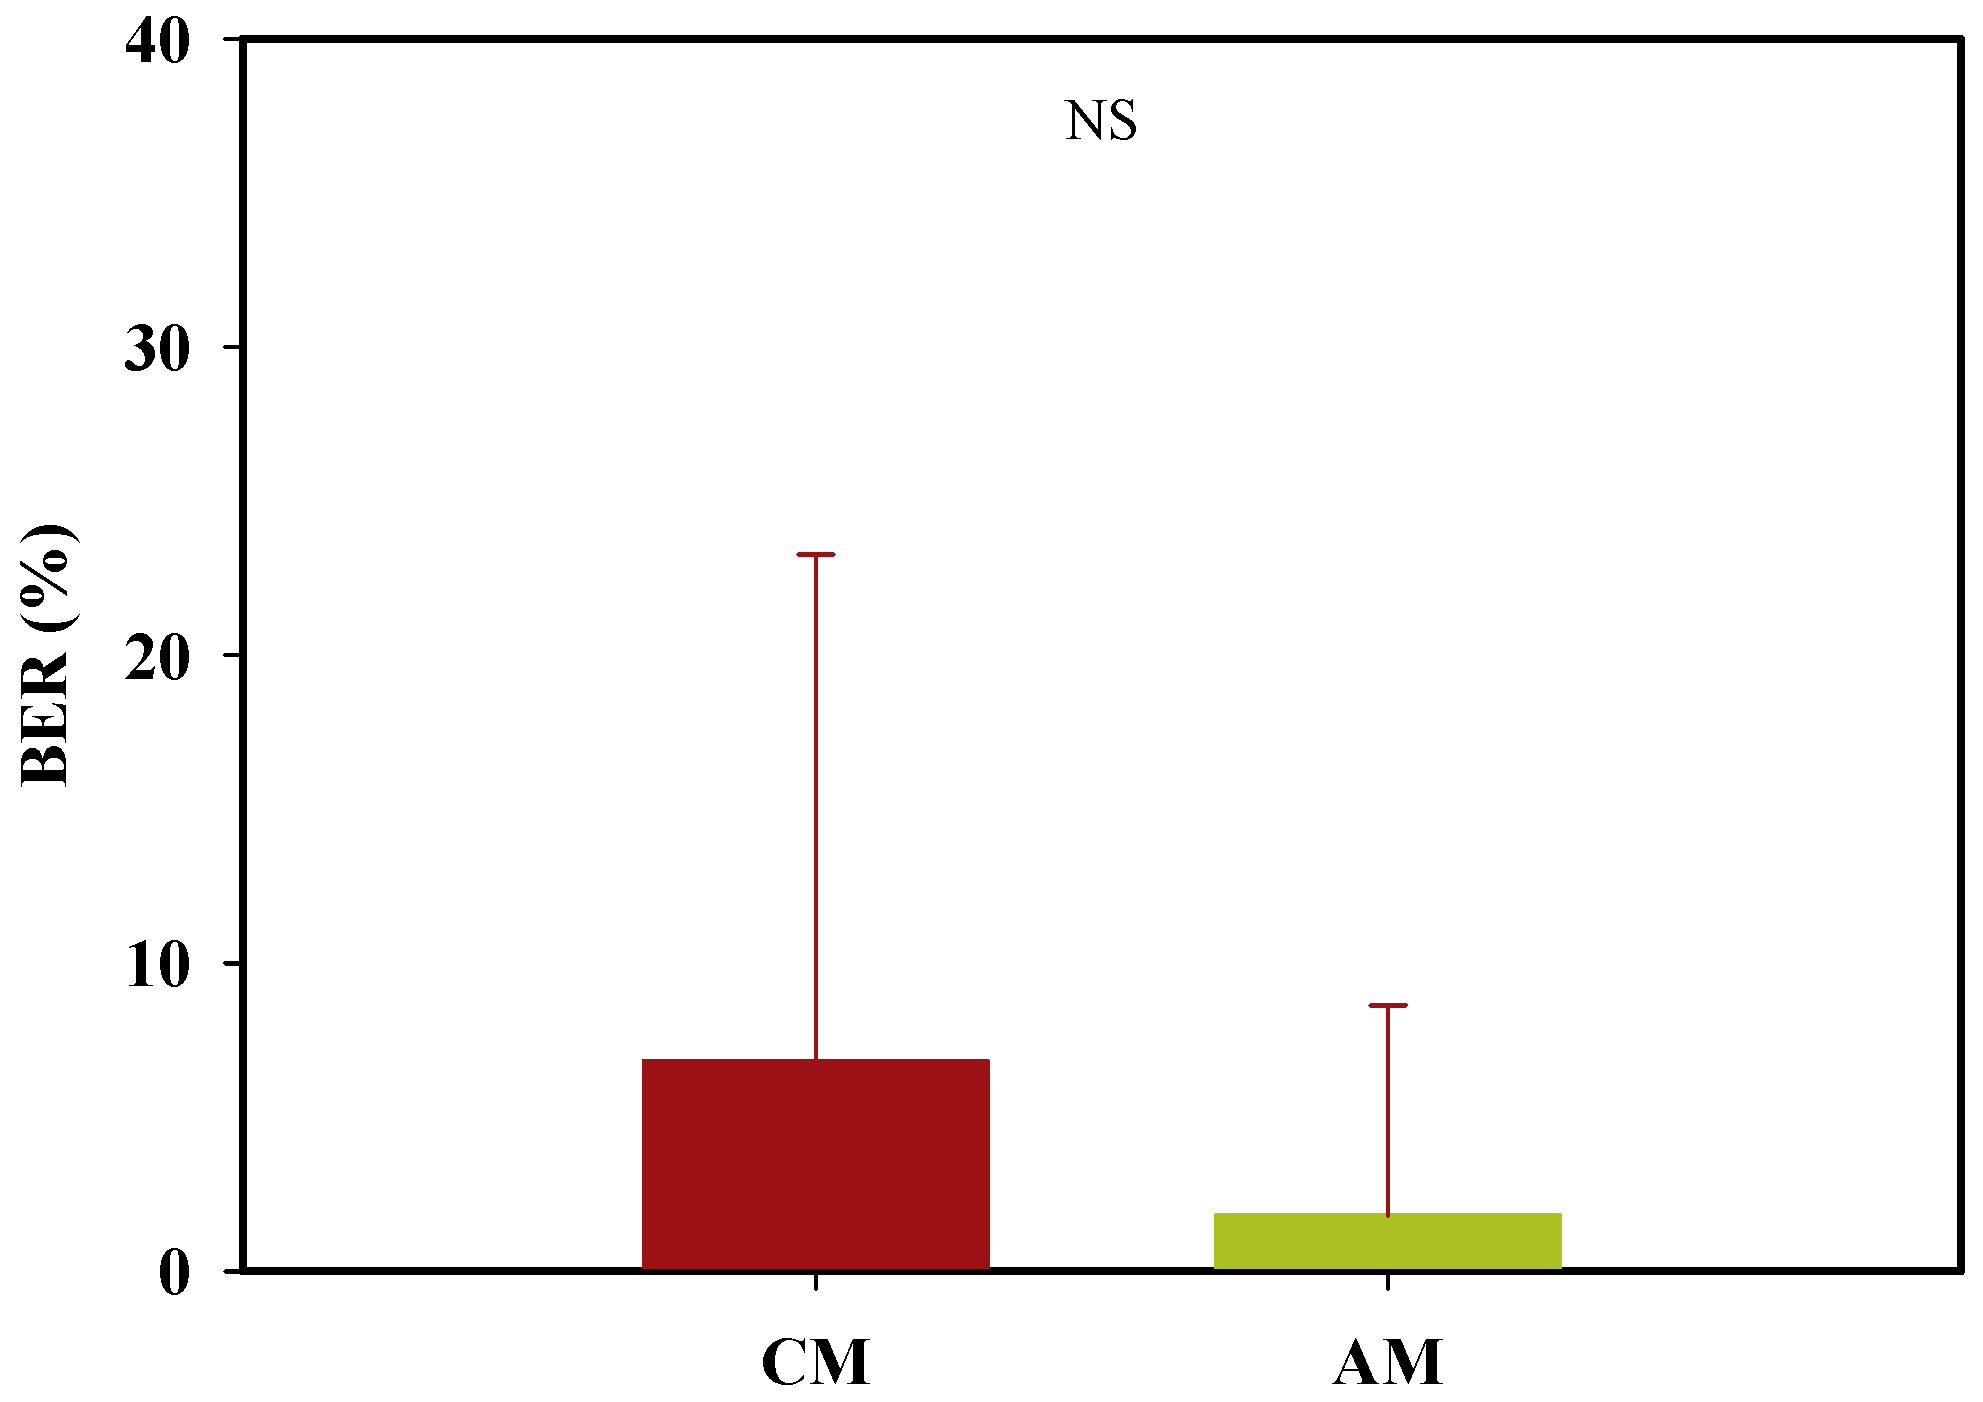
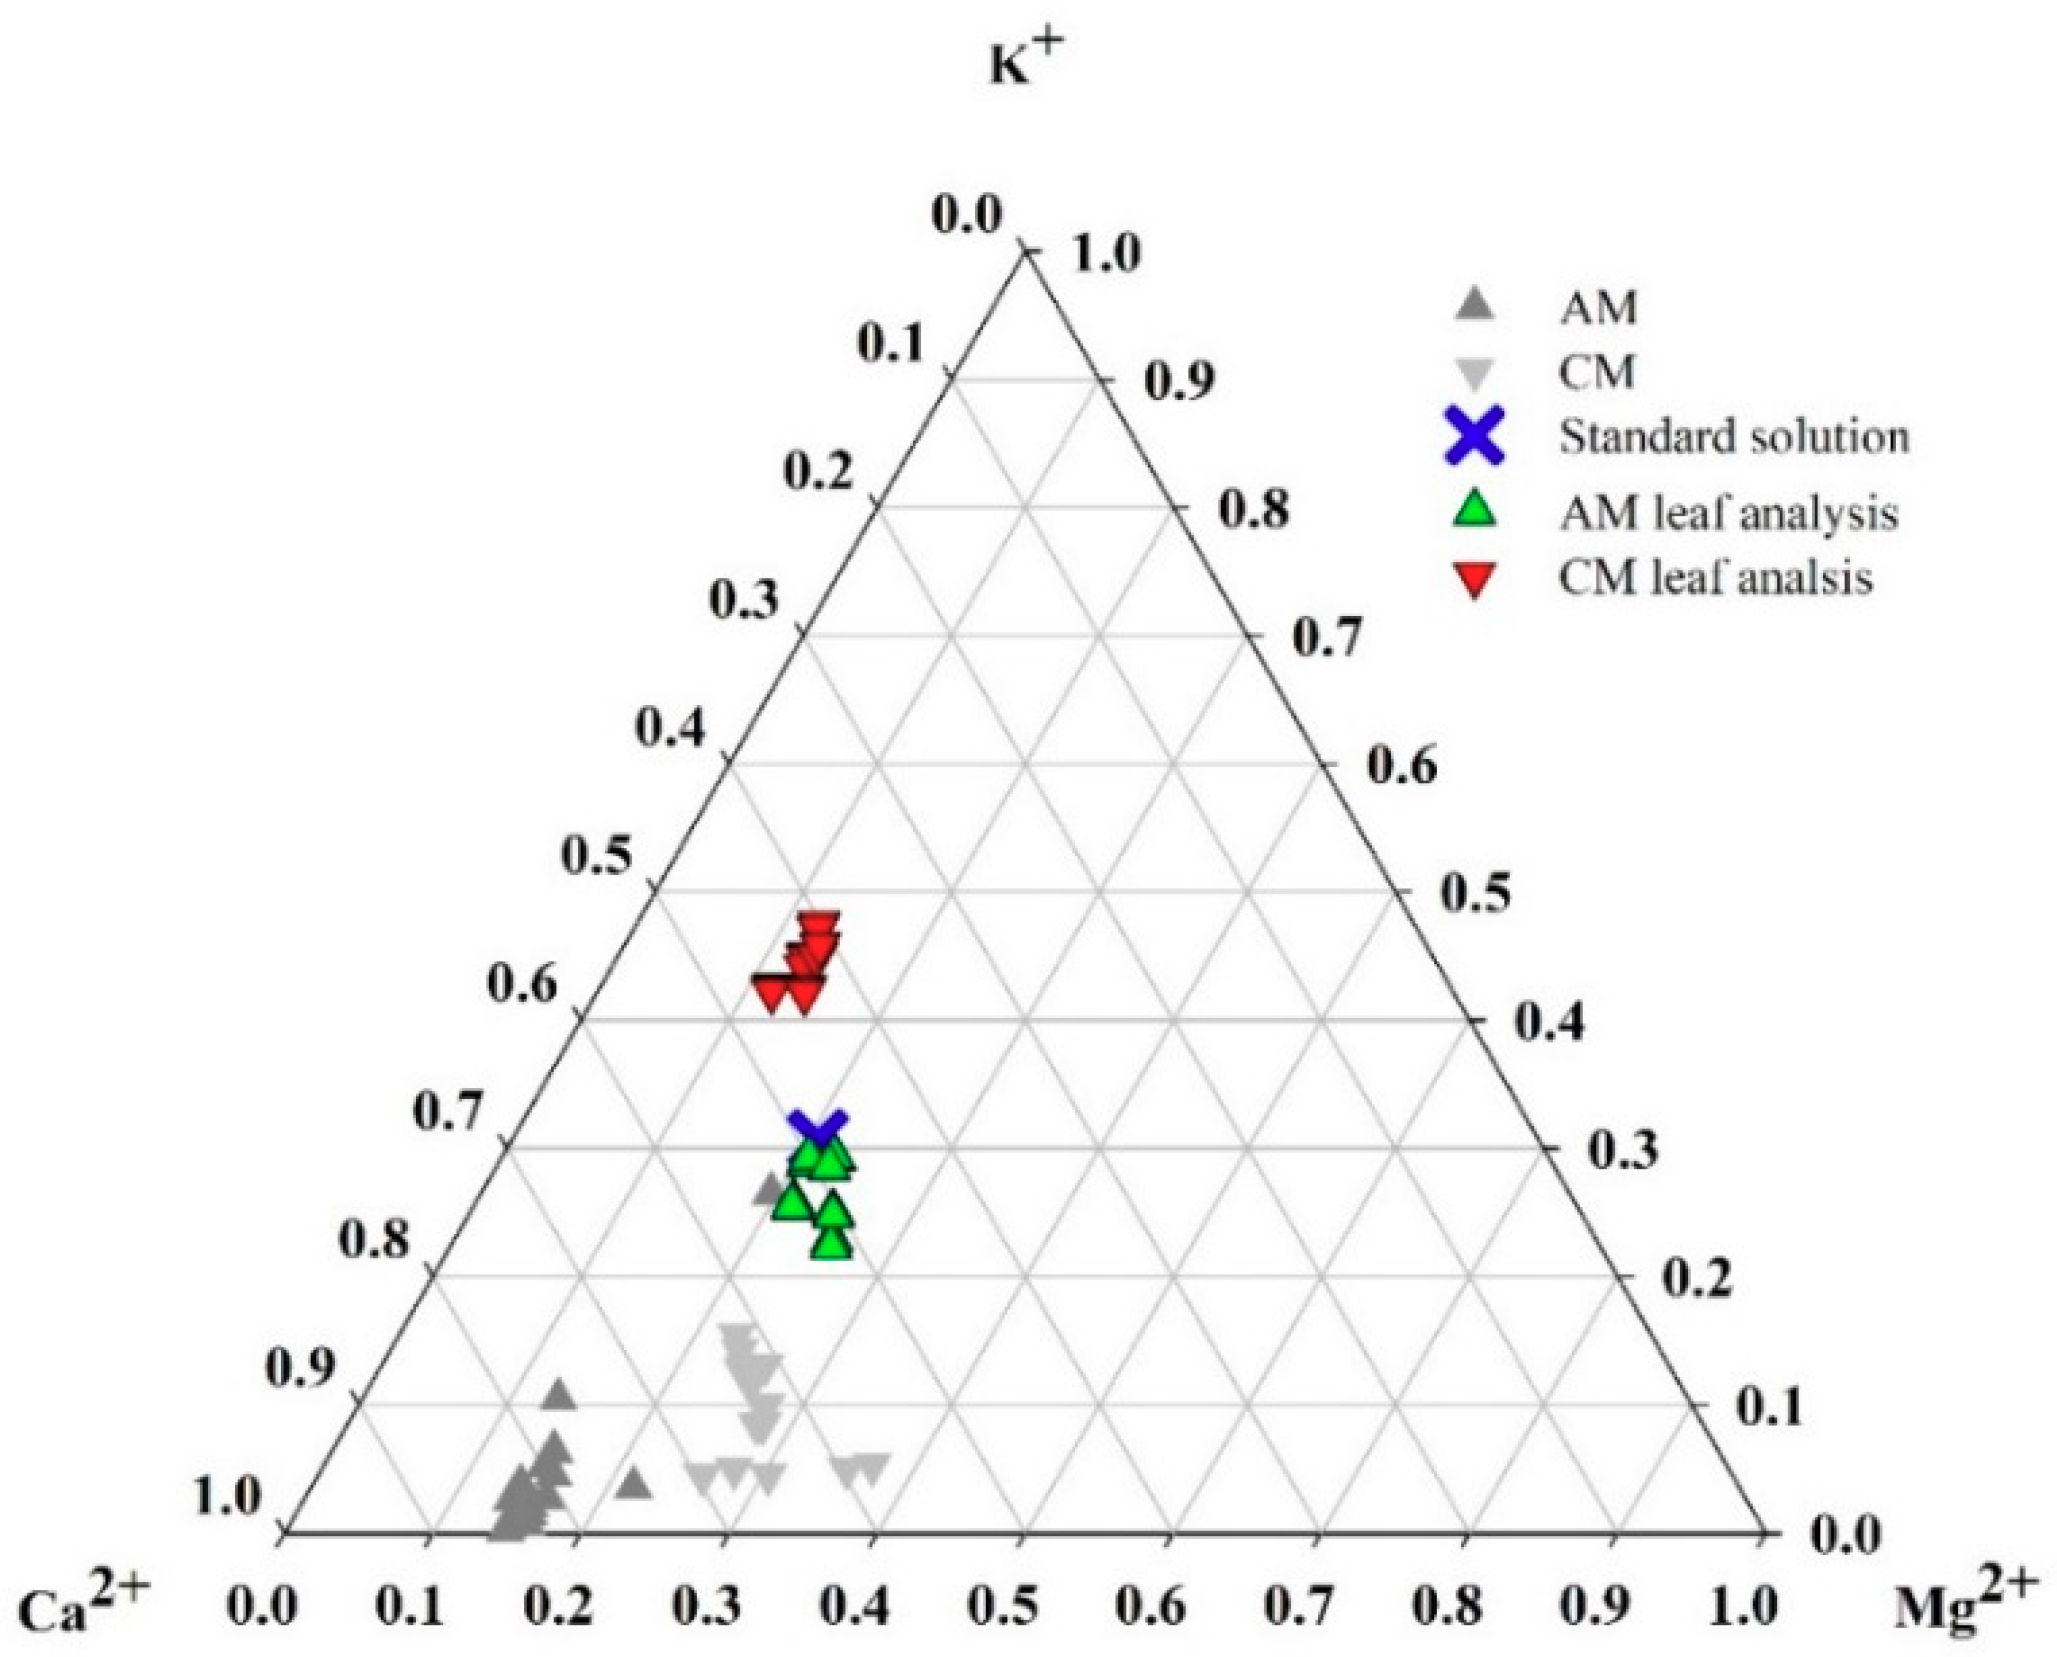
3.2. Experimental Analysis: Demonstration Experiment for the Theoretical Analysis

The AM showed stable changes in the EC control of substrate and drainage against the CM (Figure 4). While the EC of substrate and drainage in the AM was maintained near the initial value of the system, an increasing tendency in stored drainage volume in the drainage tank was not observed (Figure 5). The average level of stored drainage level in the CM was higher than in the AM, and the range of variation was relatively wider (Figure 5).
The mixing ratio of drainage, water, and stock solution in the conventional nutrient solution mixing process depends on the target EC for the irrigation solution. However, this aspect could generate significant fluctuations in the stored volume of drainage. No increasing or decreasing trend in EC or stored drainage volume can be inferred over the entire experimental period in the closed-loop system, meaning that total nutrient input to the system adequately followed total nutrient uptake by the plant. In the CM, the EC of the rockwool substrate was relatively higher, and gradual increase was observed. The EC in the substrate can eventually be reflected in the EC of the drainage. A high EC value in a closed-loop soilless culture system where concentration control of the recycled nutrient solution is carried out can lead to an increase in the volume of stored drainage solution and subsequently to discharge of drainage when it exceeds system capacity [13,14]. This can be a factor in system instability. The EC changes in the rockwool substrate of the AM applied system indicate a normal effect of the proportional gain adjustment, as in the theoretical analysis in this study.
The cumulative amount of nutrients supplied to the system using the AM increased at a low rate in comparison with the CM, and the final amount of supplied nutrients was also lower than that of the CM; 1054 g for AM and 2257 g for CM, respectively (Figure 6). The AM appeared to work normally, and a reduction in fertilizer input compared with the CM was also observed. In addition, measurement of cumulative amount of nutrients in a state with no overall increases in EC and stored drainage volume were not observed indicates that the system can detect the total nutrient requirement of a plant. This measure could be used as an as index for plant nutritional status, one that is not provided in the CM.
In the case of stock solution input volume change, it was confirmed that the input amount of the AM was relatively evenly distributed during the cultivation period (Figure 7b). On the other hand, in the case of the CM, a concentrated period of nutrient solution injection occurred, and relatively long periods during which the input of stock solution was blocked were observed (Figure 7a). The irregular feeding rate of the stock solution could be an adverse factor in nutrient-balance control when nutrient correction in the system is performed by input of stock or standard nutrient solution [13,14,32].
In the CM, overall tendencies of increasing Ca2+ and Mg2+ and decreasing K+ were observed (Figure 8). In the AM, Ca2+ and Mg2+ concentrations were stable at a level relatively close to the initial value, but K+ values showed a rapid decline and then fluctuated at a low concentration (Figure 8a–c). For CM, variations in nutrient concentrations similar to those reported in previous studies were observed [9,14,16]. Previous research on closed-loop soilless culture systems has determined that nutrient variations are a result of dynamic changes in nutrient uptake concentrations, and following those changes is challenging. [5,14,30,33]. However, Figure 8 indicates that a more deterministic change occurred in the system when nutrient replenishment was synchronized with total nutrient uptake through the AM system.
The cumulative standard deviations of the AM were maintained at a lower level than those of the CM during the entire experimental period, and gradually decreasing tendencies were observed in K+ and Mg2+ for the AM (Figure 8e–g). This means that the changes in nutrient concentration in the AM applied system were maintained close to the average concentration values during the experimental period compared with the CM. Considering the nutrient variations of the AM system itself, there may be a limit to defining it as steady state in the strict sense. However, in the actual cultivation conditions in this experiment, input of nutrients and water into the root zone by irrigation occurs intermittently, and the variation in the section where no input occurs cannot be controlled until the next input event. Furthermore, the frequency of changes of such input can affect system fluctuations [34,35,36], and the AM applied system is also under this influence. Considering these constraints and the CM changes, it can be assumed that the AM entered an average steady state that fluctuated within a certain range. The nutrient concentration control in the soilless culture system can therefore be seen as shifting the fluctuation range of the average steady state to the target range through a compositional change in the stock nutrient solution.
However, because the K+ concentration of the AM was maintained at a very low level in this study, the impacts on sweet pepper productivity need to be considered [37]. Total sweet pepper yields during the experiment were compared (Figure 9). The average total yield was 827.5 g per plant (standard deviation [SD] ±106.5) in the CM and 838.8 g per plant (±109.8) in the AM, and statistically significant differences were not observed (t-test, P > 0.05; n = 10 per treatment). The average fruit weights were 133.7 g (±35.2) and 137.8 g (±38.6) for the CM and AM, respectively, but no significant effect was observed.
In the case of blossom-end rot, the mean value was low in the AM but not by a significant difference (Figure 10). This is considered to be due to the difference in concentration of the root zone when considering the characteristics of sweet pepper responses to root zone nutrient concentration [38].
When comparing the changes in the nutrient ratio in the substrate during the experiment, the AM showed a tendency to accumulate calcium (Figure 11), but it was not in the range of physiological limitations of Steiner’s standard [39]. Leaf analysis confirmed that absorption selectivity is maintained by achieving the ratio range of standard nutrient solutions, unlike the ratio of nutrients in the substrate nutrient solution (Figure 11). In the AM, the concentration of K+ was maintained at a low level, but the supply interval of the stock solution was relatively uniformly distributed, resulting in a periodic supply. That could correspond to the prevention effect of nutrient deficiency through the constant feeding rate of nutrients even at lower concentrations [40].
Previous studies and techniques for the EC-based closed-loop soilless culture systems interpreted the nutrient variations mainly focused on the discrepancies between supplied nutrient concentrations and uptake concentrations. Due to the dynamic features in the uptake concentrations and seemingly complex changes of each nutrient in the substrate, this has been a limiting factor in the systematic approach and the development of appropriate technologies so far. Therefore, most of the studies have been carried out through relative comparison by controlled experiments. However, there was no proper theoretical platform for nutrients variation in the closed-loop soilless culture system, so the stability of the cultivation has been verified by changing the terminal factors such as the irrigation, composition of the nutrient solution, and reuse period [9,14,16,17,18,41,42]. Our study redefined the problem of nutrient variation control in the EC-based closed-loop soilless culture system in the whole system perspective through the theoretical analysis and deduced the proper solution. The experimental results showed theoretically-predicted behaviors in the EC variation control. In addition, the ion concentrations showed convergent changes, which are providing a basis for future studies for technical advancement.

5. Conclusions

The effects of synchronized total nutrient supply on total nutrient uptake by the alternative nutrient-replenishment method (AM) were confirmed and compared with those of the conventional nutrient-replenishment method (CM) in the soilless culture system for sweet pepper cultivation. In the AM, electrical conductivity (EC) was maintained close to the initial value, and the use of fertilizers was reduced by about 45% without significant yield losses compared with the CM. This could mean that a closed-loop soilless culture system, showing complicated nutrient variations, can be stably controlled. Through this study, the problem of EC variation in closed-loop soilless cultures was theoretically analyzed. In addition, more advanced and sustainable control techniques could be applied based on the problem definition provided by this study and repeated experiments for other crops are required to ensure the on-site feasibility.

Author Contributions

Formal analysis, T.I.A.; investigation, T.I.A. and J.E.S.; methodology, T.I.A. and J.E.S.; supervision, J.E.S.; writing—original draft, T.I.A.; writing—review & editing, J.E.S.

Funding

This work was supported by the Korea Institute of Planning and Evaluation for Technology in Food, Agriculture, Forestry and Fisheries (IPET) through the Agriculture, Food and Rural Affairs Research Center Support Program funded by the Ministry of Agriculture, Food and Rural Affairs (MAFRA; 717001-07-1-HD240).

Conflicts of Interest

The authors declare no conflict of interest.

References

  1. Gruda, N.S. Increasing Sustainability of Growing Media Constituents and Stand-Alone Substrates in Soilless Culture Systems. Agronomy 2019, 9, 298. [Google Scholar] [CrossRef]
  2. Bouchaaba, Z.; Santamaria, P.; Choukr-Allah, R.; Lamaddalena, N.; Montesano, F.F. Open-cycle drip vs. closed-cycle subirrigation: Effects on growth and yield of greenhouse soilless green bean. Sci. Hortic. 2015, 182, 77–85. [Google Scholar] [CrossRef]
  3. Olympios, C.M. Overview of soilless culture: Advantages, constraints and perspectives for its use in Mediterranean countries. Cah. Options Méditerr. 1999, 31, 307–324. [Google Scholar]
  4. Beerling, E.A.M.; Blok, C.; van der Maas, A.A.; van Os, E.A. Closing the water and nutrient cycles in soilless cultivation systems. Acta Hortic. 2014, 1034, 49–55. [Google Scholar] [CrossRef]
  5. Van Noordwijk, M. Synchronisation of Supply and Demand is Necessary to Increase Efficiency of Nutrient Use in Soilless Horticulture; Plant Nutrition-Physiology and Applications; Kluwer Academic Publishers: Dordrecht, The Netherlands, 1990. [Google Scholar]
  6. Raviv, M.; Lieth, J.H. Soilless Culture: Theory and Practice, 1st ed.; Elsevier: Amsterdam, The Netherlands; Boston, MA, USA; Heidelberg, Germany, 2008; ISBN 978-0-444-52975-6. [Google Scholar]
  7. Kläring, H.-P. Strategies to control water and nutrient supplies to greenhouse crops. A review. Agronomie 2001, 21, 311–321. [Google Scholar] [CrossRef] [Green Version]
  8. Moon, T.; Ahn, T.I.; Son, J.E. Forecasting root-zone electrical conductivity of nutrient solutions in closed-loop soilless cultures via a recurrent neural network using environmental and cultivation Information. Front. Plant Sci. 2018, 9, 859. [Google Scholar] [CrossRef]
  9. Zekki, H.; Gauthier, L.; Gosselin, A. Growth, productivity, and mineral composition of hydroponically cultivated greenhouse tomatoes, with or without nutrient solution recycling. J. Am. Soc. Hortic. Sci. 1996, 121, 1082–1088. [Google Scholar] [CrossRef]
  10. Eggert, R.J. Engineering Design; Pearson/Prentice Hall: Upper Saddle River, NJ, USA, 2005; ISBN 978-0-13-143358-8. [Google Scholar]
  11. Putra, P.A.; Yuliando, H. Soilless culture system to support water use efficiency and product quality: A review. Agric. Agric. Sci. Procedia 2015, 3, 283–288. [Google Scholar] [CrossRef]
  12. Savvas, D.; Manos, G. Automated composition control of nutrient solution in closed soilless culture systems. J. Agric. Eng. Res. 1999, 73, 29–33. [Google Scholar] [CrossRef]
  13. Massa, D.; Incrocci, L.; Maggini, R.; Bibbiani, C.; Carmassi, G.; Malorgio, F.; Pardossi, A. Simulation of crop water and mineral relations in greenhouse soilless culture. Environ. Modell. Softw. 2011, 26, 711–722. [Google Scholar] [CrossRef]
  14. Signore, A.; Serio, F.; Santamaria, P. A Targeted management of the nutrient solution in a soilless tomato crop according to plant needs. Front. Plant Sci. 2016, 7, 391. [Google Scholar] [CrossRef] [PubMed]
  15. Anpo, M.; Fukuda, H.; Wada, T. Plant Factory Using Artificial Light: Adapting to Environmental Disruption and Clues to Agricultural Innovation, 1st ed.; Elsevier Science: Amsterdam, The Netherlands, 2018; ISBN 978-0-12-813974-5. [Google Scholar]
  16. Hao, X.; Papadopoulos, A.P. Growth, photosynthesis and productivity of greenhouse tomato cultivated in open or closed rockwool systems. Can. J. Plant Sci. 2002, 82, 771–780. [Google Scholar] [CrossRef]
  17. Incrocci, L.; Malorgio, F.; Della Bartola, A.; Pardossi, A. The influence of drip irrigation or subirrigation on tomato grown in closed-loop substrate culture with saline water. Sci. Hortic. 2006, 107, 365–372. [Google Scholar] [CrossRef]
  18. Rouphael, Y.; Raimondi, G.; Caputo, R.; De Pascale, S. Fertigation strategies for improving water use efficiency and limiting nutrient loss in soilless Hippeastrum Production. Hortscience 2016, 51, 684–689. [Google Scholar] [CrossRef]
  19. Silberbush, M.; Ben-Asher, J.; Ephrath, J.E. A model for nutrient and water flow and their uptake by plants grown in a soilless culture. Plant Soil 2005, 271, 309–319. [Google Scholar] [CrossRef]
  20. Silberbush, M.; Ben-Asher, J. Simulation study of nutrient uptake by plants from soilless cultures as affected by salinity buildup and transpiration. Plant Soil 2001, 233, 59–69. [Google Scholar] [CrossRef]
  21. Snape, J.B.; Dunn, I.J.; Ingham, J.; Prenosil, J.E. Dynamics of Environmental Bioprocesses: Modelling and Simulation; VCH: New York, NY, USA, 1995; ISBN 978-3-527-61538-4. [Google Scholar]
  22. Ta, T.H.; Shin, J.H.; Ahn, T.I.; Son, J.E. Modeling of transpiration of paprika (Capsicum annuum L.) plants based on radiation and leaf area index in soilless culture. Hortic. Environ. Biotechnol. 2011, 52, 265–269. [Google Scholar] [CrossRef]
  23. Shin, J.H.; Park, J.S.; Son, J.E. Estimating the actual transpiration rate with compensated levels of accumulated radiation for the efficient irrigation of soilless cultures of paprika plants. Agric. Water Manag. 2014, 135, 9–18. [Google Scholar] [CrossRef]
  24. Baille, M.; Baille, A.; Laury, J.C. A Simplified model for predicting evapotranspiration rate of nine ornamental species vs. climate factors and leaf-area. Sci. Hortic. 1994, 59, 217–232. [Google Scholar] [CrossRef]
  25. Bassirirad, H. Kinetics of nutrient uptake by roots: Responses to global change. New Phytol. 2000, 147, 155–169. [Google Scholar] [CrossRef]
  26. Barber, S.A. Soil Nutrient Bioavailability: A Mechanistic Approach; John Wiley and Sons: New York, NY, USA, 1995; ISBN 0-471-58747-8. [Google Scholar]
  27. Savvas, D.; Adamidis, K. Automated management of nutrient solutions based on target electrical conductivity, pH, and nutrient concentration ratios. J. Plant Nutr. 1999, 22, 1415–1432. [Google Scholar] [CrossRef]
  28. Shin, J.H.; Son, J.E. Application of a modified irrigation method using compensated radiation integral, substrate moisture content, and electrical conductivity for soilless cultures of paprika. Sci. Hortic. 2016, 198, 170–175. [Google Scholar] [CrossRef]
  29. Lee, J.Y.; Rahman, A.; Azam, H.; Kim, H.S.; Kwon, M.J. Characterizing nutrient uptake kinetics for efficient crop production during Solanum lycopersicum var. cerasiforme Alef. growth in a closed indoor hydroponic system. PLoS ONE 2017, 12, e0177041. [Google Scholar] [CrossRef] [PubMed]
  30. Carmassi, G.; Incrocci, L.; Maggini, R.; Malorgio, F.; Tognoni, F.; Pardossi, A. An aggregated model for water requirements of greenhouse tomato grown in closed rockwool culture with saline water. Agric. Water Manag. 2007, 88, 73–82. [Google Scholar] [CrossRef]
  31. Carmassi, G.; Incrocci, L.; Maggini, R.; Malorgio, F.; Tognoni, F.; Pardossi, A. Modeling salinity build-up in recirculating nutrient solution culture. J. Plant Nutr. 2005, 28, 431–445. [Google Scholar] [CrossRef]
  32. Savvas, D. Automated replenishment of recycled greenhouse effluents with individual nutrients in hydroponics by means of two alternative models. Biosyst. Eng. 2002, 83, 225–236. [Google Scholar] [CrossRef]
  33. Savvas, D.; Stamati, E.; Tsirogiannis, I.L.; Mantzos, N.; Barouchas, P.E.; Katsoulas, N.; Kittas, C. Interactions between salinity and irrigation frequency in greenhouse pepper grown in closed-cycle hydroponic systems. Agric. Water Manag. 2007, 91, 102–111. [Google Scholar] [CrossRef]
  34. Ta, T.H.; Shin, J.H.; Noh, E.H.; Son, J.E. Transpiration, growth, and water use efficiency of paprika plants (Capsicum annuum L.) as affected by irrigation frequency. Hortic. Environ. Biotechnol. 2012, 53, 129–134. [Google Scholar] [CrossRef]
  35. Xu, G.; Levkovitch, I.; Soriano, S.; Wallach, R.; Silber, A. Integrated effect of irrigation frequency and phosphorus level on lettuce: P uptake, root growth and yield. Plant Soil 2004, 263, 297–309. [Google Scholar] [CrossRef]
  36. Savvas, D.; Gruda, N. Application of soilless culture technologies in the modern greenhouse industry—A review. Eur. J. Hortic. Sci. 2018, 83, 280–293. [Google Scholar] [CrossRef]
  37. Gruda, N.; Savvas, D.; Colla, G.; Rouphael, Y. Impacts of genetic material and current technologies on product quality of selected greenhouse vegetables—A review. Eur. J. Hortic. Sci. 2018, 83, 11. [Google Scholar] [CrossRef]
  38. Tadesse, T.; Nichols, M.A.; Fisher, K.J. Nutrient conductivity effects on sweet pepper plants grown using a nutrient film technique. N. Z. J. Crop Hortic. 1999, 27, 239–247. [Google Scholar] [CrossRef]
  39. Steiner, A.A. The selective capacity of plants for ions and its importance for the composition and treatment of the nutrient solution. Acta Hortic. 1980, 98, 87–97. [Google Scholar] [CrossRef]
  40. Ingestad, T. Relative addition rate and external concentration; Driving variables used in plant nutrition research. Plant Cell Environ. 1982, 5, 443–453. [Google Scholar] [CrossRef]
  41. Ko, M.T.; Ahn, T.I.; Shin, J.H.; Son, J.E. Effects of renewal pattern of recycled nutrient solution on the ion balance in nutrient solutions and root media and the growth and ion uptake of paprika (Capsicum annuum L.) in closed soilless cultures. Korean J. Hortic. Sci. Technol. 2014, 32, 463–472. [Google Scholar] [CrossRef]
  42. Ehret, D.L.; Menzies, J.G.; Helmer, T. Production and quality of greenhouse roses in recirculating nutrient systems. Sci. Hortic. 2005, 106, 103–113. [Google Scholar] [CrossRef]
Figure 1. Schematic description of a closed-loop soilless culture system in a simulated condition. Solid lines indicate water and nutrient flow, and dotted lines indicate data flow for nutrient solution mixing and irrigation control. CM and AM mean conventional and alternative nutrient-replenishment methods, respectively.
Agronomy 09 00649 g001
Figure 2. Changes in total ion concentration in the substrate (a) and total ions in the system (b) in the closed-loop soilless culture system using conventional (CM) and alternative (Equation (12) applied) nutrient-replenishment methods.
Agronomy 09 00649 g002
Figure 3. Changes in total ion concentration in the substrate according to the nutrient-replenishment method (a) and mean and standard deviation of total ion concentration in the substrate according to the nutrient-replenishment method (b). CM is the conventional nutrient-replenishment method and AM is alternative nutrient-replenishment method (Equation (13) applied).
Agronomy 09 00649 g003
Figure 4. Comparison of electrical conductivity (mean ± SD) in the rockwool substrate (a) and the drainage (b) of the closed-loop soilless culture system during the experimental period between conventional (CM) and alternative (AM) nutrient-replenishment methods.
Agronomy 09 00649 g004
Figure 5. Changes in stored drainage volume in the drainage tank (a) and box-plot comparison between conventional (CM) and alternative (AM) nutrient-replenishment methods (b) during the experimental period.
Agronomy 09 00649 g005
Figure 6. Accumulated amounts of fertilizers injected into the soilless culture systems with conventional (CM) and alternative (AM) nutrient-replenishment methods.
Agronomy 09 00649 g006
Figure 7. Changes in volume of injected stock solution with conventional (CM, a) and alternative (AM, b) nutrient-replenishment methods.
Agronomy 09 00649 g007
Figure 8. Changes in nutrient concentrations (mean ± SD) of K+ (a), Mg2+ (b), and Ca2+ (c) and changes in cumulative standard deviation of nutrient concentrations of K+ (e), Mg2+ (f), and Ca2+ (g) in the rockwool substrates using the conventional (CM) and alternative (AM) nutrient-replenishment methods, respectively.
Agronomy 09 00649 g008
Figure 9. Comparisons (mean ± SD) of total yield (a) and fruit weight (b) of sweet pepper during the experimental period between conventional (CM) and alternative (AM) nutrient-replenishment methods (t-test). NS: Not significant (P > 0.05); n = 10 per treatment.
Agronomy 09 00649 g009
Figure 10. Comparison of blossom-end rot (mean ± SD) of sweet pepper between conventional (CM) and alternative (AM) nutrient-replenishment methods (t-test). NS: Not significant.
Agronomy 09 00649 g010
Figure 11. Nutrient balance changes in the rockwool substrates and dried leaves using the conventional (CM) and alternative (AM) nutrient-replenishment methods.
Agronomy 09 00649 g011
Table 1. Parameters used for the simulations of soilless culture system.
SymbolDescriptionValueReference Number
a L A I Leaf area index parameter3.5[22]
b L A I Leaf area index parameter13.2[22]
x 0 Leaf area index parameter37.2[22]
a T Evapotranspiration parameter0.98[22]
b T Evapotranspiration parameter2.08 × 10−4[22]
λ Latent heat of vaporization2.45[22]
k Light extinction coefficient0.84[22]
R L D m a x Maximal root length density50,000 m m−3[20]
K 1 Coefficient of the root growth function770[20]
k 1 Coefficient of the root growth function500[20]
J m a x K Maximum absorption rate2.89 × 10−3[20]
J m a x C a Maximum absorption rate3.54 × 10−4[20]
J m a x M g Maximum absorption rate4.20 × 10−4[20]
K m K Michaelis-Menten constant0.0127[20]
K m C a Michaelis-Menten constant0.039[20]
K m M g Michaelis-Menten constant0.015[20]
C m i n K Minimal concentration for uptake0.002[19]
C m i n C a Minimal concentration for uptake0.002[19]
C m i n M g Minimal concentration for uptake0.002[19]
C T Target total equivalent concentration15
C W Total equivalent concentration in tap water1
F Field capacity0.74[4]
W D A W Difficult available water0.0068[4]
S s u b , n Volume of substrate layer n 1.35

