Abstract
A three year on-farm conservation-tillage experiment was initiated in fall of 2008 at Randle Farm LLC, located in Auburn, AL. Our objective was to evaluate and demonstrate implementation of tenable conservation vegetable production practices using high amounts of cover crop residues that reduce soil erosion, improve soil productivity and quality, reduce energy costs, and promote farm profitability. Cereal rye, crimson clover, and a rye and crimson clover mixture were evaluated as cover crops; these were terminated using either a prototype two-stage roller/crimper alone or followed by an application of 2.5 L a.i. ha−1 45% cinnamon (Cinnamomum verum L.) oil (cinnamaldehyde, eugenol, eugenol acetate,)/45% clove oil (eugenol, acetyl eugenol, caryophyllene) mixture in the spring prior to crop establishment. A winter fallow conventional tillage system was included for comparison. Watermelons, cantaloupes, and okra then were transplanted into each cover crop and termination treatment combination in mid-May, utilizing a modified transplanter equipped with a custom fitted subsoiling shank and row cleaners to alleviate soil compaction and facilitate transplanting. In all years, all cover crop treatments exceeded 4000 kg ha−1 and in 2009 and 2011, exceeded 6000 kg ha−1. At 21 days after termination in 2010 when the slowest termination occurred, higher termination rates were obtained for cereal rye (95% to 96%) followed by lower termination rates for the clover/rye mixture (83% to 85%); the lowest termination rates were obtained for crimson clover (66% to 68%). Commercially available cinnamon/clove oil solution provided little cover crop termination above that provided by a roller crimper alone. Volumetric soil moisture content for rolled/crimped cover crops was consistently higher compared to the conventional system, indicating that flattened and desiccated cover crop residue provided water conservation. In 2010 and 2011, yields for cantaloupe, okra, and watermelons were consistently higher for the conventional system compared with no-till system with cover crops likely due to weed cultivation limitations and insect pressure. Future studies need to focus on weed control and integrated pest management.
1. Introduction
Cover crops are an integral component in conservation agriculture because they provide important benefits that enhance soil quality and plant growth [1]. Recent incentives from United States (U.S) Department of Agriculture (USDA) Natural Resources Conservation Service (NRCS) to utilize mono- and poly-culture cover crops in no-till systems has increased use of these crops in the U.S. To maximize cover crop benefits, they must produce optimum biomass [2]. Commonly used cover crops in the southern United States are cereal rye (Secale cereale L.) and crimson clover (Trifolium incarnatum L.). Based on historic data, the average cereal rye biomass production level in Alabama is 6000 kg ha−1 [3], although cereal rye biomass production can attain 11,100 kg ha−1 when growing conditions are optimal [4]. Similar biomass production by crimson clover of 6000 kg ha−1 was reported in central Alabama [5], but higher biomass production (7000 kg ha−1) has been also reported [4]. In addition to biomass, crimson clover as a legume can fix nitrogen which is an important alternative to fertilizers as a nitrogen source in an organic production system [6,7]. Major cover crop benefits consist of soil protection from impact of rainfall energy, reduced runoff, decreased soil compaction and increased infiltration [8,9,10,11,12]. Cover crops also provide a physical barrier on the soil surface which inhibits weed germination, emergence and growth [13,14,15,16]. In addition to providing a physical barrier, cereal rye possesses allelopathic properties that provide control similar to applying a pre-emergence herbicide [17,18]. Improved soil physical/chemical properties from increasing soil organic carbon, are conditions for better crop growth and sustainable agriculture [19].
Rolling/crimping practices have been used in conservation systems to manage cover crops by flattening and crimping cereal or legumes cover crops [20,21,22]. Crimping cover crop tissue causes plant injury and accelerates its termination rate [21]. In the southern U.S., terminating cover crops should typically be carried out three weeks prior to planting the cash crop which is similar to normal herbicide burndown recommendations [22,23]. Typically, three weeks after rolling, the termination rate for rye is above 90% when rolling is performed at an optimal growth stage [20,21,22,23,24]. Most agricultural extension services recommend terminating the cover crop at least two weeks prior to planting the cash crop to prevent the cover crop from depleting soil moisture. Hargrove and Frye [6] reported a minimum 14 days from cover crop termination before cash crop planting enable soil water recharge. When winter and early spring months are unusually cold and wet, or too dry, producers must wait longer for rye to reach the optimum growth stage and biomass, thus causing later cash crop planting dates that likely decrease yield potential. A reduction in time between cover crop termination and cash crop planting might also create residue management problems for planting equipment. This is especially critical in vegetable production when delays in transplanting negatively affect growth of plants and yield. On the other hand, warm weather and plentiful rainfall in spring can increase weed pressure and insect populations. Timing is a very important aspect of using cover crops in vegetable production systems to effectively manage nutrient competition, moisture retention, and transplanting success.
Previous research has shown if there is insufficient time between cover crop termination and planting of a cash crop, the cover crop might not completely loose its elasticity, strength, and moisture, making planting difficult due to the possibility of frequent wrapping and accumulation of cover crop residue on planting units, as well as increasing the possibility of hair-pinning [25]. One effective way to reduce the time between terminating cover crops and planting the cash crop is to apply herbicide with rolling operation [22]. In no-till organic production, synthetic herbicides are prohibited, therefore organic herbicides effectiveness must be evaluated at realistic farming conditions.
The objective of this experiment was to evaluate and demonstrate implementation of tenable on-farm conservation vegetable production systems using high amounts of cover crop residues. The experiment evaluated management of three different cover crops in three vegetable crop systems. An organic herbicide was also evaluated for cover crop termination.
2. Materials and Methods
2.1. Experimental Design and Cover Crop Management
A three year on-farm organic no-till experiment was initiated in fall 2008 at Randle Farms LLC, Auburn, AL in the same field. A sandy soil [Cation Exchange Capacity (CEC) = 4.6–9.0 cmolc·kg−1], pH = 5–7) area (0.41 ha) which had not been under crop production for decades, was selected by the producer to conduct a replicated experiment with cover crops. The experiment was a split–split block design with factorial treatment arrangement, with each treatment replicated three times, and the experiment repeated over three years. The main block was cash crop, consisting either of watermelon, cantaloupe, or okra (Figure 1). Within each main block there were four subplot cover crop treatments: (1) crimson clover, (2) cereal rye (Wrens Abruzzi), (3) a crimson clover + cereal rye mixture, and (4) conventional tilled soil using multiple passes with a disk and field cultivator to prepare the seedbed, with no cover crop. In addition within each cover crop treatment, two cover crop termination treatments were applied to each sub-plot consisting of: (1) rolling/crimping alone, or (2) rolling/crimping followed by an application of 2.5 L a.i. ha−1 45% cinnamon (Cinnamomum verum L.) oil (cinnamaldehyde, eugenol, eugenol acetate,)/45% clove oil (eugenol, acetyl eugenol, caryophyllene) mixture (Weed Zap®, JH Biotech, Inc., Ventura, CA, USA) (Figure 1). Plots were 24.4 m long and 1.8 m wide with a 1.8 m alley between each plot.
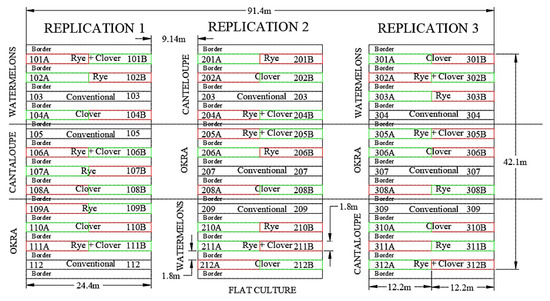
Figure 1.
Experiment layout for the on-farm organic no-till experiment.
Cereal rye (var. Wrens Abruzzi, 100 kg ha−1), crimson clover (var. Dixie, 24.5 kg ha−1), and a mixture of rye and crimson clover cover crops were seeded in the fall of 2008, 2009, and 2010 using a no-till Great Plains 606 NT drill with 19 cm row spacing. Cover crop height was assessed, and biomass samples were collected the day before cover crop termination in each spring, dried, and weighed. Cover crops were rolled/crimped mid-April of 2009, 2010, and 2011 using an experimental two-stage 2.4 m wide roller/crimper (Figure 2 and Figure 3) [26] when cereal rye reached the early milk growth stage (Zadoks #77,) [27], which is a desirable termination stage for this species that typically produces the highest biomass [20]. Termination rates were determined using a portable, handheld, active light sensor, (Greenseeker RT100 data collection and mapping unit, NTech Industries, Ukiah, CA, USA). Data were collected continuously by walking with the unit through the length of each plot. With this approach, we hypothesized that dead plants have 0% greenness [28]. In addition, volumetric soil moisture content was measured using time domain reflectometry (TDR) by a FieldScount® TDR 300 (Spectrum Technologies®, Aurora, IL, USA).
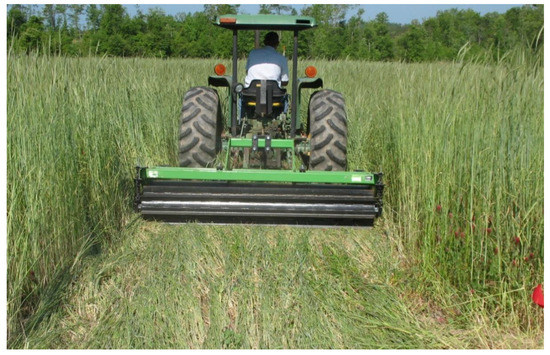
Figure 2.
Cereal rye crimson clover mixture being rolled/crimped by an experimental patented 1.8 m wide 2-stage roller/crimper.
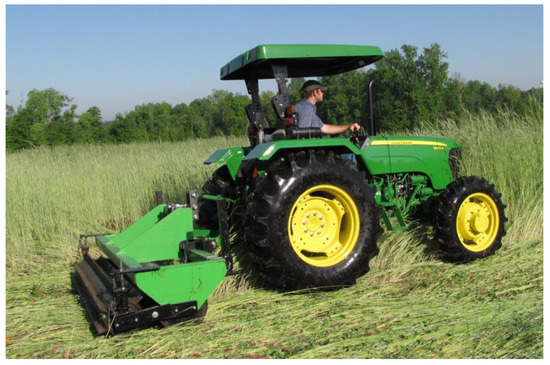
Figure 3.
Side view of the experimental patented two-stage roller/crimper with two adjustable compression springs to set crimping force of the secondary crimping drum.
2.2. Cash Crop Transplanting
Cash crop treatments were established after cover crop termination in mid-May utilizing a modified single row transplanter (RJ Equipment®, Blenheim, ON, Canada N0P 1A0), equipped with a custom-made frame (modifications were made at the National Soil Dynamics Laboratory, Auburn, AL) to which a custom designed slim shank (16 mm thickness) was attached, to alleviate a soil compaction layer (Figure 4). In addition, a spring-loaded fluted coulter and row cleaners (YetterTM, PO BOX 358 109 S. McDonough, Colchester, IL, USA) were used to manage cover crop residue on the soil surface. All plants received irrigation at planting. Drip irrigation was then immediately installed on all plots to provide plants with irrigation, applied four times a day for fifteen minutes until harvest. Hydrolyzed Fish Fertilizer 2-4-1 (Neptune’s Harvest, Gloucester, MA, USA) was applied throughout the season through the drip irrigation applied as needed, to meet requirements recommended by the Alabama Cooperative Extension System [29].
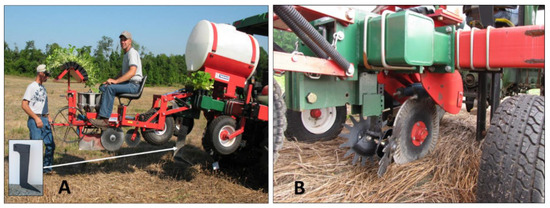
Figure 4.
(A) RJ Equipment® no-till transplanter, with the additional custom designed sub-frame to accommodate a custom subsoiler shank (subsoiler used is pointed by arrow) for a single combined subsoiling and transplanting operation. (B) Row cleaners were mounted for cover crop residue management.
Crimson Sweet watermelon (var. lanatus), Athena cantaloupe (var. cantalupensis), and Clemson Spineless okra (var. esculentus) transplants were grown from seed in the greenhouse. Vegetables were hand harvested from all plots and weighed for yield assessment. Field operation timing are presented in Table 1.

Table 1.
Field operations at each growing season.
2.3. Data Analysis
Cover crop termination rates (%) and volumetric soil moisture content (%) were transformed using an arcsine square-root transformation method [30], but this transformation did not result in a change in analysis of variance (ANOVA), thus non-transformed means are presented. Non-transformed cover crop height, cover crop biomass, and cash crop yield data were used in analysis of variance (ANOVA). Cover crop production system, termination system, and their interactions were considered fixed effects. Treatment means were separated using the ANOVA General Linear Model (GLM) procedure; the Fisher’s protected least significant differences (LSD) test at the 10% probability level was used [31]. Fixed effect p values are reported in Table 2.
Table 2.
Fixed effects of (p values) for dependent variables utilized in this study.
3. Results and Discussion
3.1. Cover Crop Height and Biomass Production
Cover crop height was significant for year and species (ANOVA revealed p value <0.0001 for both variables). Cereal rye height as monoculture was 161, 138, and 164 cm in 2009, 2010, and 2011 respectively, whereas rye height was decreased in 2009 when mixed with crimson clover (Table 3). The height for crimson clover was 68, 34, and 57 cm alone in 2009, 2010, and 2011 respectively, and did not decrease when mixed with rye. Across three growing seasons, significant differences were detected among cover crops biomass (p value for variable YEAR was <0.0001). Similarly, the p value for variable COVER was <0.0001. Biomass production averaged over cover crops was highest in 2009 (7753 kg ha−1) followed by lower biomass in 2011 (7130 kg ha−1), and the lowest biomass was recorded in 2010 (4144 kg ha−1). The lowest biomass generated in 2010 was associated with drier field conditions due to a lack of rainfall during cover crop growth period.
Table 3.
Height (cm) and cover crop biomass (kg ha−1) on dry basis during three growing seasons.
In 2009, there were no significant difference between biomass production for rye, clover alone, and mixture between these cover crops (p value = 0.2382). In 2010, the lowest cover crop biomass was generated by crimson clover alone (2956) compared with significantly higher biomass for cereal rye and clover/rye mixture (4763 and 4712 kg ha−1, respectively). In 2011, significantly higher biomass was generated by clover/rye mix (8064 kg ha−1) compared with lower biomass for clover (6274 kg ha−1) and cereal rye 7052 (kg ha−1) alone.
3.2. Cover Crop Termination
Cereal rye had significantly higher termination rates compared to clover/rye mix and clover alone across three growing seasons where the termination rates were averaged over one, two, and three weeks after treatment application. Overall, the lowest termination rates were observed for crimson clover (Table 4). The results show that applying organic herbicide ZAP in addition to mechanical termination by rolling/crimping did not improve termination rates for single species cover crops (rye and clover) and clover/rye mixture for all three growing seasons.
Table 4.
Three-year average termination rates comparison between rolled only treatment and roller with ZAP application treatment.
Overall rye and mixture were easier to terminate (above 90% three weeks after rolling) (Table 5). Clover alone, because of its very low height in 2010, was unable to engage with the roller’s crimping bars and resulted in lower termination three weeks after rolling (68%).
Table 5.
Cover crop termination rates during 2009, 2010, and 2011 growing seasons.
At 14 days after rolling, significantly higher termination rates of 83% and 84% were associated with rolling rye and rolling rye with a supplemental ZAP application, respectively. However, these termination rates were not different than for rolling clover with ZAP (77%). Termination rates for crimson clover were significantly lower (66%) for rolling only treatment and slightly higher (72%) for rolling with ZAP, but there were no differences between no-ZAP and ZAP treatments for clover. Data clearly suggest that adding ZAP to rolling did not increase termination for both mono and mix cover crops. At 21 days after rolling and chemical treatment of ZAP, higher termination rates were generated for rye (100%) and clover/rye mix (100%) with or without ZAP treatment, compared with lower termination rates for clover cover crop (91% for rolling only and 93% for rolling with ZAP).
At 14 days after rolling treatment, higher termination rate for cereal rye was associated with rolling with ZAP treatment compared to roller alone (71% vs. 63%). For crimson clover, there was no difference in termination rates between roller only and roller plus ZAP treatments. However, no difference in termination rates for rye and clover mixture were found between rolling only and rolling with ZAP treatment. Overall, termination rates for crimson clover (52%) were lower for both rolling treatments compared with cereal rye and clover/rye mixture. At 21 days there was no difference between rolling only and rolling with ZAP for each cover crop. Higher termination rates were obtained for cereal rye (95% to 96%) followed by lower termination rates for clover/rye mixture (83% to 85%) and the lowest termination rates were obtained for crimson clover (66% to 68%).
In 2011 at seven days after rolling treatment application, higher termination rate of 55% was obtained for rolled rye and ZAP followed by lower termination for rolled rye (46%), rolled clover/rye mix (41%), and rolling with ZAP (38%). As in previous growing seasons, the lowest termination rates were observed for crimson clover having 29% for rolled only treatment and 32% for rolling with ZAP treatment, without statistical differences between these treatments. At 14 days after rolling, there were no differences in termination among cover crops and rolling treatments ranging from 64% (crimson clover with roller only) to 74% (for cereal rye roller only treatment). Similarly, at 21 days after rolling, no differences in termination rates among cover crops and rolling treatments were found having termination rates ranging from 91% for crimson clover (rolling with ZAP) to 96% for both cereal rye (rolling with and without ZAP) and clover/rye mixture (for rolling only treatment).
Termination data from three growing seasons clearly indicates that adding organic ZAP herbicide with rolling did not increase termination rates for all cover crops. Therefore, based on this study, spending money for Weed ZAP application is not recommended due to expense and ineffectiveness.
3.3. Volumetric Soil Moisture Content
Across three growing seasons, rolling treatments had a significant effect on volumetric soil moisture content (p value < 0.0001) (Table 6). The higher volumetric moisture content (VMC) was observed for rolled rye + ZAP (6.6%), rolled clover/rye mix (6.5%), rolled clover/rye mix + ZAP (6.2%), and rolled rye (6.1%) without significant differences among these treatments. Lower volumetric soil moisture content was observed for rolled crimson clover (5.7%) and rolled crimson clover + ZAP (5.7%) but not significantly different than VMC obtained for rolled clover/rye mix + ZAP and rolled rye alone. The lowest VMC of 4.4% was recorded for conventional culture (rototilled soil without cover crops). These results indicate that rolled residue provided consistently higher soil moisture during three weeks of evaluation in addition to protecting the soil surface from water and wind erosion.
Table 6.
Volumetric soil moisture content during 2009, 2010, and 2011 growing seasons.
In 2009, at seven days after rolling and ZAP application, VMC for rolled cover crops with or without ZAP treatment ranged from 8.9% (rolled crimson clover + ZAP) to 10.2% (rolled clover/rye mix) and was significantly higher than for conventional operation (7.8%). Except for crimson clover (rolling + ZAP treatment) and clover/rye mix, no significant differences in VMC were detected among other rolled residue treatments indicating that rolling effectively preserved soil water. At 14 days after rolling, significantly higher VMC (8.3% to 9%) was observed for cereal rye and clover/rye mix for rolled and rolled plus ZAP applications compared to crimson clover (rolled and rolled–ZAP with 7.2% VMC) and the lowest VMC of 6.2% for conventional tillage without cover crops most likely due to higher water evaporation from the bare soil. Lower VMC for crimson clover might be associated with lesser soil coverage due to numerically lower biomass production for clover compared to rye and clover/rye mix. At 21 days after rolling, there were no significant differences in VMC among all treatments with 7% VMC for conventional plots (numerically lowest), and 7.5% to 8.5% for rolled treatments.
In 2010, compared to the previous growing season, the volumetric soil water in 2010 during the three weeks of the evaluation was significantly lower due to lack of rainfall. At seven days the VMC was 4.3% for rolled clover plus ZAP which was significantly lower than rolled clover/rye mix with VMC of 5.2%. All other rolling treatments for cereal rye (rolled only and rolled with ZAP), rolled clover and mixture (rolled only and rolled with ZAP) had VMC from 4.6% to 4.9% without significant difference among these treatments. In contrast conventional plots had significantly lower VMC of 2.2% indicating higher water evaporation compared with the covered soil surface by cover crop residue. At 14 days after rolling, there were no significant differences in VMC among all rolled and ZAP treatments for all covers ranging from 6.8% to 8.0%. The conventional plots had significantly lower VMC of 5.5% compared to cover crops treatments. At 21 days after rolling, because of a lack of rainfall, the VMC for all treatments was significantly lower compared with seven-day and 14-day evaluations. The VMC readings of 3.0% for cereal rye (rolled and rolled with ZAP) and 2.7% to 3.2% for clover/rye mix (rolled and rolled with ZAP) was higher compared to lower VMC for rolled clover (1.7%) and rolled with ZAP (1.8%). These lower VMC levels were most likely associated with unusually low production of clover biomass, approximately 1.8 metric tons less than for cereal rye and clover/rye mix. The conventional plots without covers had very low VMC of 0.8% indicating severe drought conditions.
In 2011, at seven days after rolling and ZAP application, no significant differences in VMC were detected among rolled clover and cereal rye (with and without ZAP) and for rolled only clover/rye mix. Lower VMC of 5.9% was obtained for rolled clover/rye mix plus ZAP compared with higher VMC for rolled clover and rye plus ZAP (6.8%). The conventional system without cover crop had significantly lower VMC of 3.1% compared to two times higher VMC for rolled cover crop treatments. At 14 days after rolling, VMC for all cover crops was unusually low due to a drought and higher temperatures. The lowest VMC was obtained for conventional system (1.2%), followed by crimson clover (1.6% for rolling and 1.5% for rolling with ZAP) and by clover/rye mixture (1.7% for rolling only and 1.8% for rolling with ZAP). VMC for cereal rye was higher (3.0% for rolling with ZAP). VMC for rolling only was 2.4% but not statistically different than VMC for clover/rye mixture. At 21 days after rolling, compared with 14 days, VMC was higher for all cover crops and rolling treatments due to a rainfall occurring between 14 and 21 days after rolling. This rainfall event elevated VMC ranging from 6.0% to 7.3% without statistical difference in VMC among cover crops and rolling treatments. Generally, across all growing seasons, rolled cover crops had higher VMC compared to conventional system indicating water conservation as one of the major benefits that cover crops provide.
3.4. Cash Crop Yield
In 2009, there were many problems associated with no-till systems when commercial pesticides were not used. Large insect populations (grasshoppers and squash bugs) severely hindered crop establishment and high weed pressure reduced yields. The 2009 growing season served as a learning process to resolve pest problems by using organic compounds and mechanical methods. Organic insecticides were used in late 2009 including Hot Pepper Wax and Pyganic E.C. 5.0. for insect control.
- Cantaloupe. There were no significant differences in cantaloupe yield between two growing seasons (p value = 0.6995). In 2010 the yield had higher numerical value of 3037 kg ha−1 compared to 2710 kg ha−1 in 2011 (Table 7). Across two growing seasons, there was no significant difference in cantaloupe yield among three blocks (p value = 0.2906). In addition, no significant differences in the yield were present between rolling alone and rolling + ZAP, although the rolling + ZAP treatment had a higher numerical yield of 3193 kg ha−1 compared to lower yield of 2554 kg ha−1 for rolling only treatments. In 2010 cover crops did not influence cantaloupe yield (Table 7) ranging from 2382 kg ha−1 for cereal rye to 4126 kg ha−1 for conventional plots. In contrast, in 2011 growing season cover crop did have an effect on the yield with a lower 606 kg ha−1 for cereal rye and similar yields of 3823 kg ha−1 for conventional system, 2746 kg ha−1 for clover and 3665 kg ha−1 for clover/rye mixture. However, no differences found between rolling only and rolling with ZAP treatments (p value = 0.7064). Likewise, rolling treatment across two growing seasons, did not have an influence on yield (p value = 0.4521) generating cantaloupe yield of 3194 kg ha−1 for rolled + ZAP compared to 2554 kg ha−1 for rolled only treatment.
Table 7. Cantaloupe yield (kg ha−1) with respect to cover crop treatments in 2010 and 2011 growing seasons.
- Okra. There was a significant difference in okra yield between two growing seasons (p value = 0.0051); the yield in 2010 was 1207 kg ha−1 compared to 1603 kg ha−1 in 2011 (Table 8). Moreover, across two growing seasons, significant difference in okra yield existed among the three blocks (p value = 0.0001) and among cover crops (p value < 0.0001). In 2010 growing season, cover crops did have an effect on the okra yield, with lowest yield of 525 kg ha−1 for crimson clover/cereal rye mix, 639 kg ha−1 for crimson clover without significant difference between these cover crops, and higher yield of 839 kg ha−1 was found for cereal rye, and the significantly higher yield of 2823 kg ha 1 was obtained for conventional system compared to all cover crops. Similarly, in 2011 growing season, cover crops did influence okra yield (Table 8) ranging from the lowest yield of 935 kg ha−1 for cereal rye, followed by 1146 kg ha−1 for crimson clover (without significant difference between these cover crops) and the higher okra yield of 1472 kg ha−1 for the clover/rye mix. Compared to the cover crops used, conventional plots generated significantly higher okra yield of 2860 kg ha−1. In addition, across two growing seasons, rolling treatment did not have an influence on yield (p value = 0.9551).
Table 8. Okra yield (kg ha−1) with respect to cover crop treatments in 2010 and 2011 growing seasons.
- Watermelon. No significant difference existed in watermelon yield between two growing seasons (p value = 0.1760), but in 2010 the watermelon yield had higher numerical value of 6257 kg ha−1 compared to 4827 kg ha−1 in 2011 (Table 9). Across two growing seasons cover crops influenced watermelon yield (p value < 0.0001). Significant difference in watermelon yield was observed among blocks (p value = 0.0006) indicating high variability in the yield among three blocks. In addition, no significant differences in watermelon yield were found between rolling alone (5661 kg ha−1) and rolling + ZAP (5424 kg ha−1). In 2010 cover crops did influence watermelon yield (Table 9) ranging from 2382 kg ha−1 for cereal rye to 4126 kg ha−1 for conventional plots. Similarly, in 2011 growing season, cover crop did have an effect on the yield from lowest of 2258 kg ha−1 for cereal rye to the highest 8315 kg ha−1 for conventional system. There was no difference in watermelon yield in 2011 between crimson clover/rye mix (5211 kg ha−1) and crimson clover (3525 kg ha−1), but the watermelon yield for crimson clover was not statistically different than for cereal rye. The 2011 growing season showed, similar to 2010, that rolling treatment did not have an influence on yield (p value = 0.5017) generating watermelon yield of 5147 kg ha−1 for rolled compared to numerically lower yield of 4508 kg ha−1 for rolled + ZAP treatment with the conventional system having a significantly higher yield of 8315 kg ha−1.
Table 9. Watermelon yield (kg ha−1) with respect to cover crop treatments in 2010 and 2011 growing seasons.
Results from this experiment and previous research indicates that yields in no-till systems using cover crops tend to be lower in the first growing season compared to conventional systems [32].
4. Conclusions
This work presents findings for a vegetable no-till system using cover crops under weather and soil conditions of Alabama and provides guidance for adoption of similar conservation systems in the Southeast. Across three growing seasons, cover crop termination rates by roller/crimper alone were consistently as good as rolling/crimping with supplemental application of organic herbicide Weed ZAP. Termination results indicate that Weed ZAP was ineffective in speeding up the termination process, therefore extra costs incurred for purchasing this organic product and cost of application was added to overall cost of termination without tangible results, therefore is not recommended for cover crop termination. Volumetric soil moisture content for rolled/crimped cover crops was consistently higher compared to the conventional system, indicating that flattened and desiccated cover crop residue provided water conservation. In contrast, in the conventional system, soil was exposed without coverage resulting in lower volumetric soil moisture content. Since this field experiment was focused on a no-till organic system using cover crops, non-tillage operation for plots with planted cover crops, there were many problems encountered in the first year of experiment (2009 growing season). In 2010 and 2011, yields for cantaloupe, okra, and watermelons were consistently higher for the conventional system compared with the no-till system with cover crops. Previous research indicates that yields in no-till systems using cover crops tend to be lower in the first growing season compared to conventional systems [4]. One reason for reduced cash crop yields may be related to lower N availability to cash crops due to N demands by microbes during decomposition of cover crop residue. Also, increased weed population (due to cultivation limitations) and increased insect populations (due to residual habitat) may have hindered yield potential in the no-till system. This study was conducted on-farm under realistic farm conditions and the results indicate that major fluctuations in yield of cash crops were the result of inadequate weed and insect control from use of less effective organic products than synthetic pesticides. Future studies need to be focused on weed control by generating optimum cover crop residues covering soil surface providing an effective mulch barrier to prevent weed emergence as well as an integrated pest management plan to decrease yield impact of pest insects in these systems.
Author Contributions
T.S.K. and A.J.P. collaborated on experimental conceptualization, experimental investigation, contributing to resources, statistical analysis, and writing—original draft preparation.
Funding
This Conservation Innovation Grant (CIG) on-farm project was conducted with a financial support from the USDA-NRCS, Auburn University and USDA-Agricultural Research Service (ARS), National Soil Dynamics Lab.
Acknowledgments
The authors wish to acknowledge Corey Kichler, agricultural engineer, Trent Morton, biological technician and Kirk Iversen, project administrator for their personal involvement in cover crop termination, treatments application, planting, harvesting of cash crops, and for creative ideas such as insect control and maintaining constant communication with the producer Frank Randle.
Conflicts of Interest
The authors declare no conflict of interest.
References
- Crossland, M.; Fradgley, N.; Henry Creissen, H.; Sally Howlett, S.; Baresel, P.; Finckh, M.; Robbie Girling, R. An online toolbox for cover crops and living mulches. Asp. Appl. Biol. 2015, 129, 1–6, Getting the Most out of Cover Crops. Available online: orgprints.org/29405/1/1%20FRADGLEY.PDF (accessed on 15 October 2019).
- Brady, N.C.; Weil, R.R. The Nature and Properties of Soils, 12th ed.; Prentice-Hall, Inc.: Upper Saddle River, NJ, USA, 1999; p. 881. [Google Scholar]
- Reiter, M.S.; Reeves, D.W.; Burmester, C.H.; Torbert, H.A. Cotton nitrogen management in a high-residue conservation system: Cover crop fertilization. Soil Sci. Soc. Am. J. 2008, 72, 1321–1329. [Google Scholar] [CrossRef]
- Bowen, G.; Shirley, C.; Cramer, C. Managing Cover Crops Profitably, 3rd ed.; Sustainable Agriculture Network Handbook Series, Book 9; National Agricultural Library: Beltsville, MD, USA, 2012; p. 244. [Google Scholar]
- Kornecki, T.S.; Price, A.J.; Balkcom, K.S. Cotton population and yield following different cover crops termination practices in an Alabama no-till system. J. Cotton Sci. 2015, 19, 375–386. [Google Scholar]
- Hargrove, W.L.; Frye, W.W. The need for legume cover crops in conservation tillage production. In The Role of Legumes in Conservation Tillage Systems; Power, J.F., Ed.; Soil Conservation Society of America: Ankeny, IA, USA, 1987; pp. 1–5. [Google Scholar]
- Hubbell, D.H.; Sartain, J.B. Legumes—A Possible Alternative to Fertilizer Nitrogen; Florida Cooperative Extension Service Circ. SL-9; University of Florida: Gainesville, FL, USA, 1980. [Google Scholar]
- Kern, J.S.; Johnson, M.G. Conservation tillage impacts on national soils and atmospheric carbon levels. Soil Sci. Soc. Am. J. 1993, 57, 200–210. [Google Scholar] [CrossRef]
- McGregor, K.C.; Mutchler, C.K. Soil loss from conservation tillage for sorghum. Trans. ASAE 1992, 35, 1841–1845. [Google Scholar] [CrossRef]
- Reeves, D.W. Cover crops and rotations. In Advances in Soil Science: Crops Residue Management; Hatfield, J.L., Stewart, B.A., Eds.; Lewis Publ.: Boca Raton, FL, USA, 1994; pp. 125–172. [Google Scholar]
- Raper, R.L.; Reeves, D.W.; Burmester, C.H.; Schwab, E.B. Tillage depth, tillage timing, and cover crop effects on cotton yield, soil strength, and tillage energy requirements. Appl. Eng. Agric. 2000, 16, 379–385. [Google Scholar] [CrossRef]
- Raper, R.L.; Reeves, D.W.; Schwab, E.B.; Burmester, C.H. Reducing soil compaction of Tennessee Valley soils in conservation tillage systems. J. Cotton Sci. 2000, 4, 84–90. [Google Scholar]
- Creamer, N.G.; Bennett, M.A.; Stinner, B.R.; Cardina, J.; Regnier, E.E. Mechanisms of weed suppression in Cover Crop-based production systems. HortScience 1996, 31, 410–413. [Google Scholar] [CrossRef]
- Teasdale, J.R.; Mohler, C.R. The quantitative relationship between weed emergence and the physical properties of mulches. Weed Sci. 2000, 48, 385–392. [Google Scholar] [CrossRef]
- Price, A.J.; Korres, N.; Norsworthy, J.S.; Li, S. Influence of a cereal rye cover crop and conservation tillage on the critical weed free period in cotton. Weed Technol. 2018, 32, 683–690. [Google Scholar] [CrossRef]
- Price, A.J.; Williams, J.; Duzy, L.; McElroy, S.; Guertal, B.; Li, S. Effects of integrated polyethylene and cover crop mulch, conservation tillage, and herbicide application on weed control, yield, and economic returns in watermelon. Weed Technol. 2018, 32, 623–632. [Google Scholar] [CrossRef]
- Barnes, J.P.; Putnam, A.R. Rye residues contribute weed suppression in no-tillage cropping systems. J. Chem. Ecol. 1983, 9, 1045–1057. [Google Scholar] [CrossRef]
- Hoffman, L.M.; Weston, L.A.; Snyder, J.C.; Reginer, E.E. Alleopatic influence of germinating seeds and seedlings of cover crops and weed species. Weed Sci. 1996, 44, 579–584. [Google Scholar] [CrossRef]
- Chan, Y. Increasing Soil Organic Carbon of Agricultural Land; PRIMEFACT New South Wales (NSW) Government, Department of Primary Industries, 2008; p. 735. Available online: http://www.dpi.nsw.gov.au/__data/assets/pdf_file/0003/210756/Increasing-soil-organic-carbon.pdf (accessed on 15 October 2019).
- Ashford, D.L.; Reeves, D.W. Use of a mechanical roller crimper as an alternative kill method for cover crop. Am. J. Altern. Agric. 2003, 18, 37–45. [Google Scholar] [CrossRef]
- Kornecki, T.S.; Price, A.J.; Raper, R.L.; Bergtold, J.S. Effectiveness of different herbicide applicators mounted on a roller/crimper for accelerated rye cover crop termination. Appl. Eng. Agric. 2009, 25, 819–826. [Google Scholar] [CrossRef]
- Price, A.J.; Arriaga, F.J.; Raper, R.L.; Balkcom, K.S.; Kornecki, T.S.; Reeves, D.W. Comparison of mechanical and chemical winter cereal cover crop termination systems and cotton yield in conservation agriculture. Cotton Sci. 2009, 13, 238–245. [Google Scholar]
- Reeves, D.W. A Brazilian model for no-tillage cotton production adapted to the southeastern USA. In Proceedings of the II World Congress on Conservation Agriculture—Producing in Harmony with Nature, Iguassu Falls, Paraná, Brazil, 11–15 August 2003; pp. 372–374. [Google Scholar]
- Kornecki, T.S.; Price, A.J.; Raper, R.L. Performance of Different Roller Designs in Terminating Rye Cover Crop and Reducing Vibration. Appl. Eng. Agric. 2006, 22, 633–641. [Google Scholar] [CrossRef]
- Kornecki, T.S.; Arriaga, F.J.; Price, A.J.; Balkcom, K.S. Effects of different residue management methods on cotton establishment and yield in a no-till system. Appl. Eng. Agric. 2012, 28, 787–794. [Google Scholar] [CrossRef]
- Kornecki, T.S. Multistage Crop Roller. U.S. Patent Number 7,987,917B, 2 August 2011. [Google Scholar]
- Zadoks, J.C.; Chang, T.T.; Konzak, C.F. A decimal code for the growth stages of cereals. Weed Res. 1974, 14, 415–421. [Google Scholar] [CrossRef]
- Kornecki, T.S.; Arriaga, F.J.; Price, A.J. Evaluation of visual and non-visible light active sensors methods to assess termination rates of cover crops. TASABE 2012, 55, 733–741. [Google Scholar] [CrossRef]
- Anonymous. Nutrient Recommendation Tables for Alabama Crops; Agronomy and Soils Departmental Series No. 324; Alabama A&M University: Huntsville, AL, USA, 2012. [Google Scholar]
- Steel, R.G.; Torrie, J.H. Principles and Procedures of Statistics; McGraw: New York, NY, USA, 1960. [Google Scholar]
- SAS. SAS User’s Guide: Statistics. Proprietary Software Release 9; SAS Institute: Cary, NC, USA, 2013. [Google Scholar]
- Johnson, T.J.; Kaspar, T.C.; Kohler, K.A.; Corak, S.J.; Logsdon, S.D. Oat and rye over-seeded into soybean as fall cover crops in the upper Midwest. J. Soil Water Conserv. 1998, 53, 276–279. [Google Scholar]
© 2019 by the authors. Licensee MDPI, Basel, Switzerland. This article is an open access article distributed under the terms and conditions of the Creative Commons Attribution (CC BY) license (http://creativecommons.org/licenses/by/4.0/).