Article

Sensitivity of Maize Yield in Smallholder Systems to Climate Scenarios in Semi-Arid Regions of West Africa: Accounting for Variability in Farm Management Practices

1
Soil and Irrigation Research Centre, School of Agriculture, College of Basic and Applied Science (CBAS), University of Ghana, P.O. Box LG 68, Accra, Ghana
2
CIRAD, UMR AGAP, Bobo-Dioulasso 01, Burkina Faso
3
AGAP, Univ Montpellier, CIRAD, INRA, Montpellier SupAgro, 34000 Montpellier, France
4
International Crops Research Institute for the Semi-arid Tropics (ICRISAT), BP 320 Bamako, Mali
5
Institut National de l’Environnement et de Recherches Agricoles, O4 BP 8645 Ouagadougou, Burkina
6
Centre Regional AGRHYMET, 425 Boulevard de l’Université, BP 11011 Niamey, Niger
7
LPAOSF/ESP, Cheikh Anta Diop University, Dakar-Fann 5085, Senegal
8
Climate Analytics, 10961 Berlin, Germany
9
Goddard Institute for Space Studies, National Aeronautics and Space Administration, 2880 Broadway, New York, NY 10025, USA
10
Center for Climate Systems Research, Columbia University, 2880 Broadway, New York, NY 10025, USA
11
Livestock and Poultry Research Centre, School of Agriculture, CBAS, University of Ghana, P.O. Box LG 68, Accra, Ghana
12
Manobi Africa PLC, Level 2 Max City Bldg., Remy Ollier St., Port-Louis 11602, Mauritius
13
Department of Agricultural and Biological Engineering, University of Florida, Frazier Rogers Hall, Gainesville, FL 32611, USA
14
Department of Soil Science, School of Agriculture, University of Ghana, P.O. Box LG 245 Accra, Ghana
*
Author to whom correspondence should be addressed.
Agronomy 2019, 9(10), 639; https://doi.org/10.3390/agronomy9100639
Submission received: 7 September 2019 / Revised: 1 October 2019 / Accepted: 7 October 2019 / Published: 15 October 2019

Abstract

:
Climate change is estimated to exacerbate existing challenges faced by smallholder farmers in Sub-Sahara Africa. However, limited studies quantify the extent of variation in climate change impact under these systems at the local scale. The Decision Support System for Agro-technological Transfer (DSSAT) was used to quantify variation in climate change impacts on maize yield under current agricultural practices in semi-arid regions of Senegal (Nioro du Rip) and Ghana (Navrongo and Tamale). Multi-benchmark climate models (Mid-Century, 2040–2069 for two Representative Concentration Pathways, RCP4.5 and RCP8.5), and multiple soil and management information from agronomic surveys were used as input for DSSAT. The average impact of climate scenarios on grain yield among farms ranged between −9% and −39% across sites. Substantial variation in climate response exists across farms in the same farming zone with relative standard deviations from 8% to 117% at Nioro du Rip, 13% to 64% in Navrongo and 9% to 37% in Tamale across climate models. Variations in fertilizer application, planting dates and soil types explained the variation in the impact among farms. This study provides insight into the complexities of the impact of climate scenarios on maize yield and the need for better representation of heterogeneous farming systems for optimized outcomes in adaptation and resilience planning in smallholder systems.

1. Introduction

Climate is changing and there is now increasing evidence that suggests that even at low levels of warming (+1.5 °C), agricultural productivity is likely to decline across the globe with the impact being greater in the tropics [1,2,3]. Studies by [4] and [5] reported temperature increases of 1 to 1.5 °C over the last three decades in West Africa. In terms of rainfall, analysis of future projections show that, whereas some areas (western Sahel, e.g., Senegal) will experience decline in annual rainfall by about 15%, other areas (eastern Sahel, e.g., Mali and Niger) will experience increases in rainfall by as much as 20% to 40%. In [6,7], the authors gave historical evidence of shifts in rainfall patterns, with extreme events (i.e., droughts and floods) becoming more frequent, and it is probable that this trend may persist into the future.
Agriculture in West Africa contributes significantly to the gross domestic product (GDP). It is dominated by a large number of smallholder farmers, who cultivate a range of crops, of which maize is one of the major cereal crops [8]. In Ghana, agriculture is predominantly on small-holder bases, rain-fed, depends on nutrient-deficient soils and has high post-harvest losses [8]. With the increasing climate-induced risks, rain-fed agriculture in many regions of Africa including Ghana and Senegal is projected to become further constrained. In other words, climate variability and change is expected to further negatively impact agriculture in most parts of Africa, especially the semi-arid areas [9,10]. Global agricultural production over the last 30 years is estimated to have reduced by 1–5% per decade with the impact being more negative for tropical cereal crops such as maize and rice [11,12]. The impacts of climate change on agriculture may significantly derail the development efforts of ensuring food security and reducing poverty.
Studies by [13] indicated that crop yields in sub-Saharan Africa may decline by 10% by 2055, and this impact is expected to vary over the region [14]. Most climate change impact assessments are done at large scales using crop management information that is usually generic. In [1], the authors projected reductions in cereal yields as a result of 1.5 and 2.0 °C increases in temperature in their assessment of climate change and variability on cereals in West Africa. Similarly, [15] analyzed the climate change impact on maize cropping systems in sub-Saharan Africa and indicated that the extent of impact varied between regions and input levels used. Most of these studies were, however, conducted at coarse scales, which do not capture the particular details at the farm-level. Though there are also other studies on climate change impact assessment conducted at the field scale that capture agro-ecological and soil type differences [16], other important determinants of production, such as variations of planting dates and fertilizer management practices have not been considered. In northern Ghana, for example, planting dates stretch over 3 months, with early planting beginning in May, normal planting in June and late planting in July. With regard to fertilizer use, N application ranges from zero to 60 kg N/ha (Figure 1). This suggests that climate change impact may differ for different categories of farmers.
In [16], the authors analyzed long-term (1965–1993) crop and weather data for locations in Mali and showed that the climate change impact on cotton yield was mainly due to variation in rainfall distribution. The combination of these factors with differences in soil types results in a range of varied conditions under which crop production occurs in a given community. These varied conditions will potentially result in varied yield outcomes but are usually not captured under climate change impact analyses.
The impact of climate change scenarios on West African agriculture has been the subject of research interest in recent times. A field level impact assessment by [17] reported the impact for the southern and northern Guinea savanna zones in the Niger basin. In [18], the authors did a meta-data analysis of future yields based on 16 studies selected from the literature to estimate the impact of climate scenarios on crop yield. Most climate scenario impact analyses on agriculture at different sites, however, do not consider the differences in soil types, as well as soil and crop management practices.
Given that adaptation strategies have to be implemented at the farm level, there is a need to quantify the extent of climate scenario impacts and variability in impact on maize yields among farms, taking into account the differences in soil types and crop management practices. In this study, we conducted a multi-farm level assessment of the impact of climate scenarios on maize among multiple farms within three edaphoclimatic zones in semi-arid West Africa using the Decision Support System for Agro-technological Transfer (DSSAT) [13,19]. Crop models are appropriate assessment tools for climate change scenario impact analysis as they best capture the complexities of plant–soil–atmosphere and management interactions. The agricultural modeling community has developed climate impact assessment protocols [20] and conducted multiple model inter-comparisons to evaluate and demonstrate applications within the Agricultural Model Inter-comparison and Improvement Project (AgMIP) [21,22]. This study seeks to build upon this foundation.

2. Materials and Methods

2.1. Description of Study Area

The study was carried out in three locations in West Africa, namely Nioro du Rip (hence forth referred to as Nioro), Senegal, located at 13.7437° N, 15.7733° W in the Sudan Savannah agro-ecology; Navrongo, Ghana, located at 10.89° N, 1.09° W in the Sudan Savannah agro-ecological zone; and Tamale, Ghana, located at 9.40° N, 0.84° W in the Guinea Savannah agro-ecological zone. The rainfall pattern at the study sites is uni-modal beginning in April/May and ending in September/October. Soils at the sites are coarse-textured and have low fertility, but those at the Nioro du Rip site are deeper than at the Ghana sites (Table 1 and Table 2).
Agriculture in the region is dominated by small-scale farmers who also usually have livestock. There is dependence of the livestock on crop residues, while livestock also produce manure for the crop, though manure application to crops is low due to other competing uses such as domestic fuel. Inorganic fertilizer application to crops is also limited. The farming practices vary widely in terms of soil and crop management.

2.2. Model Description

In this study, we employed the Decision Support System for Agro-technology Transfer (DSSAT) version 4.6.0.18 software [20], which is a process-related mechanistic crop model, to estimate crop yield as a function of weather conditions, soil conditions, cultivar genetic information, and choice of crop management practices. Detailed description of the model can be found in [23,24]. Briefly, however, the model simulates crop growth and development over time, in response to climate factors (radiation, rainfall, temperature), soil factors (e.g., water, organic carbon and nitrogen), and management (fertilizer application, tillage), among others. DSSAT modules include plant development (crop phenology) [24], soil organic matter dynamics using DSSAT/CENTURY [25], and soil water and nutrient balance [26], which enables the assessment of stress effects on growth and yield and leaching of nutrients beyond the root zone. The overall model provides a basis for cropping decision making.
For this study, we used the DSSAT-CERES-Maize component (model v4.6.0.18), which is described by [19].

2.3. Data Sources for Model Calibration

The two maize varieties “Obatanpa” (open pollinated) and TZEEY-SRBC5 (open pollinated) were re-calibrated for the Ghana (Navrongo and Tamale) and Nioro sites respectively. For the Ghana sites, experimental data from the two sites with N fertilization at 120 kg N/ha were used. Observed data include dates to 50% flowering and maturity, grain and biomass yields. For the TZEEY-SRBC5 variety, data collected from Kaduna, Nigeria, with similar edaphoclimatic characteristics as Nioro du Rip, were used. Measured soil data for the experimental sites were used together with measured weather data, as well as cultural practices such as planting date, planting density, time and amount of fertilizer applied. Basal fertilizer was applied at the rate of 40 kg/ha N, P2O5 and K2O at 10 days after emergence and 80 kg N/ha at 36 days after emergence. Crop phenology data and daily weather data over the experimental period were used to estimate genetic coefficients (P1, P5 and PHINT) for the varieties (Table 3). Photoperiod sensitivity was set to zero. The maximum grain numbers were obtained from the literature and expert knowledge [23]. The calibration procedure began with phenology, followed by growth parameters and yield parameters. The ability of the model to reproduce observed data on crop phenology, grain and biomass yield were assessed using root mean square error (RMSE), relative root mean square error (RRMSE) and Willmott d-index.

2.4. Data Sources for Model Evaluation

The DSSAT model used in this study was evaluated for the maize varieties using data from farmer surveys. The farmer survey involved a total number of 68, 87 and 134 farms for Nioro (2007), Navrongo (2012) and Tamale (2014), respectively. Agronomic data from a subset of these farms with observed maize yield were used to evaluate the performance of the model. In Ghana, these subsets of data were from 31 and 47 farmers at Navrongo (2012) and Tamale (2014), respectively, whereas for Nioro, we relied on data of 29 farmers interviewed in 2007. The information recorded included input planting dates, amount and time of fertilizer and manure application and grain yield of maize. The survey results indicated that planting dates ranged from early May to late July at Ghana sites and from June to July in Nioro. About 84% of the farmers applied less than 30 kg N/ha to their fields, which is less than the recommended 60 kg N/ha for the region. Manure application to farms was also very limited. About 63% of the farmers applied less than 100 kg manure/ha to their fields. Only two farmers in the survey applied more than 1000 kg manure/ha. Representative soils for the farming zones surveyed in Nioro were obtained from the soil maps [24] and farmers’ fields were assigned to the farms based on the location of their farms. Soil data used for Navrongo and Tamale were based on measurements. Even though data on crop phenology was not available from the survey, data sources from the literature [25,26] were relied upon as checks of validity. The relevant soil data required as input for the DSSAT model are shown in Table 1 and Table 2.

2.5. Simulation of Historical and Future Climate Impact on Maize Yields in Farming Zones

A 30-year (1980–2009) historical weather data record was obtained from the Ghana Meteorological Agency (GMet) for the locations in Ghana. For Nioro du Rip in Senegal, the historical weather data were sourced from AGRHYMET, Niamey, Niger. Gaps in datasets at each location were filled with AgMERRA [27]. Analysis of the data in Ghana showed that Navrongo had an average daily temperature of 29.80 °C, and a seasonal (June to September) rainfall of 891 mm, and the number of rainfall events was 63 days. For Tamale, the daily temperature was 28.56 °C with seasonal rainfall of 1065 mm, and the number of rainfall events was 68 days. In the case of Nioro du Rip, the average daily temperature was 28.24 °C and seasonal average rainfall was 741 mm, with the average number of rainy days being 46.
For future climate, the projected weather data were produced using protocols developed by AgMIP [21,27]. Growing season temperature and precipitation changes were predicted from 29 General Circulation Models (GCMs). Based on AgMIP protocols, five future climate scenarios were identified to represent relatively Hot/Wet, Hot/Dry, Middle, Cool/Wet and Cool/Dry future climate scenarios (Table 4). Out of the 29 GCMs, those that best describe the scenarios at a given farming zone were identified and used to generate the daily weather sequence for the zone in question [22]. The selection of the appropriate GCM for a given zone also considered the development trajectories of the farming zones, as expressed by the two representative concentration pathways (RCPs) [28]. In this study, as per the AgMIP protocols, two RCPs were selected, namely RCP 4.5 (moderate greenhouse gas emissions) and RCP 8.5 (high greenhouse gas emissions), considering the climate forcing under the current development paths of both Ghana and Senegal, as well as the possible future forcing, as these economies tend to become more fossil fuel based. The atmospheric CO2 concentrations used were 390 ppm for the historical period, 499 ppm for the RCP 4.5 whilst RCP 8.5 was 571 ppm based on the AgMIP protocols [21]. RCP4.5 and RCP8.5 are widely considered as plausible moderate- and high-emission pathways for future emissions. For example, Table 4 shows that the appropriate GCM for the Cool/Wet scenario at Nioro du Rip under RCP 4.5 and 8.5 was GFDL-ESM2M, but for the same climate scenario at Navrongo (Ghana), the appropriate GCM for the same RCPs was CCSM4. In all future climate projections, the reference time selected is 2040–2069, because this represents a mid-century time slice that is appealing, given that it is close enough to the present day that planning needs to begin in order to meet the adaptation needs, but also far enough into the future that the climate change signal more clearly emerges from the noise of climate variability. The length of the time slice is also necessary to capture climatic changes without getting caught up in inter-annual anomalies (the World Meteorological Organization recommends 30-year climate periods as a climate ‘normal’). Further details regarding the projection methodology can be found in [27,29].
The validated DSSAT model was used to simulate maize yields for climate impact analysis. For this, management data from all 68 farmers in Nioro, 87 farmers from Navrongo and 134 farmers in Tamale surveyed earlier (Section 2.3) were used. The soil data in Table 1 and Table 2 were used for the simulations. Soil N and water were initialized in the model 30 days prior to planting each simulation. As farmers planted over a wide time scale, we defined six planting windows, each of a duration of 1 week for Nioro du Rip (which has a shorter growing season), commencing from June 19 to July 31. For the Ghana sites, planting windows were of 2 weeks duration, starting from May 1 to June 30 for Navrongo and April 14 to July 14 for Tamale. Within a given planting window, maize sowing was implemented in the model when 20 mm of rainfall had accumulated over three rainfall events. The automatic planting was used to mimic decisions made by farmers taking into account the inter-annual variability at the start of the rainy season. The planting density of 4 plants per m2 was used for all sites.

2.6. Model Evaluation

The model evaluation of the harvested yield was based on five criteria: mean absolute error (MAE), root mean square error (RMSE), relative root mean square error (RRMSE), Nash–Sutcliffe model efficiency (NSE) and the Willmott d-index.
The mean absolute error (MAE) [30] indicates the absolute error associated with the predicted parameter, with a value of 0 indicating a perfect situation. It is defined as:
M A E =   i n | P i O i | n
where Pi = model predicted value, Oi = observed value, i = index of observation, n = number of observations.
The root mean square error (RMSE) [30] indicates the error associated with the predicted outcomes and a value of zero signifies a perfect prediction. It is defined as:
R M S E = [ 1 n   ( P i O i ) 2 ] 0.5
A low RMSE is desirable, as this would signify a better agreement between the predicted and observed data. The minimum value of zero implies a perfect model performance. Relative root mean square is defined as;
R R M S E = R M S E O ¯ × 100
where O ¯ = the mean of observed values.
The Nash–Sutcliffe model efficiency (NSE) [31] indicates the goodness of fit for the model. A perfect agreement between predicted and observed is signified by EF = 1. It is defined as:
N S E =   1 i = 1 n ( O i P i ) 2 i = 1 n ( O i   O ¯ ) 2
The Willmott’s d index [32] is defined as:
d = 1   i = 1 n ( P i O i ) 2 i = 1 n ( | P i O ¯ | + | O i O ¯ | ) 2
The Willmott d-value ranges from 0 to 1. A value of 1 signifies a perfect prediction of observed data.

2.7. Assessment of Impact of Climate Scenarios

The assessment of the impact of climate scenarios on maize yields was based on the output from DSSAT CERES-Maize model simulations for the historical period 1980–2009 and for mid-century climate scenarios (2040–2069) at each farming site, as per AgMIP protocols. Apart from maize yields, we also analyzed the impact of future climate scenarios on nitrogen fertilizer leaching and the effect of water stress on photosynthesis, all of which are important determinants of yield and are additional outputs of the DSSAT model. Using the historical simulated results as the baseline, we determined the percent change in maize yield under each climate scenario. In Nioro, the model was used to simulate the yield for each of the 87 farms for the historical period. This generated a total 30 (years) × 87 (farms), making a total of 2160 yield observations for the Nioro historical period. The same procedure was repeated for each of the five climate scenarios and the two RCPs. A 30-year mean yield ( X i ¯ ) was determined for each farm under both the historical and future climate conditions (five climate scenarios × two RCPs). Differences between the historical mean yield and those for the future climate were then determined for each farm. These differences were normalised by the historical mean yield to obtain a relative percentage change for the farm in question designated as dijk, where i is the farmer number, j refers to the climate scenario and k refers to the RCP (i = 87, j = 5 and k = 2). The relative percentage change, dijk, was determined as;
d i j k   ( % ) = 100 × ( F u t u r e   X ¯ i j k   H i s t o r i c a l   X ¯ i   H i s t o r i c a l   X ¯ i ) .  
The grand mean of dijk (across farms) is designated Δjk;
Δ j k =   i = 1 n d i j k N
where N = number of farms.
This procedure was repeated for the other two locations (Navrongo and Tamale), taking into account their respective number of farms. Each Δjk represents the overall impact of the climate scenarios on maize yield at a location for the various climate scenarios and RCPs (for the five climate scenarios and two RCPs; there are five Δs per RCP).
We employed the coefficient of variation (CV), to assess the variability of grain yields among farms for both the historical and future climate conditions. Let the grand mean yield across farms be designated GMjk;
G M j k = i = 1 n X ¯ i j k N
Then the CV is defined as:
C V =   S t d e v   o f   G M i j k G M j k ×   100
The relative standard deviation (RSD) was used to determine the variability in relative impact of climate scenarios among farms. The RSD was used to illustrate variability or dispersion from the mean because the mean impacts of climate scenarios are negative, implying CV values will be negative. The RSD is defined as:
R S D =   s t d e v   o f   d i j k | Δ j k | × 100
where stdev is the standard deviation of yields or the impact of climate scenarios under each climate scenario/historical climate, and Δjk is the grand mean of yields across all farms under each climate scenario/historical climate.
To understand contributions of the soil type, fertilizer and planting date to the variability in impact of climate scenarios, data on dijk were first sorted according to the various soil types and the mean for each soil type was determined. The grand mean of the impact under climate scenarios among soil types and standard deviations were then used to determine the CV of the impact of climate scenarios on soil types. The procedure was repeated for fertilizer levels and planting dates. To determine the importance of the various management practices in influencing the magnitude of the impact of climate scenarios among farms, an analysis of variance (ANOVA) with three factors (soil × planting window × fertilizer rate) was carried out for each site using GENSTAT 12th Edition.

3. Results

3.1. Projected Changes in Future Climate

Table 5 summarizes projected changes in mean daily temperature, total rainfall amounts and events over the growing season under the two RCPs and the five climate scenarios. At Nioro du Rip, the average daily historical (1980–2009) temperature over the growing season was 28.24 °C, which was projected to increase by 0.99 °C to 1.75 °C under RCP 4.5 and from 1.3 °C to 2.61 °C under RCP 8.5 by 2040–2069. The historical mean annual rainfall of 741 mm was projected to reduce by 2 to 32% across both RCPs except under the “Wet” scenarios. The “Wet” scenarios projected changes in rainfall by −2 to 7% across RCPs. The number of rainy days was also projected to change from −6 to −40%, except for the “Wet” scenarios that projected no change in number of rainfall events to increases up to 5% under both RCPs.
The average daily temperature for Navrongo during the growing season was 29.08 °C with a rainfall of 891 mm. Future projections predicted temperatures increases of between 1.14 °C to 1.87 °C under RCP 4.5 and 1.72 °C to 2.72 °C for RCP 8.5 (Table 5). Future rainfall was projected to be higher than the historical values except for the two dry scenarios in both RCPs, where no change to a slight decline in rainfall amount are expected. The Cool/Wet scenario predicted the wettest climates with 7% and 12% more rainfall than historical conditions under RCPs 4.5 and 8.5, respectively. The number of rainy days generally reduced for both RCPs (from −1 to −13%), with the exception of the Cool/Wet scenario, which projected increased rainfall events of 2% and 4% for RCP 4.5 and 8.5, respectively.
The average daily temperature of historical weather data at Tamale was slightly lower (28.56 °C) than that experienced in Navrongo during the growing season and the in-season rainfall amount was 1065 mm. The average number of rainy days recorded under the historical conditions was 68. Higher temperatures were predicted by all GCMs under both RCPs compared to the historical climate. Temperature increases ranged from 1.06 °C to 1.96 °C under RCP 4.5 and 1.72 °C to 2.81 °C under RCP 8.5 (Table 5). The wet scenarios and middle scenarios of both RCPs projected increased rainfall amounts of between 2% and 6%. The number of rainy days however reduced by 3 to 12 days for the wet and dry scenarios, while the middle scenario showed no change in number of rainy days.

3.2. Model Calibration

The TZEEY-SRBC5 calibration showed that anthesis and physiological maturity were well simulated with a RMSE of 1.6 and 3.1 days and a RRMSE of 3 and 4%, respectively. Grain yield was simulated with a RMSE of 273 kg/ha, a RRMSE of 6% and a Wilmott d-index of 0.89. Total biomass calibrated with a RMSE of 360 kg/ha, a RRMSE of 4% and a Wilmott d-index of 0.89. The Obatanpa calibration showed that anthesis and physiological maturity were both well simulated with a RMSE of 2.3 and 3.6 days and a RRMSE of 4 and 3.5%, respectively. Grain yield was calibrated with a RMSE, RRMSE and Wilmott d-index of 254 kg/ha, 7%, and 0.88, respectively, while that for biomass was well calibrated with a RMSE, RRMSE and Wilmott d-index of 311 kg/ha, 7%, and 0.88, respectively.

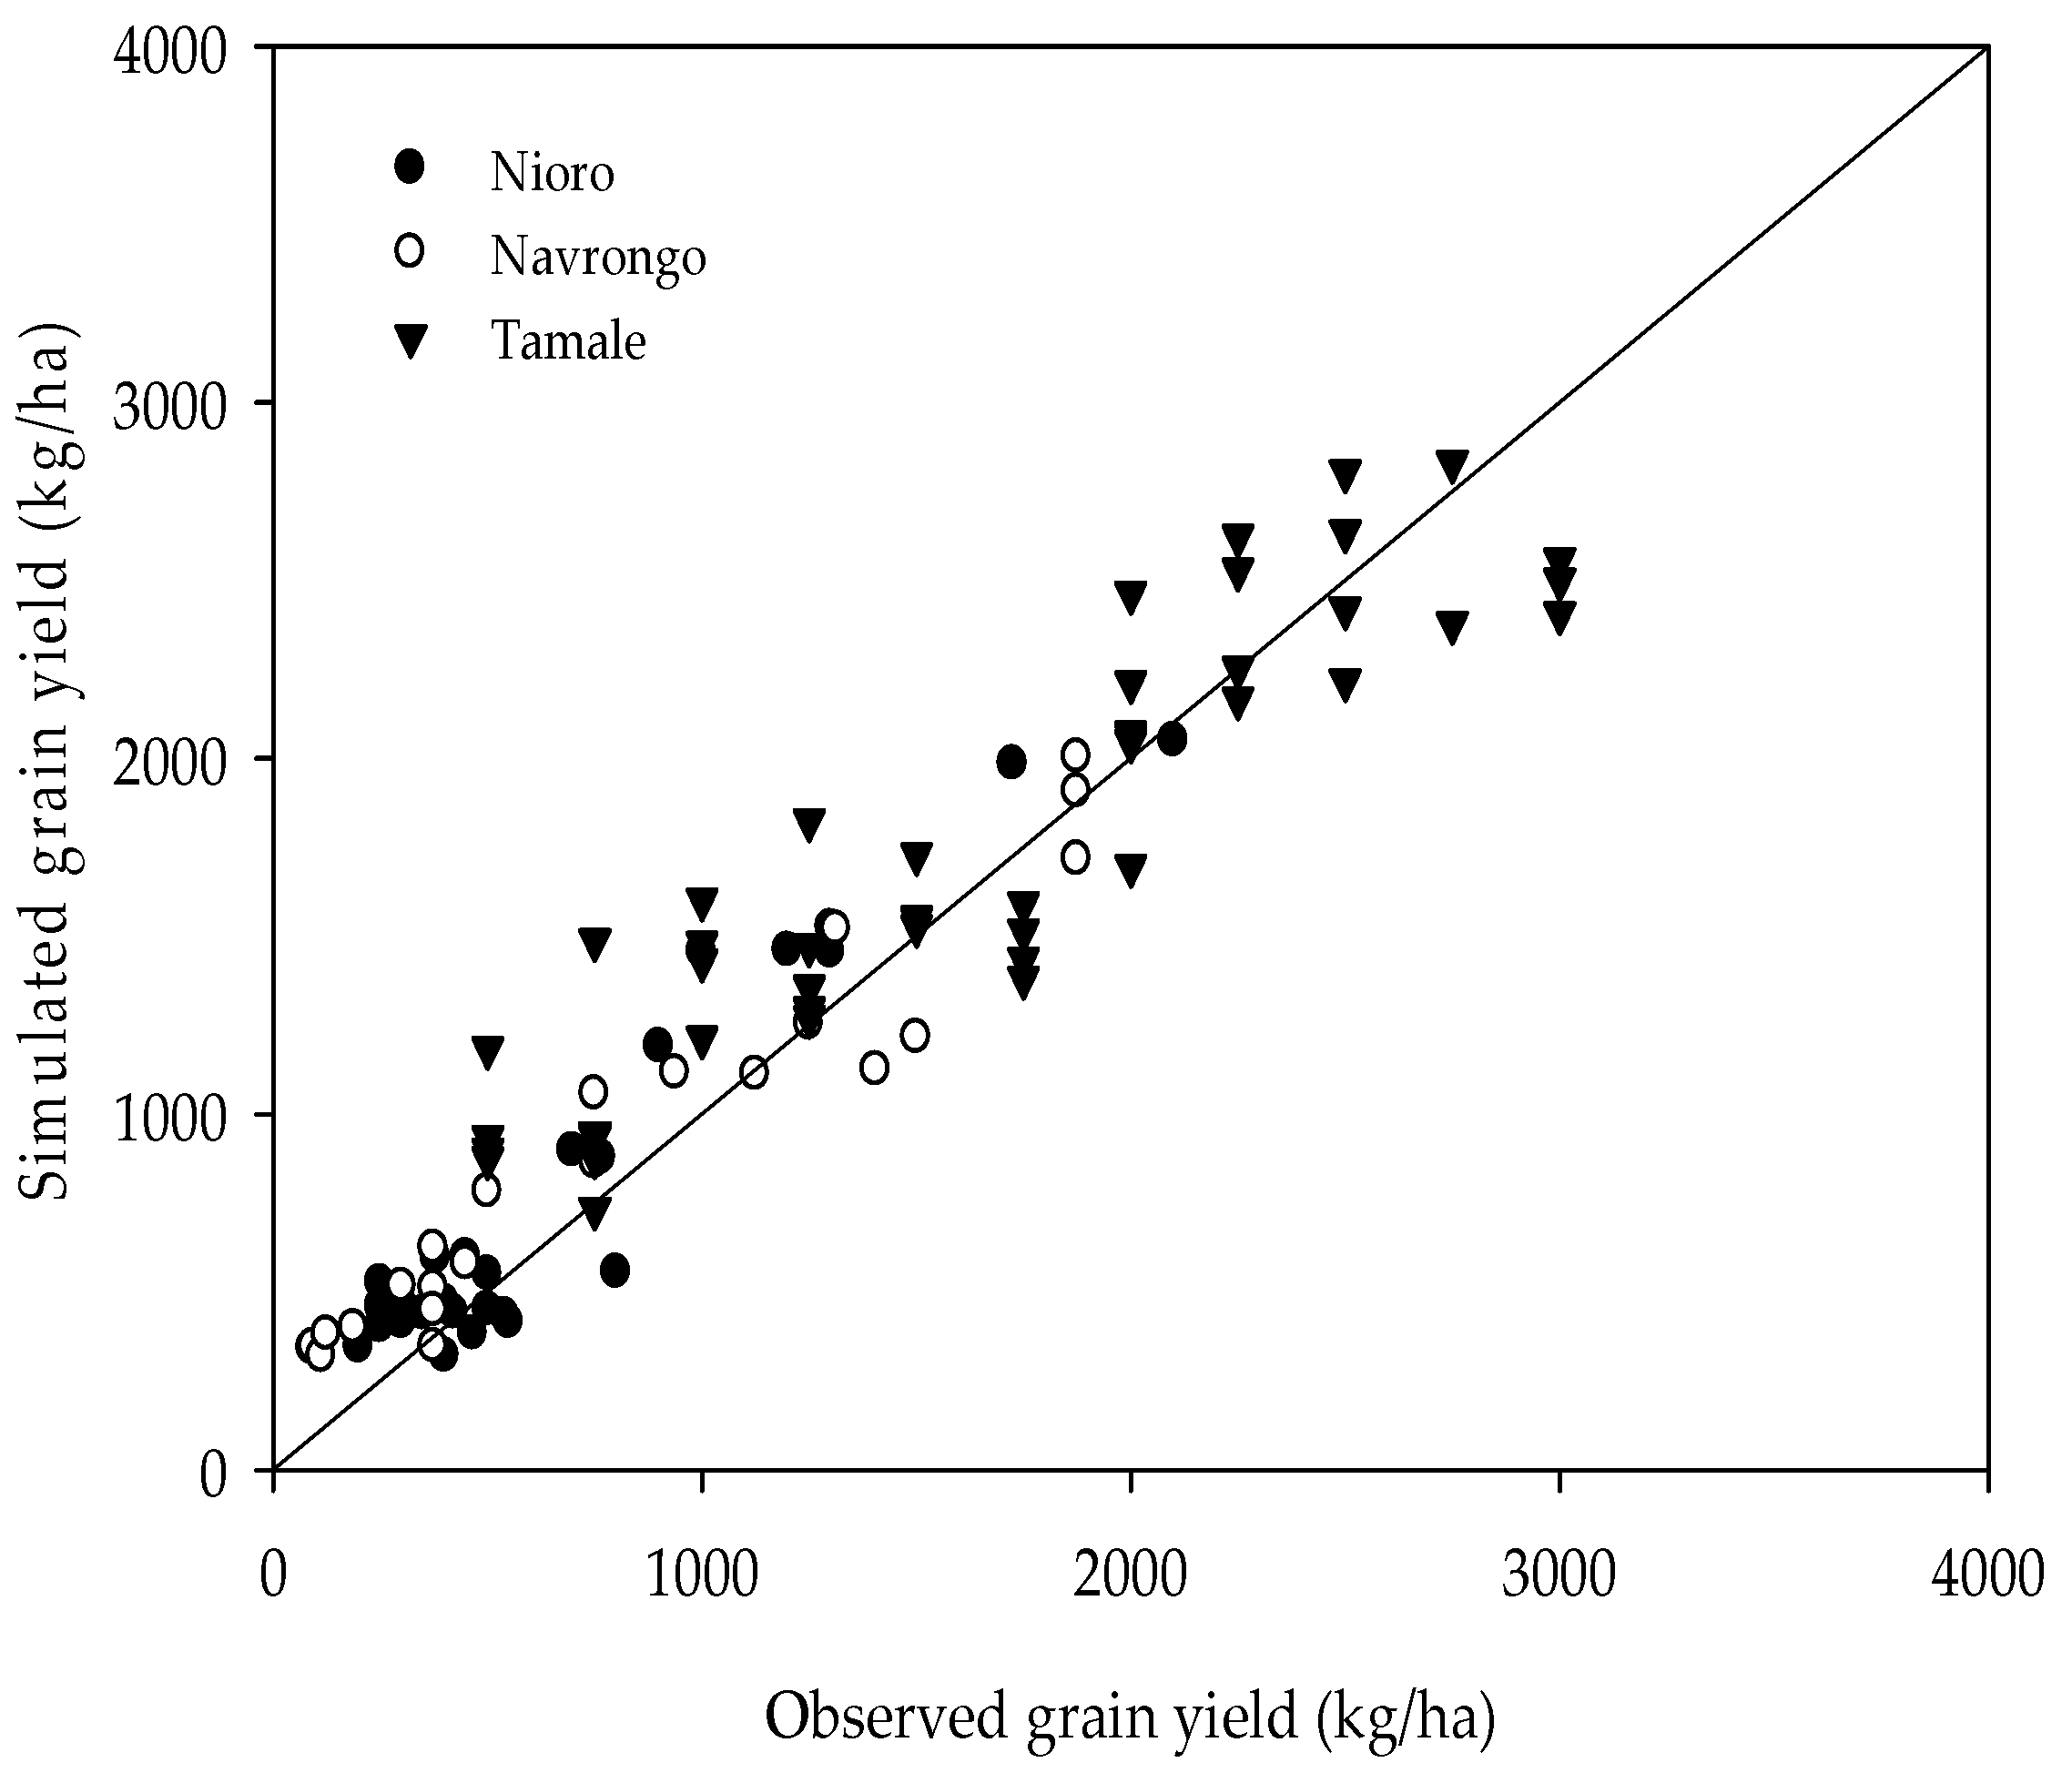
3.3. Model Evaluation

Anthesis of the cultivars were reasonably simulated with a RMSE of between 2.1 to 4.0 days, a RRMSE of between 3% to 7% and a MAE of between 1.5 to 3.4 days across sites (Table 6). Similar to anthesis, duration to maturity was also adequately simulated with a RMSE of 3 to 5 days, a RRMSE of between 3% and 5% and a MAE of between 1.1 to 4.6 days.
Grain yield was reasonably simulated with a RMSE of 183 kg/ha, RRMSE of 28%, NSE of 0.84 and Willmott’s d-index of 0.96 for Nioro (Table 6; see also Figure 2). On the other hand, a RMSE of 193 kg/ha, RRMSE of 23%, NSE of 0.89 and Willmott’s d-index of 0.97 were obtained for the Navrongo site using the 2012 survey information. For the Tamale site, RMSE, RRMSE, NSE and Willmott’s d-index were 324 kg/ha, 20%, 0.81 and 0.94 respectively based on the 2014 survey year.

3.4. Simulated Maize Yields under Historical and Future Climate Scenarios

In Nioro, simulated historical maize yields ranged from 208 to 3176 kg/ha with an average yield of 934 kg/ha. The variability in the yields was high (CV = 79%) among farms. Simulated mean grain yields under the future climate varied with scenario, ranging from 682 (Hot/Wet) to 853 (Cool/Wet) kg/ha under RCP 4.5 and from 553 (Hot/Dry), and to 828 kg/ha (Middle) under RCP 8.5. The variability in simulated yields under climate scenarios were also high (67–79% under RCP 4.5 and 60–79% under 8.5), with the highest variability in yields occurring under the wet scenarios.
The simulated maize grain yield at Navrongo under historical conditions ranged from 331 to 3377 kg/ha among farms with an average yield of 1212 kg/ha. Variability of grain yields among farms was 55%. Under future climate scenarios with RCP 4.5, simulated mean maize yields were lower compared to those under historical climate ranging from 997 kg/ha under the Hot/Wet climate scenario to 1107 kg/ha under the Cool/Wet scenario. Under RCP 8.5, simulated average grain yields ranged from 926 kg/ha under the Middle scenario to 1028 under the Cool/Wet scenario. Variability in maize yield among farmers for the various scenarios ranged from 53% to 56% under RCP 4.5 and from 51% to 56% under RCP 8.5.
Simulated historical yields at Tamale ranged from 575 to 3044 kg/ha with a mean yield of 1876 kg/ha. Variability in yields was 32% among farms. Under future climate scenarios with RCP 4.5, yields ranged from 1424 under Hot/Wet to 1679 kg/ha under Cool/Wet scenarios. Under climate scenarios with RCP 8.5, the simulated yields ranged from 1182 (Hot/Wet) to 1516 kg/ha (Middle). Variability in maize yield among farmers for the various scenarios ranged from 29% to 31% under RCP 4.5 and from 26% to 30% under RCP 8.5. Across the three locations, variability in yields were generally marginally higher under a historical climate than under the climate scenarios across all three locations (Table 7). The magnitude of the variability in yields were in the order; Nioro > Navrongo > Tamale.

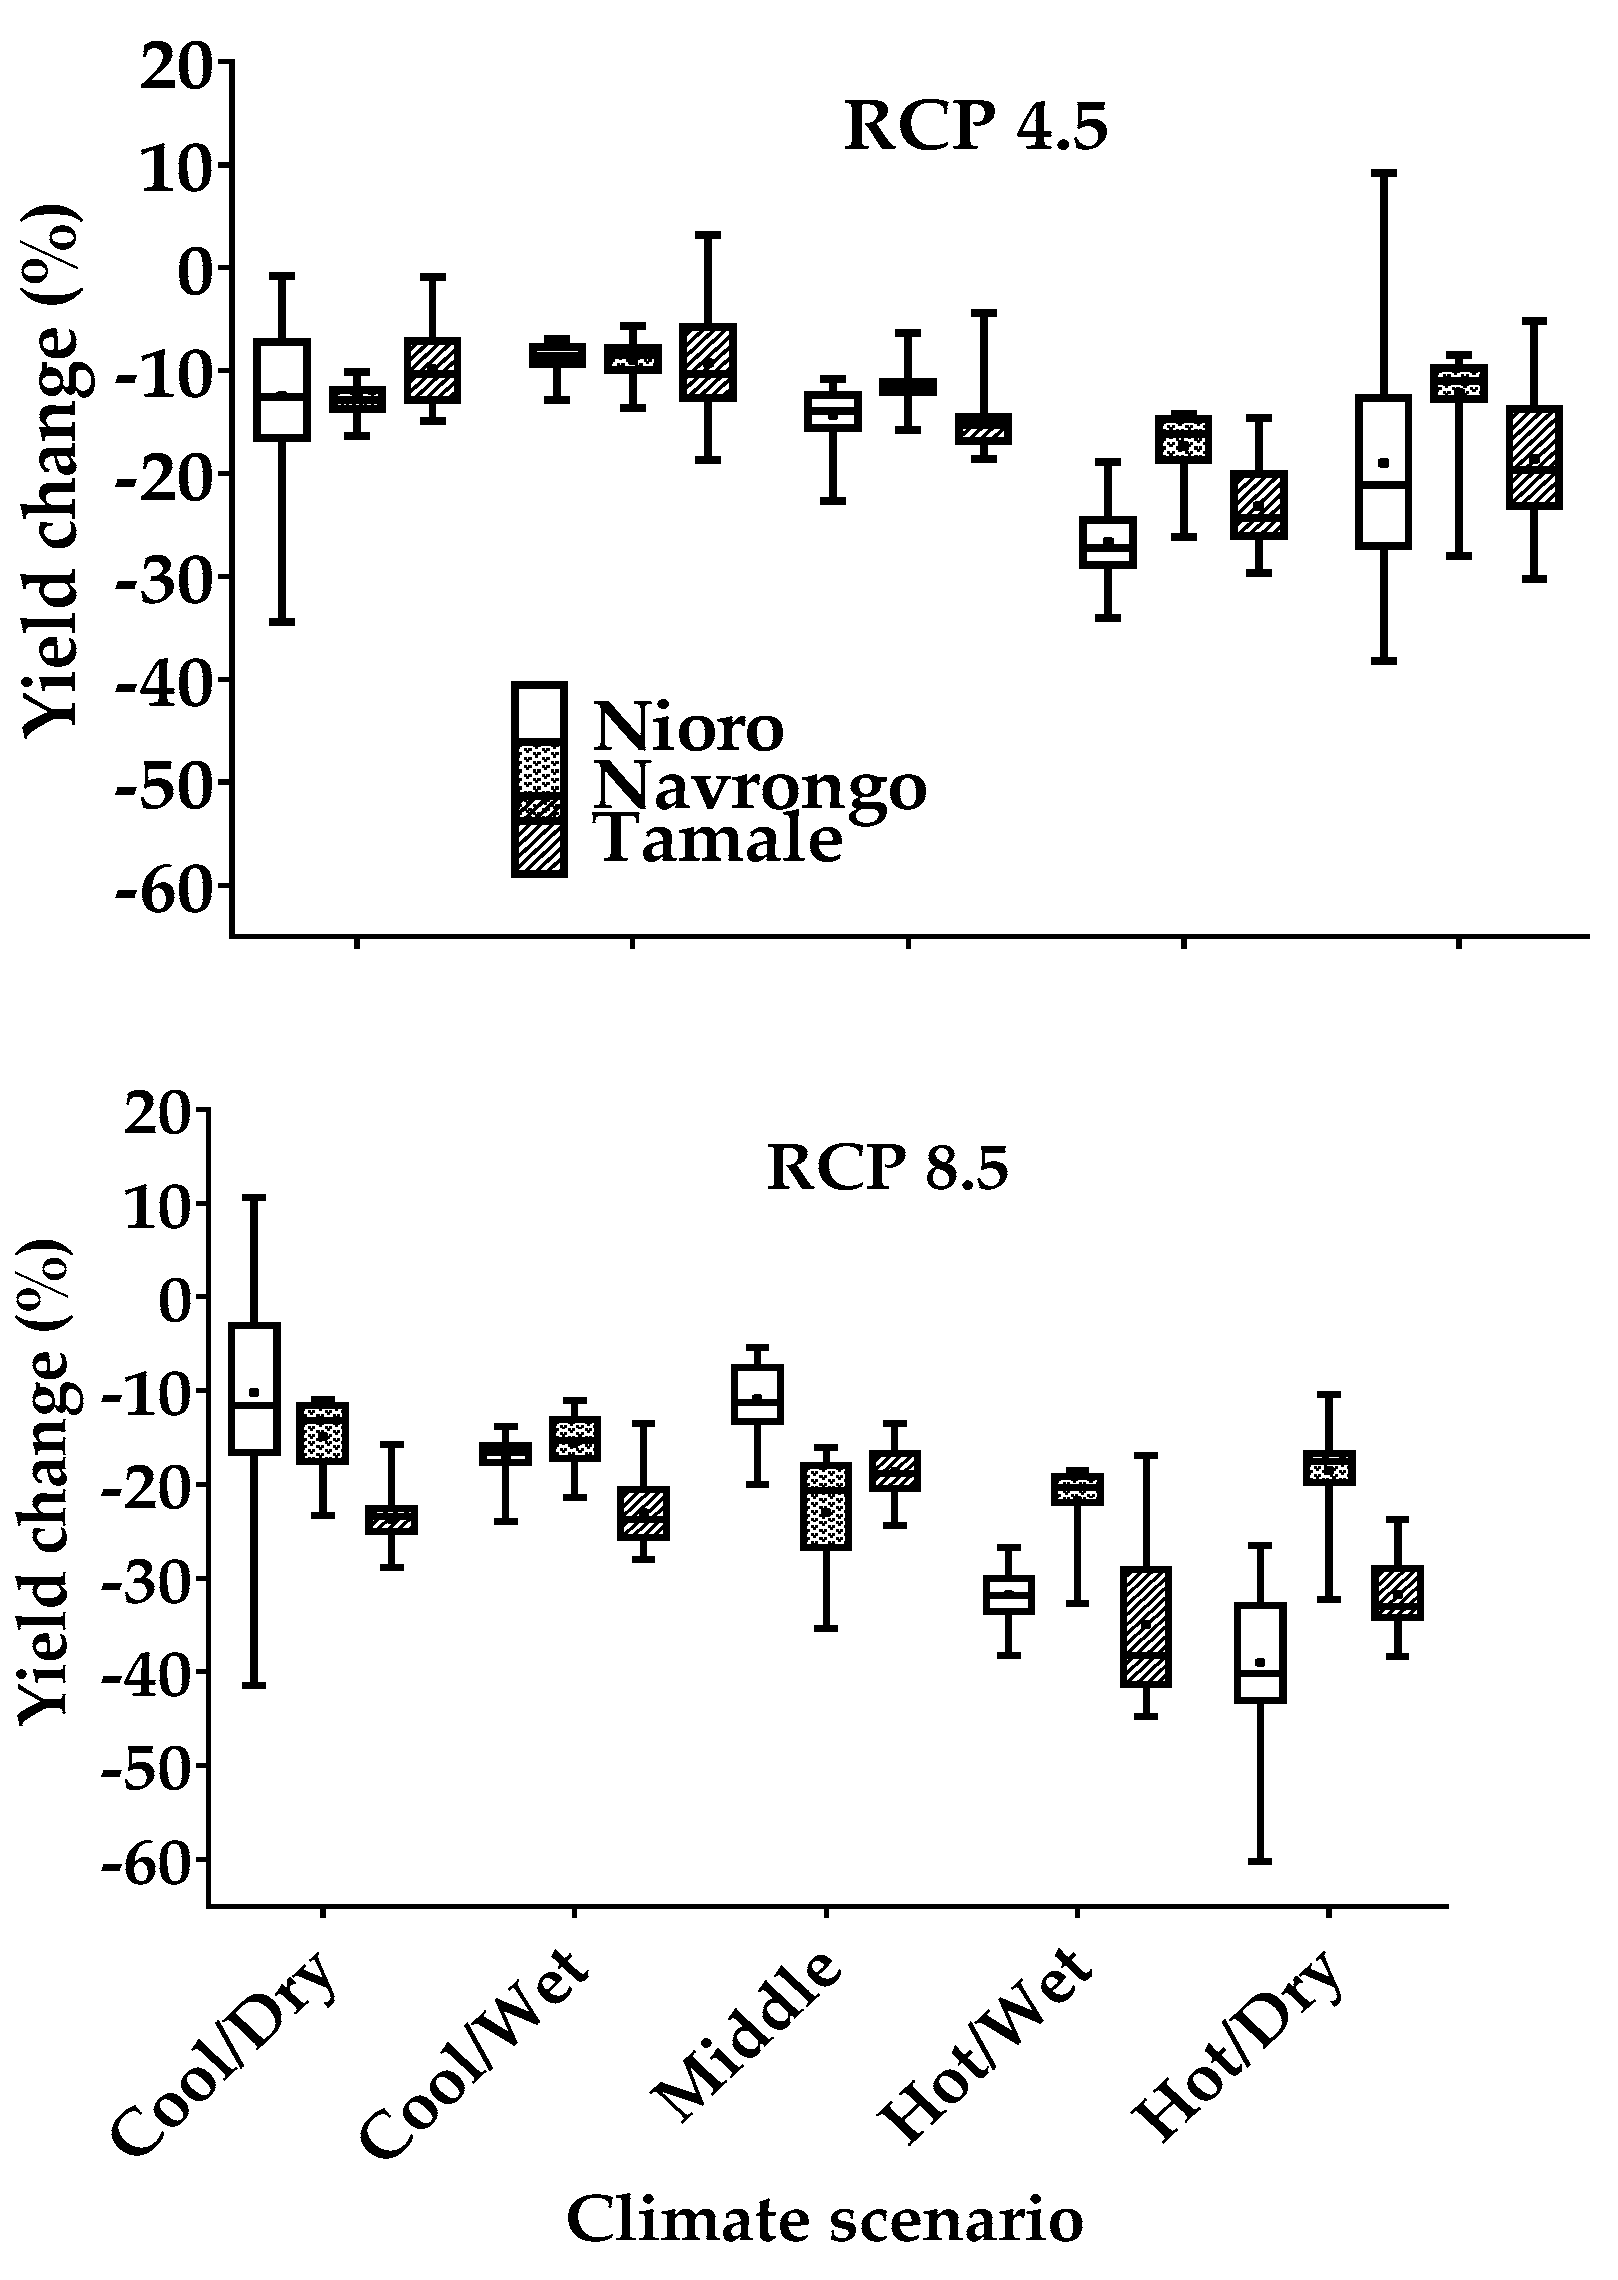
3.5. Impact of Climate Change Scenarios on Maize Yields

The relative mean impact of climate change scenarios on maize yields at the various locations is summarized in Table 7. Under future climate scenarios at Nioro, mean maize yield reduction ranged from 9% to 27% under RCP 4.5 and from 10% to 39% under RCP 8.5 (Figure 3, Table 7). The two hot scenarios, under the two RCPs consistently caused the largest grain yield reduction. As in Nioro, simulated maize yields in Navrongo, under future climate scenarios (RCP 4.5), were lower compared to those under a historical climate with the highest reductions being 17% under the Hot/Wet scenario and the least being 9% under Cool/Wet scenario. Under RCP 8.5, the simulated yields highest yield reduction of 23% was under the Middle scenario, while the Cool/Dry scenario yielded the lowest mean yield reduction of 15%.
In Tamale, simulated maize yields under future climate scenarios with RCP 4.5 were reduced below historical yields, ranging from a mean of 23% under the Hot/Wet scenario to 9% under the Cool/Wet scenario. Under RCP 8.5, mean yield reductions ranged from 35% with Hot/Wet scenario to 19% with the Middle scenario. Thus, the Hot/Wet scenarios produced the highest mean yield reductions under both RCPs. The magnitude of the mean impact of climate change scenarios on grain yield was consistently higher under RCP 8.5 than under RCP 4.5 across the three locations. Generally, climate scenarios with the highest temperatures resulted in the highest yield decline. The magnitude of mean yield losses was in the order Nioro > Tamale > Navrongo.
The sensitivity analysis showed that simulated cumulative N leaching increased with rainfall at all three sites (figure not shown). The more it rained, the more N was leached. Though this is logical, we lack validation of simulated N leaching using DSSAT. On the other hand, the effect of water stress on photosynthesis (Figure 4) varied among the scenarios with the Hot/Wet scenario showing higher stress levels, particularly for the Nioro and Navrongo sites, which was more prominent under future climate than under historical conditions. For the Tamale site, except for the periods between 30 to 40 days after planting, the Cool/Wet scenario caused the highest water stress effect on photosynthesis.

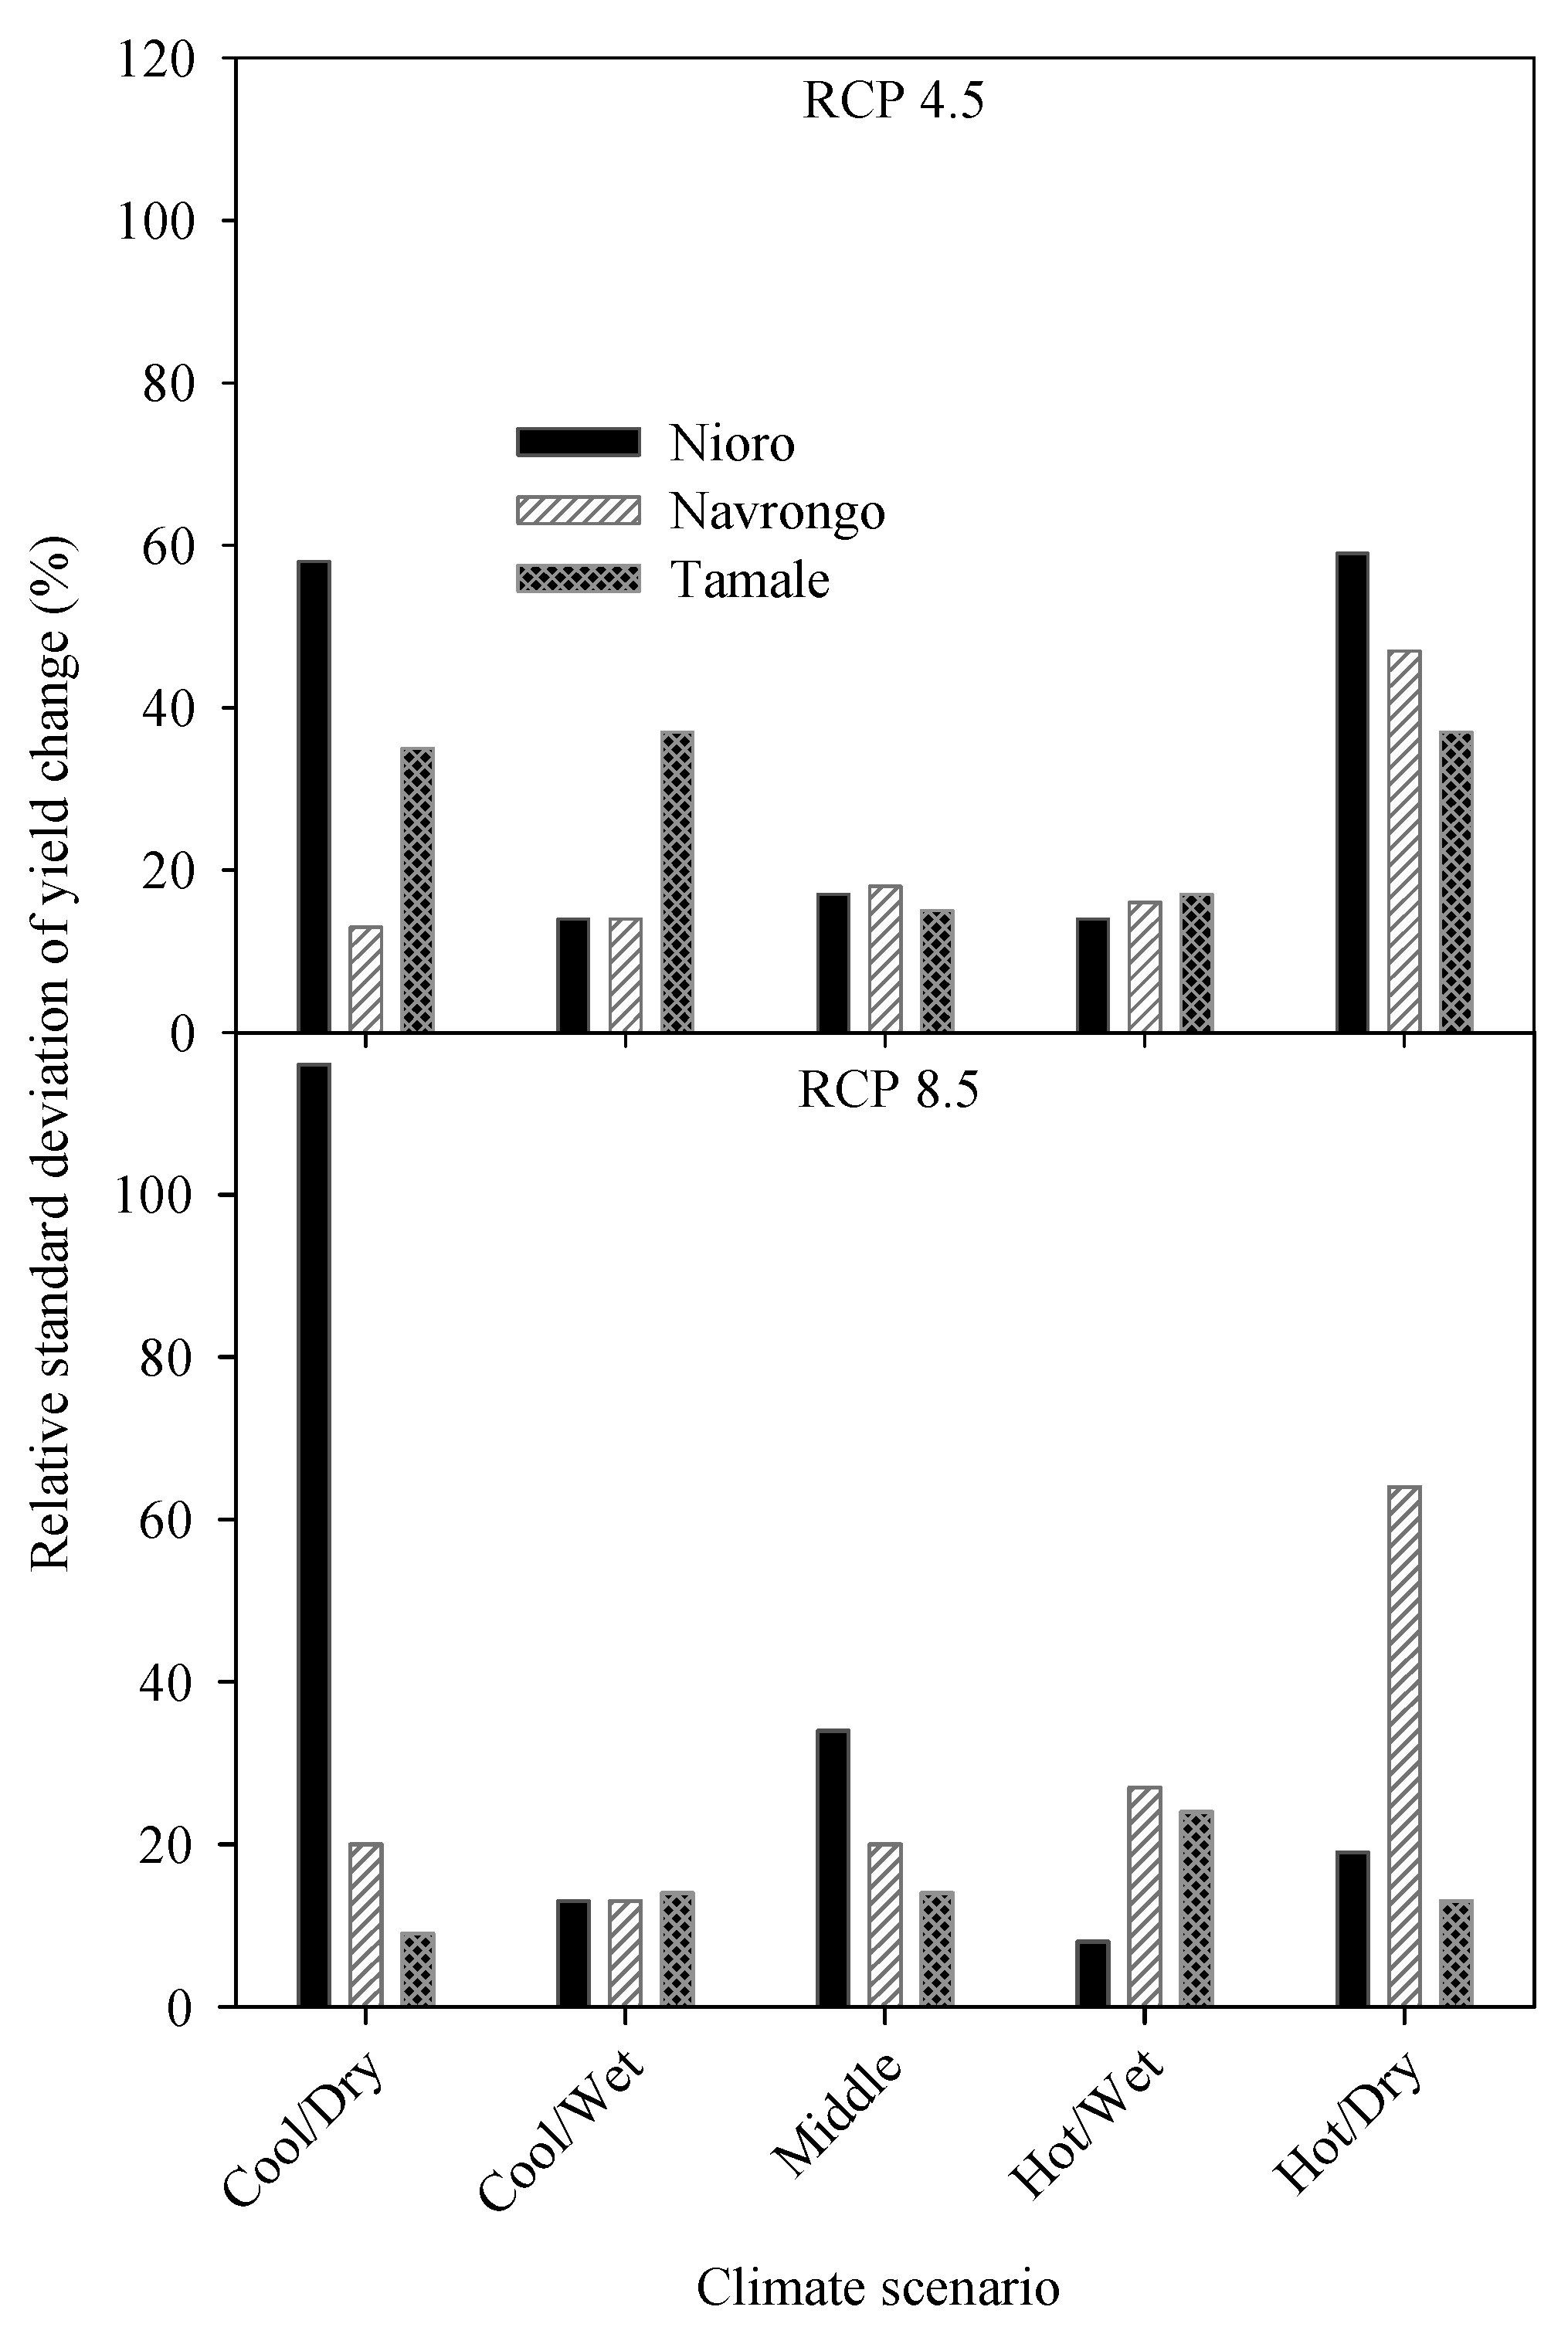
3.6. Variability in the Impact of Climate Change on Maize Yields among Farmers under Future Climate Scenarios

The relative standard deviation in the percentage change in grain yield among farms in Nioro ranged from 14% to 59% under RCP 4.5 and between 8% and 116% under RCP 8.5 (Figure 5). In Navrongo, it ranged between 13% and 47% under RCP 4.5 and from 13% to 64% under RCP 8.5. In Tamale, the relative standard deviation in the percentage change in grain yield ranged from 15% to 37% under RCP 4.5 and from 9% to 24% under RCP 8.5. The extent of dispersion in percentage change in grain yield also differed among climate scenarios and RCPs at all sites. There was no consistent trend in the relative standard deviation of the impact of climate scenarios on grain yields among farms (Figure 5). While the percentage change in grain yield among farms in Navrongo was generally higher under RCP 8.5 than RCP 4.5, the same cannot be said for the Nioro and Tamale sites. Variation in the impact of climate scenarios was generally highest in Nioro compared to the other two sites.

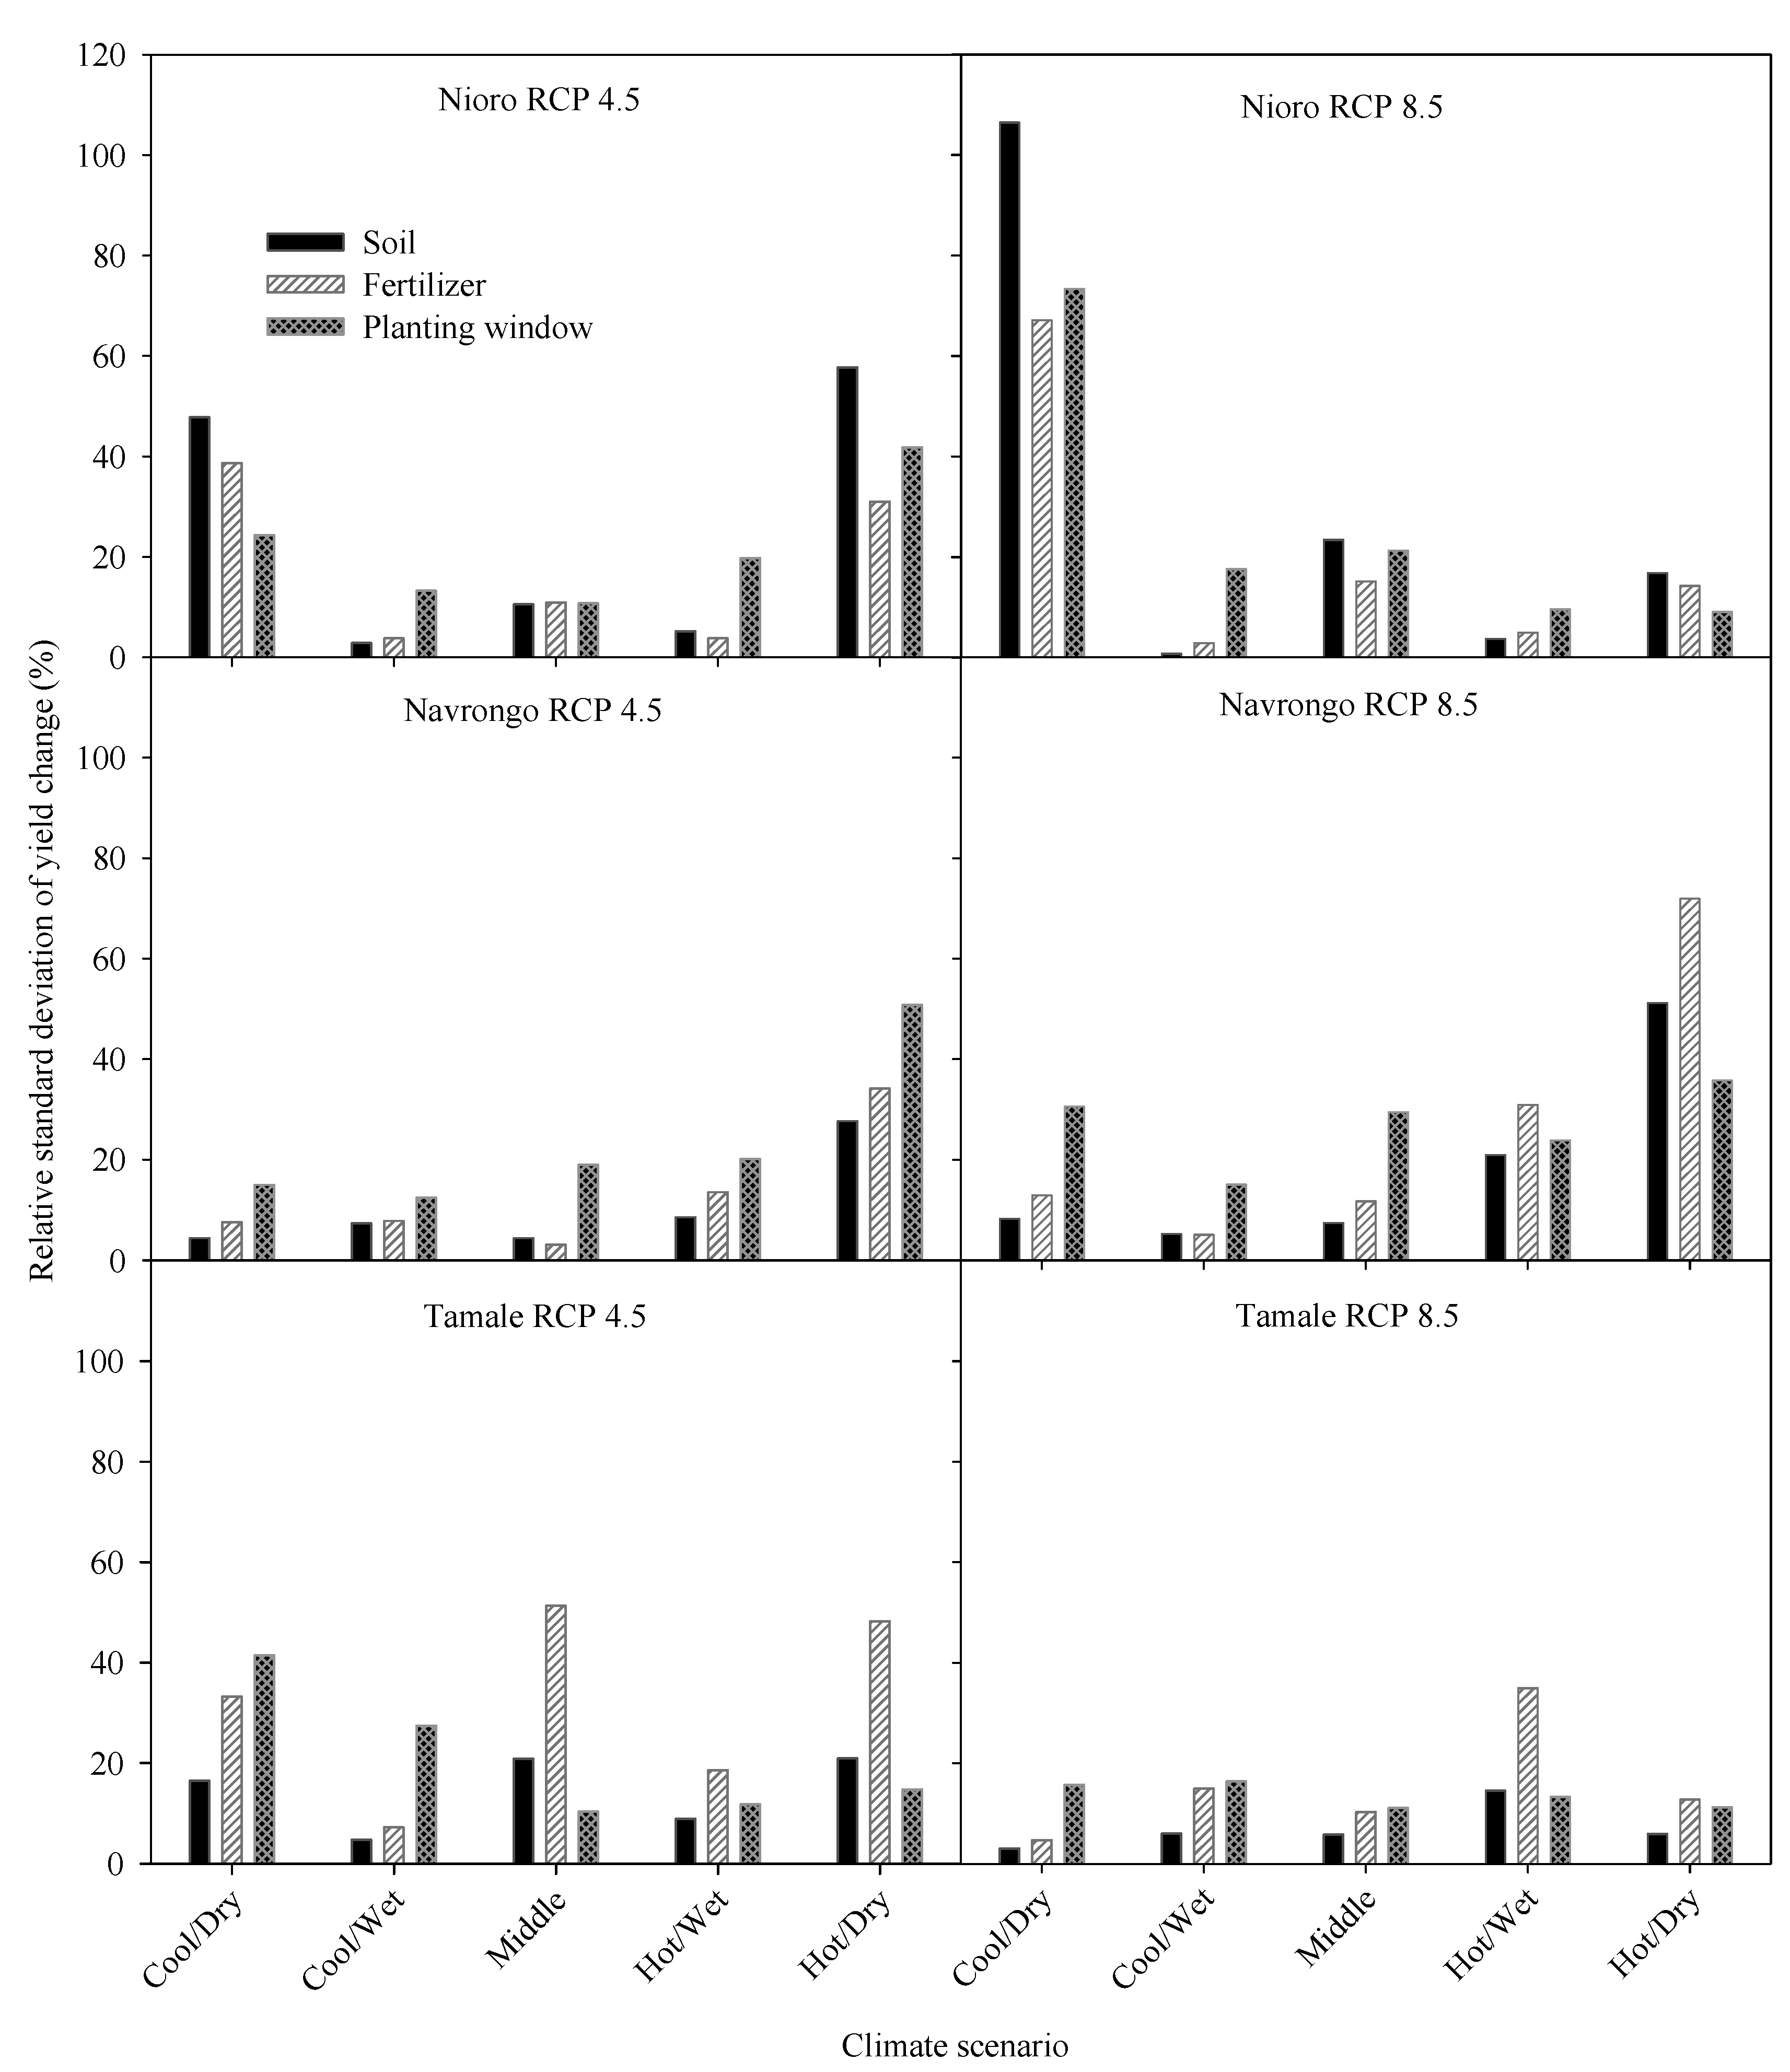
3.7. Effects of Soil Type and Management Practices on the Variation in Yield Lose among Farms

Analysis of variance revealed that the sole effects of fertilizer, planting window and soil type significantly impacted the variability in climate change impact on grain yield among farms under all climate scenarios at Nioro and Navrongo, but for Tamale, these factors were only significant under a few climate scenarios. Additionally, there were significant interactions for soil × fertilizer, soil × planting window and fertilizer × planting window at Nioro du Rip and Navrongo, while at Tamale, there were no significant interactions among these factors. The factor contributing most to the dispersion in the impact of climate scenarios was not consistent across sites. In Nioro, soil type contributed most to the relative standard deviation in climate change impact under the Hot/Dry scenarios under RCP 4.5 and under the Cool/Dry scenario under RCP 8.5. In the case of Navrongo and Tamale, the planting window contributed most to the RSD in climate change impact among farms under most of the climate scenarios. The magnitude of the RSD of the management factors were generally higher in Nioro than the other two sites. The extent to which these factors influenced grain yield change under climate change varied among the climate scenarios and also across sites. While the Hot/Wet climate scenarios under both RCPs produced the highest RSD among farms in Nioro, the trend was different for the other two sites.

4. Discussion

4.1. Variations in the Impact of Climate Scenarios among Farms

All climate change scenarios were consistent on the direction of change in temperatures projected for the mid-century. Average temperature increases were projected to range from 0.99 °C to 2.81 °C over the three study locations across RCPs. Generally higher temperature increases are projected for Tamale in the Guinea Savannah agro ecology compared to Nioro and Navrongo, both in the Sudan Savannah agro ecology of Senegal and Ghana, respectively. Most of the projections per RCP fall within the range of 1.5 °C and 2.0 °C, which was the acceptable range agreed on by governments that are signatory to the Paris Agreement. Hence, the output from most of the GCMs used in this study provides information that can contribute to the analysis of food security implications of the Paris Agreement. The climate scenarios did not agree on the direction of change of rainfall. Some scenarios indicated decreased total rainfall amounts, while others indicated increased rainfall amounts, similar to the case reported by [33]. Increasing trends in total annual rainfall were also reported by [34] when they analyzed rainfall data for Northern Ghana over the period between 1953 and 2010.

4.2. Impact of Climate Change Scenarios on Maize Yields

In this study, current farm management practices in the farming system were assumed to remain the same in the future. Currently, most crop models do not account for the effects of genetic drifts of cultivars and other biotechnological changes that may occur over long periods of time. Furthermore, the impact of the trajectory of agricultural development, though it can be captured within the concept of representative agricultural pathways (RAPs) [35] and could influence management practices, it cannot be easily simulated. Therefore, we have not attempted to do any such modifications to the cultivar coefficients in the case of long-term simulations, even if we recognize the need to address it. What stood out from this study, however, is that if current practices were effected within future climate context, the average grain yields would decline by 9 to 27% under RCP 4.5 and between 10 and 39% for RCP 8.5 at Nioro. In Navrongo, yield losses would be between 9 to 17% under RCP 4.5 and 15% to 23% for RCP 8.5 across the scenarios. In Tamale, average grain yield reductions among farms would decline by 9 and 23% for the scenarios under RCP 4.5. Under RCP 8.5, average yield reductions ranged between 19 to 35% among the scenarios. The magnitude of reductions in projected grain yield has implications for food security in the region. This will further widen yield gaps over those currently existing in smallholder systems in sub-Saharan Africa.
Reductions in yield would have a negative impact on the livelihoods of large populations of rural folks whose main source of sustenance is farming. Generally, higher yield losses simulated for Nioro compared to the other two sites could partly be attributed to the generally high temperature changes projected coupled with large losses in rainfall amount and frequencies (Table 5). The magnitude of yield losses for the sites in Ghana falls within those reported by [34,36] in similar environments. Work done in southern Mali by [37], using APSIM, reported maize yield reductions of 51 and 57% for RCP 4.5 and 8.5, respectively, by mid-century (2040–2069). In [38], the authors suggested a 17% reduction in maize productivity for Africa with a 1 °C rise in temperature. The magnitude of the projected yield losses are also consistent with a previous study by [39] with yield losses of between 4 and 43% projected for maize across nine GCMs. A wide range of projections in maize yield reduction have been reported for sub-Saharan Africa.

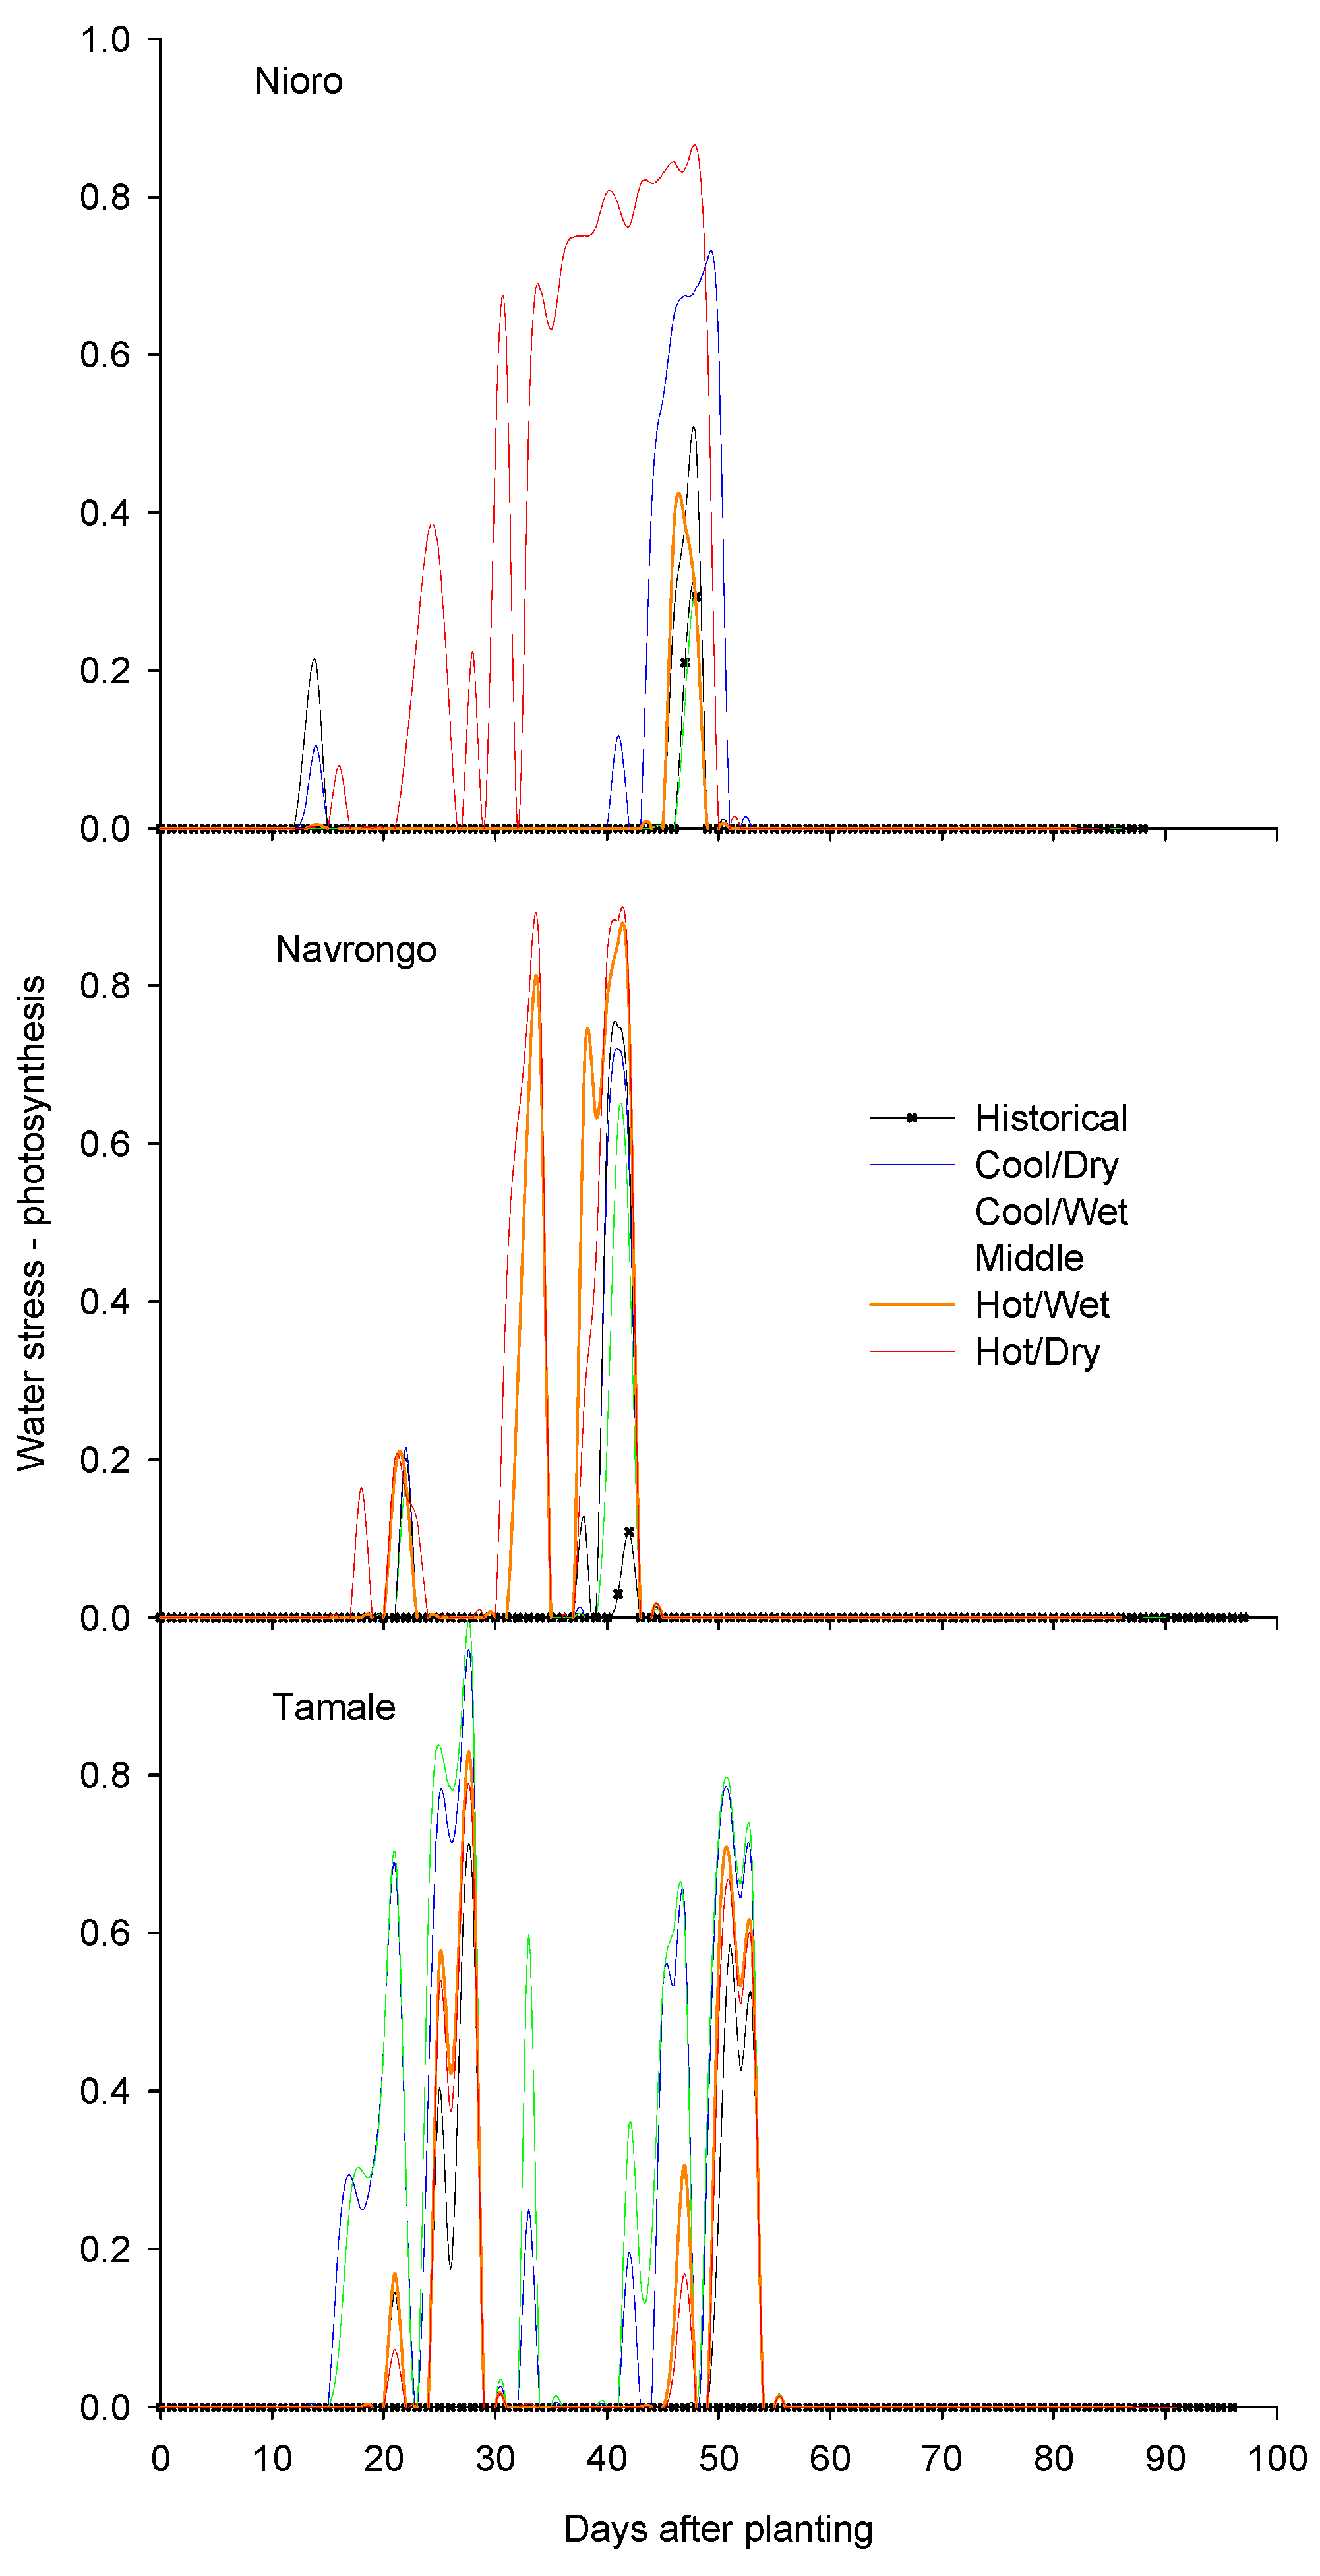
4.3. Drivers of Yield Changes under Climate Change Scenarios

With regard to temperature increase (Table 5), the reductions in grain yields in this study can be attributed to accelerated plant development that would shorten the crop phenology (Table 5, Table A1 and Table A2). Because flowering is a crucial determinant of plant reproductive success and seed-set, the higher impact on days to flowering coupled with water stress would severely affect grain yield. In other words, the effect of increased temperature and water stress would exhibit a larger impact on grain yield than on vegetative growth because of shortening of the grain-filling phase and also increases in the rate of senescence, which reduces the ability of the maize plant to efficiently fill the grains. Similar results of higher negative impacts on grain yield than on biomass were obtained in controlled environment experiments carried out by [40]. The studies of [41,42] attributed grain yield decline to accelerated crop development at the global scale in the face of increasing temperatures. This is corroborated by the current study where highest yield reductions were simulated under the hottest scenarios under both RCP 4.5 and 8.5. Thus, if soil water is not limiting, temperature alone can still significantly reduce crop yields.
The Hot/Wet scenario showed the highest grain yield reduction under RCP 4.5, not only primarily due to the higher temperature, but also probably due to increased rainfall that would cause increased N leaching (figure not shown). Similar observations can also be made for Tamale. The extent to which temperature and rainfall would impact yields could also be influenced by time of planting, because this determines whether the reproductive stage of the crop, which is most sensitive to temperature, would coincide with the peak of the temperature period or otherwise. Thus, the time of planting is important in determining the extent of yield loss. Additionally, the time of planting will determine how the within-season rainfall distribution will coincide with different development stages. In [36] and [43], the authors reported on the climate change scenario impact varying under different amounts of fertilizer application, which is in accord with our finding. The results of this study are important as it adds more insight to the complexities of the impact of climate scenarios, particularly in smallholder systems, and will aid in the design of appropriate adaptation strategies to adequately mitigate losses in yields at the farm level.
Similarly, the level of fertilizer applied also contributed to the extent of variation in climate impact among farms. Higher water stresses (Figure 4) under future climate scenarios compared to those in the historical period would contribute to the decreases in grain yield under future climate scenarios. The impact of carbon dioxide fertilization on maize yield could not be assessed in this study. However, we expect any beneficial effect to be negligible, as most of the evidence regarding the benefit of elevated CO2 has been for C3 plants and not C4. Even if there were any benefit in the case of maize, the negative impacts of elevated temperature and water stress could nullify it.

4.4. Diversity in the Impact of Climate Scenarios among Farms

An important finding from our study is that it captured the variability in the magnitude of yield changes among the multi farms within each of the study locations. For instance, for Tamale location, the Cool/Wet climate scenario under RCP 4.5 accounted for an impact of 37% RDS among farms (Figure 5). The RSD of the impact of climate scenarios among farms ranged from 13 to 47 and 13 to 64% across climate scenarios under RCP 4.5 and 8.5, respectively, in Navrongo. In Nioro, variability in the impact of climate scenarios ranged from 14 to 59% and 8 to 116% relative standard deviation across climate scenarios under RCP 4.5 and 8.5, respectively. The variability in climate scenario impact among farms was highest at the Nioro site. Variations in the yield responses within each climate scenario are attributable to the heterogeneity in management practices, such as time of planting and quantity of fertilizer used, which mimic the diversity of farmers’ cultural practices. The wide variation in yield outcomes occurs across all climate scenarios at the three locations (Figure 6). The wide variations among the climate scenarios could be attributed to the differences in weather parameters within each climate scenario and their interactions with management factors. This type of household analysis is exactly what is needed to conduct economic analyses, similar to that which AgMIP did using the TOA model [21].
Generally, there was a tendency of higher variability in the impact of climate scenarios among farms under the relatively hot scenarios at all sites. Variability in change impact under the scenarios were also generally higher in Nioro (where projected temperature changes above the historical climate were highest) compared to Navrongo and Tamale. Analysis of variance attributed the variance to the sole effects of variation in soil types, amount of fertilizer and planting dates as well as the interactions among the factors. These results shed more light on the complexities in climate change scenario impact assessments that needs to be adequately captured for effective planning of adaptation strategies in smallholder systems. While the effect of soil type was most prominent in explaining the variation in climate scenario impact among farms in Nioro, the effects of planting windows were more prominent in Navrongo, while in Tamale, differences in fertilizer application were most prominent. The projected reductions in rainfall amounts and events were highest in Nioro than the other two sites, thus explaining the higher losses in yields. Thus, the ability of the soils to store water for plant use during drought periods is critical [23]. A previous study by [36] in the semi-deciduous forest and Guinea savannah zones indicated differences in the impact of climate scenarios on maize simulated on loamy and sandy soil types.

5. Conclusions

Maize yields were projected to decrease by 10 to 39% on average in Nioro du Rip, 9 to 23% in Navrongo and 9 and 35% in Tamale across the GCMs and RCPs used in this study. The variation in the impact of climate scenarios on grain yields were between 8 and 117% in Nioro, 13 to 64% in Navrongo and 9 to 37% at Tamale. Though both RCPs showed declining grain yield, higher magnitude of losses were produced under RCP 8.5 with higher temperatures. Significant inter-farm variations in grain yield were projected for all sites. Variance in climate change impact on maize yield was due to differences in soil types, variation in the amount of fertilizer applied and time of planting as well as interactions among these factors. Additionally, the extent of yield reduction varied under the various climate models. This study provides valuable insight into the complexities with regards to climate scenario impacts on maize production, sufficient to ensure adaptation measures are developed to tackle climate change impact that are better tailored to the local context.

Author Contributions

Conceptualization, D.S.M., B.S.F., M.A., S.G.K.A., K.J.B., C.P., A.C.R. and M.L. Data curation, B.S.F., D.S.M., M.L., A.C.R. Formal analysis, B.S.F., D.S.M., M.A., M.L., A.C.R., E.C.T.-J., K.J.B., C.P., S.G.K.A. Fund acquisition, D.S.M. Investigation, B.S.F., D.S.M., M.A., M.L., A.C.R., E.C.T.-J., K.J.B., C.P., S.G.K.A. Methodology, B.S.F.; D.S.M., M.A., M.L., A.C.R., E.C.T.-J., P.S.T., K.J.B., C.P., S.G.K.A. Project administration, D.S.M. Resources, M.L., A.C.R., P.S.T., C.P. Supervision, D.S.M., M.A., K.J.B., S.G.K.A. Validation, B.S.F., D.S.M., M.A., M.L., A.C.R., E.C.T.-J., P.S.T., K.J.B., C.P., S.G.K.A. Visualization, B.S.F. Writing—original draft, D.S.M. Writing—review & editing, B.S.F., D.S.M., M.A., M.L., A.C.R., E.C.T.-J., P.S.T., K.J.B., C.P., S.G.K.A.

Funding

This research was funded by the United Kingdom UKaid grant GB-1-202108 of the Department for International Development (DFID), to the Agricultural Model Inter-comparison and Improvement Project (AgMIP) for work in Sub-Saharan Africa and South Asia to substantially improved assessments of climate impacts on the agricultural sector. Additional support was provided by the CGIAR Research Program on Climate Change, Agriculture and Food Security (CCAFS), which is carried out with support from CGIAR Fund Donors and through bilateral funding agreements.

Acknowledgments

We acknowledge AgMIP and Columbia University for providing the sub-grant to CIWARA for this study. We are also grateful to Dr. Ibrahim Hathie and Dr. Joseph Amikuzunu for providing survey data for the Nioro, Senegal and Navrongo, Ghana sites respectively.

Conflicts of Interest

The authors declare no conflict of interest.

Appendix A

Table A1. Imparct of climate change scenarios on days to flowering at three sites in semi-arid region of West Africa.
Climate DescriptionGM* (days)CV (%)Max* (days)Min* (days)Mean Δ (%)RSD of Δ (%)Min Δ (%)Max Δ (%)
Nioro, RCP 4.5
Historical5415553----
Cool/Dry5115250−57−6−4
Cool/Wet5215351−48−4−3
Middle5115250−55−6−4
Hot/Wet5115150−65−6−5
Hot/Dry5125749−533−75
Nioro, RCP 8.5
Cool/Dry5115350−520−5−2
Cool/Wet5115250−53−6−5
Middle5015149−64−7−5
Hot/Wet5015149−74−8−7
Hot/Dry4925748−94−105
Navrongo, RCP 4.5
Historical5425551----
Cool/Dry5115249−53−4−5
Cool/Wet5215249−53−4−5
Middle5215249−53−4−5
Hot/Wet5015148−74−5−7
Hot/Dry5015148−75−5−7
Navrongo, RCP 8.5
Cool/Dry5115148−74−5−7
Cool/Wet5115148−75−5−7
Middle5015048−88−5−9
Hot/Wet5015047−95−7−9
Hot/Dry4915047−103−8−10
Tamale, RCP 4.5
Historical5615752----
Cool/Dry5315450−410−4−5
Cool/Wet5325450−55−4−6
Middle5315350−53−5−6
Hot/Wet5115349−72−7−7
Hot/Dry5115349−73−6−8
Tamale, RCP 8.5
Cool/Dry5115249−75−6−8
Cool/Wet5115249−86−6−9
Middle5215349−75−7−8
Hot/Wet5015148−102−9−10
Hot/Dry5015148−92−8−10
Δ: relative change; RSD: relative standard deviation *: GM, Max and Min are grand mean, maximum and minimum values of farm.
Table A2. Impact of climate change scenarios on days to maturity at three sites in semi-arid region of West Africa.
Climate DescriptionGM* (days)CV (%)Max* (days)Min* (days)Mean Δ (%)RSD of Δ (%)Min Δ (%)Max Δ (%)
Nioro, RCP 4.5
Historical9009089----
Cool/Dry8508684−63−6−5
Cool/Wet8608786−45−4−4
Middle8508684−63−6−5
Hot/Wet8408584−63−7−6
Hot/Dry8418682−712−9−4
Nioro, RCP 8.5
Cool/Dry8518784−511−7−3
Cool/Wet8508584−62−6−5
Middle8408583−63−7−6
Hot/Wet8308382−82−8−8
Hot/Dry8118981−102−10−2
Navrongo, RCP 4.5
Historical9819995----
Cool/Dry9319389−61−5−6
Cool/Wet9419490−53−4−5
Middle9319490−52−5−5
Hot/Wet9119288−73−7−8
Hot/Dry9119288−72−7−8
Navrongo, RCP 8.5
Cool/Dry9119288−72−7−7
Cool/Wet9219288−74−7−7
Middle8919087−93−8−9
Hot/Wet8919086−93−9−9
Hot/Dry8919085−101−9−10
Tamale, RCP 4.5
Historical100110197----
Cool/Dry9619693−46−4−5
Cool/Wet9519691−57−4−6
Middle9409592−64−5−6
Hot/Wet9209389−83−7−8
Hot/Dry9319389−87−6−8
Tamale, RCP 8.5
Cool/Dry9209390−83−7−8
Cool/Wet9219390−84−7−9
Middle9319390−84−7−8
Hot/Wet9019087−113−10−11
Hot/Dry9019187−102−10−11
Δ: relative change; RSD: relative standard deviation *: GM, Max and Min are grand mean, maximum and minimum values of farms

References

  1. Faye, B.; Webber, H.; Naab, J.B.; MacCarthy, D.S.; Adam, M.; Ewert, F.; Lamers, J.P.A.; Schleussner, C.-F.; Ruane, A.; Gessner, U.; et al. Impacts of 1.5 versus 2.0 C on cereal yields in the West African Sudan Savanna. Environ. Res. Lett. 2018, 13, 034014. [Google Scholar] [CrossRef]
  2. Rosenzweig, C.; Rind, D.; Lacis, A.; Manley, D.E. Our Warming Planet: Topics in Climate Dynamics; World Scientific: Singapore, 2018; Volume 1. [Google Scholar]
  3. Challinor, A.J.; Parkes, B.; Ramirez-Villegas, J. Crop yield response to climate change varies with cropping intensity. Glob. Chang. Biol. 2015, 21, 1679–1688. [Google Scholar] [CrossRef] [PubMed] [Green Version]
  4. Environmental Protection Agency. Initial National Communication under the United Nations’ Framework Convention on Climate Change, Government of the Republic of Ghana; Environmental Protection Agency: Washington, DC, USA, 2001; p. 172. [Google Scholar]
  5. Intergovernmental Panel on Climate Change (IPCC). The Physical Science Basis, Contribution of Working Group 1 to the Third Assessment Report of the Intergovernmental Panel on Climate Change; Cambridge University Press: Cambridge, UK, 2007; Volume 996. [Google Scholar]
  6. Hulme, M.; Doherty, R.; Ngara, T.; New, M.; Lister, D. African climate change: 1900–2100. Clim. Res. 2001, 17, 145–168. [Google Scholar] [CrossRef]
  7. Laux, P.; Wagner, S.; Wagner, A.; Jacobeit, J.; Bárdossy, A.; Kunstmann, H. Modelling daily precipitation features in the Volta Basin of West Africa. Int. J. Climatol. 2009, 29, 937–954. [Google Scholar] [CrossRef] [Green Version]
  8. Ministry of Food Agriculture (MoFA). Agriculture in Ghana. Facts and Figures 2010. Ministry of Food and Agriculture, Statistics, Research and Information Directorate; Ministry of Food Agriculture: Accra, Ghana, 2011. [Google Scholar]
  9. Hellmuth, M.E.; Moorhead, A.; Thomas, M.C.; Williams, J. Climate Risk Management in Africa: Learning from Practice. IRI; Columbia University: New York, NY, USA, 2007. [Google Scholar]
  10. Cooper, P.; Dimes, J.; Rao, K.; Shapiro, B.; Shiferaw, B.; Twomlow, S. Coping better with current climatic variability in the rain-fed farming systems of sub-Saharan Africa: An essential first step in adapting to future climate change? Agric. Ecosyst. Environ. Res. Lett. 2008, 126, 24–35. [Google Scholar] [CrossRef] [Green Version]
  11. Porter, J.R.; Xie, L.; Challinor, A.J.; Cochrane, K.; Howden, S.M.; Iqbal, M.M.; Lobell, D.B.; Travasso, M.I. Food security and food production systems. In Climate Change 2014: Impacts, Adaptation and Vulnerability. Working Group II Contribution to the IPCC 5th Assessment Report; Cambridge University Press: Cambridge, UK, 2014; pp. 485–533. [Google Scholar]
  12. Ramírez Villegas, J.; Thornton, P.K. Climate Change Impacts on African Crop Production. CCAFS Working Paper No. 119; CGIAR Research Program on Climate Change, Agriculture and Food Security (CCAFS): Copenhagen, Denmark, 2015. [Google Scholar]
  13. Jones, P.G.; Thornton, P.K. The potential impacts of climate change in tropical agriculture: The case of maize production in Africa and Latin America in 2055. Glob. Environ. Chang. 2003, 13, 51–59. [Google Scholar] [CrossRef]
  14. Müller, C.; Cramer, W.; Hare, W.L.; Lotze-Campen, H. Climate change risks for African agriculture. Proc. Natl. Acad. Sci. USA 2011, 108, 4313–4315. [Google Scholar] [CrossRef] [Green Version]
  15. Tesfaye, K.; Gbegbelegbe, S.; Cairns, J.E.; Shiferaw, B.; Prasanna, B.M.; Sonder, K.; Boote, K.; Makumbi, D.; Robertson, R. Maize systems under climate change in sub-Saharan Africa: Potential impacts on production and food security. Int. J. Clim. Chang. Strateg. Manag. 2015, 7, 247–271. [Google Scholar] [CrossRef]
  16. Traore, B.; Corbeels, M.; Van Wijk, M.T.; Rufino, M.C.; Giller, K.E. Effects of climate variability and climate change on crop production in southern Mali. Eur. J. Agron. 2013, 49, 115–125. [Google Scholar] [CrossRef]
  17. Akumaga, U.; Tarhule, A.; Piani, C.; Traore, B.; Yusuf, A. Utilizing Process-Based Modeling to Assess the Impact of Climate Change on Crop Yields and Adaptation Options in the Niger River Basin, West Africa. Agronomy 2018, 8, 11. [Google Scholar] [CrossRef]
  18. Roudier, P.; Sultan, B.; Quirion, P.; Berg, A. The impact of future climate change on West African crop yields: What does the recent literature say? Glob. Environ. Chang. 2011, 21, 1073–1083. [Google Scholar] [CrossRef] [Green Version]
  19. Hoogenboom, G.; Porter, C.; Shelia, V.; Boote, K.; Singh, U.; White, J.; Hunt, L.; Ogoshi, R.; Lizaso, J.; Koo, J. Decision Support System for Agrotechnology Transfer (DSSAT) Version 4.7; DSSAT Foundation: Gainesville, FL, USA, 2017. [Google Scholar]
  20. Porter, C.H.; Villalobos, C.; Holzworth, D.; Nelson, R.; White, J.W.; Athanasiadis, I.N.; Janssen, S.; Ripoche, D.; Cufi, J.; Raes, D. Harmonization and translation of crop modeling data to ensure interoperability. Environ. Model. Softw. 2014, 62, 495–508. [Google Scholar] [CrossRef]
  21. Rosenzweig, C.; Jones, J.W.; Hatfield, J.L.; Ruane, A.C.; Boote, K.J.; Thorburn, P.; Antle, J.M.; Nelson, G.C.; Porter, C.; Janssen, S. The Agricultural Model Intercomparison and Improvement Project (AgMIP): Protocols and pilot studies. Agric. For. Meteorol. 2013, 170, 166–182. [Google Scholar] [CrossRef]
  22. Ruane, A.C.; McDermid, S.P. Selection of a representative subset of global climate models that captures the profile of regional changes for integrated climate impacts assessment. Earth Perspect. 2017, 4, 1. [Google Scholar] [CrossRef] [Green Version]
  23. MacCarthy, D.S.; Adiku, S.G.; Freduah, B.S.; Gbefo, F. Using CERES-Maize and ENSO as decision support tools to evaluate climate-sensitive farm management practices for maize production in the northern regions of Ghana. Front. Plant Sci. 2017, 8, 31. [Google Scholar] [CrossRef]
  24. Batjes, N.H. Soil Parameter Estimates for Senegal and the Gambia Derived from SOTER and WISE (SOTWIS-Senegal, ver. 1.0); ISRIC-World Soil Information: Wageningen, The Netherlands, 2008. [Google Scholar]
  25. Adnan, A.A.; Jibrin, J.M.; Abdulrahman, B.L.; Shaibu, A.S.; Garba, I.I. CERES–Maize model for determining the optimum planting dates of early maturing maize varieties in Northern Nigeria. Front. Plant Sci. 2017, 8, 1118. [Google Scholar] [CrossRef]
  26. Fosu-Mensah, B.; MacCarthy, D.; Vlek, P.; Safo, E.Y. Simulating impact of seasonal climatic variation on the response of maize (Zea mays L.) to inorganic fertilizer in sub-humid Ghana. Nutr. Cycl. Agroecosyst. 2012, 94, 255–271. [Google Scholar] [CrossRef]
  27. Ruane, A.C.; Winter, J.M.; McDermid, S.P.; Hudson, N.I. AgMIP climate data and scenarios for integrated assessment: The Agricultural Model Intercomparison and Improvement Project (AgMIP) Integrated Crop and Economic Assessments, Part 1. In Handbook of Climate Change and Agroecosystems; ICP Series on Climate Change Impacts, Adaptation, and Mitigation; Rosenzweig, C., Hillel, D., Eds.; Imperial College Press: London, UK, 2015; Volume 3, pp. 45–78. [Google Scholar] [CrossRef]
  28. Moss, R.H.; Edmonds, J.A.; Hibbard, K.A.; Manning, M.R.; Rose, S.K.; Van Vuuren, D.P.; Carter, T.R.; Emori, S.; Kainuma, M.; Kram, T.; et al. The next generation of scenarios for climate change research and assessment. Nature 2010, 463, 747. [Google Scholar] [CrossRef]
  29. Abera, K.; Crespo, O.; Seid, J.; Mequanent, F. Simulating the impact of climate change on maize production in Ethiopia, East Africa. Environ. Syst. Res. 2018, 7, 4. [Google Scholar] [CrossRef]
  30. Willmott, C.J.; Matsuura, K. Advantages of the mean absolute error (MAE) over the root mean square error (RMSE) in assessing average model performance. J. Clim. Res. 2005, 30, 79–82. [Google Scholar] [CrossRef]
  31. Nash, J.E.; Sutcliffe, J.V. River flow forecasting through conceptual models part I—A discussion of principles. J. Hydrol. 1970, 10, 282–290. [Google Scholar] [CrossRef]
  32. Willmott, C.J.; Robeson, S.M.; Matsuura, K. A refined index of model performance. Int. J. Climatol. 2012, 32, 2088–2094. [Google Scholar] [CrossRef]
  33. Adiku, S.G.; MacCarthy, D.S.; Hathie, I.; Diancoumba, M.; Freduah, B.S.; Amikuzuno, J.; Traore, P.S.; Traore, S.; Koomson, E.; Agali, A. Climate change impacts on west african agriculture: An integrated regional assessment (CIWARA). The Agricultural Model Intercomparison and Improvement Project (AgMIP) Integrated Crop and Economic Assessments, Part 2. In Handbook of Climate Change and Agroecosystems; ICP Series on Climate Change Impacts, Adaptation and Mitigation; Rosenzweig, C., Hillel, D., Eds.; Imperial College Press: London, UK, 2015; pp. 25–73. [Google Scholar]
  34. Adiku, S.G.K.; Debrah-Afanyede, E.; Greatrex, H.; Zougmoré, R.B.; MacCarthy, D.S. Weather-index based crop insurance as a social adaptation to climate change and variability in the Upper West Region of Ghana: Developing a participatory approach. In CCAFS Working Paper No. 189; CGIAR Research Program on Climate Change, Agriculture and Food Security (CCAFS): Copenhagen, Denmark, 2017; p. 44. [Google Scholar]
  35. Valdivia, R.O.; Antle, J.M.; Rosenzweig, C.; Ruane, A.C.; Vervoort, J.; Ashfaq, M.; Hathie, I.; Tui, S.H.-K.; Mulwa, R.; Nhemachena, C.; et al. Representative Agricultural Pathways and Scenarios for Regional Integrated Assessment of Climate Change Impacts, Vulnerability, and Adaptation; Rosenzweig, C., Hillel, D., Eds.; Imperial College Press: London, UK, 2015; Volume 3, pp. 101–156. [Google Scholar]
  36. MacCarthy, D.; Adiku, S.; Yangyuoru, M. Assessing the potential impact of climate change on maize production in two farming zones of Ghana using the CERES-Maize Model. Ghana Policy Journal Special Issue: Climate Change in Ghana: Impacts on Agriculture and the policy implications. Ghana Policy J. 2013, 5, 29–42. [Google Scholar]
  37. Traore, B.; Descheemaeker, K.; Van Wijk, M.T.; Corbeels, M.; Supit, I.; Giller, K.E. Modelling cereal crops to assess future climate risk for family food self-sufficiency in southern Mali. Field Crop. Res. 2017, 201, 133–145. [Google Scholar] [CrossRef] [Green Version]
  38. Thomson, A.M.R.A.; Brown, N.J.; Rosenberg, N.J.; Lazaurralde, R.C.; Benson, V. Climate change impacts for the conterminous USA: An integrated assessment Part 3. Dry land production of grain and forage Crops. Clim. Chang. 2005, 69, 43–65. [Google Scholar] [CrossRef]
  39. Tachie-Obeng, E.; Akponikpe, P.; Adiku, S. Considering effective adaptation options to impacts of climate change for maize production in Ghana. Environ. Dev. 2013, 5, 131–145. [Google Scholar] [CrossRef]
  40. Hatfield, J.L.; Prueger, J.H. Temperature extremes: Effect on plant growth and development. Weather Clim. Extrem. 2015, 10, 4–10. [Google Scholar] [CrossRef] [Green Version]
  41. Gourdji, S.M.; Sibley, A.M.; Lobell, D.B. Global crop exposure to critical high temperatures in the reproductive period: Historical trends and future projections. Environ. Res. Lett. 2013, 8, 024041. [Google Scholar] [CrossRef]
  42. Teixeira, E.I.; Fischer, G.; Van Velthuizen, H.; Walter, C.; Ewert, F. Global hot-spots of heat stress on agricultural crops due to climate change. Agric. For. Meteorol. 2013, 170, 206–215. [Google Scholar] [CrossRef]
  43. Kassie, B.; Van Ittersum, M.; Hengsdijk, H.; Asseng, S.; Wolf, J.; Rötter, R.P. Climate-induced yield variability and yield gaps of maize (Zea mays L.) in the Central Rift Valley of Ethiopia. Field Crop. Res. 2014, 160, 41–53. [Google Scholar] [CrossRef]
Figure 1. Distribution of planting dates and fertilizer application rates in a community at Tamale (Ghana) in a 2014 agronomy survey
Agronomy 09 00639 g001
Figure 2. Performance of DSSAT in simulating maize grain yields collected from farmer surveys in 2007 at Nioro, 2012 at Navrongo and 2014 at Tamale site.
Agronomy 09 00639 g002
Figure 3. Simulated future maize yield changes under different climate scenarios for the Nioro, Senegal, Navrongo and Tamale Ghana sites. (Note that for a given scenario, GCMs are not necessarily the same). Each box in the graph shows the distribution of relative yield change across farms. The boundary of the box closest to zero indicates the 25th percentile, a line within the box marks the median, the dots depict the means, and the upper boundary of the box indicates the 75th percentile. Whiskers above and below the box indicate the 95th and 5th percentiles.
Agronomy 09 00639 g003
Figure 4. Simulated water stress on photosynthesis under historical climate and climate change scenarios at Nioro, Senegal, Navrongo and Tamale in Ghana. Water stress factor ranges from 1 (fully stressed) to 0 (no stress).
Agronomy 09 00639 g004
Figure 5. Variability in the impacts of climate scenarios on yields among farms at Nioro, Navrongo and Tamale sites under RCP 4.5 and RCP 8.5.
Agronomy 09 00639 g005
Figure 6. Contribution of differences in fertilizer levels, soil and planting window on the variability in the impacts of climate scenarios on yields among farms at Nioro, Navrongo and Tamale under RCP 4.5 and RCP 8.5.
Agronomy 09 00639 g006
Table 1. Soil parameters used in simulations for Nioro, Senegal.
LocationSoil IDL (cm)SLL (cm3/cm3)SDUL (cm3/cm3)SAT (cm3/cm3)BD (g/cm3)OC (%)pHNH4 (mg/kg)NO3 (mg/kg)
NioroITSN840080100.0940.170.2971.340.3405.11.20.1
200.0930.1680.2951.340.3085.11.00.1
400.0810.1490.2711.460.2645.00.50.1
600.0880.1610.2931.480.2505.30.50.1
800.0850.1590.3051.510.2405.40.50.1
1000.0540.1030.2031.540.2205.40.50.1
ITSN840042100.1090.1850.4441.400.4806.11.20.1
200.1090.1850.4441.400.4806.11.00.1
400.1670.2530.4521.380.4205.10.50.1
600.2170.3050.4451.40.4175.00.50.1
800.2610.350.4201.470.3625.00.50.1
1000.2600.3480.4561.370.3205.00.50.1
ITSN840067100.1000.1620.3801.460.5385.61.20.1
200.1000.1620.3801.460.5385.61.00.1
400.1200.1880.3731.480.445.10.50.1
600.1330.1950.3581.530.4245.10.50.1
800.1430.2000.3751.480.3805.10.50.1
1000.1550.2180.3981.510.3005.10.50.1
ITSN840056100.0760.1540.3961.420.3106.41.20.1
200.0760.1540.3961.420.3106.41.00.1
400.1210.1990.3761.480.2956.40.50.1
600.1290.2040.3591.530.2606.40.50.1
800.1280.2030.3751.480.2466.40.50.1
1000.1660.2460.3521.500.2465.40.50.1
L = Depth of the soil layer, SLL = soil lower limit or wilting point, SDUL = soil drained upper limit or field capacity, SAT = saturated water content, BD = bulk density, OC = organic carbon.
Table 2. Soil parameters used in simulations for the Navrongo and Tamale, Ghana.
LocationSoil IDL (cm)SLL (cm3/cm3)SDUL (cm3/cm3)SAT (cm3/cm3)BD (g/cm3)OC (%)pHNH4 (mg/kg)NO3 (mg/kg)
NavrongoGHNA0150.0520.1760.3521.430.305.51.00.5
150.0520.1760.3521.430.305.51.00.5
300.0520.1760.3211.450.295.30.50.5
500.0730.1920.3201.450.255.30.50.5
GHNA0250.0820.2130.3521.560.396.21.00.5
150.0820.2130.3521.560.396.21.00.5
300.0900.2090.3211.580.365.90.50.5
500.1100.2050.3201.560.325.90.50.5
GHNA0350.0540.1310.3531.670.585.12.00.5
150.0540.1310.3531.670.585.11.00.5
300.0940.1190.3591.740.565.41.00.5
500.1060.1920.3691.830.455.30.50.5
GHNA0450.0850.1560.3151.490.805.22.00.5
150.0850.1560.3151.490.805.21.00.5
300.0910.1840.3791.550.645.41.00.5
500.1320.210.3721.580.515.20.50.5
TamaleGURU01150.0970.1600.3731.550.376.32.00.5
300.1020.1700.3771.570.356.31.00.5
450.1470.2340.3921.590.316.30.50.5
600.1430.2270.3861.60.175.90.50.5
GBUL01150.0970.1610.3771.570.385.72.00.5
300.1010.1680.3771.580.316.01.00.5
450.1420.2260.3821.590.266.10.50.5
600.1430.2270.3861.590.145.90.50.5
DIMA01150.0850.1560.4091.490.805.22.00.5
300.1310.2040.3891.550.645.41.00.5
450.1320.2100.3821.580.215.20.50.5
600.1920.2770.3821.580.145.30.50.5
KPAL01150.1470.2180.3831.570.485.12.00.5
300.1550.2210.3731.570.385.21.00.5
450.1620.2450.3881.570.315.90.50.5
600.1930.2790.3861.600.176.10.50.5
LANG01150.0720.1250.3881.560.315.52.00.5
300.0710.1290.3851.570.295.31.00.5
450.1070.1740.3711.600.245.30.50.5
600.1160.1910.3761.610.105.30.50.5
NYAN01150.0770.1410.4661.340.515.52.00.5
300.0890.1530.3581.640.485.71.00.5
450.1070.1740.3381.700.345.70.50.5
600.1290.2050.3111.780.105.80.50.5
L = Depth of the soil layer, SLL = soil lower limit or wilting point, SDUL = soil drained upper limit or field capacity, SAT = saturated water content, BD = bulk density, OC = organic carbon.
Table 3. Genetic coefficients of the maize varieties used.
Description of Genetic CoefficientsDSSAT IDTZEEY-SRBC5 Obatanpa
Degree days (base 8 °C) from emergence to end of juvenile phaseP1250280
Photoperiod sensitivityP200
Degree days (base 8 °C) from silking to physiological maturityP5720837
Potential kernel number (/plant)G2850540
Potential kernel growth rate (mg/day)G387.5
Phyllochron intervalPHINT5540
Table 4. General circulation models selected for each of the climate scenarios at the three study locations.
GCMs
Climate ScenarioRCP 4.5RCP 8.5
Nioro
Cool/WetGFDL-ESM2MGFDL-ESM2M
Hot/WetGISS-ES-HGISS-E2-H
Middlebcc-csm1-1BNU-ESM
Cool/DryMRI-CGCM3CESMI-BGC
Hot/DryIPSL-CM5B-LRCMCC-CM
Navrongo
Cool/WetCCSM4CCSM4
Hot/WetCMCC-CMCMCC-CMS
MiddleMRI-CGCM3GFDL-ESM2M
Cool/Drybcc-csm1-1BNU-ESM
Hot/DryCMCC-CMSMPI-ESM-MR
Tamale
Cool/WetIPSL-CM5B-LRIPSL-CM5B-LR
Hot/WetHadGEM2-AOCanESM2
MiddleCESMI-BGCGFDL-ESM2
Cool/DryBNU-ESMMIROC5
Hot/DryCMCC-CMSHadGEM2-ES
Table 5. Changes in temperature and rainfall parameters under climate change scenarios (2040—2069) relative to historical (1980–2009) climate at Nioro (Senegal) and Navrongo and Tamale (Ghana).
Temp Δ °CRainfall Amount Δ %Rainfall Events %
Climate ScenarioRCP 4.5RCP 8.5RCP 4.5RCP 8.5RCP 4.5RCP 8.5
Nioro
Historical28.24 °C741 mm46 days
Cool/Wet0.991.520712
Hot/Wet1.752.205−250
Middle1.341.79−9−5−6−6
Cool/Dry1.331.30−22−32−14−37
Hot/Dry1.732.61−32−26−29−40
Navrongo
Historical29.08 °C891 mm63 days
Cool/Wet1.141.7271224
Hot/Wet1.852.72411−8−4
Middle1.321.9643−11
Cool/Dry1.371.72−1−3−1−1
Hot/Dry1.842.4700−5−13
Tamale
Historical28.56 °C1065 mm68 days
Cool/Wet1.281.98−26−2−3
Hot/Wet1.952.813−11−5−12
Middle1.411.852600
Cool/Dry1.061.72−2−1−1−1
Hot/Dry1.842.6015−5−2
Table 6. Performance of the model in predicting maize anthesis, maturity and grain yields for Nioro, Navrongo and Tamale.
Evaluation StatisticNioroNavrongoTamale
Anthesis
RMSE (days)2.12.04.0
RRMSE (%)4.137
MAE (days)1.91.53.4
Maturity
RMSE (days)4.135
RRMSE (%)4.935
MAE (days)4.11.14.6
Grain yield
RMSE (kg/ha)183193324
RRMSE (%)282320
NSE0.840.890.81
d-value0.960.970.94
MAE (kg/ha)157166259
Table 7. Impact of climate change scenarios on maize grain yield (kg/ha) in semi-arid regions in West Africa.
Climate DescriptionGM * (kg/ha)CV (%)Max * (kg/ha)Min * (kg/ha)Mean Δ (%)RSD of Δ (%)Min Δ (%)Max Δ (%)
Nioro, RCP 4.5
Historical934793176208----
Cool/Dry803672081231−1358−34−1
Cool/Wet853782853189−914−13−7
Middle797752456196−1417−23−11
Hot/Wet682792258146−2714−34−19
Hot/Dry735641963218−1959−389
Nioro, RCP 8.5
Cool/Dry821601900298−10116−4111
Cool/Wet773792616162−1713−24−14
Middle828752611196−1134−20−5
Hot/Wet632761961145−328−38−27
Hot/Dry553621343179−3919−60−27
Navrongo, RCP 4.5
Historical1212553377331----
Cool/Dry1054542850288−1313−10−16
Cool/Wet1107563128291−914−6−14
Middle1067542976279−1218−6−16
Hot/Wet997532683280−1716−14−26
Hot/Dry1059532753303−1247−9−28
Navrongo, RCP 8.5
Cool/Dry1028542796293−1520−11−23
Cool/Wet1027562910275−1613−11−21
Middle926532423278−2320−16−35
Hot/Wet937512395269−2227−18−33
Hot/Dry975512507277−1964−10−32
Tamale, RCP 4.5
Historical1876323044575----
Cool/Dry1679302738530−1035−1−15
Cool/Wet1679292698591−9373−19
Middle1586312530486−1515−4−19
Hot/Wet1424292212481−2317−15−30
Hot/Dry1499292444543−1937−5−30
Tamale, RCP 8.5
Cool/Dry1430322316439−249−16−29
Cool/Wet1430302267466−2314−13−28
Middle1516312422483−1914−13−24
Hot/Wet1182261846477−3524−17−45
Hot/Dry1265291992431−3213−24−38
Δ: relative change; RSD: relative standard deviation *: GM, Max and Min are grand mean, maximum and minimum values of farms.

