Heat Shock-Induced Resistance against Pseudomonas syringae pv. tomato (Okabe) Young et al. via Heat Shock Transcription Factors in Tomato

 ,
,
Abstract
1. Introduction
2. Materials and Methods
2.1. Growth and Maintenance of Pathogens and Plant Materials
2.2. Pathogen Inoculation
2.3. Heat Shock, GDA, and KB Treatments
2.4. Gene-Expression Analysis
2.5. Measurement of SA and Salicylic Acid b-d-Glucoside (SAG) Levels
2.6. Identification of HSEs in the Upstream Regions of PR Genes
2.7. Statistical Analysis
3. Results and Discussion
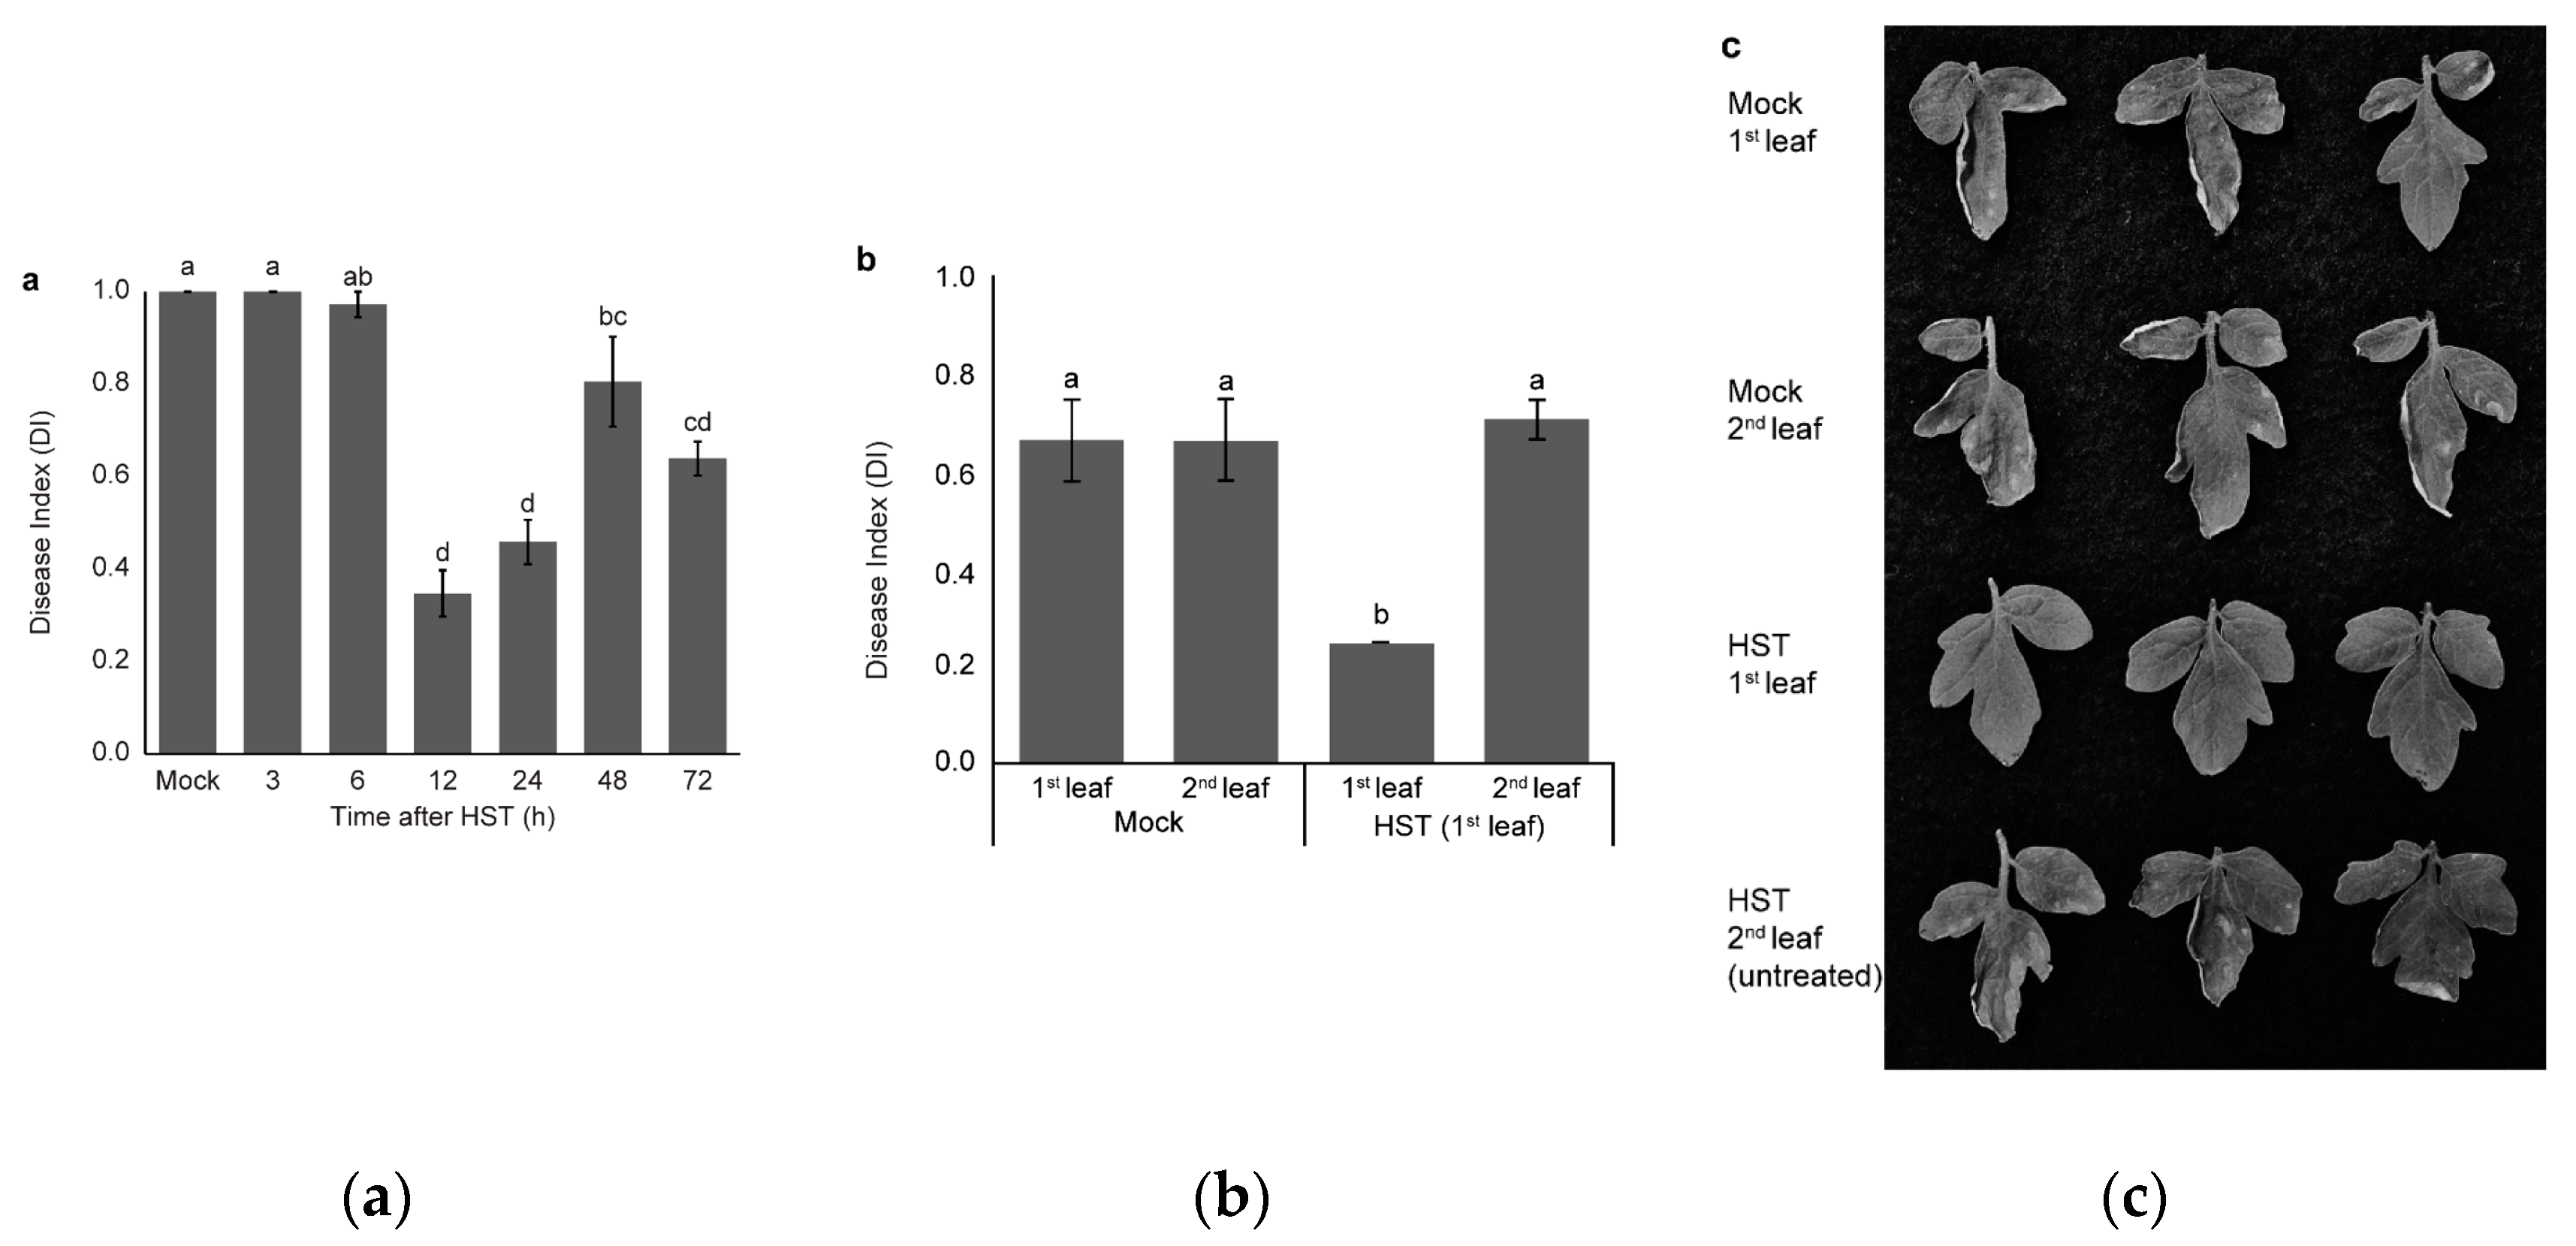
3.1. Changes in Resistance Induced by HST
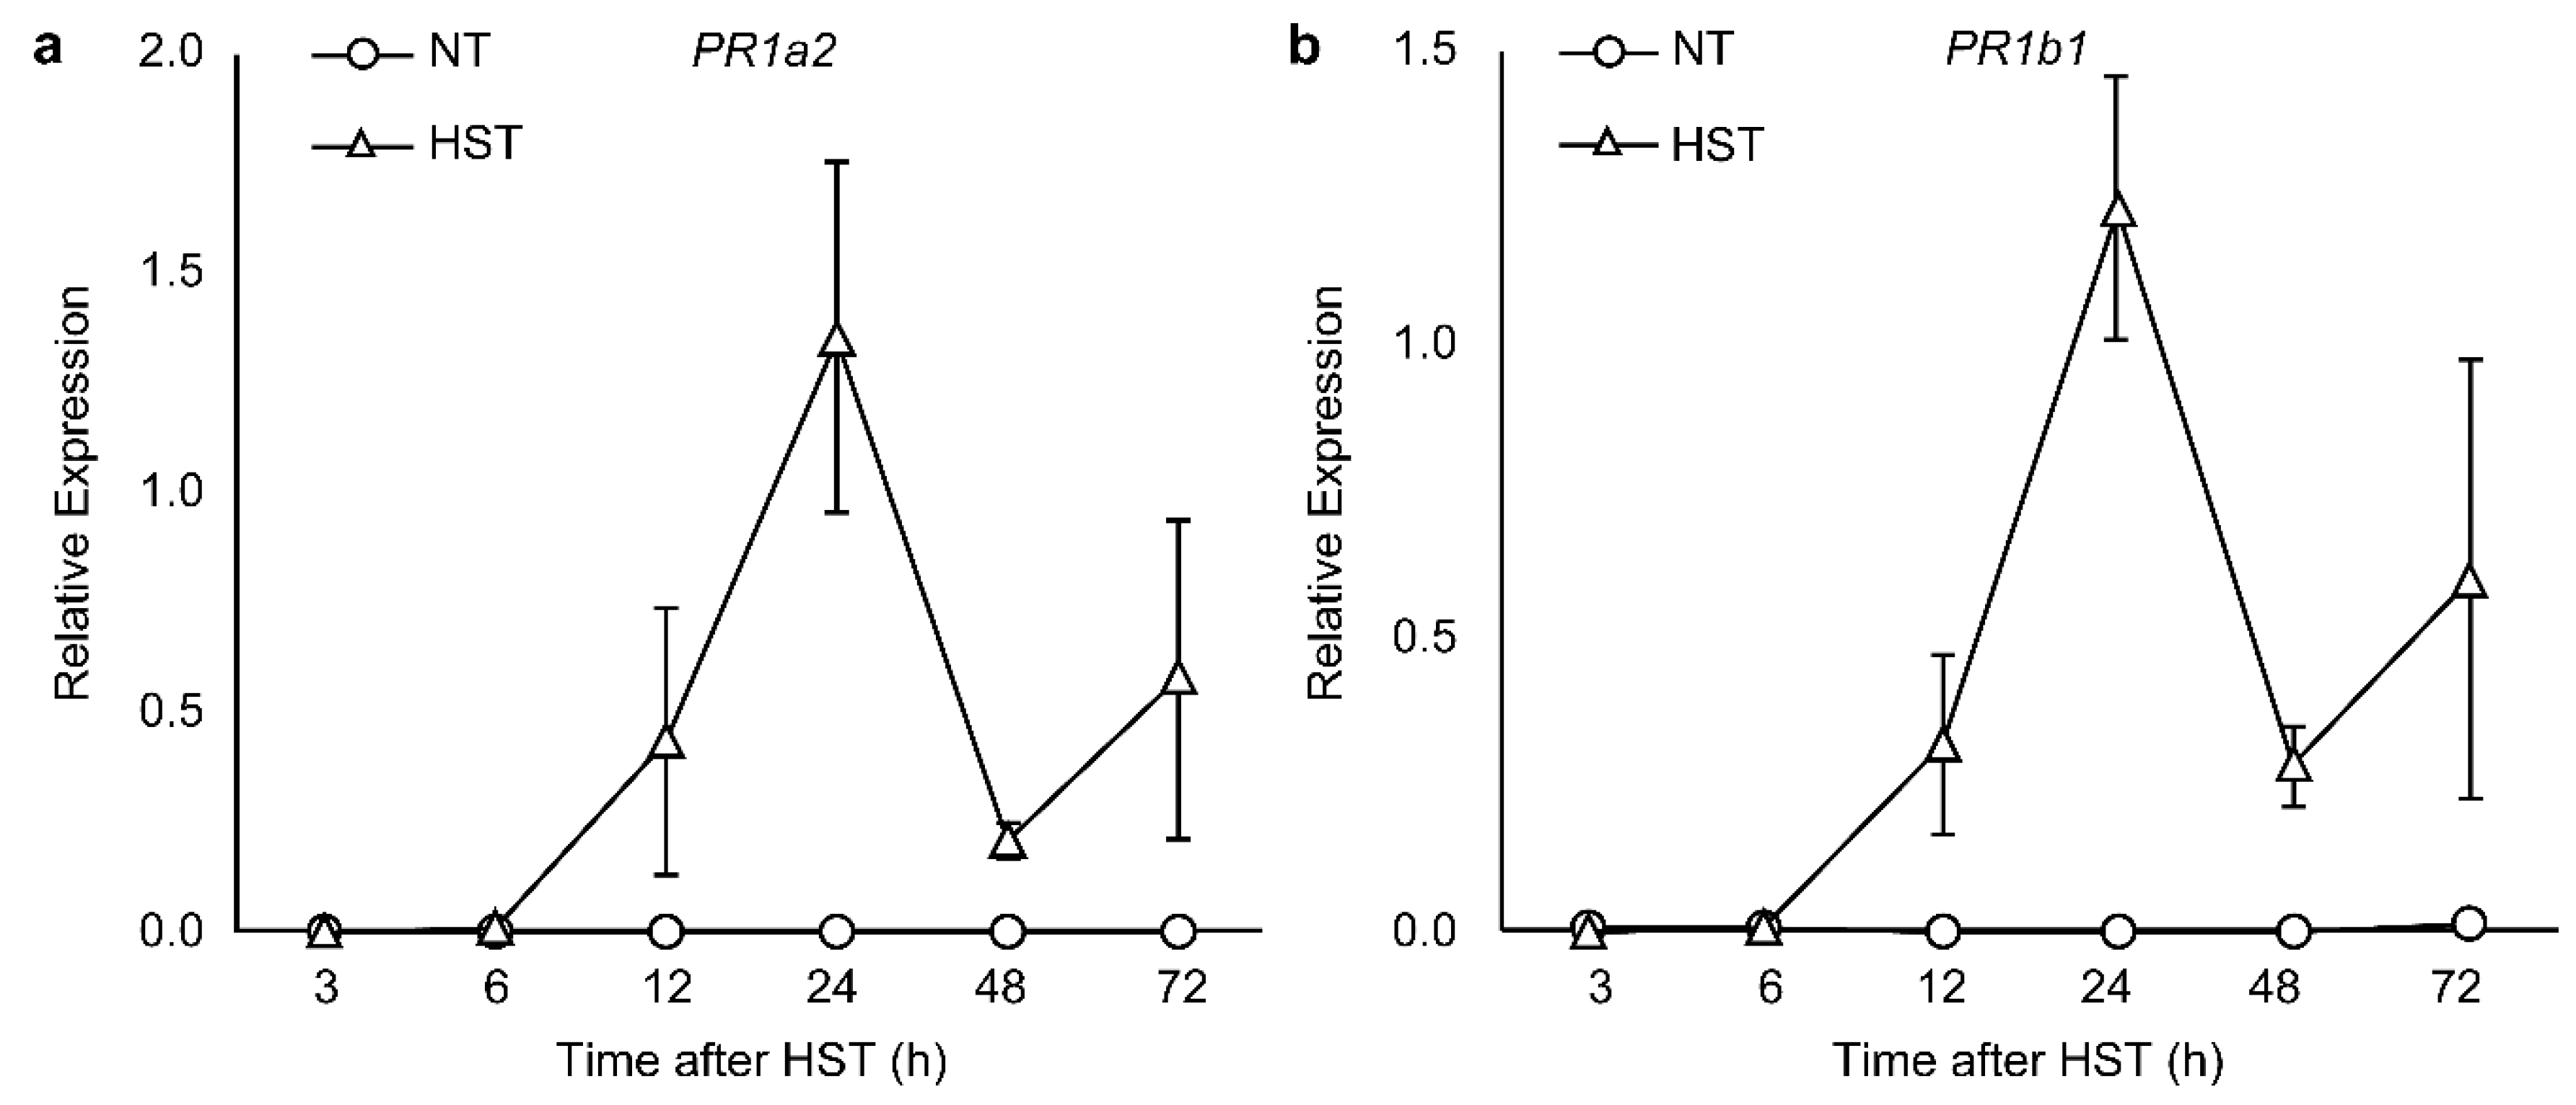
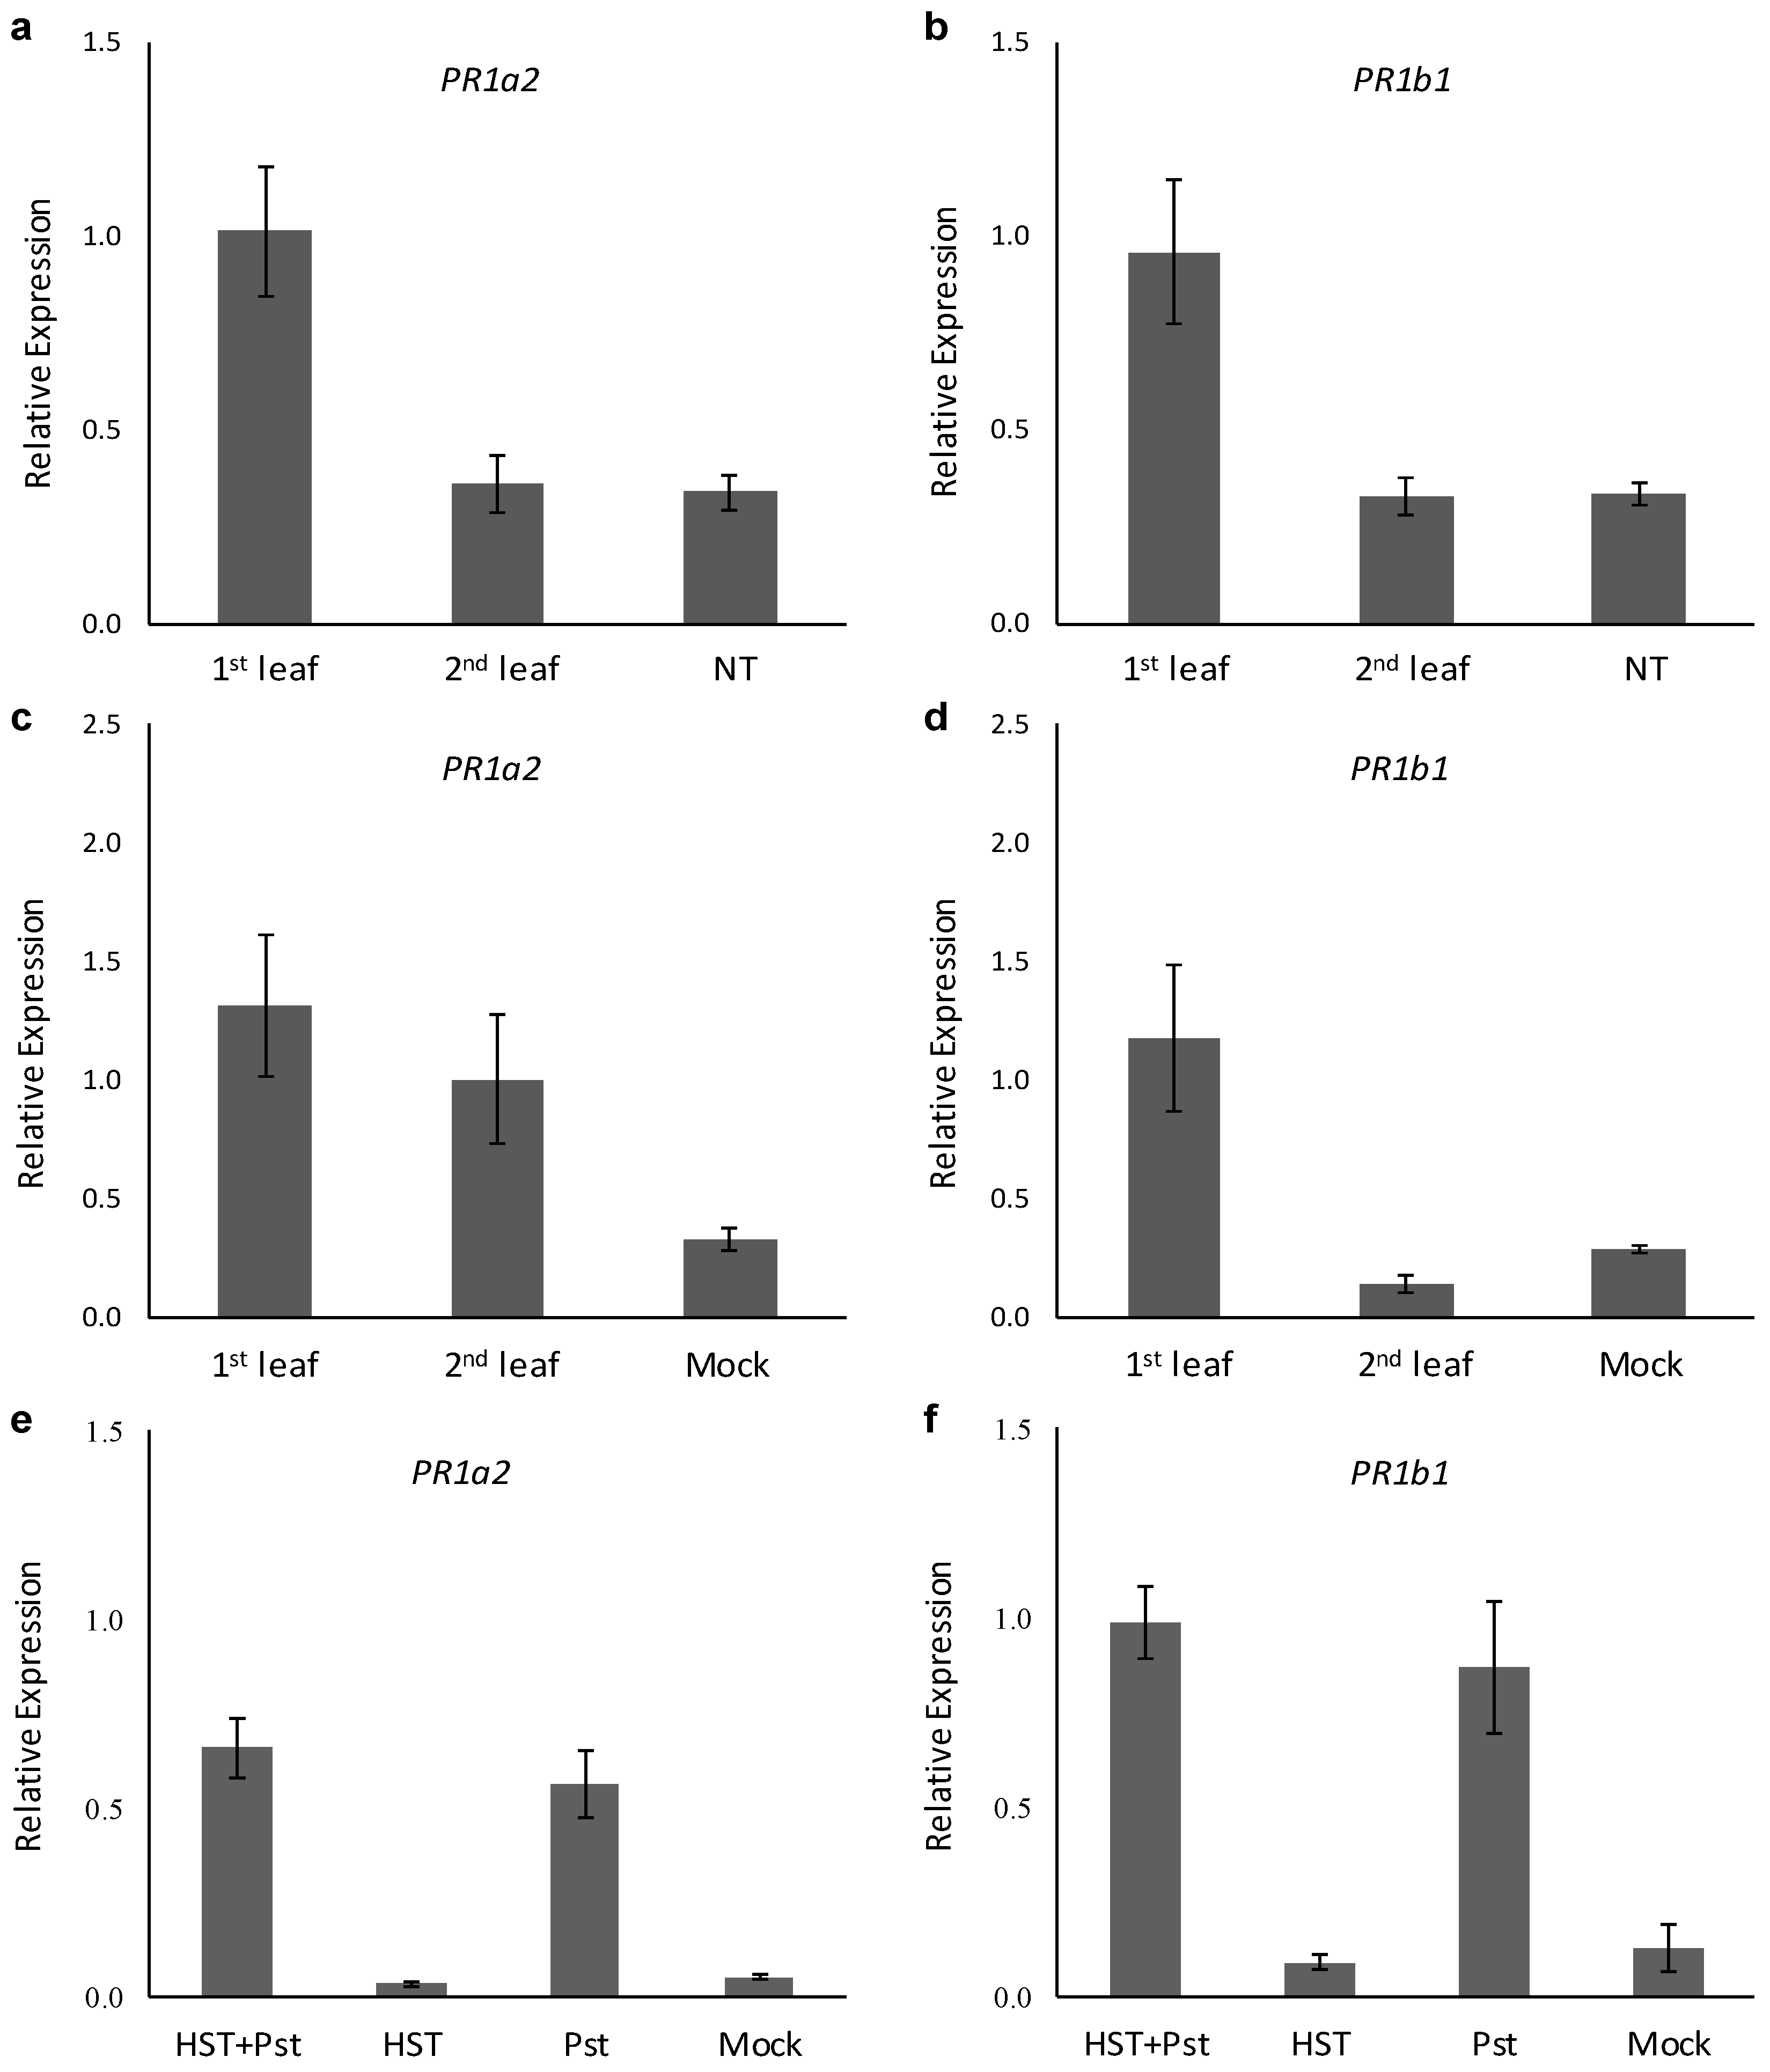
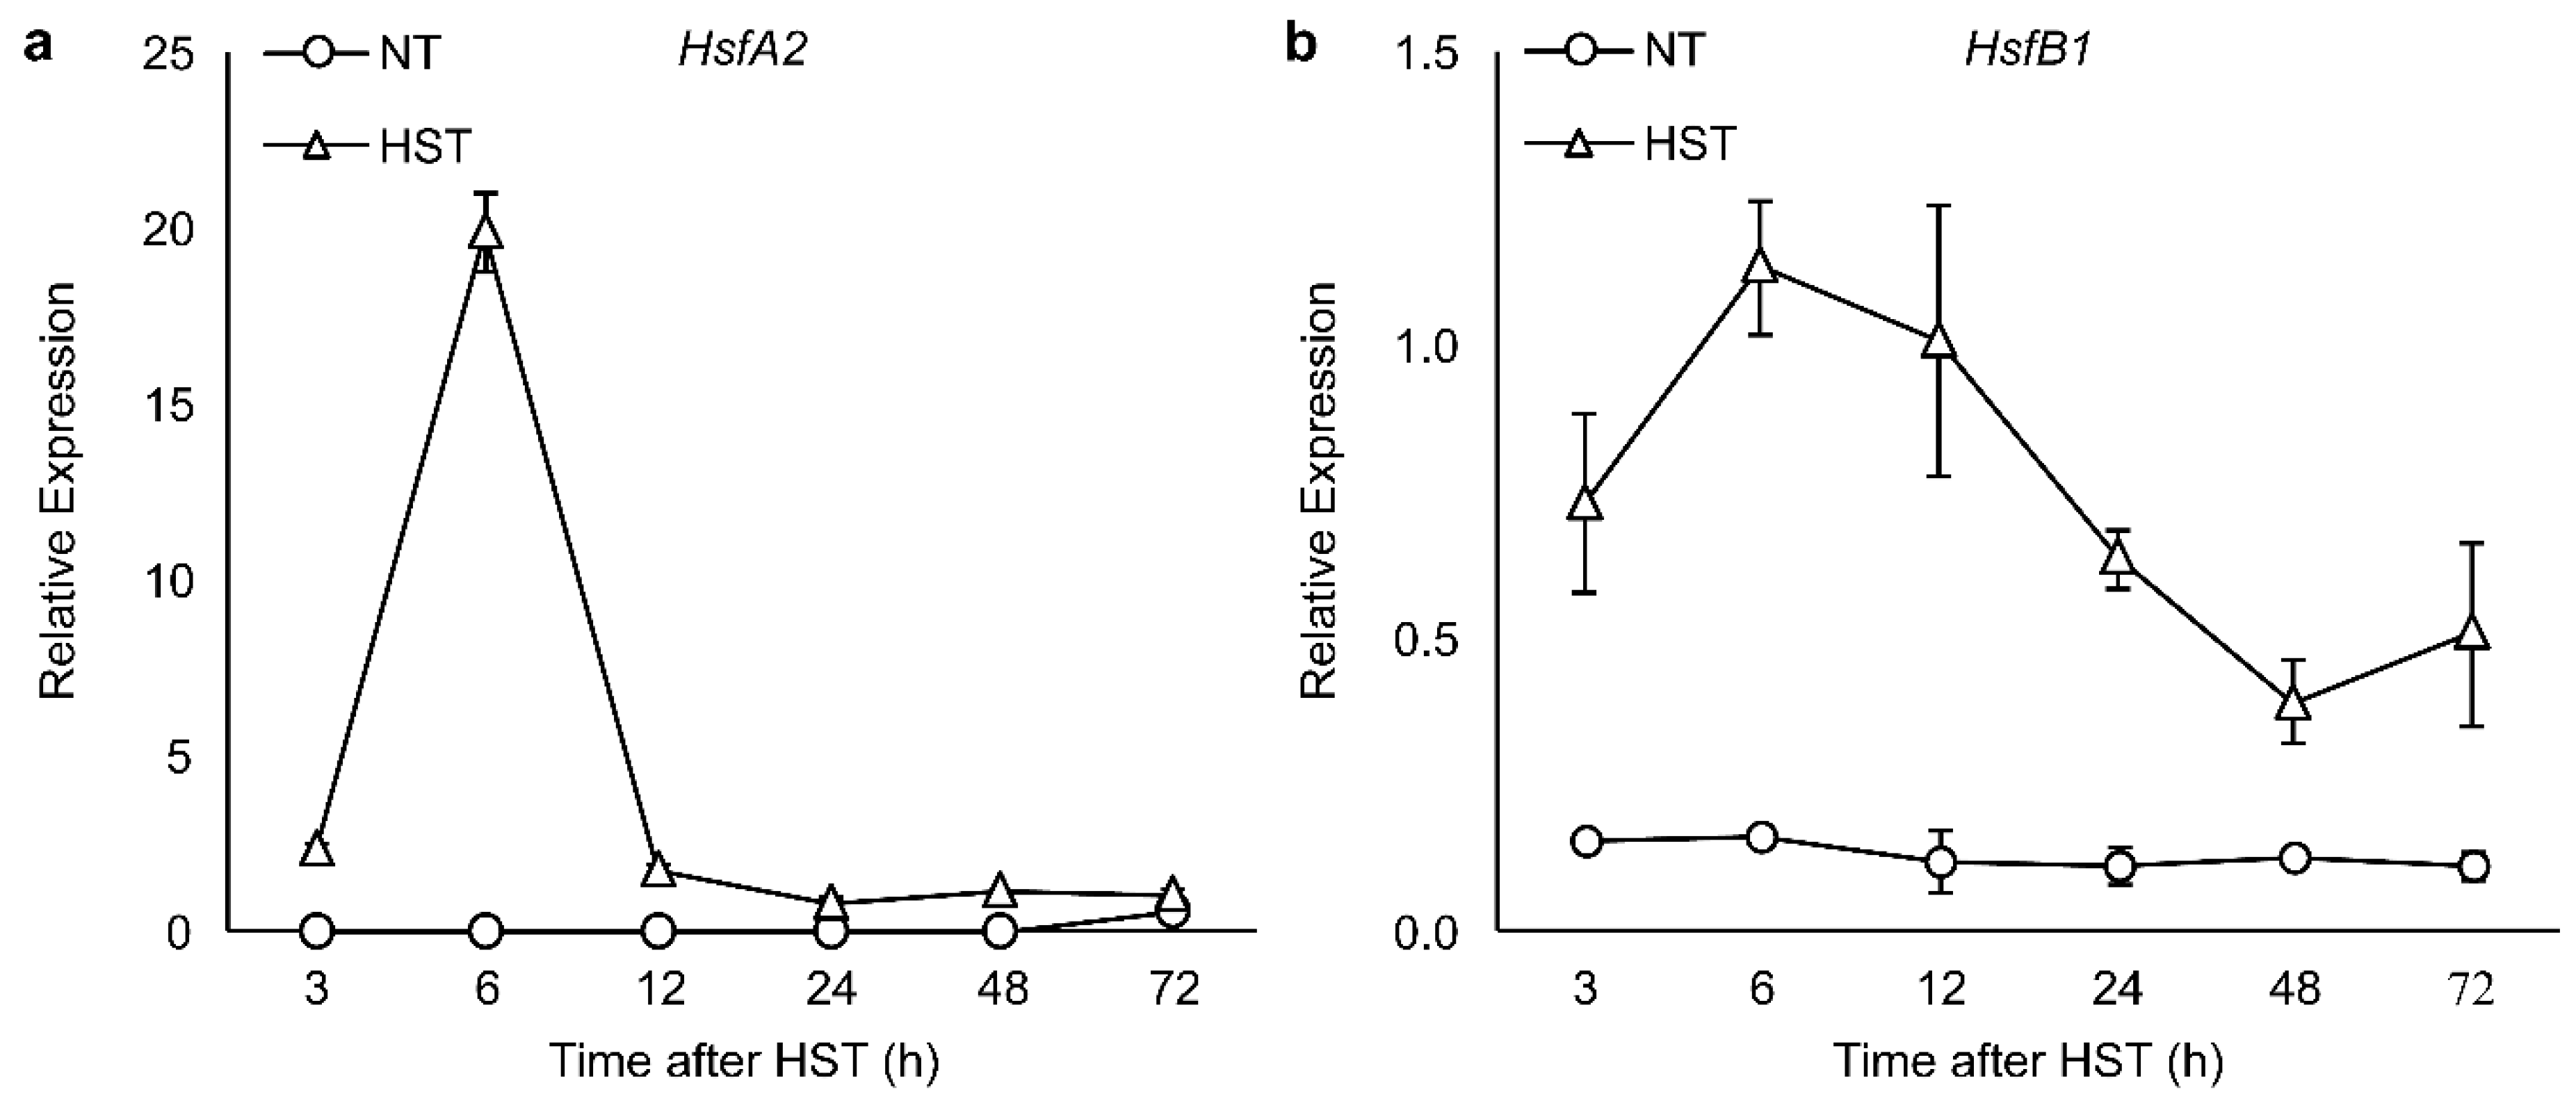
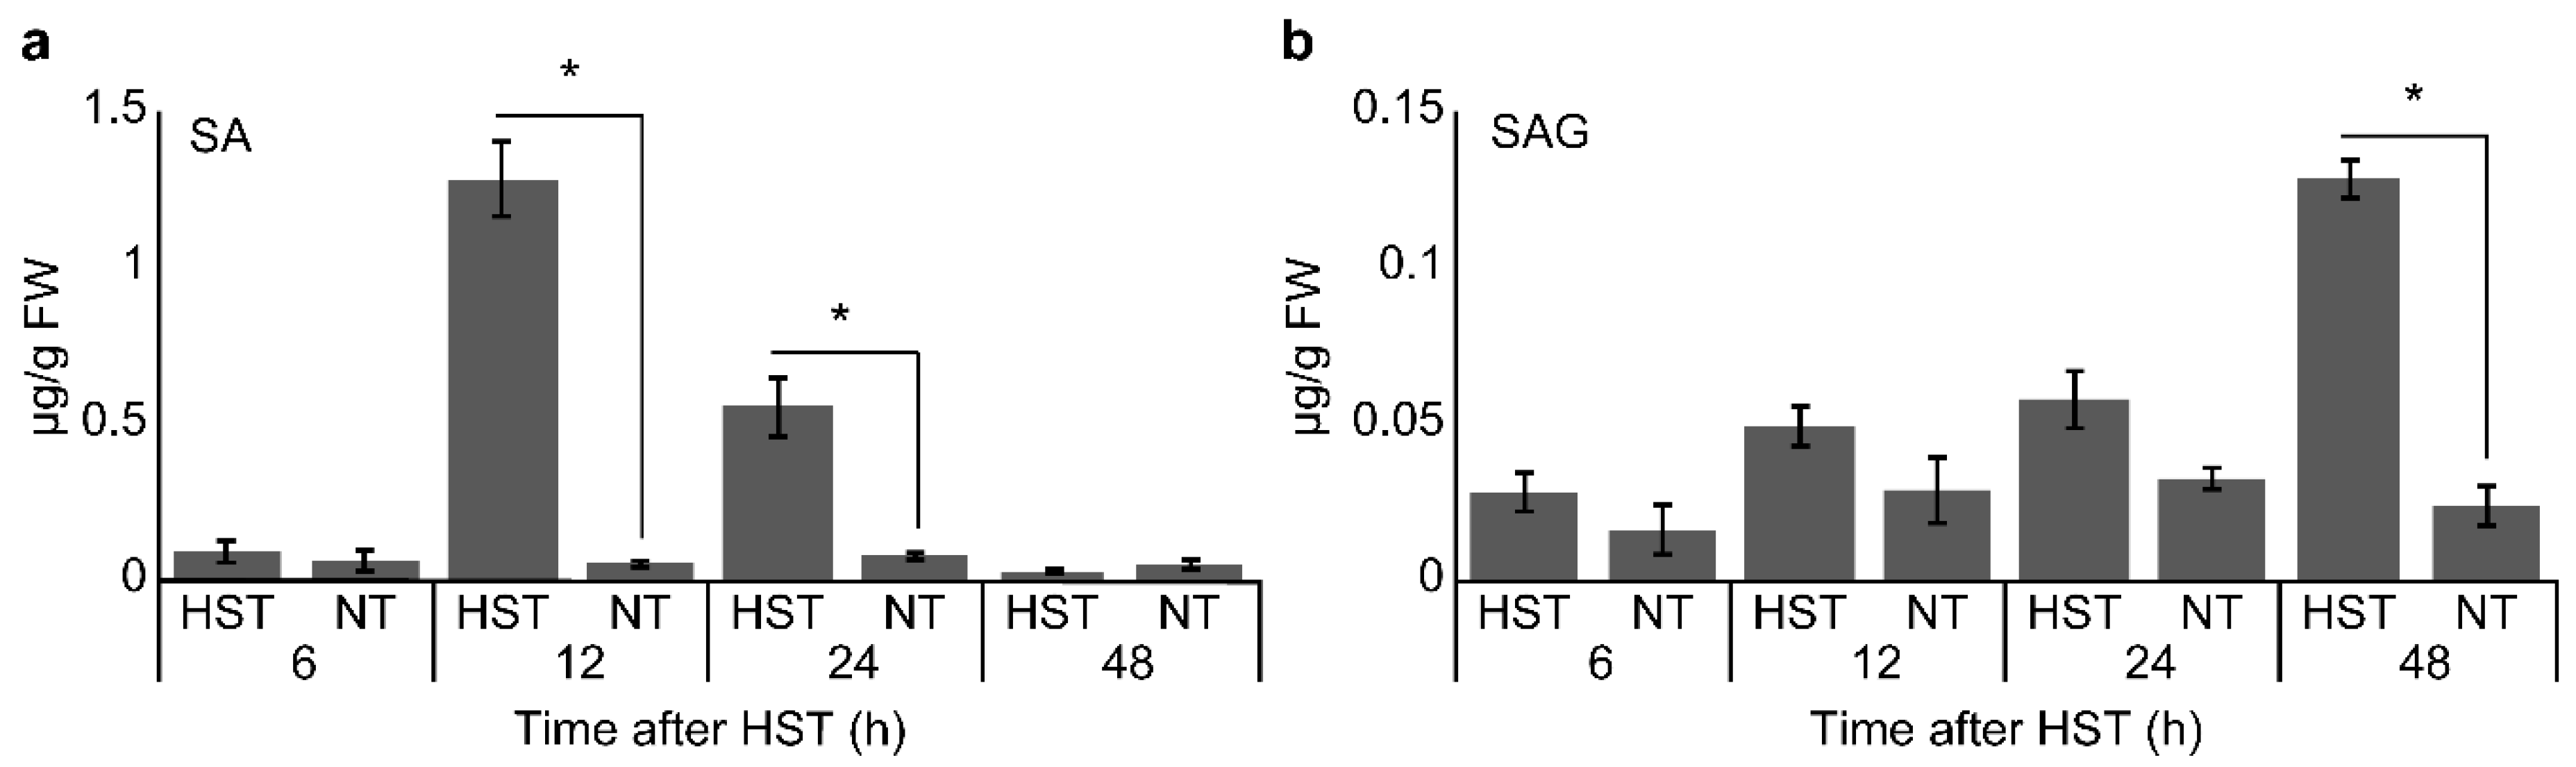
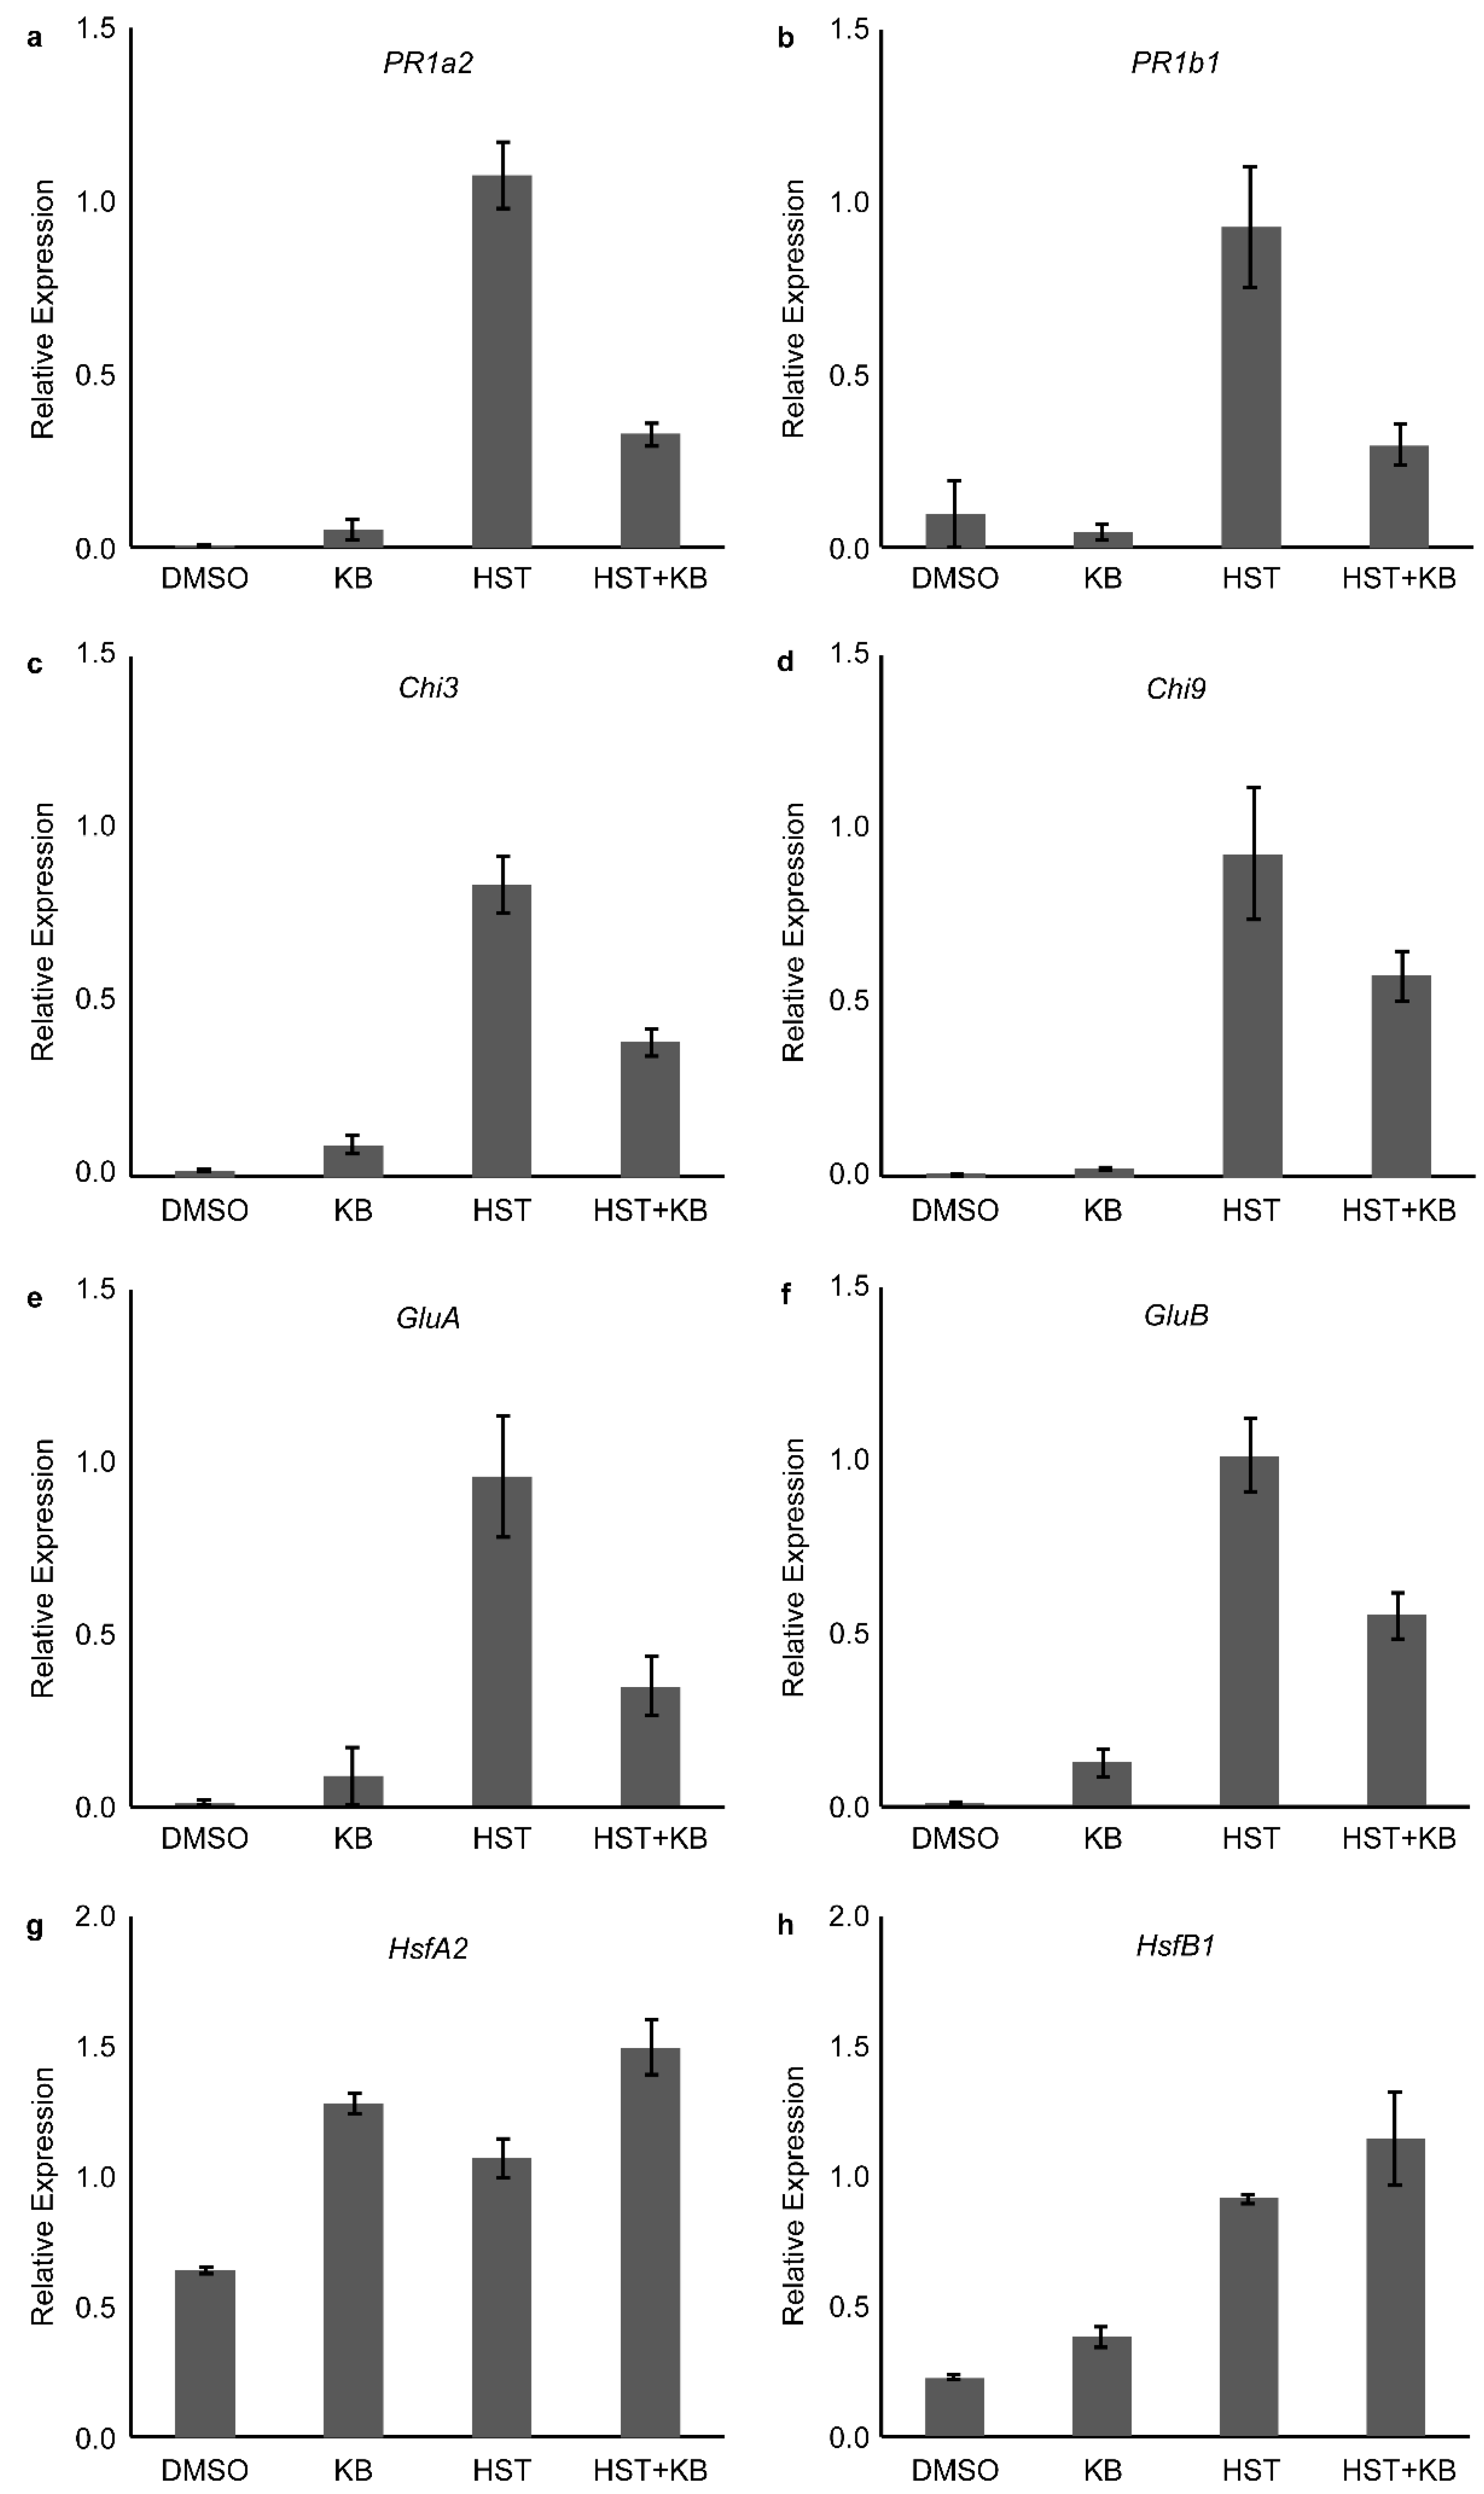
3.2. PR1a2, PR1b1, HsfA2, and HsfB1 Expression Profiles and SA Accumulation
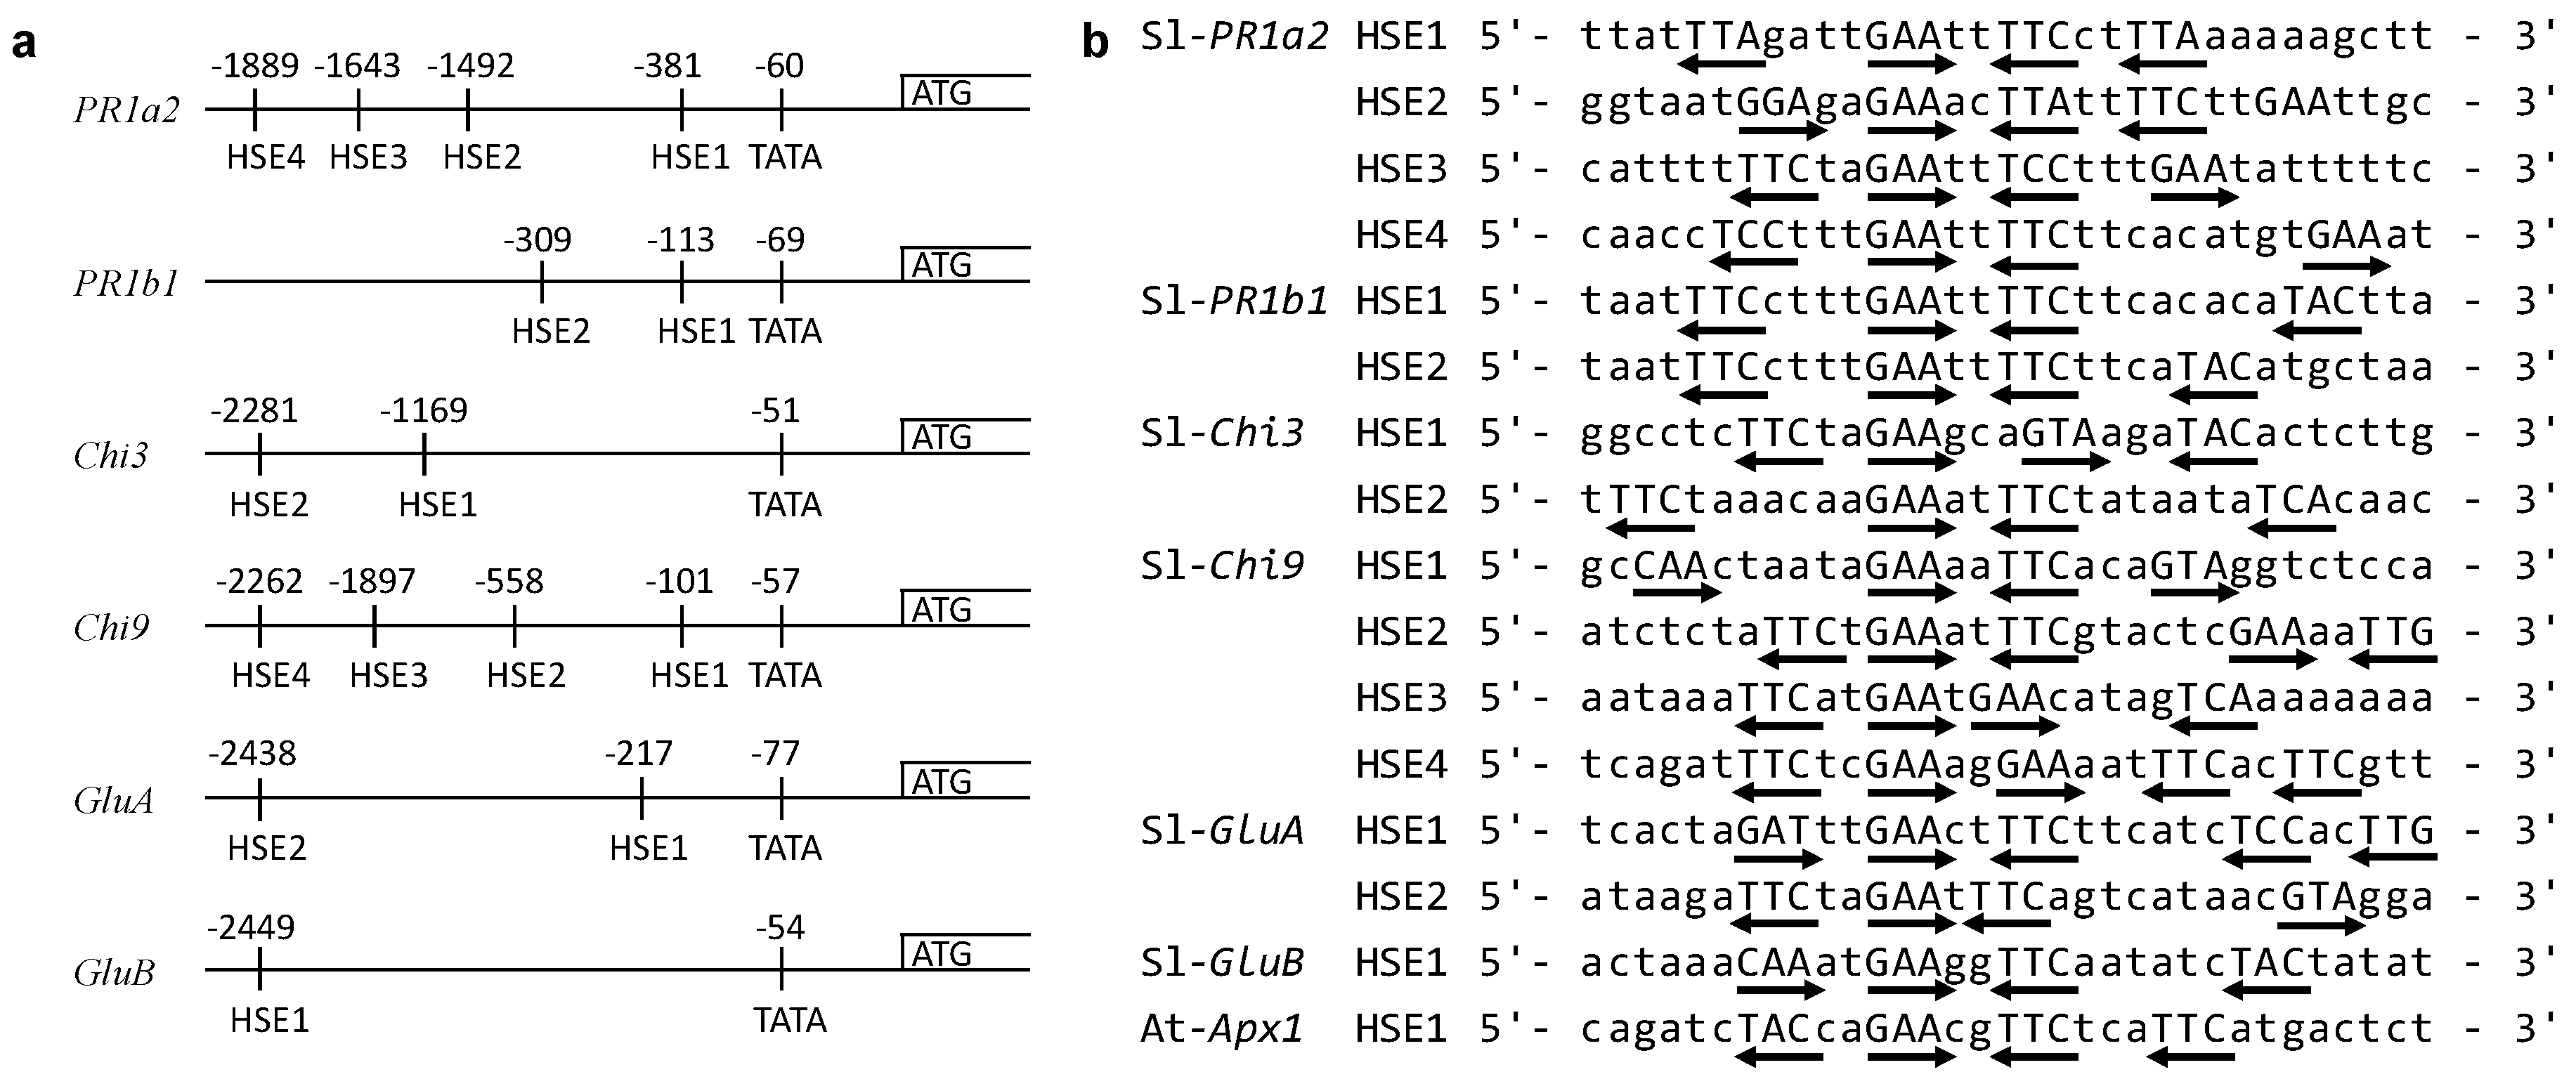
3.3. Identification of HSEs Motifs in the Upstream Regions of Target Genes
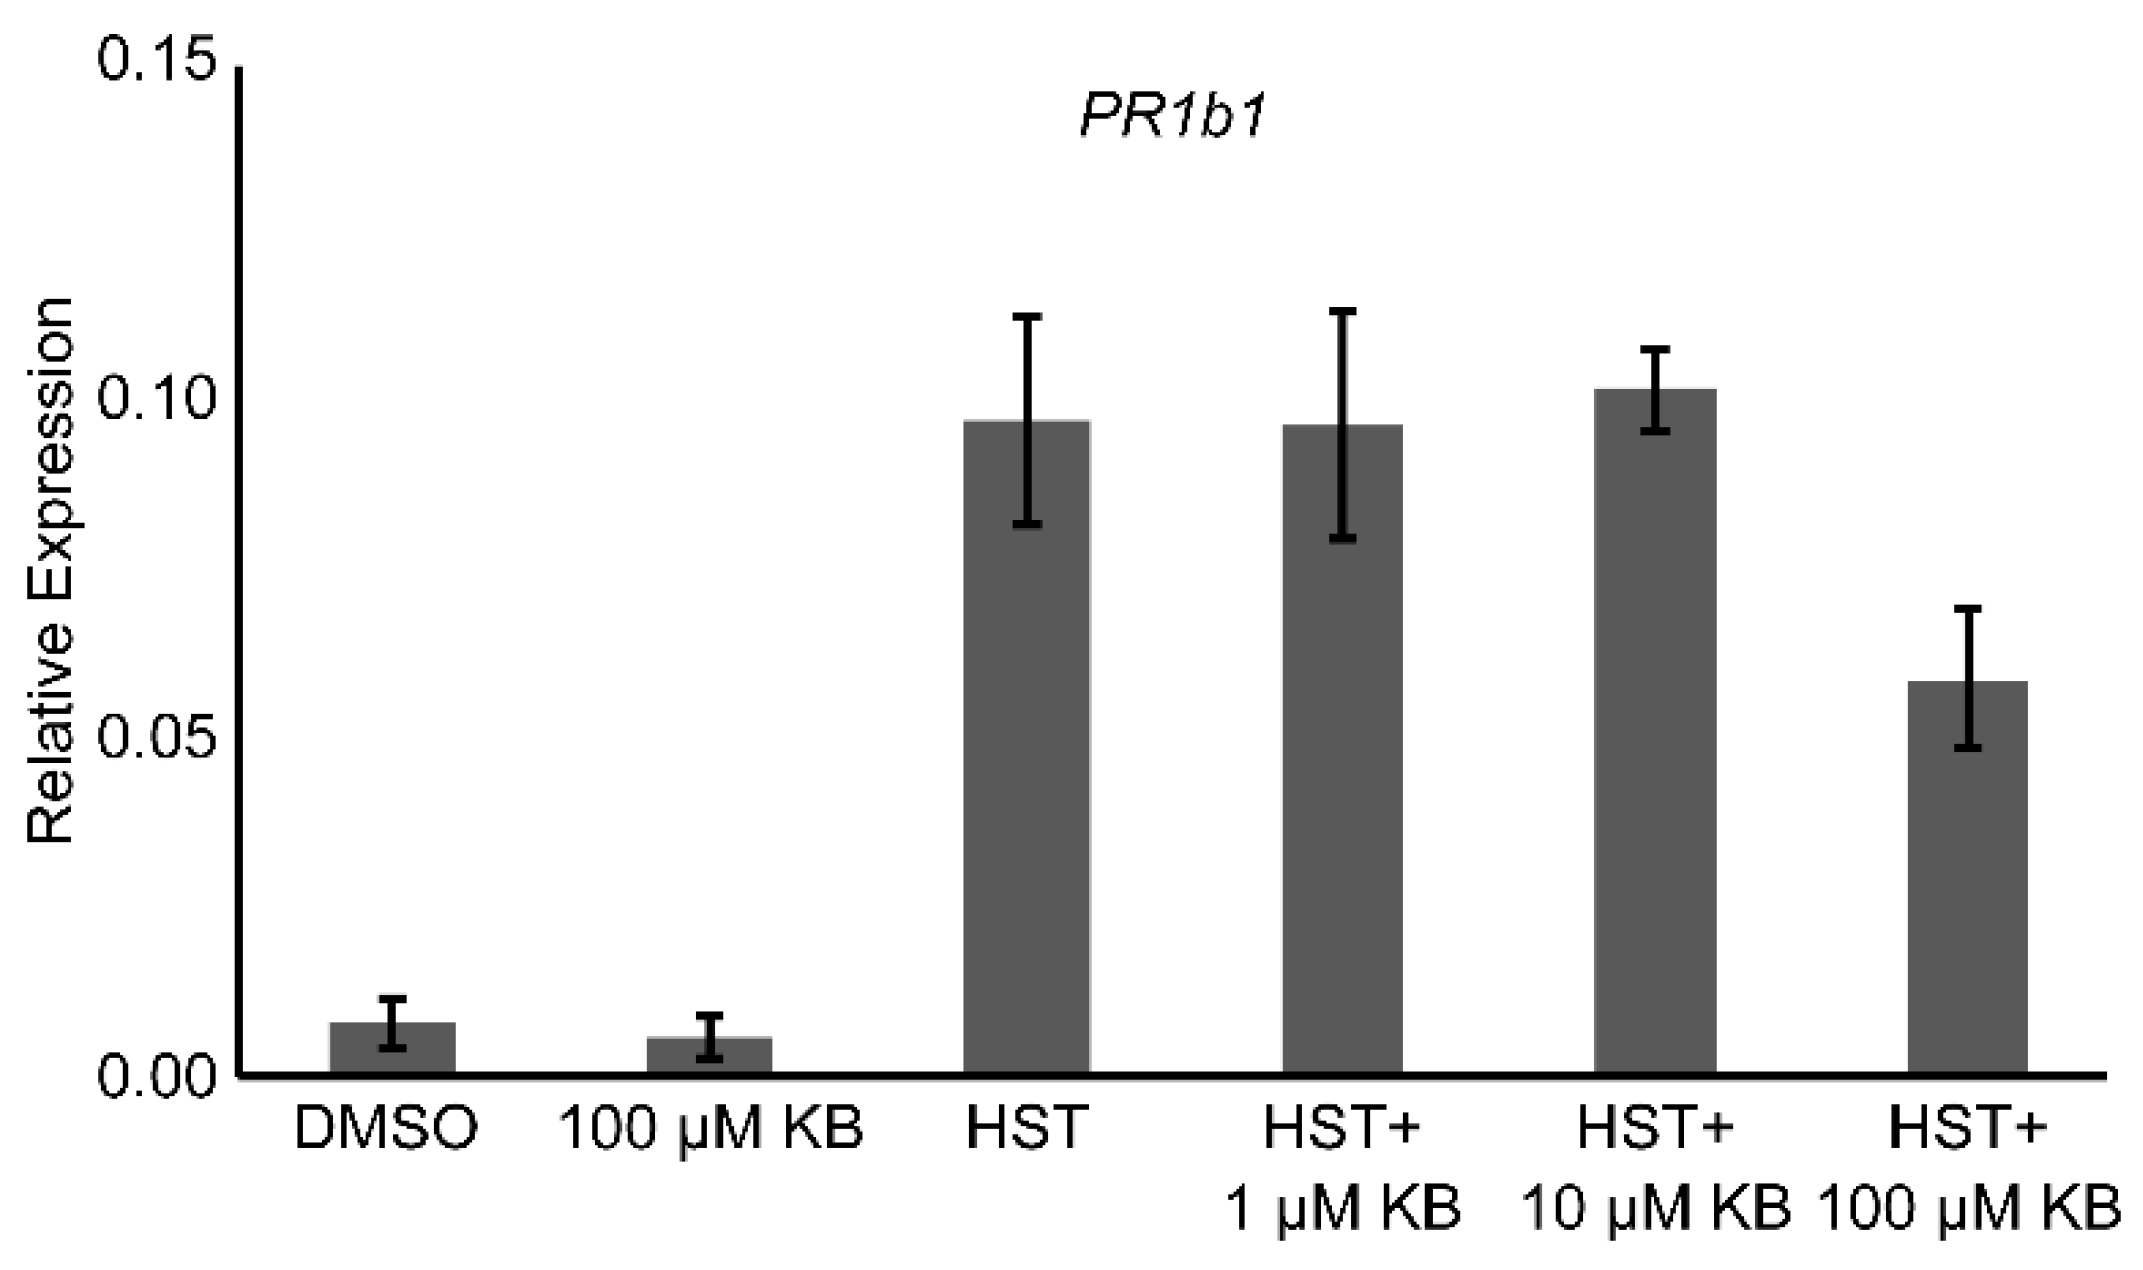
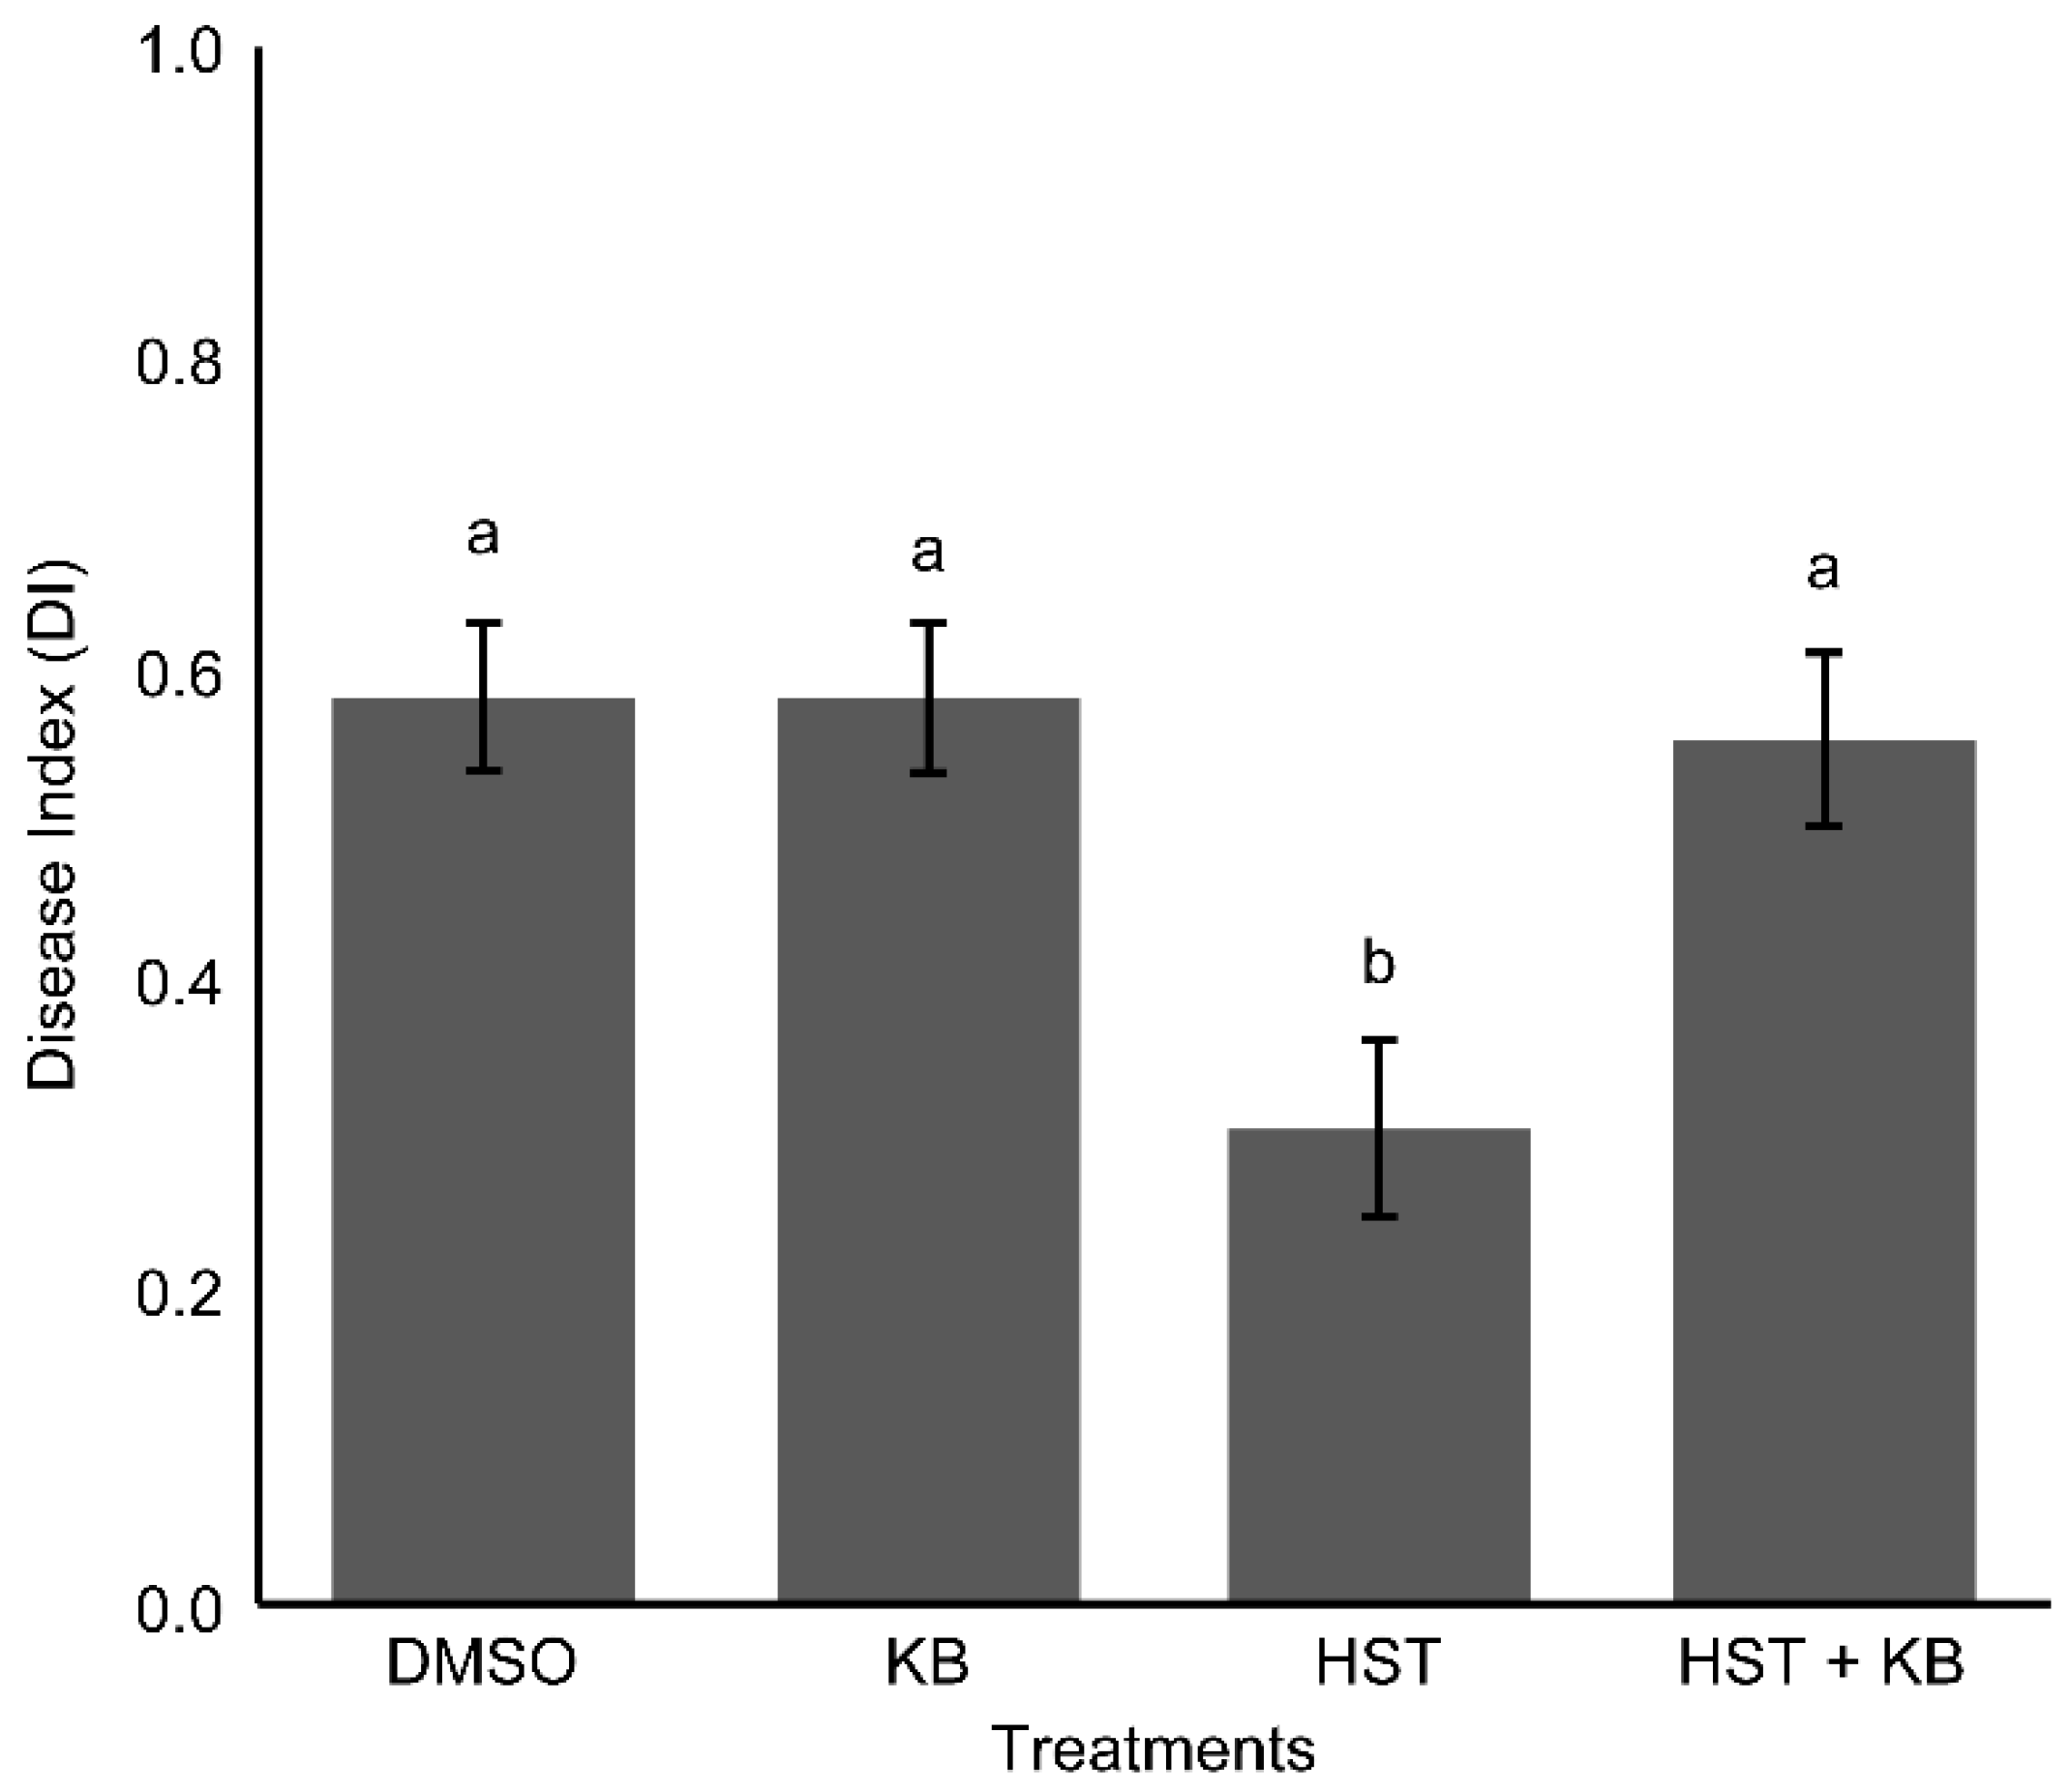
3.4. HSP90 and HSF Inhibitor Treatment
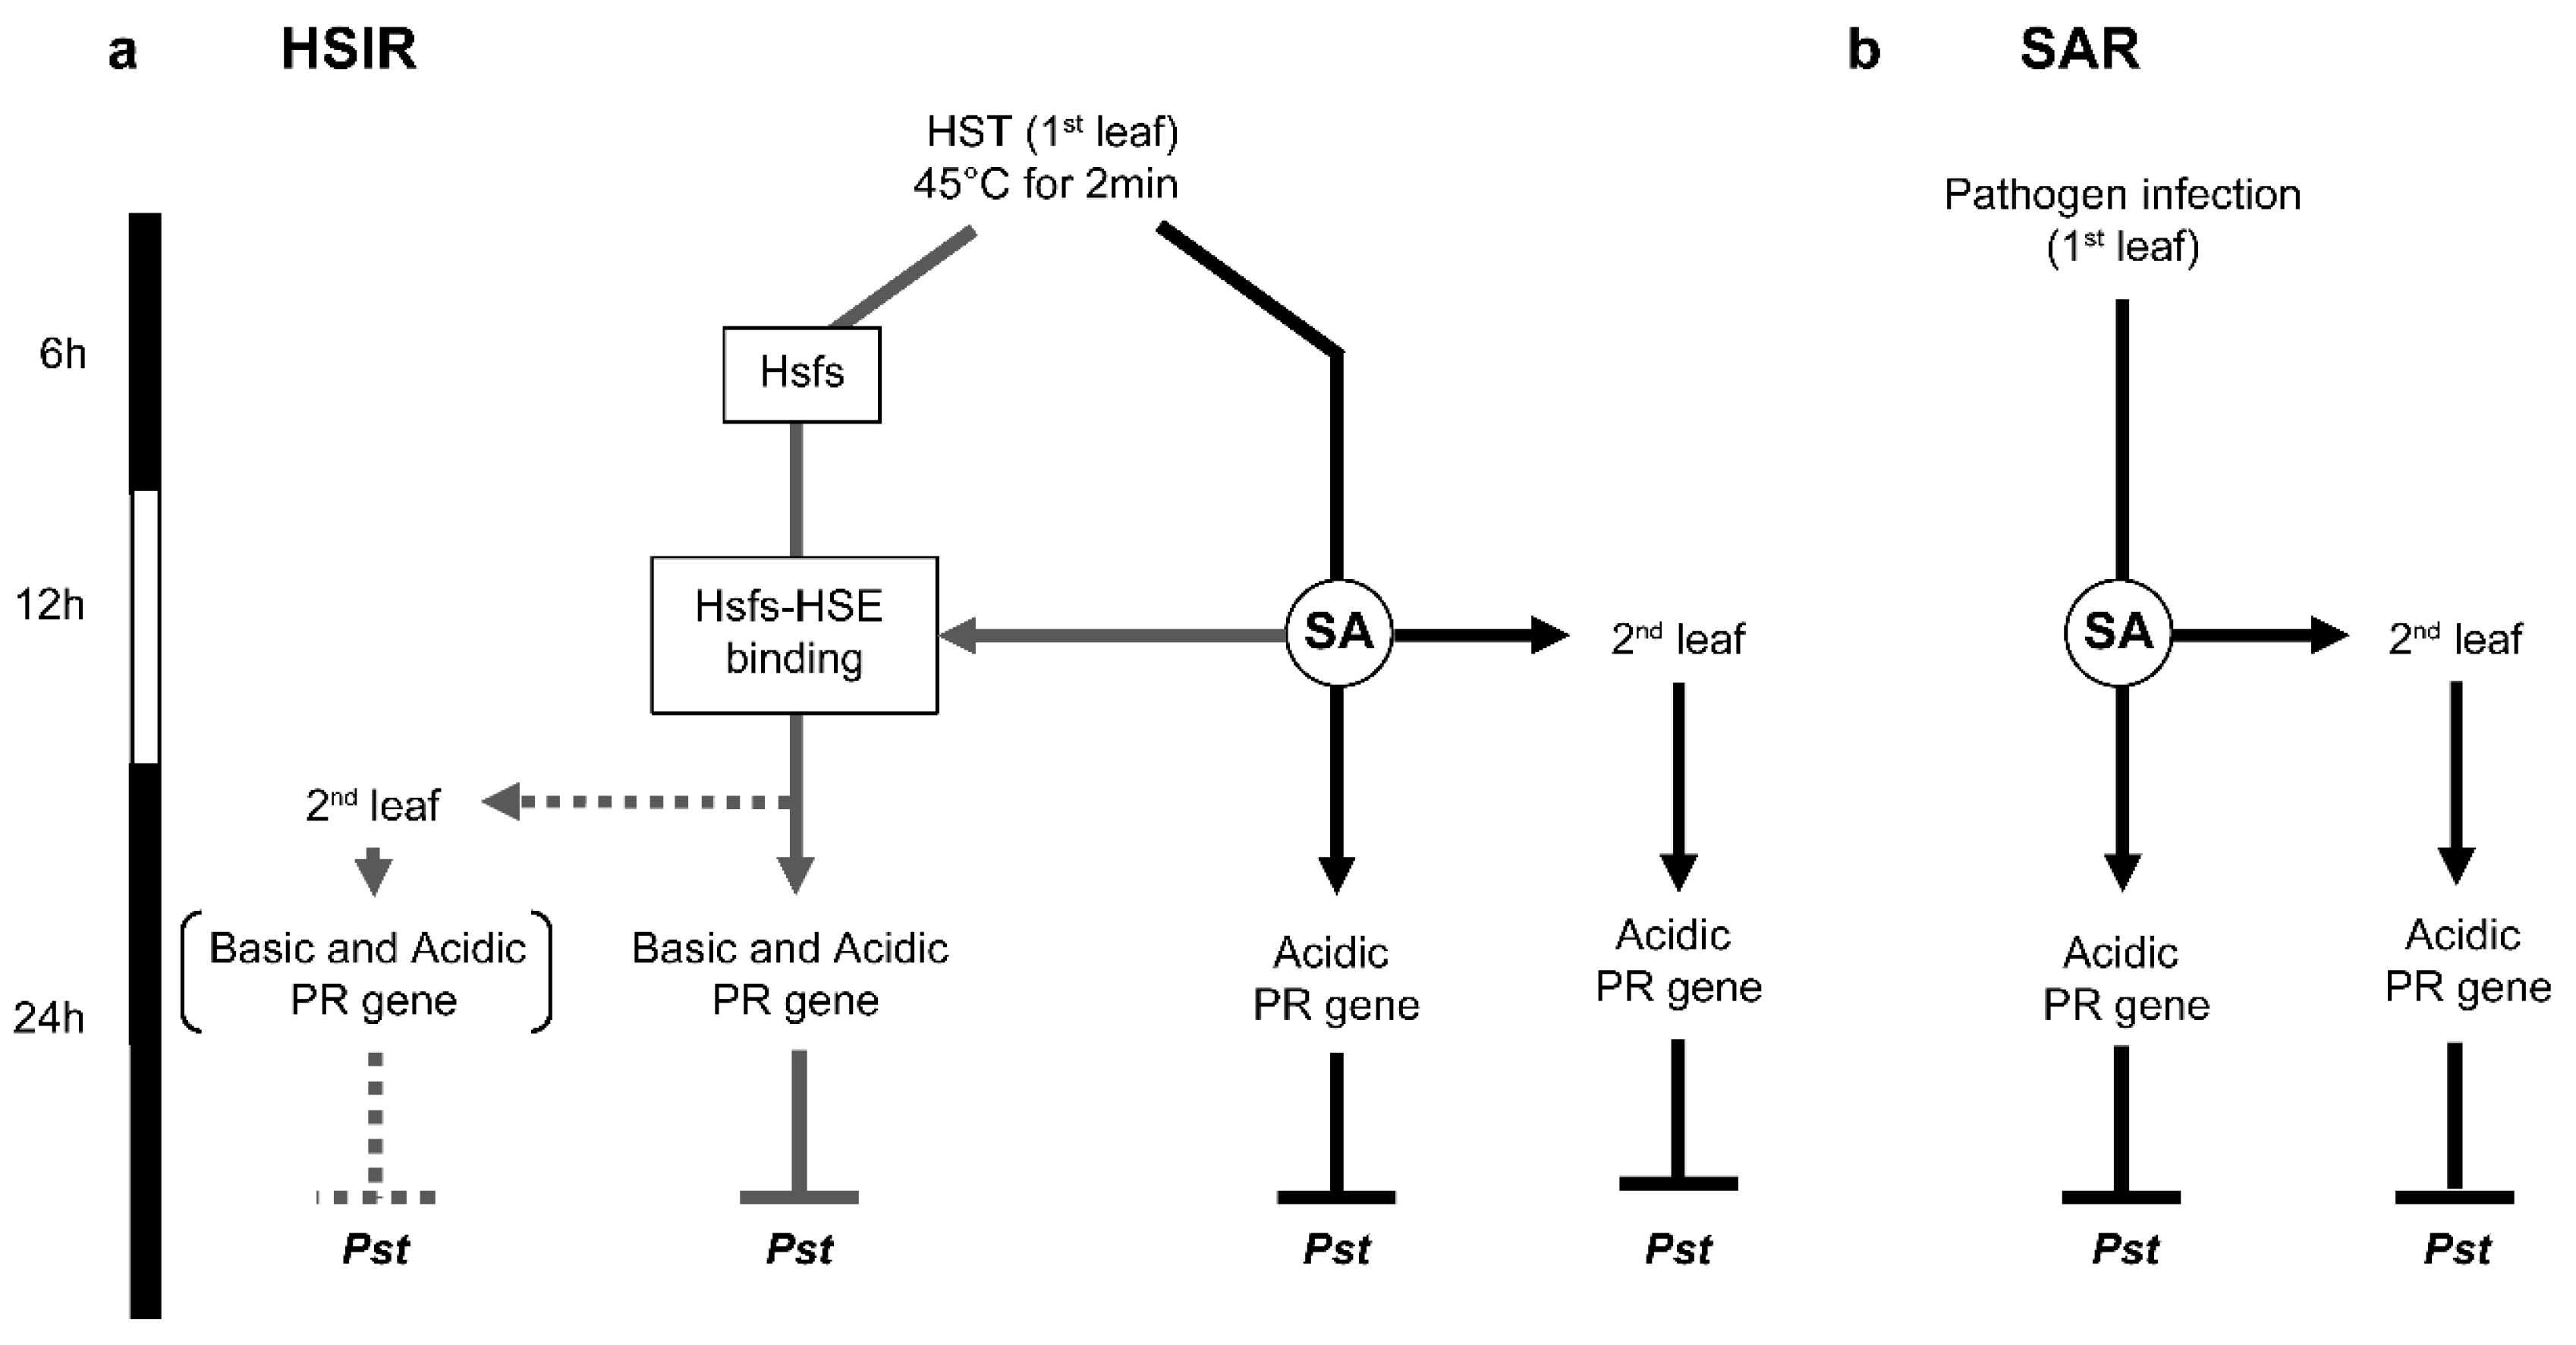
4. Conclusions
Supplementary Materials
Author Contributions
Funding
Acknowledgments
Conflicts of Interest
References
- Widiastuti, A.; Yoshino, M.; Saito, H.; Maejima, K.; Zhou, S.; Odani, H.; Hasegawa, M.; Nitta, Y.; Sato, T. Induction of disease resistance against Botrytis cinerea by heat shock treatment in melon (Cucumis melo L.). Physiol. Mol. Plant Pathol. 2011, 75, 157–162. [Google Scholar] [CrossRef]
- Widiastuti, A.; Yoshino, M.; Saito, H.; Maejima, K.; Zhou, S.; Odani, H.; Narisawa, K.; Hasegawa, M.; Nitta, Y.; Sato, T. Heat shock-induced resistance in strawberry against crown rot fungus Colletotrichum gloeosporioides. Physiol. Mol. Plant Pathol. 2013, 84, 86–91. [Google Scholar] [CrossRef]
- Yoshino, M.; Widiastuti, A.; Hasegawa, M.; Sato, T. Induction of disease resistance against gray mold by heat shock using hot water dipping in cucumber and its underlying mechanism. Hortic. Res. 2011, 10, 429–433. [Google Scholar] [CrossRef]
- Cronjé, M.J.; Bornman, L. Salicylic acid influences Hsp70/Hsc70 expression in Lycopersicon esculentum: Dose- and time-dependent induction or potentiation. Biochem. Biophys. Res. Commun. 2006, 427, 422–427. [Google Scholar] [CrossRef] [PubMed]
- Cronjé, M.J.; Weir, I.E.; Bornman, L. Salicylic acid-mediated potentiation of Hsp70 induction correlates with reduced apoptosis in tobacco protoplasts. Cytometry Part A 2004, 61, 76–87. [Google Scholar] [CrossRef] [PubMed]
- Liu, H.C.; Liaom, H.T.; Charng, Y.Y. The role of class A1 heat shock factors (HSFA1s) in response to heat and other stresses in Arabidopsis. Plant Cell Environ. 2011, 34, 738–751. [Google Scholar] [CrossRef] [PubMed]
- Liu, H.; Charng, Y. Acquired thermotolerance independent of heat shock factor A1 (HsfA1), the master regulator of the heat stress response. Plant Signal. Behav. 2012, 7, 547–550. [Google Scholar] [CrossRef]
- Xue, G.P.; Sadat, S.; Drenth, J.; McIntyre, C.L. The heat shock factor family from Triticum aestivum in response to heat and other major abiotic stresses and their role in regulation of heat shock protein genes. J. Exp. Bot. 2014, 65, 539–557. [Google Scholar] [CrossRef]
- Basra, A. Crop Responses and Adaptations to Temperature Stress: New Insights and Approaches; CRC Press/Taylor & Francis: Baca Raton, FL, USA, 2000; Volume 223, ISBN 1-56022-890-3. [Google Scholar]
- von Koskull-Döring, P.; Scharf, K.D.; Nover, L. The diversity of plant heat stress transcription factors. Trends Plant Sci. 2007, 12, 452–457. [Google Scholar] [CrossRef]
- Nover, L.; Bharti, K.; Döring, P.; Mishra, S.K.; Ganguli, A.; Scharf, K.-D. Arabidopsis and the heat stress transcription factor world: How many heat stress transcription factors do we need? Cell Stress Chaperones 2001, 6, 177. [Google Scholar] [CrossRef] [PubMed]
- Treuter, E.; Nover, L.; Ohme, K.; Scharf, K.D. Promoter specificity and deletion analysis of three heat stress transcription factors of tomato. Mol. Gen. Genet. 1993, 240, 113–125. [Google Scholar] [CrossRef] [PubMed]
- Chan-Schaminet, K.Y.; Baniwal, S.K.; Bublak, D.; Nover, L.; Scharf, K.D. Specific interaction between tomato HsfA1 and HsfA2 creates hetero-oligomeric superactivator complexes for synergistic activation of heat stress gene expression. J. Biol. Chem. 2009, 284, 20848–20857. [Google Scholar] [CrossRef] [PubMed]
- Hahn, A.; Bublak, D.; Schleiff, E.; Scharf, K.D. Crosstalk between Hsp90 and Hsp70 chaperones and heat stress transcription factors in tomato. Plant Cell 2011, 23, 741–755. [Google Scholar] [CrossRef] [PubMed]
- Storozhenko, S.; De Pauw, P.; Van Montagu, M.; Inzé, D.; Kushnir, S. The heat-shock element is a functional component of the Arabidopsis APX1 gene promoter. Plant Physiol. 1998, 118, 1005–1014. [Google Scholar] [CrossRef] [PubMed]
- Sato, Y.; Murakami, T.; Funatsuki, H.; Matsuba, S.; Saruyama, H.; Tanida, M. Heat shock-mediated APX gene expression and protection against chilling injury in rice seedlings. J. Exp. Bot. 2001, 52, 145–151. [Google Scholar] [CrossRef] [PubMed]
- Kumar, M.; Busch, W.; Birke, H.; Kemmerling, B.; Nürnberger, T.; Schöffl, F. Heat shock factors HsfB1 and HsfB2b are involved in the regulation of Pdf1.2 expression and pathogen resistance in Arabidopsis. Mol. Plant 2009, 2, 152–165. [Google Scholar] [CrossRef]
- Prodromou, C.; Roe, S.M.; O’Brien, R.; Ladbury, J.E.; Piper, P.W.; Pearl, L.H. Identification and structural characterization of the ATP/ADP-binding site in the Hsp90 molecular chaperone. Cell 1997, 90, 65–75. [Google Scholar] [CrossRef]
- Moshe, A.; Gorovits, R.; Liu, Y.; Czosnek, H. Tomato plant cell death induced by inhibition of HSP90 is alleviated by Tomato yellow leaf curl virus infection. Mol. Plant Pathol. 2016, 17, 247–260. [Google Scholar] [CrossRef]
- McConnell, J.R.; Buckton, L.K.; McAlpine, S.R. Regulating the master regulator: Controlling heat shock factor 1 as a chemotherapy approach. Bioorg. Med. Chem. Lett. 2015, 25, 3409–3414. [Google Scholar] [CrossRef]
- Yoon, Y.J.; Kim, J.A.; Shin, K.D.; Shin, D.S.; Han, Y.M.; Lee, Y.J.; Lee, J.S.; Kwon, B.M.; Han, D.C. KB inhibits HSP70 synthesis through inhibition of heat shock factor 1 function by impairing the recruitment of positive transcription elongation factor b to the hsp70 promoter. J. Biol. Chem. 2011, 286, 1737–1747. [Google Scholar] [CrossRef]
- Tornero, P.; Gadea, J.; Conejero, V.; Vera, P. Two PR-1 genes from tomato are differentially regulated and reveal a novel mode of expression for a pathogenesis-related gene during the hypersensitive response and development. Mol. Plant Microbe Interact. 1997, 10, 624–634. [Google Scholar] [CrossRef] [PubMed]
- Francia, D.; Demaria, D.; Calderini, O.; Ferraris, L.; Valentino, D.; Arcioni, S.; Tamietti, G.; Cardinale, F. Wounding induces resistance to pathogens with different lifestyles in tomato: Role of ethylene in cross-protection. Plant Cell Environ. 2007, 30, 1357–1365. [Google Scholar] [CrossRef] [PubMed]
- Di Baccio, D.; Ederli, L.; Marabottini, R.; Badiani, M.; Francini, A.; Nali, C.; Antonelli, M.; Santangelo, E.; Sebastiani, L.; Pasqualini, S. Similar foliar lesions but opposite hormonal patterns in a tomato mutant impaired in ethylene perception and its near isogenic wild type challenged with ozone. Environ. Exp. Bot. 2012, 75, 286–297. [Google Scholar] [CrossRef]
- Sato, T.; Yasuda, M.; Kubo, M.; Nakashita, H.; Arie, T.; Teraoka, T.; Takayanagi, R.; Yoneyama, Y.; Yoshida, S. Analysis of gray mold resistance of tomato induced by heat shock treatment. In Proceedings of the Abstracts of the 46th Annual Meeting of the Japanese Society of Plant Physiologists, Niigata, Japan, 24–26 March 2005. [Google Scholar] [CrossRef]
- Widiastuti, A.; Yoshino, M.; Hasegawa, M.; Nitta, Y.; Sato, T. Heat shock-induced resistance increases chitinase-1 gene expression and stimulates salicylic acid production in melon (Cucumis melo L.). Physiol. Mol. Plant Pathol. 2013, 82, 51–55. [Google Scholar] [CrossRef]
- Stout, M.J.; Fidantsef, A.L.; Duffey, S.S.; Bostock, R.M. Signal interactions in pathogen and insect attack: Systemic plant-mediated interactions between pathogens and herbivores of the tomato, Lycopersicon esculentum. Physiol. Mol. Plant Pathol. 1999, 54, 115–130. [Google Scholar] [CrossRef]
- Kumar, D. Salicylic acid signaling in disease resistance. Plant Sci. 2014, 228, 127–134. [Google Scholar] [CrossRef] [PubMed]
- Derksen, H.; Rampitsch, C.; Daayf, F. Signaling cross-talk in plant disease resistance. Plant Sci. 2013, 207, 79–87. [Google Scholar] [CrossRef]
- Park, S.W.; Kaimoyo, E.; Kumar, D.; Mosher, S.; Klessig, D.F. Methyl salicylate is a critical mobile signal for plant systemic acquired resistance. Science 2007, 318, 113–116. [Google Scholar] [CrossRef]
- Larkindale, J. Protection against heat stress-induced oxidative damage in Arabidopsis involves calcium, abscisic acid, ethylene, and salicylic acid. Plant Physiol. 2002, 128, 682–695. [Google Scholar] [CrossRef]
- Khan, M.I.R.; Iqbal, N.; Masood, A.; Per, T.S.; Khan, N.A. Salicylic acid alleviates adverse effects of heat stress on photosynthesis through changes in proline production and ethylene formation. Plant Signal. Behav. 2013, 8, e26374. [Google Scholar] [CrossRef]
- Wang, L.J.; Fan, L.; Loescher, W.; Duan, W.; Liu, G.J.; Cheng, J.S.; Luo, H.B.; Li, S.H. Salicylic acid alleviates decreases in photosynthesis under heat stress and accelerates recovery in grapevine leaves. BMC Plant Biol. 2010, 10, 34. [Google Scholar] [CrossRef] [PubMed]
- Snyman, M.; Cronjém, M.J. Modulation of heat shock factors accompanies salicylic acid-mediated potentiation of Hsp70 in tomato seedlings. J. Exp. Bot. 2008, 59, 2125–2132. [Google Scholar] [CrossRef] [PubMed]
- Nover, L. Expression of heat shock genes in homologous and heterologous systems. Enzym. Microb. Technol. 1987, 9, 130–144. [Google Scholar] [CrossRef]
- Hoffman, E.; Corces, V. Sequences involved in temperature and ecdysterone-induced transcription are located in separate regions of a Drosophila melanogaster heat shock gene. Mol. Cell. Biol. 1986, 6, 663–673. [Google Scholar] [CrossRef] [PubMed]
- Goyal, R.K.; Fatima, T.; Topuz, M.; Bernadec, A.; Sicher, R.; Handa, A.K.; Mattoo, A.K. Pathogenesis-related protein 1b1 (PR1b1) is a major tomato fruit protein responsive to chilling temperature and upregulated in high polyamine transgenic genotypes. Front. Plant Sci. 2016, 7, 901. [Google Scholar] [CrossRef] [PubMed]


| Target Gene | Location | Accession Number | Properties | Primer Name | Sequence (5′ to 3′) |
|---|---|---|---|---|---|
| PR1a2 | chr 9 | NM_001321040.1 | Pathogenesis-related leaf protein 4 Acidic | SLPR1a2 F | TGTTACTTATGACTTGTCTCATGGT |
| SLPR1a2 R | CGACCCAATTGCCTACAGGA | ||||
| PR1b1 | unplaced scaffold | NM_001247385.2 | Pathogenesis-related leaf protein 6 Basic | SLPR1b1 F | ACATCTCATTGTTACTCACTTGTCT |
| SLPR1b1 R | GACGTTGTCCGATCCAGTT | ||||
| GluA | chr 1 | NM_001247869.2 | Glucan endo-1,3-beta-d-glucosidase Acidic | SLGluA F | GGTCTCAACCGCGACATATT |
| SLGluA R | CACAAGGGCATCGAAAAGAT | ||||
| GluB | chr 1 | NM_001247876.2 | β-1,3-glucanases Basic | SLGluB F | TCTTGCCCCATTTCAAGTTC |
| SLGluB R | TGCACGTGTATCCCTCAAAA | ||||
| Chi3 | chr 2 | NM_001247475.2 | Class III endochitinase Acidic | SLChi3 F | TGCAGGAACATTCACTGGAG |
| SLChi3 R | TAACGTTGTGGCATGATGGT | ||||
| Chi9 | chr 10 | NM_001247474.2 | Class I chitinase Basic | SLChi9 F | CTCCAATGGCTCTTCCACAT |
| SLChi9 R | GAAATTGCTGCTTTCCTTGC | ||||
| HsfA2 | chr 8 | XM_010326728.2 | Heat shock transcription factor A2 | SLHsfA2 F | GCGAATGGAGGTTTTCTGGG |
| SLHsfA2 R | GTCACAACAGAATCCGGCCT | ||||
| HsfB1 | chr 2 | NM_001321450.1 | Heat shock transcription factor B1 | SLHsfB1 F | CTATACGCCGTCGGAAGACC |
| SLHsfB1 R | TACCACGTCCACCACAAGTC | ||||
| GAPDH | chr 5 | NM_001279325.2 | Glyceraldehyde-3-phosphate dehydrogenase | SLGAPDH F | GGTTTGGCATTGTTGAGGGTC |
| SLGAPDH R | TCGACAACGGAGACATCAGC |
© 2018 by the authors. Licensee MDPI, Basel, Switzerland. This article is an open access article distributed under the terms and conditions of the Creative Commons Attribution (CC BY) license (http://creativecommons.org/licenses/by/4.0/).
Share and Cite
Arofatullah, N.A.; Hasegawa, M.; Tanabata, S.; Ogiwara, I.; Sato, T. Heat Shock-Induced Resistance against Pseudomonas syringae pv. tomato (Okabe) Young et al. via Heat Shock Transcription Factors in Tomato. Agronomy 2019, 9, 2. https://doi.org/10.3390/agronomy9010002
Arofatullah NA, Hasegawa M, Tanabata S, Ogiwara I, Sato T. Heat Shock-Induced Resistance against Pseudomonas syringae pv. tomato (Okabe) Young et al. via Heat Shock Transcription Factors in Tomato. Agronomy. 2019; 9(1):2. https://doi.org/10.3390/agronomy9010002
Chicago/Turabian StyleArofatullah, Nur Akbar, Morifumi Hasegawa, Sayuri Tanabata, Isao Ogiwara, and Tatsuo Sato. 2019. "Heat Shock-Induced Resistance against Pseudomonas syringae pv. tomato (Okabe) Young et al. via Heat Shock Transcription Factors in Tomato" Agronomy 9, no. 1: 2. https://doi.org/10.3390/agronomy9010002
APA StyleArofatullah, N. A., Hasegawa, M., Tanabata, S., Ogiwara, I., & Sato, T. (2019). Heat Shock-Induced Resistance against Pseudomonas syringae pv. tomato (Okabe) Young et al. via Heat Shock Transcription Factors in Tomato. Agronomy, 9(1), 2. https://doi.org/10.3390/agronomy9010002