Article

Testing and Improving the WOFOST Model for Sunflower Simulation on Saline Soils of Inner Mongolia, China

1
State Key Laboratory of Water Resources and Hydropower Engineering Science, Wuhan University, Wuhan 430072, China
2
Department of Hydrology and Water Resources, Hohai University, Nanjing 210098, China
*
Author to whom correspondence should be addressed.
Agronomy 2018, 8(9), 172; https://doi.org/10.3390/agronomy8090172
Submission received: 17 July 2018 / Revised: 19 August 2018 / Accepted: 25 August 2018 / Published: 1 September 2018

Abstract

:
Monitoring and improving environmental stress in crops is vital for the sustainable development of agriculture and food security. Traditional experimental methods are costly and time-consuming, yet crop growth models focus mainly only on water and nutrient stresses. In this study, a new World Food Studies (WOFOST) model, WOFOST-ES, was developed by the addition of a general environmental stress factor (ES). To calibrate and validate WOFOST-ES, two-year micro-plot experiments and one-year field experiments with sunflower were conducted in the Hetao Irrigation District, China. The results of the micro-plot experiments indicated that the WOFOST model failed to simulate sunflower growth correctly but that the WOFOST-ES model was highly accurate in simulating both yield (R2 = 0.99, root mean square error (RMSE) = 56 kg/ha) and leaf area index (LAI) (R2 = 0.86, RMSE = 0.44). A statistical method for estimating ESs based on the dominant stress factor (salt at our study site) was also proposed as a supplemental tool for WOFOST-ES, and micro-plot and field experiments conducted in 2013 and 2017 both proved acceptable accuracy of the statistical method when using WOFOST-ES. Comparison between ESs and the water and salt stress factors of Feddes-type stress reduction functions indicated that ESs failed to reveal actual environmental stresses during the sunflower seeding stage but did reflect other environmental stresses in addition to water and salt during the bud, flowering, and maturity stages. Although the present WOFOST-ES model proved to be accurate, stable, and practical, future studies should be performed, focusing on the physical separation of ESs, their mechanistic quantification, and their evaluation at small time steps using more observations.

1. Introduction

Soil salinization is a serious environmental problem affecting more than 8.31 × 10⁸ ha of soil resources worldwide [1,2,3,4]. High salt concentrations in soil can decrease both the growth rate and ultimate size of crops by increasing the osmotic potential of soil water [5,6]. Researchers indicated that the reduction in crop yield due to soil salinization normally ranges from 10% to 90% for wheat, 30% to 50% for rice, 50% to 75% for cotton, and 30% to 90% for sugarcane [7]. Furthermore, single salts or extreme ion ratios are likely to result in specific ion toxicities, which may lead to leaf damage and defoliation, furthering decreasing photosynthesis [8]. Salinity can also induce elemental nutrient deficiencies or imbalances in crops, and there is consensus that high salinity is a significant threat to the sustainable development of agriculture and food security [9,10,11]. Since the last century, numerous experimental studies have been performed to identify a solution for this issue, and many distinguished achievements have been documented [12,13]. However, with continuing in-depth research, scientists have realized the shortcomings of purely experimental studies. For example, salt tolerance varies widely among different crop species: some crops, such as strawberry and sesame, are highly sensitive to salinity [14,15], whereas other crops, including cotton and triticale, are almost as tolerant as some halophytes [16,17]. In addition, salt tolerance changes during crop growth [18]. Therefore, it is difficult to systematically describe interactions between crop and salinity using only experiments; in fact, these variabilities in salt tolerance have caused inconsistent experimental findings. For instance, despite a previous classification as moderately sensitive, Katerji et al. [19] re-classified maize and sunflower as salt-tolerant crops. Our previous studies also proved that sunflower can grow better under slightly moderate saline conditions, which is contrary to results indicating that sunflower yield decreases with soil salinity [20]. Although salt is usually the dominant factor restricting crop growth in salt-affected regions, other factors such as climate and nutrient status may also impact crop growth [21,22,23], yet experiments cannot consider all these factors due to the associated time and cost.
As alternatives to experimentation, researchers have developed many models to simulate crop growth dynamics in agro-ecosystems, and some of these models can also consider environmental stresses that affect crops (Table 1). For example, World Food Studies (WOFOST) accounts for soil water stress and calculates nutrient demand for potential crop growth [24]. The Agricultural Production Systems sIMulator (APSIM) can simulate crop growth under both water and nutrient stress conditions [25], and HYDRUS has the ability to simultaneously model root water uptake affected by various stress factors (e.g., water and salt) using Feddes-type stress reduction functions (Feddes model) [26]. Nonetheless, it is clear that models accounting for numerous environmental stress factors largely focus on soil hydrologic dynamics (e.g., HYDRUS, SWAT (The Soil and Water Assessment Tool)) [26,27] and that models based on crop physiology (e.g., WOFOST, APSIM) typically only consider a few environmental stress factors (e.g., water, nutrients, and heat).
Consequently, Zhou et al. [42], Li et al. [43], Li et al. [44], and Eweys, Elwan and Borham [34] proposed the coupling of crop and hydrologic models to maximize their advantages. This approach appears to be beneficial, and it has been used in some studies. However, in addition to the possible conflicts that arise during coupling, this approach requires more input parameters, which may cause difficulties for model calibration. Moreover, some of the input parameters (e.g., soil hydraulic parameters) are difficult to obtain, which also restricts the application of this approach across large regions.
Based on our previous experience, complicated approaches are usually not the most efficient [18]. In large-scale modeling, it is common to use a general factor that reflects complicated interactions among different stress factors (e.g., water, salt, heat, cold, and nutrients) and crops. Moreover, due to the development of modern agricultural management, many stress factors can be well controlled in field practice. For example, in the Hetao Irrigation District (HID), a typical salt-affected region of China, soil moisture is artificially adjusted to be suitable for crop growth using flood irrigation before sowing and film-covered planting [45,46]. Because salinity is the dominant factor that affects crop growth in the HID, we hypothesize that different stresses can be reflected by a general environmental stress factor (ES) and that ES can be quantified based on dominant stress factor observations.
The main objective of this study is to determine a general stress factor to consider the different environmental stresses. To this end, we conducted two-year micro-plot experiments on sunflower (one of the main cash crops in the study region) in the HID and applied WOFOST as the base model for two reasons. First, WOFOST is a physical-based crop growth model that focuses on crop physiology. Second, this model has been widely used and is open source, which facilitates further development. After evaluating the performance of the WOFOST model using field experimental data, we developed and validated a new WOFOST model, WOFOST-ES, by adding a general ES. We also proposed a statistical method for determining ESs, which may offer a novel strategy for improving crop growth modeling in the future.

2. Materials and Methods

2.1. Descriptions of WOFOST and New Improvements

The WOFOST model was designed to simulate plant growth and physiological development processes at a daily time step; it has been widely applied to many crops, including sunflower [47]. WOFOST first calculates the dry matter growth rate by computing the potential gross assimilation of a crop under optimal conditions based on effective incoming radiation. A portion of the available carbohydrates is used to provide energy for maintenance and crop respiration, and the remainder is converted into dry matter during the crop growth season. The gross dry matter is then partitioned among different organs (leaves, stems, storage organs, and roots) based on a pre-defined partitioning fraction for these organs [48]. The present version of WOFOST (version 7.1.7) accounts for water stress using the ratio of actual to potential transpiration as a reduction coefficient for gross assimilate. However, WOFOST does not incorporate any stress factor to reflect the impacts of other environmental stresses (e.g., salt, cold, and heat). In this study, we embedded a general ES into the WOFOST model (Equation (1)) to modify the potential productivity of sunflower through carbohydrate assimilation efficiency (WOFOST-ES, Figure 1).
AE(t) = ES(t) × AEP(t)
In Equation (1), AE(t) is the stress-affected assimilation efficiency at time t; AEP(t) is the assimilation efficiency of the potential productivity level under optimal growth conditions at time t.
In the WOFOST-ES model, ES also accounts for water stress. Therefore, the original WOFOST model should be configured to run only under the potential condition. In addition, although ES can vary with time at a daily step, it is usually difficult to obtain daily ES values in practice. Therefore, an option is to define ES based on specific crop growth stages. ES values range from 0 to 1. When the value is closer to 0, AE declines at a certain rate, whereas AE approaches the potential productivity level when the value is closer to 1.

2.2. Study Site

Both micro-plot and field experiments were conducted at the Yichang experimental station in the HID of Inner Mongolia, China (49°19′–41°18′ N, 106°20′–109°19′ E). The HID has the largest gravity irrigation area (approximately 1.05 × 10⁶ ha) in China and is representative of the temperate continental climate. The average annual precipitation and potential evapotranspiration are approximately 176 mm and 2056 mm, respectively, and approximately 60% of precipitation occurs from June to August [49]. Strong evaporation forces constant upward migration of groundwater and soil water with salt, causing salt accumulation in the root zone. The basic climate data for the present study were obtained from an agrometeorological station at our experimental site (Figure 2). Due to its salt-tolerant ability, sunflower is one of the dominant cash crops in the HID, accounting for more than 60% of farm land, and selling sunflower seed has become the main source of income for local farmers [18].

2.3. Micro-Plot Experiments

Micro-plot experiments for sunflower (cv. LD5009) were performed from 2012 to 2013. The crops were planted in micro-plots with undisturbed soil. Each micro-plot covered an area of 180 cm × 180 cm, and the sides were wrapped with impermeable plastic to a depth of 150 cm. Sunflower seeds were planted on 7 June 2012, and on 4 June 2013 (Table 2), in a grid of four rows (45 cm × 40 cm) in each micro-plot. The plants were harvested on 24 September 2012, and on 16 September 2013 (Table 2).
In each micro-plot, leaf area was measured on 22 July, 2 August, 9 August, and 20 August in 2012 and on 30 June, 10 July, 24 July, 14 August, 21 August, and 7 September in 2013 using a tape for the length (L) and width (W) of each leaf. The leaf area index (LAI) was calculated as 0.6564 × L × W [50]. After harvesting, air-dried seed yields (<8% moisture) from each micro-plot were weighted. More details about the experiments can be found in our previous publications [18,20]. The initial soil salt and moisture contents differed among micro-plots, and salt and moisture contents varied at different depths in the same micro-plot. Because our study focused on the effects of complex environmental stresses on sunflower growth, the LAI data and seed yield observations from 14 micro-plots with relatively large heterogeneous distributions of initial salt and moisture contents were selected as the data source for this study. Using 2012 as a reference, the maximum and minimum moisture contents were 0.592 cm3/cm3 and 0.073 cm3/cm3, respectively; the maximum and minimum soil salt contents (measured as saturated electrical conductivity, ECe) were 1.024 dS/m and 54.982 dS/m, respectively. Details of the soil physical properties and initial moisture and salt contents are shown in Table 3 and Table 4, respectively.

2.4. Field Experiments

Seven fields (F1 to F7) (7.5 m × 4.5 m) with naturally different salinity levels were established in farmers’ fields in 2017 (Table 3). The saturated electrical conductivity (ECe) was measured to indicate the salinity levels of each plot (Table 4). The respective mean, maximum, and minimum ECe values of the soil profile were approximately 4.9, 13.8, and 1.2 dS·m−1, indicating that the experimental plots ranged from non-saline (ECe < 4.5 dS·m−1) to highly saline (9 < ECe < 18 dS·m−1) soils [20]. At approximately one month before sowing, all fields at our study site had sufficient spring irrigation, and no irrigation was applied during the sunflower growth period. Furthermore, each plot was covered with three plastic films (1.0 m width, with a 0.25 m interval), and two rows of sunflower were sown through holes in each plastic film on 27 May 2017, and at harvest on 15 September 2017. Plant density was approximately 3.7 plants per square meter, and the sunflower cultivar used was JK601 because almost all local farmers plant this cultivar. The nitrogen application rate for all seven plots before sowing was 180 kg/ha. In addition, 90 kg/ha nitrogen was applied in F2, F4, F6, and F7, approximately 20 days after sowing. Other management practices, including insect and weed control, were performed according to local agronomic practices, unless otherwise indicated. Because the primary motivation for the field experiment was not for the present study, we only used the field measurements of soil salinity and yield as independent data in this study to evaluate the performance of the model. Specifically, three sunflower samples from each field were collected at harvest to measure air-dried seed yields (<8% moisture).

2.5. Simulation Strategies

Crop parameters of the WOFOST model under potential conditions were determined based on our observations and previous studies [20,46,51]. Specifically, micro-plot and field potential yields were determined by using the highest sunflower yield in both 2012 and 2013 for the micro-plots and in 2017 for the fields. The simulated potential yield should be close to but higher than the yield of the selected micro-plot (or field). The crop parameters used for sunflower under the potential condition are shown in Table 5.
The soil and weather files for the WOFOST model were prepared based on these measurements, and simulations were organized into four steps. In the first step, both potential and water-limited conditions were simulated by WOFOST to evaluate its performance using our experimental field data. In the second step, the ES values of the 14 micro-plots in 2012 were estimated according to LAI and yield observations using the PEST program [52]. PEST is the industry standard software package for parameter estimation and uncertainty analysis of complex environmental and other computer models. It is comprehensively documented and accompanied by a plethora of utility programs that support its use in conjunction with different kinds of other models. More details for the PEST program can be found in reference [52]. Because our observations for parameter calibration were limited and ES functions at a daily time step in our established WOFSOT-ES model, in this time step, we only used four ES values that represent the seedling, bud, flowering, and maturity stages of sunflower based on phenology observations (Table 2). This was done for simplification purposes and also to ensure reliability. In the third step, an empirical function for determining ES values from soil characteristics (e.g., moisture, salt) was proposed using partial least square regression (PLSR, details can be found in Section 2.6). In the fourth step, the proposed empirical function was tested using independent micro-plot and field data from 2013 to 2017, respectively.

2.6. Water and Salt Stresses of the Feddes Model

As described in Section 1, Feddes-type stress reduction functions (the Feddes model) can determine both water and salt stress factors, and they have been widely employed. Our study compared the ES values of the WOFOST-ES model with water potential and stress factors calculated using the Feddes model.
In the Feddes model, a piecewise linear reduction function was parameterized by four critical values of the water pressure head (h4 < h3 < h2 < h1) [53].
α ( h ) = { h h 4 h 3 h 4 , h 3 > h > h 4 1 , h 2 h h 3 h h 1 h 2 h 1 , h 1 > h > h 2 0 , h h 4   o r   h h 1
In Equation (2), α(h) is a water stress factor, and h is the water pressure head. Details for determining the above four critical values can be found in a previous publication [54].
Consistent with water stress, the effects of salinity stress α(π) on root water uptake can also be described using the piecewise linear function [55]:
α ( π ) = { 1 , a π 0 1 + b ( π a ) , a > π > a 1 b 0 , π a 1 b
In Equation (3), a and b are the adjustable parameters, often referred to as the salinity threshold and slope, respectively. In our study, a and b for each micro-plot were calculated as previously described [56].

2.7. Statistical Analysis

Correlation analysis between calibrated ES values for each micro-plot for the four growth stages and for some typical soil water and salt indices, such as the average water and salt contents at a specific depth, was first applied. Typical soil indices with a relatively high coefficient of determination (R2, Equation (4)) were then selected as independent variables (X values), with ES values selected as dependent variables (Y values). PLSR was used to establish an empirical relationship between X and Y. The PLSR method has the advantages of principal component analysis (PCA), canonical correlation analysis and linear regression methods, which can be used to solve multicollinearity problems. Detailed descriptions of PLSR can be found in Kopačková et al. [57], Fan et al. [58], Geladi and Kowalski [59] and our previous studies [60,61].
The root mean square error (RMSE, Equation (5)) and relative root mean square error (RRMSE, Equation (6)) were also used with R2 to evaluate the accuracy of the simulation.
R 2 = ( i = 1 n ( Y i m e a Y i m e a ¯ ) ( Y i m e a Y i s i m ¯ ) i = 1 n ( Y i m e a Y i m e a ¯ ) 2 i = 1 n ( Y i s i m Y i s i m ¯ ) 2 ) 2
R M S E = i = 1 n ( Y i m e a Y i s i m ) 2 n
R R M S E = R M S E y i m e a ¯
In Equations (4)–(6), n is the number of samples, Yimea is the i th measurement, Yisim is the i th simulation, and Y i m e a ¯ and Y i s i m ¯ are the means of the measurements and simulations, respectively.

3. Results

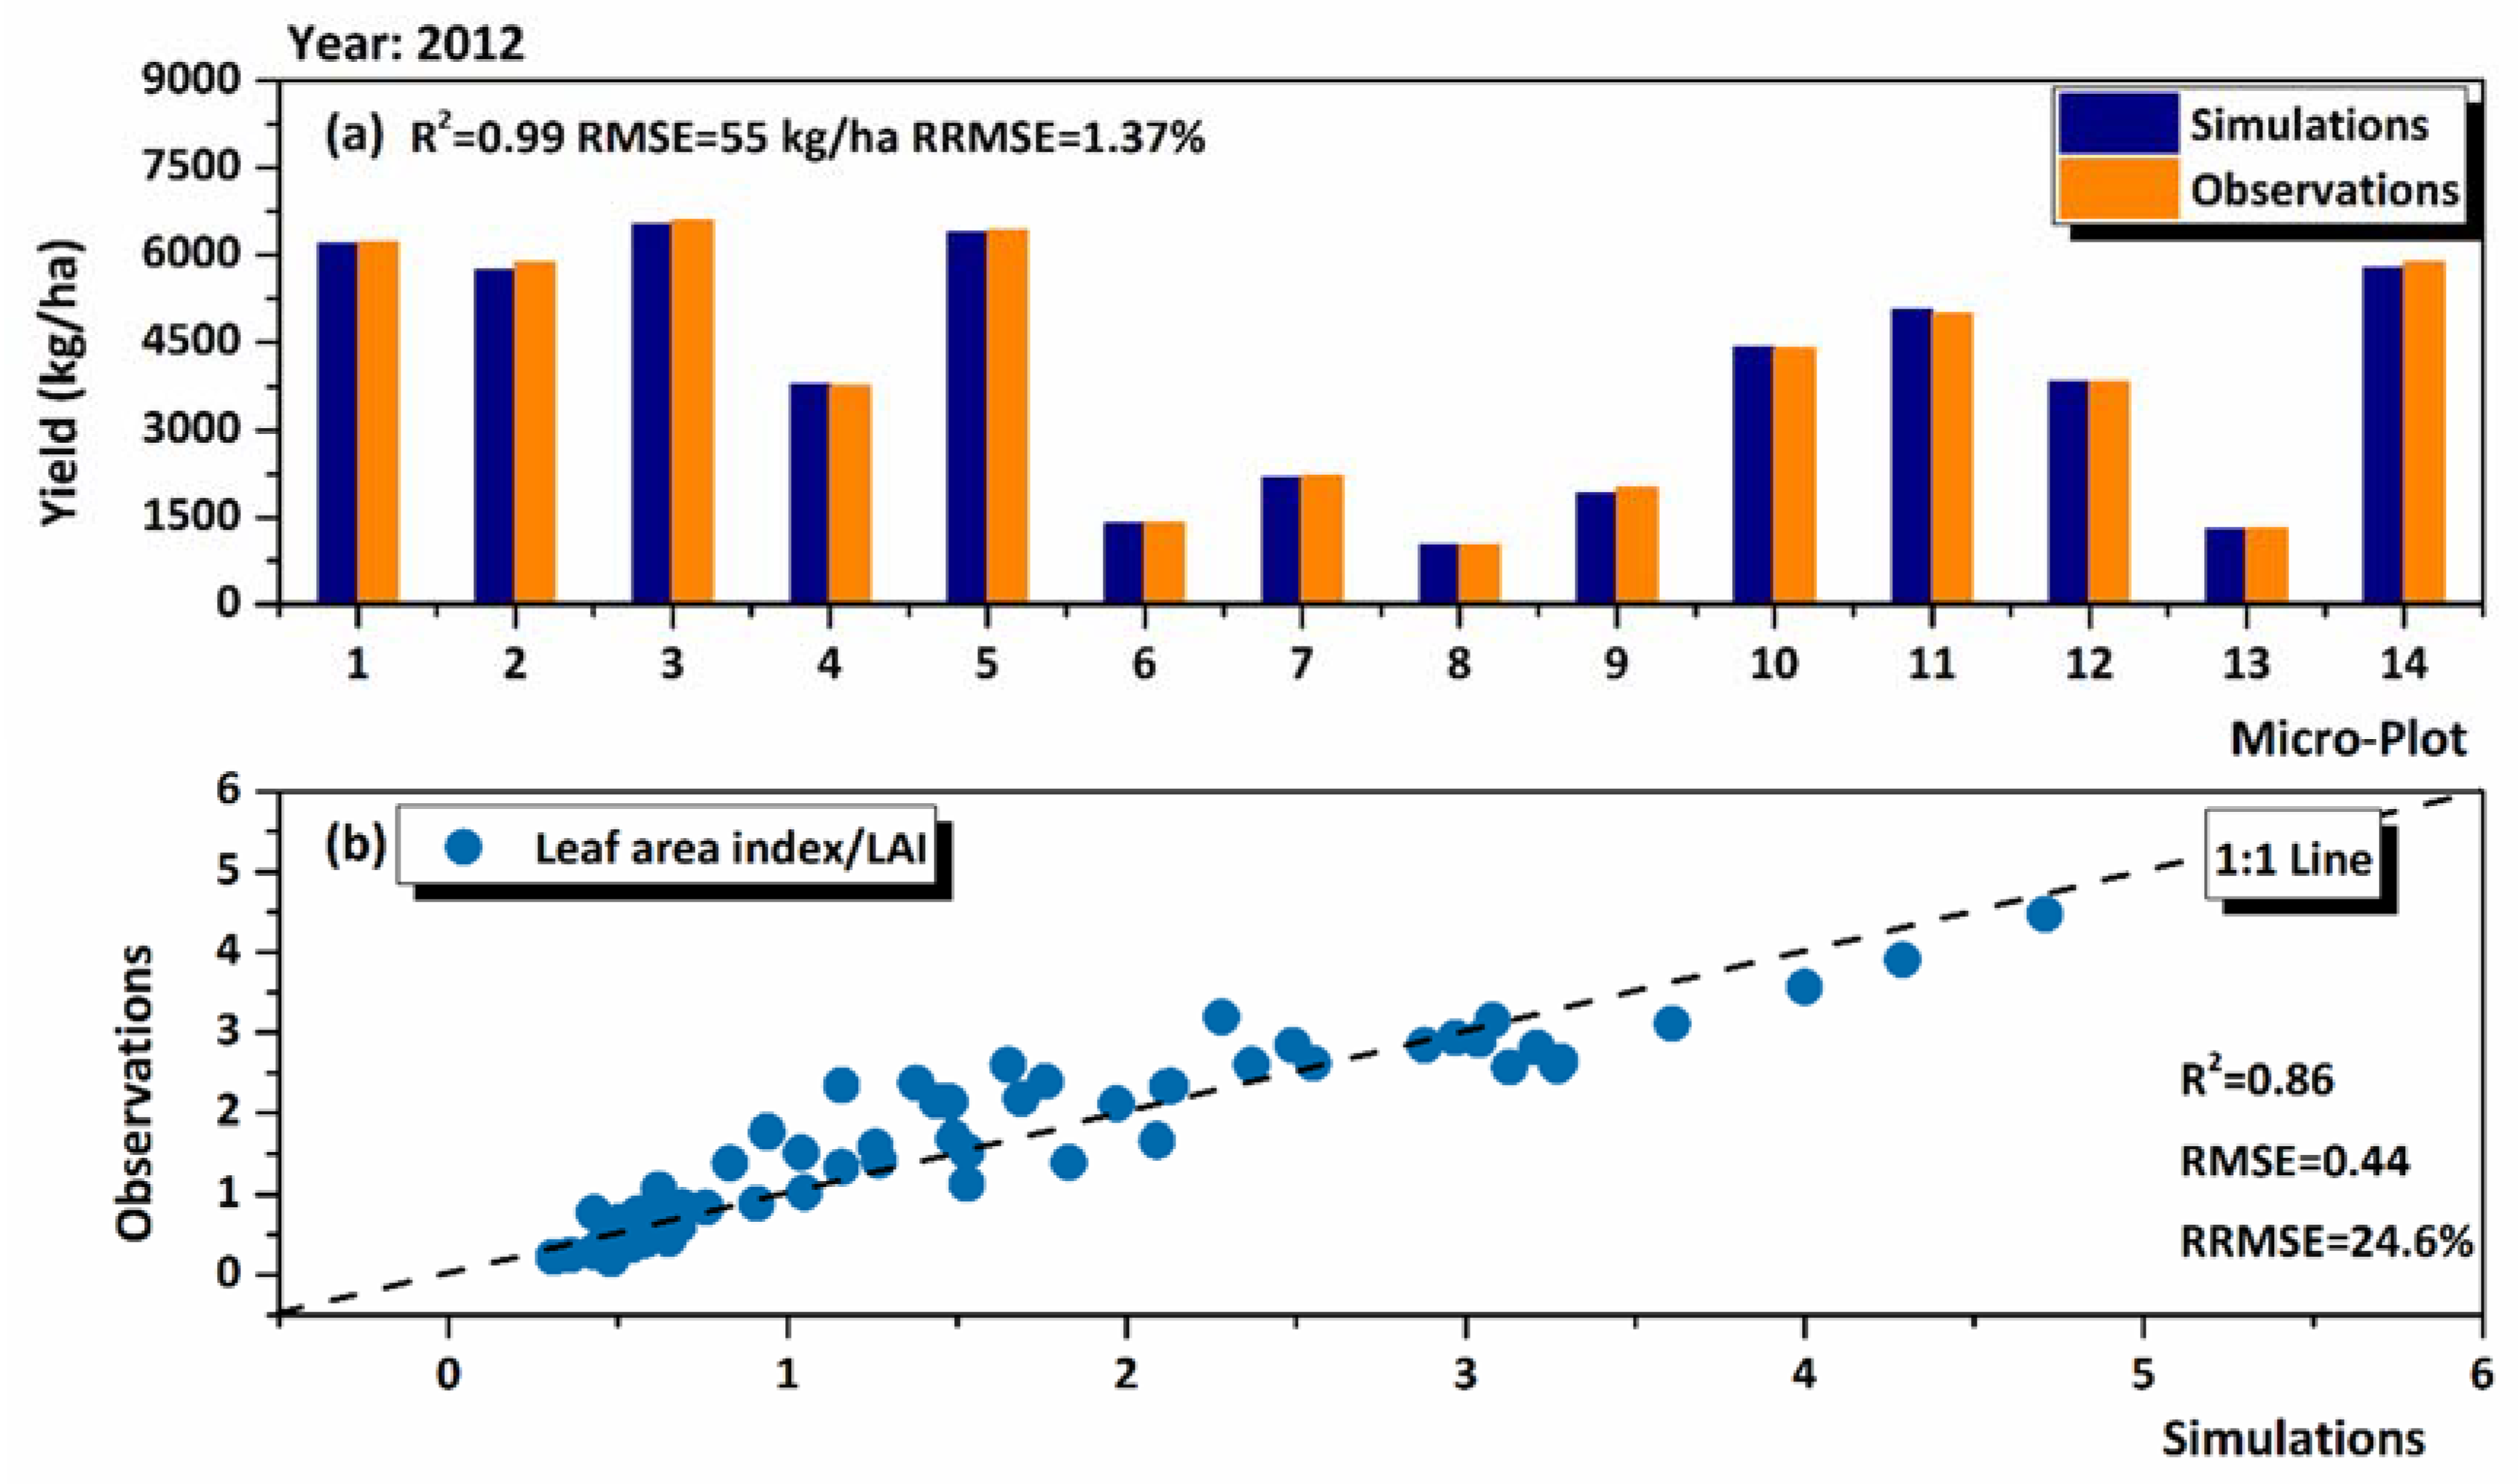
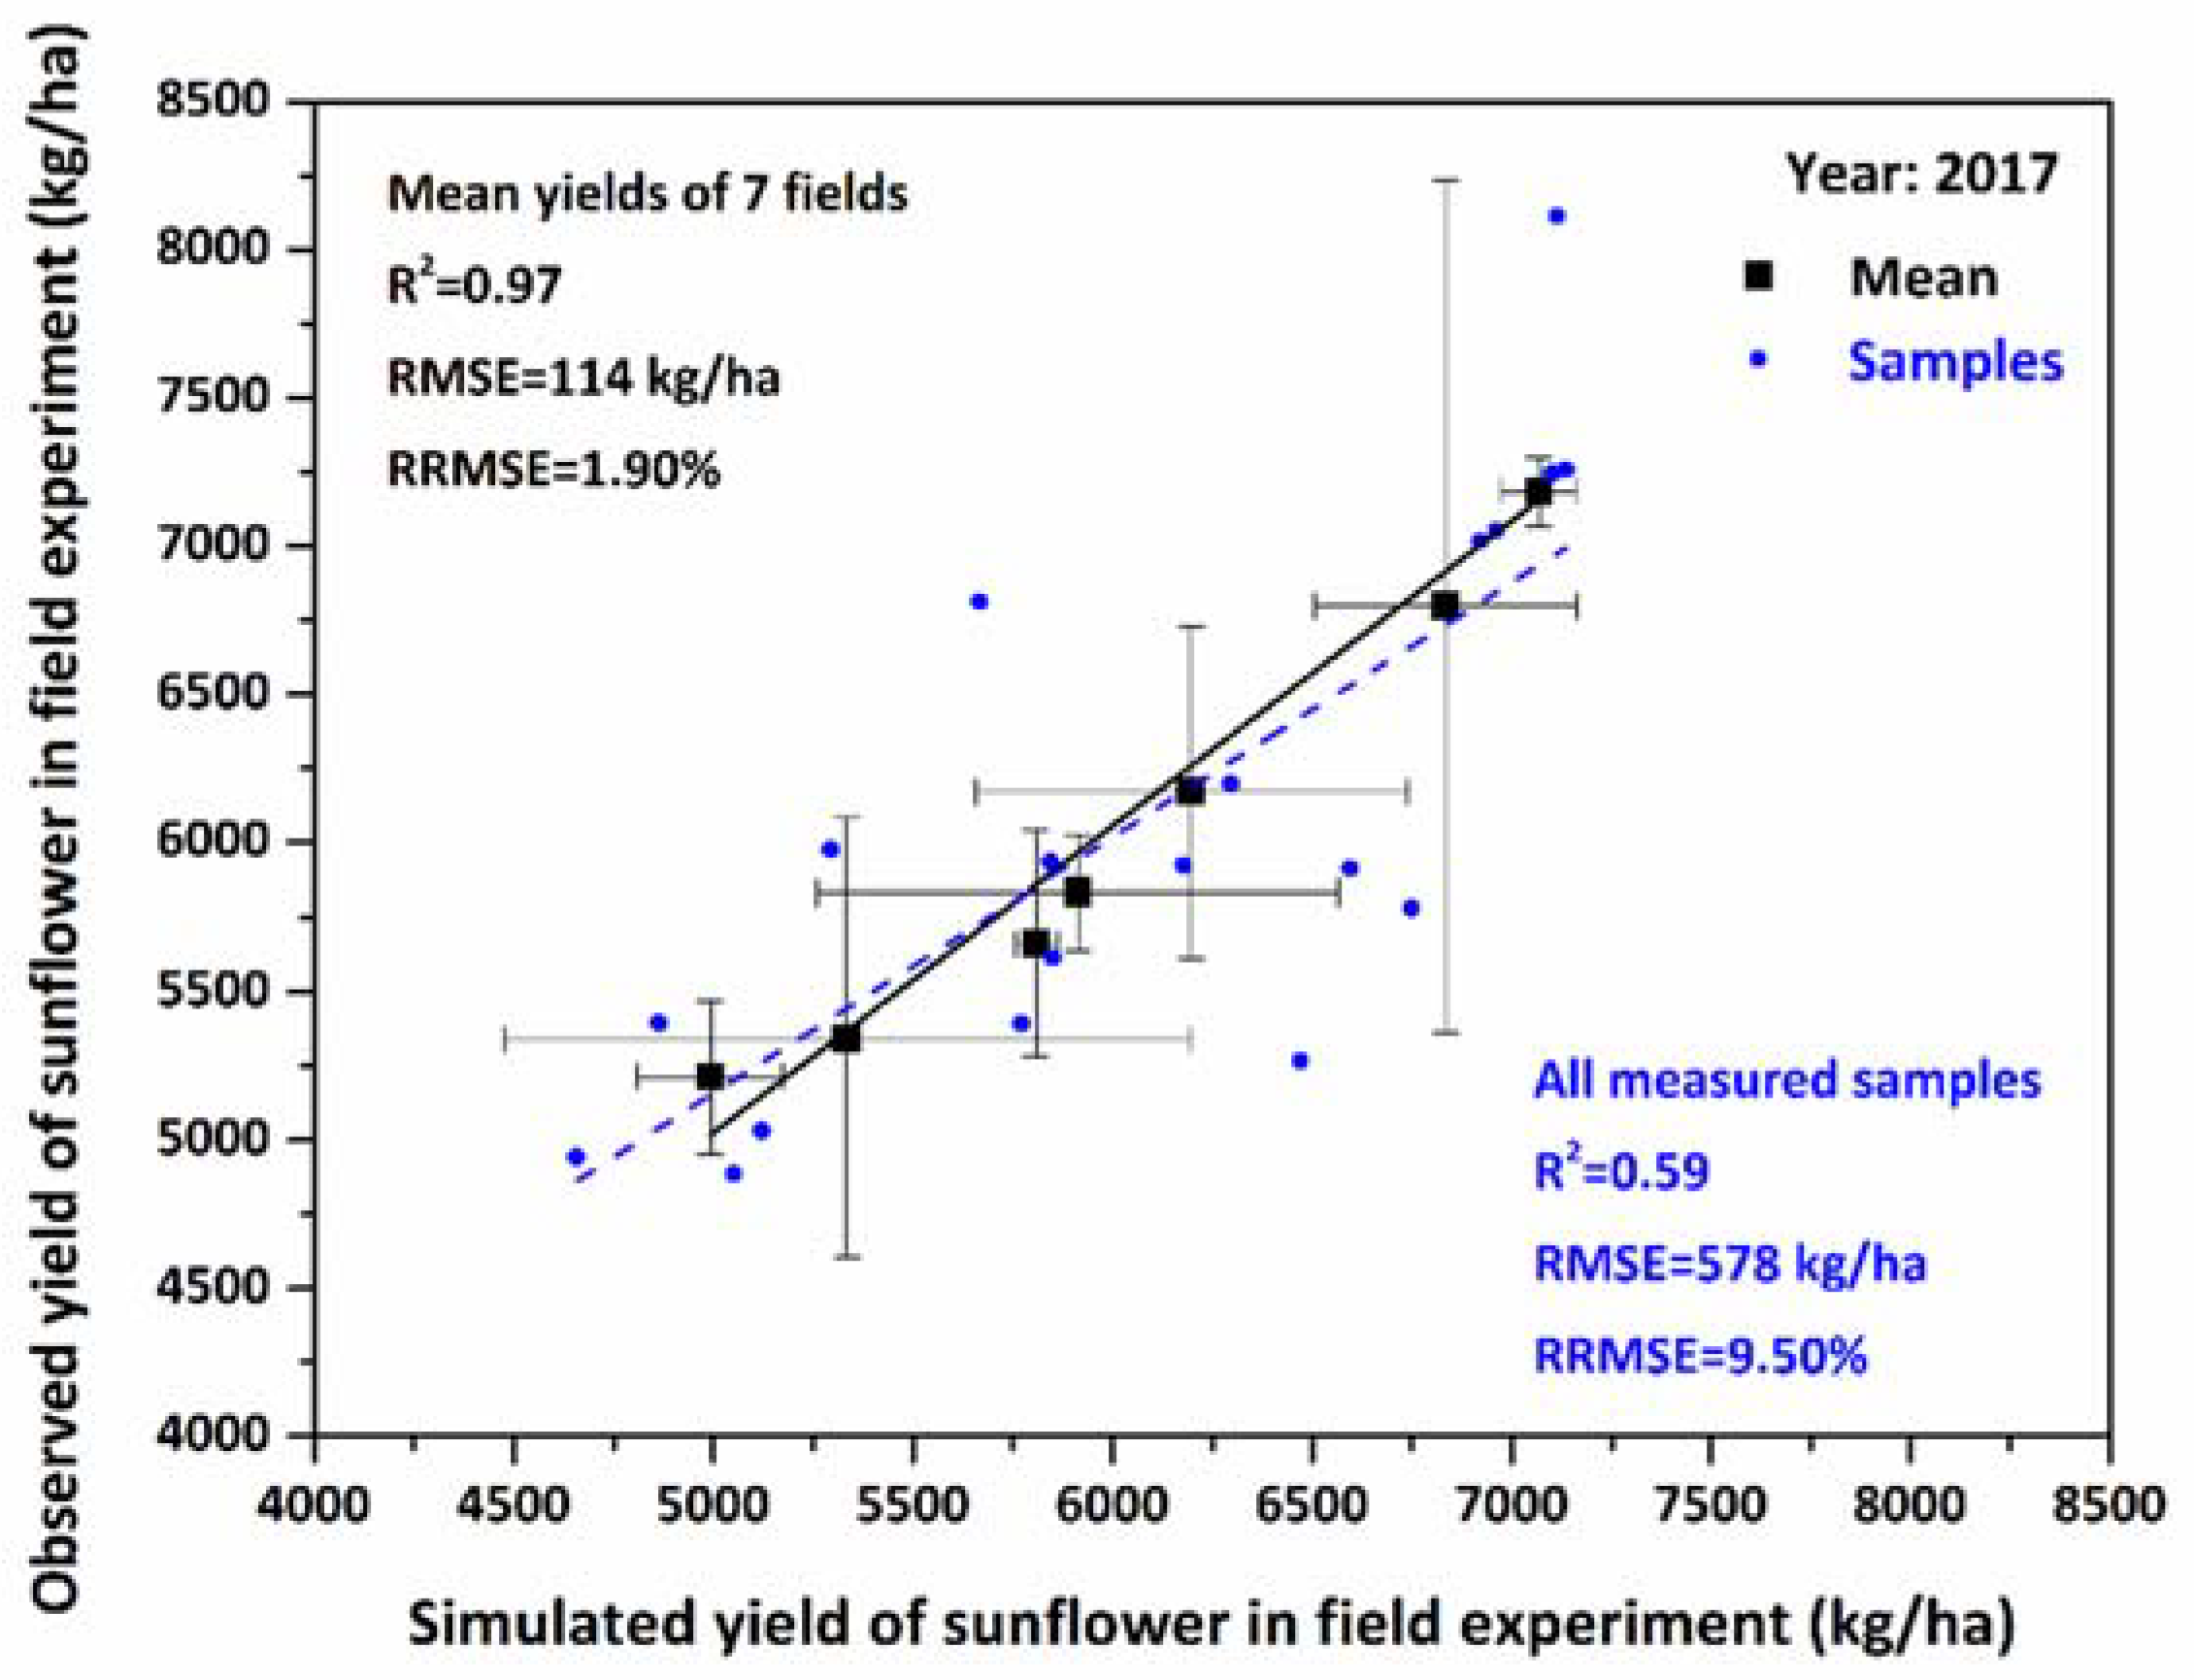
3.1. Model Performance

The potential and water-stressed yields in 2012 simulated by the original WOFOST model based on determined parameters (Table 5) were 7395 kg/ha and 6085 kg/ha, respectively. However, the observed yield in 2012 ranged from 1017 kg/ha to 6590 kg/ha, which indicated that 78.6% of the observations were lower than the water-stressed simulated yield (Figure 3c). A similar phenomenon was observed for LAI. Specifically, the WOFOST-simulated maximum LAI under potential and water-stressed conditions was 5.22 and 2.55, respectively (Figure 3a). Although the maximum observed LAI was 4.47 in 2012, approximately 12.6% of the simulated values did not fall within the observed LAI range. In contrast to 2012, the water-stressed simulated yield in 2013 was only 916 kg/ha. Therefore, all observed yields were in the range of the 2013 potential and water-stressed yields simulated by WOFOST (Figure 3d). Nonetheless, almost all observed LAI values were higher than the simulated water-stressed LAI values, and approximately 23% of observed LAI values were higher than the simulated potential LAI in 2013 (Figure 3b).
After modification based on environmental stress, the WOFOST-ES model exhibited very high accuracy for both yield and LAI simulations. Specifically, the R2 values of yield and LAI were 0.99 and 0.86, respectively, and the corresponding RMSEs were only 56 kg/ha and 0.44 (Figure 4). Detailed ES values are shown in Section 3.2.

3.2. Stress Factors Used in the WOFOST-ES and Feddes Models

The ES of the WOFOST-ES model, the water stress factor of the Feddes model-α(h), and the salt stress factor of the Feddes model-α(π) for the 14 micro-plots for the seedling, bud, flowering, and maturity stages of sunflower in 2012 are shown in Figure 5. ES in the seedling stage was almost 0.99, showing no stress during this stage. Similar to ES, α(h) was also 0.99, indicating that no water stress occurred during the seedling stage. However, α(π) was 0.88, which indicated that sunflower did experience salt stress during the seedling stage (Figure 5a). In the bud stage, the mean values of ES, α(h), and α(π) were 0.68, 0.99, and 0.90, respectively, indicating the occurrence of both water and salt stresses. As ES was even smaller than α(h) × α(π) (0.89), some other stress factors might have been imposed during this stage (Figure 5b). A similar phenomenon was observed for the flowering stage. Specifically, the mean values of ES, α(h), and α(π) were 0.42, 0.94, and 0.90, respectively. Moreover, the lowest ES was only 0.04, whereas both α(h) and α(π) were larger than 0.5 (Figure 5c). Regarding the maturity stage, although the mean value of ES (0.76) was smaller than α(h) (0.93) and α(π) (0.90), differences among ES, α(h), and α(π) varied according to micro-plot. For 5 of the 14 micro-plots, we detected that ES was larger than α(h) or α(π). For example, ES was 1.0 in the fourth micro-plot, whereas α(h) and α(π) were only 0.76 and 0.98, respectively (Figure 5d).

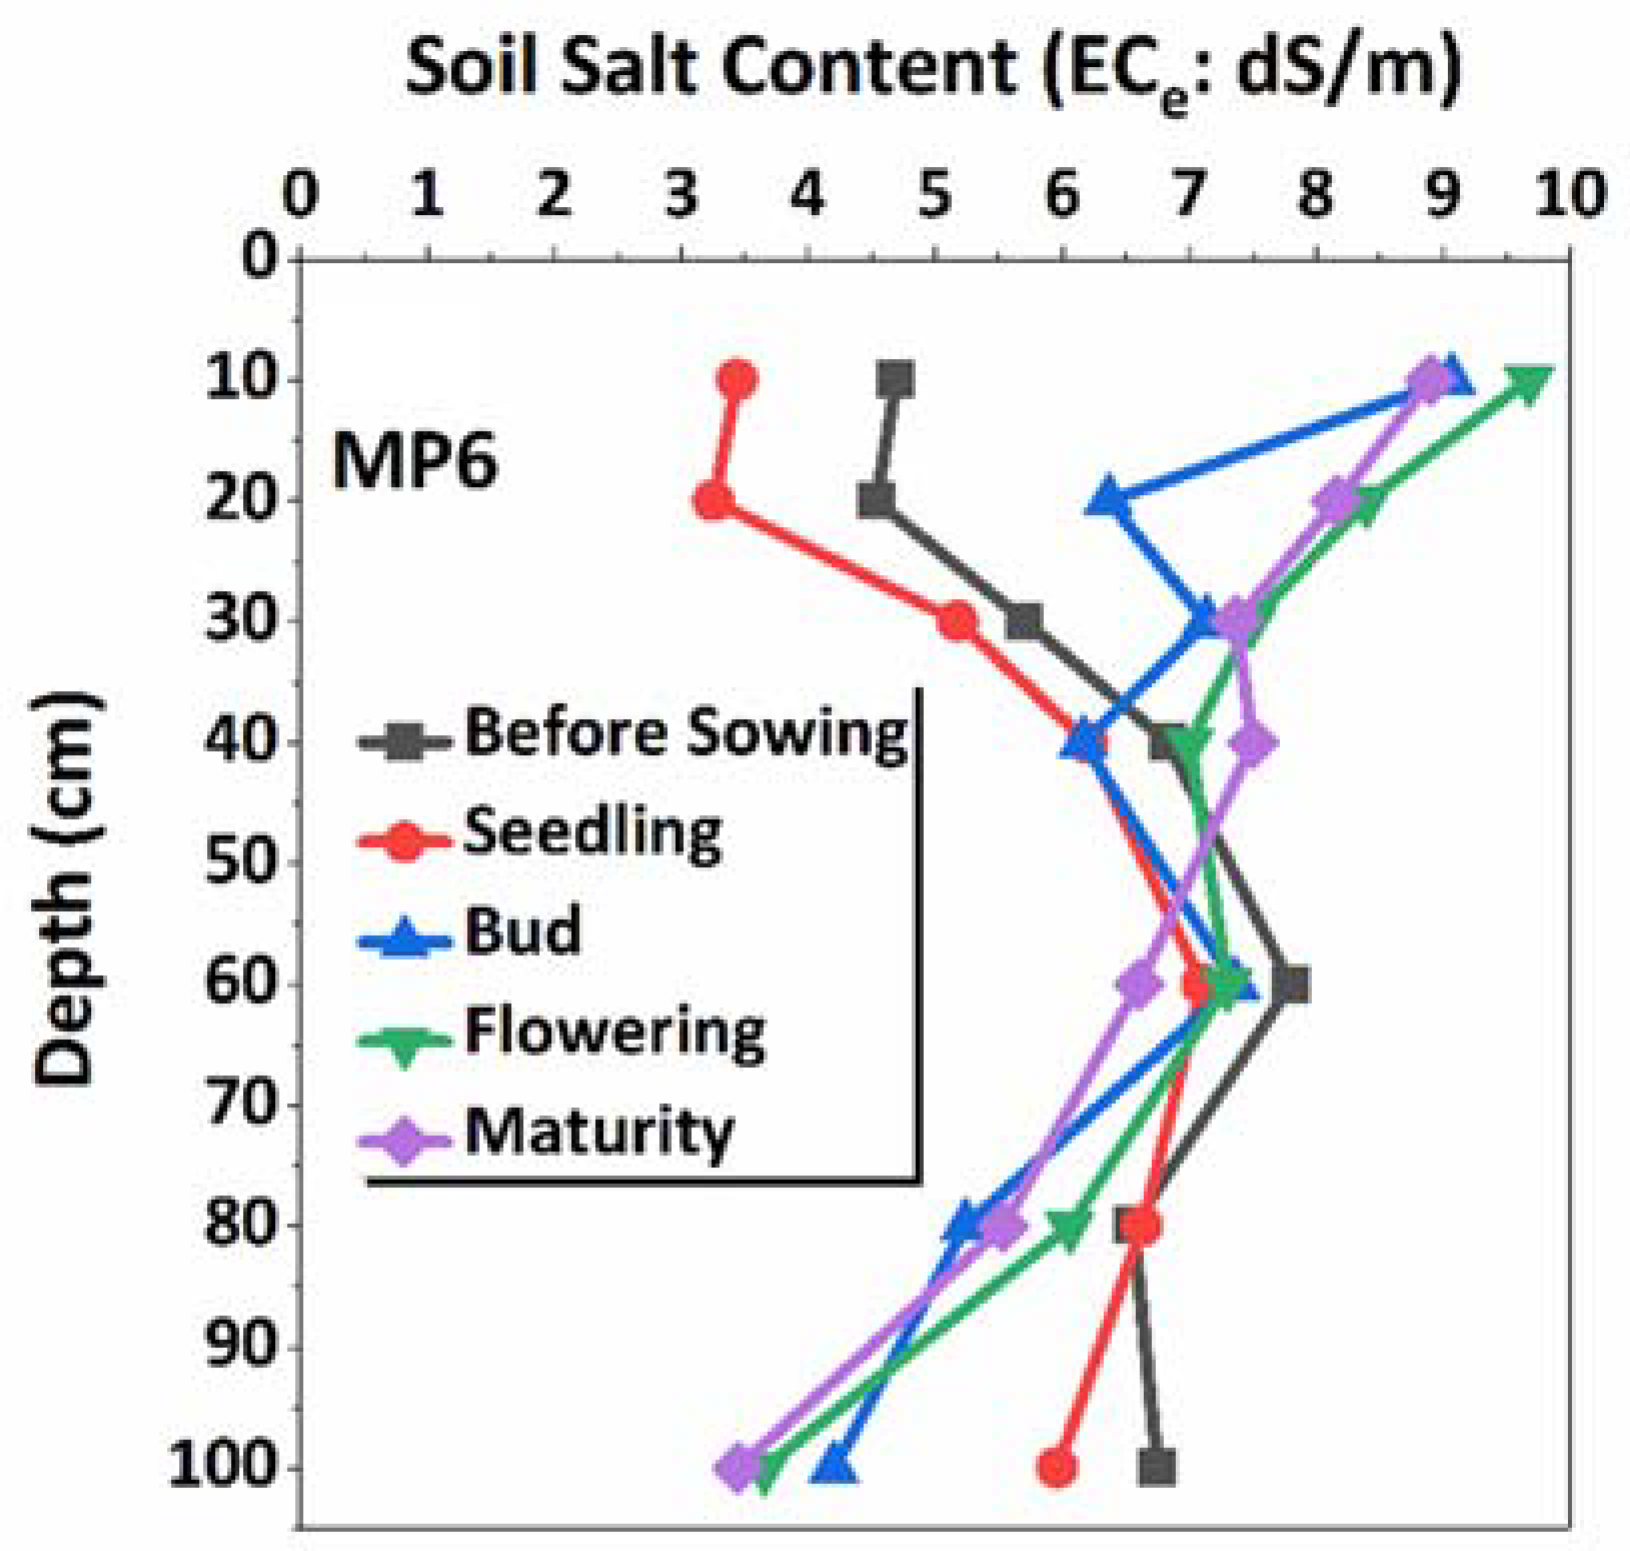
3.3. Relationship between Environmental Stress Factors and Soil Conditions

Correlation analysis of soil moisture, salinity, and ES (not displayed) indicated that soil salinity was the dominant factor affecting ES in our study area. Specifically, soil salinity (measured as saturated electrical conductivity) at a depth of 60–80 cm during the bud stage (S60–80 bud) and soil salinity at a depth of 20–40 cm during the maturity stage (S20–40 maturity) were significantly correlated (p < 0.01) with ES during the bud stage (ESbud). In addition, soil salinity at depths of 10–20 cm and 0–10 cm during the flowering stage (S10–20 flowering and S0–10 flowering) was significantly correlated (p < 0.01) with ES in the flowering stage (ESflowering). At maturity, soil salinity at a depth of 20–40 cm during the bud stage (S20–40 bud) and soil salinity at a depth of 60–80 cm during the flowering stage (S60–80 flowering) were the two main ESs affecting sunflower growth.
PLSR can accurately establish prediction relationships between ESs and specific soil salinity values. The ESs of the bud, flowering, and maturity stages were predicted by soil salinity at a depth of 0–20 cm before sowing (S0–20 bs) and by dominant soil salinity values as in Equations (7)–(9). The graphical prediction accuracy of PLSR is shown in Figure 6, and the R2 values of the bud, flowering, and maturity stages were 0.61, 0.52, and 0.88, respectively.
E S b u d = 0.005   S 0 20   b s 0.045   S 60 80   b u d 0.005   S 20 40   m a t u r i t y + 0.869
E S f l o w e r i n g = 0.015   S 0 20   b s 0.075   S 10 20   f l o w e r i n g + 0.035   S 0 10   f l o w e r i n g + 1.056
E S m a t u r i t y = 0.028   S 0 20   b s 0.011   S 20 40   b u d 0.017   S 60 80   f l o w e r i n g + 1.169
Equations (7)–(9) were employed to predict ESs of the bud, flowering, and maturity stages in 2013 and 2017; the ES of the seedling stage was set to 1. The results for 2013 indicate that predicted ESs can also provide highly accurate LAI simulations. Specifically, R2 and RMSE of LAI in 2013 were 0.63 and 0.99, respectively (Figure 7b). There were relatively large differences between simulated and observed yields in micro-plots 2, 3, 6, and 10; the R2 value was only 0.26, and RMSE was 890 kg/ha. However, if we ignored the above four micro-plots, the predicted ESs also resulted in very accurate yield simulations in 2013; the R2 and RMSE values were 0.81 and 357 kg/ha, respectively (Figure 7a).
Similar to 2013, Equations (7)–(9) also showed high simulation accuracy for the field experiments in 2017, even though the sunflower cultivar and experimental scale were both different from the conditions used to establish the empirical equations. In particular, R2 was as high as 0.97, and RMSE and RRMSE were only 114 kg/ha and 1.9%, respectively, when only considering the mean yields of seven fields. Considering all samples, R2 was approximately 0.6, and RRMSE was smaller than 10% (Figure 8).

4. Discussion

4.1. Environmental Stresses in Different Growth Periods

Environmental stress factors (ESs) in the modified WOFOST model (WOFOST-ES) varied among different growth periods. ES in the seedling stage (ESseed) was almost 1 in all micro-plots, thus with the impression that no environmental stress affected sunflower during the seedling stage. This was caused by the method of ESseed determination. Specifically, LAI and yield were dependent variables for calculating ESs in our study. Although ESseed can affect both LAI and yield (Figure 9 and Figure 10), in WOFOST-ES, the relatively small LAI in the seedling stage reduced the effect of ESseed on subsequent leaf growth. In addition, ESseed had an indirect effect on yield by altering leaf growth in subsequent growth stages because no biomass was partitioned to storage organs in the seedling stage [62,63]. However, our findings regarding ESseed differed from those of previous studies [18,46,64,65]. For example, Feddes-type stress reduction functions (Equations (2) and (3)) indicated that 6 of the 14 micro-plots experienced salt stress, whereas no micro-plots experienced water stress during the seedling stage. Moreover, some experiments, including those in our previous studies, proved that sunflower readily suffers from environmental stress during the seedling stage [20,66,67]. Nevertheless, the present results indicated only that ESseed can be ignored; it was equal to 1 when WOFOST-ES was applied in our study area, which does not prove that sunflower was insensitive to environmental stresses during the seedling stage.
ESs in the bud (ESbud) and flowering (ESflowering) stages were smaller than the combined water and salt stresses of the Feddes-type stress reduction functions (Feddes-WS), which indicated that stress factors other than water and salt also restricted sunflower growth during the bud and flowering stages. For example, nitrogen is a factor that affects sunflower growth in this study area [68,69,70], and heavy metals in soil also adversely affect sunflower [71,72]. ESbud and ESflowering in WOFOST-ES also revealed that Feddes-type stress reduction functions might underestimate the adverse effects of soil water and salt on sunflower growth. Furthermore, ESbud affected LAI in all four growth stages and also affected changes in yield, whereas ESflowering only had a slight effect on LAI after flowering and mainly affected yield (Figure 9 and Figure 10). Therefore, in WOFOST-ES, ESbud was the dominant factor affecting leaf growth in sunflower, which is reasonable, even from the view of crop physiology because transfer of biomass to leaves would be significantly reduced in and after the flowering stage.
Similar to ESflowering, ES in the maturity (ESmaturity) stage also only affected yield, with no effect on the change in LAI during the four growth stages. However, ESmaturity in WOFOST-ES was also larger than the Feddes-WS in a few micro-plots, similar to ESseed; this may have been caused by the heterogeneous spatial distribution of soil salt. Cai et al. [73] indicated that compensatory root water uptake can occur in heterogeneous soils, possibly reducing environmental stress on crop growth. Similar viewpoints were also proposed by Albasha et al. [74], Couvreur et al. [75], Skaggs et al. [76], and Green and Clothier [77]. In the present study, using micro-plot 6 as an example, ESmaturity and Feddes-WS in the maturity stage were 0.98 and 0.93, respectively (Figure 5), and the soil salt content significantly decreased with soil depth, with an extreme difference of 4.72 dS/m (Figure 11).
The Feddes-type stress reduction functions also indicated salt stress to be the dominant environmental factor affecting sunflower growth when compared with water stress (Figure 5). Previous studies have also shown that soil salinization is the main environmental challenge for crop growth in our study area [78,79].

4.2. Quantification of Stresses Associated with Soil Conditions

As discussed in Section 4.1, although water and other stresses occurred in some of the micro-plots, salt stress was the dominant environmental factor affecting sunflower growth in our study area, which enabled quantifying ESs based on soil salt contents (Equations (7)–(9)). The soil salt content at a depth of 0–20 cm before sowing was impulsively included in Equations (7)–(9) without correlation analysis for two reasons: (1) the soil salt content at a depth of 0–20 cm before sowing has been widely used for classifying soil salinization levels [80,81]; (2) this value can be easily obtained by remote sensing technology at a regional scale, whereas soil sampling or in situ sensors (e.g., Time-Domain Reflectometry(TDR)) are needed for other variables in Equations (7)–(9). Furthermore, Equations (7)–(9) also demonstrate that the distribution of soil salt affects ESs. For example, ESbud was related to the soil salt content at depths of 60–80 cm and 20–40 cm during the bud and maturity stages, respectively. This might be because the soil salt content at a depth of 0–20 cm before sowing was impulsively imported and used to replace the soil salt content in the topsoil during the bud stage. Regardless, there was large difference in the salt content between topsoil (e.g., 0–20 cm) and deep soil (e.g., 60–80 cm) (Figure 11). It is possible that the inclusion of the soil salt content in Equation (7), at a depth of 20–40 cm during the maturity stage, resulted purely from the statistical approach adopted. In addition, two interesting phenomena were found. First, the coefficients of the 0–20 cm soil salt content before sowing and the 0–10 cm soil salt content during the flowering stage were positive in Equation (7) and Equation (8), respectively, indicating that low salt stress may enhance growth and increase the yield of sunflower. Similar results were found by Di Caterina et al. [82], Kong et al. [83] and in our previous studies [18,20,45,63]. Second, soil salt contents at maturity were not included in Equation (9) because ESmaturity indicated that salt tolerance increases with growth in sunflower [84,85].
When using field data from 2013 to test Equations (7)–(9), four micro-plots exhibited relatively large differences between observed and simulated yields (Figure 7). A possible reason is that only salt stress was considered in Equations (7)–(9); although salt was considered the main stress, other environmental factors can also affect sunflower growth. In addition, the soil salt content changed dynamically during the experimental period, and the statistical equations could not reveal such dynamic physical changes. Nonetheless, due to their simple forms and acceptable accuracy, statistical equations have been widely used in both practical applications and in scientific studies [86,87]. Therefore, as a supplementary tool for WOFOST-ES, Equations (7)–(9) can result in easier application of the WOFOST-ES model in our study area and in other regions with similar soil salinization issues. The high simulation accuracy for sunflower yield in field experiments in 2017 also supports this conclusion (Figure 8).

4.3. Limitations

Our study also has some limitations. First, ESs could not be separated into different sub-stress components. As stated above, general ESs result in a more practical and easier model application. Regardless, we must concede that ESs cannot explain the source of environmental stress because they could not be separated. Comparison of Feddes-W and Feddes-S also showed that ESs cannot be separated based on Feddes-type stress reduction functions. Therefore, future studies should focus on the detailed components of ESs to allow physical separation [88]. Second, the present method used to quantify ESs is statistical; this method considers only the main stress factor, and the underlying mechanism is lacking. The next step should focus on improving quantifications by considering both the content and dynamics of the main stress factor as well as crop characteristics (e.g., LAI), to ensure that the results are mechanistic and accurate and that the variables can be easily obtained at a large scale. Third, although ES in the WOFOST-ES model can be changed to a daily step, we simplified it to be constant during each growth stage due to the lack of field observations. Hence, additional evaluations should process smaller time steps to assess the accuracy and stability of WOFOST-ES. In addition, the present modifications added ESs to reduce CO2 assimilation in WOFOST before biomass partitioning, assuming that the effects of environmental stress would impact all organs act in the same way; thus, compared with some specific studies, our present strategy was short of mechanism [89,90,91]. Although many previous studies have used similar methods to consider drought stress in WOFOST [34,42], further efforts, especially experimental studies, should focus on the effects of environmental factors on feedback between crop organs, which may also provide more reliable evidence to update the present empirical biomass partitioning coefficients in WOFOST. However, as stated above, the present modifications for WOFOST mainly focused on the balance of the crop growth mechanism and practical applications, which was also the motivation to modify the physical-based WOFOST model with a statistical method. Fortunately, independent evaluations with data from different crop cultivars at different scales have proved the accuracy and reliability of our previous modifications (Figure 8 and Figure 9), and we will also persistently strive to overcome these limitations in future studies.

5. Conclusions

Our study added a general environmental stress factor (ES) to modify the WOFOST model and enable accurate simulation of different environmental stresses, including water and salt stresses. The newly developed model (WOFOST-ES) was first applied to sunflower micro-plot experiments in 2012 in the Hetao Irrigation District (HID), a semiarid and arid region. The results showed good agreement between the WOFOST-ES simulations and experimental measurements, and WOFOST-ES could account for more than 85% variability in both sunflower yield and LAI. Environmental stress factors (ESs) for each micro-plot were also determined and compared with Feddes-type water stress and salt stress factors, indicating that salt stress was the dominant environmental stress at our experimental site. To facilitate WOFOST-ES application, empirical functions between salt stress factors (dominant ESs) and soil salt contents were established and accurately validated with measurements from sunflower micro-plot experiments in 2013 and field experiments in 2017, respectively.
In summary, the WOFOST-ES model balanced physical-based crop growth simulations and empirical methods for model parameterization, considering both scientific and practical views, and can be used to predict crop growth in saline soils. With minor calibrations, WOFOST-ES can also be applied to evaluate the effects of other environmental stresses or environmental changes on agricultural production.

Author Contributions

J.Z., T.M., and G.L. conducted the experiments; W.Z., J.H., and J.W. designed the experiments. J.Z. and W.Z. wrote the paper; Y.Z. and Y.F. reviewed the manuscript.

Funding

This research was funded by the State Natural Science Fund of China (grant No. 51609175, 51790533, 51879196, and 51779273), the Natural Science Fund of Hubei Province, China (grant No. 2017CFB440), the Major Program of National Science and Technology Support Plan of China (grant No. 2017YFC0403304 and 2016YFC0501304), the Fundamental Research Funds for the Central Universities (grant No. 2042016kf0043 and 2042016kf1034), and the China Postdoctoral Science Foundation (grant No. 2017T100579).

Acknowledgments

Authors would like to thank the staff of the Yichang experimental station for providing land for the experiments and for active involvement in the care and maintenance of the experiments.

Conflicts of Interest

The authors declare no conflict of interest.

References

  1. Shrivastava, P.; Kumar, R. Soil salinity: A serious environmental issue and plant growth promoting bacteria as one of the tools for its alleviation. Saudi J. Biol. Sci. 2015, 22, 123–131. [Google Scholar] [CrossRef] [PubMed]
  2. Fourati, H.T.; Bouaziz, M.; Benzina, M.; Bouaziz, S. Detection of terrain indices related to soil salinity and mapping salt-affected soils using remote sensing and geostatistical techniques. Environ. Monit. Assess. 2017, 189, 177. [Google Scholar] [CrossRef] [PubMed]
  3. Singh, A. Soil salinization and waterlogging: A threat to environment and agricultural sustainability. Ecol. Indic. 2015, 57, 128–130. [Google Scholar] [CrossRef]
  4. Li, J.; Pu, L.; Han, M.; Zhu, M.; Zhang, R.; Xiang, Y. Soil salinization research in China: Advances and prospects. J. Geogr. Sci. 2014, 24, 943–960. [Google Scholar] [CrossRef]
  5. Munns, R.; James, R.A.; Läuchli, A. Approaches to increasing the salt tolerance of wheat and other cereals. J. Exp. Bot. 2006, 57, 1025–1043. [Google Scholar] [CrossRef] [PubMed] [Green Version]
  6. Almansouri, M.; Kinet, J.-M.; Lutts, S. Effect of salt and osmotic stresses on germination in durum wheat (Triticum durum Desf.). Plant Soil 2001, 231, 243–254. [Google Scholar] [CrossRef]
  7. Eynard, A.; Lal, R.; Wiebe, K. Crop response in salt-affected soils. J. Sustain. Agric. 2005, 27, 5–50. [Google Scholar] [CrossRef]
  8. Roy, S.J.; Negrão, S.; Tester, M. Salt resistant crop plants. Curr. Opin. Biotechnol. 2014, 26, 115–124. [Google Scholar] [CrossRef] [PubMed]
  9. Gleadow, R.; Pegg, A.; Blomstedt, C.K. Resilience of cassava (Manihot esculenta Crantz) to salinity: Implications for food security in low-lying regions. J. Exp. Bot. 2016, 67, 5403–5413. [Google Scholar] [CrossRef] [PubMed]
  10. Butcher, K.; Wick, A.F.; DeSutter, T.; Chatterjee, A.; Harmon, J. Soil salinity: A threat to global food security. Agron. J. 2016, 108, 2189–2200. [Google Scholar] [CrossRef]
  11. Du, T.; Kang, S.; Zhang, J.; Davies, W.J. Deficit irrigation and sustainable water-resource strategies in agriculture for china’s food security. J. Exp. Bot. 2015, 66, 2253–2269. [Google Scholar] [CrossRef] [PubMed]
  12. Rivero, R.M.; Mestre, T.C.; Mittler, R.; Rubio, F.; Garcia-Sanchez, F.; Martinez, V. The combined effect of salinity and heat reveals a specific physiological, biochemical and molecular response in tomato plants. Plant Cell Environ. 2014, 37, 1059–1073. [Google Scholar] [CrossRef] [PubMed]
  13. Ghaffari, A.; Gharechahi, J.; Nakhoda, B.; Salekdeh, G.H. Physiology and proteome responses of two contrasting rice mutants and their wild type parent under salt stress conditions at the vegetative stage. J. Plant Physiol. 2014, 171, 31–44. [Google Scholar] [CrossRef] [PubMed]
  14. Kaya, C.; Kirnak, H.; Higgs, D.; Saltali, K. Supplementary calcium enhances plant growth and fruit yield in strawberry cultivars grown at high (NaCl) salinity. Sci. Hortic. 2002, 93, 65–74. [Google Scholar] [CrossRef]
  15. Bahrami, H.; Razmjoo, J. Effect of salinity stress (NaCl) on germination and early seedling growth of ten sesame cultivars (Sesamum indicum L.). Int. J. AgriSci. 2012, 2, 529–537. [Google Scholar]
  16. Ahmad, S.; Khan, N.; Iqbal, M.; Hussain, A.; Hassan, M. Salt tolerance of cotton (Gossypium hirsutum L.). Asian J. Plant Sci. 2002, 1, 715–719. [Google Scholar]
  17. Salehi, M.; Arzani, A. Grain quality traits in triticale influenced by field salinity stress. Aust. J. Crop Sci. 2013, 7, 580. [Google Scholar]
  18. Zeng, W.; Xu, C.; Wu, J.; Huang, J. Sunflower seed yield estimation under the interaction of soil salinity and nitrogen application. Field Crop. Res. 2016, 198, 1–15. [Google Scholar] [CrossRef]
  19. Katerji, N.; van Hoorn, J.W.; Hamdy, A.; Mastrorilli, M. Salt tolerance classification of crops according to soil salinity and to water stress day index. Agric. Water Manag. 2000, 43, 99–109. [Google Scholar] [CrossRef]
  20. Zeng, W.; Xu, C.; Huang, J.; Wu, J.; Ma, T. Emergence rate, yield, and nitrogen-use efficiency of sunflowers (Helianthus annuus) vary with soil salinity and amount of nitrogen applied. Commun. Soil Sci. Plant Anal. 2015, 46, 1006–1023. [Google Scholar] [CrossRef]
  21. Rosenzweig, C.; Elliott, J.; Deryng, D.; Ruane, A.C.; Müller, C.; Arneth, A.; Boote, K.J.; Folberth, C.; Glotter, M.; Khabarov, N.; et al. Assessing agricultural risks of climate change in the 21st century in a global gridded crop model intercomparison. Proc. Natl. Acad. Sci. USA 2014, 111, 3268–3273. [Google Scholar] [CrossRef] [PubMed] [Green Version]
  22. Scarrow, R. Climate change: Variance in crop yields. Nat. Plants 2017. [Google Scholar] [CrossRef] [PubMed]
  23. Secco, D.; Whelan, J.; Rouached, H.; Lister, R. Nutrient stress-induced chromatin changes in plants. Curr. Opin. Plant Biol. 2017, 39, 1–7. [Google Scholar] [CrossRef] [PubMed]
  24. Van Diepen, C.A.; Wolf, J.; van Keulen, H.; Rappoldt, C. Wofost: A simulation model of crop production. Soil Use Manag. 1989, 5, 16–24. [Google Scholar] [CrossRef]
  25. McCown, R.L.; Hammer, G.L.; Hargreaves, J.N.G.; Holzworth, D.P.; Freebairn, D.M. Apsim: A novel software system for model development, model testing and simulation in agricultural systems research. Agric. Syst. 1996, 50, 255–271. [Google Scholar] [CrossRef]
  26. Simunek, J.; Van Genuchten, M.T.; Sejna, M. The HYDRUS-1D software package for simulating the one-dimensional movement of water, heat, and multiple solutes in variably-saturated media. Univ. Calif.-Riverside Res. Rep. 2005, 3, 1–240. [Google Scholar]
  27. Arnold, J.G.; Moriasi, D.N.; Gassman, P.W.; Abbaspour, K.C.; White, M.J.; Srinivasan, R.; Santhi, C.; Harmel, R.; Van Griensven, A.; Van Liew, M.W.; et al. Swat: Model use, calibration, and validation. Trans. ASABE 2012, 55, 1491–1508. [Google Scholar] [CrossRef]
  28. Mudgal, A.; Baffaut, C.; Anderson, S.H.; Sadler, E.J.; Thompson, A.L. APEX model assessment of variable landscapes on runoff and dissolved herbicides. Trans. ASABE 2010, 53, 1047–1058. [Google Scholar] [CrossRef]
  29. Keating, B.A.; Carberry, P.S.; Hammer, G.L.; Probert, M.E.; Robertson, M.J.; Holzworth, D.; Huth, N.I.; Hargreaves, J.N.G.; Meinke, H.; Hochman, Z.; et al. An overview of apsim, a model designed for farming systems simulation. Eur. J. Agron. 2003, 18, 267–288. [Google Scholar] [CrossRef]
  30. Stöckle, C.O.; Kemanian, A.R.; Nelson, R.L.; Adam, J.C.; Sommer, R.; Carlson, B. Cropsyst model evolution: From field to regional to global scales and from research to decision support systems. Environ. Model. Softw. 2014, 62, 361–369. [Google Scholar] [CrossRef]
  31. Hansen, S.; Abrahamsen, P.; Petersen, C.T.; Styczen, M. Daisy: Model use, calibration, and validation. Trans. ASABE 2012, 55, 1317–1333. [Google Scholar] [CrossRef]
  32. Del Grosso, S.J.; Mosier, A.R.; Parton, W.J.; Ojima, D.S. Daycent model analysis of past and contemporary soil N2O and net greenhouse gas flux for major crops in the USA. Soil Tillage Res. 2005, 83, 9–24. [Google Scholar] [CrossRef]
  33. Giltrap, D.L.; Li, C.; Saggar, S. Dndc: A process-based model of greenhouse gas fluxes from agricultural soils. Agric. Ecosyst. Environ. 2010, 136, 292–300. [Google Scholar] [CrossRef]
  34. Eweys, O.A.; Elwan, A.A.; Borham, T.I. Integrating wofost and noah lsm for modeling maize production and soil moisture with sensitivity analysis, in the east of the Netherlands. Field Crop. Res. 2017, 210, 147–161. [Google Scholar] [CrossRef]
  35. Jones, J.W.; Hoogenboom, G.; Porter, C.H.; Boote, K.J.; Batchelor, W.D.; Hunt, L.A.; Wilkens, P.W.; Singh, U.; Gijsman, A.J.; Ritchie, J.T. The dssat cropping system model. Eur. J. Agron. 2003, 18, 235–265. [Google Scholar] [CrossRef]
  36. Jiang, Y.; Xu, X.; Huang, Q.; Huo, Z.; Huang, G. Assessment of irrigation performance and water productivity in irrigated areas of the middle Heihe River basin using a distributed agro-hydrological model. Agric. Water Manag. 2015, 147, 67–81. [Google Scholar] [CrossRef]
  37. Šimůnek, J.; van Genuchten, M.T.; Šejna, M. Recent developments and applications of the HYDRUS computer software packages. Vadose Zone J. 2016, 15. [Google Scholar] [CrossRef]
  38. Lapola, D.M.; Priess, J.A.; Bondeau, A. Modeling the land requirements and potential productivity of sugarcane and jatropha in Brazil and India using the LPJmL dynamic global vegetation model. Biomass Bioenergy 2009, 33, 1087–1095. [Google Scholar] [CrossRef]
  39. Nendel, C.; Berg, M.; Kersebaum, K.C.; Mirschel, W.; Specka, X.; Wegehenkel, M.; Wenkel, K.O.; Wieland, R. The MONICA model: Testing predictability for crop growth, soil moisture and nitrogen dynamics. Ecol. Model. 2011, 222, 1614–1625. [Google Scholar] [CrossRef]
  40. Wu, L.; McGechan, M.B.; McRoberts, N.; Baddeley, J.A.; Watson, C.A. Spacsys: Integration of a 3D root architecture component to carbon, nitrogen and water cycling—Model description. Ecol. Model. 2007, 200, 343–359. [Google Scholar] [CrossRef]
  41. Jing, Q.; Jégo, G.; Bélanger, G.; Chantigny, M.H.; Rochette, P. Simulation of water and nitrogen balances in a perennial forage system using the STICS model. Field Crop. Res. 2017, 201, 10–18. [Google Scholar] [CrossRef]
  42. Zhou, J.; Cheng, G.; Li, X.; Hu, B.X.; Wang, G. Numerical modeling of wheat irrigation using coupled HYDRUS and WOFOST models. Soil Sci. Soc. Am. J. 2012, 76, 648–662. [Google Scholar] [CrossRef]
  43. Li, Y.; Kinzelbach, W.; Zhou, J.; Cheng, G.; Li, X. Modelling irrigated maize with a combination of coupled-model simulation and uncertainty analysis, in the northwest of China. Hydrol. Earth Syst. Sci. 2012, 16, 1465. [Google Scholar] [CrossRef]
  44. Li, Y.; Zhou, Q.; Zhou, J.; Zhang, G.; Chen, C.; Wang, J. Assimilating remote sensing information into a coupled hydrology-crop growth model to estimate regional maize yield in arid regions. Ecol. Model. 2014, 291, 15–27. [Google Scholar] [CrossRef]
  45. Ma, T.; Zeng, W.; Li, Q.; Wu, J.; Huang, J. Effects of water, salt and nitrogen stress on sunflower (Helianthus annuus L.) at different growth stages. J. Soil Sci. Plant Nutr. 2016, 16, 1024–1037. [Google Scholar] [CrossRef]
  46. Zeng, W.; Wu, J.; Hoffmann, M.P.; Xu, C.; Ma, T.; Huang, J. Testing the apsim sunflower model on saline soils of Inner Mongolia, China. Field Crop. Res. 2016, 192, 42–54. [Google Scholar] [CrossRef]
  47. Todorovic, M.; Albrizio, R.; Zivotic, L.; Saab, M.-T.A.; Stöckle, C.; Steduto, P. Assessment of aquacrop, cropsyst, and wofost models in the simulation of sunflower growth under different water regimes all rights reserved. Agron. J. 2009, 101, 509–521. [Google Scholar] [CrossRef]
  48. Boogaard, H.L.; van Diepen, C.A.; Rotter, R.P.; Cabrera, J.M.C.A.; van Laar, H.H. WOFOST 7.1; User’s Guide for the WOFOST 7.1 Crop Growth Simulation Model and WOFOST Control Center 1.5; SC-DLO: Wageningen, The Netherlands, 1998; pp. 927–4499. [Google Scholar]
  49. Zeng, W.; Xu, C.; Huang, J.; Wu, J.; Tuller, M. Predicting near-surface moisture content of saline soils from near-infrared reflectance spectra with a modified gaussian model. Soil Sci. Soc. Am. J. 2016, 80, 1496–1506. [Google Scholar] [CrossRef]
  50. Chen, J. Adjustment coefficient of sunflower leaf area. Chin. J. Oil Crop Sci. 1984, 1, 71–73. [Google Scholar]
  51. Sezen, S.; Yazar, A.; Kapur, B.; Tekin, S. Comparison of drip and sprinkler irrigation strategies on sunflower seed and oil yield and quality under mediterranean climatic conditions. Agric. Water Manag. 2011, 98, 1153–1161. [Google Scholar] [CrossRef]
  52. Doherty, J. Pest: A unique computer program for model-independent parameter optimisation. In Water Down Under 94: Groundwater/Surface Hydrology Common Interest Papers; Preprints of Papers, Adelaide, South Australia, 21–25 November 1994; Institution of Engineers: Barton, Australia, 1994. [Google Scholar]
  53. Feddes, R.A.; Kowalik, P.J.; Zaradny, H. Simulation of Field Water Use and Crop Yield; Centre for Agricultural Publishing and Documentation: Wageningen, The Netherlands, 1978. [Google Scholar]
  54. Ren, D.; Xu, X.; Hao, Y.; Huang, G. Modeling and assessing field irrigation water use in a canal system of hetao, upper yellow river basin: Application to maize, sunflower and watermelon. J. Hydrol. 2016, 532, 122–139. [Google Scholar] [CrossRef]
  55. Maas, E.V.; Hoffman, G.J. Crop salt tolerance–current assessment. J. Irrig. Drain. Div. 1977, 103, 115–134. [Google Scholar]
  56. Zhao, Q.; Zhan, W.; Wu, J.; Huang, J.; Zhang, S.; Chen, A.; Gao, H. Effect of salt stress on growth and yield of sunflower. J. Irrig. Drain. 2014, 33, 32–35. [Google Scholar]
  57. Kopačková, V.; Ben-Dor, E.; Carmon, N.; Notesco, G. Modelling diverse soil attributes with visible to longwave infrared spectroscopy using PLSR employed by an automatic modelling engine. Remote Sens. 2017, 9, 134. [Google Scholar] [CrossRef]
  58. Fan, X.; Liu, Y.; Tao, J.; Weng, Y. Soil salinity retrieval from advanced multi-spectral sensor with partial least square regression. Remote Sens. 2015, 7, 488–511. [Google Scholar] [CrossRef]
  59. Geladi, P.; Kowalski, B.R. Partial least-squares regression: A tutorial. Anal. Chim. Acta 1986, 185, 1–17. [Google Scholar] [CrossRef]
  60. Zeng, W.; Xu, C.; Zhao, G.; Wu, J.; Huang, J. Estimation of sunflower seed yield using partial least squares regression and artificial neural network models. Pedosphere 2017, in press. [Google Scholar] [CrossRef]
  61. Zeng, W.; Huang, J.; Xu, C.; Ma, T.; Wu, J. Hyperspectral reflectance models for soil salt content by filtering methods and waveband selection. Ecol. Chem. Eng. S 2016, 23, 117–130. [Google Scholar] [CrossRef] [Green Version]
  62. Vega, C.R.C.; Andrade, F.H.; Sadras, V.O. Reproductive partitioning and seed set efficiency in soybean, sunflower and maize. Field Crop. Res. 2001, 72, 163–175. [Google Scholar] [CrossRef]
  63. Ma, T.; Zeng, W.; Li, Q.; Yang, X.; Wu, J.; Huang, J. Shoot and root biomass allocation of sunflower varying with soil salinity and nitrogen applications. Agron. J. 2017, 109, 2545–2555. [Google Scholar] [CrossRef]
  64. Quartacci, M.F.; Navari-Izzo, F. Water stress and free radical mediated changes in sunflower seedlings. J. Plant Physiol. 1992, 139, 621–625. [Google Scholar] [CrossRef]
  65. Habibi, G. Physiological, photochemical and ionic responses of sunflower seedlings to exogenous selenium supply under salt stress. Acta Physiol. Plant. 2017, 39, 213. [Google Scholar] [CrossRef]
  66. Jabeen, N.; Ahmad, R. Growth response and nitrogen metabolism of sunflower (Helianthus annuus L.) to vermicompost and biogas slurry under salinity stress. J. Plant Nutr. 2017, 40, 104–114. [Google Scholar] [CrossRef]
  67. Pereira, S.I.; Moreira, H.; Argyras, K.; Castro, P.M.; Marques, A.P. Promotion of sunflower growth under saline water irrigation by the inoculation of beneficial microorganisms. Appl. Soil Ecol. 2016, 105, 36–47. [Google Scholar] [CrossRef]
  68. Zeng, W.; Xu, C.; Wu, J.; Huang, J.; Zhao, Q.; Wu, M. Impacts of salinity and nitrogen on the photosynthetic rate and growth of sunflowers (Helianthus annuus L.). Pedosphere 2014, 24, 635–644. [Google Scholar] [CrossRef]
  69. Cabelguenne, M.; Debaeke, P.; Bouniols, A. Epicphase, a version of the epic model simulating the effects of water and nitrogen stress on biomass and yield, taking account of developmental stages: Validation on maize, sunflower, sorghum, soybean and winter wheat. Agric. Syst. 1999, 60, 175–196. [Google Scholar] [CrossRef]
  70. Silva, S.; Ferreira Cardoso, J.A.; Oliveira, H.; do Nascimento, R.; Guimaraes, R.F.B.; Leão, A.B. Growth and biomass of sunflower under different nitrogen levels and available water in the soil of a semi-arid region. Aust. J. Crop Sci. 2017, 11, 32. [Google Scholar] [CrossRef]
  71. Gallego, S.M.; Benavides, M.P.; Tomaro, M.L. Effect of heavy metal ion excess on sunflower leaves: Evidence for involvement of oxidative stress. Plant Sci. 1996, 121, 151–159. [Google Scholar] [CrossRef]
  72. Murillo, J.; Maranon, T.; Cabrera, F.; López, R. Accumulation of heavy metals in sunflower and sorghum plants affected by the guadiamar spill. Sci. Total Environ. 1999, 242, 281–292. [Google Scholar] [CrossRef]
  73. Cai, G.; Vanderborght, J.; Couvreur, V.; Mboh, C.M.; Vereecken, H. Parameterization of root water uptake models considering dynamic root distributions and water uptake compensation. Vadose Zone J. 2017. [Google Scholar] [CrossRef]
  74. Albasha, R.; Mailhol, J.C.; Cheviron, B. Compensatory uptake functions in empirical macroscopic root water uptake models–experimental and numerical analysis. Agric. Water Manag. 2015, 155, 22–39. [Google Scholar] [CrossRef]
  75. Couvreur, V.; Vanderborght, J.; Javaux, M. A simple three-dimensional macroscopic root water uptake model based on the hydraulic architecture approach. Hydrol. Earth Syst. Sci. 2012, 16, 2957–2971. [Google Scholar] [CrossRef] [Green Version]
  76. Skaggs, T.H.; van Genuchten, M.T.; Shouse, P.J.; Poss, J.A. Macroscopic approaches to root water uptake as a function of water and salinity stress. Agric. Water Manag. 2006, 86, 140–149. [Google Scholar] [CrossRef]
  77. Green, S.; Clothier, B. Root water uptake by kiwifruit vines following partial wetting of the root zone. Plant Soil 1995, 173, 317–328. [Google Scholar] [CrossRef]
  78. Zeng, W.; Xu, C.; Wu, J.; Huang, J. Soil salt leaching under different irrigation regimes: HYDRUS-1D modelling and analysis. J. Arid Land 2014, 6, 44–58. [Google Scholar] [CrossRef]
  79. Wang, J.; Wu, J.; Jia, H. Analysis of spatial variation of soil salinization using a hydrochemical and stable isotopic method in a semiarid irrigated basin, Hetao plain, Inner Mongolia, north China. Environ. Process. 2016, 3, 723–733. [Google Scholar] [CrossRef]
  80. Zhao, Y.; Li, Y.; Wang, J.; Pang, H.; Li, Y. Buried straw layer plus plastic mulching reduces soil salinity and increases sunflower yield in saline soils. Soil Tillage Res. 2016, 155, 363–370. [Google Scholar] [CrossRef]
  81. Yang, H.; Hu, J.; Long, X.; Liu, Z.; Rengel, Z. Salinity altered root distribution and increased diversity of bacterial communities in the rhizosphere soil of Jerusalem artichoke. Sci. Rep. 2016, 6, 20687. [Google Scholar] [CrossRef] [PubMed]
  82. Di Caterina, R.; Giuliani, M.; Rotunno, T.; De Caro, A.; Flagella, Z. Influence of salt stress on seed yield and oil quality of two sunflower hybrids. Ann. Appl. Biol. 2007, 151, 145–154. [Google Scholar] [CrossRef]
  83. Kong, D.; Shi, H.; Wei, Z.; Chen, Y.; Zhang, L.; Huo, Z.; Li, Y.; Wang, C. Effect on physiological properties of sunflower under water-saving irrigation in the arid areas. J. Irrig. Drain. 2004, 23, 44–46. [Google Scholar]
  84. Chartzoulakis, K.; Klapaki, G. Response of two greenhouse pepper hybrids to NaCl salinity during different growth stages. Sci. Hortic. 2000, 86, 247–260. [Google Scholar] [CrossRef] [Green Version]
  85. Maas, E.; Poss, J.; Hoffman, G. Salinity sensitivity of sorghum at three growth stages. Irrig. Sci. 1986, 7, 1–11. [Google Scholar] [CrossRef]
  86. Gornott, C.; Wechsung, F. Statistical regression models for assessing climate impacts on crop yields: A validation study for winter wheat and silage maize in Germany. Agric. For. Meteorol. 2016, 217, 89–100. [Google Scholar] [CrossRef]
  87. Wang, P.; Pozdniakov, S.P. A statistical approach to estimating evapotranspiration from diurnal groundwater level fluctuations. Water Resour. Res. 2014, 50, 2276–2292. [Google Scholar] [CrossRef] [Green Version]
  88. Jones, H.G. Plants and Microclimate: A Quantitative Approach to Environmental Plant Physiology; Cambridge University Press: Cambridge, UK, 2013. [Google Scholar]
  89. Paleari, L.; Movedi, E.; Confalonieri, R. Trait-based model development to support breeding programs. A case study for salt tolerance and rice. Sci. Rep. 2017, 7, 4352. [Google Scholar] [CrossRef] [PubMed]
  90. Karlberg, L.; Ben-Gal, A.; Jansson, P.-E.; Shani, U. Modelling transpiration and growth in salinity-stressed tomato under different climatic conditions. Ecol. Model. 2006, 190, 15–40. [Google Scholar] [CrossRef]
  91. Ferrer-Alegre, F.; Stockle, C.O. A model for assessing crop response to salinity. Irrigation Sci. 1999, 19, 15–23. [Google Scholar] [CrossRef]
Figure 1. Simplified diagram of the structure of the modified model (WOFOST-ES) under general environmental stress.
Agronomy 08 00172 g001
Figure 2. Basic climate data during sunflower growth periods in 2012 (a), 2013 (b) and 2017 (c).
Agronomy 08 00172 g002
Figure 3. Simulated and observed leaf area index (LAI, a,b) and yield (c,d) in 2012 and 2013. Black lines indicate potential simulations using calibrated potential crop parameters. Red lines indicate the water-stressed condition, activated using the water stress function in WOFOST. Blue dots represent observations.
Agronomy 08 00172 g003
Figure 4. WOFOST-ES model-simulated and observed yield (a) and leaf area index (LAI, b) in 2012.
Agronomy 08 00172 g004
Figure 5. Environmental stress factor (ES) of the WOFOST-ES model, water stress factor of the Feddes model-α(h), and the salt stress factor of the Feddes model-α(π) for the 14 micro-plots during the seedling, bud, flowering, and maturity stages of sunflower in 2012. Sub-figures (a), (b), (c) and (d) indicate seedling, bud, flowering and maturity stages of sunflower.
Agronomy 08 00172 g005
Figure 6. PLSR prediction of environmental stress factors of bud (black squares), flowering (red dots), and maturity (blue triangles) stages under the influence of soil salinity. Lines indicate linear fitting, and the dashed purple line is the 1:1 line.
Agronomy 08 00172 g006
Figure 7. Evaluation of Equations (7)–(9) relative to the observed yield (a) and leaf area index (LAI, b) in 2013. Red squares indicate micro-plots with large differences between simulated and observed yield. R2, RMSE, and RRMSE in parentheses are statistical indices ignoring the four micro-plots in the red squares.
Agronomy 08 00172 g007
Figure 8. Evaluation of Equations (7)–(9) relative to observed yield in 2017. Black squares indicate the mean value of 7 fields, with standard deviations of both observed and simulated yields. Blue points indicate yields of all 21 measured samples. Black lines and blue dashed lines indicate the linear fitting curves of mean values and all measured samples, respectively.
Agronomy 08 00172 g008
Figure 9. Change in leaf area index (LAI) with stress factors in the seedling (a), bud (b), flowering (c), and maturity (d) stages in 2012.
Agronomy 08 00172 g009
Figure 10. Change in yield with stress factors in the seedling (a), bud (b), flowering (c), and maturity (d) stages in 2012.
Agronomy 08 00172 g010
Figure 11. Dynamic of soil salt content in micro-plot 6.
Agronomy 08 00172 g011
Table 1. Reviews of crop models that consider environmental stresses.
NameVersionWaterSaltNitrogenTemperatureCO2Reference
APEXVersion: 0604[28]
APSIMVersion: 2×[29]
CropSystVersion: 4[30]
DAISYVersion: 2012×[31]
DayCentVersion: 4.5×[32]
DNDCVersion: 8.3p××[33]
WOFOSTVersion: 7.1.7××[34]
DSSATVersion: 3.5×[35]
EPICVersion: 0810[36]
HYDRUSVersion: 4.17[37]
LPJmL×[38]
MONICAVersion 2.0×[39]
SPACSYS×[40]
STICSVersion: 8.3×[41]
SWATVersion: 2009×[27]
Table 2. Phenology data of sunflower in 2012, 2013, and 2017. DOY denotes day of year.
Growth StagesYear: 2012Year: 2013Year: 2017
DateDOYDateDOYDateDOY
Sowing7 June1594 June15527 May147
Bud3 July19521 July20211 July192
Anthesis15 August2287 August22028 July209
Maturity14 September2586 September2495 September248
Harvest24 September26816 September25915 September258
Table 3. Soil physical properties of micro-plots (mean value of the 14 micro-plots) and fields (mean value of the 7 micro-plots).
ExperimentDepth (cm)BD (g/cm3)Sand (%)Silt (%)Clay (%)OM (g/kg)Soil Texture
Micro-plot experiments in 2012 and 20130–101.3512.5854.9432.4811.6Silty Clay Loam
10–201.3511.7952.8135.4010.63Silty Clay Loam
20–301.4412.0252.3235.668.21Silty Clay Loam
30–401.4412.2753.7733.966.94Silty Clay Loam
40–601.448.9169.7721.326.94Silt Loam
60–801.5112.4870.5716.956.94Silt Loam
80–1001.5116.6969.5913.726.94Silt Loam
Field experiments in 20170–101.3510.2871.6718.0514.64Silt Loam
10–201.387.8572.2919.8615.14Silt Loam
20–301.446.8578.8814.2810.74Silt
30–401.5520.261.3418.4610.6Silt Loam
40–601.6116.5177.825.6712.86Silt Loam
60–801.5910.3666.3123.3311.47Silt Loam
80–1001.5211.8933.0555.0610.24Clay
Note: BD denotes bulk density; OM denotes organic matter. Soil texture was determined based on the soil texture triangle of the United States Department of Agriculture (USDA).
Table 4. Initial moisture and salt contents of micro-plots from 14 micro-plots and 7 fields in 2012, 2013 and 2017.
Depth (cm)Moisture in 2012 (cm3/cm3)Moisture in 2013 (cm3/cm3)Moisture in 2017 (cm3/cm3)
Mean (SD)MaxMinMean (SD)MaxMinMean (SD)MaxMin
0–100.310 (0.052)0.4040.0730.276 (0.042)0.3480.1520.218 (0.039)0.3600.116
10–200.310 (0.049)0.4380.1890.282 (0.045)0.3690.1900.243 (0.037)0.4040.126
20–300.337 (0.051)0.4340.2090.305 (0.050)0.3890.1130.263 (0.045)0.3930.153
30–400.340 (0.051)0.4260.2000.319 (0.059)0.5570.1340.300 (0.048)0.4590.098
40–600.374 (0.056)0.5920.2040.353 (0.056)0.4290.1520.347 (0.043)0.4880.153
60–800.411 (0.055)0.4960.1920.381 (0.072)0.4740.1130.370 (0.044)0.4930.157
80–1000.427 (0.044)0.5030.2690.390 (0.067)0.4880.1370.362 (0.041)0.5060.170
Depth (cm)Salt in 2012 (ECe, dS/m)Salt in 2013 (ECe, dS/m)Salt in 2017 (ECe, dS/m)
Mean (SD)MaxMinMean (SD)MaxMinMean (SD)MaxMin
0–109.570 (8.611)54.9822.1027.419 (3.797)18.1302.4274.442 (3.431)15.4661.295
10–207.849 (4.827)23.6802.2946.641 (3.240)14.7481.7834.655 (3.158)14.1121.332
20–307.608 (4.051)20.9421.2506.245 (2.978)14.0161.6135.05 (3.389)14.4451.225
30–407.873 (5.681)42.1281.0246.007 (3.531)22.1261.1695.095 (3.308)14.4451.295
40–606.276 (3.780)14.9481.7095.425 (2.510)12.1361.4314.988 (2.993)14.0011.243
60–805.175 (3.251)15.3181.4694.827 (2.820)13.5491.3455.174 (2.813)13.4831.058
80–1004.532 (2.708)11.3891.2284.170 (2.483)11.9361.2284.819 (2.197)10.4191.125
Note: SD denotes standard deviation. There were 14 micro-plots and 7 fields.
Table 5. Sunflower growth parameters of the WOFOST model under the potential condition.
Growth ParameterUnitValueDescription
LD5009JK601
TSUM1°C·d−112501150Temperature sum from emergence to anthesis
TSUM2°C·d−1530730Temperature sum from anthesis to maturity
RGRLAId−10.02940.0294Maximum relative increase in leaf area index (LAI)
SLA-00.0350.035Specific leaf in developmental stage 0
SLA-10.0250.025Specific leaf in developmental stage 1
SLA-20.0250.025Specific leaf in developmental stage 2
EFFkg·ha−1·h−1·j−2·m2·s0.850.62Light use efficiency for a single leaf

