Article

Methylome and Epialleles in Rice Epilines Selected for Energy Use Efficiency

1
Department of Plant Biotechnology and Bioinformatics, Ghent University, Technologiepark 927, 9052 Ghent, Belgium
2
Center for Plant Systems Biology, VIB, Technologiepark 927, 9052 Ghent, Belgium
3
BASF Agricultural Solutions Belgium NV, Technologiepark 38, 9052 Ghent, Belgium
4
Bayer CropScience (BioScience), Multi-Crop Breeding Station (MCBS), Chandippa, Shankarpally, Ranga Reddy District-501203, Telangana State, India
*
Author to whom correspondence should be addressed.
Agronomy 2018, 8(9), 163; https://doi.org/10.3390/agronomy8090163
Submission received: 13 July 2018 / Revised: 6 August 2018 / Accepted: 21 August 2018 / Published: 24 August 2018
(This article belongs to the Special Issue The Regulatory Functions of Epigenetic Mechanisms in Plants)

Abstract

:
Epigenetics offers important opportunities in breeding to improve the potential yield in a wide variety of crops. Starting from a pure breeder seed lot of a rice (Oryza sativa ssp. indica) inbred population, repeated testing for improved cellular respiration rates and energy use efficiency (EUE) over three generations identified performant epilines with distinct epigenetic signatures and with improved seed yield in field trials. Epiline DNA methylomes were characterized by genome-wide bisulfite sequencing to discern cytosine methylation changes in relation to transcriptome and phenotype. Regional methylation changes were dispersed over the epiline genomes. A number of upstream-associated differentially methylated regions (DMRs) correlated with differentially expressed genes (DEGs) with a role in particular molecular functions like transmembrane transport and protein kinase activity. Targeted bisulfite sequencing confirmed epiline DMRs that anti-correlated with DEGs, identifying putative epialleles that were susceptible for cytosine methylation changes that might affect gene expression and contribute to the phenotype. Chromatin immunoprecipitation sequencing revealed the extensive enrichment of gene-associated histone H3 lysine-4 trimethylation (H3K4me3), which correlated with gene activation and reduced cytosine methylation. Our data indicate that seed formation is prone to epigenetic changes that might be used as a resource in crop improvement.

1. Introduction

When growing the future food crops, we have to meet the demands of a rising global population of above nine billion in 2050, requiring improved seed yield per hectare on existing agricultural land. Yield is affected by the chosen bred plant variety, climate, soil, and agricultural practices. In breeding, the growth optima for a wide range of parameters are broadened by introducing new (epi)genetic resources that determine crop physiological characteristics. Genetic and epigenetic mechanisms that regulate complex traits, such as yield, are not yet sufficiently understood [1,2]. The efficiency of energy use in plants is an important component of yield stability in the field under varying environmental conditions, and it is measured by low cellular respiration and steady NADPH content [3]. Indeed, the ratio between energy content and cellular respiration, defined here as energy use efficiency (EUE), has a major impact on the yield potential of a crop. Both the EUE and energy homeostasis have an epigenetic component that can be directed and stabilized by selection [3,4]. Brassica napus (canola) epilines selected for improved cellular respiration rates and EUE have increased seed yield, changes in global cytosine methylation and transcriptome changes [4,5].
Epigenetic and chromatin modifications in plants include DNA methylation in various cytosine contexts, incorporated histone variants, and their post-translational modifications, regulatory non-coding RNAs, and nucleosome occupancy. DNA methylation is an important component of the repertoire of epigenetic modification. Methylation at CG sites is most abundant and occurs in gene bodies, their upstream (promoter) and downstream regions, and in non-coding regions and repetitive elements, like transposable elements (TEs) [6,7]. CHG methylation is relatively less abundant up- and downstream of genes, but it occurs in inverted and tandem repeats, and in TEs [6,7]. The abundant CHH sites in the genome are methylated at very low levels overall, but are highly methylated in short repeats, like satellite DNA and some TEs [6,8,9]. High cytosine methylation of upstream regions correlates with low or no gene transcription in flowering plants, and is exemplified especially in rice [6,10,11]. Loss of silencing involves loss of CG methylation, and changes in histone H3 modification, leading to epialleles that vary in expression even in isogenic populations [12,13]. This changed cytosine methylation state at specific gene-associated regions might remain stable over generations [14,15,16]. Specific post-translational histone modifications have been associated with the modulation of gene expression in plants [17]. Histone H3 lysine-4 trimethylation (H3K4me3) is associated with highly expressed genes [18], and dynamic changes in the occurrence of H3K4me3 in genes are positively correlated with the transcriptional regulation of certain stress-responsive genes [19,20]. DNA methyltransferases that function in cytosine methylation establishment and maintenance interact with histone modification enzymes and components of the RNAi machinery [21,22].
Here, we produced rice epilines with an enhanced seed yield in the field by selecting for EUE. Genome-wide analyses revealed that their transcriptomes and epigenomes were altered; CG methylation changes in upstream regions correlated with differential gene expression. In addition, H3K4me3 was enhanced at the coding regions of the same genes or of distinct subsets of genes. Our study shows that epigenetic variation in seed lots occurs and can be selected for, which might be used to identify pathways, genes, and networks that underlie agronomical traits.

2. Material and Methods

2.1. Plant Material and Growth Conditions

A rice pure breeding inbred line (Oryza sativa ssp. indica) of Bayer CropScience, named the control line, and derived epilines, named LR1, LR2 [23], and LR3, selected for a higher EUE (Figure S1), were grown in a growth chamber at 26 °C/21 °C (day/night) for 24 days to vegetative stage 2, characterized by the emerging fifth leaf at the first tiller, in a 16 h light/8 h dark regime (light intensity was 300 µmol m−2 s−1, the relative humidity was kept at 71%). The sample material for the molecular analyses were pools of the fourth leaf of vegetative stage 2 plants, which belong to the fourth selfing generation of the EUE selection pedigree, unless differently indicated.

2.2. Selection for Respiration Rate and Energy Use Efficiency

The selection was basically done as described for Brassica napus [5] using a population of 180 seedlings (Figure S1). The seedlings were grown in the dark in vitro for 10 days on agar in half-strength Murashige and Skoog medium supplemented with 3% (w/v) sucrose. The first 5 cm above the coleoptiles (primary leaf rolls) were cut in about 0.6 cm segments. Care was taken to not damage the meristem. Seven primary leaf roll explants of each seedling were cultured in the dark for one day on callus inducing medium (Murashige and Skoog medium containing 2% (w/v) maltose, 3% (w/v) sorbitol, 2 mg/L 2,4D). The cut seedlings were cultured in the light to allow outgrowth of the meristem. For each seedling, the cellular respiration of the seven leaf roll explants was quantified by measuring the reduction of triphenyltetrazolium chloride as previously described [24]. Brief outline: the seven explants were transferred to 2 mL 20 mM 2,3,5-triphenyltetrazolium (TTC) solution in 50 mM K-phosphate buffer (pH 7.4). They were incubated for 1.5 h in the dark at 26 °C. The TTC solution was removed and the explants were washed with water. The explants were freeze-thawed and the reduced TTC was extracted with 1 mL ethanol by shaking for about 1.5 h. The absorption of the extract was measured at 485 nm and 663 nm. The absorbance of the reduced TTC (TTC-H) was calculated at an optical density of 485 nm (OD485): OD485 TTC-H = a − (b/c) (a = OD485; b = OD663; c is a constant determined by measuring the absorbance of chlorophyll extract (identical processes as described above) at 485 nm and 663 nm, c = OD663/OD485).
Five to 10 seedlings with the lowest respiration of the tested population (Figure S1) were transferred to the greenhouse for seed production by self-fertilization. Both respiration and NAD(P)H content of approximately 35–40 seedlings of the obtained progenies were measured as previously described [5]. Lines with the lowest respiration and highest EUE were retained. Three rounds of selection were sufficient to obtain epilines with distinct lower respiration rates and higher EUEs.
For the determination of leaf respiration, the plants were grown in soil for four weeks (temperature: day, 26 °C, night, 22 °C; light intensity: 400 µMol s−1 m−2; 16 h light, 8 h dark). The fifth leaf of six plants per epiline and the control line of the fifth selfing generation was harvested and put in 240 mL of buffer (25 mM K-phosphate pH = 5.8; 2% sucrose; 0.1% Tween20) saturated with oxygen and contained in a closed 200 mL-scaled bottle. Ten repeats per line were made. The amount of oxygen in the buffer was measured using an optode HQ-portable meter with a LDO-electrode (Hach) after 4 h of incubation at 24 °C (with very gentle shaking). The consumed oxygen was determined by comparing with a blank buffer that contained no leaf material.

2.3. Field Trials

The seed upscale and field trials were done at Bayer’s Rice Breeding Station, Hyderabad (17.40° N, 78.28° E, 550 m amsl). The lines were evaluated in three replications for their agronomic performance. Each line was sown in raised nursery beds, and 21 day-old seedlings were planted at spacing of 20 cm (row to row) and 15 cm (plant to plant in a row). Each plot had 400 hills and each had one seedling.

2.4. RNA Sequencing Analysis

Isolation of total RNA was performed from pools of 12 plants with three biological replicates per plant line, using the Spectrum™ Plant Total RNA kit (Sigma-Aldrich, Saint Louis, MO, USA) according to the manufacturer’s instructions. The quantity, quality, and integrity were examined by NanoDrop ND-1000 spectrophotometry, gel electrophoresis, and RNA 6000 Lab-on-a-Chip using the Bioanalyzer 2100. RNA sequencing (RNA-seq) was done by ServiceXS B.V. (Leiden, The Netherlands). Complementary DNA sequencing libraries were prepared with the Illumina mRNA-seq Sample prep Kit according to the Illumina protocol “Preparing Samples for Sequencing of mRNA” (1004898 Rev.D). DNA sequencing using the Illumina HiSeq 2000 (Solexa) was performed according to the manufacturer’s protocols. All sequencing libraries are available via ArrayExpress [25] (accession number: E-MTAB-6983). The RNA-seq analysis was performed with Illumina reads (PE-100) using a bioinformatics pipeline based on FastQC check [26], followed by adapter removal, trimming of at least 10 bp, read start and end quality filtering (Phred ≥ 20; base call error rate ≤ 1.0%) and sequence quality filtering (Phred ≥ 20 at ≥ 75% of sequence length) (cutadapt), followed by mapping using GSNAP [27], read counting using SAMtools idxstats [28] and differential expression testing using edgeR [29]. The high quality paired reads were uniquely mapped, allowing for five mismatches at the coding sequence (CDS) of an Oryza sativa ssp. indica reference genome ([30], PLAZA 9311_BGF_2005). A total of 21,302 genes were retained for examination (Table S4). Differential expression was deduced for genes having counts, and a minimum sum of read counts based on an average of five counts per gene in each sample, p < 0.01, false discovery rate (FDR) (q) < 0.05 and transcriptional level thresholds (log2 fold change (log2FC) > 0.6: up-regulated, log2FC < −0.6: down-regulated, in comparison to the control line [29]. Gene description was assigned by blastx with a reference CDS as the query against the Arabidopsis database, extracting the description of the smallest E-value hit. Gene Ontology (GO) analyses were done using PLAZA v2.5 [31,32,33].

2.5. Quantitative Reverse Transcription Polymerase Chain Reaction (qRT-PCR)

Total RNA was extracted using Spectrum™ Plant Total Kit (Sigma-Aldrich, Saint Louis, MO, USA) and treated with DNaseI as described in the manufacture’s protocol. The complementary DNA (cDNA) was then synthesized using the Invitrogen SuperScript® III First-Strand Synthesis System for RT-PCR (Invitrogen, Carlsbad, CA, USA). Relative transcript abundance of selected genes (Table S5) was determined using the Roche LightCycler 480 system and the LC480 SYBR Green I Master kit (Roche Diagnostics, Risch-Rotkreuz, Switserland). Measurements were taken for three biological and three technical repeats. The amplification data were analyzed with qBase+ [34], using the second derivative maximum method and five reference genes for normalization, to obtain relative expression values.

2.6. Whole Genome Bisulfite Sequencing (WGBS)

For genome-wide DNA methylome analysis by bisulfite sequencing (WGBS), the isolation of gDNA was performed from pooled fourth leaves of 12 individual plants per line using the CTAB (cetyltrimethyl/ammonium bromide) standard protocol [35]. Genomic DNA isolates were examined for high quality and sufficient quantity by NanoDrop spectrophotometry (concentration, A260/A280 of approximately 1.9 or more) and gel electrophoresis (high molecular weight, integrity, purity). For WGBS, paired-end WGBS libraries were constructed by Alpha Biolaboratory, Inc. Saratoga, CA, USA as previously described [36], with modifications. About 300 ng of gDNA was fragmented by sonication, end repaired, and ligated to custom-synthesized methylated adapters (Eurofins MWG Operon, Huntsville, AL, USA) according to the manufacturer’s (Illumina, San Diego, CA, USA) instructions for gDNA library construction. Adaptor-ligated libraries were subjected to two successive treatments of sodium bisulfite conversion using the EpiTect Bisulfite kit (Qiagen, Hilden, Germany), as outlined in the manufacturer’s instructions. One-quarter of the bisulfite-converted libraries was PCR-amplified using the following conditions: 2.5 U of ExTaq DNA polymerase (Takara Bio, Kusatsu, Shiga, Japan), 5 µL of 10 × ExTaq reaction buffer, 25 µM deoxynucleoside triphosphates (dNTPs), 1 µL primer 1.1, and 1 µL primer 2.1 in a 50 µL reaction. The thermocycling conditions were as follows: 95 °C for 3 min, then 12–14 cycles of 95 °C for 30 s, 65 °C for 30 s, and 72 °C for 60 s. The enriched libraries were purified twice with the Solid Phase Reversible Immobilization (SPRI) method using 0.8 × (v/v) AM-Pure beads (Beckman Coulter, Brea, CA, USA) prior to quantification with a Bioanalyzer (Agilent Technologies, Santa Clara, CA). Sequencing on the Illumina platform (SE100 runs) was performed at the Vincent J. Coates Genomic Sequencing Laboratory at UC Berkeley. All sequencing libraries are available via ArrayExpress [25] (accession numbers: E-MTAB-5002 and E-MTAB-6981). The WGBS data analysis was performed with Illumina reads (SE-100) using a bioinformatics pipeline based on FastQC v0.9.1 check [26], followed by PCR duplicate filtering, adapter removal, read start and end quality filtering (Phred ≥ 20; base call error rate ≤ 1.0%) and length filtering (nt ≥ 50) selections, and primer removal, followed by mapping and methylation calling using Bismark v0.10.0 [37] and statistical testing and differentially methylated region (DMR) detection using methylKit v0.5.7 and R v3.0.1 processing [38]. The high-quality reads were uniquely mapped at a nuclear reference genome of Oryza sativa ssp. indica ([30], PLAZA 9311_BGF_2005), and genome coverage was determined for at least one mapped read at a genome position. A mapping threshold of at least 10 informative nucleotides (C or T) mapped at cytosine positions (i) of the reference genome was used for the calculation of the cytosine site methylation level (%) = C i / ( C i + T i ) × 100% (for variables, see above or [39]) in both DNA strands [39]. Cytosine methylation levels of CG, CHG, and CHH sites at their total number of positions (n) were genome-wide averaged as the mean methylation level (%) = 1 / n i = 1 n C i / ( C i + T i ) × 100% (for variables, see above or [39]). Bisulfite conversion efficiency rates were assessed by calculating the cytosine methylation levels in the chloroplast genome. Bisulfite conversion rates were approximately 99%, and genome coverage was 72% to 75% in the Oryza sativa ssp. indica reference genome, which was equally good as the 76% observed in a previous study of O. sativa ssp. indica [11].

2.6.1. Detection of Differential Cytosine Methylation

Cytosine site-specific DMRs (CG, CHG, CHH) were defined by a minimum of 10 informative nucleotides in unique mappable reads at consistently mapped positions in every line (read-depth weighted methylation level (%) = i = 1 n C i / i = 1 n ( C i + T i ) × 100%; variables: see main section, above or [39], 100%, window size: 100 bp, step size: 20 bp) and after passing FDR (q) < 0.01 and additional requirements (read-depth weighted methylation level difference threshold, involved cytosines) in an epiline compared with the control line using methylKit [38]. A relaxed selection (>|25|% read-depth weighted methylation level (methylKit default), ≥2 involved cytosines (define a region)) was used for the connection to transcription data. The stringent DMR selection (>|80|% read-depth weighted methylation level and ≥2 involved cytosines, named highly differentially methylated region (hDMR)) was used for the detection of methylome changes in the target region. Selected DMRs were joined when they were co-located with a distance of 20 bp (equal to step size) between each other.

2.6.2. DNA Methylome and Transcriptome Integration

The DNA methylome (BS) and transcriptome (RNA-seq) connection was based on DMRs showing more than a 25% read-depth weighted methylation level difference and on a DMR location that was less than 2 kb upstream of the DEG transcription start, and that were supposed to contain the entire or part of the promoter because promoter annotation is not available in the genomic feature annotation for this reference genome ([30], PLAZA 9311_BGF_2005, annotation, ATG). Hyper-methylated CG-DMRs associated with transcriptional down-regulated DEGs were detected, and vice versa. CG-DMRs with the highest read-depth weighted methylation level difference upstream of a DEG were joined.

2.7. Targeted Bisulfite Sequencing

Targeted bisulfite sequencing was performed as region-specific cytosine methylation analysis of upstream DMR-associated DEGs, and confirmation of WGBS data by bisulfite-converted DNA followed by PCR amplification and next-generation sequencing (NGS) analysis. The same gDNA isolates of the control line and epilines LR1 and LR2 as for WGBS were used. The assay was performed and provided by Active Motif, Inc. (La Hulpe, Belgium). PCR primers to the target region were designed with the MethPrimer software [40]. All primers were designed to the plus strand and used in PCR reactions with bisulfite-converted gDNA (Table S1). Based on a relatively low frequency of methylation in CHH sites, and instead assuming them as not-methylated, the conversion efficiency was estimated to be ≥99.5%. PCR reactions (40 cycles) were performed using Invitrogen’s Platinum PCR supermix. Amplicon sizes were between 237 and 496 bp. For each of the samples, about equal amounts of the PCR products were pooled and DNA ends were made blunt. After concatemerization with T4 DNA ligase, the samples were sonicated to an average fragment length of 150–300 bp. Libraries were generated from these sonicated DNA samples using the standard Illumina protocol. The samples were indexed with 8 bp bar codes (independent Illumina index read). Sequencing on NextSeq 500 generated > 6 million 75 nt reads (single-end) per sample. Reads (Phred ≥ 20; base call error rate ≤ 1.0%) were aligned to the reference genome of Oryza sativa ssp. indica ([30], PLAZA 9311_BGF_2005) using Bismark v0.7.7 [37]. Alignment and methylation information were captured in BAM files by running the appropriate Bismark scripts, and methylation levels and read depths at each CG site were determined, and the latter was higher than 14,000. Alignments to the strands and to genomic locations not expected to be present in the PCR products were filtered out using a combination of SAMtools [28] and standard UNIX commands.

2.8. Chromatin Immunoprecipitation Sequencing (ChIP-seq)

ChIP-seq was performed from pools of 12 plants with two biological replicates per LR2 and the control, which belonged to the fifth selfing generation of the EUE selection pedigree. The assays for histone modification H3K4me3 (HistonePath™) and PolII-detection (TranscriptionPathTM) were performed and provided by Active Motif, Inc. (La Hulpe, Belgium), and are described below.

2.8.1. Chromatin Immunoprecipitation

Liquid nitrogen fixation was performed by means of a pre-cooled (−80 °C) mortar, pestle, metal spatula, and sample, which were placed on dry ice. Approximately 1 g per sample was ground to a fine powder, placed into the plant fixation buffer (40 mL plant cross-linking and extraction buffer, 1 mL 37% formaldehyde, and 400 µL 0.1 M phenylmethylsulfonyl fluoride (PMSF), and mixed in a vacuum for 10 min, and 1.6 mL 2.5 M glycine were added and mixed for 5 min in vacuum. The samples were transferred to a 50 mL conical tube and spun for 10 min at 2500 rpm at 4 °C. The pellet washed twice in 10 mL ice-cold diH2O, spun for 10 min at 2500 rpm and 4 °C, and the pellets were frozen on dry ice.
Chromatin was prepared by resuspending each pellet in 5 mL nuclei isolation buffer, 5 µL protease inhibitor cocktail (PIC), and 50 µL 0.1 M PMSF. Samples were incubated on ice for 10 min, homogenized with 20 strokes of bouncing, centrifuged for 10 min at 2500 rpm and 4 °C, and each pellet was resuspended in 500 µL DOC sonication buffer (5 µL PIC and 5 µL 0.1 M PMSF), incubated on ice for 10 min, and 50 mg of glass beads were added. The samples were sonicated twice with a microtip (10 min in total, consisting of 30 s pulses and 30 s pauses, with an amplitude of 45%). The tubes were centrifuged to pellet debris at maximum speed for 10 min at 4 °C. 10 µL supernatant was distributed for two replicates for Input DNA preparations.
Genomic DNA (Input) was prepared by treating aliquots of chromatin with RNase, proteinase K, and heat for de-crosslinking, followed by ethanol precipitation. Pellets were resuspended and the resulting DNA was quantified on a NanoDrop spectrophotometer. Extrapolation to the original chromatin volume allowed quantitation of the total chromatin yield.
An aliquot of chromatin (15 µg) was precleared with protein A agarose beads (Invitrogen, Carlsbad, CA, USA). Genomic DNA regions of interest were isolated using antibodies against H3K4me3 (Active Motif, cat # 39159) or the largest subunit (YSPTSpPS) of RNA PolII (Active Motif, cat # 39097). Complexes were washed, eluted from the beads with SDS buffer, and subjected to RNase and proteinase K treatment. Crosslinks were reversed by incubation overnight at 65 °C, and ChIP DNA was purified by phenol-chloroform extraction and ethanol precipitation.
qRT-PCR reactions were carried out in triplicate on specific genomic regions (positive and negative controls) using the SYBR Green Supermix (Bio-Rad, Hercules, CA, USA). The resulting signals were normalized for primer efficiency by carrying out qRT-PCR for each primer pair using Input DNA.

2.8.2. ChIP Sequencing

Illumina sequencing libraries were prepared from the ChIP and Input DNAs by the standard consecutive enzymatic steps of end-polishing, dA-addition, and adaptor ligation. After a final PCR amplification step, the resulting DNA libraries were quantified and sequenced on Illumina’s NextSeq 500 (SE-75). All sequencing libraries are available via ArrayExpress [25] (accession number: E-MTAB-6982). Reads were aligned to an Oryza sativa ssp. indica reference genome [30] using the BWA algorithm (v0.6.1, default settings) [41].
Duplicate reads were removed and only uniquely mapped reads (mapping quality ≥ 25) were used for further analysis. Alignments were extended in silico at their 3’-ends to a length of 200 bp, which is the average genomic fragment length in the size-selected library, and assigned to 32 nt bins along the genome. The resulting histograms (genomic “signal maps”) were stored in bigWig files. Peak locations were determined using the MACS algorithm (v1.4.2) with a cutoff of p < 10−7 [42]. For PolII, the “− nomodel” option was used.
The unions of overlapping peak intervals were identified for the purpose of sample comparison, peak metrics, peak locations and gene annotations ([30], PLAZA 9311_BGF_2005, annotation). For differential H3K4me3 and PolII analyses, peak enrichment was deduced within genes having log2 fold changes (log2FC) > 0.6 in LR2, in comparison with the control line. The connection of H3K4me3 (ChIP) enrichment, PolII (IP) enrichment, and transcriptional up-regulation (RNA-seq) was performed based on the associated genes.

3. Results

3.1. Rice Epilines Selected for Energy Use Efficiency Show an Enhanced Seed Yield

A pure breeder seed lot of an inbred line of a rice variety Oryza sativa L. ssp indica was subjected to a repeated testing and selection procedure (Figure S1), similar to that previously described in canola [3,4,5] to identify epilines with an improved EUE. Leaf roll explants from 10 day-old rice seedlings were evaluated for cellular respiration (Table S2). Ten seedlings, of which the explants had the lowest cellular respiration, were transferred to the greenhouse for seed production by self-fertilization. Two of the self-fertilized S1 progenies with the lowest respiration and an NAD(P)H content that was similar to that of the original inbred line control were retained. After repeated selections in three consecutive selfing generations, three epilines, LR1, LR2, and LR3, with low cellular respiration and normal NAD(P)H content, were obtained; these parameters remained stable in the next selfing generations S4 and S5, which were obtained without further selection (Table S2). The LR1 and LR2 epilines had comparably lower cellular respiration levels of 88% and 86%, respectively, and an increased EUE of 115% and 116%, respectively, as compared with the control line (Table 1). The LR3 epiline also had a significantly lower cellular respiration (95%, p < 0.01) than the control line, but its EUE was not significantly different (Table 1). The leaf respiration was significantly reduced in LR1 and LR2 by approx. 20% compared with the control line (p < 0.05, Table 1) in S5 plants, which correlated with the lower respiration of the leaf roll explants upon selection in vitro.
The seeds of generation S5 were upscaled in field conditions (generation S6) and used for field trials in the wet season of 2013 (one location, three repetitions, 400 plants/repetition). Significantly increased seed yield (Figure S2) was measured in LR1 and LR2, i.e., 116% and 110%, respectively, as compared with the control line (p < 0.05, Table 1). The seed yield of LR3 was similar to the control line (99%). When a next generation was grown in the field (generation S7, 2014), the yield gain in line LR2 was lost, whereas LR1 showed a statistically non-significant yield of 105% versus the control (Table 1). This moderate yield increase of LR1 was lost in the next generation (generation S8, 2015).

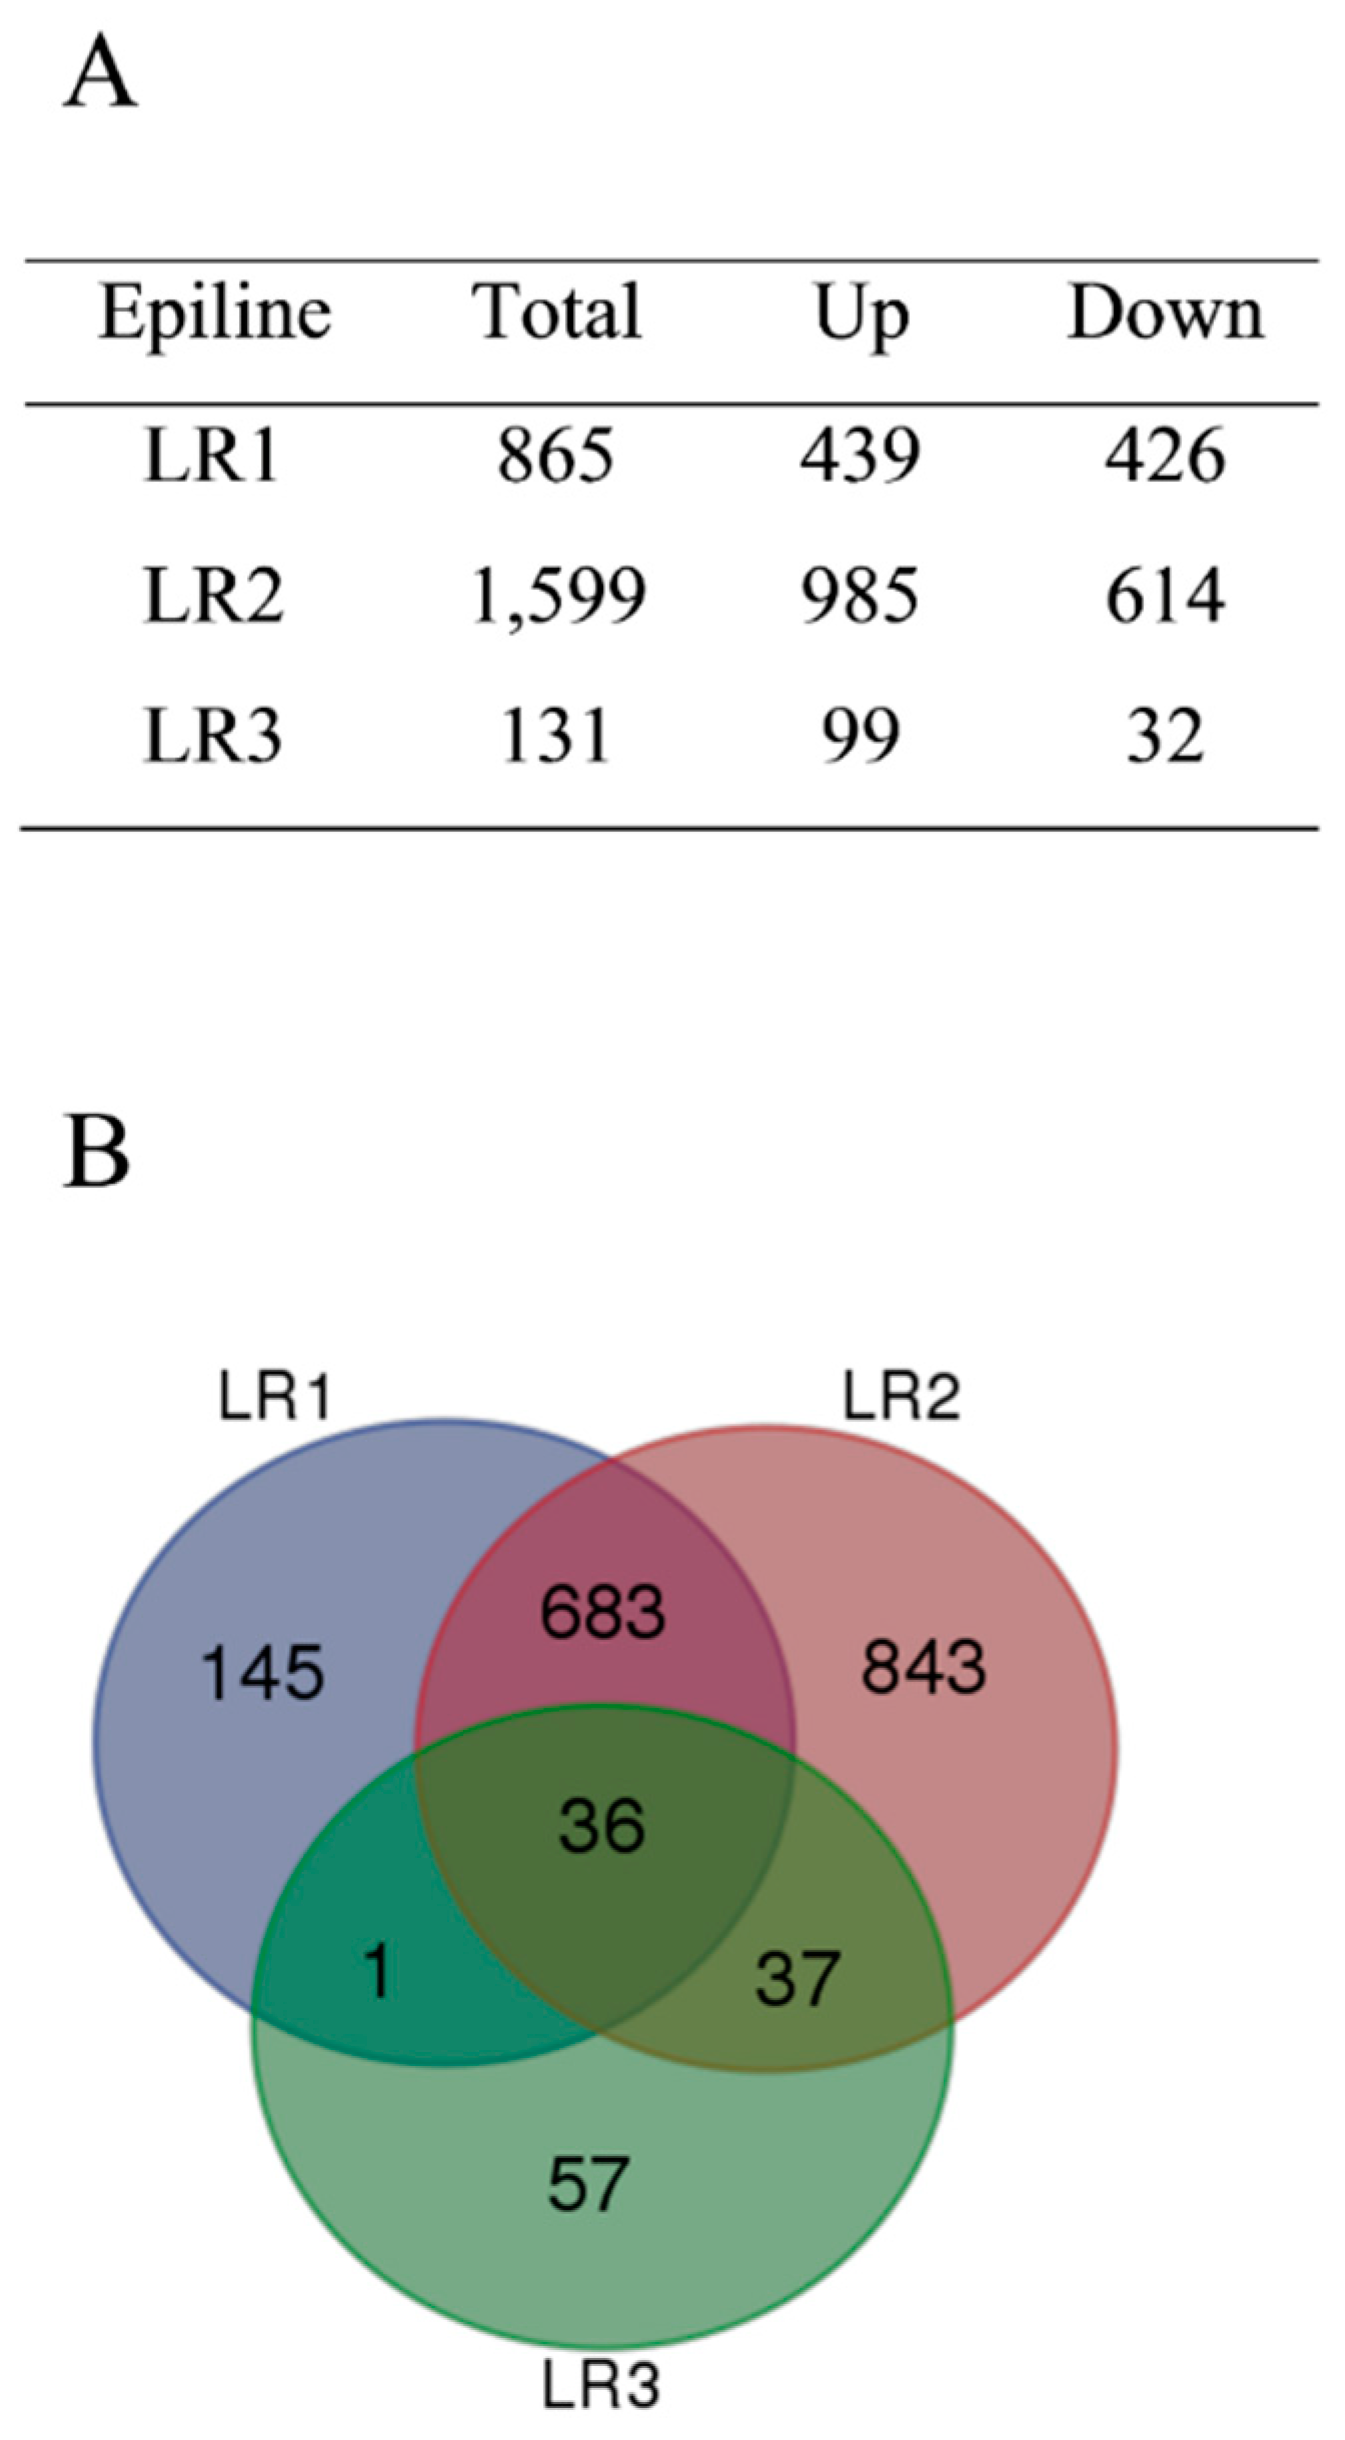
3.2. Altered Transcriptomes in Rice Epilines

To gain insight into transcriptional changes captured by the selection for improved EUE, the transcriptomes of the LR1, LR2 and LR3 epilines and the control line were compared. The fourth leaves of 28-day-old seedlings, grown non-selectively in growth chamber conditions, were sampled for RNA-seq analyses in three replicates (Table S3). Pairwise comparisons between each epiline versus the control line identified differentially expressed genes (DEGs) using the EdgeR package (fold change > 1.5; p < 0.05) (Table S4). The total number of DEGs identified in LR1 was 865, of which 439 were up-regulated and 426 down-regulated (Figure 1A). In LR2, 1,599 genes had altered expression levels, of which 985 were up-regulated and 614 were down-regulated. In LR3, only 131 DEGs were found, among those, 99 were up-regulated and 32 were down-regulated. A relatively small number of 36 DEGs was commonly deregulated in all epilines, mainly because of limited transcriptional changes observed in LR3 (Figure 1B).
A big overlap of 719 DEGs was observed between the LR1 and LR2 transcriptomes (Figure 1B; Figure S3), which was in accordance with the EUE similarity between these epilines and their pedigree (Figure S1). qRT-PCR analyses of DEGs showed a high degree of expression correlation between RNA-seq and qRT-PCR results (LR1 r = 0.98; LR2 r = 0.96) (Figure S4 and Table S5).
We investigated the DEGs for their functional information through gene ontology (GO) using PLAZA v2.5 [31,32], in order to identify their cellular components, biological processes and molecular functions. GO analyses were performed on the epilines LR1 and LR2 because of the low number of DEGs observed in LR3. Up-regulated DEGs in the LR1 and LR2 epilines (Figure S3A) identified highly enriched GO molecular categories related to primary metabolic processes, and especially the chloroplast metabolic process, as also reflected in the cellular component categories of ‘membrane-bound organelle’, ‘organelle’ and ‘plastid’ (about 2.0-fold; p < 0.05) (Table S6). More detailed analyses of these categories revealed that genes encoding chloroplast-related proteins involved in the electron transport chain were highly overrepresented, in addition to genes involved in cyclic electron flow around Photosystem I (PSI), subunits of the chloroplast NAD(P)H dehydrogenase complex, e.g., NDH-DEPENDENT CYCLIC ELECTRON FLOW 1 (NDF1), NDF5 and PsbQ-LIKE 2 (PQL2), translocation of cytoplasmic proteins to the plastids, export of adenylates into the cytosol, and PENTATRICOPEPTIDE REPEAT (PPR) superfamily proteins. Furthermore, the GO term ‘primary metabolic process’ was also enriched (more than 1.5-fold; p < 0.001), including different types of transcription factors, protein kinases, and genes involved in amino acid metabolism and transport. Hence, in the EUE-selected LR1 and LR2 rice epilines, molecular processes associated with general metabolic activity and especially chloroplast metabolic activity were transcriptionally enhanced, which differed from the EUE-selected canola epiline [5] with enhanced abiotic stress responses. Although in both species the selection criterion was an enhanced EUE, there were differences in the in vitro EUE assays related to medium composition, cultivation time, and tissue explant (primary leaf roll in rice and hypocotyl in canola).
Down-regulated DEGs in LR1 and LR2 epilines (Figure S3B) were highly enriched in biological processes related to the GO terms ‘transport’ and ‘transmembrane transport’ (log2FC > 1.55; p < 10−5) (Table S6), and they included different members of the mitochondrial substrate carrier family and proteins involved in transmembrane transport of various substrates, including metal ions and metabolites. The cellular component GO terms ‘organelle’, ‘membrane-bound organelle’ and ‘plastid’ were also enriched (more than 1.5-fold; p < 10−10), including proteins in nitrate sensing and assimilation metabolic pathways. Other down-regulated transcripts encoded proteins with different molecular functions involved in various metabolic processes. Together, these observations indicate that the selection for low cellular respiration levels resulted in plants with transcriptional activation of pathways involved in chloroplast metabolism and in altered transcriptional regulation of transport processes of various substrates and metabolites.

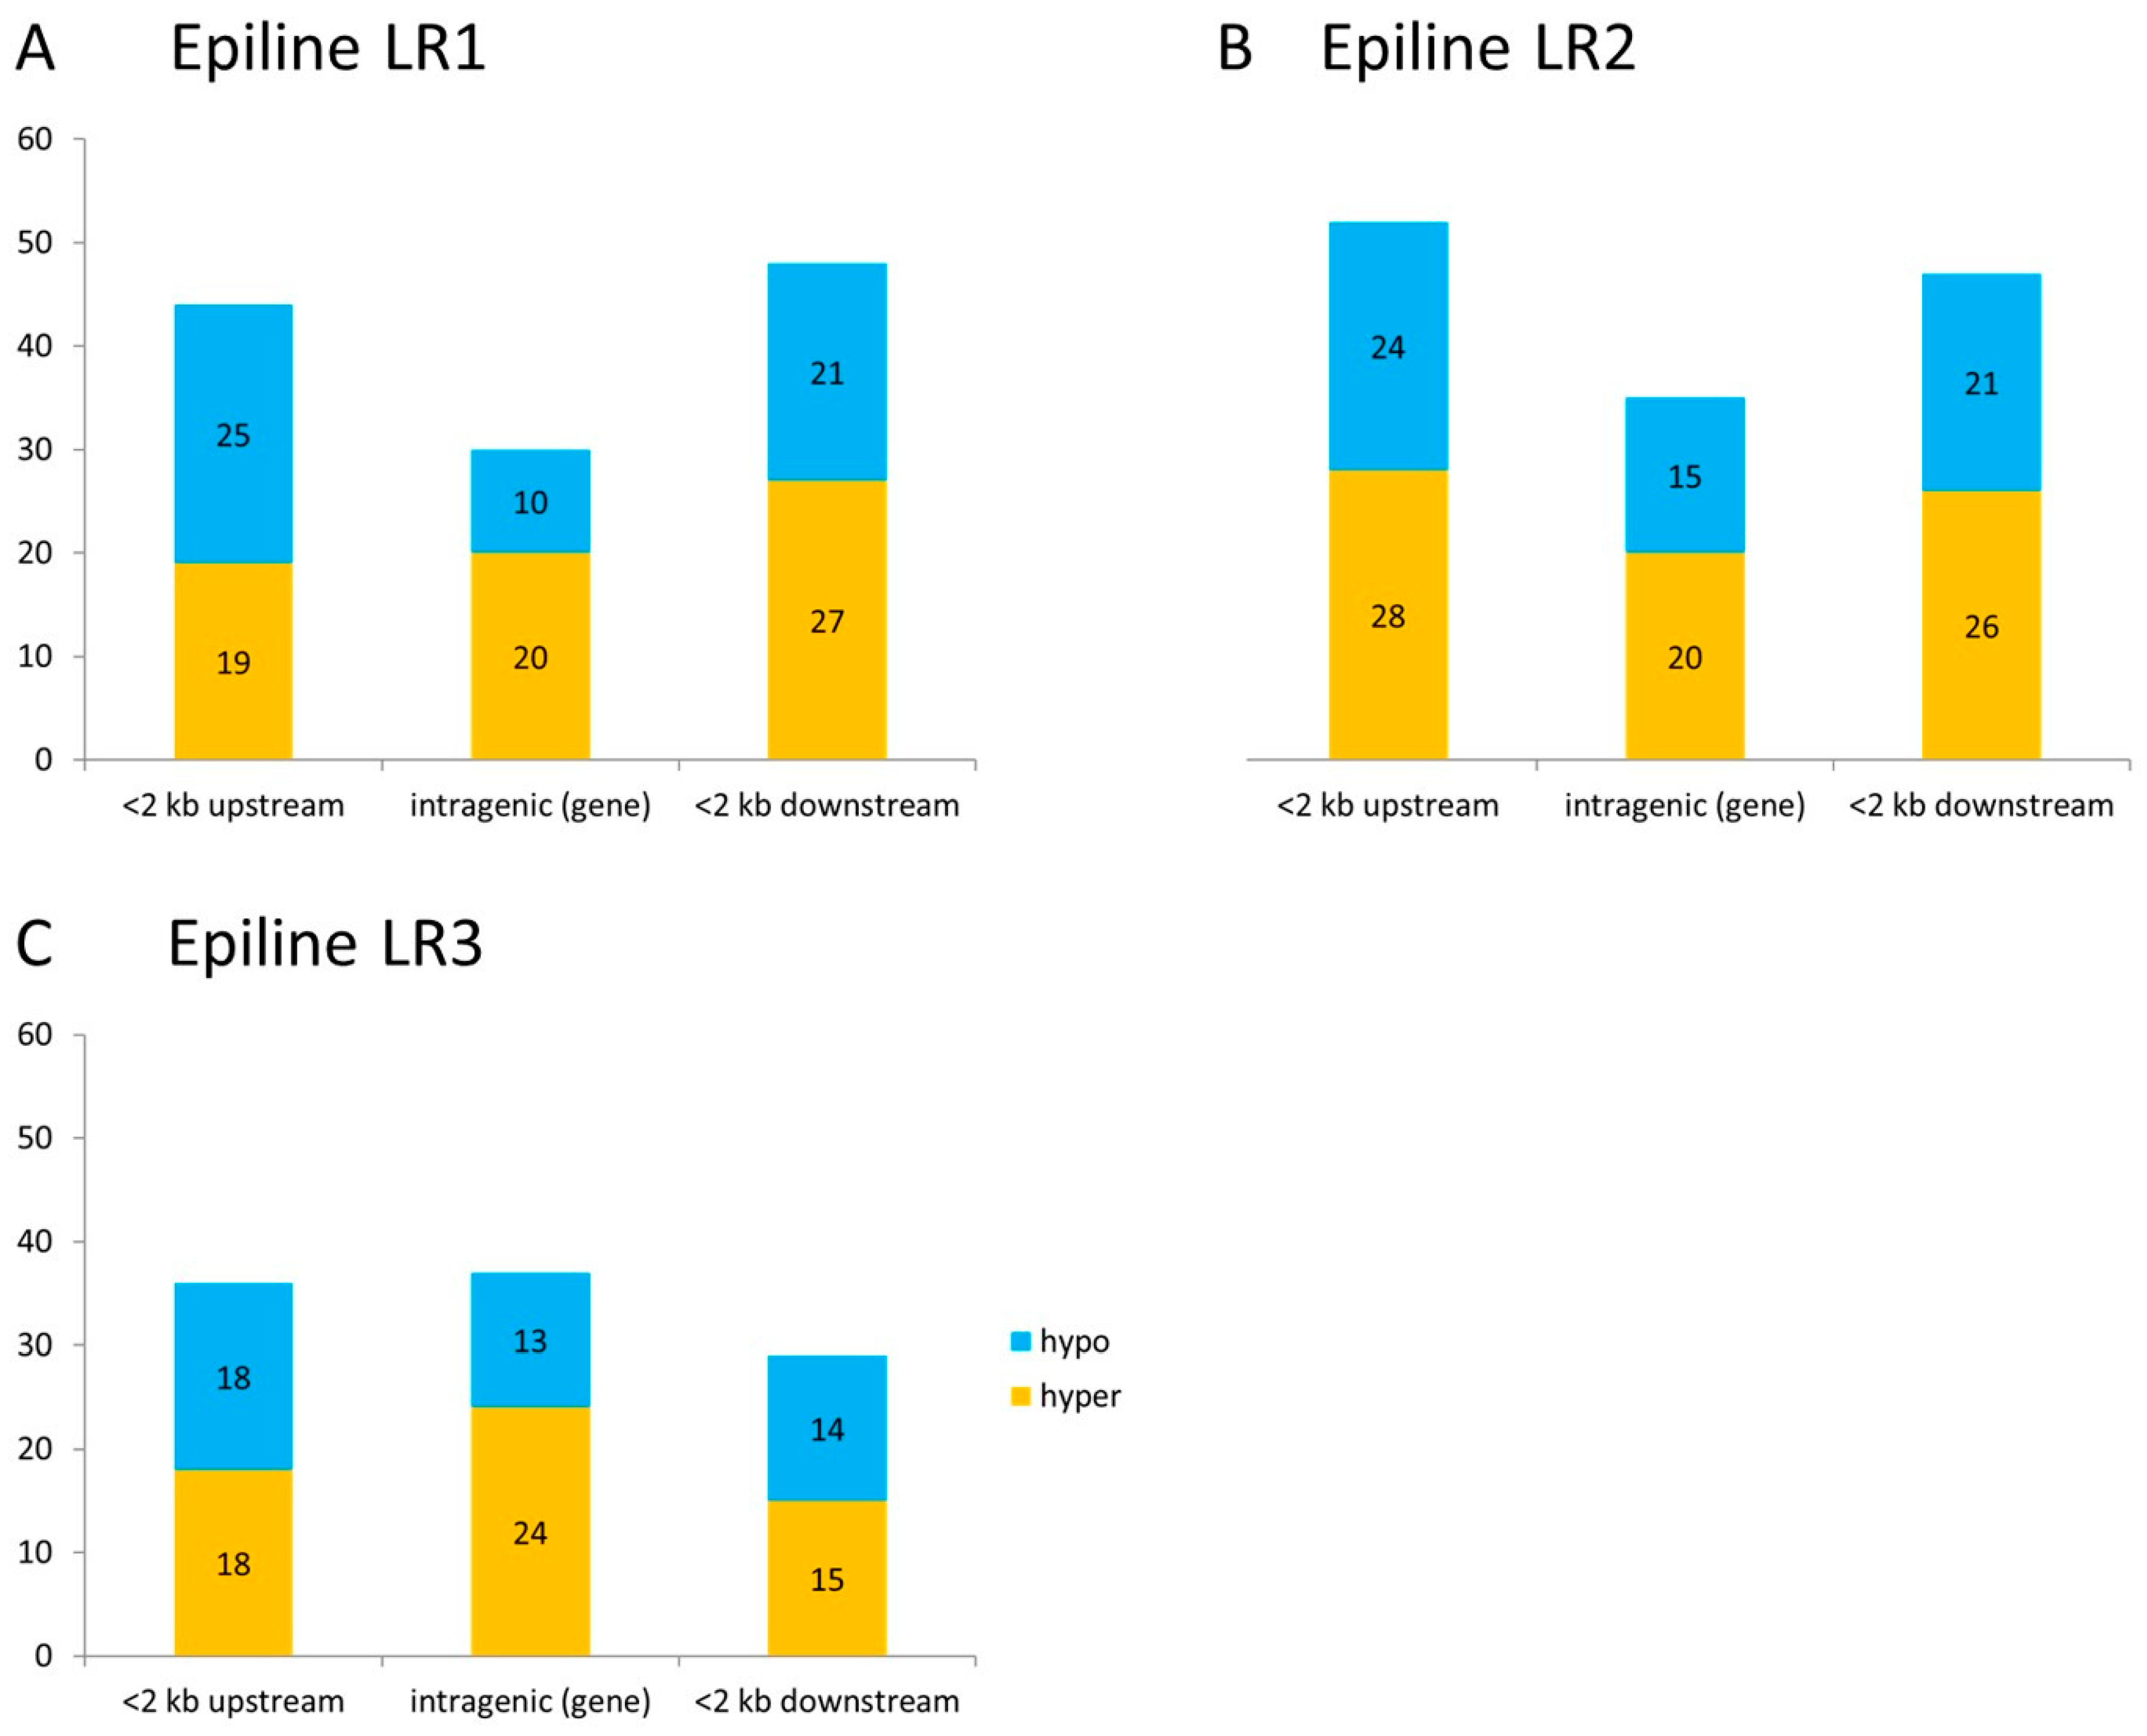
3.3. Differentially Methylated Regions in Rice Epilines

Genome-wide cytosine methylation in the rice epilines and the control line was analyzed by bisulfite conversion and next-generation sequencing, read quality filtering (Table S7), mapping (Table S8), methylation calling, statistical testing, and DMR detection. We ensured high quality data by method-specific quality controls and filtering. For all details, see Material and Methods section. For example, a mapping threshold was applied, not a theoretical genome coverage averaged overall the genome. Our mapping threshold ensured 10-fold and higher coverage at any analyzed cytosine positions.
Mean methylation levels at CG, CHG, and CHH sites were averaged genome-wide [39], and they showed similar global methylation in the epilines and control line, i.e., high at CG sites (42.2% to 45.8%), moderate at CHG sites (16.2% to 17.3%), and low at CHH sites (2.9% to 3.2%) (Table 2).
CG sites showed the lowest frequency, but because of their highest mean methylation level, they represented the major proportion of methylated cytosines, contributing the most to the overall methylation, and they are expected to be broadly associated with promoter sequences and transcriptional regulation [6,11]. CHG sites showed a moderate abundance and a low contribution to the overall cytosine methylation. The minor fraction of methylated CHH sites was contributed the least to the overall cytosine methylation (Table 2), taking into account the high abundance of CHH sites.
We determined cytosine methylation changes in 100 bp regions by sliding 20 bp steps over both strands of the reference genome, considering consistently the measured cytosine positions in the epilines. After passing multiple hypothesis testing using depth-weighted methylation level difference thresholds [39] and joining of neighboring regions, the resulting region was described as a differentially methylated region (DMR). Relaxed DMR selection was done at a threshold of more than 25% methylation level change [38,43,44], and this yielded thousands of joined DMRs (by close proximity of one 20 bp step, co-located DMRs, see Material and Methods section) per cytosine site in each epiline methylome, representing epialleles (Table 3). Stringent DMR selection was done at a threshold of 80% methylation level change, and it resulted in a limited number of highly DMRs (hDMRs) that contained almost exclusively CG sites (CG-hDMRs), which emphasizes the importance of the CG context in extensively changed methylated regions, whereas only a few hDMRs contained CHG sites, and rare hDMRs contained CHH sites.
Susceptible regions for cytosine methylation changes were identified based on the chromosomal positions of the hDMRs in the epilines (Figure S5). The hDMRs were visualized in unified-length chromosome bars to show their distribution pattern in the epilines. The LR1 and LR2 epilines showed relatively high similarities in their hDMR distribution compared with the divergent hDMR distribution in LR3; it correlated with the epiline pedigree, suggesting a link between the cytosine methylation and the EUE phenotype, and indicating that cytosine methylation was a regionally altered, genome-wide dispersed epigenetic component in the rice epilines. Approximately half of the hDMRs were located in intergenic regions lacking annotation (compare Table 3 and Figure 2). Because transposons are not distinguished in DNA transposons and retrotransposons, nor in superfamilies, and they are underrepresented in copy number within the available genomic feature annotation for the used Oryza sativa ssp. indica reference genome [30], transposons were not analyzed to avoid biased conclusions. hDMRs were filtered for those being located either less than 2.0 kb upstream of genes, within genes (intragenic), or a maximum of 2.0 kb downstream of genes (Figure 2), which allowed for the identification of gene-associated target regions for major cytosine methylation changes. An enrichment of hDMRs up- and downstream of genes was detected, as compared with their intragenic regions in the high-yield LR1 and LR2 epilines. The subset of upstream DMRs might correlate with differential gene transcription and contribute to the enhanced EUE. Therefore, methylome and transcriptome data were integrated.

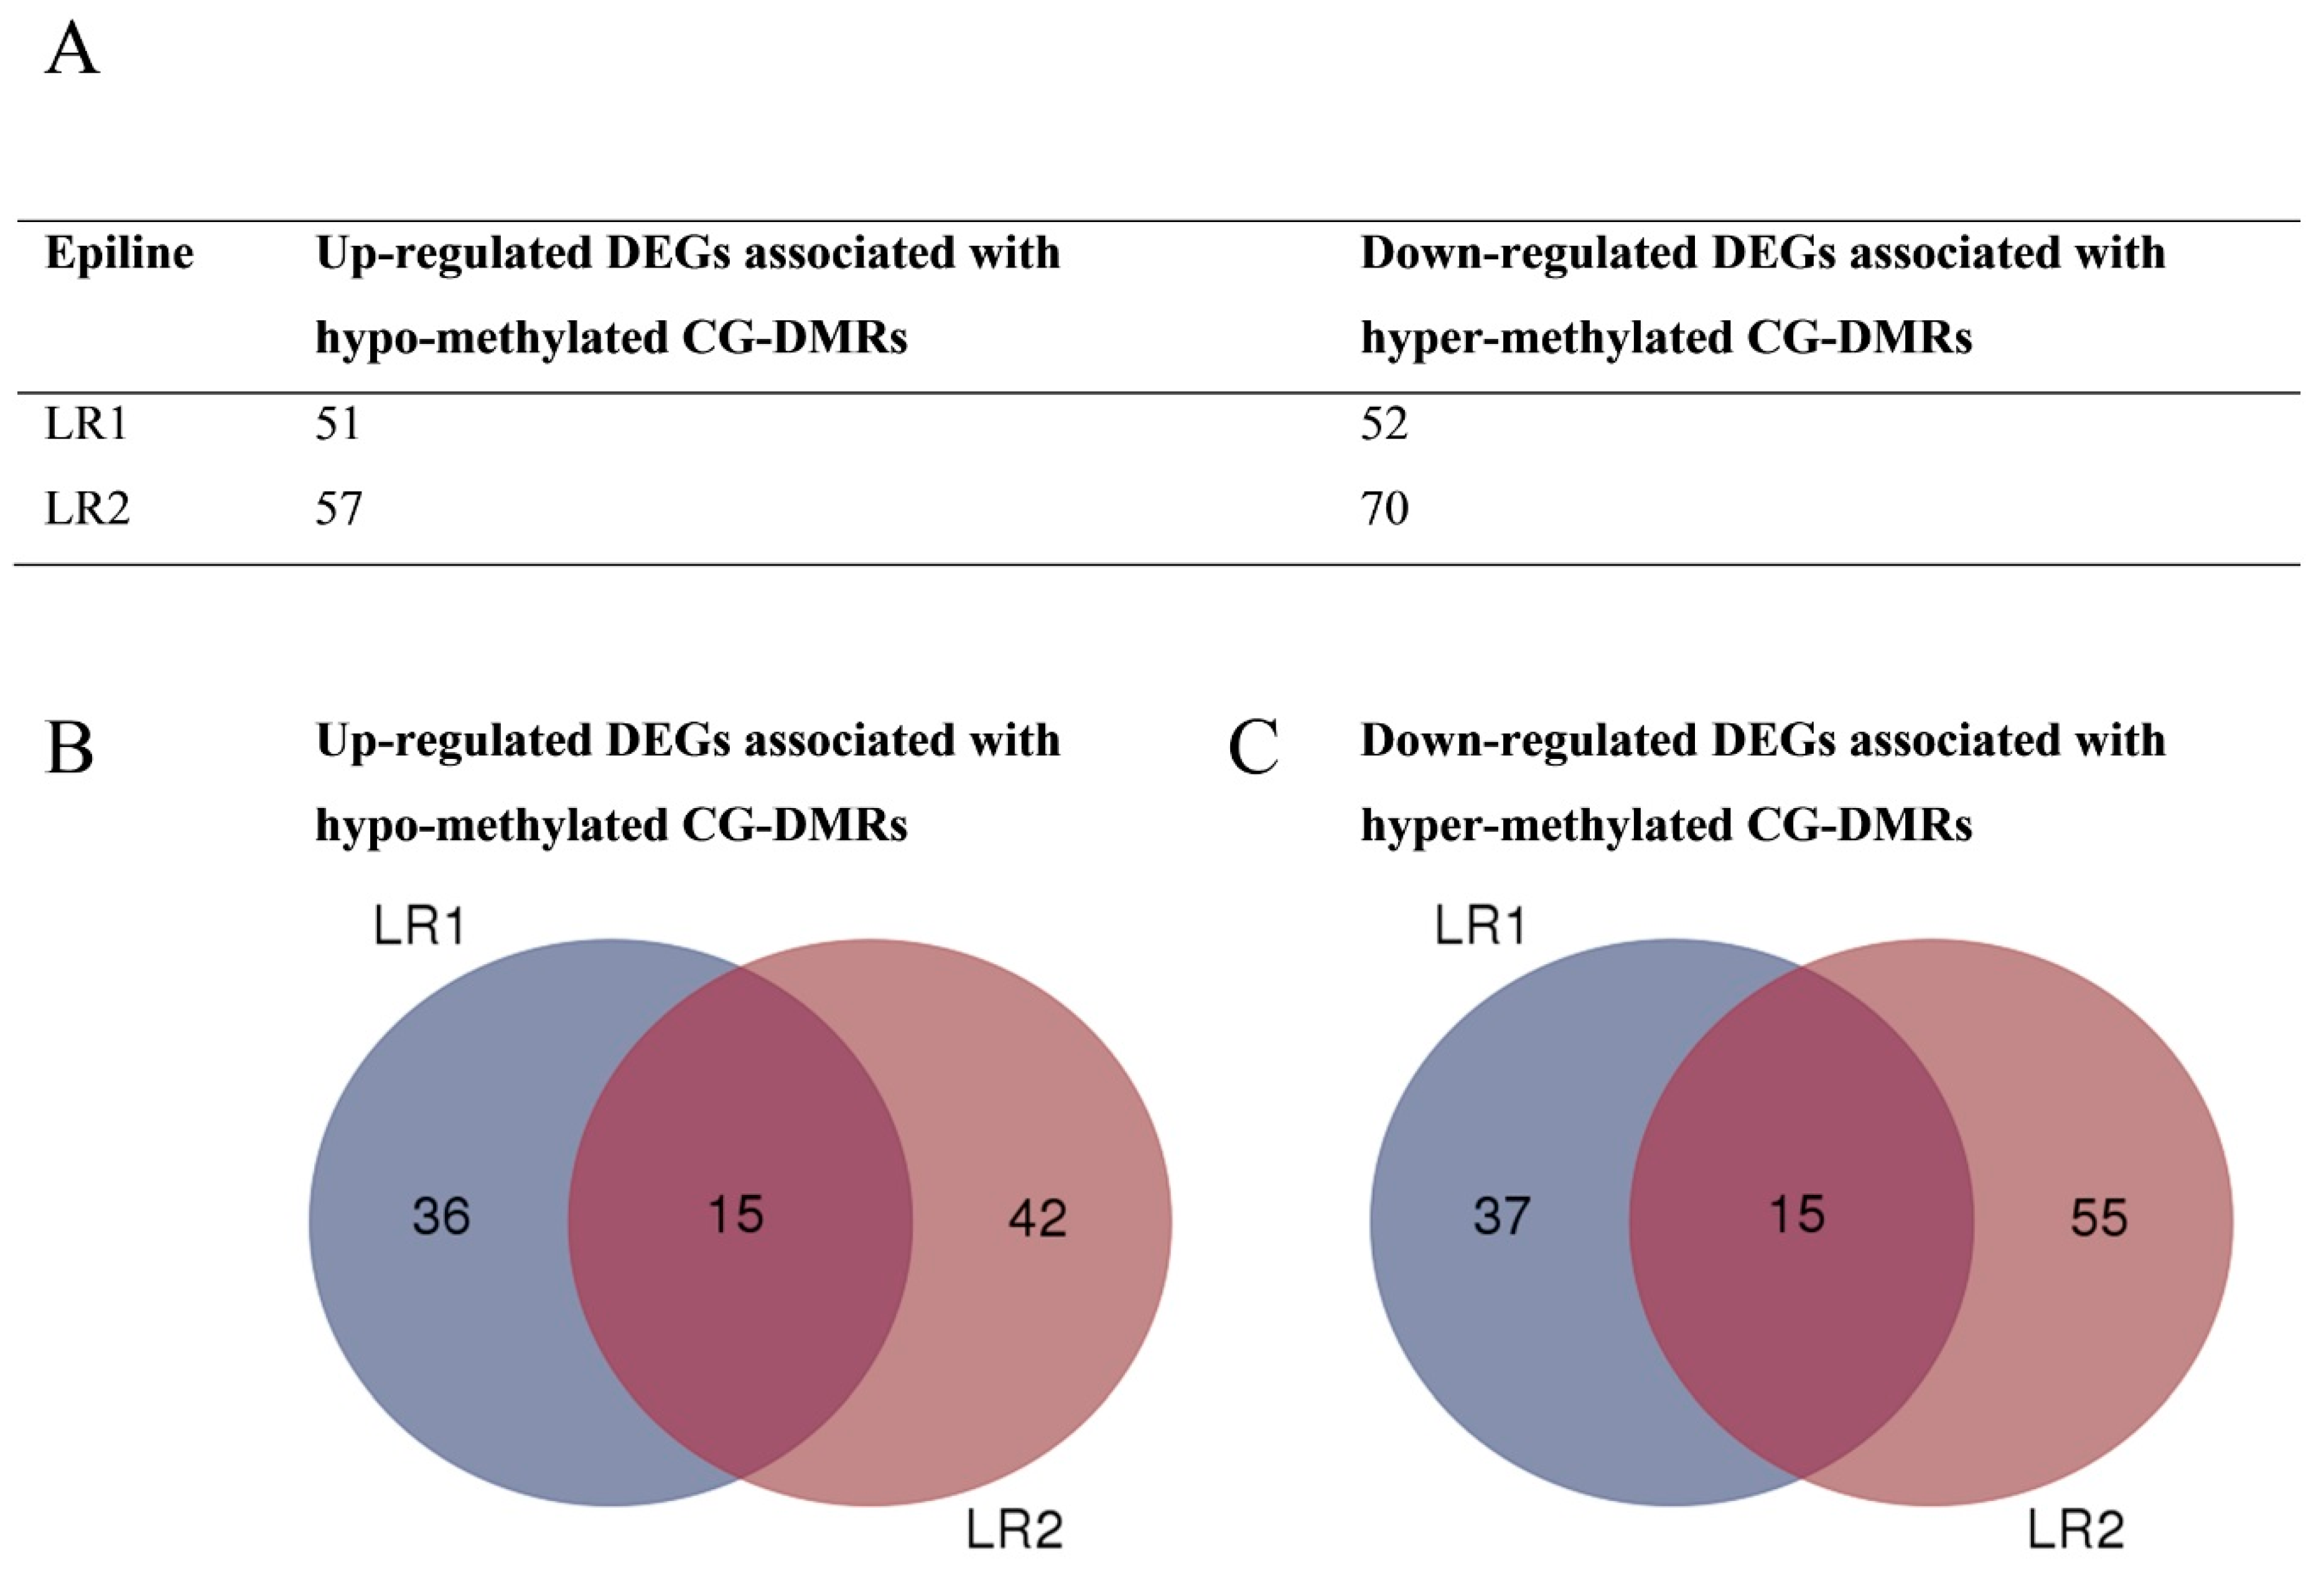
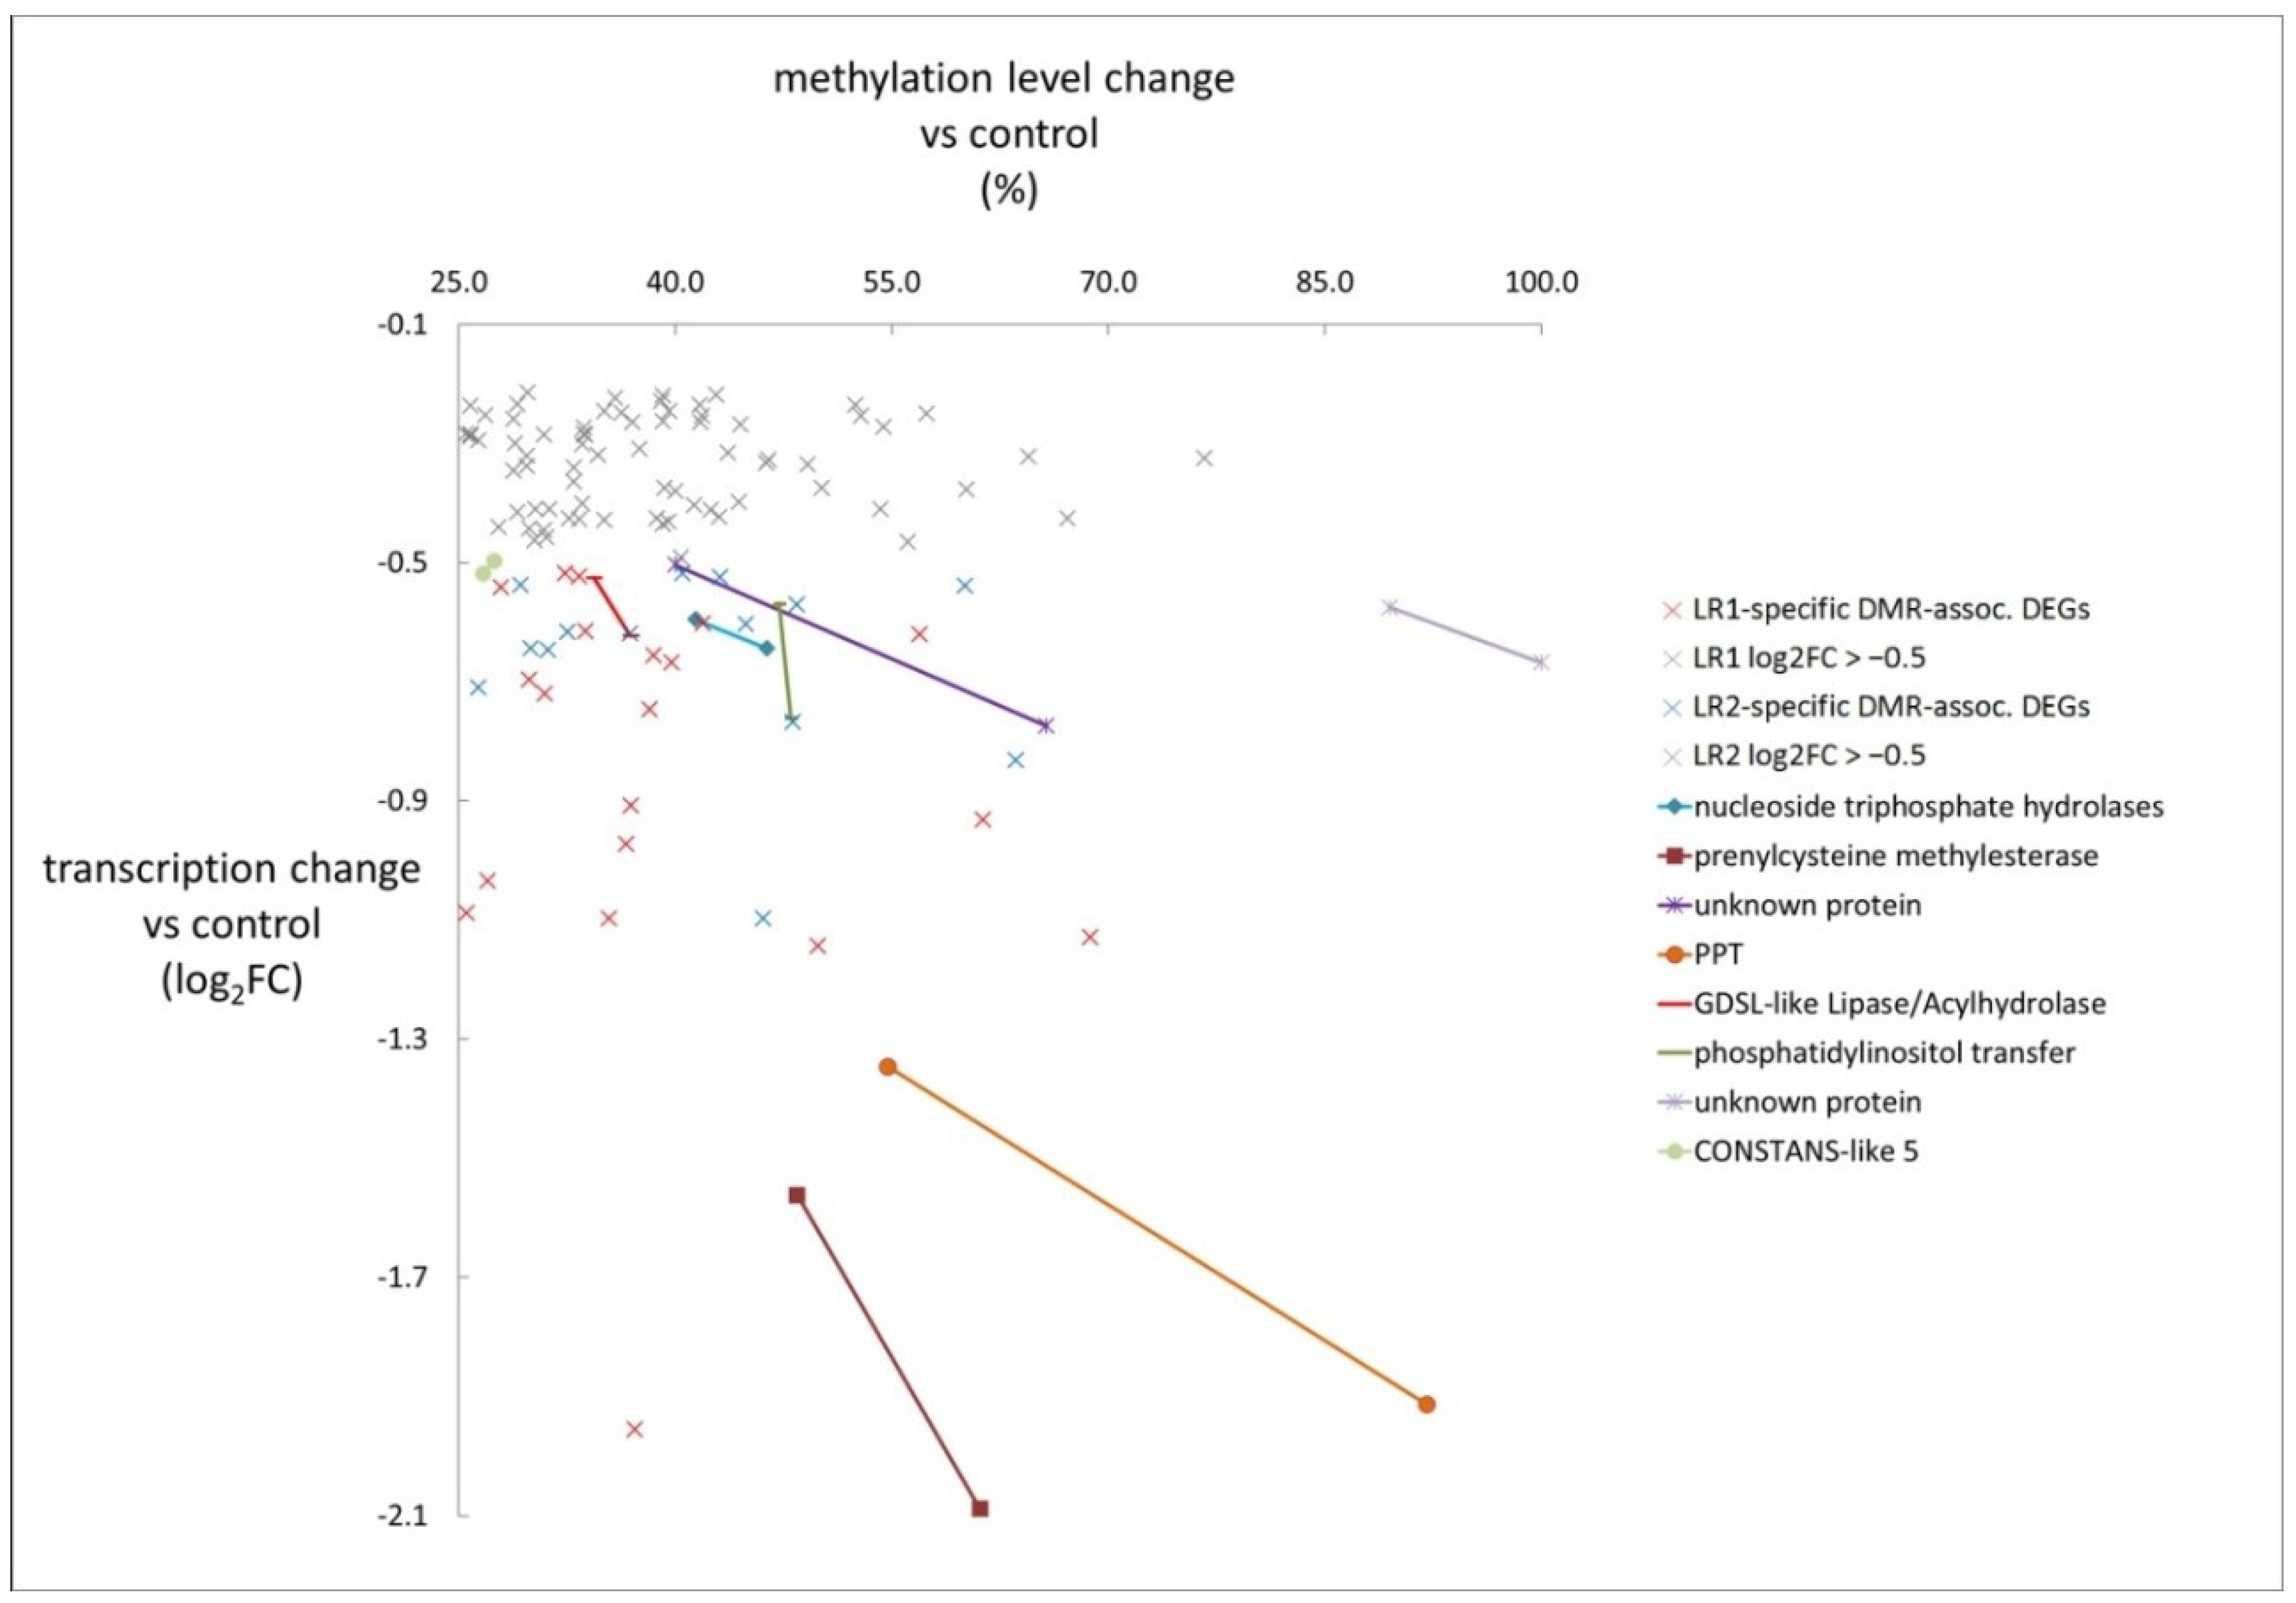
3.4. DMRs Upstream of DEGs Identify Putative Epialleles

Repression or induction of gene transcription, respectively, correlates with increased or reduced cytosine methylation in gene promoters [6,10,11], upstream of the transcription start site, which was the basis for the integration of the rice epiline methylome and transcriptome datasets. Such a relation was also shown in a rice genome-wide analysis [6,11] and at a specific rice gene [45]. We followed this strategy to identify putative epialleles in the rice epilines. DMRs were identified in regions less than 2.0 kb upstream of the transcription start site of DEGs (regulatory element-rich region, supposed to contain the entire or part of the promoter) because promoter annotation is not available in the genomic feature annotation for the Oryza sativa ssp. indica reference genome ([30], PLAZA 9311_BGF_2005); then, statistically significantly hyper-methylated CG-DMRs (q < 0.01) were related to statistically significantly transcriptionally down-regulated DEGs (q < 0.05) and hypo-methylated DMRs were linked to up-regulated DEGs. More than 100 DMR-associated DEGs were identified in each of the high-yield LR1 and LR2 epilines (Figure 3, Table S9), of which 30 were common DMR-associated DEGs, and even more were specific for each epiline, representing putative methylation-sensitive epialleles.
Particular GO molecular functions like ‘transmembrane transport’ and ‘protein kinase activity’ of DMR-associated DEGs in LR1 and LR2 suggested that methylome changes might contribute to the enhanced EUE, as the ratio of detected stable NAD(P)H content by reduced respiration. The methylation level change was plotted versus that of transcription (Figure 4; Figure S6); DMR-associated DEGs are shown as data points for LR1 and LR2 that are connected with lines to emphasize putative epialleles with anti-correlation and gradual methylation changes in relation to transcriptional changes. In LR1 and LR2, putative epialleles with a hyper-methylated region and down-regulated transcription coded for the P-loop containing nucleoside triphosphate hydrolase superfamily protein, prenylcysteine methylesterase, two unknown coding sequences, phosphoenolpyruvate (PEP)/phosphate translocator (PPT), GDSL-like lipase/acylhydrolase superfamily protein, and phosphatidylinositol transfer family protein. The putative epiallele annotated as a PPT showed a gradual upstream hyper-methylation and down-regulation of gene transcription in both LR1 and LR2 epilines, in comparison with the control line (Figure 4), i.e., a 2.5- and 3.8-fold transcriptional down-regulation, and a 55% and 92% upstream cytosine methylation level increase, respectively (Table 4). Putative epialleles with a hypo-methylated region and up-regulated transcription encoded ABA-activated protein kinase, brassinosteriod-responsive RING-H2, and sugar transporter 1 (Table 4, Table S9, Figure S6).
Three significant CG-DMRs (>25% methylation difference, q < 0.01) upstream of associated DEGs were further analyzed by targeted bisulfite sequencing using bisulfite conversion and PCR amplification of upstream regions, followed by next-generation sequencing with extensive read depth (Supplementary Tables S9 and S10 and Figure S7). Indeed, the hyper-methylation of CG-DMRs were 48% and 61% upstream of the prenylcysteine methylesterase DEG in LR1 and LR2, respectively, which correlated with a 2.9- and 4.3-fold transcriptional down-regulation, respectively (Table S9); this was confirmed at all 22 commonly measured cytosine positions (control r = 0.79, LR1 r = 0.98, LR2 r = 0.99, Table S10). Two different PPRs showed epiline-specific hypo-methylated CG-DMRs of 32% in LR1 and 51% in LR2, which correlated with 2.0-fold and 2.5-fold transcriptional up-regulation, respectively (Table S9). In LR1, the reduced methylation levels of 16 cytosine positions within the CG-DMR in the promoter of one PPR were confirmed (control r = 0.98, LR1 r = 0.99) (Table S10). In addition, we confirmed 16 non-methylated cytosine positions within a CG-DMR of another PPR in LR2 (Tables S9 and S10).

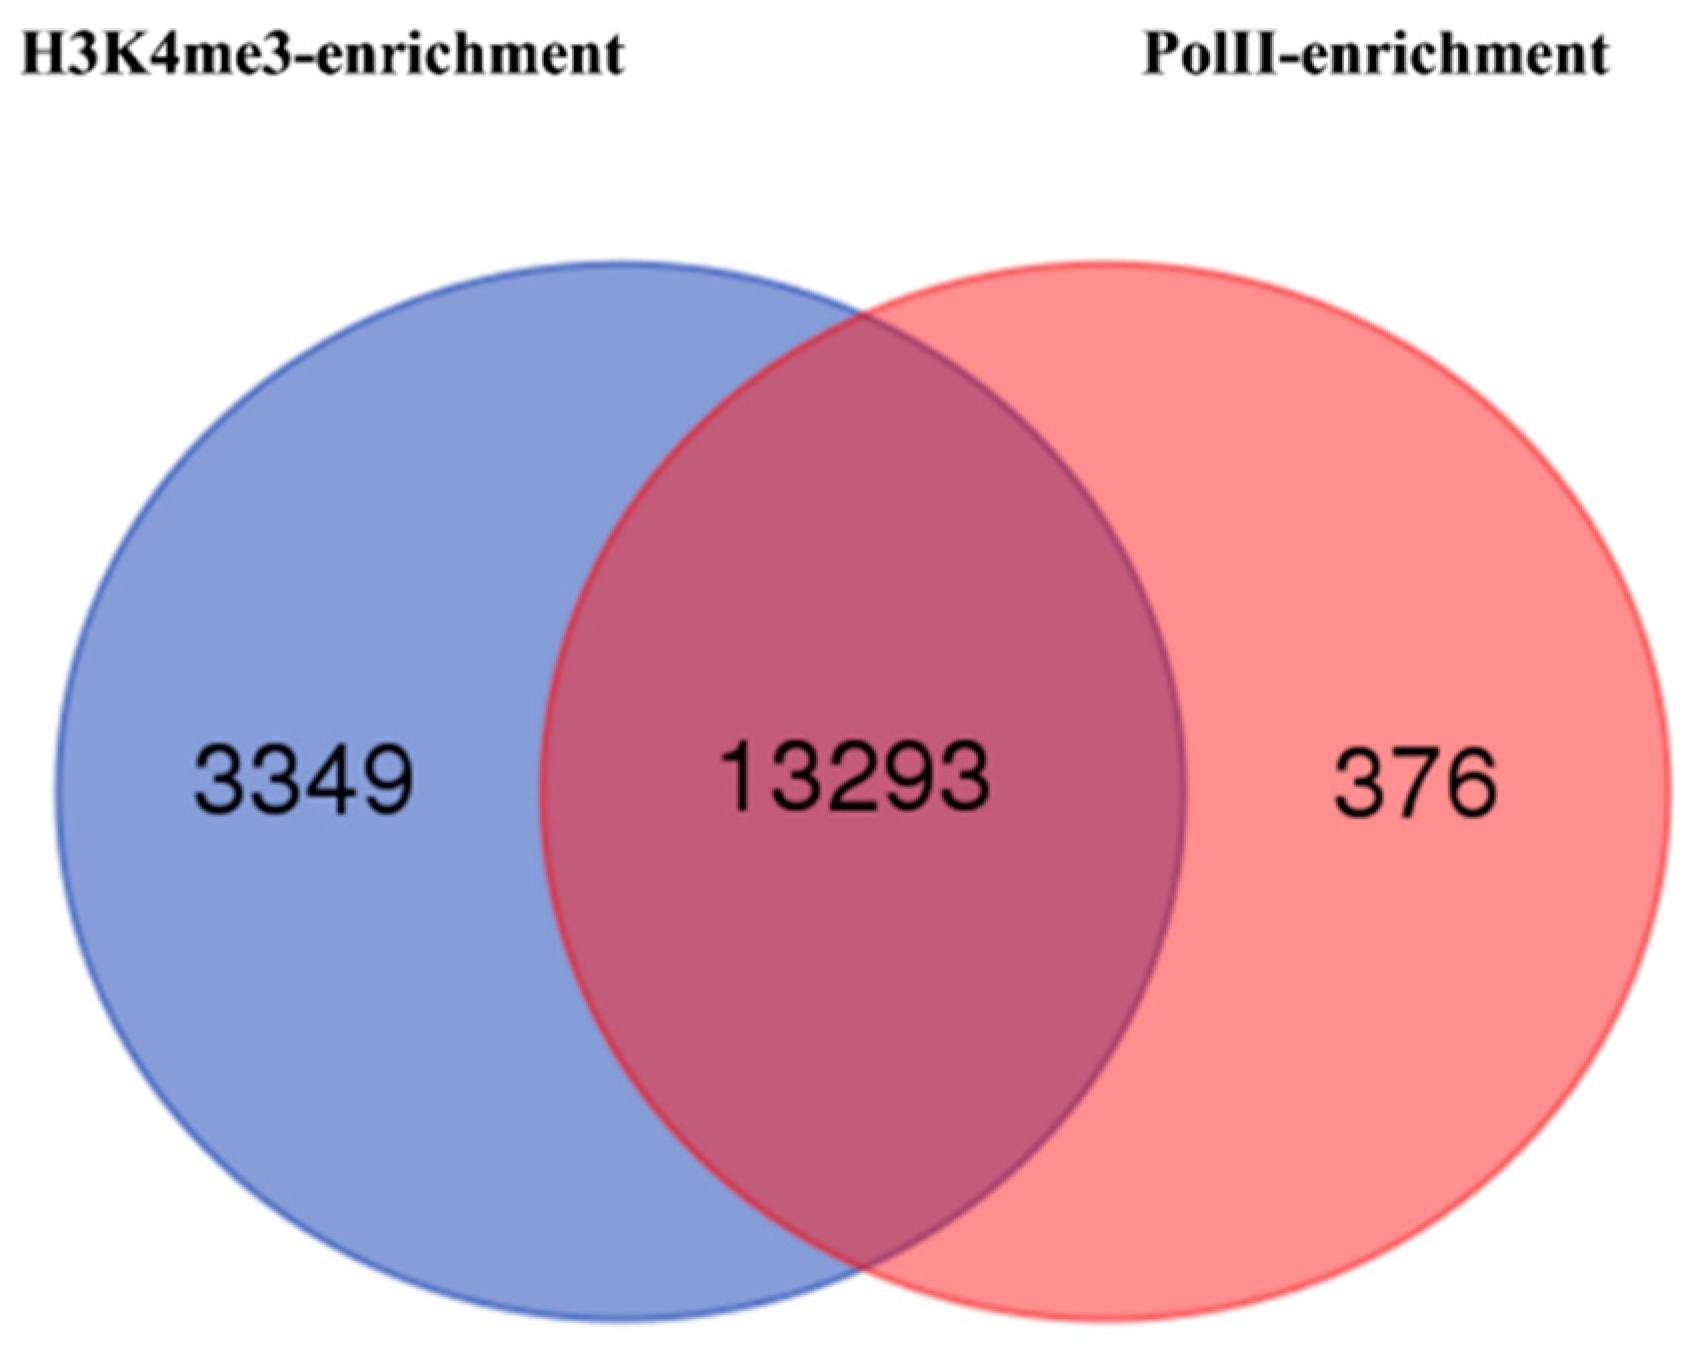
3.5. Histone H3 Lysine-4 Trimethylation and RNA Polymerase II (PolII) Enrichments in Epiline LR2 Identify Activated Genes

H3K4me3 is associated with highly expressed genes and it is an indicator for the actively transcribed gene-containing fraction of the euchromatin [18,46]. Dynamic changes in the occurrence of H3K4me3 are associated with the transcriptional regulation of certain stress-responsive genes under drought stress conditions [19,20], and in epilines in canola selected for drought stress tolerance [5]. Differential histone mark H3K4me3 distribution in the rice epiline LR2 was analyzed by chromatin immunoprecipitation sequencing (ChIP-seq) using an H3K4me3 antibody, and compared with differential PolII occupancy using an antibody against the largest subunit of PolII. qRT-PCR validations were carried out to verify positive and negative reference regions in the genome (for more details, see the Materials and Methods section). H3K4me3 in rice epiline LR2 was enriched (log2FC > 0.6) compared with the control line at 26,800 regions in the genome that ranged from several hundreds to ten thousands of nucleotides (Table 5, Table S11), of which 16,642 regions were located within genes, based on the genome feature annotation. Thus, most of the H3K4me3 enrichment in the genome (62.1%) was occurring at genic regions in epiline LR2 compared with the control, which is in line with a role for H3K4me3 in promoting transcript elongation [46].
Then, PolII occupancy was measured within the same experiment in order to analyze the transcript elongation process. In the rice epiline LR2, PolII was enriched (log2FC > 0.6) compared with the control line at 21,065 genome regions (Table S11), of which 13,669 regions were within genes. Thus, most of the PolII enrichment in the genome (64.9%) was occurring at genic regions in epiline LR2 compared with the control line. The integration of differential H3K4me3 with PolII occupancy resulted in the detection of a tremendous overlap of both signals at 13,293 genes, representing 79.9% of the H3K4me3-enriched genes, and 97.2% of the PolII-enriched genes (Figure 5). Hence, H3K4me3 enrichment occurred at many genic regions, together with PolII enrichment that might identify activated genes in epiline LR2.
Overlap in transcriptionally active genes in LR2 was identified when comparing the RNA-seq dataset and the H3K4me3 and PolII enrichments, and this resulted in 1143 activated genes. GO categories were enriched (p < 0.05, Table S12) for the biological process ‘amino acid transport’ (log2FC = 2.18) and associated GOs ‘phosphoenolpyruvate transport’ (log2FC = 4.03), and ‘photosynthetic electron transport chain’ (log2FC = 2.22), and for molecular functions related to ‘amino acid transmembrane transporter activity’ (log2FC ≥ 2.70) and ‘phosphoenolpyruvate:phosphate antiporter activity’ (log2FC = 4.44). Within the 1143 activated genes found in the overlap between RNA-seq and ChIP-seq datasets, there were 28 hypo-methylated for DMR-associated and RNA-seq up-regulated genes out of the 57 identified (Figure 3A). Interestingly, among those 28 genes, a pentatricopeptide repeat and a sugar transporter 1 gene shared transcriptional up-regulation, upstream hypo-methylation, and enrichments in H3K4me3 and PolII occupancy in epiline LR2. The other transcriptionally activated epialleles had either H3K4me3 and PolII enrichment or differential cytosine methylation, indicating distinct chromatin and epigenetic mechanisms at work in the rice epilines.

4. Discussion

Here, we demonstrate that the selection for improved cellular respiration levels and EUE over three consecutive generations of a pure breeder seed lot of a rice (Oryza sativa ssp. indica) inbred population resulted in the identification of the LR1 and LR2 epilines that had lower leaf respiration rates in the S4 and S5 consecutive generations, grown non-selectively in greenhouse conditions and better seed yields in the field in the S6 generation. Epiline transcriptomes showed enrichment of metabolic processes (especially organelle-related) in the up-regulated genes and of transport processes in the down-regulated genes. Intriguingly, activated genes encode subunits of the chloroplast NAD(P)H dehydrogenase (NDH) complex with a function in the chloroplast PSI NDH-dependent cyclic electron transport, and PPR proteins that are critical in the mitochondrial and chloroplast biogenesis, and in the establishment and maintenance of organelle metabolic activities through their role in transcript editing and processing [47,48]. The NDH-dependent cyclic electron transport generates a proton gradient across thylakoid membranes, and it drives adenosine triphosphate (ATP) synthase without concomitant generation of NADPH [49], thus protecting photosystems from damage and contributing to the cellular energy pool [50,51,52,53,54,55,56]. Recently, a number of PPR proteins have been identified that are directly involved in post-transcriptional processing of the plastid-encoded subunits of the chloroplast NDH complex [57,58,59,60,61]. NDH activity is high in the flag leaf and panicles at the flowering to grain-filling stage [62]. Altogether, the data suggest that the EUE selection preceding the rice epiline identification was in favor of lines with activated genes and pathways that are critical in organelle metabolic activity.
The methylome in the EUE-selected rice epilines showed specific patterns of genome-wide dispersed regional cytosine methylation changes. Predominantly CG-DMRs were detected in upstream regions of genes that were either common to LR1 and LR2, or specific to one of them. Epiline-common subsets of DMR-associated DEGs that exhibited gradual cytosine methylation and transcriptional changes might be used to identify regions susceptible for differential methylation in the genome, so-called epialleles. Among the putative epialleles listed in Table S9, the sugar transporter 1, PPT, and prenylcysteine methylesterase were highly differentially expressed and cytosine-methylated and might be promising for further study. PPT encodes a chloroplast-located inner envelope protein that catalyzes the transport of phosphoenolpyruvate and phosphate across the inner envelope membrane. PPT is glucose-6-phosphate/phosphate translocator-related and it is a supplier for the shikimate pathway. The potential epiallelic status of a particular PPT that is involved in the essential uptake of phosphoenolpyruvate is embedded in the transcriptional down-regulation of genes involved in phosphoenolpyruvate-connected pathways in LR1 and LR2. Interesting putative epialleles of PPR genes were identified; indeed, epiline-specific changes in transcription (activation) and cytosine methylation (hypo-methylation) were identified for different PPRs in LR1 and LR2. Thus, in epilines selected for improved EUE, a fraction of the DEGs is correlated with cytosine methylation changes in upstream regions that might identify genes that are susceptible to epigenetic modification.
Cytosine methylation can be initiated by upstream pathways like sequence-homologous small RNAs, long non-coding RNAs and histone modifications ([63,64,65], summarized in [66]), as identified in A. thaliana. The subsequent maintenance of methylation in CG sites is efficiently catalyzed by MET1 at genic regions that are independent from small RNAs or histone marks in A. thaliana. Similar processes could drive epigenetic inheritance at the chromatin by homologous proteins and non-coding RNAs in the rice epilines. Stability of cytosine methylation over epiline selfing generations might exist at specific loci with previously established methylation, such as in A. thaliana sperm cells of the pollen, in the absence of reprogramming [14,67]. Methylation in CG context was evidenced as a central coordinator of epigenetic memory that secures stable transgenerational inheritance in plants [68]. The efficiency of active MET1 to methylate hemi-methylated symmetric CG sites might contribute to that process during gametogenesis and embryogenesis, so that patterns of DNA methylation can persist (summarized in [69]).
ChIP data integration of gene-associated H3K4me3 and PolII enrichments evidenced that an extensive overlap of both characteristics exists in epiline LR2. The GO enrichment of activated genes with H3K4me3 and PolII enrichments and of the transcriptional up-regulation in the RNA-seq data showed that a subset of the H3K4me3-enriched active regions might be responsible for the transcriptional activation of specific genes that might contribute to the enhanced EUE and seed yield observed in LR2. Indeed, specific histone modifications, such as H3K4me3, at gene-encoding regions stimulate the CTD-phosphorylated PolII transcript elongation rate, gene expression and mRNA processing [46,70], which represents a different mechanism for gene activation as compared with reduced cytosine methylation at promoter regions that typically activates PolII transcript initiation.
The selection procedure for EUE resulted in epilines with altered transcriptomes that correlated with epigenome and chromatin changes at distinct genes. We hypothesize that microclimate conditions at seed set might lead to the induction of a broad spectrum of epigenetic and chromatin changes within an inbred seed population. The higher seed yield measured in S6 in the field was gradually lost in the next generations, which suggests that some of the epigenetic modifications might contribute to the seed yield phenotype. Thus, the epialleles are likely not stable throughout a high number of generations, which is in accordance with reports on other epilines [71].
This study enabled us to obtain rice epilines with increased seed yield that showed distinct epigenetic variation and fine-tuned gene transcription alteration, related to changes in basic energy metabolism and transmembrane transport. Epiline selection in rice and canola supports the hypothesis that epigenetic changes are induced at a rather high frequency during seed formation. Indeed, the selection procedure only starts from 180 individuals in order to obtain a few stable epilines, which is a frequency which is far above the spontaneous genetic mutation rate. Seed development in greenhouse or field conditions is prone to microclimate and biotic stresses, which might induce the epigenetic changes within a specific window of early embryogenesis or at fertilization. Indeed, temperature has an impact on epigenetic changes during development in Drosophila melanogaster [72,73]. Also, progeny of starved Caenorhabditis elegans in early embryogenesis were more resistant to starvation and heat, suggesting induced epigenetic inheritance of acquired resistance to stress [74]. Thus, we postulate that each seed harvest contains epigenetic changes at a percentage frequency, which represents a putative wealth of epialleles at any genomic locus that are susceptible to epigenetic changes, which can be identified by a selection procedure for a particular parameter in any plant species. The insight into the contribution of dynamic epialleles to a specific trait in epilines can be used to contribute to the basic knowledge of the biology of traits and in breeding programs to select or generate corresponding genetically stable alleles. The EUE selection in canola [5] and rice (this work) identified different metabolic pathways that might underlie the EUE and seed yield phenotypes. In short, using inbred seed lots combined with selection for improved EUE is a valid approach that can be used in different crops to obtain plants with improved agronomic parameters. Epigenetic components of complex traits might help to unravel their underlying networks and to identify novel molecular markers for breeding.

Supplementary Materials

The following are available online at https://www.mdpi.com/2073-4395/8/9/163/s1, Figure S1: Rice epiline selection scheme for EUE and pedigree generated by consecutive selfings, Figure S2: Field grain yield of LR1, LR2, and LR3 epilines, and the control line in the selfing generation S6, Figure S3: Up- and down-regulated genes in LR1, LR2 and LR3 epiline transcriptomes, Figure S4: Quantitative real-time PCR validation of up- and down-regulated differentially expressed genes from the RNA-seq dataset, Figure S5: Genome-wide regions with highly differential methylation (hDMRs) in LR1, LR2 and LR3 rice epilines compared with the control line, Figure S6: Expression and cytosine methylation changes of up-regulated DEGs associated with upstream hypo-methylated DMRs in epilines, Figure S7: Verification of differential methylated regions (DMR) methylation upstream of a differential expressed gene (DEG) that are commonly measured by whole-genome bisulfite sequencing (WGBS) and targeted bisulfite sequencing (targeted BS), Table S1: Primers used for targeted BS, Table S2: Cellular respiration (%) in the rice epilines upon selection in three consecutive selfings (S1, S2 and S3) and non-selectively in S4 and S5, Table S3: RNA-seq clean read mapping, Table S4: Differentially expressed genes, Table S5: List of primer sequences used for qRT-PCR analysis, Table S6: Functional categorization of LR1 and LR2 commonly up-regulated DEGs (PLAZA 2.5; p < 0.05), Table S7: Quality control of the raw BS-seq read, Table S8: Mapping the BS-seq reads (Bismark), Table S9: DMRs upstream of DEGs, Table S10: Validation of cytosine methylation levels for a set of DMR-associated DEGs, Table S11: H3K4me3- and PolII-enriched and depleted regions in LR2 compared with those in the control line, Table S12: GO term enrichment analyses of transcriptional up-regulated genes, associated with H3K4me3- and PolII-enrichments in LR2 compared with the control line.

Author Contributions

Conceptualization, M.S., M.B., M.D.B. and M.V.L.; Writing—Original Draft Preparation, M.S.; Writing—Review & Editing, M.D.B. and M.V.L.; Methodology, M.S., M.B., C.M., M.P., Y.R., S.S. and T.V.; Formal Analysis, M.S., M.B., M.D.B. and M.V.L.; Supervision, M.V.L.; Funding Acquisition: M.V.L.

Funding

This research was funded by the European Union Seventh Framework Program and the European Commission Marie Curie Research Training Network ‘Chromatin in Plants–European Training and Mobility’ to M.V.L., M.D.B. and fellow M.S. (CHIP-ET, FP7-PEOPLE-2013-ITN607880) and the Agency for Innovation by Science and Technology within the ‘IsisCode’ project to M.D.B and M.V.L. with funding to M.B. and T.V. (IWT 120100).

Acknowledgments

We are grateful for the work of Indravir Singh, Bayer CropScience, SHANKARPALLI, Chandippa, India. We thank Annick Bleys for the help in preparing the manuscript.

Conflicts of Interest

The authors declare no competing financial interests.

References

  1. Gallusci, P.; Dai, Z.W.; Génard, M.; Gauffretau, A.; Leblanc-Fournier, N.; Richard-Molard, C.; Vile, D.; Brunel-Muguet, S. Epigenetics for plant improvement: Current knowledge and modeling avenues. Trends Plant Sci. 2017, 22, 610–623. [Google Scholar] [CrossRef] [PubMed]
  2. Springer, N.M.; Schmitz, R.J. Exploiting induced and natural epigenetic variation for crop improvement. Nat. Rev. Genet. 2017, 18, 563–575. [Google Scholar] [CrossRef] [PubMed]
  3. De Block, M.; Van Lijsebettens, M. Energy efficiency and energy homeostasis as genetic and epigenetic components of plant performance and crop productivity. Curr. Opin. Plant Biol. 2011, 14, 275–282. [Google Scholar] [CrossRef] [PubMed]
  4. Hauben, M.; Haesendonckx, B.; Standaert, E.; Van Der Kelen, K.; Azmi, A.; Akpo, H.; Van Breusegem, F.; Guisez, Y.; Bots, M.; Lambert, B.; et al. Energy use efficiency is characterized by an epigenetic component that can be directed through artificial selection to increase yield. Proc. Natl. Acad. Sci. USA 2009, 106, 20109–20114. [Google Scholar] [CrossRef] [PubMed] [Green Version]
  5. Verkest, A.; Byzova, M.; Martens, C.; Willems, P.; Verwulgen, T.; Slabbinck, B.; Rombaut, D.; Van de Velde, J.; Vandepoele, K.; Standaert, E.; et al. Selection for improved energy use efficiency and drought tolerance in canola results in distinct transcriptome and epigenome changes. Plant Physiol. 2015, 168, 1338–1350. [Google Scholar] [CrossRef] [PubMed] [Green Version]
  6. Zemach, A.; McDaniel, I.E.; Silva, P.; Zilberman, D. Genome-wide evolutionary analysis of eukaryotic DNA methylation. Science 2010, 328, 916–919. [Google Scholar] [CrossRef] [PubMed]
  7. Cokus, S.J.; Feng, S.; Zhang, X.; Chen, Z.; Merriman, B.; Haudenschild, C.D.; Pradhan, S.; Nelson, S.F.; Pellegrini, M.; Jacobsen, S.E. Shotgun bisulphite sequencing of the Arabidopsis genome reveals DNA methylation patterning. Nature 2008, 452, 215–219. [Google Scholar] [CrossRef] [PubMed] [Green Version]
  8. Schmidt, M.; Hense, S.; Minoche, A.E.; Dohm, J.C.; Himmelbauer, H.; Schmidt, T.; Zakrzewski, F. Cytosine methylation of an ancient satellite family in the wild beet Beta procumbens. Cytogenet. Genome Res. 2014, 143, 157–167. [Google Scholar] [CrossRef] [PubMed]
  9. Zakrzewski, F.; Schubert, V.; Viehoever, P.; Minoche, A.E.; Dohm, J.C.; Himmelbauer, H.; Weisshaar, B.; Schmidt, T. The CHH motif in sugar beet satellite DNA: A modulator for cytosine methylation. Plant J. 2014, 78, 937–950. [Google Scholar] [CrossRef] [PubMed]
  10. Suzuki, M.M.; Bird, A. DNA methylation landscapes: Provocative insights from epigenomics. Nat. Rev. Genet. 2008, 9, 465–476. [Google Scholar] [CrossRef] [PubMed]
  11. Li, X.; Zhu, J.; Hu, F.; Ge, S.; Ye, M.; Xiang, H.; Zhang, G.; Zheng, X.; Zhang, H.; Zhang, S.; et al. Single-base resolution maps of cultivated and wild rice methylomes and regulatory roles of DNA methylation in plant gene expression. BMC Genom. 2012, 13, 300. [Google Scholar] [CrossRef] [PubMed]
  12. Blevins, T.; Pontvianne, F.; Cocklin, R.; Podicheti, R.; Chandrasekhara, C.; Yerneni, S.; Braun, C.; Lee, B.; Rusch, D.; Mockaitis, K.; et al. A two-step process for epigenetic inheritance in Arabidopsis. Mol. Cell 2014, 54, 30–42. [Google Scholar] [CrossRef] [PubMed]
  13. Schmitz, R.J.; Schultz, M.D.; Lewsey, M.G.; O’Malley, R.C.; Urich, M.A.; Libiger, O.; Schork, N.J.; Ecker, J.R. Transgenerational epigenetic instability is a source of novel methylation variants. Science 2011, 334, 369–373. [Google Scholar] [CrossRef] [PubMed]
  14. Calarco, J.P.; Borges, F.; Donoghue, M.T.A.; Van Ex, F.; Jullien, P.E.; Lopes, T.; Gardner, R.; Berger, F.; Feijó, J.A.; Becker, J.D.; et al. Reprogramming of DNA methylation in pollen guides epigenetic inheritance via small RNA. Cell 2012, 151, 194–205. [Google Scholar] [CrossRef] [PubMed]
  15. Silveira, A.B.; Trontin, C.; Cortijo, S.; Barau, J.; Del Bem, L.E.; Loudet, O.; Colot, V.; Vincentz, M. Extensive natural epigenetic variation at a de novo originated gene. PLoS Genet. 2013, 9, e1003437. [Google Scholar] [CrossRef] [PubMed]
  16. Cubas, P.; Vincent, C.; Coen, E. An epigenetic mutation responsible for natural variation in floral symmetry. Nature 1999, 401, 157–161. [Google Scholar] [CrossRef] [PubMed]
  17. Perrella, G.; Lopez-Vernaza, M.A.; Carr, C.; Sani, E.; Gosselé, V.; Verduyn, C.; Kellermeier, F.; Hannah, M.A.; Amtmann, A. Histone deacetylase complex1 expression level titrates plant growth and abscisic acid sensitivity in Arabidopsis. Plant Cell 2013, 25, 3491–3505. [Google Scholar] [CrossRef] [PubMed]
  18. Roudier, F.; Ahmed, I.; Bérard, C.; Sarazin, A.; Mary-Huard, T.; Cortijo, S.; Bouyer, D.; Caillieux, E.; Duvernois-Berthet, E.; Al-Shikhley, L.; et al. Integrative epigenomic mapping defines four main chromatin states in Arabidopsis. EMBO J. 2011, 30, 1928–1938. [Google Scholar] [CrossRef] [PubMed]
  19. Kim, J.-M.; To, T.K.; Ishida, J.; Morosawa, T.; Kawashima, M.; Matsui, A.; Toyoda, T.; Kimura, H.; Shinozaki, K.; Seki, M. Alterations of lysine modifications on the histone H3 N-tail under drought stress conditions in Arabidopsis thaliana. Plant Cell Physiol. 2008, 49, 1580–1588. [Google Scholar] [CrossRef] [PubMed]
  20. Ding, Y.; Fromm, M.; Avramova, Z. Multiple exposures to drought ‘train’ transcriptional responses in Arabidopsis. Nat. Commun. 2012, 3, 740. [Google Scholar] [CrossRef] [PubMed]
  21. Du, J.M.; Johnson, L.M.; Jacobsen, S.E.; Patel, D.J. DNA methylation pathways and their crosstalk with histone methylation. Nat. Rev. Mol. Cell Biol. 2015, 16, 519–532. [Google Scholar] [CrossRef] [PubMed] [Green Version]
  22. Wendte, J.M.; Schmitz, R.J. Specifications of targeting heterochromatin modifications in plants. Mol. Plant 2018, 11, 381–387. [Google Scholar] [CrossRef] [PubMed]
  23. Schmidt, M.; Van Bel, M.; Woloszynska, M.; Slabbinck, B.; Martens, C.; De Block, M.; Coppens, F.; Van Lijsebettens, M. Plant-RRBS, a bisulfite and next-generation sequencing-based methylome profiling method enriching for coverage of cytosine positions. BMC Plant Biol. 2017, 17, 115. [Google Scholar] [CrossRef] [PubMed] [Green Version]
  24. De Block, M.; De Brouwer, D. A simple and robust in vitro assay to quantify the vigour of oilseed rape lines and hybrids. Plant Physiol. Biochem. 2002, 40, 845–852. [Google Scholar] [CrossRef]
  25. Parkinson, H.; Sarkans, U.; Kolesnikov, N.; Abeygunawardena, N.; Burdett, T.; Dylag, M.; Emam, I.; Farne, A.; Hastings, E.; Holloway, E.; et al. ArrayExpress update—An archive of microarray and high-throughput sequencing-based functional genomics experiments. Nucleic Acids Res. 2011, 39, D1002–D1004. [Google Scholar] [CrossRef] [PubMed]
  26. FastQC. Available online: http://www.bioinformatics.babraham.ac.uk/projects/fastqc/ (accessed on 13 July 2018).
  27. Wu, T.D.; Nacu, S. Fast and SNP-tolerant detection of complex variants and splicing in short reads. Bioinformatics 2010, 26, 873–881. [Google Scholar] [CrossRef] [PubMed] [Green Version]
  28. Li, H.; Handsaker, B.; Wysoker, A.; Fennell, T.; Ruan, J.; Homer, N.; Marth, G.; Abecasis, G.; Durbin, R. 1000 Genome Project Data Processing Subgroup. The Sequence Alignment/Map format and SAMtools. Bioinformatics 2009, 25, 2078–2079. [Google Scholar] [CrossRef] [PubMed]
  29. Robinson, M.D.; McCarthy, D.J.; Smyth, G.K. edgeR: A Bioconductor package for differential expression analysis of digital gene expression data. Bioinformatics 2010, 26, 139–140. [Google Scholar] [CrossRef] [PubMed]
  30. Yu, J.; Hu, S.; Wang, J.; Wong, G.K.-S.; Li, S.; Liu, B.; Deng, Y.; Dai, L.; Zhou, Y.; Zhang, X.; et al. A draft sequence of the rice genome (Oryza sativa L. ssp. indica). Science 2002, 296, 79–92. [Google Scholar] [CrossRef] [PubMed]
  31. Proost, S.; Van Bel, M.; Sterck, L.; Billiau, K.; Van Parys, T.; Van de Peer, Y.; Vandepoele, K. PLAZA: A comparative genomics resource to study gene and genome evolution in plants. Plant Cell 2009, 21, 3718–3731. [Google Scholar] [CrossRef] [PubMed] [Green Version]
  32. Van Bel, M.; Proost, S.; Wischnitzki, E.; Movahedi, S.; Scheerlinck, C.; Van de Peer, Y.; Vandepoele, K. Dissecting plant genomes with the PLAZA comparative genomics platform. Plant Physiol. 2012, 158, 590–600. [Google Scholar] [CrossRef] [PubMed]
  33. PLAZA. Available online: https://bioinformatics.psb.ugent.be/plaza (accessed on 13 July 2018).
  34. Hellemans, J.; Mortier, G.; De Paepe, A.; Speleman, F.; Vandesompele, J. qBase relative quantification framework and software for management and automated analysis of real-time quantitative PCR data. Genome Biol. 2007, 8, R19. [Google Scholar] [CrossRef] [PubMed]
  35. Murray, M.G.; Thompson, W.F. Rapid isolation of high molecular weight plant DNA. Nucleic Acids Res. 1980, 8, 4321–4325. [Google Scholar] [CrossRef] [PubMed]
  36. Ibarra, C.A.; Feng, X.; Schoft, V.K.; Hsieh, T.-F.; Uzawa, R.; Rodrigues, J.A.; Zemach, A.; Chumak, N.; Machlicova, A.; Nishimura, T.; et al. Active DNA demethylation in plant companion cells reinforces transposon methylation in gametes. Science 2012, 337, 1360–1364. [Google Scholar] [CrossRef] [PubMed] [Green Version]
  37. Krueger, F.; Andrews, S.R. Bismark: A flexible aligner and methylation caller for Bisulfite-Seq applications. Bioinformatics 2011, 27, 1571–1572. [Google Scholar] [CrossRef] [PubMed]
  38. Akalin, A.; Kormaksson, M.; Li, S.; Garrett-Bakelman, F.E.; Figueroa, M.E.; Melnick, A.; Mason, C.E. methylKit: A comprehensive R package for the analysis of genome-wide DNA methylation profiles. Genome Biol. 2012, 13, R87. [Google Scholar] [CrossRef] [PubMed]
  39. Schultz, M.D.; Schmitz, R.J.; Ecker, J.R. ‘Leveling’ the playing field for analyses of single-base resolution DNA methylomes. Trends Genet. 2012, 28, 583–585. [Google Scholar] [CrossRef] [PubMed] [Green Version]
  40. MethPrimer. Available online: http://www.urogene.org/cgi-bin/methprimer/methprimer.cgi (accessed on 13 July 2018).
  41. Li, H.; Durbin, R. Fast and accurate short read alignment with Burrows-Wheeler transform. Bioinformatics 2009, 25, 1754–1760. [Google Scholar] [CrossRef] [PubMed] [Green Version]
  42. Zhang, Y.; Liu, T.; Meyer, C.A.; Eeckhoute, J.; Johnson, D.S.; Bernstein, B.E.; Nusbaum, C.; Myers, R.M.; Brown, M.; Li, W.; et al. Model-based analysis of ChIP-Seq (MACS). Genome Biol. 2008, 9, R137. [Google Scholar] [CrossRef] [PubMed]
  43. Reizel, Y.; Spiro, A.; Sabag, O.; Skversky, Y.; Hecht, M.; Keshet, I.; Berman, B.P.; Cedar, H. Gender-specific postnatal demethylation and establishment of epigenetic memory. Genes Dev. 2015, 29, 923–933. [Google Scholar] [CrossRef] [PubMed] [Green Version]
  44. Shih, A.H.; Jiang, Y.; Meydan, C.; Shank, K.; Pandey, S.; Barreyro, L.; Antony-Debre, I.; Viale, A.; Socci, N.; Sun, Y.; et al. Mutational cooperativity linked to combinatorial epigenetic gain of function in acute myeloid leukemia. Cancer Cell 2015, 27, 502–515. [Google Scholar] [CrossRef] [PubMed]
  45. Zhang, L.; Cheng, Z.; Qin, R.; Qiu, Y.; Wang, J.-L.; Cui, X.; Gu, L.; Zhang, X.; Guo, X.; Wang, D.; et al. Identification and characterization of an epi-allele of FIE1 reveals a regulatory linkage between two epigenetic marks in rice. Plant Cell 2012, 24, 4407–4421. [Google Scholar] [CrossRef] [PubMed]
  46. Van Lijsebettens, M.; Grasser, K.D. Transcript elongation factors: Shaping transcriptomes after transcript initiation. Trends Plant Sci. 2014, 19, 717–726. [Google Scholar] [CrossRef] [PubMed]
  47. Barkan, A.; Small, I. Pentatricopeptide repeat proteins in plants. Annu. Rev. Plant Biol. 2014, 65, 415–442. [Google Scholar] [CrossRef] [PubMed]
  48. Schmitz-Linneweber, C.; Small, I. Pentatricopeptide repeat proteins: A socket set for organelle gene expression. Trends Plant Sci. 2008, 13, 663–670. [Google Scholar] [CrossRef] [PubMed]
  49. Heber, U.; Walker, D. Concerning a dual function of coupled cyclic electron transport in leaves. Plant Physiol. 1992, 100, 1621–1626. [Google Scholar] [CrossRef] [PubMed]
  50. Miyake, C. Alternative electron flows (water-water cycle and cyclic electron flow around PSI) in photosynthesis: Molecular mechanisms and physiological functions. Plant Cell physiol. 2010, 51, 1951–1963. [Google Scholar] [CrossRef] [PubMed]
  51. Takahashi, S.; Badger, M.R. Photoprotection in plants: A new light on photosystem II damage. Trends Plant Sci. 2011, 16, 53–60. [Google Scholar] [CrossRef] [PubMed]
  52. Livingston, A.K.; Cruz, J.A.; Kohzuma, K.; Dhingra, A.; Kramer, D.M. An Arabidopsis mutant with high cyclic electron flow around photosystem I (hcef) involving the NADPH dehydrogenase complex. Plant Cell 2010, 22, 221–233. [Google Scholar] [CrossRef] [PubMed]
  53. Suorsa, M.; Sirpiö, S.; Aro, E.-M. Towards characterization of the chloroplast NAD(P)H dehydrogenase complex. Mol. Plant 2009, 2, 1127–1140. [Google Scholar] [CrossRef] [PubMed]
  54. Shikanai, T. Central role of cyclic electron transport around photosystem I in the regulation of photosynthesis. Curr. Opin. Biotechnol. 2014, 26, 25–30. [Google Scholar] [CrossRef] [PubMed]
  55. Yamori, W.; Sakata, N.; Suzuki, Y.; Shikanai, T.; Makino, A. Cyclic electron flow around photosystem I via chloroplast NAD(P)H dehydrogenase (NDH) complex performs a significant physiological role during photosynthesis and plant growth at low temperature in rice. Plant J. 2011, 68, 966–976. [Google Scholar] [CrossRef] [PubMed] [Green Version]
  56. Yamori, W.; Shikanai, T.; Makino, A. Photosystem I cyclic electron flow via chloroplast NADH dehydrogenase-like complex performs a physiological role for photosynthesis at low light. Sci. Rep. 2015, 5, 13908. [Google Scholar] [CrossRef] [PubMed] [Green Version]
  57. Okuda, K.; Nakamura, T.; Sugita, M.; Shimizu, T.; Shikanai, T. A pentatricopeptide repeat protein is a site recognition factor in chloroplast RNA editing. J. Biol. Chem. 2006, 281, 37661–37667. [Google Scholar] [CrossRef] [PubMed]
  58. Yagi, Y.; Tachikawa, M.; Noguchi, H.; Satoh, S.; Obokata, J.; Nakamura, T. Pentatricopeptide repeat proteins involved in plant organellar RNA editing. RNA Biol. 2013, 10, 1419–1425. [Google Scholar] [CrossRef] [PubMed] [Green Version]
  59. Hashimoto, M.; Endo, T.; Peltier, G.; Tasaka, M.; Shikanai, T. A nucleus-encoded factor, CRR2, is essential for the expression of chloroplast ndhB in Arabidopsis. Plant J. 2003, 36, 541–549. [Google Scholar] [CrossRef] [PubMed]
  60. Okuda, K.; Myouga, F.; Motohashi, R.; Shinozaki, K.; Shikanai, T. Conserved domain structure of pentatricopeptide repeat proteins involved in chloroplast RNA editing. Proc. Natl. Acad. Sci. USA 2007, 104, 8178–8183. [Google Scholar] [CrossRef] [PubMed] [Green Version]
  61. Kotera, E.; Tasaka, M.; Shikanai, T. A pentatricopeptide repeat protein is essential for RNA editing in chloroplasts. Nature 2005, 433, 326–330. [Google Scholar] [CrossRef] [PubMed]
  62. Xu, M.; Shi, N.; Li, Q.; Mi, H. An active supercomplex of NADPH dehydrogenase mediated cyclic electron flow around Photosystem I from the panicle chloroplast of Oryza sativa. Acta Biochim. Biophys. Sin. 2014, 46, 757–765. [Google Scholar] [CrossRef] [PubMed]
  63. Zilberman, D.; Cao, X.; Jacobsen, S.E. ARGONAUTE4 control of locus-specific siRNA accumulation and DNA and histone methylation. Science 2003, 299, 716–719. [Google Scholar] [CrossRef] [PubMed]
  64. Chan, S.W.-L.; Zilberman, D.; Xie, Z.; Johansen, L.K.; Carrington, J.C.; Jacobsen, S.E. RNA silencing genes control de novo DNA methylation. Science 2004, 303, 1336. [Google Scholar] [CrossRef] [PubMed]
  65. Zhu, Y.; Rowley, M.J.; Böhmdorfer, G.; Wierzbicki, A.T. A SWI/SNF chromatin-remodeling complex acts in noncoding RNA-mediated transcriptional silencing. Mol. Cell 2013, 49, 298–309. [Google Scholar] [CrossRef] [PubMed]
  66. Zhong, X.; Du, J.; Hale, C.J.; Gallego-Bartolome, J.; Feng, S.; Vashisht, A.A.; Chory, J.; Wohlschlegel, J.A.; Patel, D.J.; Jacobsen, S.E. Molecular mechanism of action of plant DRM de novo DNA methyltransferases. Cell 2014, 157, 1050–1060. [Google Scholar] [CrossRef] [PubMed]
  67. Hofmeister, B.T.; Lee, K.; Rohr, N.A.; Hall, D.W.; Schmitz, R.J. Stable inheritance of DNA methylation allows creation of epigenotype maps and the study of epiallele inheritance patterns in the absence of genetic variation. Genome Biol. 2017, 18, 155. [Google Scholar] [CrossRef] [PubMed]
  68. Mathieu, O.; Reinders, J.; Čaikovski, M.; Smathajitt, C.; Paszkowski, J. Transgenerational stability of the Arabidopsis epigenome is coordinated by CG methylation. Cell 2007, 130, 851–862. [Google Scholar] [CrossRef] [PubMed]
  69. Bond, D.M.; Baulcombe, D.C. Small RNAs and heritable epigenetic variation in plants. Trends Cell Biol. 2014, 24, 100–107. [Google Scholar] [CrossRef] [PubMed]
  70. Antosz, W.; Pfab, A.; Ehrnsberger, H.F.; Holzinger, P.; Köllen, K.; Mortensen, S.A.; Bruckmann, A.; Schubert, T.; Längst, G.; Griesenbeck, J.; et al. The composition of the Arabidopsis RNA polymerase II transcript elongation complex reveals the interplay between elongation and mRNA processing factors. Plant Cell 2017, 29, 854–870. [Google Scholar] [CrossRef] [PubMed]
  71. Johannes, F.; Porcher, E.; Teixeira, F.K.; Saliba-Colombani, V.; Simon, M.; Agier, N.; Bulski, A.; Albuisson, J.; Heredia, F.; Audigier, P.; et al. Assessing the impact of transgenerational epigenetic variation on complex traits. PLoS Genet. 2009, 5, e1000530. [Google Scholar] [CrossRef] [PubMed]
  72. Smith, S.T.; Petruk, S.; Sedkov, Y.; Cho, E.; Tillib, S.; Canaani, E.; Mazo, A. Modulation of heat shock gene expression by the TAC1 chromatin-modifying complex. Nat. Cell Biol. 2004, 6, 162–167. [Google Scholar] [CrossRef] [PubMed]
  73. Gibert, J.-M.; Peronnet, F.; Schlötterer, C. Phenotypic plasticity in Drosophila pigmentation caused by temperature sensitivity of a chromatin regulator network. PLoS Genet. 2007, 3, e30. [Google Scholar] [CrossRef] [PubMed]
  74. Jobson, M.A.; Jordan, J.M.; Sandrof, M.A.; Hibshman, J.D.; Lennox, A.L.; Baugh, L.R. Transgenerational effects of early life starvation on growth, reproduction, and stress resistance in Caenorhabditis elegans. Genetics 2015, 201, 201–212. [Google Scholar] [CrossRef] [PubMed]
Figure 1. Total, common and specific differentially expressed genes (DEGs) in epiline LR1, LR2, and LR3 transcriptomes. Comparative transcriptome analysis of total DEGs (p < 0.01; false discovery rate (FDR) (q) < 0.05, |log2fc| > 0.6). (A) Number of total up- and down-regulated DEGs; (B) Venn diagram showing total common and epiline-specific numbers of DEGs.
Agronomy 08 00163 g001
Figure 2. Gene-associated location of stringently selected highly DMRs (hDMRs) that contain almost exclusively CG sites (CG-hDMRs). For epiline LR1 (A), LR2 (B), and LR3 (C), the locations of hyper-/hypo-methylated hDMRs are shown within 2.0 kb upstream of genes, within genes, and a maximum of 2.0 kb downstream of genes using the reference genome annotation of Oryza sativa ssp. indica ([30], PLAZA 9311_BGF_2005).
Agronomy 08 00163 g002
Figure 3. DEGs associated with upstream CG-DMRs in epilines compared with the control line. (A) Number of up-regulated DEGs associated with hypo-methylated CG-DMRs, and number of down-regulated DEGs associated with hyper-methylated CG-DMRs; (B,C) Comparison of up-regulated DEGs/hypo-methylated CG-DMRs (B) and of down-regulated DEGs/hyper-methylated CG-DMRs (C) between LR1 and LR2. The significant DMR (q < 0.01, >25% methylation level difference) location needed to be located at less than 2 kb upstream of the gene transcription start site of the significantly DEG (q < 0.05, no Log2FC threshold).
Agronomy 08 00163 g003
Figure 4. Expression and cytosine methylation changes of down-regulated DEGs associated with upstream hyper-methylated DMRs in epilines. Values for epiline LR1 and LR2 are indicated. Each DMR-associated DEG is shown with its transcription and methylation change, versus the control line. Epiline-specific DMR-associated DEGs are colored (red/blue crosses) when reaching the threshold of log2FC ≤ −0.5. Epiline-common DMR-associated DEGs are putative epialleles, and they are emphasized by connected data points and specific symbols as depicted in the legend.
Agronomy 08 00163 g004
Figure 5. Venn diagram showing the intersection of H3K4me3 and PolII enrichments within genes in LR2. An extensive overlap of gene-associated H3K4me3 and PolII enrichments (log2FC > 0.6) in epiline LR2 compared with the control line is shown.
Agronomy 08 00163 g005
Table 1. Physiological and yield properties of rice epilines.
LineIn Vitro AssaysSoilField Trial b
Average Cellular Respiration (S3)NAD(P)H Content (S3)Energy Use Efficiency a (S3)Photo-Respiration (S5)Leaf Respiration (S5)Seed Yield
(S6)(S7)
Control100100100100100100100
LR188 **101115 **10681 *116 *105
LR286 ***100116 **10680 *110 *101
LR395 **97102112 **9699101
a NAD(P)H/respiration; b one location; Statistical significance using ANOVA with Dunnett’s post-hoc test, * p < 0.05, ** p < 0.01, and *** p < 0.001, versus control line (%).
Table 2. Genome-wide DNA methylome analysis of rice epilines by bisulfite sequencing.
LineMean Methylated Cytosines a
CGCHGCHH
(%)
Control45.816.63.2
LR144.717.33.0
LR245.817.13.1
LR342.216.22.9
a Arithmetic mean of site methylation levels of analyzed cytosine positions ( 1 / n i = 1 n C i / ( C i + T i ) × 100 % ). n = total number of positions with certain CG, CHG, or CHH sites, i = cytosine position, C = number of cytosine supporting methylated state, T = number of informative nucleotide thymine supporting the unmethylated state (for more details see the Material and Methods section or [39]).
Table 3. Number of differentially methylated regions (DMRs) in rice epilines.
EpilineCGCHGCHH
Hyper-MethylatedHypo-MethylatedHyper-MethylatedHypo-MethylatedHyper-MethylatedHypo-Methylated
25% Methylation Level Difference (DMRs)
LR1660154604953504721653329
LR2468245883649292624283238
LR3602057354049436117923571
80% Methylation Level Difference (hDMRs)
LR1115982101
LR21141044322
LR31161022202
Parameters: Minimum of 10 unique mappable reads/position in all analyzed rice lines; DMR: FDR (q) < 0.01; window size: 100 bp; step size: 20 bp; DMR selection: >|25|% and >|80|% depth-weighted methylation level differences and ≥2 cytosines. DMRs with a distance lower than 20 bp were joined.
Table 4. Epiline LR1- and LR2-common DMR-associated DEGs showing gradual methylation changes and transcriptional changes (putative epialleles).
DMRDEGDEG ParameterDMR ParameterGene
Gene IDlog2FCMethylation Level Difference (%)Description
Hyper-methylatedOSINDICA_01G41530−0.6041.4nucleoside triphosphate hydrolases
−0.6446.4
OSINDICA_01G43010−1.5648.4prenylcysteine methylesterase
−2.0961.1
OSINDICA_03G51310−0.5040.0unknown protein
−0.7765.7
OSINDICA_05G06440−1.3554.7phosphoenolpyruvate/phosphate translocator (PPT)
−1.9192.1
OSINDICA_06G29930−0.6236.9GDSL-like Lipase/acylhydrolase
−0.5334.4
OSINDICA_06G36260−0.5747.2phosphatidylinositol transfer family protein
−0.7648.0
OSINDICA_09G30400−0.5789.5unknown protein
−0.67100.0
Hypo-methylatedOSINDICA_02G440500.70−34.2brassinosteroid-responsive RING-H2
0.98−37.3
OSINDICA_01G359201.12−54.4sugar transporter 1
0.72−40.0
OSINDICA_12G276000.74−29.1ABA-activated protein kinase
0.91−35.6
Transcription change (log2FC) and methylation level difference (%) were compared with the control line. Per gene, the upper line values are of LR1, the lower line values are of LR2.
Table 5. Number of H3K4me3 and RNA polymerase II (PolII) differentially marked regions in the rice epiline LR2 versus the control line.
H3K4me3PolII
EnrichedDepletedTotalEnrichedDepletedTotal
26,8004026,84021,06510521,170
Active region lengths: average: 2553 nt, median: 1844 nt, minimum: 321 nt, maximum: 38,529 nt. Filtered for the ratio of the average signal/signal strength in epiline versus the control line, expressed as log2FC > 0.6 or < −0.6, and indicated by enriched or depleted.

