


Abstract
Increased nutrient withdrawal by rapidly expanding intensive cropping systems, in combination with imbalanced fertilization, is leading to potassium (K) depletion from agricultural soils in Asia. There is an urgent need to better understand the soil K-supplying capacity and K-use efficiency of crops to address this issue. Maize is increasingly being grown in rice-based systems in South Asia, particularly in Bangladesh and North East India. The high nutrient extraction, especially K, however, causes concerns for the sustainability of maize production systems in the region. The present study was designed to estimate, through a plant-based method, the magnitude, and variation in K-supplying capacity of a range of soils from the maize-growing areas and the K-use efficiency of maize in Bangladesh. Eighteen diverse soils were collected from several upazillas (or sub-districts) under 11 agro-ecological zones to examine their K-supplying capacity from the soil reserves and from K fertilization (100 mg K kg−1 soil) for successive seven maize crops grown up to V10–V12 in pots inside a net house. A validation field experiment was conducted with five levels of K (0, 40, 80, 120 and 160 kg ha−1) and two fertilizer recommendations based on “Nutrient Expert for Maize-NEM” and “Maize Crop Manager-MCM” decision support tools (DSSs) in 12 farmers’ fields in Rangpur, Rajshahi and Comilla districts in Bangladesh. Grain yield and yield attributes of maize responded significantly (p < 0.001) to K fertilizer, with grain yield increase from 18 to 79% over control in all locations. Total K uptake by plants not receiving K fertilizer, considered as potential K-supplying capacity of the soil in the pot experiment, followed the order: Modhukhali > Mithapukur > Rangpur Sadar > Dinajpur Sadar > Jhinaidah Sadar > Gangachara > Binerpota > Tarash > Gopalpur > Daudkandi > Paba > Modhupur > Nawabganj Sadar > Shibganj > Birganj > Godagari > Barura > Durgapur. Likewise, in the validation field experiment, the K-supplying capacity of soils was 83.5, 60.5 and 57.2 kg ha−1 in Rangpur, Rajshahi, and Comilla, respectively. Further, the order of K-supplying capacity for three sites was similar to the results from pot study confirming the applicability of results to other soils and maize-growing areas in Bangladesh and similar soils and areas across South Asia. Based on the results from pot and field experiments, we conclude that the site-specific K management using the fertilizer DSSs can be the better and more efficient K management strategy for maize.
1. Introduction
Maize is the second most important cereal crop after rice in Asia and provides approximately 30% of the food calories to more than 4.5 billion people in 94 developing countries [1]. The world population is increasing and will continue to increase from 7.2 to 8.1 billion by 2025, reaching 9.6 billion by 2050 and 10.9 billion by 2100, with most growth occurring in the developing countries [2,3]. Maize was grown in 0.43 million hectares during 2016–2017 in Bangladesh [4].
Available soil K is deficient in many soils of Bangladesh, and crops are showing K deficiency symptoms. It is well known that the availability of K to plants does not only depend on the size of the available pool in the soil but also on the transport of K from soil solution to the root zone and from the root zone into plant roots [5]. Many plant factors (variety, root system, and antagonistic and synergistic mechanisms in ion uptake), soil factors (pH, organic matter content, texture, complementary cations, etc.) and environmental factors (rainfall, temperature, etc.) may affect these processes. However, when plant available soil K is sufficient, these factors tend to become less important. Therefore, soil K-supplying capacity is a key factor to sustain and increase crop yields.
Recent soil-test results have shown that many soils of the Indo-Gangetic Plains (IGP) of South Asia, with available K concentration of less than 0.1 cmol kg−1, are becoming deficient in K despite their original high K contents [6,7,8,9,10]. The introduction and prevalence of high yielding varieties of rice, hybrid maize and wheat since the green revolution accelerated the removal of K from the soil than the traditional varieties did. At the same time, the application of K fertilizers, on the other hand, was limited, leading to negative input-output balance of K that depleted soil K status in most of the Asian countries [10,11]. Scientists reported 31% decline in soil K status in Bangladesh over the past 30 years, which is an alarming figure [12]. Despite this, studies in soil K received less attention than other major nutrients, because the application of K fertilizer doesn’t frequently bring about a dramatic improvement in the vegetative growth of crop as is observed with nitrogen (N) fertilizer, or does not have the environmental concerns associated with its use as in N. Besides, the general perception that the South Asian soils are rich in K-bearing minerals also led to the complacency that crops may not require external K application to perform adequately. Therefore, most of the farmers, who can afford to apply fertilizers to their crops, apply only urea and phosphate fertilizers, while K application is often neglected. As a result, soils which were not deficient in K in the past have either become deficient or are likely to become deficient in the near future [13].
Of the three main macronutrients (N, phosphorus-P, and potassium-K), much work has been done in the past about N management in cropping systems [14,15]. The focus now, however in the context of maize production has been shifted to K nutrition, as the K dynamics of maize-growing soils dictate how well the K demand for high-yielding maize crops can be met. It is hypothesized that soils of maize-growing areas in Bangladesh differ in terms of mineralogy, soil K reserves, allowable drawdown, and K-supplying capacity. Thus, some soils would require more while others would require less K to grow profitable maize crops. Carefully-conducted pot and field experiments using a plant-based assay are expected to help estimate the magnitude and variation in K-supplying capacity of soils. The information generated from such experiments would help develop soil-based coefficients on allowable draw down of soil K reserves, which can be used for the determination of fertilizer K requirements of maize for Bangladesh, as well as for other maize-growing areas in South Asia.
Soil indigenous K supply, K-use efficiency, and crop yield vary spatially and temporally in the diverse irrigated maize fields in Bangladesh and South Asia. At present, however, blanket fertilizer recommendations are often applied over large areas without taking into account the wide variability in site- and season-specific crop nutrient requirements, which explains the reasons for low K-use efficiency. Further, the use of K fertilizers is often not based on crop requirements and are not balanced with other nutrients. As a result, the profitability is not optimized [6,16]. A rational and profitable K fertilizer management strategy needs to be based on better understanding of the soil K-supplying capacity. The efficiency of applied K fertilizer, in terms of agronomic efficiency of K (AEK, kg yield increase per kg nutrient applied) and apparent K recovery efficiency (REK, kg K uptake per kg K applied) are commonly used as performance indicators for K management strategies [17,18,19]. The K-use efficiency is generally affected by yield levels, soil indigenous K-supplying capacity, amount of K fertilizer applied, and the quality of crop management operations [18]. Keeping the above points in view, the present study was undertaken to (i) determine the indigenous K-supplying capacity of major maize-growing soils in Bangladesh, and (ii) evaluate the grain yield and the K-use efficiency for maize under different K fertilizer recommendation strategies in the diverse soils of Bangladesh.
2. Materials and Methods
2.1. Pot Experiment
2.1.1. Experimental Soils
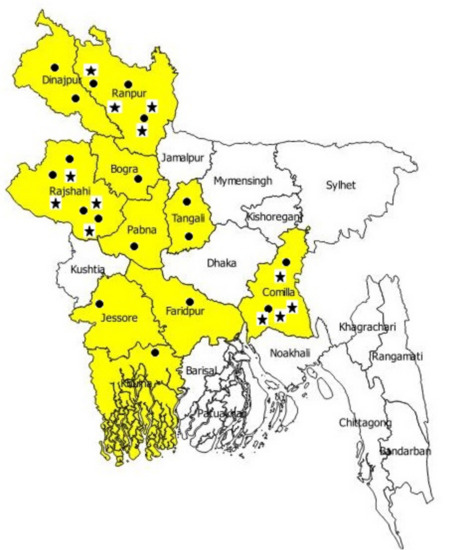
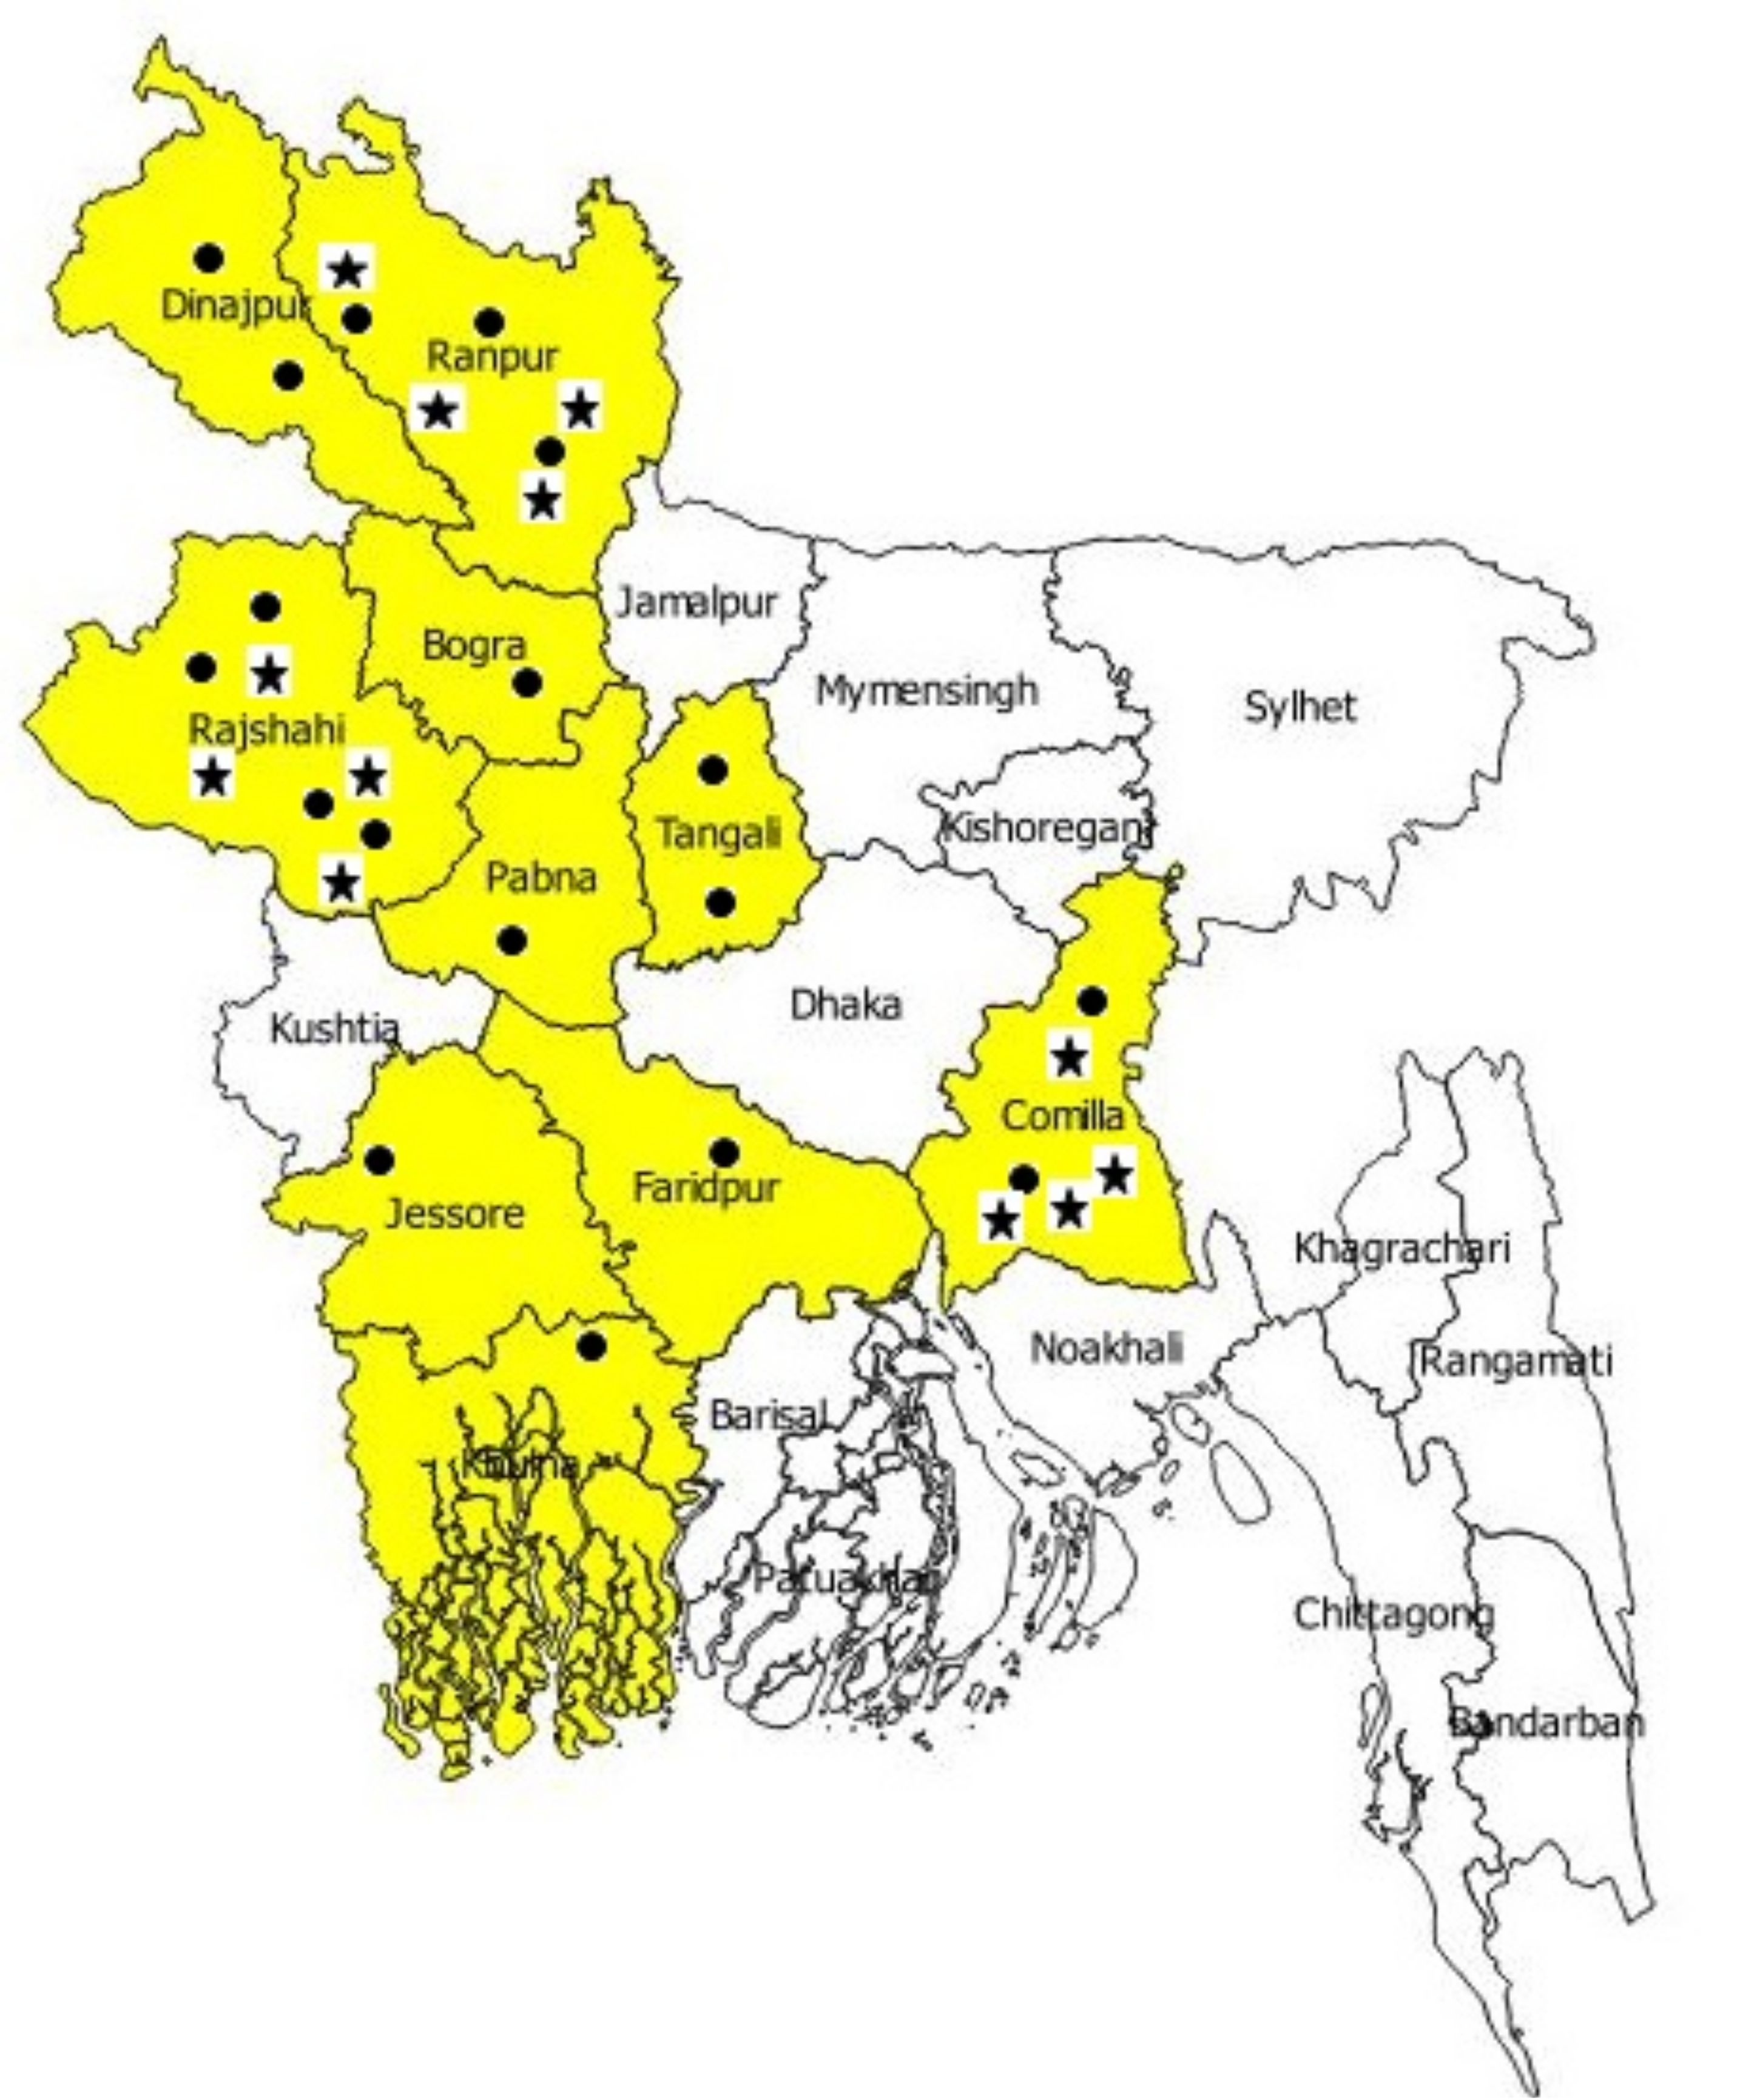
Soil samples (0–20 cm) were collected from farmers’ fields of 18 upazillas or sub-districts (representing 18 diverse soils) located in the North, North-west, East, and South parts of Bangladesh. The 18 upazillas were: Birganj, Dinajpur Sadar, Gangachara, Rangpur Sadar, Mithapukur, Shibganj, Godagari, Paba, Durgapur, Tarash, Gopalpur, Modhupur, Daudkandi, and Barura (Figure 1). The soil samples were air-dried, ground and sieved through 2 mm sieve, and subject to test for their properties. Soil pH was determined in 1:1 soil/water paste by a pH meter. Exchangeable K was extracted by 1 mol L−1 Ammonium acetate (NH4OAc), non-exchangeable K by boiling Nitric acid (HNO3) method, and total K by Hydrogen fluoride (HF) digestion [20]. Particle size analysis was done by Hydrometer method [21] and the textural class was determined from Marshall’s triangular co-ordinate following USDA system. The physical and chemical properties of the tested soils from the various upazillas used for pot study are presented in Table 1, while that for field experiment are presented in Table 2.
Figure 1.
Dots showing the locations for 18 soil samples collected from various districts for pot experiment and stars showing the field experimental sites in Bangladesh.
Table 1.
Basic chemical and physical properties of 18 soils (0–15 cm), collected from various locations, used for pot experiment with maize at Bangladesh Rice Research Institute (BRRI) net house in Gazipur, Bangladesh, 2011–2013.
Table 2.
Chemical and physical properties of four soil samples for each field experimental site (Rangpur, Rajshahi and Comilla) before sowing of rabi (winter) maize, 2012–2013.
2.1.2. Description of Pot Experiment
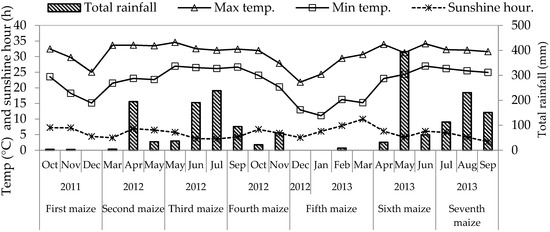
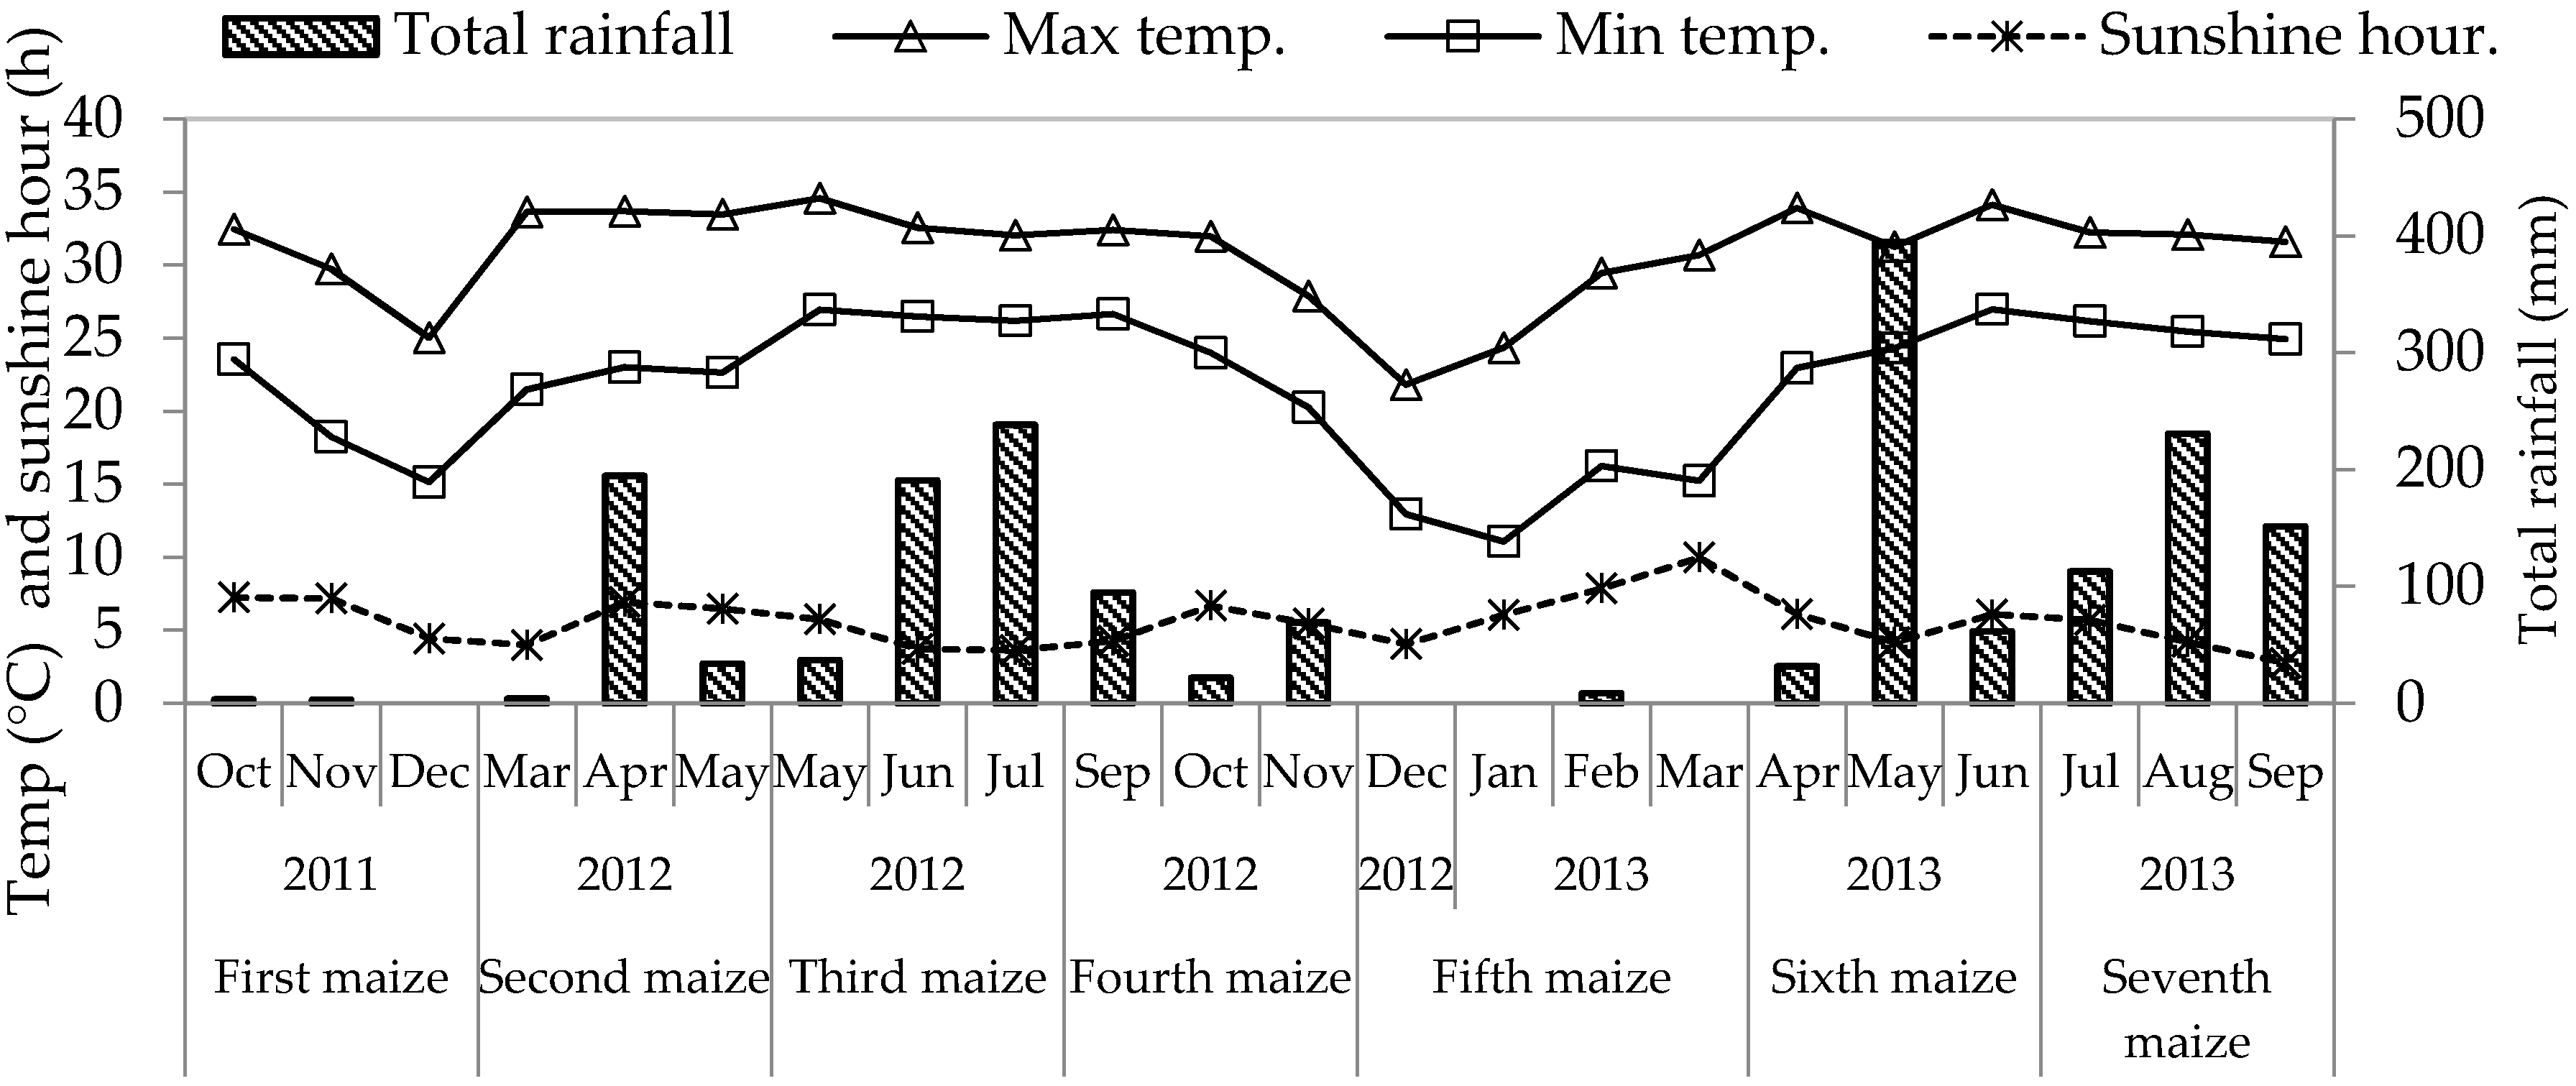
A repeated pot experiment was conducted with the eighteen soils using a randomized complete block experimental design that consisted of a no-K fertilizer (K0) and a 100 mg K kg−1 soil (K100) treatments in four replications in a net house of BRRI, Gazipur. Soils were air dried and ground to pass a 2-mm sieve, and 7 kg of each soil was weighed into each pot. Other fertilizers such as urea, Triple Super Phosphate (TSP), gypsum, and zinc sulfate were used in every pot to supply N, P, S and Zn at the rate of 200, 50, 10, and 5 mg pot−1, respectively. All nutrients except N were applied before sowing of maize while N was applied in two splits. After application of fertilizers, the soil was gently irrigated allowing smooth mixing of fertilizer materials with soils. After basal fertilizer application, five healthy seeds of hybrid maize (cv. BARI Hybrid Maize-8) were sown two cm below soil surface in each pot. Seeds were germinated after 6–11 days of sowing. Emergence was delayed in winter due to low temperature. Thinning was done 5–7 days after emergence, keeping 4 healthy plants per pot. After thinning, half N was top dressed, while the remaining 1/2 was applied at V6 stage (when 6 leaves appeared). The soils in pots were irrigated with tap water once every 3–5 days to replenish 100% soil moisture and to ensure that plants were not drought stressed. The aboveground part of the maize plant was cut at the soil surface at V10–V12 stage (55–65 days after emergence) because >90% of the total K uptake is usually accumulated by that stage [24]. The maize tissue was dried at 70 °C for 48 hours, crushed, and ground to pass a 0.5-mm sieve. A 0.5-g sub-sample was digested by an HNO3-HClO42 mixture at 180 to 200 °C [25] and K concentration was determined. Soil samples were collected before and after cropping for NHOAc-extractable K determination [20]. Seven maize crops were grown successively in each pot. Climate during the seven maize-growing periods together with crop duration for each period are presented in Figure 2.
Figure 2.
Mean monthly sunshine hour (h), minimum and maximum temperatures (°C), and total rainfall (mm) during successive cropping of rabi maize in pots from 2011 to 2013 in Gazipur, Bangladesh.
2.2. Field Experiment
2.2.1. Experimental Sites
A field experiment was conducted in 12 farmers’ fields in three districts in Bangladesh, with 4 fields each in Rangpur (25.74° N, 89.28° E), Rajshahi (24.36° N, 88.62° E) and Comilla (23.46° N, 91.19° E) (Figure 1). Rajshahi is situated in the Active Ganges Floodplain (agro-ecological zone-AEZ, AEZ 11); Comilla is in the Old Meghna Estuarine Floodplain (AEZ 19); while Rangpur is spread over both the Active Tista Floodplain (AEZ 2) and Tista Meander Floodplain (AEZ 3). According to USDA Taxonomy, the soils are classified as Typic Haplaquept, Aeric Haplaquept and Typic Dystrochrept, respectively [22]. Experimental fields in Rangpur were located in AEZ 3 only.
The four farmers’ fields in each district (two upazillas per district) were selected based on soil K (ranging from very low to high) across Bangladesh and from the literature review of K status in Bangladesh soils. The selected farmers’ fields represented the diverse agro-ecosystems with variations in the cropping system, soil, and climate within each district.
2.2.2. Climatic Condition during the Experimental Period
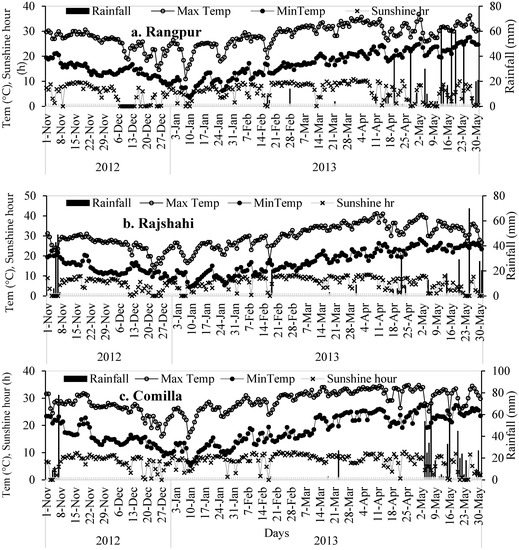
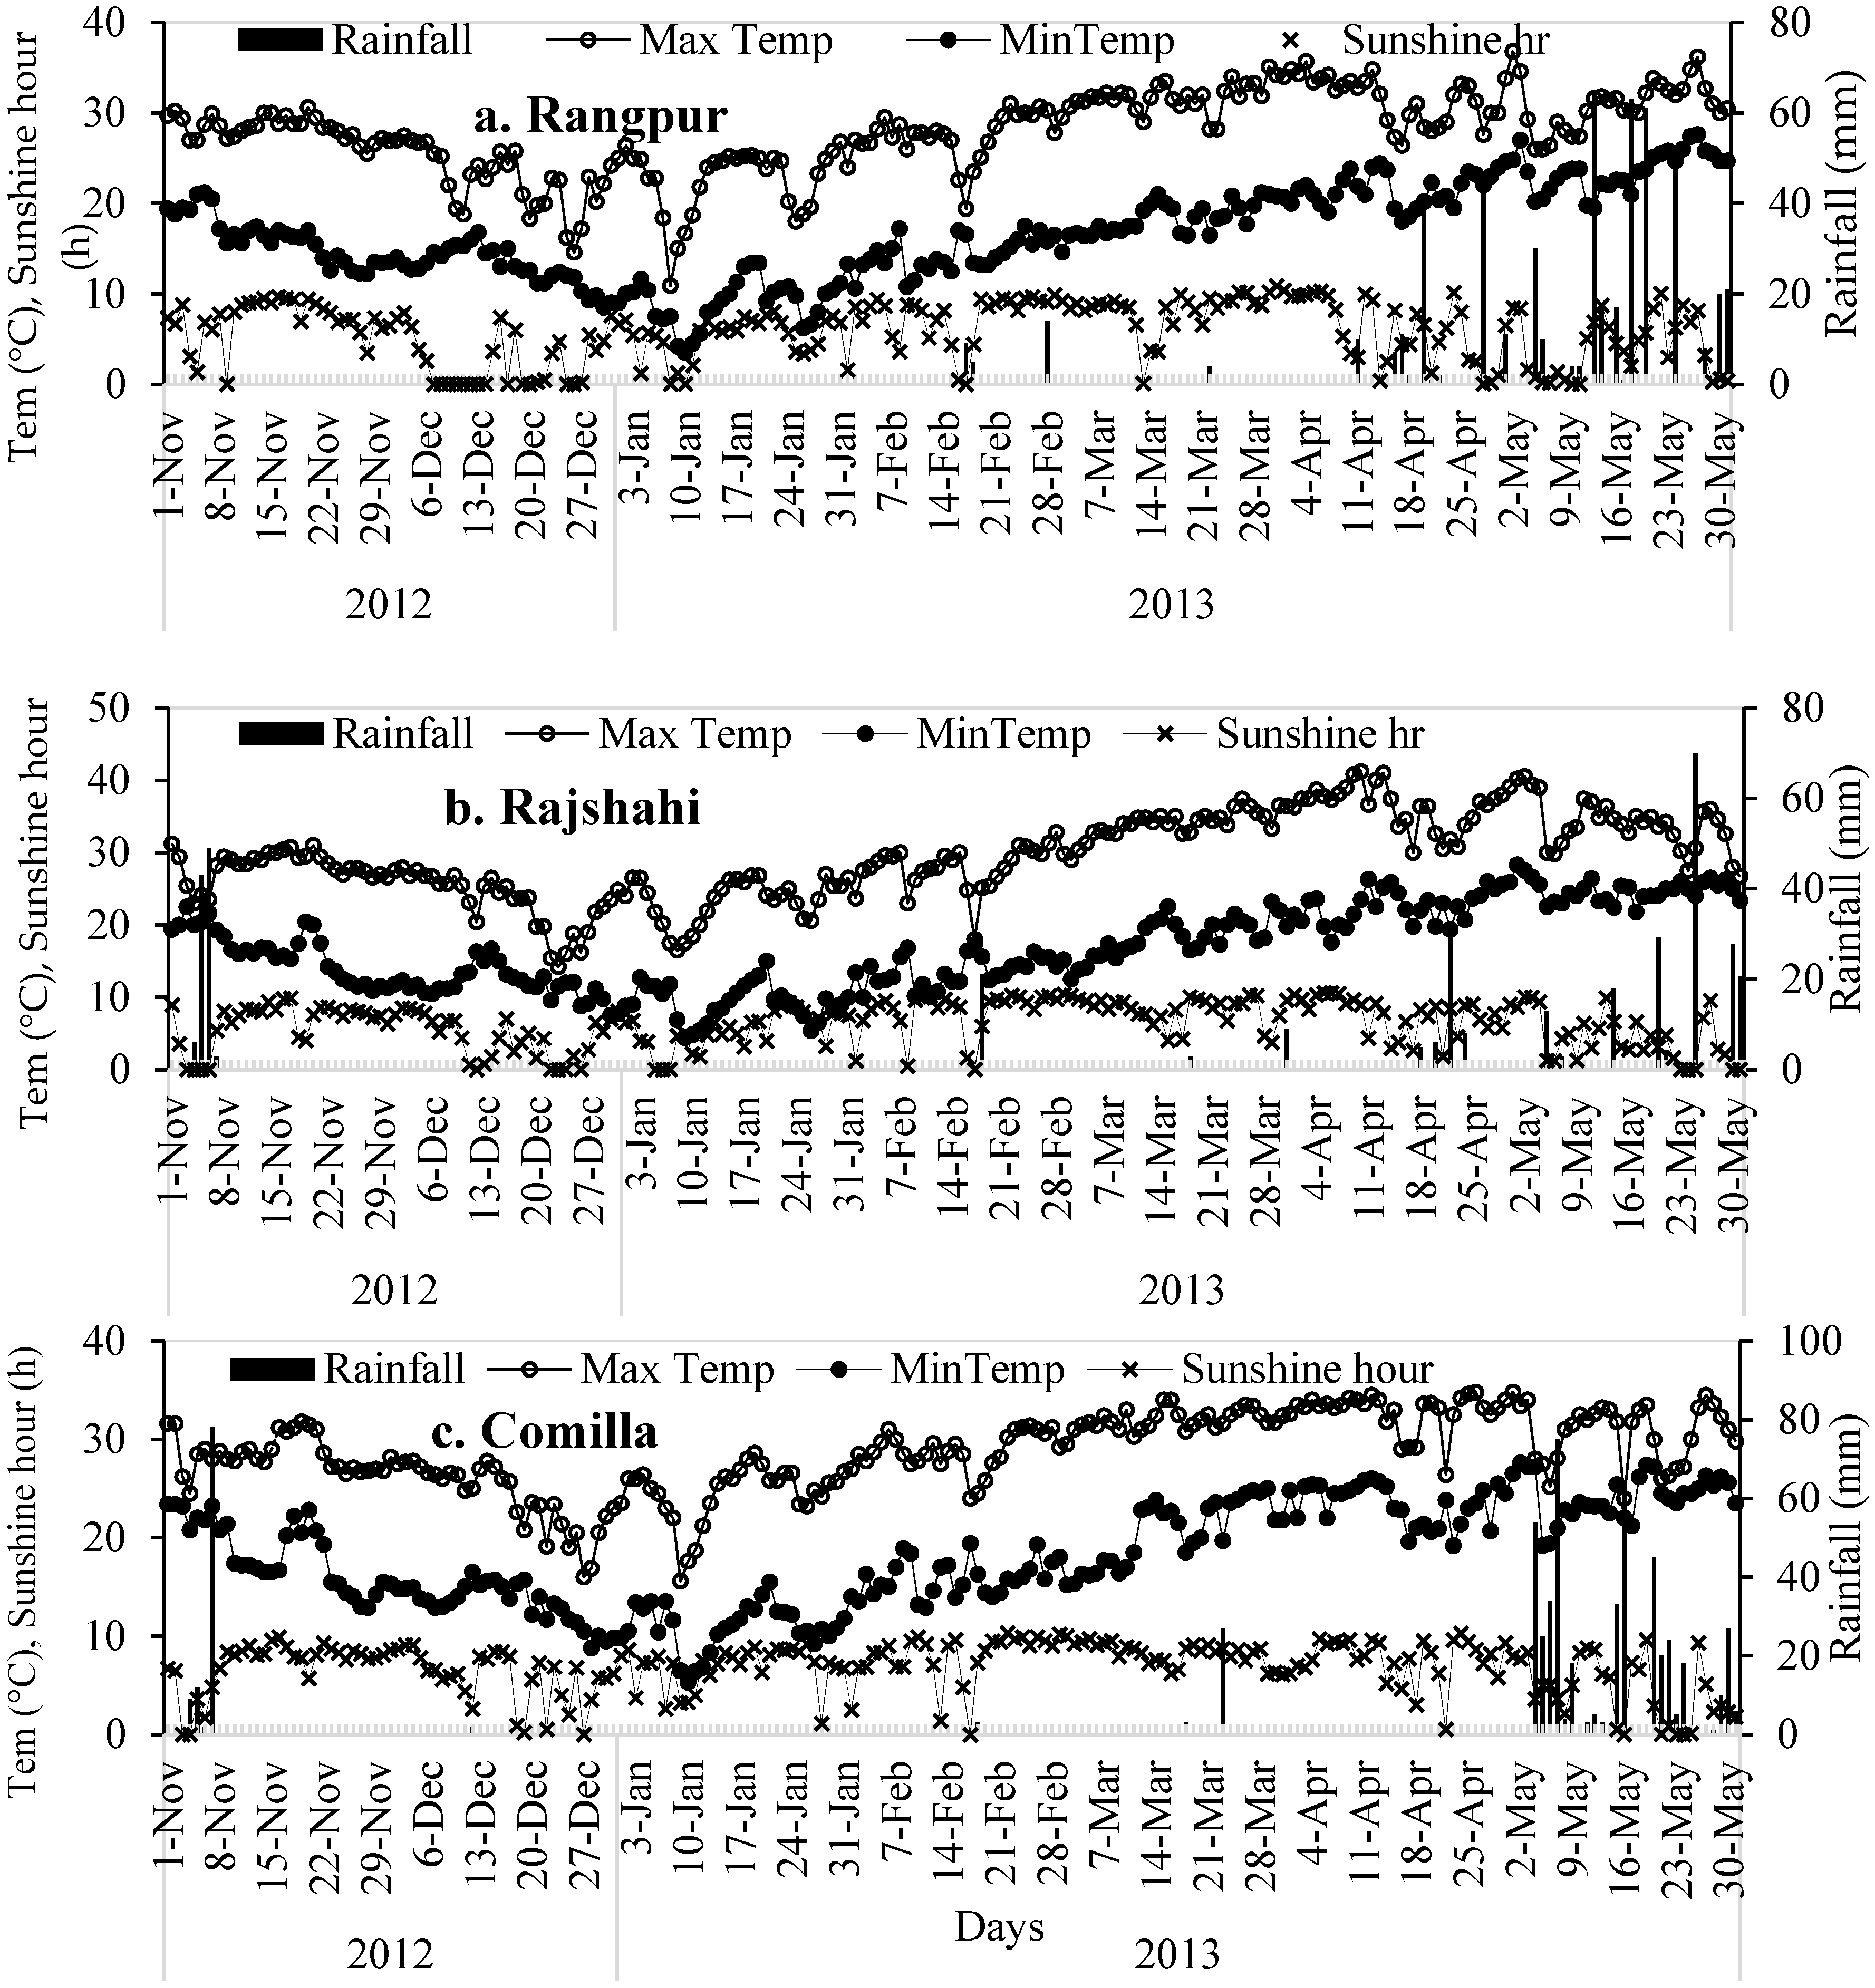
The experimental fields were located in sub-tropical to the tropical climate, and the weather data for the three districts during the experimental period are shown in Figure 3. Most of the rainfall at all the sites occurred during the monsoon season (June–October). There was no rain from November 2012 to January 2013 in Rangpur, but Rajshahi and Comilla received ~100 mm rain in November. The total rainfall during the maize season was 532, 373, and 611 mm in Rangpur, Rajshahi, and Comilla, respectively. The mean minimum and maximum temperatures during the maize season were 9 °C and 32 °C, 9 °C and 36 °C, 11 °C and 33 °C in Rangpur, Comilla, and Rajshahi, respectively. The mean minimum and maximum temperatures were 9 °C and 25 °C respectively at the beginning of the experiment in January, with lower temperatures in Rangpur than the other two districts. The temperatures increased steadily to mean a minimum of 22 °C and mean maximum of 36 °C in April and May 2013. Mean sunshine hours across districts ranged from 5.8 to 6.8 h day−1, with lowest sunshine hours recorded in Rangpur and highest in Comilla. At the beginning of the experiment, the sunshine hour was much lower in Rangpur (2.8 h day−1) than the other two districts, and as the season progressed, the sunshine hour in all districts increased steadily to maximum of 10.9, 10.6, and 10.3 h day−1 in Rangpur, Rajshahi and Comilla, respectively (Figure 3).
Figure 3.
Daily maximum and minimum temperatures (°C), sunshine hour (h) and total rainfall (mm) during the rabi maize season from November 2012 to May 2013 in experimental sites (a. Rangpur, b. Rajshahi, c. Comilla) in Bangladesh.
2.2.3. Fertilizer Decision Support Tools
Based on the principles of site-specific nutrient management (SSNM) and experiences drawn from several years of on-farm research on maize in several Asian countries [26,27,28,29,30,31], the International Rice Research Institute (IRRI) and International Plant Nutrition Institute (IPNI) developed the fertilizer decision support system (DSS) tools, Maize Crop Manager (MCM) and Nutrient Expert for Maize (NEM), respectively, in collaboration with the International Maize and Wheat Improvement Centre (CIMMYT) and National Agricultural Research and Extension Systems (NARES) partners in South and Southeast Asia. The K fertilizer recommendation rates based on these two fertilizer DSS tools were compared against five levels of K (Table 3).
Table 3.
Fertilizer recommendations for three field experimental sites in Bangladesh based on Maize Crop Manager (MCM) and Nutrient Expert for Maize (NEM).
2.2.4. Experimental Design and Treatments
The experiment was laid out in a Randomized Complete Block Design in 12 farmers’ fields (serving as replicates) with five K levels (K1 = 0, K2 = 40, K3 = 80, K4 = 120, K5 = 160), and two K fertilizer recommendations based on SSNM (DSS) tools (K6 = Nutrient Expert based recommendation for maize (NEM); K7 = Maize Crop Manager based recommendation (MCM)) in three districts. To determine the SSNM-based recommendations using two DSS tools: MCM (http://webapps.irri.org/bd/mcm/; IRRI, Philippines) and (NEM, an offline computer-based software; IPNI Offices, Delhi and Singapore), the participant farmers were asked 20 questions based on their agronomic and nutrient management practices of last (previous) year along with their field or soil characteristics. The answers to these questions were used as inputs to the MCM and NEM for generating fertilizer recommendations for each farmer (Table 3). Each treatment plot was 50 m2 in area. Bunds of 0.5 m width were prepared between plots, and a border of 1 m width was kept around the experimental area. A medium-statured hybrid maize NK40, popularly grown in Rabi (winter) season was used. NK40 is tolerant of lodging and has a high yield potential of up to 20 t ha−1.
2.2.5. Crop Management Practices
The experimental fields in all districts were irrigated with about 10 cm of water and allowed to reach proper moisture condition conducive for tillage. The fields were then prepared by 3–4 tillage with a 2-wheel operated power tiller to a depth of 8–10 cm followed by planking. Seeds in all districts were sown manually (with sowing dates ranging from 26 November 2012 to 6 January 2013) on shallow holes by dibbling and maintaining row to row and seed to seed distances of 60 and 20 cm respectively. Gap filling was done after emergence to maintain the 85,000 plant population ha−1. N, P, K, S, and Zn were applied through urea, TSP, MoP, gypsum and zinc sulfate, respectively. Rates for different nutrients, including K, applied through the recommendations of MCM and NEM are presented in Table 3. N fertilizer was applied as three splits: as basal and top-dressed twice at V6 and V10; while K was applied as two splits: as basal and at V6. All other fertilizers were applied as basal.
The crops were manually weeded twice: the first weeding was done just before the first top dressing while the second was before the second top dressing, thus allowing the weeds to be removed from the fields before each top-dressing. As rainfall was not enough, four irrigations were applied in each site to avoid drought stress to the crops. First irrigation was applied at V2–V4 (2–3 leaves stage) while the second irrigation was applied after first weeding and before first top dressing at V6–V8 (6–8 leaves stage). Likewise, third irrigation was applied after second weeding and before second top-dressing at V10–V12 (10–12 leaf stage) and fourth irrigation during grain formation stage. The amount of water for each irrigation at each site was about 7.5 cm. Carbofuran 10G @ 100g per 100-meter rows was applied at planting for controlling cutworms and nematode infestation.
2.3. Data Analysis and Measurements
The crops were harvested at maturity from a 10.08 m2 (4.2 m row length by 4 rows) area in the center of each treatment plot, excluding the two outer border rows. After harvesting, the crops were threshed with a hand thresher. The grain and stover yields and the growth and yield attributing characters (plant height, cobs plant−1, cob length and girth, grains cob−1, 1000-grain weight) were measured. The grain and stover samples from each plot were analyzed for total K content. For the post-harvest soil analysis for Kex and Knex, composite soil samples were taken from each treatment of each farmer immediately after crop harvest by using the methods as described in Table 2 [25].
Indigenous K supply (IKS) is defined as the amount of soil K that is available to maize from the soil during its growing period when other nutrients are non-limiting [31], and the IKS can be measured as the K accumulation in the above ground dry matter at harvest in the K omission plots [32]. Yield response (YR) is an effective index of soil fertility, and YR to K is defined as the yield difference between the attainable yield (measured as 85–90% of yield potential) and yield from the K omission plots [25,26]. YR to K can also be used to evaluate the soil K-supplying capacity [33]. The K concentration (%) of plant samples (stover and grain) was determined by a flame photometer [34].
The data from the K exhaustion study from the pot experiment as well as the field experiments were used to quantify the K-supplying capacity of the 18 soils to maize crops, and was calculated as follows:
Total plant K uptake = above ground biomass × K concentration in plant tissue
Agronomic efficiency (AEK; kg grain yield increase kg−1 applied K) was calculated using the equation:
where GY+K is the grain yield in the treatment with K application (kg ha−1), GY0K is the grain yield in the treatment without K application (kg ha−1), and FK is the quantity of K applied (kg ha−1).
AEK = (GY+K − GY0K) ÷ FK
Recovery efficiency (REK; kg K taken up kg−1 K applied) was calculated using the equation:
where UK+K is the total plant K uptake (kg ha−1) of the above-ground biomass (stover + grain) in plots that received K, UK0K is total K uptake without the addition of K, and FK is the quantity of K applied (kg ha−1).
REK = (UK+K − UK0K) ÷ FK
The R software [35,36] was used to analyze the means of grain and stover yields, growth and yield components, total K uptake, agronomic efficiency and recovery efficiency of K between different soils and treatments by using the least significant difference at 0.05 probability level. The Duncan’s New Multiple Range Test, a mean separation technique, was applied to detect significant differences between treatment [37].
3. Results
3.1. Pot Experiment
3.1.1. Mean Shoot Dry Matter Yield and Yield Response to K Fertilizer
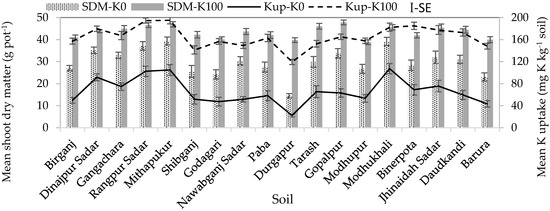
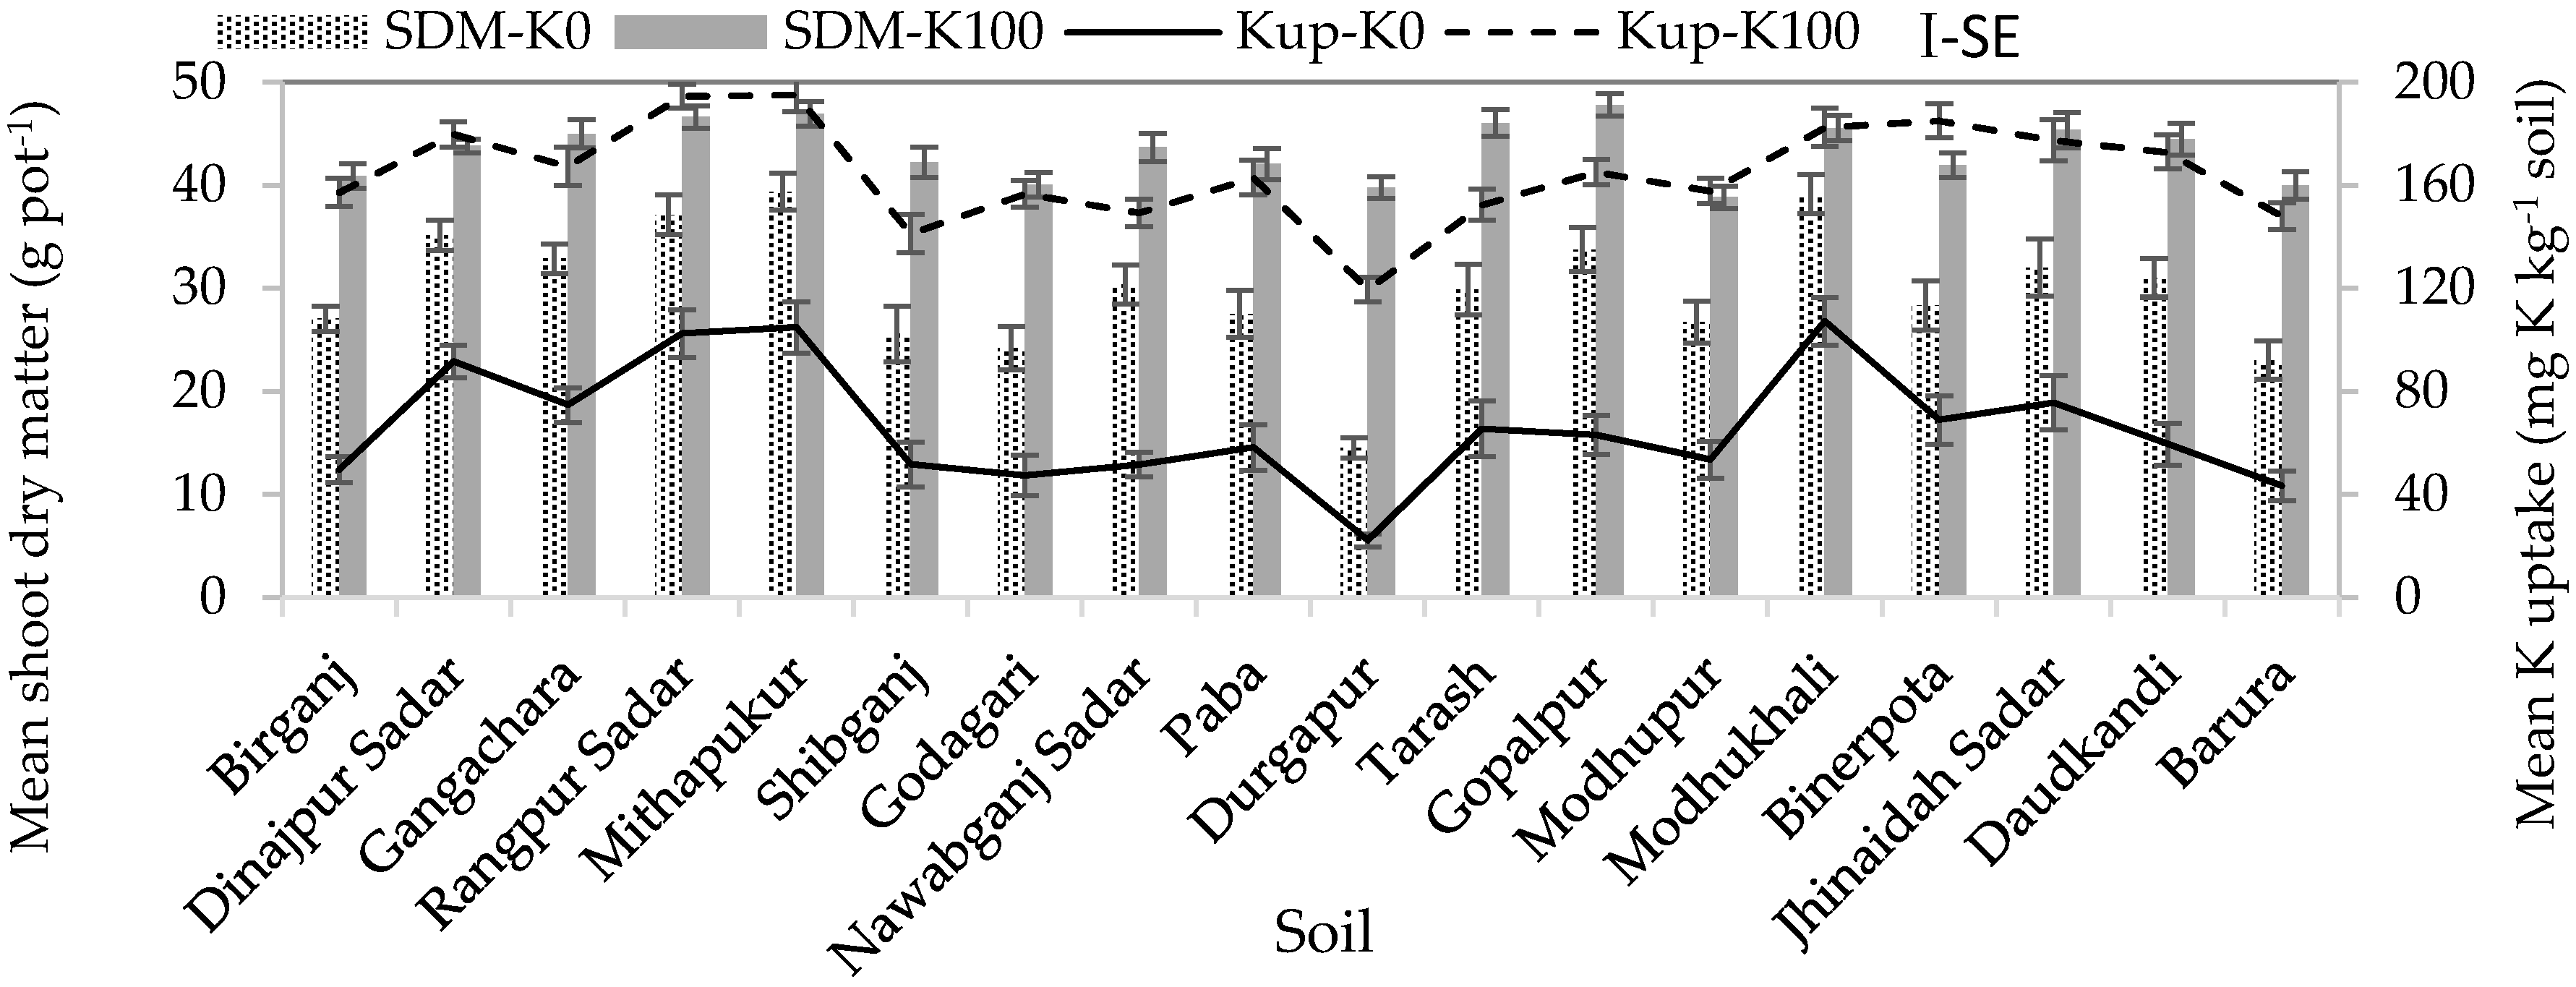
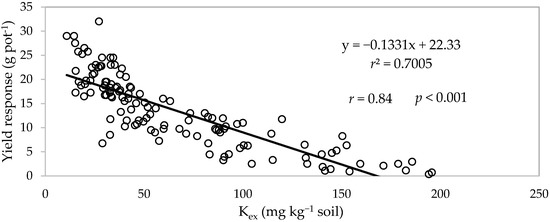
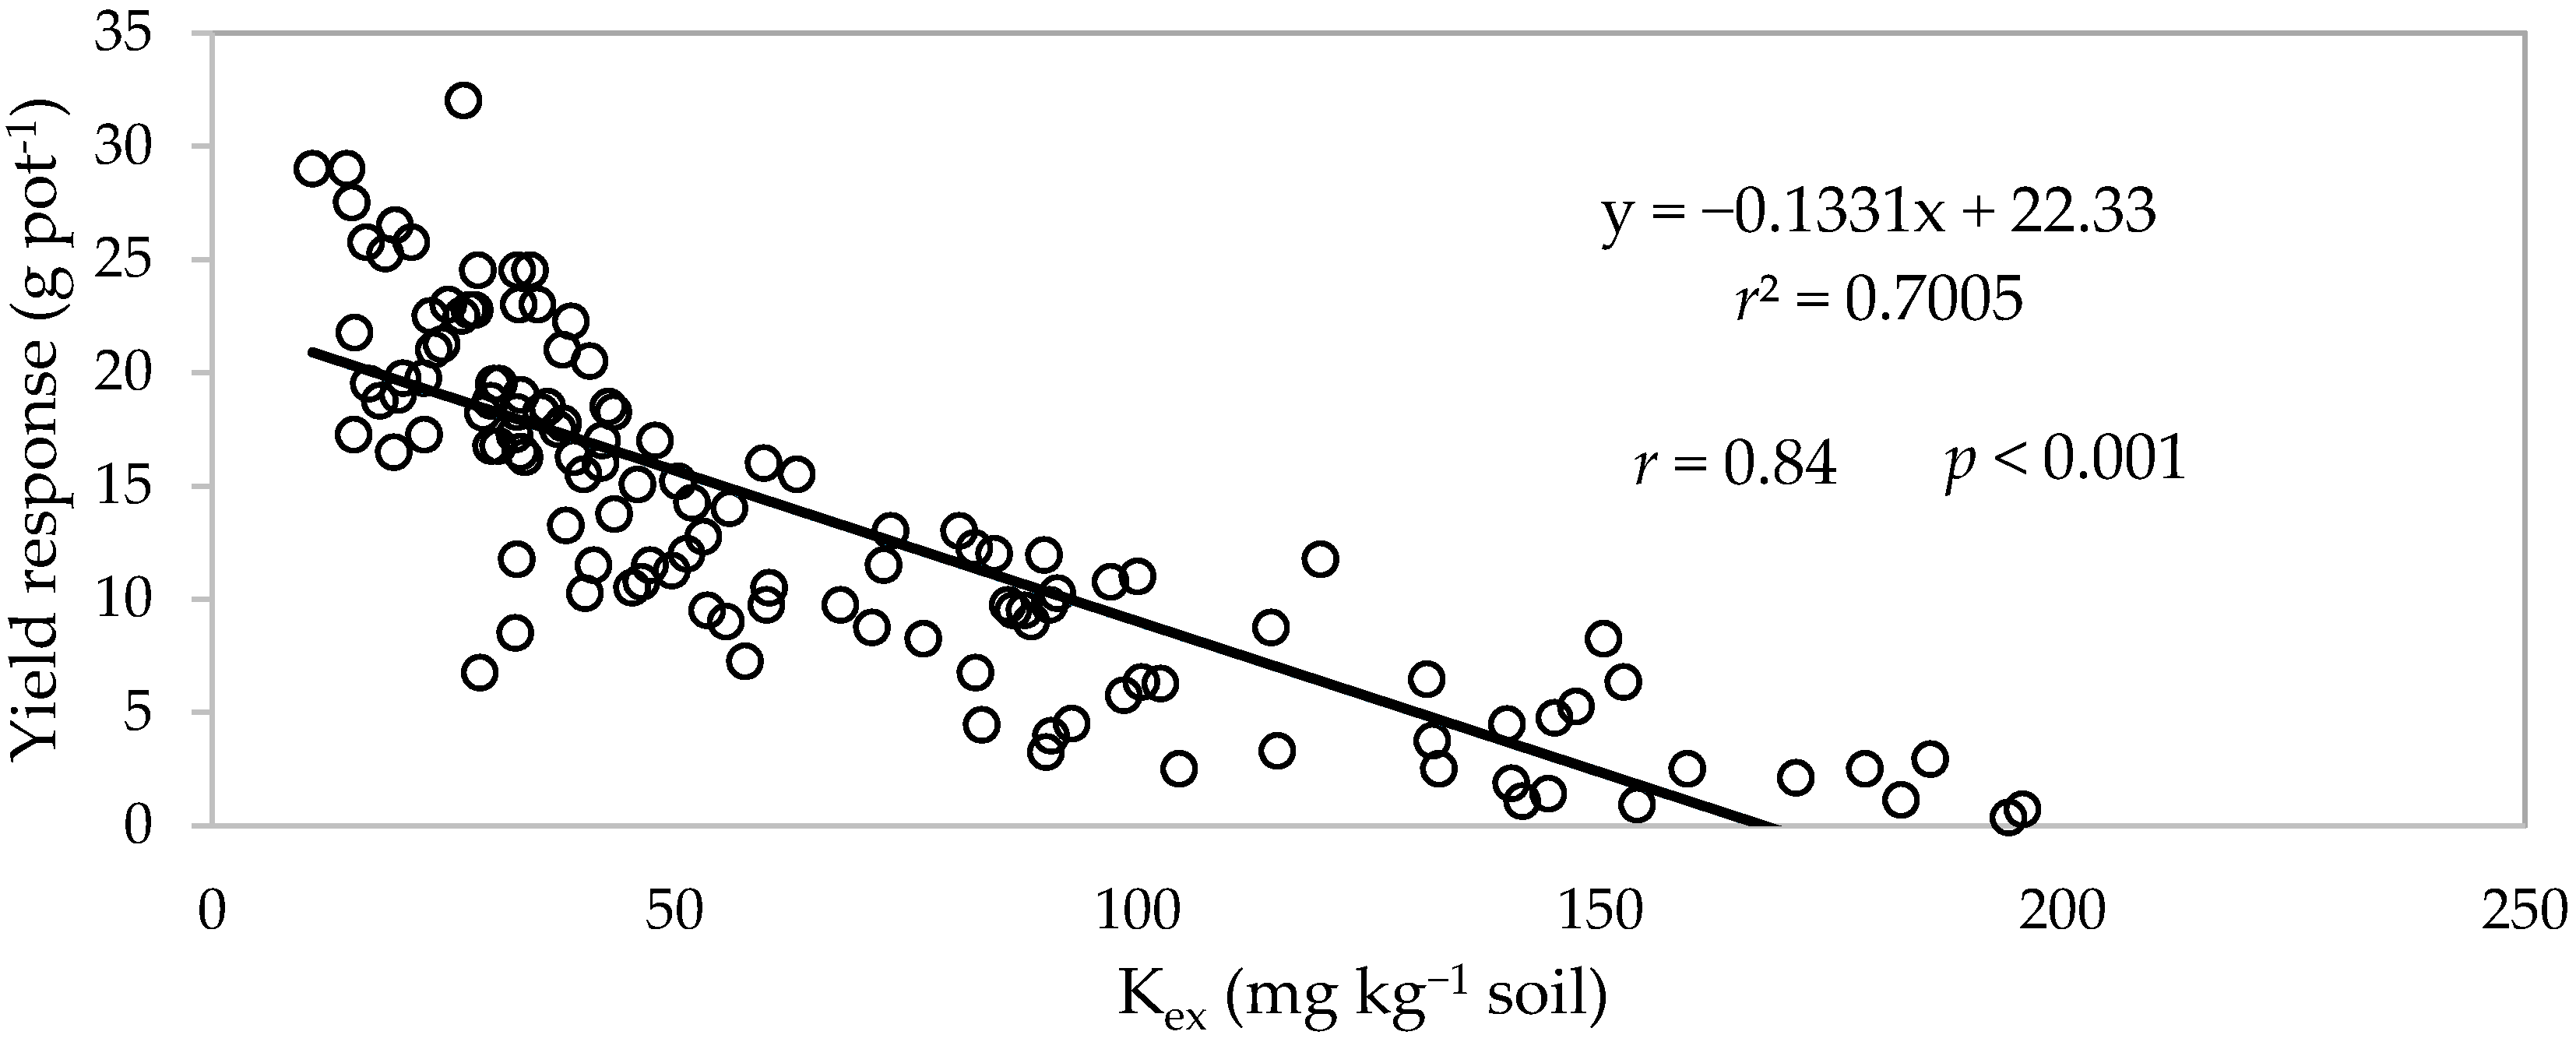
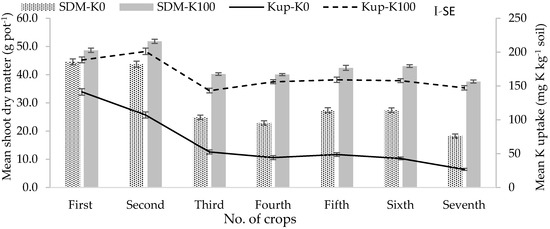
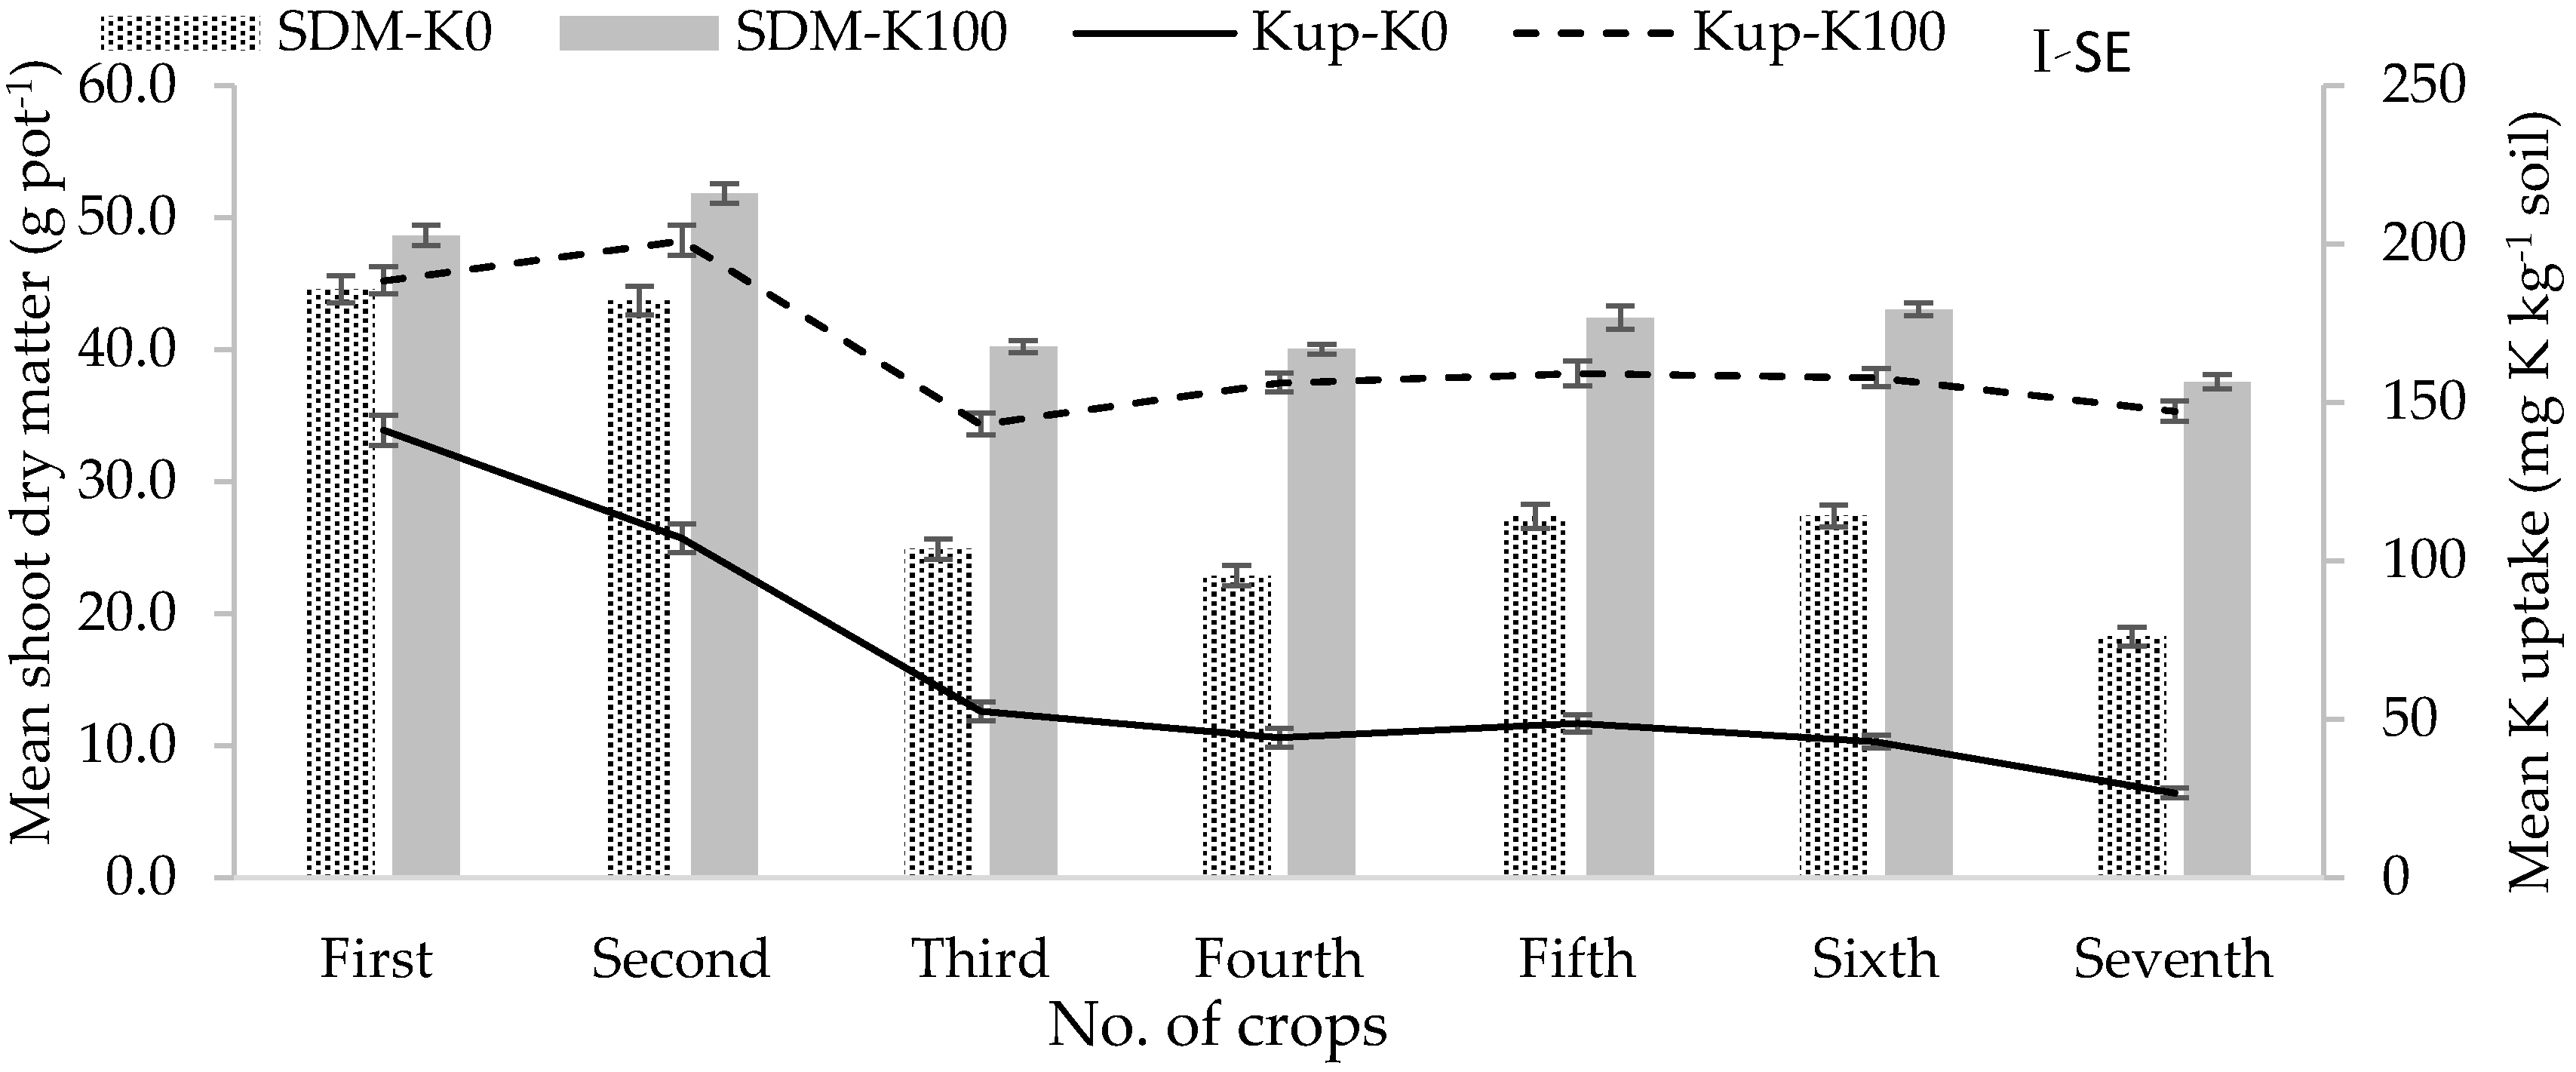
The mean shoot dry matter yield of maize over seven successive cropping across 18 soils varied widely from 14.52 to 39.37 g pot−1 in K control pots while it was from 38.83 to 47.81 g pot−1 in K applied pots. The lowest and highest dry matter yield with no added K soils were found in Durgapur and Mithapukur soils, respectively. While the lowest and highest dry matter yield with K fertilizer added soils were found in Modhupur and Gopalpur soils, respectively (Figure 4). The contribution of K fertilizer to the increment of maize shoot dry matter over K control was considered as the shoot dry matter response to K. The mean response of shoot dry matter over seven successive cropping ranged from 4 to 16 g pot−1, with the highest response (p ≤ 0.001) in Durgapur soil and the lowest in Modhukhali. The mean response followed the order of: Durgapur > Shibganj > Barura > Godagari > Tarash > Paba > Binerpota > Jhinaidah Sadar > Modhupur > Birganj > Nawbagnj Sadar > Gopalpur > Daudkandi > Gangachara > Rangpur Sadar > Dinajpur Sadar > Mithapukur > Modhukhali. Therefore, Durgapur and Modhukhali soil appeared as the most and least responsive to K fertilization, respectively (Figure 4). There was significant (p ≤ 0.001) negative correlation (r2 = 0.70, r = −0.84) between yield response to K fertilizer and soil initial K (Figure 5). The mean shoot dry matter yield in the 18 soils without K fertilization reduced drastically from 1st to 3rd crops, decreased slightly in the 4th to 5th crop due to climatic variation, and after that gradually declined up to the 7th crop. The differences in shoot dry matter yield between the K applied soils and the no added K fertilizer soils were gradually increased with the successive cropping (Figure 6).
Figure 4.
Trends for mean shoot dry matter (SDM) and mean K uptake over successive seven rabi maize crops in pots with K0 and K100 for 18 diverse soils of Bangladesh.
Figure 5.
The relationship between initial exchangeable soil K (Kex) for 18 diverse soils of Bangladesh and yield response of rabi maize grown up to V10–V12 for seven successive crops to K fertilizer in pot experiment, Gazipur, Bangladesh.
Figure 6.
Trends for mean shoot dry matter (SDM) and mean K uptake over 18 diverse soils for seven successive cropping of rabi maize with K0 and K100 in pots in Gazipur, Bangladesh.
3.1.2. Soil K Supplying Capacity and K Depletion over Successive Cropping
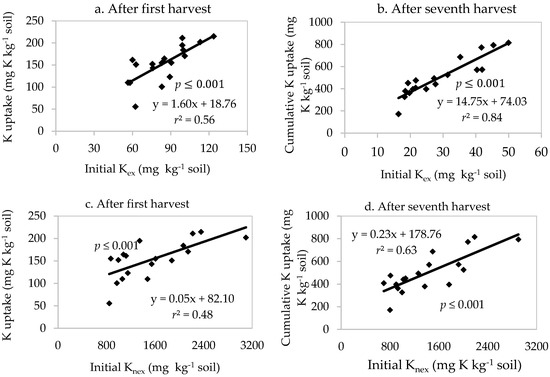
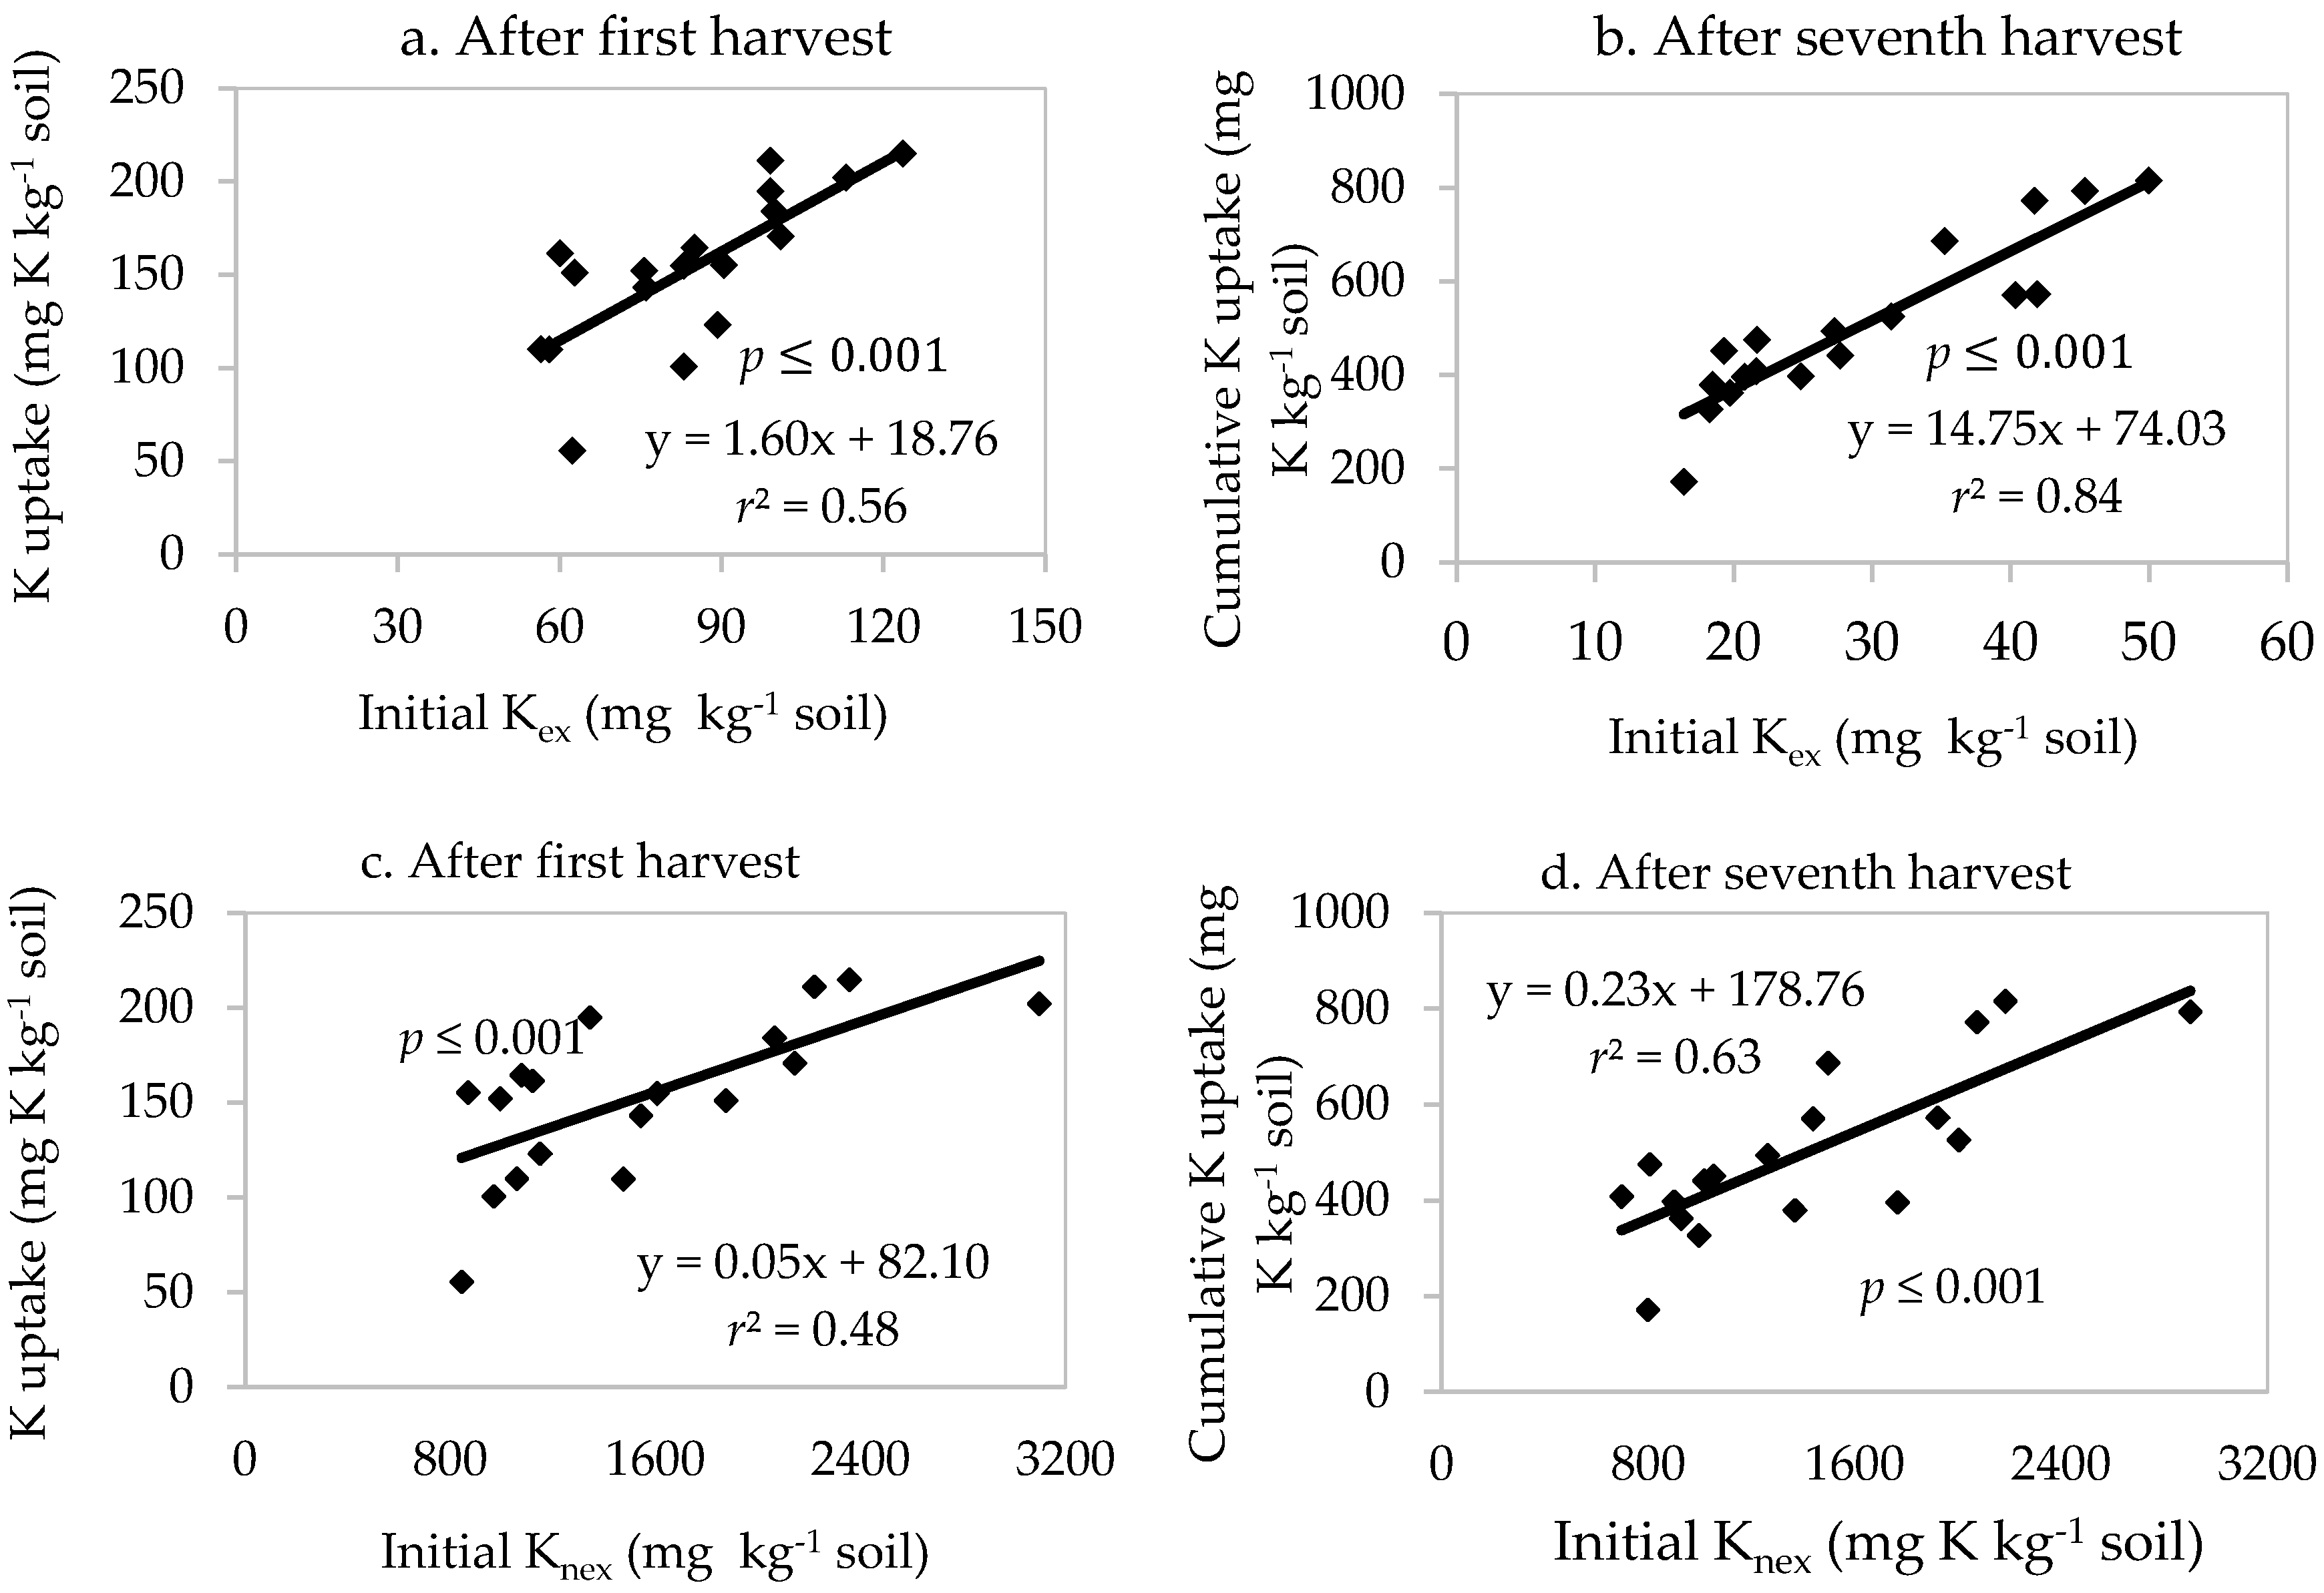
The amount of total K uptake by plants in different soils without application of K fertilizer was defined as the potential K-supplying capacity. The K uptake varied significantly due to the variation of soil K reserves among the soils. In control pots, average K uptake over seven successive crops varied from 22.1 to 107.3 mg kg−1 soil (Figure 4). The lowest K uptake was found in Durgapur and significantly higher K uptake was recorded in Modhukhali and Mithapukur soils. In general, potential K-supplying capacity of these tested soils followed the order: Modhukhali > Mithapukur > Rangpur Sadar > Dinajpur Sadar > Jhinaidah Sadr > Gangachara > Binerpota > Tarash > Gopalpur > Daudkandi > Paba > Modhupur Nawabganj > Shibganj > Birganj > Godagari > Barura > Durgapur (Figure 4). Though the trends were similar for both +K and −K soils but the K uptake was 2–3 times higher for K-treated soils than the non-treated ones (Figure 4). In control pots mean K uptake over 18 soils drastically reduced from first to the third crop but it was gradually declined from fourth to seventh crops (Figure 6). There was a strong positive relationship in both soil Kex (r2 = 0.56–0.84) and Knx (r2 = 0.48–0.63) with K uptake, but it was stronger in soil Kex than Knx. Moreover, the relationship became gradually stronger with increasing the number of successive cropping (Figure 7). And soil Kex and Knex decreased remarkably in control pots due to the growing of seven successive maize crops (Table 4).
Figure 7.
The relationship between exchangeable soil K (Kex) and K uptake (a. after first harvest and b. after seventh harvest), and between non-exchangeable K (Kex) for 18 diverse soils of Bangladesh and K uptake (c. after first harvest and d. after seventh harvest) in the above ground biomass of rabi maize grown up to V10–V12 in pot as successive crop.
Table 4.
Amount of exchangeable and non-exchangeable K before the start of the experiment (initial) and after seventh harvest (grown up to V10–V12) of maize grown in pots with K0 and K100 with 18 diverse soils, Gazipur, Bangladesh.
3.2. Field Experiment
The ANOVA for the means for all yield and yield attributing characters (except number of cobs plant−1) in all the farmers’ fields across the three districts showed highly significant effects between the treatments (p ≤ 0.001) due to farmers’ fields being scattered over a large area with variable soils and land types. There was no significant effect (p ≥ 0.05) on the interaction among the same treatment of different farmers for most of the measurable variables (except yield increase over control) in the same location due to less variability of soils and maintaining same practices for all farmers.
3.2.1. Growth and Yield Components
Plant heights were 237 ± 1.35, 186 ± 5.10 and 237 ± 3.51cm in Rangpur, Rajshahi, and Comilla, respectively, while it was 217 ± 3.20 cm over all sites (Table 5). In all sites, significantly shortest plants were found in control plots, and the height increased progressively, though not significantly, with an increase of K rate up to 120 kg K ha−1. In Rangpur and Rajshahi significantly taller plants were found with all K-treated plots except 40 kg K ha−1 plots, with slightly taller plants in MCM and NEM plots. In Comilla, however, maize plants in all K-treated plots were significantly taller than in the control plots.
Table 5.
Effect of K fertilization on growth, and yield and yield attributes of rabi maize in three field experimental sites in Bangladesh, 2012–2013.
Cob length varied from 15.0 to 17.8 cm overall sites, ranging from 17.0–20.1, 12.6–15.1 and 15.4–19.3 cm in Rangpur, Rajshahi, and Comilla, respectively (Table 5). Cob length increased progressively with increase of K fertilizer rate up to 120 kg ha−1. In all locations, cobs were significantly longer for all levels of K and MCM- and NEM-based recommendations than in control. The longest cob was found with 120 kg K ha−1 plots in Rangpur and MCM-based fertilizer recommendation (88 kg K ha−1) in Rajshahi, though it was statically identical with the NEM-based recommendation in all locations (Table 5).
The cob girth was 16.5 ± 0.27, 14.78 ± 0.10 and 15.6 ± 0.22 cm in Rangpur, Rajshahi, and Comilla, respectively (Table 5). Cob girth increased progressively with the increase of K rates up to 120 kg K ha−1. Cob girth in control plots was lower than other treatments in all sites though it was only statistically lower to 120 and 160 kg K ha−1 treated plots in Rangpur. The highest cob girth for 120 kg K ha−1 was found in Rangpur and Rajshahi and in NE fertilizer recommended plots in Comilla, though it was statically identical to the MCM fertilizer recommended plots in all locations. In Rajshahi and Comilla, except control, all treatments were statistically identical.
The number of grains cob−1 was 495 ± 9.82, 367 ± 3.09 and 442 ± 17.05 in Rangpur, Rajshahi, and Comilla, respectively. The number of grains cob−1 increased progressively with the increase of K rate up to 120 kg ha−1. It was the highest for the NEM-based recommendation in Rangpur and Comilla, 160 kg K ha−1 treated plots in Rajshahi, though it was statistically identical to all K levels and MCM- and NEM-based fertilizer recommendations (Table 5).
The weight of 1000-grains varied significantly among the treatments, ranging 314 ± 7.03, 3121 ± 8.61 and 307 ± 3.68 g in Rangpur, Rajshahi, and Comilla, respectively. Across the sites, it varied significantly (p < 0.001) from 252 g in K0 to 339 g in NEM based recommendation plot. The results showed that NEM-based fertilizer recommendation resulted in heaviest grains in all locations, followed by all levels of K and MCM-based recommendation (Table 5).
The average grain yields across all treatments were 9.18 ± 0.33, 7.67 ± 0.25 and 6.60 ± 0.26 t ha−1 in Rangpur, Rajshahi, and Comilla, respectively. Likewise, average biomass was 18.53 ± 0.67, 15.32 ± 0.49 and 13.18 ± 0.52 t ha−1, respectively, in the three districts. The average grain and biomass yields over all districts were 7.82 ± 0.20 and 15.68 ± 0.40, respectively (Table 5). Grain and biomass yields progressively increased with the increase of K rate up to 120 kg K ha−1. Grain and biomass yields in control plots were significantly lower compared to other treatments in Rajshahi, but it was similar to 40 kg K ha−1 plots in Rangpur and Comilla. In all districts, grain and biomass yields were significantly similar for 80, 120, 160 kg K ha−1, and NEM- and MCM-based fertilizer recommendation.
Harvest index varied from 0.49 to 0.50, 0.49 to 0.52, and 0.49 to 0.51 in Rangpur, Rajshahi and Comilla, respectively. It varied significantly across treatments in Rajshahi and Comilla, but not in Rangpur. Yield response to K application across treatments varied from 17.72 to 70.47%, 22.01 to 59.33%, and 20.57 to 54.02% in Rangpur, Rajshahi, and Comilla, respectively, and when averaged across sites, it varied from 20.10 to 59.25% (Table 5).
3.2.2. Estimation of K Supplying Capacity
The average K concentration in maize grain over treatments were 0.439 ± 0.013, 0.439 ± 0.012 and 0.409 ± 0.014% in Rangpur, Rajshahi, and Comilla, respectively. Likewise, average K concentration in maize stover were 1.32 ± 0.05%, 1.21 ± 0.06% and 1.24 ± 0.05%, respectively, in the three districts. The average K concentration in grain and biomass yields over all districts were 0.429 ± 0.008 and 1.24 ± 0.03, respectively (Table 6). K concentration in maize grain and stover over sites varied from 0.309 to 0.520% and from 0.88 to 1.73%, respectively. K concentration in maize grain and stover progressively increased with the increase in K rate up to the maximum dose (160 kg K ha−1). K concentration across locations and treatments was lowest (0.31% in grain and 0.88% in stover) in control plots and highest in 160 kg K ha−1 plots (0.52% in grain and 1.73% in stover (Table 6).
Table 6.
Effect of K fertilization on K concentration and K uptake, and agronomic and recovery efficiency of K by rabi maize in three field experimental sites in Bangladesh, 2012–2013.
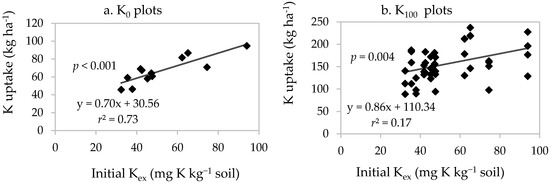
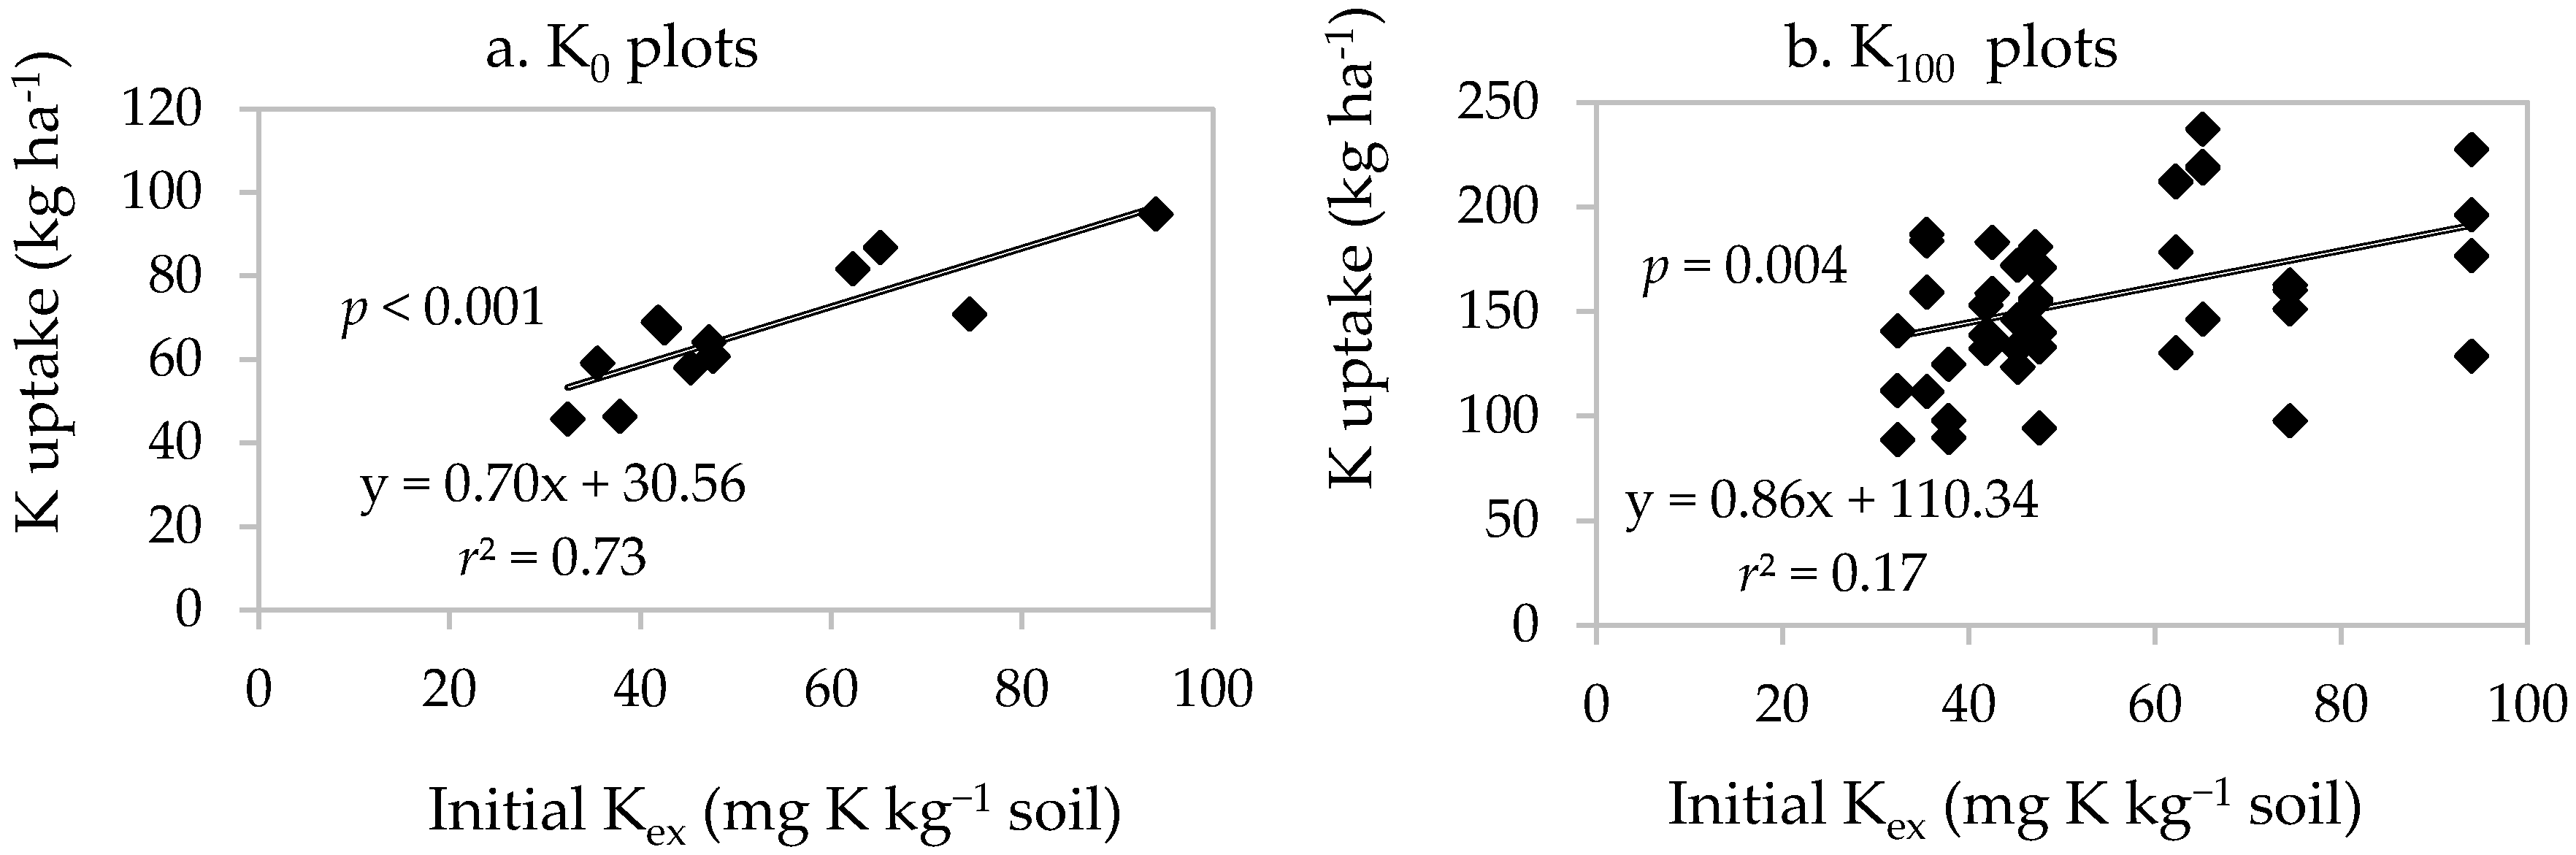
The total mean K uptake by maize (grain + stover) across treatments was from 166 ± 9.66, 128 ± 7.39, and 106 ± 6.40 kg ha−1 in Rangpur, Rajshahi, and Comilla, respectively. Total K uptake over the sites varied significantly from 67.1 to 178.3 kg K ha−1. Total K uptake progressively increased with the increase in K rate up to 160 kg K ha−1. Total K uptake by maize across treatments and locations was lowest in control plots and highest in 160 kg K ha−1. Across all locations, in both control and K-treated plots, the total K uptake, i.e., the K-supplying capacity of soils, was in the order: Rangpur > Rajshahi > Comilla, and this was similar to the results found in the pot study (Table 6). There was a strong positive linear relationship (r2 = 0.73, p < 0.001) between indigenous soil K to K uptake in without K fertilized plots (Figure 8a), but no such relationship with indigenous soil K was observed in high K fertilized plots (Figure 8b).
Figure 8.
The relationship between initial soil Kex and K uptake in (a) control plots, K0 (n = 12) and (b) K-fertilizer applied plots, K100 (n = 48) in three field experimental sites in Bangladesh. ‘n’ indicates number.
3.2.3. K-Use Efficiency
There was a significant effect of K application on agronomic efficiency (AEK) and recovery efficiency (REK) in each site and across all sites. The AEK varied significantly over control from 16.8 to 46.1, 16.2 to 34.2, and 12.9 to 26.0 in Rangpur, Rajshahi, and Comilla, respectively. Likewise, the ranges of REK were from 0.77 to 1.15, 0.73 to 1.00, and 0.50 to 0.64, respectively in the three sites. AEK and REK over the sites varied from 15.30 to 34.74 and 0.70 to 0.93, respectively, and decreased progressively with increase of K rates (Table 6). Both AEK and REK were lowest for the highest K dose (160 kg ha−1) compared to other rates. Though not significantly different, the MCM-based recommendation generally resulted in higher AEK and REK than NEM-based recommendation (Table 6).
4. Discussion
Until a few years back, there was a general perception that agricultural soils in South and South East Asia, including those in Bangladesh, were well supplied with K, and hence there was no need to apply K fertilizer to crops. But recently, many investigations, reviews and research results have shown that the intensification of agriculture in the region with little or no K application caused gradual K mining, and crop responses to K are observed in many of those countries including Bangladesh [38,39,40,41,42,43,44]. Such results suggest the need for application of K fertilizers for sustaining or increasing the crop yields. Proper application and management of K require a thorough understanding of soil K dynamics and its uptake by crops at various K inputs and outputs scenarios and for different cropping systems. It is well known that the K availability to the plants does not only depend on the size of the available K pool in the soil but also K release patterns, and its transport from soil solution to the root zone for its uptake by plants [45,46]. It is hypothesized that soils K availability to plants differ in terms of mineralogy, soil K reserves, K-supplying capacity and its allowable drawdown factors [47,48]. Thus, some soils would require more while others would require less K to grow profitable maize crops [40].
Plant available K can be assessed either by plant growth analysis or by simple chemical extraction method or by a combination of both procedures with plants grown in no-K added plots. A robust relationship (r2 = 0.82) between K uptake and grain yield was observed in no-K plots, which was considered as a good measure of soil K supply to crops [49]. When assessed by plant K uptake, it can be termed as “K-supplying capacity” whereas if assessed by extracting the soil with one or more extractions, a chemical index of available K (K-releasing capacity), can be the true index of plant available K. Consequently, many investigators reported, while “plant available K” can be equated to the K-supplying capacity of the soil, it can only be related to the K-releasing capacity. Thus, both K-releasing and K-supplying capacity can be considered the measures of the ability of a soil to supply K to plants [50,51,52]. The amount of total K uptake by plants from a soil depends on the potential of K-supplying capacity.
The K depletion pattern in this study was carried out in a pot experiment with the successive planting of maize for seven harvests to understand K-supplying capacity from soil reserves of major soils in Bangladesh. The 18 tested soils varied considerably in supporting K uptake over seven crops, ranging from 22.1–103.7 mg K kg−1 soil, and the uptake in control pots was lowest in Durgapur (Rajshahi), and highest in Mithapukur and Modhukhali (Rangpur) soils. Similar trends were observed for K-treated pots with K uptake ranging from 119.6 to 195.14 mg K kg−1. The results from this study assisted us to divide the potential K-supplying capacity of 18 soils into three categories: low, medium, and high, and corresponding to average K uptake over seven successive crops of <50, 51–80 and > 80 mg K kg−1 soil, respectively (Figure 4). According to the classification, among the tested soils, K uptake (or soil K-supply capacity) by maize was low in Durgapur, Barura, Godagari and Birganj; medium in Nawabganj, Shibganj, Modhupur, Paba, Daudkandi, Gopalpur Tarash, Binerpota, Gangachara and Jhinaidah soils; and high in Dinajpur Sadar, Rangpur Sadar, Mithapukur and Modhukhali soils (Figure 4). In line to our study, similar observations were also recorded in Guinea grass for six successive crop harvests. In that study, the tissue K concentration and K uptake in plants, and soil K-supplying capacity varied widely in various soils and was higher for K-treated than for no K-applied soils [46,53,54].
In the multi-location field experiment, growth and yield attributing characteristics of maize, except number of cobs per plant, responded to K fertilization significantly in all locations. Yield increase over control varied 18–79%, 22–59% and 21–54% in Rangpur, Rajshahi and Comilla, respectively [55]. In all locations, significantly higher grain yield was found with NEM-based fertilizer recommendation followed respectively by MCM-based recommendation, 120, 80 and 160 kg K ha−1, and lowest with no K added and 40 kg K ha−1 treatments. Both NEM- and MCM-based recommendations were based on the SSNM principles which considered previous crop’s residues and manures and fertilizers practices, and indigenous soil fertility [28]. Previous results have also shown that the MCM and NEM have great potential to estimate K fertilizer recommendation for maize, which could help to reduce the cost of production and to increase yield and profit by reducing the over or underuse of fertilizer to the crop [27,40].
K uptake by maize was governed by K content in plant tissue and above ground dry matter. The K concentration of the plant tissue was consistent with the K availability in the soil. Therefore, K uptake by maize in K-omission plots can be a reliable measure of K-supplying capacity of soil [50,51,52]. In control plots, K uptake by maize varied from 57.2 to 83.6 kg ha−1. The order of K-supplying capacity in the field experiment was Rangpur > Rajshahi > Comilla which was similar to the order observed in the pot study. The correlation between K uptake by maize at harvest and initial Kex and Knex were positive and linear. Plots of cumulative K uptake by maize from 1st to 7th harvest versus initial Kex contents showed a progressively higher utilization of NH4OAc-K by maize during the experiment (Figure 7a,b). Moreover, the highly significant r2 values (0.56 to 0.84) revealed that 56 to 84% of the K uptake by maize was governed by the initial Kex content. However, the slope (>1) of the linear regression line indicated that the initial Kex was not sufficient to meet the entire uptake requirement of maize starting from the 1st crop to the 7th crop. The value of slope (1.6 to 14.8) increased with increase in crop number revealing the gradual depletion in Kex pool and therefore, the uptake of K might have been complimented from other soil K pools also (Figure 7a,b). In the case of Knex, the lower value of the slope and r2 of a linear relationship for the 1st harvest indicated that the contribution of the Knex pool to K uptake by maize was lower than the Kex pool. But the relationship of cumulative K uptake versus Knex at 7th harvest became stronger with a higher value of slope than the 1st harvest. The value of slope and r2 increased with successive crops indicating that the K uptake dependency on the Knex pools was increased due to reduced Kex availability in the soil with successive exhaustive cropping in control pots (Figure 7c,d). A significant contribution of Knex to crop uptake was reported in other studies also. However, Knex is not measured in routine soil K test in most countries and the depletion of Knex often remain unnoticed to the detriment of soil K fertility.
The amount of K uptake by maize in the K-applied plots (99.0–178.3 kg K ha−1) was significantly higher than in control plots (67.1 kg K ha−1) across the sites. The highest K uptake occurred with 160 kg K ha−1, though MCM (75–100 kg K ha−1) resulted in significantly higher agronomic and recovery efficiency of K. The K requirements vary for different crops, varieties, and locations in which they are grown [54,56]. Other studies have also shown that crop K requirement depends on the K status and K dynamics in soils, as well as efficient K use, which depends also on the rooting pattern of different crops and varieties, and their productivity [46,53]. There is thus essential need for K to be supplied at an optimum dose and maintained to augment production and ensure to improve quality crop [27,56,57]. Nevertheless, both the concomitant increase in yield and efficiency improvement with added K are important considerations for improved K management. Finally, improving nutrient use efficiency should not be the singular goal of any sustainable nutrient management program as higher efficiencies can be achieved by less and less nutrient application. In this study, the trend is yield and efficiency increase from 40 to 80 kg K, but efficiencies drop as 120 or 160 kg of K are applied, clearly suggesting that yield improvement at these rates are not enough to improve use efficiencies also. In any improved K management programs, decision support system (DSS) tools such as MCM or NEM strategies could be the better options for improved K fertilizer management, as the current study showed that, these strategies increased K application but also increased maize yield to keep the efficiencies at higher levels. SSNM strategies, such as MCM and NEM DSS tools, can take care of adequate and balanced application of all nutrients, including K, and hence their adoption in Bangladesh and South Asia would be important not just for K management but for the management of all nutrients.
5. Conclusions
In pot study, maize responded to added K in Godagari, Durgapur, and Modhupur soils out of 18 soils from the first crop and 50% soils responding from the second crop, with remaining soils responding from the third crop onwards. The mean yield response over seven successive crops across 18 soils varied from 20 to 195%, where least and most responsive soils to K fertilizer were found in Modhukhali and Durgapur soils. In control pots, K-supplying capacity over seven successive crops varied (22.1–107.3 mg K kg soil−1) significantly and there was a significant (p < 0.001) negative correlation between yield response and indigenous K-supplying capacity. In the field validation experiment, yield and yield attributes of maize responded to K fertilizer significantly in all locations. Potassium fertilizer increased grain yield from 18 to 79%.
The current research established that the requirement of K was 111–122 kg K ha−1 for maize cultivation in Bangladesh. Total K uptake by the plot that did not receive K fertilizer in on-farm trials, considered as K-supplying capacity of the soils, was in the order: Rangpur > Rajshahi > Comilla, which was similar to the results of pot study. Thus, assessment of K-supplying capacity of major soils in Bangladesh will be useful for managing K fertility in soils and K nutrition for maize. The study provides evidence of the essentiality of adequate and balanced K application in maize in Bangladesh for sustainably improving or maintaining high yields. The results, however, have great implications for South Asia as a whole as maize is replacing rice and wheat in vast areas of the region because of its economic value and climate resilience. Although the results of the pot and field experiments provide sufficient information on the K-supplying capacity of diverse soils of, and the productivity maize for selected sites in, Bangladesh, which helps refine current K fertilizer recommendation rates to farmers, further study would be required to better understand K-supplying capacity, yield and K-use efficiency in more diverse soils and for robust recommendation to farmers across maize-growing areas of South Asia.
Author Contributions
S.I., J.T., M.S. and K.M conceived and designed the experiments; S.I., J.T and M.S. conducted the experiments; S.I. recorded the data; S.I., J.T and M.K.G. analyzed the data; S.I. and J.T. wrote the paper; S.I., J.T., M.S., K.M. and M.K.G. reviewed, edited, and approved the final manuscript.
Funding
This research was funded by International Plant Nutrition Institute (IPNI) for “Assessment of Soil Potassium Supplying Capacity from Soil Nutrient Reserves and Dissemination of Nutrient Management Technologies through Nutrient Manager” project (South Asia Office, New Delhi, India, grant number [IPNI-2010-BGD-6] and Australian Centre for International Agricultural Research (ACIAR) for “Sustainable Intensification of Rice-Maize production systems in Bangladesh” project, grant number [CIM-2007-122].
Acknowledgments
Authors give special thanks to Bangladesh Rice Research Institute (BRRI) for giving the opportunity to conduct pot experiments in their net house. Authors would also like to thank Abu Saleque (BRRI) and Roland Buresh (IRRI) for their constructive suggestions during the conduct of research. We are also grateful to farmers for providing lands for the experiments and actively involved in care and maintenance of the experiments.
Conflicts of Interest
The authors declare no conflict of interest.
References
- Shiferaw, B.; Prasanna, B.M.; Hellin, J.; Bänziger, M. Crops that feed the world 6. Past successes and future challenges to the role played by maize in global food security. Food Secur. 2011, 3, 307–327. [Google Scholar] [CrossRef] [Scilit]
- Gerland, P.; Raftery, A.E.; Ševčíková, H.; Li, N.; Gu, D.; Spoorenberg, T.; Alkema, L.; Fosdick, B.K.; Chunn, J.; Lalic, N.; et al. World population stabilization unlikely this century. Science 2014, 346, 234–237. [Google Scholar] [CrossRef] [Scilit] [PubMed]
- Bank, W. World Development Indicators 2014; World Bank: Washington, DC, USA, 2014; Volume 87, pp. 98–191. [Google Scholar]
- DAE. Krishi Diary; Agricultural Information Services, Department of Agriculture Extension (DAE), Ministry of Agriculture, Khamar Bari: Dhaka, Bangladesh, 2018.
- Barber, S.A. Potassium availability at the soil-root interface and factors influencing potassium uptake. In Potassium in Agriculture; Munson, R.D., Ed.; American Society of Agronomy: Madison, WI, USA, 1985; pp. 309–324. [Google Scholar]
- Dobermann, A.; Cassman, K.G.; Mamaril, C.P.; Sheehy, J.E. Management of phosphorus, potassium, and sulfur in intensive, irrigated lowland rice. Field Crop. Res. 1998, 56, 113–138. [Google Scholar] [CrossRef] [Scilit]
- Regmi, A.P.; Ladha, J.K.; Pathak, H.; Pasuquin, E.; Bueno, C.; Dawe, D.; Hobbs, P.R.; Joshy, D.; Maskey, S.L.; Pandey, S.P. Yield and Soil Fertility Trends in a 20-Year Rice-Rice-Wheat Experiment in Nepal. Soil Sci. Soc. Am. J. 2002, 66, 857. [Google Scholar] [CrossRef]
- Srivastava, S.; Raghavareddy Rupa, T.; Swarup, A.; Singh, D. Effect of long-term fertilization and manuring on potassium release properties in a Typic Ustochrept. J. Plant Nutr. Soil Sci. 2002, 165, 352–356. [Google Scholar] [CrossRef] [Scilit]
- Singh, B.; Singh, Y.; Imas, P.; Jian-chang, X. Potassium Nutrition of the Rice-Wheat Cropping System. Adv. Agron. 2001, 81, 203–259. [Google Scholar]
- Timsina, J.; Jat, M.L.; Majumdar, K. Rice-maize systems of South Asia: Current status, future prospects and research priorities for nutrient management. Plant Soil 2010, 335, 65–82. [Google Scholar] [CrossRef] [Scilit]
- Doboerman, A.; Fairhurst, T.H. Nutrient Disorders & Nutrient Management, 1st ed.; Potash & Phosphate Institute (PPI)-Potash & Phosphate Institute of Canada (PPIC): Norcross, GA, Canada; International Rice Institute (IRRI): Los Baños, Philippines, 2000; ISBN 9810427425. [Google Scholar]
- Ali, M.M.; Saheed, S.M.; Kubota, D.; Masunaga, T.; Wakatsuki, T. Soil degradation during the period 1967–1995 in Bangladesh. Soil Sci. Plant Nutr. 1997, 43, 879–890. [Google Scholar] [CrossRef] [Scilit]
- Saleque, M.A.; Saha, P.K.; Panaullah, G.M.; Bhuiyan, N.I. Response of wetland rice to potassium in farmers’ fields of the Barind tract of Bangladesh. J. Plant Nutr. 1998, 21, 39–47. [Google Scholar] [CrossRef] [Scilit]
- Majumdar, K.; Zingore, S.; Garcia, F.; Johnston, A.M. Improving nutrient management for sustainable intensifi cation of maize. In Achieving Sustainable Cultivation of Maize; Burleigh Dodds Science Publishing: Sawston, UK, 2017; Volume 2, pp. 1–32. [Google Scholar]
- Panaullah, G.M.; Timsina, J.M.A.; Saleque, M.A.; Ishaque, M.; Pathan, A.B.M.B.U.; Connor, D.J.; Saha, P.K.; Quayyum, M.A.; Humphreys, E.; Meisner, C.A. Nutrient uptake and apparent balances for rice-wheat sequences. III. Potassium. J. Plant Nutr. 2006, 29, 173–187. [Google Scholar] [CrossRef] [Scilit]
- Olk, D.C.; Cassman, K.G.; Simbahan, G.; Sta. Cruz, P.C.; Abdulrachman, S.; Nagarajan, R.; Tan, P.S.; Satawathananont, S. Interpreting fertilizer-use efficiency in relation to soil nutrient-supplying capacity, factor productivity, and agronomic efficiency. Nutr. Cycl. Agro-Ecosyst. 1999, 1621, 35–41. [Google Scholar] [CrossRef] [Scilit]
- Cassman, K.G.; Dobermann, A.R.; Walters, D.T. Agroecosystems, Nitrogen-use Efficiency, and Nitrogen Management. Agron. Hortic. 2002, 31, 132–140. [Google Scholar] [CrossRef]
- Dobermann, A. Nutrient use efficiency–measurement and management. In Fertilizer Best Management Practices, Proceedings of the IFA International Workshop on Fertilizer Best Management Practices, Brussels, Belgium, 7–9 March 2007; International Fertilizer Industry Association: Paris, France, 2007; p. 28. [Google Scholar]
- Liu, X.; He, P.; Jin, J.; Zhou, W.; Sulewski, G.; Phillips, S. Yield gaps, indigenous nutrient supply, and nutrient use efficiency of wheat in China. Agron. J. 2011, 103, 1452–1463. [Google Scholar] [CrossRef] [Scilit]
- Sparks, D.L.; Page, A.L.; Helmke, P.A.; Loeppert, R.A.; Soltanpour, P.N.; Tabatabai, M.A.; Johnston, C.T.; Sumner, M.E. Methods of soil analysis: Chemical Methods. In Chemical Methods; Fundación Hondureña de Investigación Agrícola (FHIA): Madison, WI, USA, 1996; p. 1390. ISBN 0891188258. [Google Scholar]
- ASTM D422-63(2007)e2. Report of Standard Test Method for Particle-Size Analysis of Soils; ASTM International: West Conshohocken, PA, USA, 2007; Volume D422-63, pp. 1–8. [Google Scholar]
- Brammer, H.; Antoine, J.; Kassam, A.H.; Van Velthuizen, H.T. Land Resources Appraisal of Bangladesh for Agricultural Development; FAO of United Nations: Rome, Italy, 1988; Volume II. [Google Scholar]
- Fertilizer Recommendation Guide 2012; BARC (Bangladesh Agricultural Research Council): Farmgate, Dhaka, 2012; ISBN 978-984-500-000-0.
- Ritchie, S.; Hanway, J.; Benson, G. How a Corn Plant Develops; Iowa State University of Science and Technology: Ames, IA, USA, 1989; pp. 1–25. [Google Scholar]
- Jones, J.B., Jr. Laboratory Guide for Conducting Soil Tests and Plant Analysis. In Laboratory Guide for Conducting Soil Tests and Plant Analysis, 1st ed.; CRC (Chemical Rubber Company) Press: Boca Raton, FL, USA, 2001; p. 202. ISBN 1420025295. [Google Scholar]
- Buresh, R.J.; Pampolino, M.F.; Witt, C. Field-specific potassium and phosphorus balances and fertilizer requirements for irrigated rice-based cropping systems. Plant Soil 2010, 335, 35–64. [Google Scholar] [CrossRef] [Scilit]
- Satyanarayana, T.; Kaushik, M.; Biradar, D.P. New approaches and tools for site-specific nutrient management with reference to potassium. Karnataka J. Agric. Sci. 2011, 24, 86–90. [Google Scholar]
- Anand, S.R.; Vishwanatha, J.; Rajkumar, R.H. Site Specific Nutrient Management (SSNM) Using “ Nutrient Expert ” for Hybrid Maize (Zea mays L.) Under Zero Tillage in Thungabhadra Project (TBP) Command Area of Karnataka. Int. J. Curr. Microbiol. Appl. Sci. 2017, 6, 3597–3605. [Google Scholar] [CrossRef] [Scilit]
- Witt, C.; Found, M.G. A Site-Specific Nutrient Management Approach for Irrigated, Lowland Rice in Asia. Better Crop. Int. 2016, 16, 20–24. [Google Scholar]
- Witt, C.; Pasuquin, J.M.C.A.; Dobermann, A. A Site-Specific Nutrient Management for Maize in Favorable Tropical Environments of Asia. In Proceedings of the 5th International Crop Science Congress, Brisbane, Australia, 26 September–1 October 2004; Better Crops Internationa: Jeju, Korea, April 2008; p. 257. [Google Scholar]
- Xu, X.; He, P.; Qiu, S.; Pampolino, M.F.; Zhao, S.; Johnston, A.M.; Zhou, W. Estimating a new approach of fertilizer recommendation across small-holder farms in China. Field Crop. Res. 2014, 163, 10–17. [Google Scholar] [CrossRef] [Scilit]
- Dobermann, A.; Witt, C.; Abdulrachman, S.; Gines, H.C.; Nagarajan, R.; Son, T.T.; Tan, P.S.; Wang, G.H.; Chien, N.V.; Thoa, V.T.K.; et al. Estimating indigenous nutrient supplies for site-specific nutrient management in irrigated rice. Agron. J. 2003, 95, 924–935. [Google Scholar] [CrossRef] [Scilit]
- Xu, X.; He, P.; Pampolino, M.; Johnston, A.; Qiu, S.; Zhao, S.; Chuan, L.; Zhou, W. Fertilizer recommendation for maize in China based on yield response and agronomic efficiency. Field Crop. Res. 2014, 157, 27–34. [Google Scholar] [CrossRef] [Scilit]
- Cock, J.; Yoshida, S.; Forno, D.A. Laboratory Manual for Physiological Studies of Rice. Int. Rice Res. Inst. 1976, 69–72. [Google Scholar] [CrossRef] [Scilit]
- Venables, W.N.; Smith, D.M.; R Development Core Team. R Software; R Foundation for Statistical Computing: Vienna, Austria, 2008; Volume 739, p. 409. Available online: http://www.r-project.org (accessed on 15 July 2018).
- Chambers, J.M. Software for Data Analysis Programming with R; Springer Science & Business Media: Berlin/Heidelberg, Germany, 2008; Volume 15, ISBN 9780387759357. [Google Scholar]
- Steel, R.G.D.; Torrie, J.H. Principles and Procedures of Statistics: A Biometrical Approach, 3rd ed.; McGraw-Hill: New York, NY, USA, 1997. [Google Scholar]
- Dobermann, A.; Sta. CruzK, P.C.; Cassman, K.G. Fertilizer inputs, nutrient balance, and soil nutrient-supplying power in intensive, irrigated rice systems. I. Potassium uptake and K balance. Nutr. Cycl. Agroecosyst. 1996, 46, 1–10. [Google Scholar] [CrossRef] [Scilit]
- Miah, M.A.M.; Saha, P.K.; Islam, A.; Hasan, M.N.; Nosov, V. Potassium fertilization in rice-rice and rice-wheat cropping system in Bangladesh. Bangladesh J. Agric. Environ. 2016, 4, 51–67. [Google Scholar]
- Timsina, J.; Kumar Singh, V.; Majumdar, K. Potassium management in rice-maize systems in South Asia. J. Plant Nutr. Soil Sci. 2013, 176, 317–330. [Google Scholar] [CrossRef] [Scilit]
- Islam, A.; Muttaleb, A. Effect of potassium fertilization on yield and potassium nutrition of Boro rice in a wetland ecosystem of Bangladesh. Arch. Agron. Soil Sci. 2016, 62, 1530–1540. [Google Scholar] [CrossRef] [Scilit]
- Srinivasarao, C.; Satyanarayana, T.; Venkateswarlu, B. Potassium mining in Indian agriculture: input and output balance. Karnataka J. Agric. Sci. 2011, 24, 20–28. [Google Scholar]
- Rijmpa, J.; Islam, F. Nutrient mining and its effect on crop production and environment. In Seminar on Soil Health Management: DAE-SFFP Experience; DAE-SFFP (Department of Agriculture Extension-Soil Fertility of the Paddy Fields): Dhaka, Bangladesh, 2002. [Google Scholar]
- Grzebisz, W.; Szczepaniak, W.; Potarzycki, J.; Łukowiak, R. Sustainable Management of Soil Potassium—A Crop Rotation Oriented Concept. In Soil Fertility; InTech: Rijeka, Croatia, 2012. [Google Scholar]
- Barber, S.A. Soil Nutrient Bioavailability: A Mechanistic Approach, 2nd ed.; John Wiley and Sons: New York, NY, USA, 1995; ISBN 978-0-471-58747-7. [Google Scholar]
- Darunsontaya, T.; Suddhiprakarn, A.; Kheoruenromne, I.; Prakongkep, N.; Gilkes, R. The forms and availability to plants of soil potassium as related to mineralogy for upland Oxisols and Ultisols from Thailand. Geoderma 2012, 170. [Google Scholar] [CrossRef] [Scilit]
- Jagadish, T.; Vinod, K.S.; Kaushik, M. Potassium management in rice–maize systems in South Asia. J. Plant Nutr. Soil Sci. 2013, 176, 317–330. [Google Scholar] [CrossRef] [Scilit]
- Islam, A.; Karim, A.J.M.S.; Solaiman, A.R.M.; Islam, M.S.; Saleque, M.A. Eight-year long potassium fertilization effects on quantity/intensity relationship of soil potassium under double rice cropping. Soil Tillage Res. 2017, 169, 99–117. [Google Scholar] [CrossRef] [Scilit]
- Pathak, D.S.; Aggarwal, P.K.; Rötter, R.P.; Kalra, N.; Bandyopadhaya, S.K.; Prasad, S.; van keulen, H. Modelling the quantitative evaluation of soil nutrient supply, nutrient use efficiency, and fertilizer requirements of wheat in India. Nutr. Cycl. Agroecosyst. 2003, 65, 105–113. [Google Scholar] [CrossRef] [Scilit]
- Fergus, I.F.; Martin, A.E. Studies on potassium. IV. Interspecific differences in the uptake of non-exchangeable potassium. Soil Res. 1974, 12, 147–158. [Google Scholar] [CrossRef] [Scilit]
- Memon, Y.M.; Fergus, I.F.; Hughes, J.D.; Page, D.W. Utilization of non-exchangeable soil potassium in relation to soil type, plant species and stage of growth. Soil Res. 1988, 26, 489–496. [Google Scholar] [CrossRef] [Scilit]
- Surapaneni, A.; Tillman, R.W.; Kirkman, J.H.; Gregg, P.E.H.; Roberts, A.H.C. Potassium-supplying power of selected Pallic soils of New Zealand 1. Pot trial study. N. Z. J. Agric. Res. 2002, 45, 113–122. [Google Scholar] [CrossRef] [Scilit]
- Hussain, A.; Arshad, M.; Ahmad, Z.; Ahmad, H.T.; Afzal, M.; Ahmad, M. Potassium Fertilization and Maize Physiology Potassium Fertilization Influences Growth, Physiology and Nutrients Uptake of Maize (Zea mays L.). Cercet. Agron. Mold. 2015, XLVIII, 37–50. [Google Scholar] [CrossRef] [Scilit]
- Askegaard, M.; Eriksen, J.; Johnson, A.E. Sustainable management of potassium. In Managing Soil Quality: Challenges in Modern Agriculture; Schjønning, P., Elmholt, S., Christensen, B.T., Eds.; CABI (The Centre for Agriculture and Bioscience International) Publishing: Wallingford, Oxfordshire, UK, 2004; pp. 85–102. [Google Scholar]
- Huang, S.W.; Jin, J.Y.; Tan, D.S. Crop Response to Long-Term Potassium application as affected by Potassium Supplying Power of the Selected Soils in Northern China. Commun. Soil Sci. Plant Anal. 2009, 2833–2854. [Google Scholar] [CrossRef] [Scilit]
- Sadanandan, A.K.; Peter, K.V; Hamza, S. Role of Potassium Nutrition in Improving Yield and Quality of Spice Crops in India. In Potassium for Sustainable Crop Production; Haryana and International Potash Institute: Zug, Switzerland, 2002; pp. 445–466. [Google Scholar]
- Singh, V.K.; Dwivedi, B.S.; Buresh, R.J.; Jat, M.L.; Majumdar, K.; Gangwar, B.; Govil, V.; Singh, S.K. Potassium fertilization in rice-wheat system across northern India: Crop performance and soil nutrients. Agron. J. 2013, 105, 471–481. [Google Scholar] [CrossRef] [Scilit]

© 2018 by the authors. Licensee MDPI, Basel, Switzerland. This article is an open access article distributed under the terms and conditions of the Creative Commons Attribution (CC BY) license (http://creativecommons.org/licenses/by/4.0/).