Increasing Predictive Ability by Modeling Interactions between Environments, Genotype and Canopy Coverage Image Data for Soybeans


Abstract
:1. Introduction
2. Material and Methods
2.1. SoyNAM Phenotypic and Genotypic Data
2.2. Canopy Coverage and Imagery Data Collection
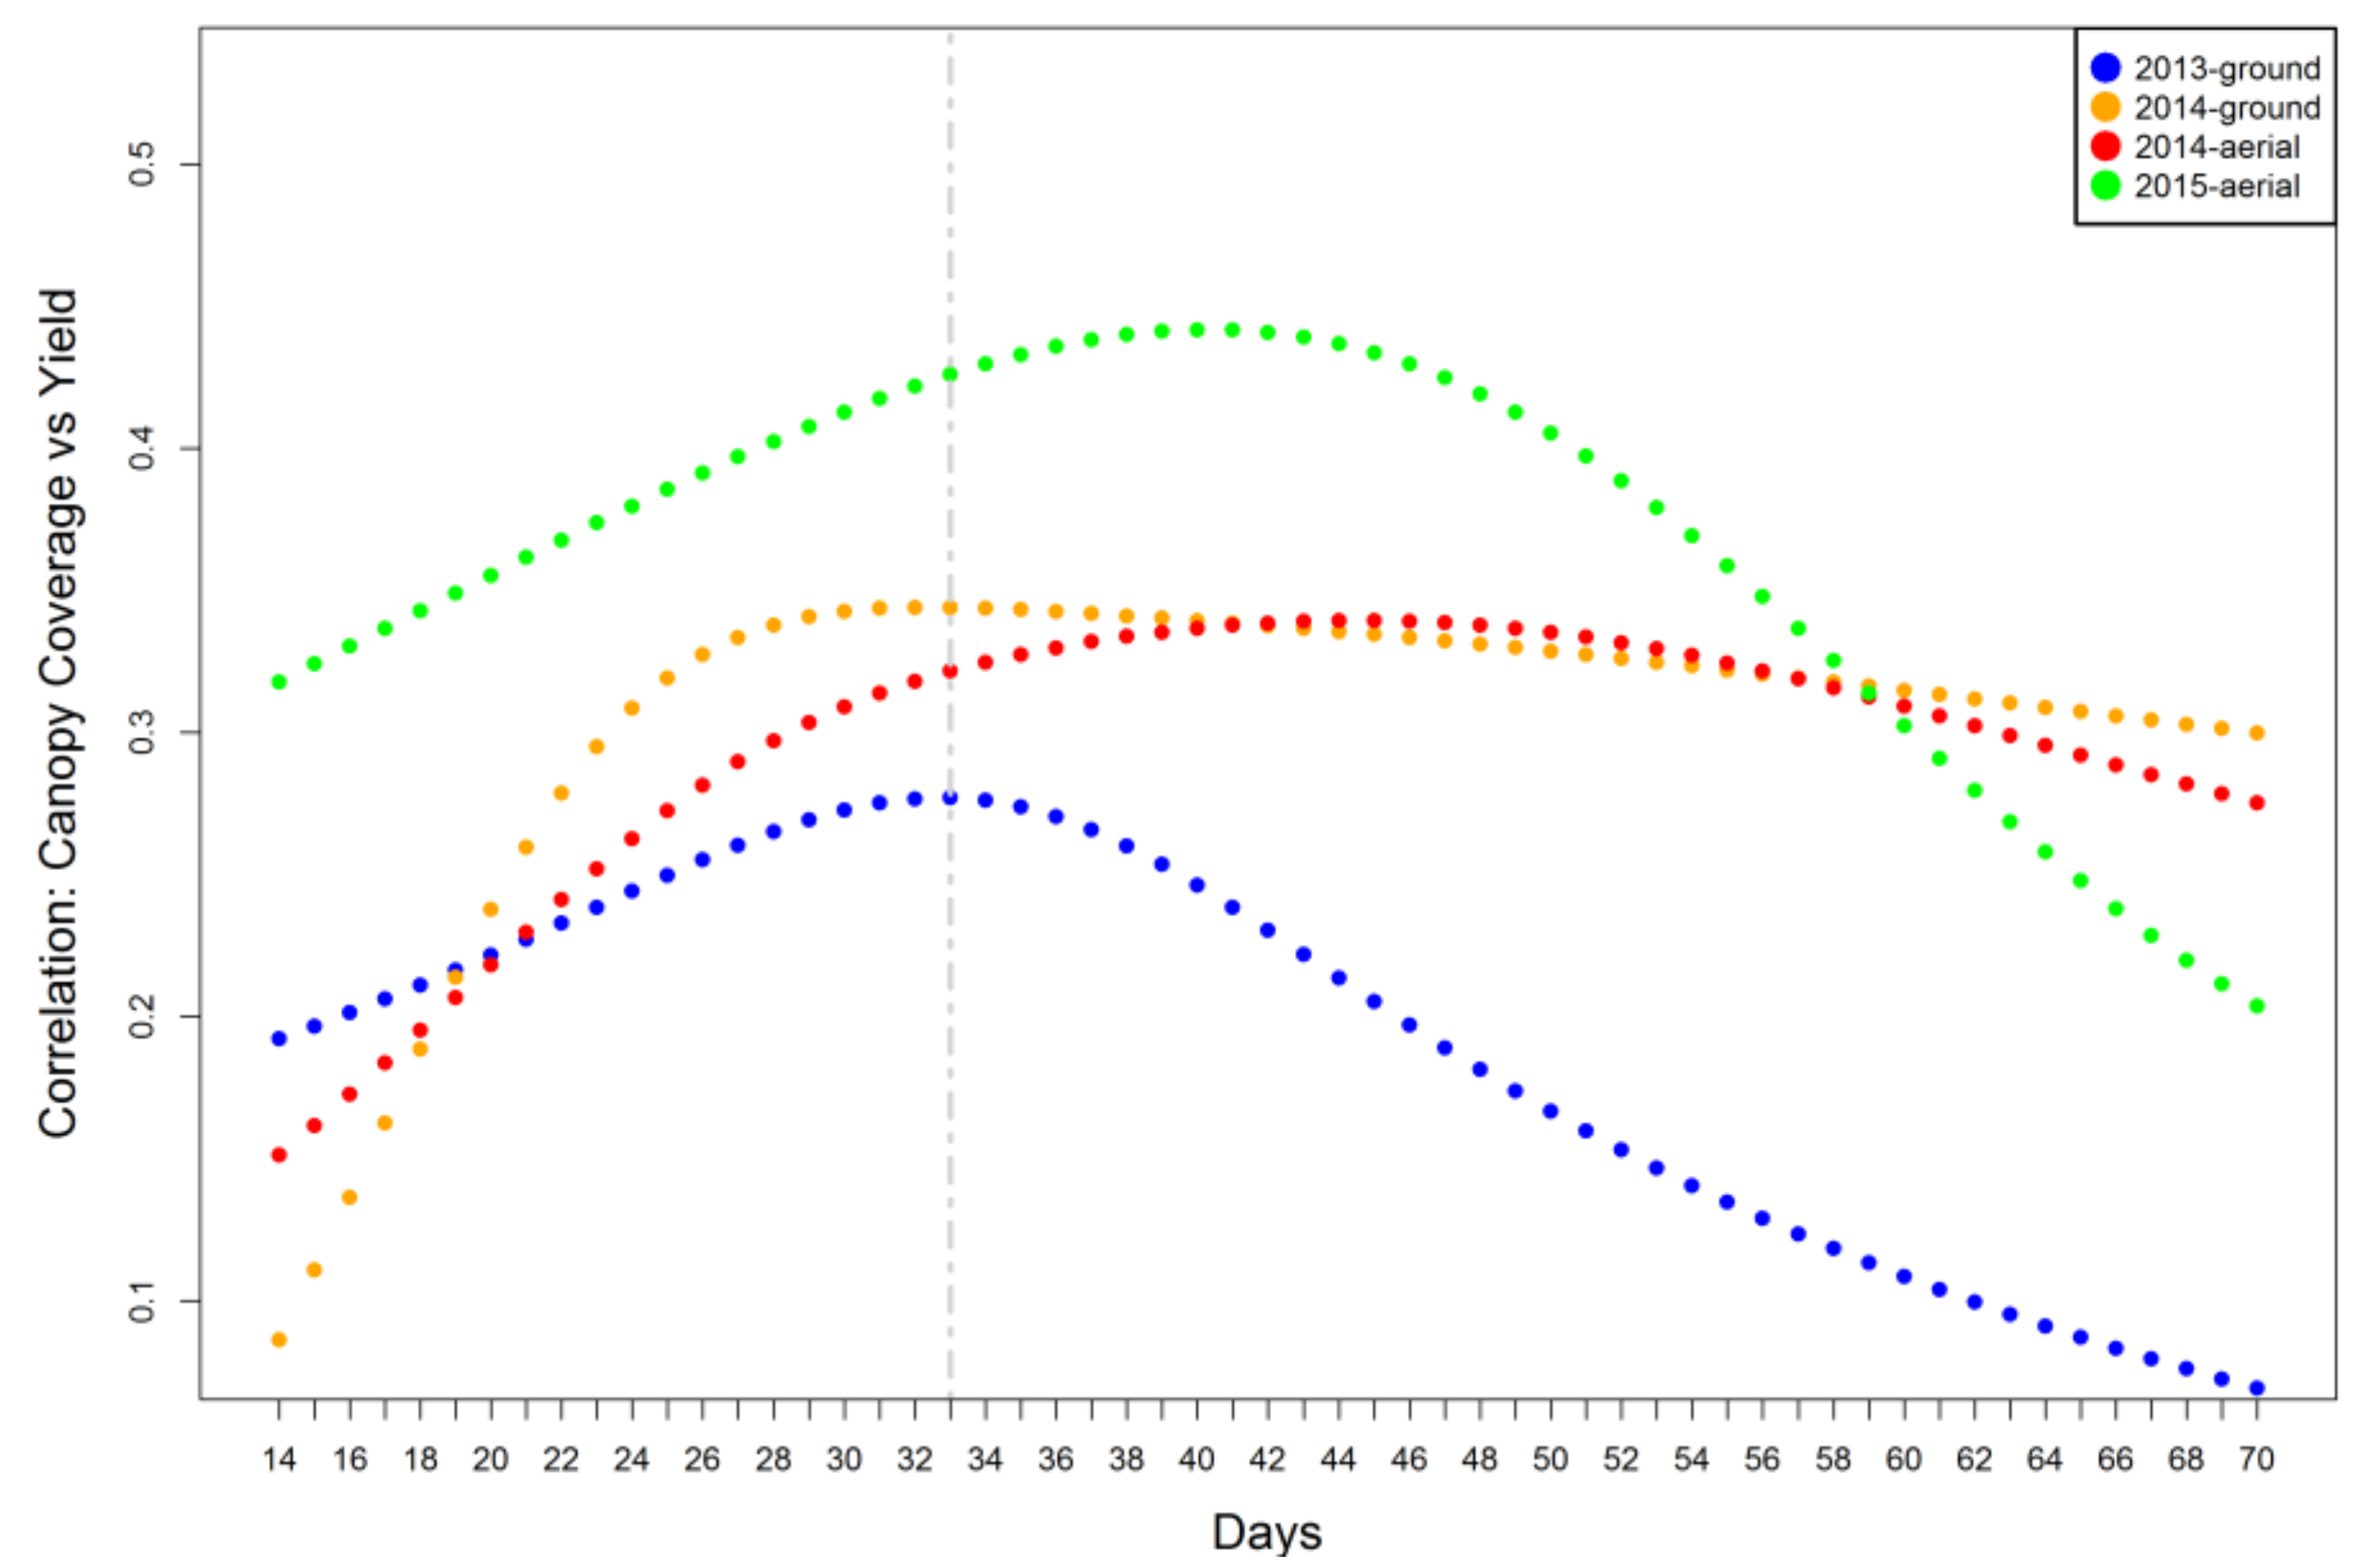
2.3. Relationship between Canopy Coverage Data and Grain Yield
2.4. Statistical Prediction Models
2.5. Main Effects Models
2.5.1. Model 1: Environment + Line
2.5.2. Model 2: Environment + Line + CC
2.5.3. Model 3: Environment + Line + Marker
2.5.4. Model 4: Environment + Line + Marker + CC
2.6. Two-Way Interaction Models
2.6.1. Model 5: Environment + Line + CC + (CC × Environment Interaction)
2.6.2. Model 6: Environment + Line + Marker + (Marker × Environment Interaction)
2.6.3. Model 7: Environment + Line + Marker + CC + (Marker × CC Interaction)
2.6.4. Model 8: Environment + Line + Marker + CC + (Marker × Environment Interaction) + (CC × Environment Interaction)
2.7. Three-Way Interaction Models
Model 9: Environment + Line + Marker + CC + (Marker × Environment Interaction) + (CC × Environment Interaction) + (Marker × CC × Environment Interaction)
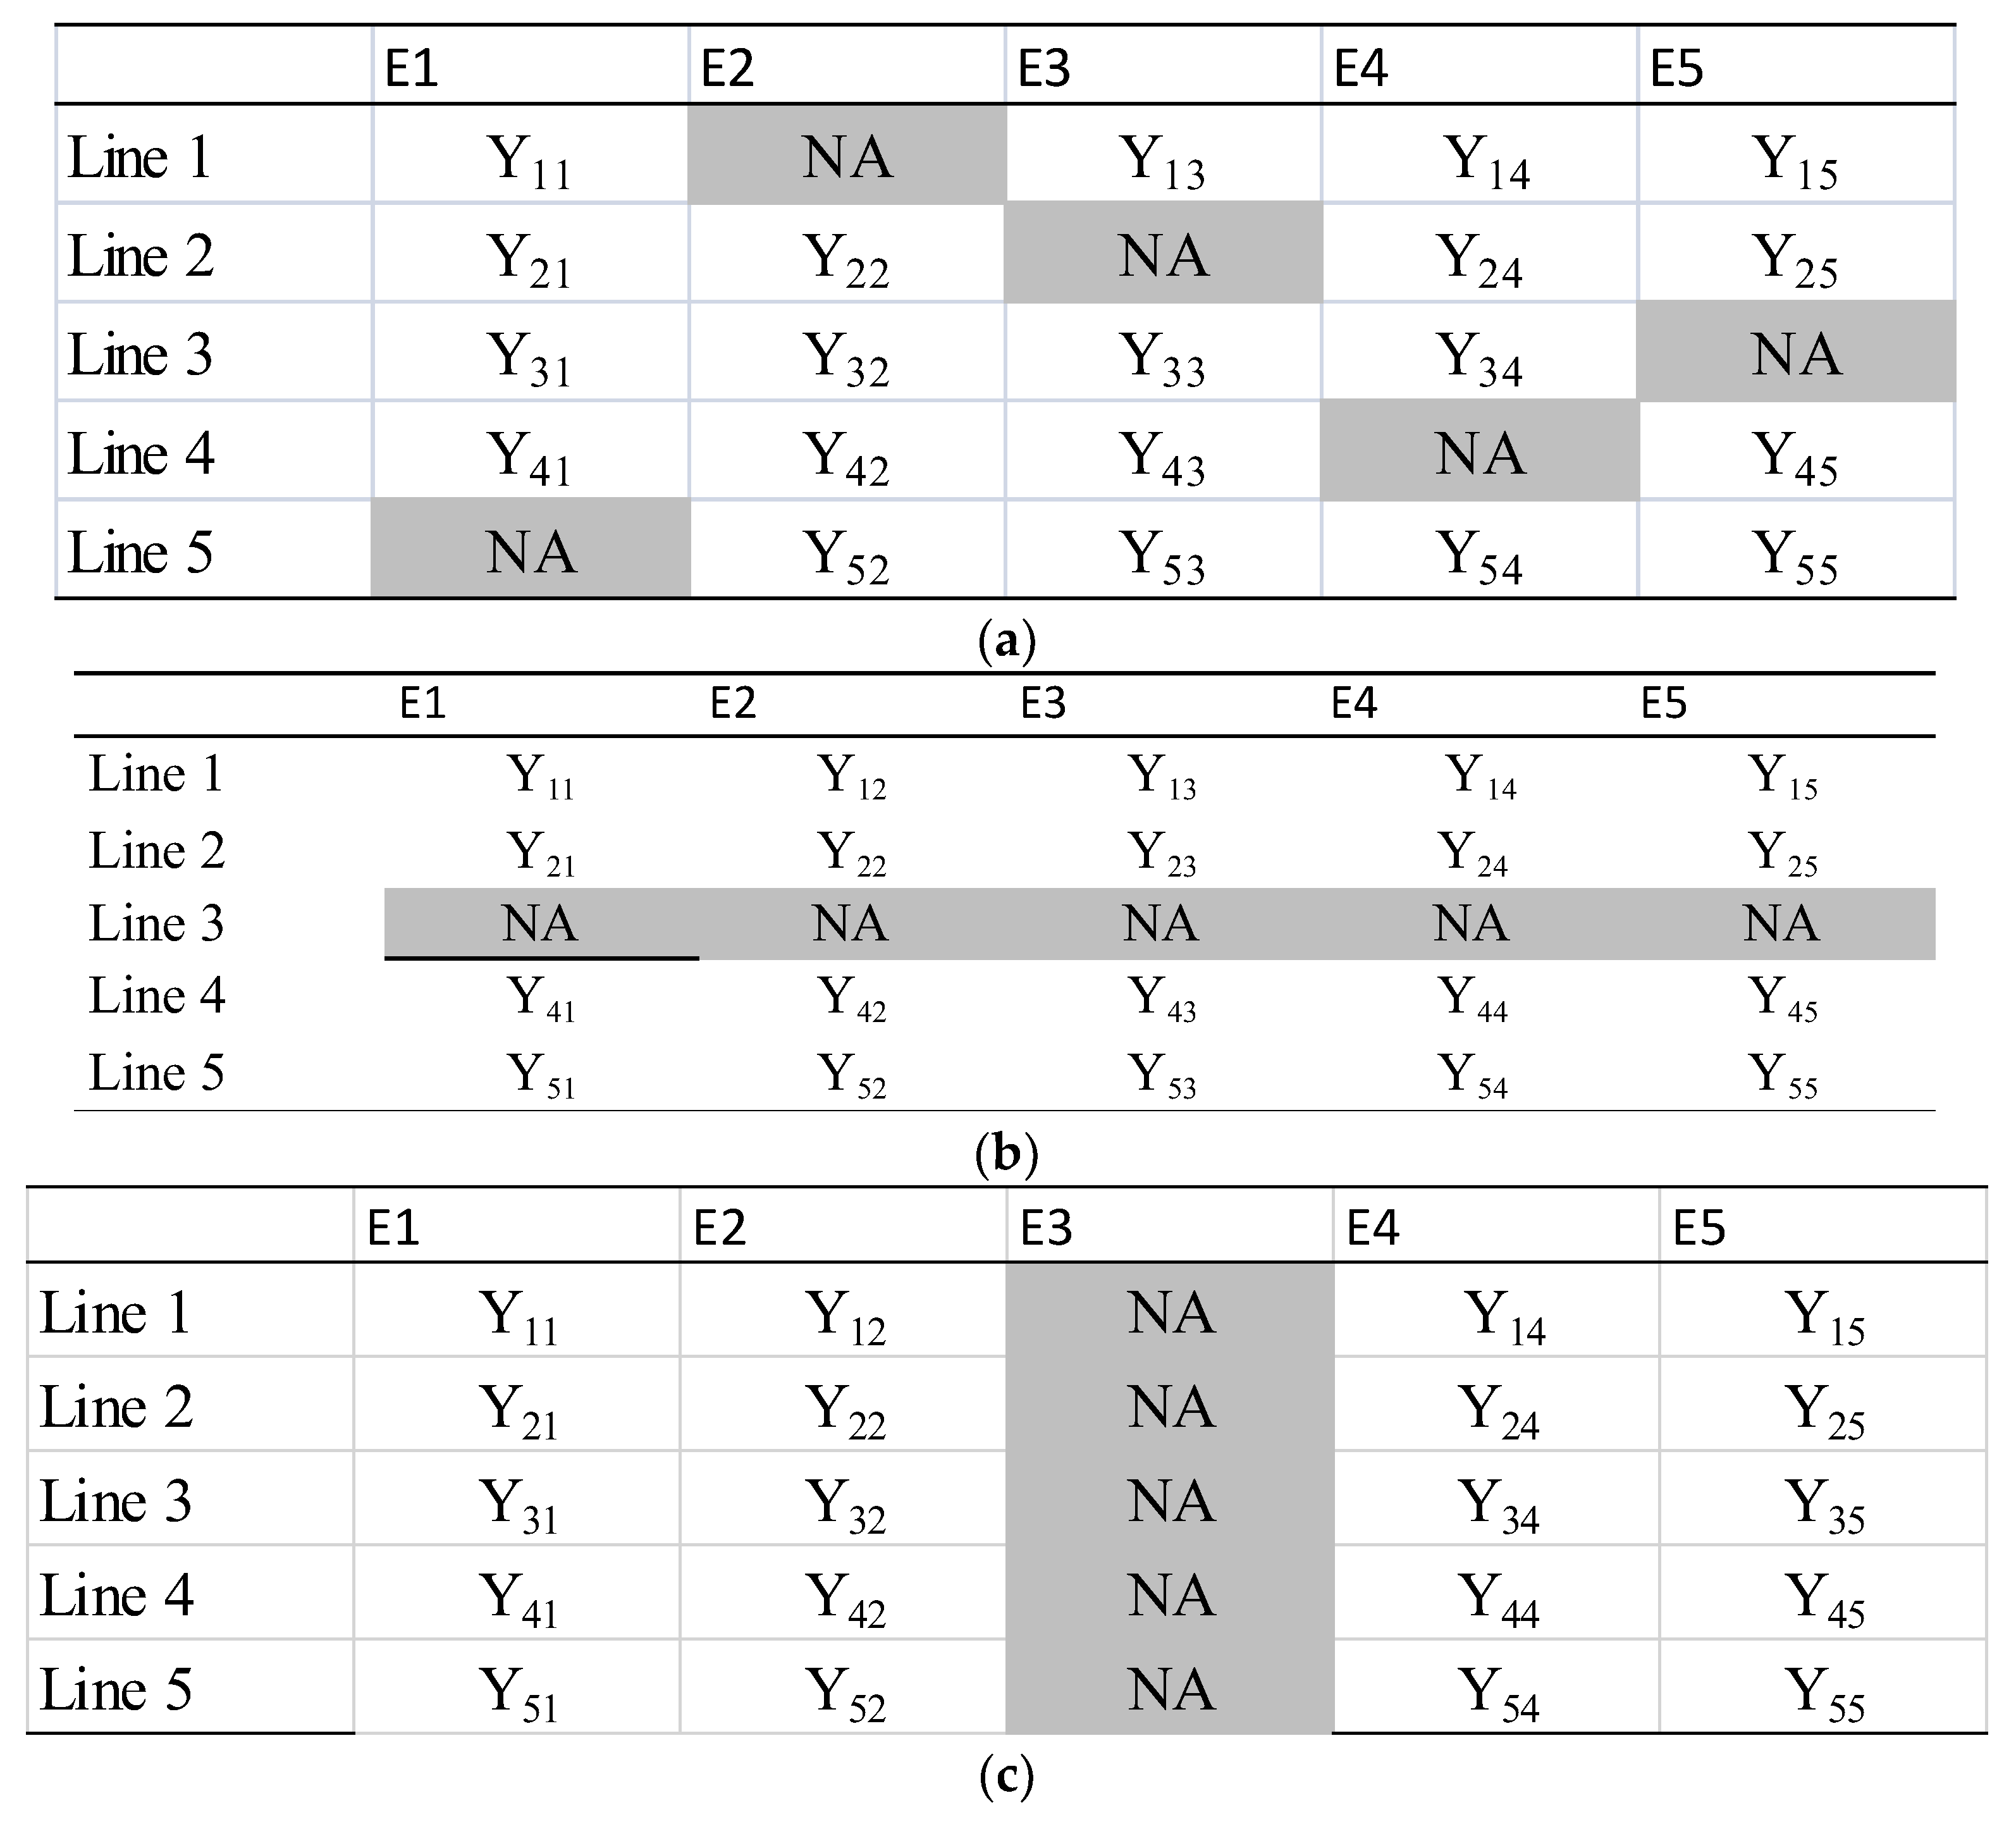
2.8. Description of Cross-Validation Schemes Implemented for Assessing Predictive Ability
3. Results and Discussion
3.1. Analysis of Variance Components
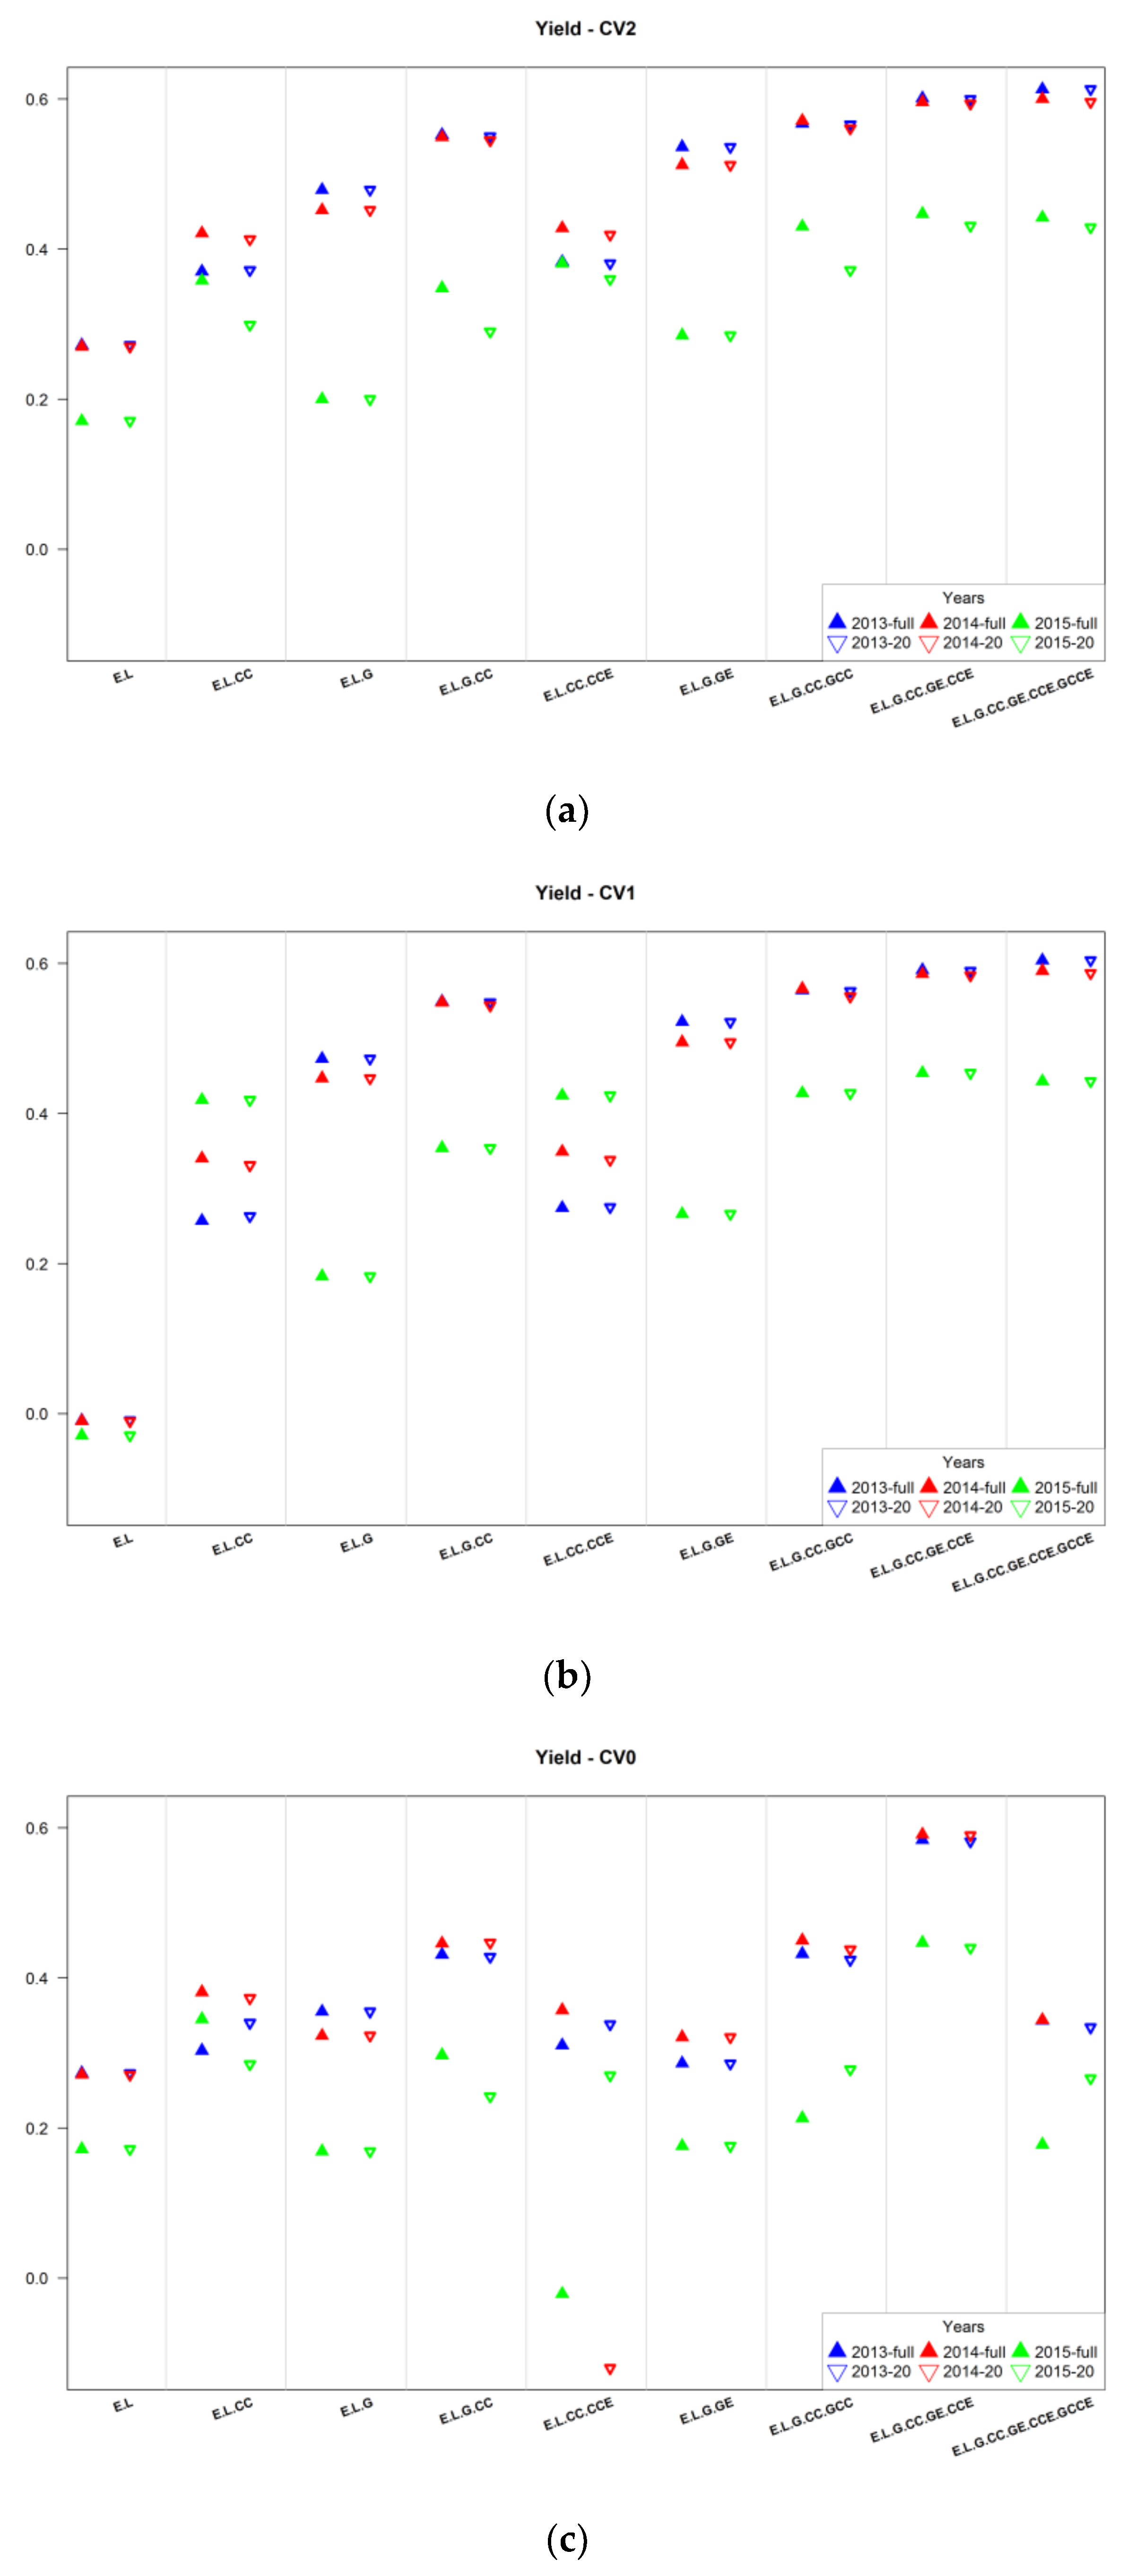
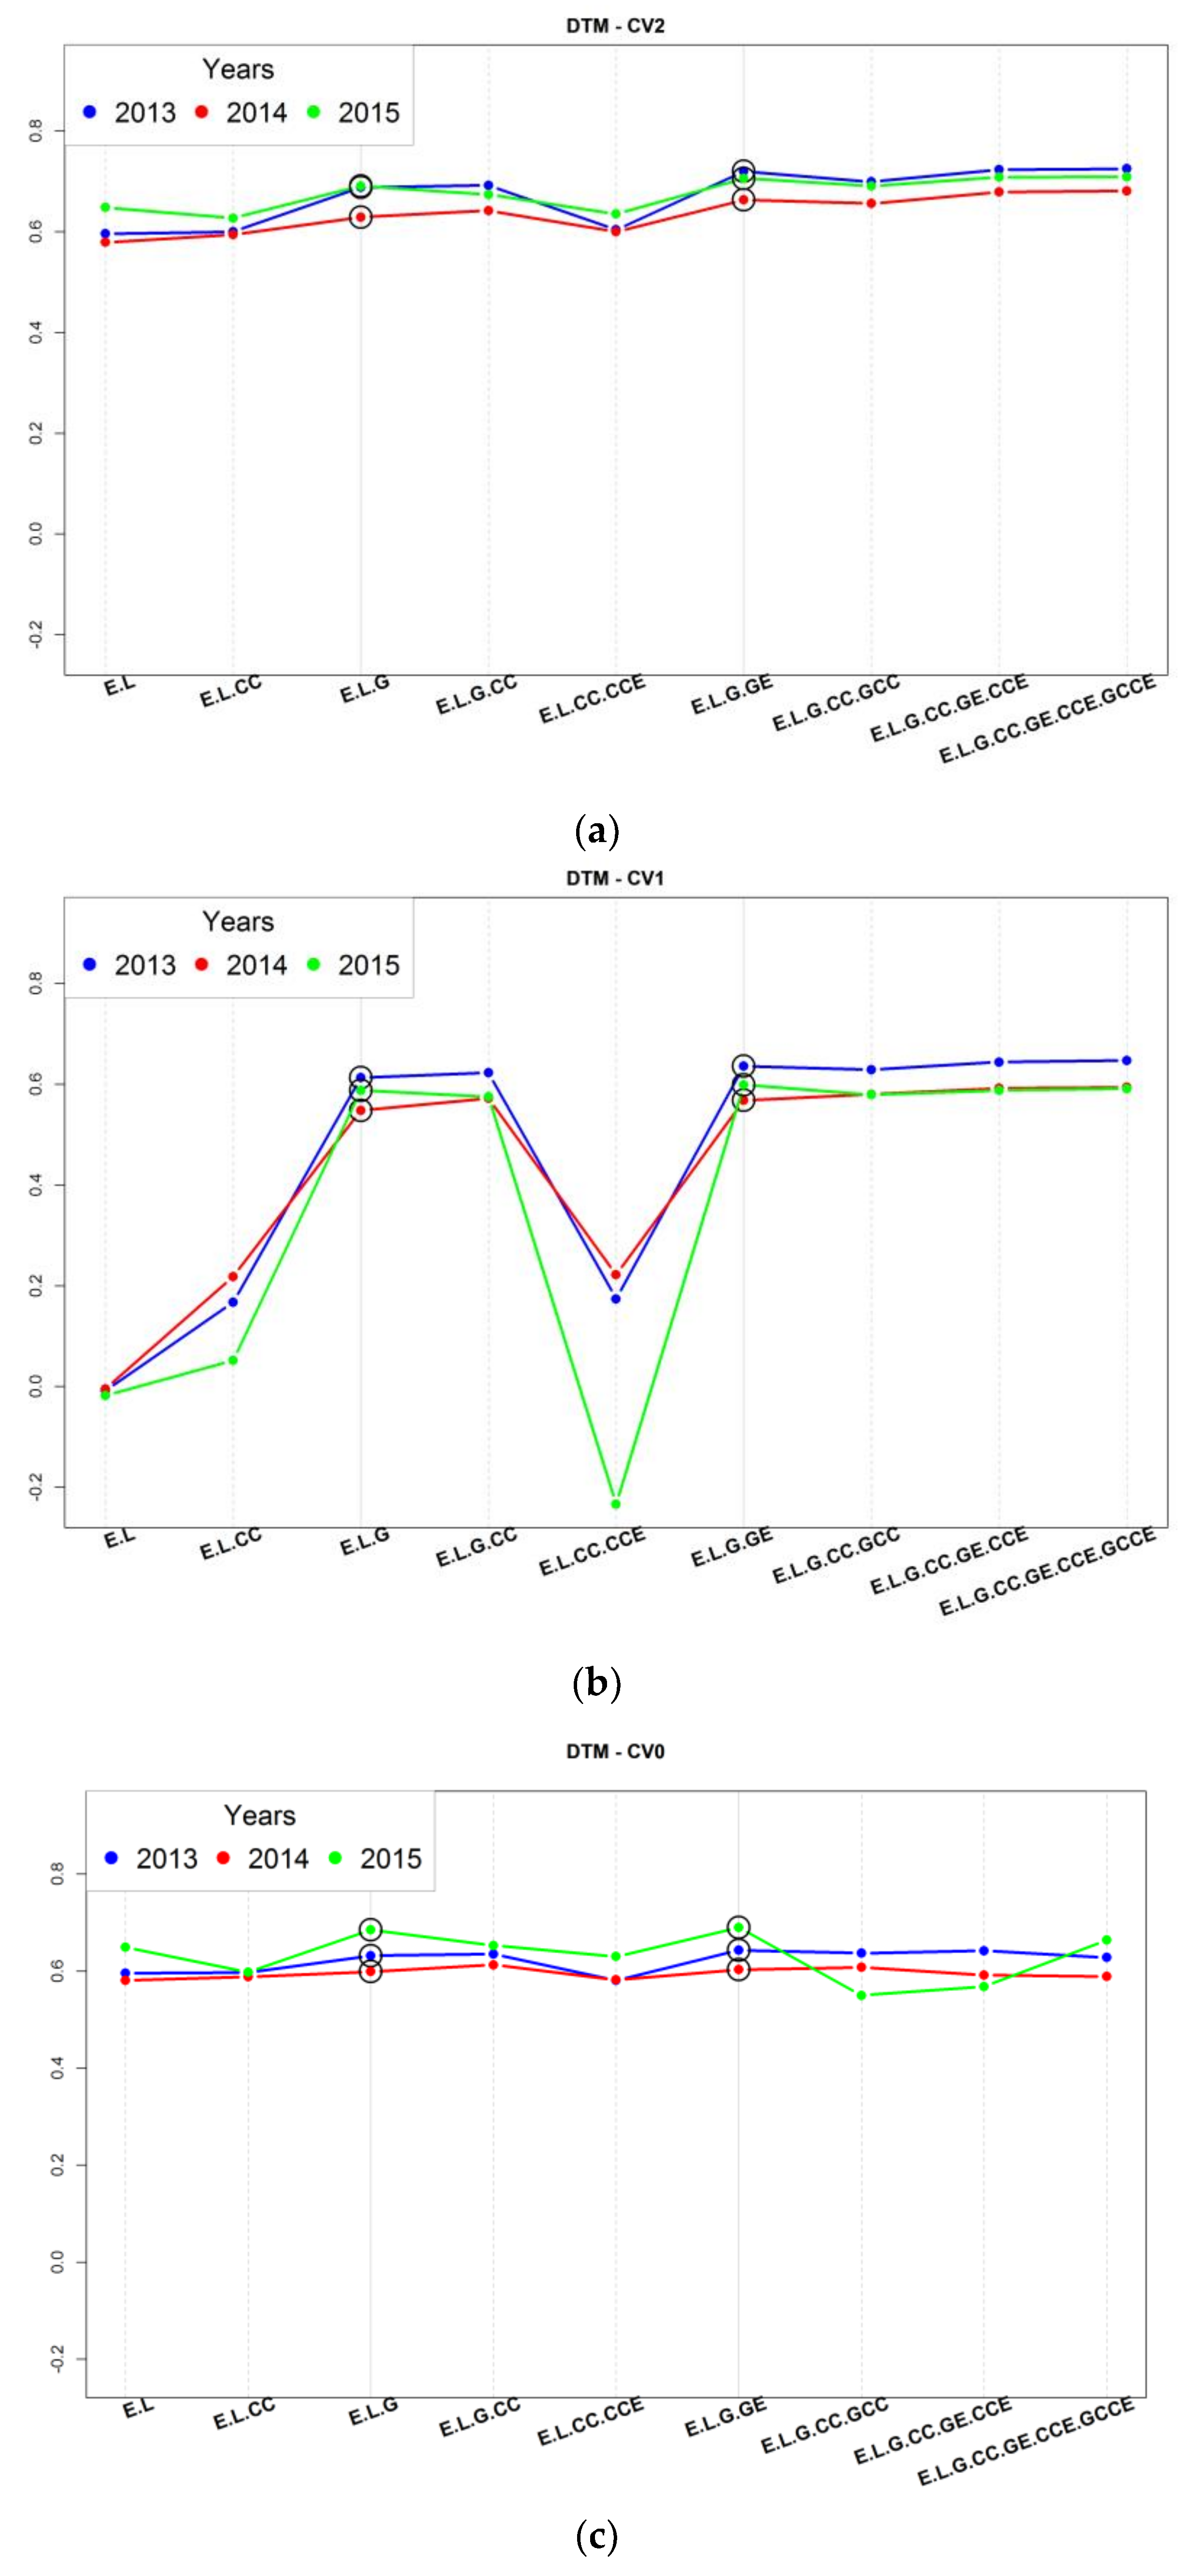
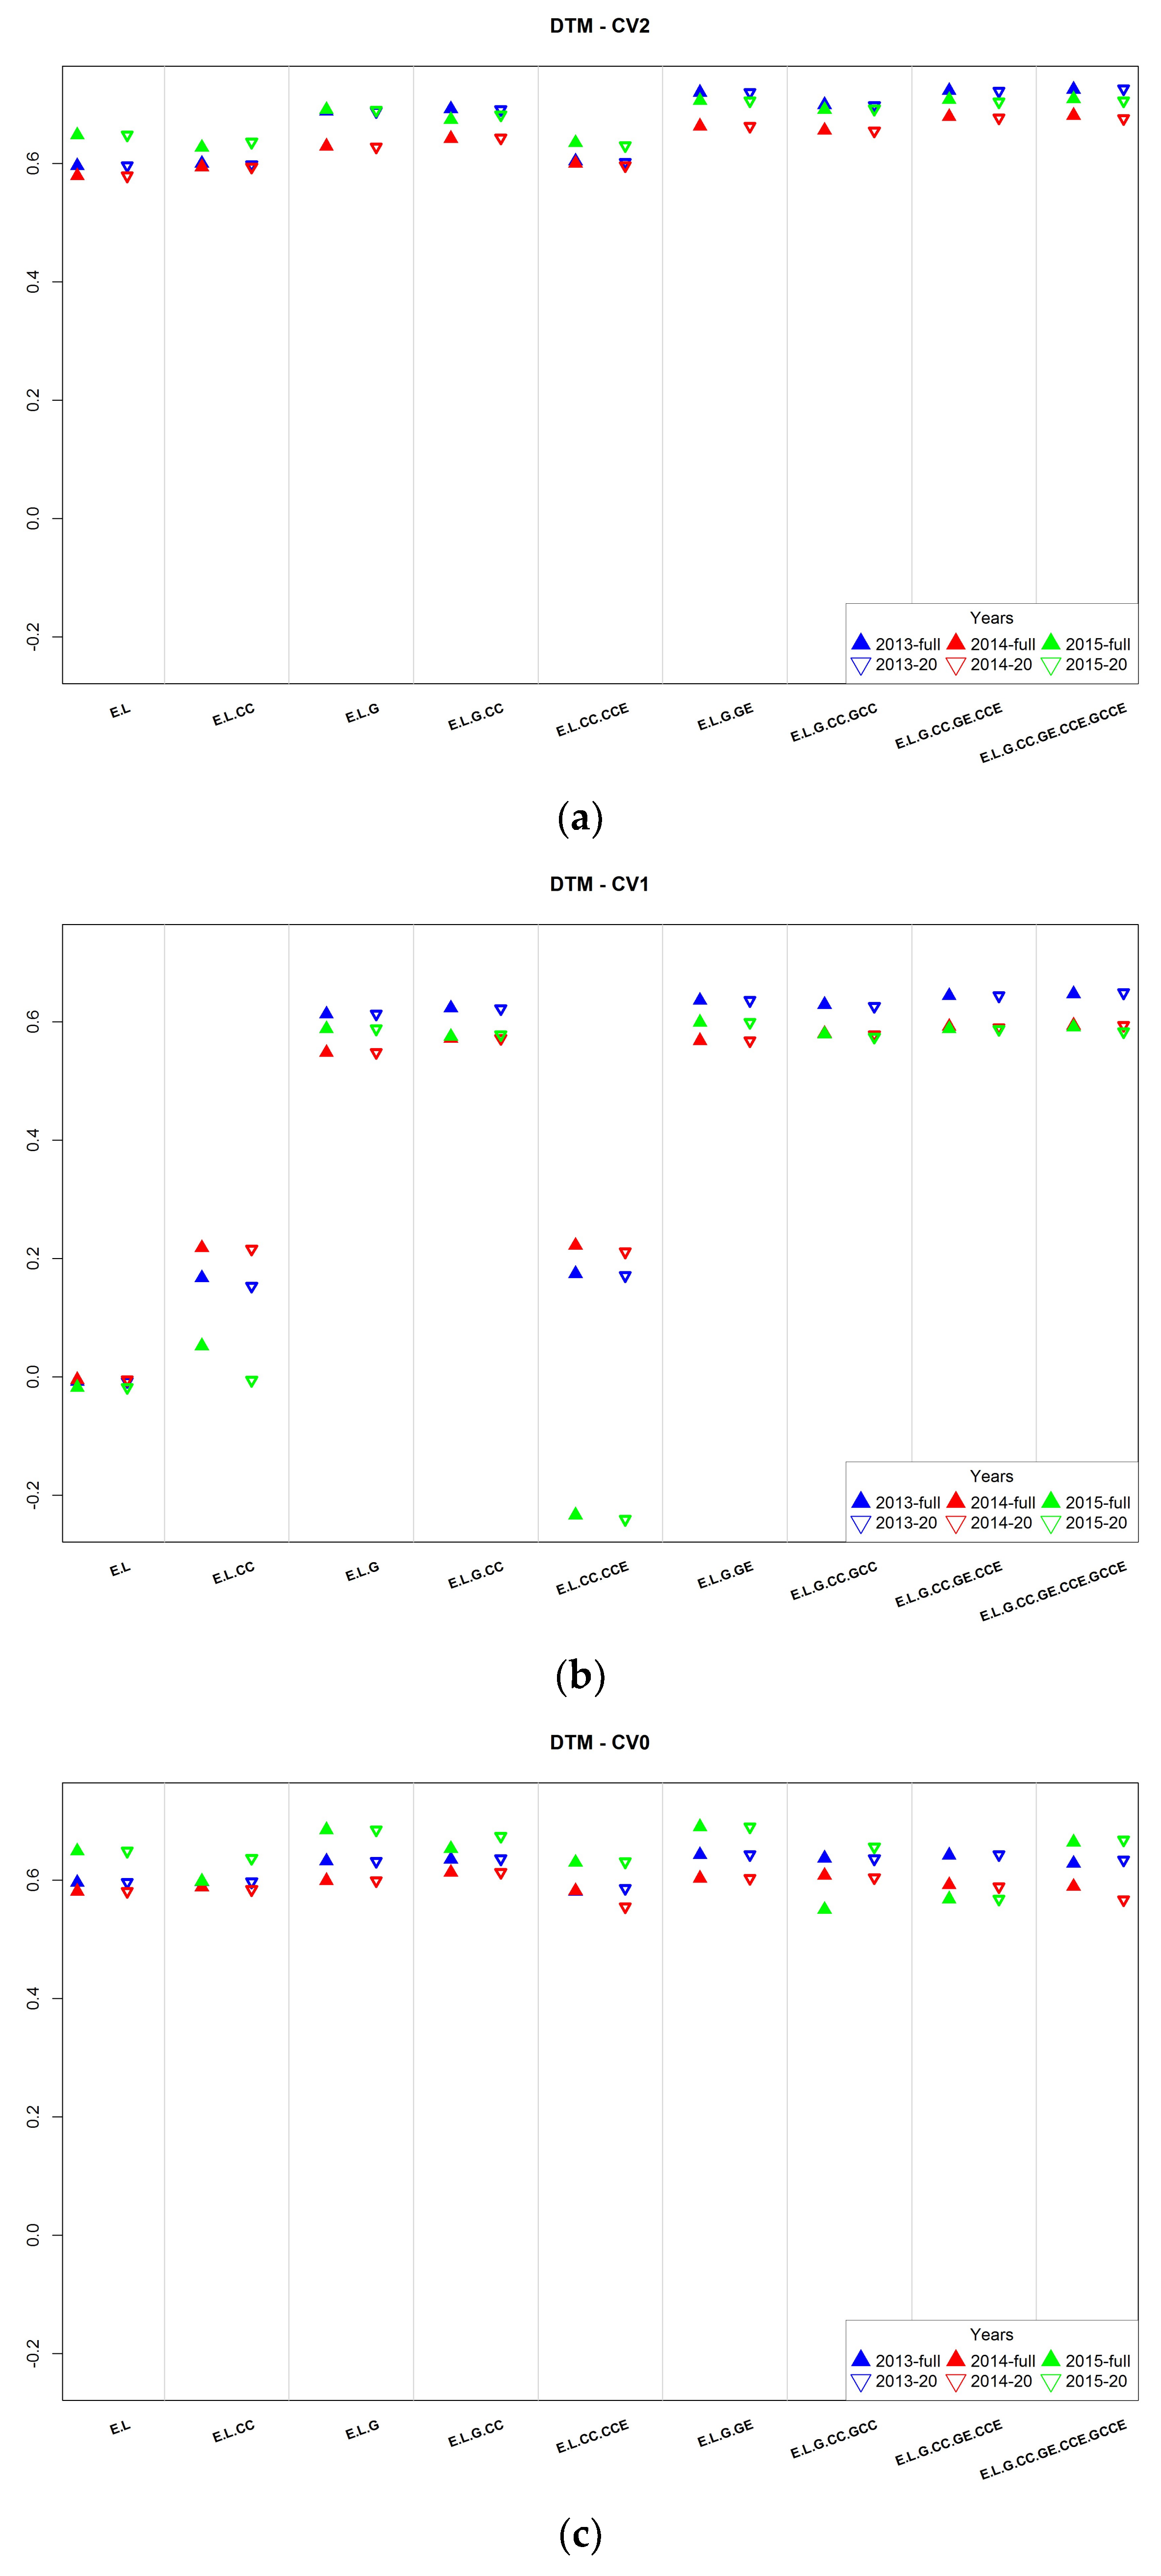
3.2. Assessment of Predictive Ability
3.3. Effectiveness of Canopy Data from Early Stages
4. Conclusions
Acknowledgments
Author Contributions
Conflicts of Interest
Abbreviations
| GP | Genomic prediction |
| CV0 | cross-validation predicting the performance of previously tested lines in untested locations |
| CV1 | cross-validation evaluating the performance of new developed lines, lines that have not been evaluated in any of the observed environments |
| CV2 | cross-validation evaluating the performance of lines that have been evaluated in some environments but not in others, incomplete field trials |
| SoyNAM | soybean nested association mapping |
References
- Whitford, R.; Fleury, D.; Reif, J.C.; Garcia, M.; Okada, T.; Korzun, V.; Langridge, P. Hybrid breeding in wheat: Technologies to improve hybrid wheat seed production. J. Exp. Bot. 2013, 64, 5411–5428. [Google Scholar] [CrossRef] [PubMed]
- Zulauf, C.; Coppess, J.; Paulson, N.; Schnitkey, G. U.S. Oilseeds: Production and Policy Comparison. Farmdoc Daily 2017, 7, 28. [Google Scholar]
- De los Campos, G.; Gianola, D.; Rosa, G.J.M.; Weigel, K.A.; Crossa, J. Semi-parametric genomic-enabled prediction of genetic values using reproducing kernel Hilbert spaces methods. Genet. Res. 2010, 92, 295–308. [Google Scholar] [CrossRef] [PubMed]
- Heffner, E.L.; Lorenz, A.J.; Jannink, J.L.; Sorrells, M.E. Plant breeding with genomic selection: Potential gain per unit time and cost. Crop Sci. 2010, 50, 1681–1690. [Google Scholar] [CrossRef]
- Meuwissen, T.H.E.; Hayes, B.J.; Goddard, M.E. Prediction of total genetic value using genome-wide dense marker maps. Genetics 2001, 157, 1819–1829. [Google Scholar] [PubMed]
- Endelman, J.B. Ridge regression and other kernels for genomic selection with R package rrBLUP. Plant Genome 2011, 4, 250–255. [Google Scholar] [CrossRef]
- Gianola, D.; Fernando, R.L.; Stella, A. Genomic-assisted prediction of genetic value with semiparametric procedures. Genetics 2006, 173, 1761–1776. [Google Scholar] [CrossRef] [PubMed]
- Habier, D.; Fernando, R.L.; Kizilkaya, K.; Garrick, D.J. Extension of the bayesian alphabet for genomic selection. BMC Bioinf. 2011, 12, 186. [Google Scholar] [CrossRef] [PubMed]
- Jarquín, D.; Kocak, K.; Posadas, L.; Hyma, K.; Jedlicka, J.; Graef, G.; Lorenz, A. Genotyping by sequencing for genomic prediction in a soybean breeding population. BMC Genom. 2014, 15, 740. [Google Scholar] [CrossRef] [PubMed]
- Jarquín, D.; Crossa, J.; Lacaze, X.; Cheyron, P.D.; Daucourt, J.; Lorgeou, J.; Piraux, F.; Guerreiro, L.; Pérez, P.; Calus, M. A reaction norm model for genomic selection using highdimensional genomic and environmental data. Theor. Appl. Genet. 2014, 127, 595–607. [Google Scholar] [CrossRef] [PubMed]
- Aguate, F.M.; Trachsel, S.; Pérez, L.G.; Burgueño, J.; Crossa, J.; Balzarini, M.; Gouache, D.; Bogard, M.; Campos, G.D.L. Use of Hyperspectral Image Data Outperforms Vegetation Indices in Prediction of Maize Yield. Crop Sci. 2017, 57, 2517–2524. [Google Scholar] [CrossRef]
- Crain, J.; Mondal, S.; Rutkoski, J.; Singh, R.P.; Poland, J. Combining High-Throughput Phenotyping and Genomic Information to Increase Prediction and Selection Accuracy in Wheat Breeding. Plant Genome 2018. [Google Scholar] [CrossRef] [PubMed]
- Montesinos-Lopez, O.A.; Montesinos-Lopez, A.; Crossa, J.; De los Campos, G.; Alvarado, G.; Mondal, S.; Rutkoski, J.; Gonzalez-Perez, L.; Burgueño, J. Predicting grain yield using canopy hyperspectral reflectance in wheat breeding data. Plant Methods 2017, 13. [Google Scholar] [CrossRef] [PubMed]
- Montesinos-López, A.; Montesinos-Lopez, O.A.; Cuevas, J.; Mata-López, W.A.; Burgueño, J.; Mondal, S.; Huerta-Espino, J.; Singh, R.P.; Autrique, E.; Gonzalez-Perez, L.; et al. Genomic Bayesian functional regression models with interactions for predicting wheat grain yield using hyper spectral image data. Plant Methods 2017, 13, 62. [Google Scholar] [CrossRef] [PubMed]
- Xavier, A.; Hall, B.; Hearst, A.A.; Cherkauer, K.A.; Rainey, K.M. Genetic Architecture of Phenomic-Enabled Canopy Coverage in Glycine max. Genetics 2017, 206, 1081–1089. [Google Scholar] [CrossRef] [PubMed]
- Xavier, A.; Muir, W.M.; Rainey, K.M. Assessing Predictive Properties of Genome-Wide Selection in Soybeans. G3 (Bethesda) 2016, 6, 2611–2616. [Google Scholar] [CrossRef] [PubMed]
- Song, Q.; Yan, L.; Quigley, C.; Jordan, B.D.; Fickus, E.; Schroeder, S.; Song, B.; An, Y.C.; Hyten, D.; Nelson, R.; et al. Genetic Characterization of the Soybean Nested Association Mapping Population. Plant Genome 2017, 10. [Google Scholar] [CrossRef] [PubMed]
- Stekhoven, D.J.; Buhlmann, P. Missforest—Non-parametric missing value imputation for mixed-type data. Bioinformatics 2012, 28, 112–118. [Google Scholar] [CrossRef] [PubMed]
- Wang, W.; Vinocur, B.; Altman, A. Plant responses to drought, salinity and extreme temperatures: Towards genetic engineering for stress tolerance. Planta 2003, 218, 1–14. [Google Scholar] [CrossRef] [PubMed]
- Purcell, L.C. Soybean canopy coverage and light interception measurements using digital imagery this paper is published with the approval of the director of the Arkansas Agric. Exp. Stn. (manuscript number 99–107). Crop Sci. 2000, 40, 834–837. [Google Scholar] [CrossRef]
- Fahlgren, N.; Gehan, M.A.; Baxter, I. Lights, camera, action: High-throughput plant phenotyping is ready for a close-up. Curr. Opin. Plant Biol. 2015, 24, 93–99. [Google Scholar] [CrossRef] [PubMed]
- Karcher, D.E.; Richardson, M.D. Batch analysis of digital images to evaluate turfgrass characteristics. Crop Sci. 2005, 45, 1536–1539. [Google Scholar] [CrossRef]
- VanRaden, P.M. Efficient methods to compute genomic predictions. J. Dairy Sci. 2008, 91, 4414–4423. [Google Scholar] [CrossRef] [PubMed]


| Model | No. | Estimated Variance Components | ||||||||
|---|---|---|---|---|---|---|---|---|---|---|
| E | L | G | GE | CC | CCE | GCC | GCCE | R | ||
| E + L | 1 | 59.0 | 10.3 | 30.7 | ||||||
| E + L + G | 2 | 49.9 | 2.4 | 14.9 | 32.8 | |||||
| E + L + G + GE | 3 | 46.5 | 4.0 | 10.4 | 10.4 | 28.7 | ||||
| E + L + CC | 4 | 51.7 | 10.1 | 7.0 | 31.3 | |||||
| E + L + CC + CCE | 5 | 63.4 | 8.9 | 0.1 | 0.1 | 27.5 | ||||
| E + L + G + CC | 6 | 48.1 | 1.6 | 13.7 | 8.8 | 27.8 | ||||
| E + L + G + CC + GCC | 7 | 42.8 | 1.9 | 15.7 | 8.1 | 3.4 | 28.1 | |||
| E + L + G + CC + GE + CCE | 8 | 55.1 | 2.4 | 8.3 | 7.8 | 5.0 | 0.4 | 20.9 | ||
| E + L + G + CC + GE + CCE + GCCE | 9 | 44.3 | 2.8 | 11.7 | 7.8 | 5.0 | 0.6 | 2.8 | 25.0 | |
| Model | No. | Estimated Variance Components | ||||||||
|---|---|---|---|---|---|---|---|---|---|---|
| E | L | G | GE | CC | CCE | GCC | GCCE | R | ||
| E + L | 1 | 45.1 | 32.0 | 22.9 | ||||||
| E + L + G | 2 | 19.8 | 5.2 | 61.2 | 13.8 | |||||
| E + L + G + GE | 3 | 17.9 | 6.4 | 61.0 | 2.7 | 12.0 | ||||
| E + L + CC | 4 | 31.5 | 37.5 | 3.0 | 28.0 | |||||
| E + L + CC + CCE | 5 | 35.8 | 37.1 | 0.1 | 0.1 | 26.9 | ||||
| E + L + G + CC | 6 | 15.2 | 5.4 | 63.4 | 1.1 | 14.9 | ||||
| E + L + G + CC + GCC | 7 | 12.3 | 6.0 | 64.6 | 1.2 | 1.3 | 14.5 | |||
| E + L + G + CC + GE + CCE | 8 | 18.8 | 5.7 | 52.1 | 2.2 | 0.0 | 10.4 | 10.7 | ||
| E + L + G + CC + GE + CCE + GCCE | 9 | 13.3 | 6.0 | 54.1 | 2.3 | 0.0 | 12.8 | 0.7 | 10.9 | |
© 2018 by the authors. Licensee MDPI, Basel, Switzerland. This article is an open access article distributed under the terms and conditions of the Creative Commons Attribution (CC BY) license (http://creativecommons.org/licenses/by/4.0/).
Share and Cite
Jarquin, D.; Howard, R.; Xavier, A.; Das Choudhury, S. Increasing Predictive Ability by Modeling Interactions between Environments, Genotype and Canopy Coverage Image Data for Soybeans. Agronomy 2018, 8, 51. https://doi.org/10.3390/agronomy8040051
Jarquin D, Howard R, Xavier A, Das Choudhury S. Increasing Predictive Ability by Modeling Interactions between Environments, Genotype and Canopy Coverage Image Data for Soybeans. Agronomy. 2018; 8(4):51. https://doi.org/10.3390/agronomy8040051
Chicago/Turabian StyleJarquin, Diego, Reka Howard, Alencar Xavier, and Sruti Das Choudhury. 2018. "Increasing Predictive Ability by Modeling Interactions between Environments, Genotype and Canopy Coverage Image Data for Soybeans" Agronomy 8, no. 4: 51. https://doi.org/10.3390/agronomy8040051
APA StyleJarquin, D., Howard, R., Xavier, A., & Das Choudhury, S. (2018). Increasing Predictive Ability by Modeling Interactions between Environments, Genotype and Canopy Coverage Image Data for Soybeans. Agronomy, 8(4), 51. https://doi.org/10.3390/agronomy8040051