Article

Assessing Field Prunus Genotypes for Drought Responsive Potential by Carbon Isotope Discrimination and Promoter Analysis

by
Beatriz Bielsa
1,
Carole Bassett
2,
D. Michael Glenn
2 and
María José Rubio-Cabetas
1,*
1
Unidad de Hortofruticultura, Centro de Investigación y Tecnología Agroalimentaria de Aragón, Instituto Agroalimentario de Aragón-IA2 (CITA-Universidad de Zaragoza), Av. Montañana 930, 50059 Zaragoza, Spain
2
U.S. Department of Agriculture, Agricultural Research Service, Appalachian Fruit Research Station, 2217 Wiltshire Road, Kearneysville, WV 25430-2771, USA
*
Author to whom correspondence should be addressed.
Agronomy 2018, 8(4), 42; https://doi.org/10.3390/agronomy8040042
Submission received: 27 February 2018 / Revised: 2 April 2018 / Accepted: 4 April 2018 / Published: 5 April 2018

Abstract

:
In order to improve the effectiveness of breeding practices for Prunus rootstocks, it is essential to obtain new resistance resources, especially with regard to drought. In this study, a collection of field-grown Prunus genotypes, both wild-relative species and cultivated hybrid rootstocks, were subjected to leaf ash and carbon isotope discrimination (Δ13C) analyses, which are strongly correlated to water use efficiency (WUE). Almond and peach wild relative species showed the lowest Δ13C ratios, and therefore, the highest WUE in comparison with hybrid genotypes. In addition, drought-related cis-regulatory elements (CREs) were identified in the promoter regions of the effector gene PpDhn2, and the transcription factor gene DREB2B, two genes involved in drought-response signaling pathways. The phylogenetic analysis of these regions revealed variability in the promoter region sequences of both genes. This finding provides evidence of genetic diversity between the peach- and almond-relative individuals. The results presented here can be used to select Prunus genotypes with the best drought resistance potential for breeding.

1. Introduction

Drought stress is a significant challenge to agriculture, especially in arid and semi-arid climates [1] such as the Mediterranean region, where water availability is the most important factor for plant survival. In plants, water stress response is a complex combination of different factors at the biochemical, molecular and physiological levels leading to plant adaptation under drought conditions [2,3]. Late embryogenesis abundant (LEA) proteins are involved in this functional adaptation. Their accumulation plays a crucial role in protecting protein structure and binding metals under osmotic and oxidative stresses induced by drought, cold and salinity [4,5]. Dehydrins, which belong to the Group II LEA proteins, are one of the most important proteins that accumullate during water stress [6,7]. The role of dehydrins in abiotic stress tolerance has been demonstrated in different woody species [8,9,10,11,12]. In particular, three dehydrin genes (Ppdhn1, Ppdhn2 and Ppdhn3) have been described in peach confirming their induction by cold and/or drought [13,14,15], and the presence of specific cis-regulatory elements (CREs) in their promoter regions is thought to contribute to their induction by several abiotic stresses [14,15]. Recently, Bielsa et al. [16] confirmed the drought-induction of two genes: a gene encoding a homologous protein to D-29 LEA protein and the PpDhn1 gene in three interspecific hybrids of Prunus. Dehydration-responsive element-binding (DREB) transcription factors (TFs), which belong to the APETALA 2/ethylene-responsive element binding factor (AP2/ERF) family [17], are important in abiotic stress responses by interaction with a specific dehydration-responsive element/C-repeat (DRE/CRT) cis-element (G/ACCGAC), located in the promoter regions of several stress responsive genes, including dehydrins [18,19,20,21]. DREB2B is one such gene whose expression is induced by dehydration, salinity and heat in an abscisic acid (ABA)-independent manner, thereby improving multiple stress tolerances in different plant species including model plants and crops [17,21,22,23,24].
Molecular responses to drought are reflected in physiological-adaptive mechanisms such as stomatal closure, reduction of cellular growth and photosynthesis deprivation [20]. Due to drought tolerance being a sophisticated and complicated process, phenotyping this physiological trait can be highly challenging. Several parameters have been established to assess drought tolerance, including water status [25], leaf hydraulic conductivity [26], stomata features [27] and water use efficiency (WUE) [28]. WUE is a physiological assessment extensively used in comparative studies due to WUE being tightly associated with plant drought adaptation [29,30,31]. WUE can be determined via comparison of different physiological assessments, namely via determining the; (i) ratio between net CO2 assimilation rate and stomatal conductance (this is defined as intrinsic WUE) and (ii) ratio between net CO2 assimilation and transpiration rates (this is defined as instantaneous WUE) [28]. These measurements provide information about plant responses to short-term drought conditions. Improving WUE is a key in ensuring future production in rain deficit environments. In breeding programs, it is also crucial to understand changes that are induced by exposure of the plant to long-term drought conditions. Carbon isotope discrimination (Δ13C) analysis is suggested as an appropriate indicator of long-term WUE at the leaf level [28,32]. The basis of this indirect method has been extensively studied [32,33,34] and suggests a negative correlation between WUE and Δ13C. Furthermore, the relationship between Δ13C and ash content has been studied in cereals [35,36], apple [37] and peach [38] in order to improve phenotyping and breeding for WUE. The association among these three parameters (WUE, Δ13C and leaf ash content) is based on the passive transport of minerals via the xylem and their accumulation in growing and transpiring tissues. Therefore, the rate of transpiration, the higher the rate of mineral transport is to those tissues leading to an increase in ash content [39]. The correlation of high WUE with low leaf ash content and low Δ13C is well documented [37,40,41].
Rootstocks are responsible for water and nutrient uptake, resistance to soil-borne pathogens, and tolerance to environmental stresses [42]. In Prunus, several species such as P. amygdalus (L.) Batsch, P. persica (L.) Batsch, P. cerasifera Ehrh., P. davidiana (Carr.) Franch, P. mira (Koehne) Kov. et Kost., P. domestica L., and P. insititia L. are used as rootstocks. In addition, interspecific hybrids have been developed from almond × peach and peach × P. davidiana [43,44,45,46]. Currently, the aim of several stone fruit rootstock-breeding programs is to create more interspecific hybrids to obtain desirable and useful traits from different Prunus species. Wild-relative species have also been utilized both for direct rootstock development, such as, P. bucharica (Korsh.) Fetdsch., P. kuramica (Korsh.), P. webbii (Spach) Vieh. or P. kotschii (A. kotschii Boiss.), and to create interspecific hybrids, e.g., P. webbii × almond, to introgress genes encoding for their natural abiotic and biotic resistances into cultivated Prunus rootstocks [47,48].
The objective of this study was to identify plant lines that displayed drought resistance potential among field Prunus collection, including a number of peach and almond wild-relative species and cultivated rootstocks. The identification of such lines was based on (i) their phenotype by leaf ash content and Δ13C analyses to estimate their long-term WUE, and; (ii) their genetic distances obtained from the promoter analysis of PpDnh2 and DREB2 TF, two genes involved in WUE.

2. Materials and Methods

2.1. Plant Material and Growth Conditions

A total of 48 individuals, listed in Table S1, were used in this study. The genotypes were located at the CITA (Centro de Investigación y Tecnología Aroalimentaria de Aragón) facilities in Zaragoza, Spain (41°43′26″ N, 0°48′31″ W) belonging to a rootstock and wild relatives collections, respectively. Conventional orchard practices were used in tree training and weed control. Water requirements were supplied by surface irrigation for the hybrids and their parentals, and drip irrigation for the almond wild-relative species.

2.2. Leaf Ash Content Analysis and Carbon Isotope Discrimination Analysis

WUE was estimated from two analyses: (i) leaf ash content and (ii) leaf carbon isotope discrimination (Δ13C). Approximately 15 leaves per tree were collected, washed with deionized water, and air dried at 60 °C for 48 hours (h). The tissue was dried further at 70 °C for 72 h, ground to a degree that would allow passage through a 40-mesh screen, and analyzed for 13C content (University of California, Davis Stable Isotope Facility, Department of Plant Sciences, Davis, CA, USA). Carbon isotope discrimination (Δ13C) was calculated according to [49]. The carbon dioxide isotope composition in air was assumed to be −7.8 parts per thousand [50]. The same sample leaf tissue weight (0.5 g) was placed in a preheated porcelain crucible and burnt in a muffle furnace at 550 °C for 24 h to determine ash content using a thermogravimetric analyzer (Leco, Inc., St. Joseph, MO, USA, model TGA701). Correlation analysis was performed to relate leaf ash content with Δ13C using IBM SPSS Statistics v21.0 (SPSS Inc./IBM Corp., Chicago, IL, USA).

2.3. DNA Isolation

Leaves were collected and stored at −20 °C. Total DNA was extracted from 50 mg of frozen leaves as described by Doyle and Doyle [51]. In brief, each sample was ground in a mortar with liquid N2. The ground material was lysed with 700 µL of CTAB (100 mM Tris-HCl C4H11NO3, 20 mM EDTA, 2% CTAB, 1.4 M NaCl, pH 8, 1% PVP-40, 0.1% NaHSO3) and 0.4 µL of 2-mercaptoethanol and transferred to a 1.5 mL Eppendorf tube. Cellular lysis was further assisted via incubation at, at 65 °C for 25 min. Next, 700 µL of chloroform-isoamyl alcohol (24:1, v/v) was added. Samples were then homogenized, it was centrifuged at 5590× g for 15 min, at room temperature. After centrifugation, 450 µL from the upper phase were transferred to a new 1.5 mL Eppendorf tube and an equal volume (450 µL) of cold isopropanol was added and samples thoroughly mixed. The precipitated nucleic acid was recovered by centrifugation at 10,956× g at room temperature for 5 min, washed in 800 µL of 10 mM ammonium acetate in 76% ethanol for 45 min. After the washing step, the sample was centrifuged again at 10,956× g at room temperature for 5 min. Finally, the supernatant was removed and the pellet dried at room temperature. DNA was re-suspended in 100 µL of TE buffer (10 mM Tris-HCl, 0.1 mM EDTA, pH 8.0) and stored at 4 °C overnight. The following day, the samples were quantified using a NanoDrop® ND-1000 UV-vis spectrophotometer (NanoDrop Technologies, Wilmington, DE, USA).

2.4. PCR Amplification

In order to obtain the approximate 1000 bp upstream sequence of the translation start codon to represent the promoter region, primers were designed based on the nucleotide sequences of the PpDhn2 (ppa011637m.g) and DREB2B (ppa022996m.g) according to the sequences of the assembled and annotated peach genome (P. persica genome v1.0; http://www.rosaceae.org/). Approximately 150 ng of genomic DNA were amplified using a Platinum Taq DNA Polymerase High Fidelity kit according to the manufacturer’s instructions (Invitrogen, Life Technologies, Carlsbad, CA, USA) and the PpDhn2-specific primers, forward 5′-TTGAGCAGCAGTATCACAAGC-3′, and reverse: 5′-GGTGGTTCCGGTCGTAGTAG-3′; and the DREB2B-specific primers, forward 5′-ACGTGGGACAAAACAGGGTA-3′, and reverse: 5′-TACCAAGCCAAAGACGACTG-3′. The PCR conditions used were 1 min at 94 °C, followed by 35 cycles of 30 s at 94 °C, 1 min at 60 °C and 2 min at 68 °C, followed by a final extension of 10 min at 72 °C. After agarose gel electrophoresis, the PCR products were purified using a DNA Clean and concentrator™-5 kit (Zymo Research, Orange, CA, USA) following the manufacturer’s recommendations.

2.5. Cloning and Sequencing

The gDNA fragments of 1074 bp and 1003 pb obtained for the putative promoter regions of the PpDhn2 and DREB2B genes, respectively, were subsequently cloned into the pCR™2.1-TOPO® vector (Invitrogen, Life Technologies, Carlsbad, CA, USA) following the manufacturer’s instructions. The plasmid DNA of the positive transformants was isolated using GeneJET™ Plasmid Miniprep kit (Thermo Fisher Scientific, Waltham, MA, USA). After digestion with EcoR1 using EcoR1-HF™ RE-Mix® (New England, BioLabs Inc., Ipswich, MA, USA) for checking the quality and the integrity of the gDNA insert within the vector, positive clones were sent to Beckman Coulter Genomics (Danvers, MA, USA) and Secugen S.L. (Madrid, Spain) for sequencing using the universal M13 forward and reverse primers.

2.6. In Silico Analysis of PpDhn2 and DREB2B Promoter Regions

Chromatograms from the sequencing of the studied fragments were edited by BioEdit software version 7.2.5 [52], vector sequences were removed using VecScreen software from NCBI (http://www.ncbi.nlm.nih.gov/tools/vecscreen/). Next the resulting sequences were aligned using MUSCLE software from EMBL-EBI (http://www.ebi.ac.uk/Tools/msa/muscle/) [53] and assembled by the Contig Assembly Program CAP3 (http://mobyle.pasteur.fr/cgi-bin/portal.py?#forms::cap3) [54].
The phylogenetic trees for each promoter region of the PpDhn2 and DREB2B gene were constructed to classify our individual plant lines on the basis of their respective promoter sequences. This analysis was done using MEGA 6.0 [55] with the neighbour-joining (NJ) method [56], and a bootstrap analysis was conducted using 1000 replicates [57]. The evolutionary distances were determined using the Kimura 2-parameter method [58].
Two databases of cis-acting regulatory elements (CREs) motifs: PlantCARE (http://bioinformatics.psb.ugent.be/webtools/plantcare/html/) [59] and PlantPAN 2.0 (http://plantpan2.itps.ncku.edu.tw/promoter.php) [60] were used to identify CREs involved in drought response.

3. Results

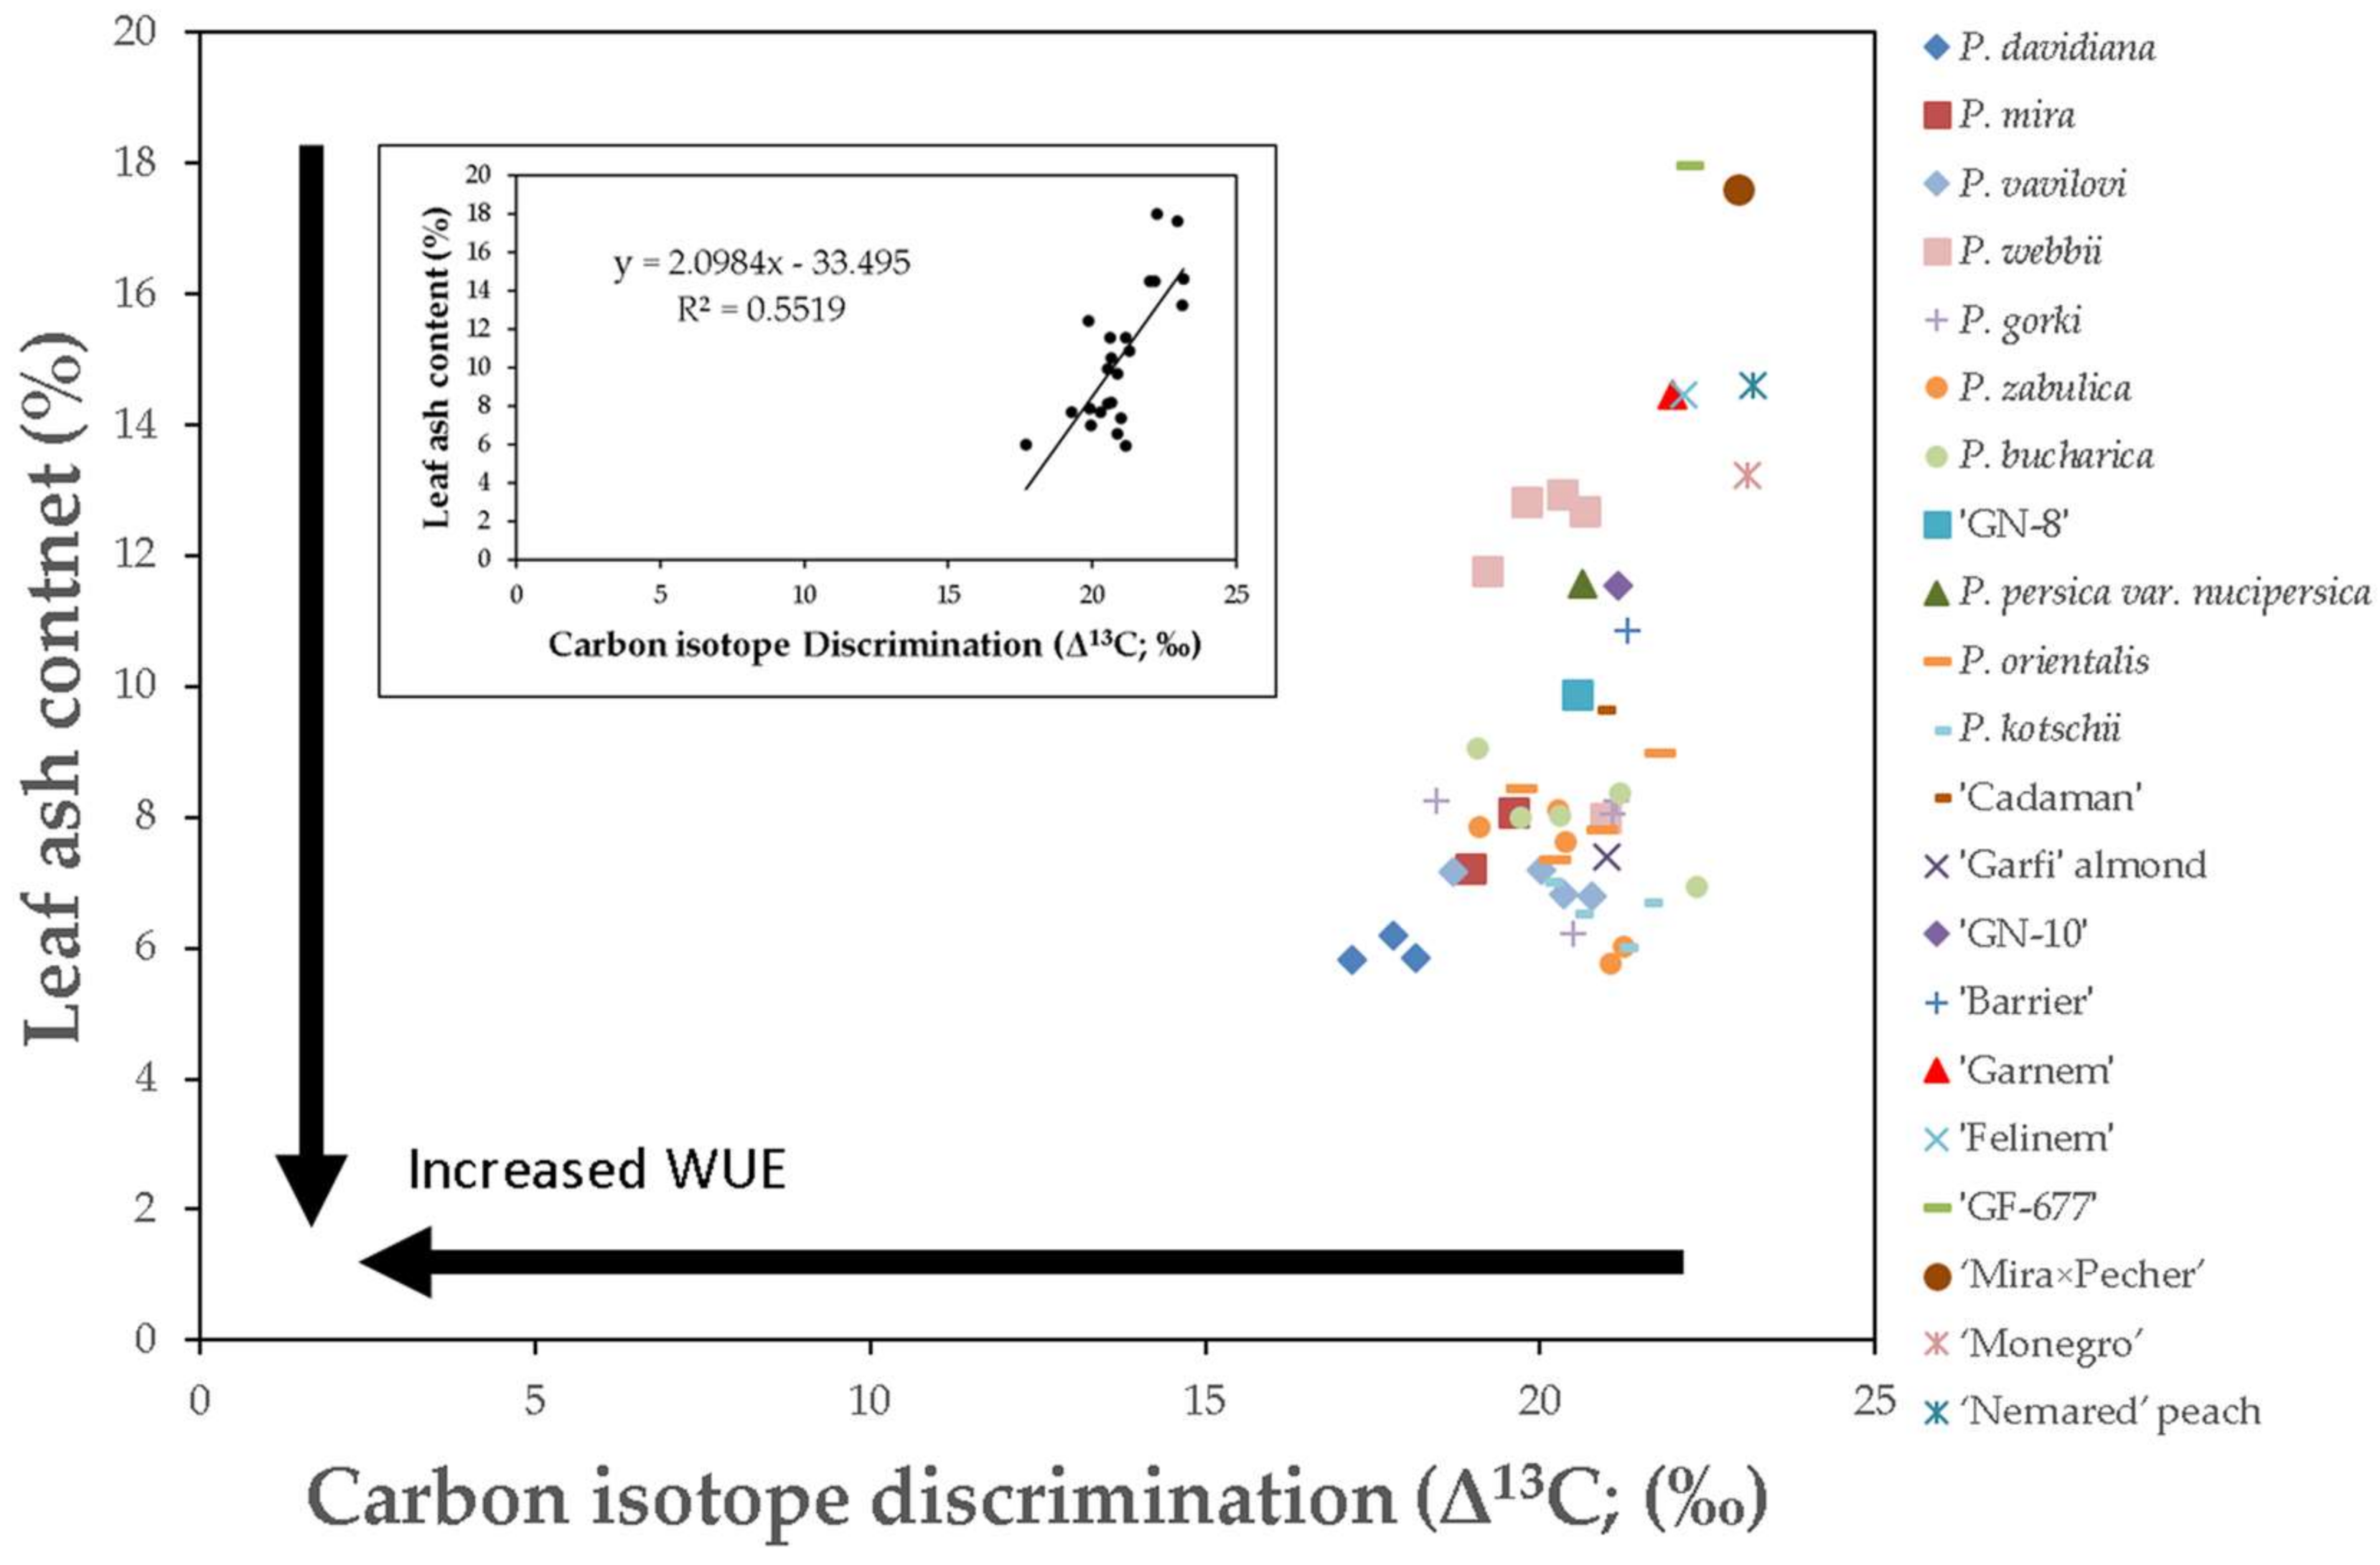
3.1. Relationship between Leaf Ash Content and Δ13C

Mean Δ13C ratios varied among genotypes and ranged from 17.71‰ to 23.17‰ and mean ash content varied from 5.96 to 17.97% (Table 1). There was a significant (p < 0.05) positive relationship between Δ13C and leaf ash content (Figure 1) P. davidiana individuals had the lowest value for both Δ13C ratio and leaf ash content (Table 1 and Figure 1). The Δ13C values of almond-related wild species were close to the average (20.99‰) with ratios between 19.96‰ to 20.87‰ (Table 1). Genotypes with highest Δ13C ratios were ‘Nemared’ (23.17‰), ‘Monegro’ (23.11‰) and ‘Mira × Pecher’ (22.95‰). Δ13C ratios of the individuals belonging to G × N series, except for the genotype ‘GN-8’, were above average (Table 1). Genotype ‘GF-677’ had the highest leaf ash content and the fourth highest Δ13C value (Table 1). Variability of Δ13C values was low with an overall standard deviation value of 1.31 and coefficient of variation (CV%) of 6.40, while the overall standard deviation of ash content values was 3.10 with a CV% of 34.99 (Table 1).
Comparing both Δ13C and ash content values, P. davidiana individuals had the lowest values (Figure 1), indicating higher WUE than the other genotypes. Conversely, ‘GF-677’ and ‘Mira × Pecher’ hybrids had the highest values for ash content and Δ13C, indicating the lowest WUE (Table 1 and Figure 1). The almond wild-relative species had similar low ash content values to P. davidiana except for P. webbii individuals F3 and F17, and low Δ13C values compared to the peach and the peach hybrid values. Overall, these peach relatives had higher Δ13C and ash content values than almond wild-relative species. Among the G × N series, ‘GN-8’ and ‘GN-10’ had lower ash and Δ13C values than ‘Felinem’, ‘Garnem’, ‘Monegro’ and ‘Nemared’ (Table 1).

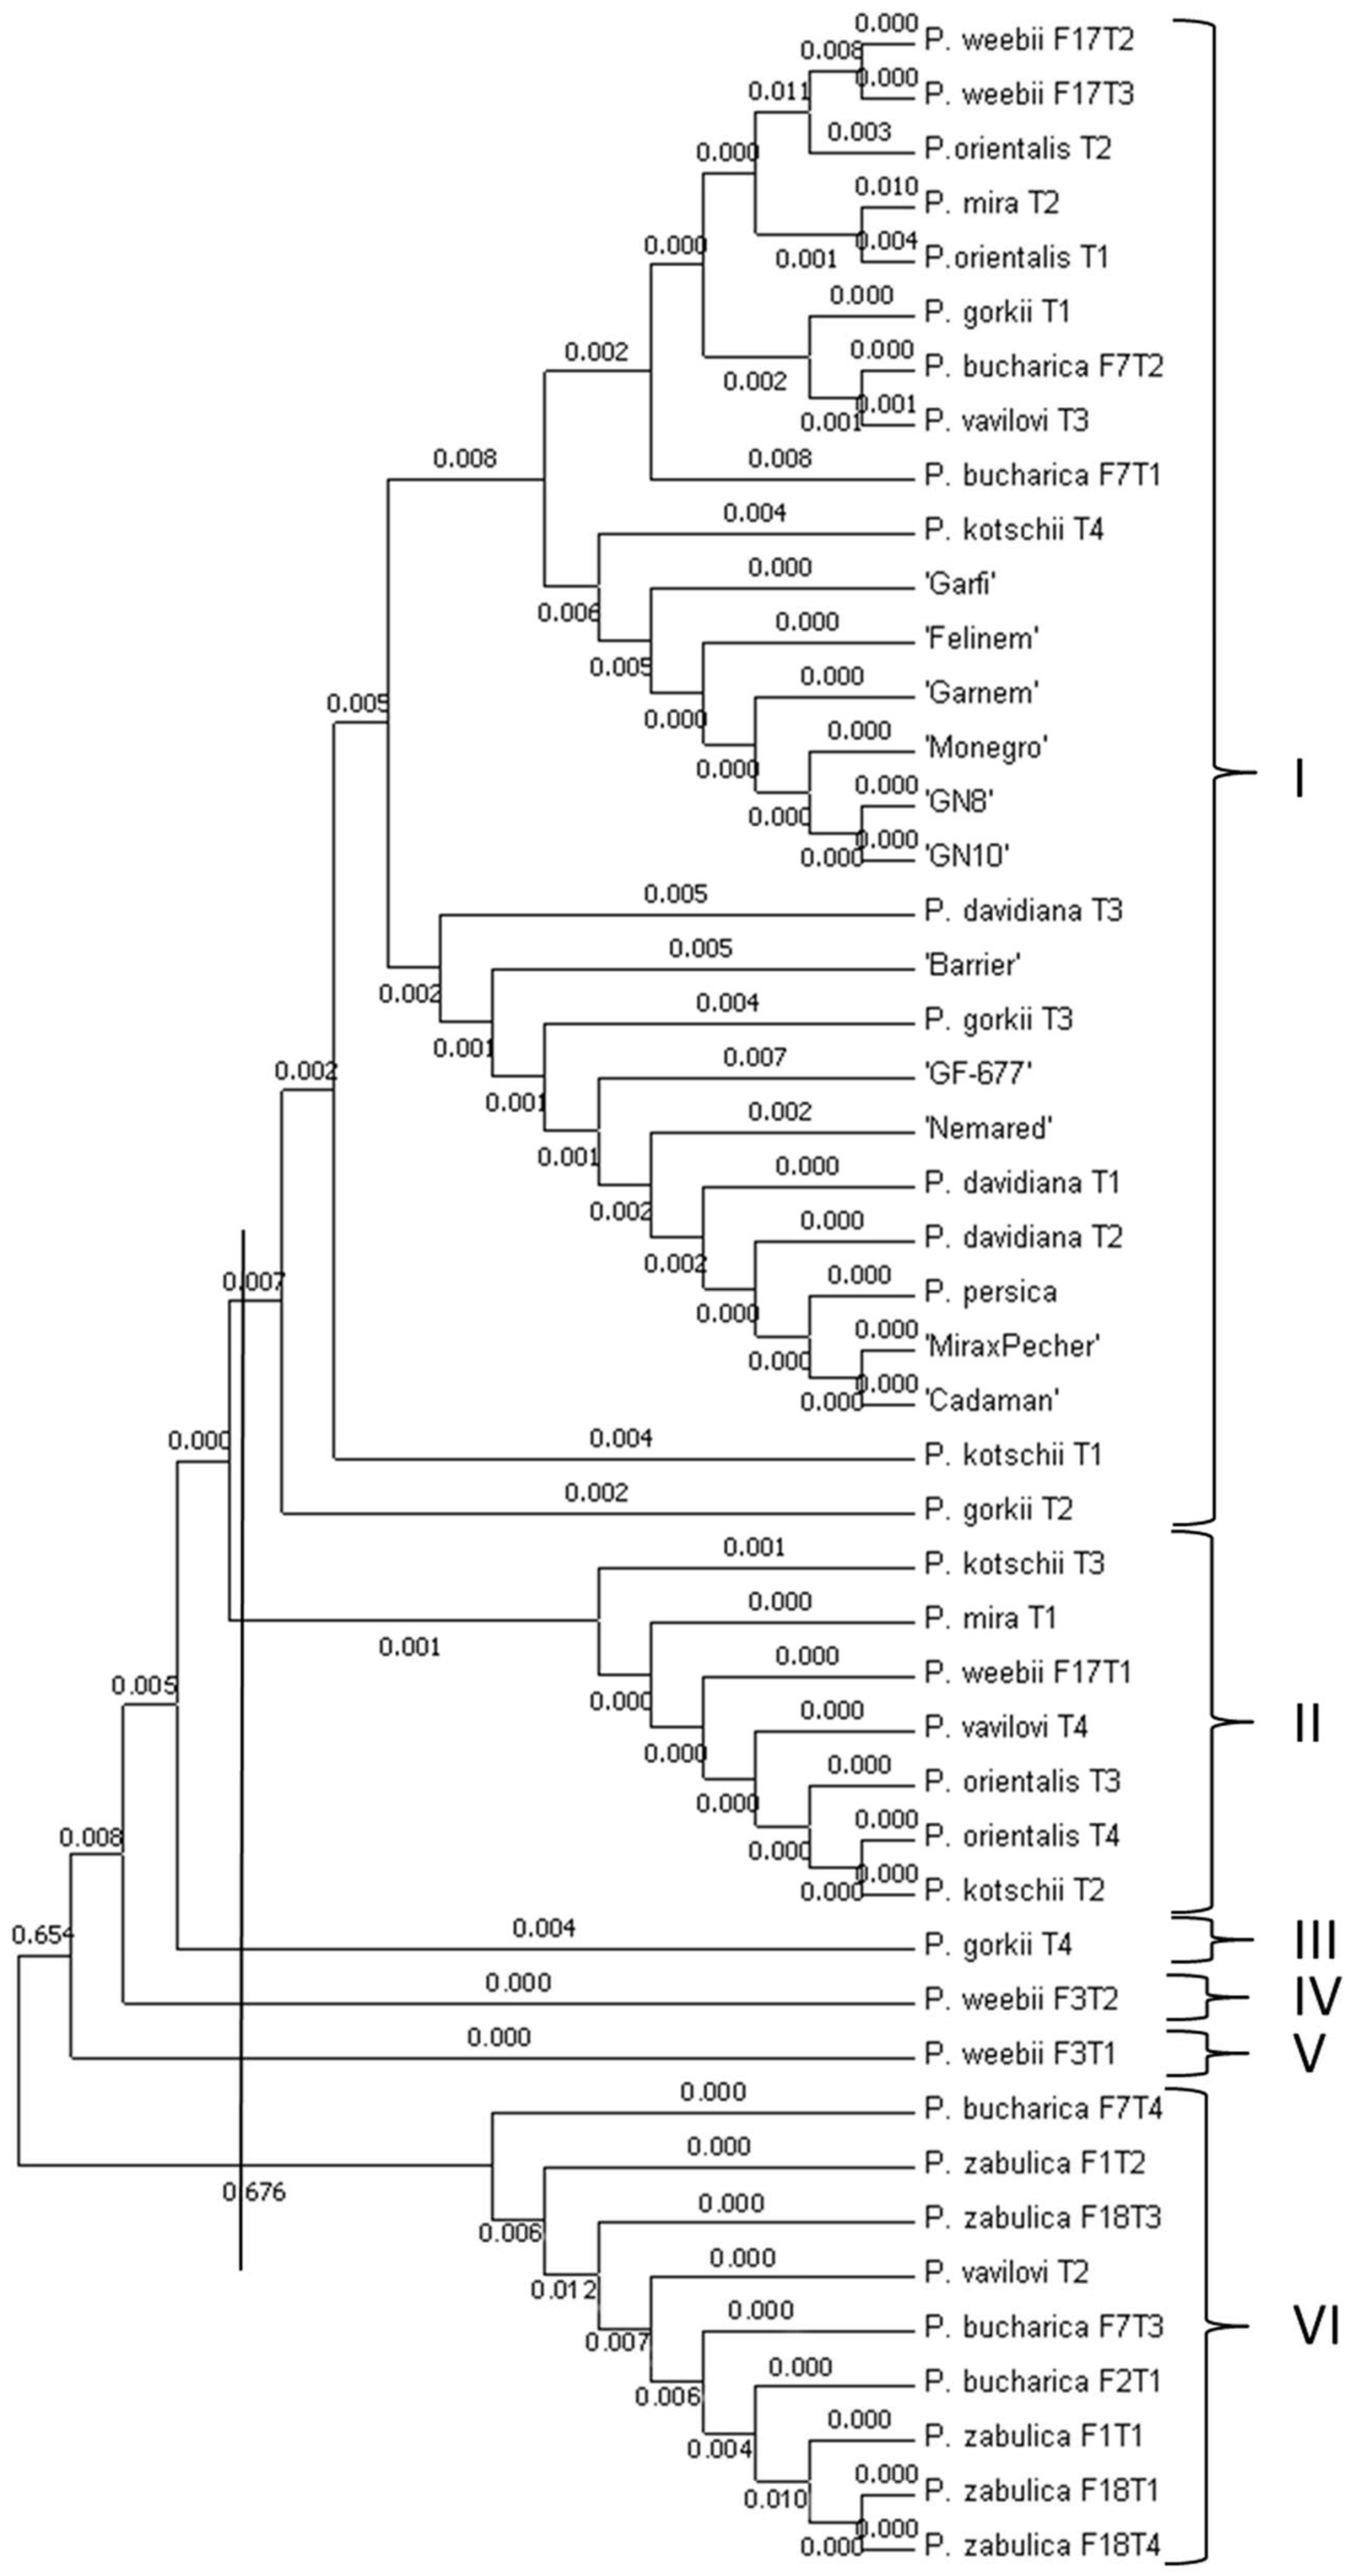
3.2. Phylogenetic Analysis Based on Promoter Regions of PpDhn2 and DREB2B Genes

The 5′ regulatory region of the PpDhn2 gene amplified from the 47 genotypes and species assessed were classified into six clusters (Figure 2) based on the dendrogram tree obtained by the NJ method. Cluster I contained 28 individuals, including all the hybrids and their parentals, except one individual belonging to P. mira genotype, which was grouped in cluster II, as well as 12 individuals belonging to 6 different wild-relative species (Figure 2). Cluster II included one P. mira individual, P. mira T1, as above-mentioned, and another six plant lines from four different wild-relative species (Figure 2). Clusters III, IV and V were the only clusters containing just one individual from 2 wild-relative species, P. gorki for Cluster III and the P. webbii F3T2 and F3T1 lines for clusters IV and V, respectively. (Figure 2). Finally, cluster VI was formed by nine wild-relative almond species (Figure 2). These results revealed the diversity in the promoter region of the PpDhn2 gene.
The promoter region of the DREB2B TF encoding gene from 48 plant lines was grouped in four clusters (Figure 3). The largest cluster, cluster I, contained 29 individuals including the ‘Garfi’ almond and individuals belonging to the almond wild-relative species P. vavilovi, P gorki, P. webbii, P. bucharica, P. orientalis, P. zabulica, and P. kotschii, as well as the ‘GF-667’ hybrid (Figure 3). Cluster II contained four wild-relative almond individuals belonging to P. zabulica and P. kotschii species (Figure 3). The smallest group was cluster III and was formed by the single genotype P. mira T2 (Figure 3). All hybrid individuals and most of the parentals were found in cluster IV (Figure 3). This dendrogram showed evolutionary distances close to zero, indicated a high level of conservation in the 5′ regulatory region of the DREB2B gene for each individual analyzed.

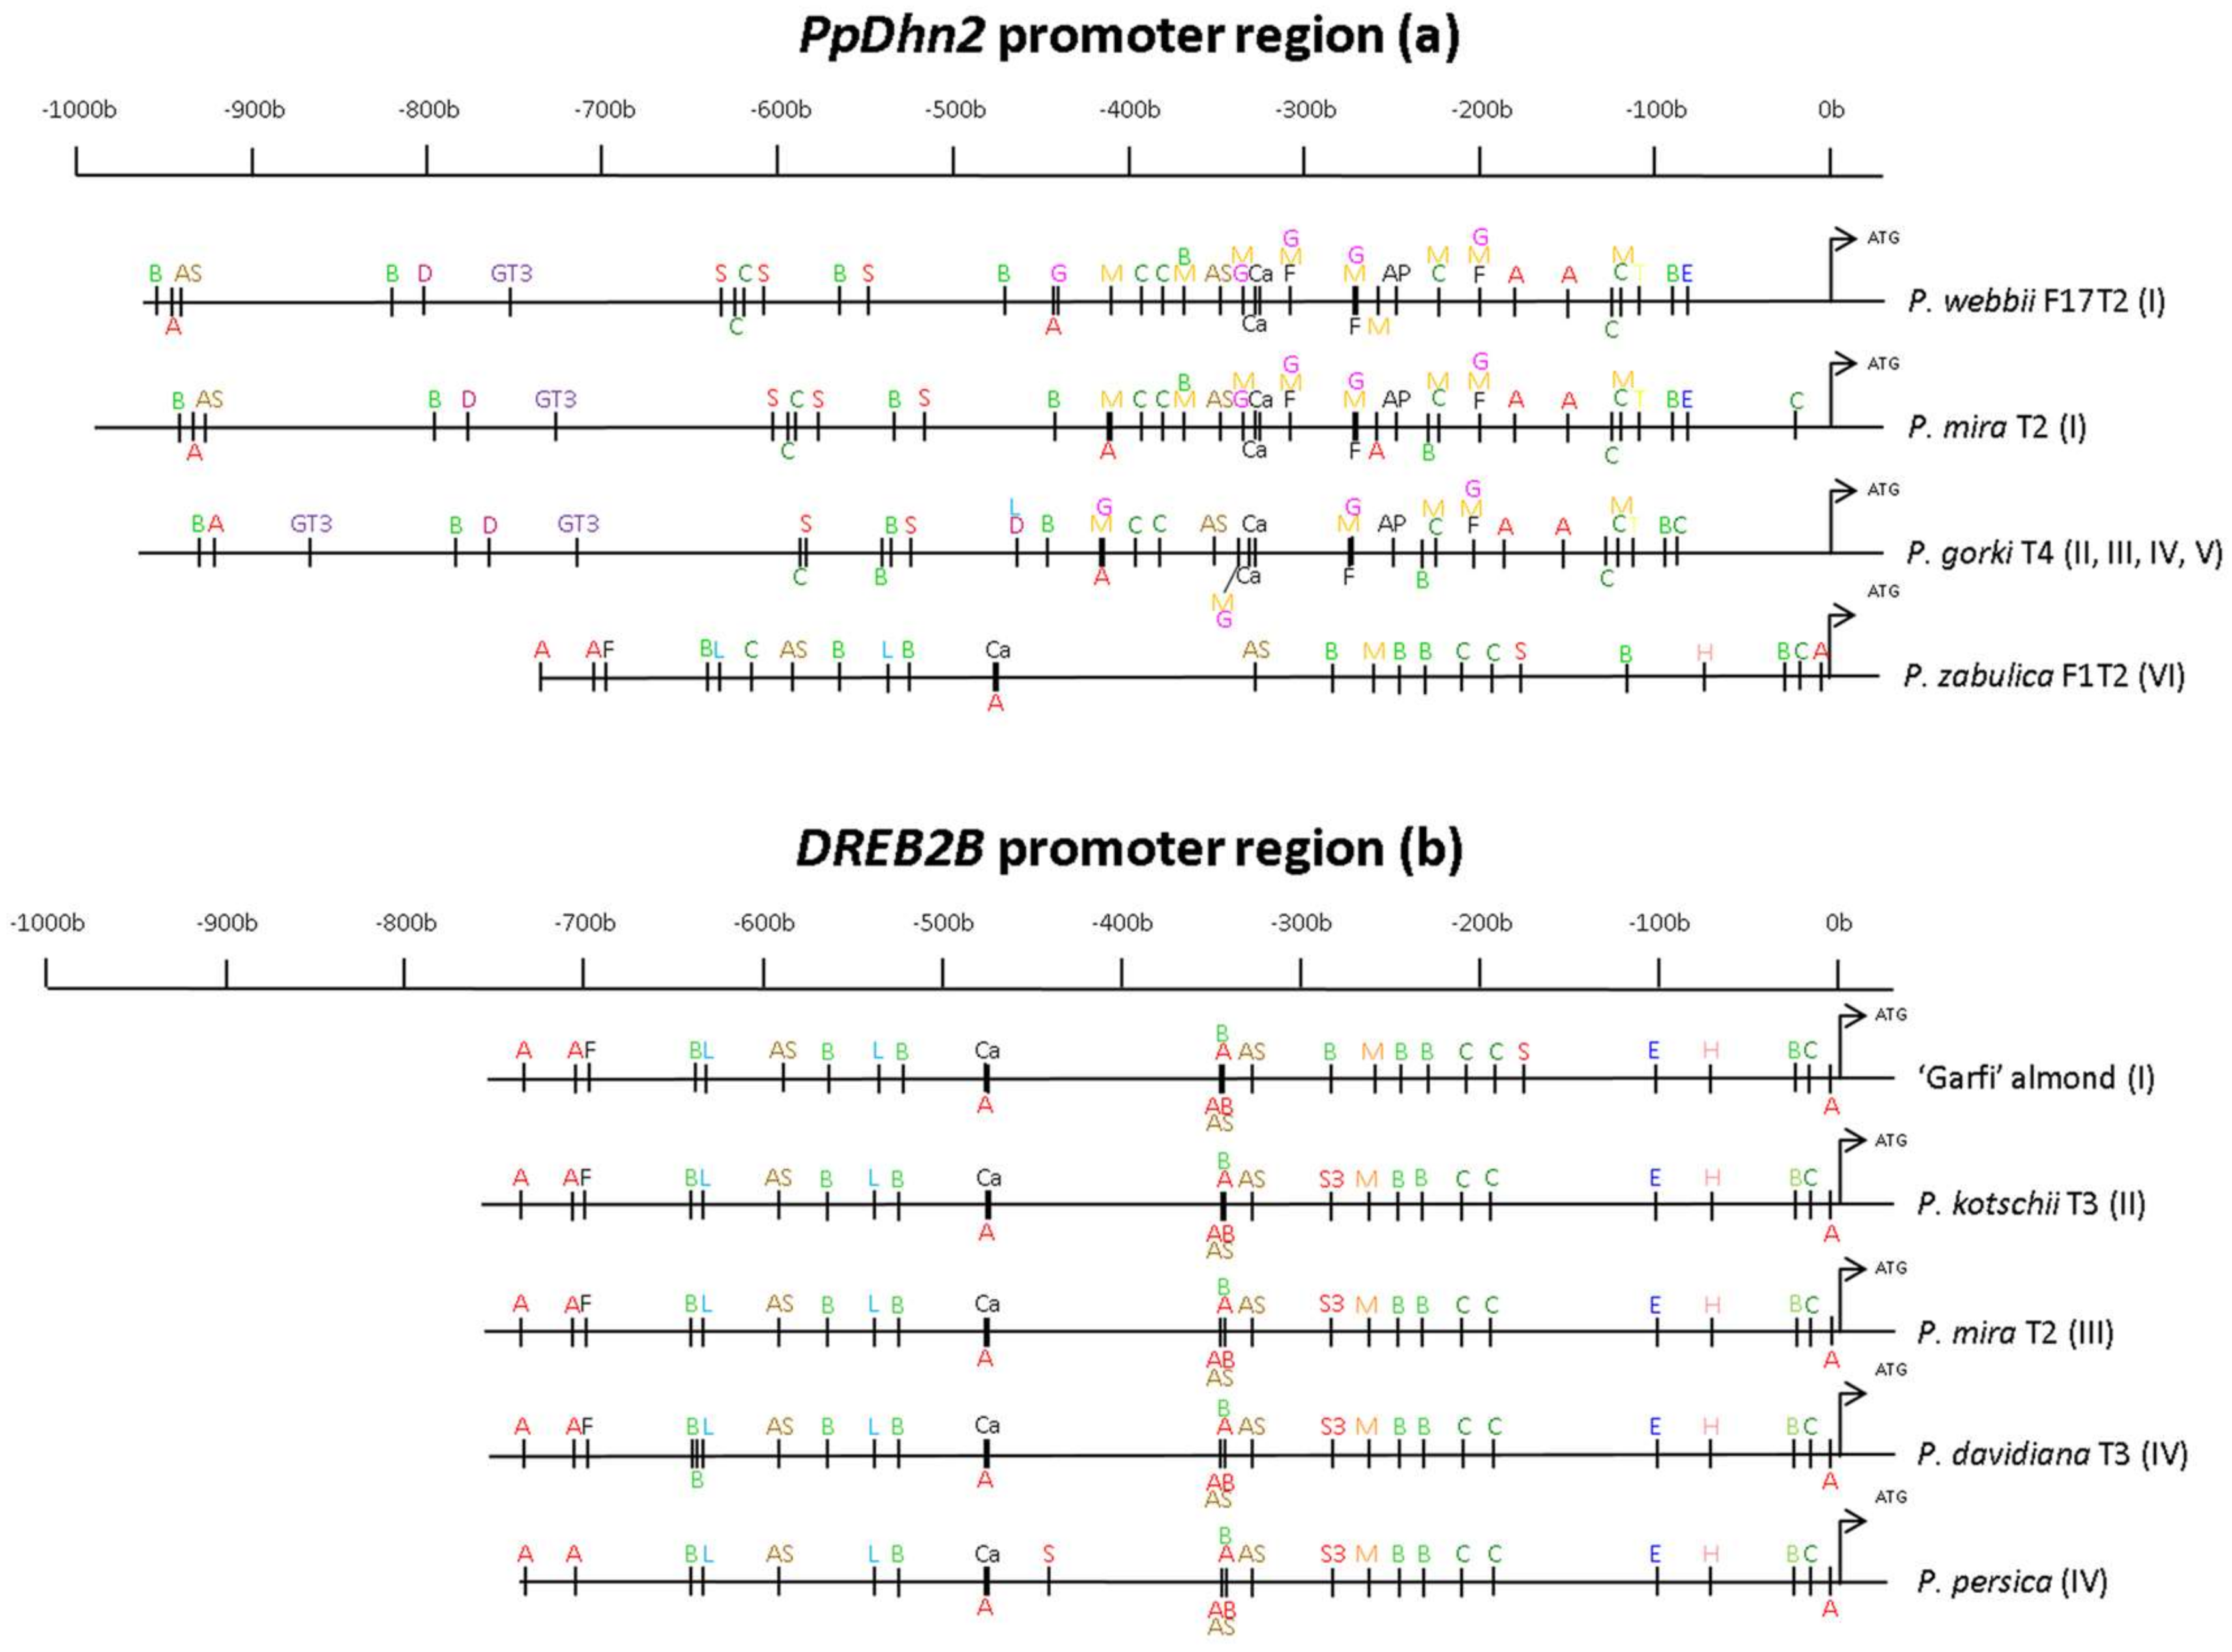
3.3. Drought-Related cis-Regulatory Elements Fround in PpDhn2 and DREB2 Promoters

In order to construct a more detailed understanding of the expression regulation of the PpDhn2 and DREB2B genes in response to drought, we next searched for CREs in the putative promoter regions of each analyzed plant line. Based on the dendrograms resulting from the phylogenetic analysis, the nucleic acid sequences of selected individuals from each cluster were aligned. Individuals of each group of the alignment were selected again depending on the nucleic acid differences found in the alignment analysis. Finally, CREs were found not only responsive to drought stress, but also to other processes and stresses such as light, development, hormone, biotic and abiotic stress responses in both promoter regions
For the PpDhn2 gene, we analyzed the promoter regions of P. mira T2 and P. webbii F17T2 from cluster I, P. gorki T4 from cluster III, and P. zabulica F1T2 from cluster VI as representatives of each cluster. For CREs analysis, clusters II, IV and V were represented by P. gorki T4 from cluster III because the promoter regions of all these grouped plant lines harbored the same complement of CREs in their respective promoter regions. Different families of CREs associated with drought stress and ABA signaling response were predicted in both sense and antisense positions. Four CRE classes were found in all genotypes: different ABA- and dehydration-responsive elements; several (basic leucine zipper) bZIP TFs also related to ABA signaling; an element regulated by calcium signals; several myeloblastosis (MYB) motifs, as well as a myelocytomatosis (MYC) and the SEF4 TF (Figure 4a, and Table 2 and Table S2). Among the CREs, EBOXBNNAPA was the most abundant element with a repetition range of 18 to 4 in the promoter region of each genotype, followed by ACGTATERD1 with a range of 8 to 6 repetitions (Table S2). Clear differences between individuals from cluster VI and individuals from the rest of the clusters (I, II, III, IV and V) were identified (Figure 4a and Table S2). Three different CREs families were only represented in the promoter region of genotypes from cluster VI: a heat shock promoter element (HSE); a low-temperature-responsive element (LTRE-1); and three MYB elements (Figure 4a, and Table 2 and Table S2). Six CREs were found in individuals from clusters I, II, III, IV and V, but not in individuals from cluster VI: the ABA-responsive element (ABRE) motif ABREDISTBBNNAPA; a T-box ACGTTBOX; the dehydration-responsive (DRE) element DRE1COREZMRAB17; the MYC elements MYCATERD1 and MYCATRD22, and the MYC recognition site G-box. Furthermore, individuals from clusters I, II, III, IV and V contained a GT3 box in their promoters (Figure 4a, and Table 2 and Table S2). The ethylene-responsive element (ERE), ERELEE4, was only identified in cluster I, but not in clusters II, III, IV and V (Figure 4a, and Table 2 and Table S2). Finally, five CREs were found only in individuals from clusters II, III, IV and V, but not in clusters I and VI: four different dehydration-responsive (DRE) elements CBFHV, DRE, DRE1COREZMRAB17 and DRECRTCOREAT; and a LTRE element LTRECOREATCOR15 (Figure 4a, and Table 2 and Table S2).
The study of the DREB2B TF gene promoter region was conducted in ‘Garfi’, ‘GF-677’, P. orientalis T4, P. vavilovi T4, P. bucharica F7T2, P. kotschii T1 and P. bucharica F7T1 from cluster I; P. kotschii T3 from cluster II; P. mira T2 from cluster III; and P. davidiana T3, ‘Mira × Pecher’, P. persica and ‘Garnem’ from cluster IV. CREs were located in both the sense and antisense orientation, presenting a more conserved sequence than the PpDhn2 gene promoter region. We identified in all individuals several ABA-, and dehydration-responsive elements also identified in the PpDhn2 promoter region however, we also identified an additional ABRE-element, namely the ABARE-element HEXMOTIFTAH3H4. Other CRE families were also identified in this analysis, including ERELEE4 motif; HSE element; the motif LTRE1HVBLT49; several MYB elements; the calmodulin-binding motif CAMTA3; SR1, and the MYC element EBOXBNNAPA (Figure 4b, and Table 2 and Table S3). The motif most frequently identified was the ACGTATERD1 being identified on 8 occasions. Interestingly, the cis-element MYB2CONSENSUSAT was only identified among cluster I members, but not in individuals belonging to clusters II, III, IV and V. (Figure 4b and Table S3). The bZIP TF DPBFCOREDCDC3 element was found in clusters I, II, III and IV, but not in cluster V (Figure 4b and Table S3). The motif SEF3MOTIFGM was presented in individuals from cluster II, III and IV (Figure 4b, and Table 2 and Table S3). Finally, the SEF4 element was only found in clusters I and V and interestingly, the position of this TF binding site was identified at different positions within the promoter regions of members of each cluster (Figure 4b, and Table 2 and Table S3).

4. Discussion

Drought tolerance must be one of the primary criteria when selecting a rootstock that we be cultivated in areas where water availability is limited. The drought response in plants is controlled by complex prototypical and physiological components. The relationship between genotype and phenotype is crucial in order to understand this response for enhancing the expression of desired traits related to drought tolerance, such as WUE. Therefore, increasing WUE in rootstocks is important to ensure future economical fruit tree production in less water-friendly environments [61]. Here, leaf ash content and carbon isotopic composition were carried out to estimate the long-term WUE [37,62] in peach and almond wild-relative species, in a number of interspecific Prunus hybrids and their parental genotypes. Furthermore, in the same plant material, a molecular genetics approach was used to assess the promoter region landscapes of two drought-responsive genes involved in key responsive pathways, the effector gene, PpDhn2 and the gene encoding the DRE2B TF was performed. Our data revealed the genotypes with the highest WUE (Figure 1); as well as documenting the variability between the PpDhn2 and DREB2B genes for each assessed plant line. (Figure 2, Figure 3 and Figure 4).
Leaf ash content and Δ13C were returned a positive correlation, and further; the ratios were similar to ratios obtained in previous reports in apple [37] and peach [38]. Also, it is known that ash content and Δ13C can be used to evaluate long-term WUE in fruit trees [37]. Based on these criteria, all P. davidiana, P. mira and the almond wild-relative species presented higher WUE than the hybrid genotypes and their parentals. This improved WUE could be due to the natural adaptation of these species to severe conditions, which represent a different growing strategy than the hybrid rootstocks studied. These wild-relative species originate from the arid steppes, deserts, and mountainous areas [63,64,65,66] in which the lack of water is a common factor. In these species stomata closure, a proven adaptation to water restrictive environments, results in decreased Δ13C, and therefore; Δ13C would be a reliable phenotypic measure of long-term drought survival [30,40,67]. Both leaf ash content and Δ13C appear to be suitable phenotypic parameters for assessing drought stress in Prunus. Further, Brendel et al. [61] were able to identify different quantitative trait loci (QTLs) for WUE as estimated by leaf Δ13C in Quercus robur L.
Promoter analysis of the PpDhn2 and DREB2B genes revealed the presence of CREs associated with ABA- and dehydration-response. We found that all individuals shared ABREs in both gene promoter regions, although the number of ABREs varied depending on the genotype and the gene promoter sequence. ABRE is the most abundant CRE in ABA-responsive gene expression, and at least two copies of an ABRE are necessary for ABA-responsive induction of transcription [3]. Different MYB motifs and a MYC element were also distributed throughout the promoter regions of both genes in each assessed genotype. Both MYB and MYC TF binding sites have been associated with drought responsiveness and are fundamental to ABA- and drought-responsive expression [68,69,70]. Further, specific CREs for PpDhn2 gene from each cluster were identified. This finding indicates additional expression regulation opportunities for the PpDhn2 locus compared to the DREB2B gene among the plant lines analyzed, which indicate more diversity of that promoter region compared to DREB2B promoter along the studied genotypes. The nine almond individuals from this cluster, that belong to P. bucharica, P. zabulica and P. vavilovi also had in common a HSE, a LTRE, as well as three MYB motifs that were more abundant elements than in the other individuals. However, we identified in the promoters of individuals from clusters I, II, III, IV and V an ABRE motif, one DRE element, three MYC recognition sites, and a GT3 box, the CRE to which the negative regulator of WUE Trihelix TF binds to, to regulate the expression of the SDD1 locus [71]. Other specific CREs were found in the almond wild-relative species and in a P. mira T1 belonging to clusters II, III, IV and V. Their PpDnh2 promoter regions harboured 3 DREs, one C-repeat binding factor and one LTRE. In previous reports, the promoters of the PpDhn2 gene in peach was studied and founding ABRE and MYC CREs, but not MYB binding sites, nor DRE/CRT or LTRE elements on the sense strand [14,15]. In our work, the DRE motifs and LTRE were located in the negative strand, but not in the sense strand. The influence of this cis-element and its orientation in gene promoter regions remains an area of debate with both dependent and independent orientation motifs [72,73]. Recent research did not find evidence of the influence of motif orientation in regulatory gene expression in a number of cis-elements studied in A. thaliana [74]. Similar to our findings, Bassett et al. [14] and Wisniewski et al. [15] observed that no DRE elements were found in positive sense in the PpDhn2 promoter and suggested that the absence of this cis-element was related to the lack of expression in response to cold. However, other reports have confirmed the presence of one DRE/CRT element in the promoter region of the YnSKn dehydrin class, which includes PpDhn2 [75]. In spite of this observation, it is known that YnSKn dehydrins are not expressed in response to cold. García-Bañuelos et al. [76] concluded that MdDhn, which shows great similarity with PpDhn2, was accumulated after a period of acclimation in apple trees. Based on that, Zolotarov and Strömvik [75] affirmed that cold-induced expression of YnSKn-type dehydrins would not be detected in some cases because of a limited time of exposure to low temperature. So that, the presence of the DRE and LTRE elements found in the anti-sense position in our individuals could have some effect in the expression of PpDhn2 in a possible response to cold.
All species shared essentially the same CREs in their DREB2B promoter region, evidencing a lower variability among the promoter sequences of every studied genotype. Beside the elements described before, we identified in sense orientation a HSE element, which binds to heat shock factors responsible for heat stress tolerance [77]. Moreover, although several reports demonstrated that DREB2B is not induced by low temperatures [1,17,67], a LTRE element, an important motif for the induction of cold regulated genes [78], was located upstream of the transcription start codon. The presence of ABREs motifs in the promoter region of DREB2B denoted the implication of this TF in ABA-dependent signal transduction pathway [79]. In the literature, the relation between dehydrin expression and an increase of WUE in cereals has been demonstrated. Sivamani et al. [80] confirmed an improvement of biomass and WUE in transgenic barley plants expressing HVA1 gene under drought conditions. Furthermore, Melišová et al. [33] suggested that elevated expression of the HvDhn4 gene, which is also a YnSKn-type dehydrin and similar to PpDhn2, was associated with the high WUE observed in a drought-tolerant variety of barley at 12 h after ABA treatment. Moreover, DREB TFs improved tolerance to abiotic stress in transgenic plants by regulation of genes involved in abiotic stress responses, so DREB TFs could increase WUE under water deficit conditions [81]. Furthermore, tobacco transgenic lines with overexpression of SbDREB2A, homolog to DREB2B, showed higher WUE and also, a higher expression of different dehydrins including ERD10B, ERD10D and LEA5, conferring drought tolerance [82].
The promoter regions of both genes also contained multiple cis-elements related to other plant responses. For example, SORLIP or I-box motifs which are usually upstream elements are regulated by light and the circadian clock; other elements are associated with to development responses, including the O2-site involved in zein metabolism regulation and a CAT-box linked to meristem expression. Some motifs are related to hormone responses including an ARR1AT motif (cytokinin response regulator), several CGTCA-motifs involved in methyljasmonate-responsiveness, and the GARE-motif associated with gibberellin-responsiveness, as well as others linked to additional stress. The presence of these CREs could reflect the role of DREB2B and PpDhn2 in other processes in addition to cold and drought [79,83,84,85].
Based on our data, the presence of DRE elements in PpDhn2 promoter belonging to the genotypes from clusters I, II, III, IV and V, suggest that PpDhn2, in addition to the ABA-dependent pathway, is also induced in an ABA-independent manner by the binding of DREB2B TF to these DRE elements under drought conditions [18,19,20,21]. From our promoter analysis of the PpDhn2 gene, we are unable to find a definitive association between PpDhn2 and different WUE and Ash measurements in a variety of Prunus genotypes.
In conclusion, our phylogenetic classification of the Prunus collection based on the CREs identified in the promoters of both genes showed a clear distinction between peach relatives and almond relatives. Nevertheless, in both PpDhn2 and DREB2B phylogenetic trees, it was demonstrated that P. davidiana (the highest WUE), a peach wild-relative specie [86], was closer to the other parental plant lines and their hybrids (lowest WUE). Our results show that phenotyping data is useful as an early selection criteria and that there are relatively few differences in promoter regions of the genes examined here, which suggests that improving drought survival could be accomplished by introgressing one or more of these genes/promoters into standard Prunus rootstock germplasm. According to our results, almond wild-relative species would be the genotypes with the best drought resistance potential for incorporation into future breeding programs aimed at generating new cultivars with drought tolerance potential.

Supplementary Materials

The following are available online at https://www.mdpi.com/2073-4395/8/4/42/s1, Table S1: List of the 48 individuals used in this study, Table S2: Cis-regulatory elements of PpDhn2 promoter gene region in each of the cluster-representative individual. Cells in grey color, CREs outside of the first 1000 bp 5′ of the translation start site. In red color, CREs in negative strand. In black color, CRES in positive strand, Table S3: Cis-regulatory elements of DREB2B promoter gene region in each of the cluster-representative individual. Cells in grey color, CREs outside of the first 1000 bp 5′ of the translation start site. In red color, CREs in negative strand. In black color, CRES in positive strand.

Acknowledgments

This work was supported by the Instituto Nacional de Investigaciones Agrarias (INIA) Project no. RTA-2014-00062; and also by the Research Group A12 of Aragon, Spain. We kindly appreciate the FPI-INIA 2012 grant for B.B. We highly appreciate the useful comments on the manuscript of R. Socias i Company.

Author Contributions

B.B. and M.J.R.-C. conceived and designed the experiments. B.B. performed the experiments; B.B., C.B. and D.M.G. analyzed the data; M.J.R.-C., C.B. and D.M.G. contributed reagents/materials/analysis tools; B.B., M.J.R.-C., C.B. and D.M.G. wrote the paper. M.J.R.-C. directed the project. All the authors read and approved the final manuscript.

Conflicts of Interest

The authors declare no conflict of interest.

References

  1. Bartels, D.; Sunkar, R. Drought and Salt Tolerance in Plants. CRC. Crit. Rev. Plant Sci. 2005, 24, 23–58. [Google Scholar] [CrossRef]
  2. Agarwal, P.K.; Agarwal, P.; Reddy, M.K.; Sopory, S.K. Role of DREB transcription factors in abiotic and biotic stress tolerance in plants. Plant Cell Rep. 2006, 25, 1263–1274. [Google Scholar] [CrossRef] [PubMed]
  3. Yamaguchi-Shinozaki, K.; Shinozaki, K. Organization of cis-acting regulatory elements in osmotic- and cold-stress-responsive promoters. Trends Plant Sci. 2005, 10, 88–94. [Google Scholar] [CrossRef] [PubMed]
  4. Battaglia, M.; Olvera-Carrillo, Y.; Garciarrubio, A.; Campos, F.; Covarrubias, A. The enigmatic LEA proteins and other hydrophilins. Plant Physiol. 2008, 148, 6–24. [Google Scholar] [CrossRef] [PubMed]
  5. Hundertmark, M.; Hincha, D.K. LEA (Late Embryogenesis Abundant) proteins and their encoding genes in Arabidopsis thaliana. BMC Genom. 2008, 9, 118. [Google Scholar] [CrossRef] [PubMed]
  6. Banerjee, A.; Roychoudhury, A. Group II late embryogenesis abundant (LEA) proteins: Structural and functional aspects in plant abiotic stress. Plant Growth Regul. 2016, 79, 1–17. [Google Scholar] [CrossRef]
  7. Close, T.J. Dehydrins: Emergence of a biochemical role of a family of plant dehydration proteins. Physiol. Plant. 1996, 97, 795–803. [Google Scholar] [CrossRef]
  8. Hara, M.; Terashima, S.; Fukaya, T.; Kuboi, T. Enhancement of cold tolerance and inhibition of lipid peroxidation by citrus dehydrin in transgenic tobacco. Planta 2003, 217, 290–298. [Google Scholar] [CrossRef] [PubMed]
  9. Chiappetta, A.; Muto, A.; Bruno, L.; Woloszynska, M.; Van Lijsebettens, M.; Bitonti, M.B.; Lijsebettens, M. Van; Bitonti, M.B. A dehydrin gene isolated from feral olive enhances drought tolerance in Arabidopsis transgenic plants. Front. Plant Sci. 2015, 6, 392. [Google Scholar] [CrossRef] [PubMed] [Green Version]
  10. Bao, F.; Du, D.; An, Y.; Yang, W.; Wang, J.; Cheng, T.; Zhang, Q. Overexpression of Prunus mume Dehydrin Genes in Tobacco Enhances Tolerance to Cold and Drought. Front. Plant Sci. 2017, 8, 151. [Google Scholar] [CrossRef] [PubMed]
  11. Vornam, B.; Gailing, O.; Derory, J.; Plomion, C.; Kremer, A.; Finkeldey, R. Characterisation and natural variation of a dehydrin gene in Quercus petraea (Matt.) Liebl. Plant Biol. 2011, 13, 881–887. [Google Scholar] [CrossRef] [PubMed]
  12. Velasco-Conde, T.; Yakovlev, I.; Majada, J.P.; Aranda, I.; Johnsen, Ø. Dehydrins in maritime pine (Pinus pinaster) and their expression related to drought stress response. Tree Genet. Genomes 2012, 8, 957–973. [Google Scholar] [CrossRef]
  13. Artlip, T.; Wisniewski, M. Tissue-specific Expresson of a Dehydrin Gene in One-year-old ‘Rio Oso Gem’ Peach Trees. J. Am. Soc. Hortic. Sci. 1997, 122, 784–787. [Google Scholar]
  14. Bassett, C.L.; Wisniewski, M.E.; Artlip, T.S.; Richart, G.; Norelli, J.L.; Farrell, R.E. Comparative expression and transcript initiation of three peach dehydrin genes. Planta 2009, 230, 107–118. [Google Scholar] [CrossRef] [PubMed]
  15. Wisniewski, M.E.; Bassett, C.L.; Renaut, J.; Farrell, R.; Tworkoski, T.; Artlip, T.S. Differential regulation of two dehydrin genes from peach (Prunus persica) by photoperiod, low temperature and water deficit. Tree Physiol. 2006, 26, 575–584. [Google Scholar] [CrossRef] [PubMed]
  16. Bielsa, B.; Leida, C.; Rubio-Cabetas, M.J. Physiological characterization of drought stress response and expression of two transcription factors and two LEA genes in three Prunus genotypes. Sci. Hortic. (Amst.) 2016, 213, 260–269. [Google Scholar] [CrossRef]
  17. Liu, Q.; Kasuga, M.; Sakuma, Y.; Abe, H.; Miura, S.; Yamaguchi-Shinozaki, K.; Shinozaki, K. Two transcription factors, DREB1 and DREB2, with an EREBP/AP2 DNA binding domain separate two cellular signal transduction pathways in drought- and low-temperature-responsive gene expression, respectively, in Arabidopsis. Plant Cell 1998, 10, 1391–1406. [Google Scholar] [CrossRef] [PubMed]
  18. Cao, Y.; Xiang, X.; Geng, M.; You, Q.; Huang, X. Effect of HbDHN1 and HbDHN2 Genes on Abiotic Stress Responses in Arabidopsis. Front. Plant Sci. 2017, 8, 470. [Google Scholar] [CrossRef] [PubMed]
  19. Hassan, N.M.; El-Bastawisy, Z.M.; El-Sayed, A.K.; Ebeed, H.T.; Nemat Alla, M.M. Roles of dehydrin genes in wheat tolerance to drought stress. J. Adv. Res. 2015, 6, 179–188. [Google Scholar] [CrossRef] [PubMed]
  20. Shinozaki, K.; Yamaguchi-Shinozaki, K. Gene networks involved in drought stress response and tolerance. J. Exp. Bot. 2007, 58, 221–227. [Google Scholar] [CrossRef] [PubMed]
  21. Tavakol, E.; Sardaro, M.L.S.; Shariati, J.V.; Rossini, L.; Porceddu, E. Isolation, promoter analysis and expression profile of Dreb2 in response to drought stress in wheat ancestors. Gene 2014, 549, 24–32. [Google Scholar] [CrossRef] [PubMed]
  22. Nakashima, K.; Shinwari, Z.K.; Sakuma, Y.; Seki, M.; Miura, S.; Shinozaki, K.; Yamaguchi-Shinozaki, K. Organization and expression of two Arabidopsis DREB2 genes encoding DRE-binding proteins involved in dehydration-and high-salinity-responsive gene expression. Plant Mol. Biol. 2000, 42, 657–665. [Google Scholar] [CrossRef] [PubMed]
  23. Mizoi, J.; Shinozaki, K.; Yamaguchi-Shinozaki, K. AP2/ERF family transcription factors in plant abiotic stress responses. Biochim. Biophys. Acta 2012, 1819, 86–96. [Google Scholar] [CrossRef] [PubMed]
  24. Dubouzet, J.G.; Sakuma, Y.; Ito, Y.; Kasuga, M.; Dubouzet, E.G.; Miura, S.; Seki, M.; Shinozaki, K.; Yamaguchi-Shinozaki, K. OsDREB genes in rice, Oryza sativa L., encode transcription activators that function in drought-, high-salt- and cold-responsive gene expression. Plant J. 2003, 33, 751–763. [Google Scholar] [CrossRef] [PubMed]
  25. Verslues, P.E.; Agarwal, M.; Katiyar-Agarwal, S.; Zhu, J.; Zhu, J.-K. Methods and concepts in quantifying resistance to drought, salt and freezing, abiotic stresses that affect plant water status. Plant J. 2006, 45, 523–539. [Google Scholar] [CrossRef] [PubMed]
  26. Pou, A.; Medrano, H.; Flexas, J.; Tyerman, S.D. A putative role for TIP and PIP aquaporins in dynamics of leaf hydraulic and stomatal conductances in grapevine under water stress and re-watering. Plant Cell Environ. 2013, 36, 828–843. [Google Scholar] [CrossRef] [PubMed]
  27. Lawson, T.; Blatt, M.R. Stomatal size, speed, and responsiveness impact on photosynthesis and water use efficiency. Plant Physiol. 2014, 164, 1556–1570. [Google Scholar] [CrossRef] [PubMed]
  28. Tomás, M.; Medrano, H.; Pou, A.; Escalona, J.M.; Martorell, S.; Ribas-Carbó, M.; Flexas, J. Water-use efficiency in grapevine cultivars grown under controlled conditions: Effects of water stress at the leaf and whole-plant level. Aust. J. Grape Wine Res. 2012, 18, 164–172. [Google Scholar] [CrossRef]
  29. Blum, A. Drought resistance, water-use efficiency, and yield potential—Are they compatible, dissonant, or mutually exclusive? Aust. J. Agric. Res. 2005, 56, 1159–1168. [Google Scholar] [CrossRef]
  30. Blum, A. Effective use of water (EUW) and not water-use efficiency (WUE) is the target of crop yield improvement under drought stress. Field Crops Res. 2009, 112, 119–123. [Google Scholar] [CrossRef]
  31. De Almeida Silva, M.; Moura dos Santos, C.; Labate, C.A.; Guidetti-Gonzalez, S.; de santana Borges, J.; Ferreira, L.C.; Oliveira De Lima, R.; Fritsche-Neto, R. Breeding for Water Use Efficiency. In Plant Breeding for Abiotic Stress Tolerance; Fritsche, R., Borém, A., Eds.; Springer: Berlin/Heidelberg, Germany, 2012; pp. 87–102. ISBN 978-3-642-30552-8. [Google Scholar]
  32. Farquhar, G.D.; Richards, R.A. Isotopic Composition of Plant Carbon Correlates with Water-use Efficiency of Wheat Genotypes. Aust. J. Plant Physiol. 1984, 11, 539–552. [Google Scholar] [CrossRef]
  33. Melišová, L.; Hronková, M.; Holková, L.; Klemš, M.; Smutná, P. Use of ABA treatment for the activation of drought protective mechanisms in barley under non-stress conditions. Acta Univ. Agric. Silvic. Mendel. Brun. 2015, 63, 87–93. [Google Scholar] [CrossRef]
  34. Moghaddam, A.; Raza, A.; Vollmann, J.; Ardakani, M.R.; Wanek, W.; Gollner, G.; Friedel, J.K. Carbon isotope discrimination and water use efficiency relationships of alfalfa genotypes under irrigated and rain-fed organic farming. Eur. J. Agron. 2013, 50, 82–89. [Google Scholar] [CrossRef]
  35. Araus, J.L.; Amaro, T.; Casadesús, J.; Asbati, A.; Nachit, M.M. Relationships between ash content, carbon isotope discrimination and yield in durum wheat. Aust. J. Plant Physiol. 1998, 25, 835–842. [Google Scholar] [CrossRef]
  36. Zhu, L.; Liang, Z.S.; Xu, X.; Li, S.H. Relationship between Carbon Isotope Discrimination and Mineral Content in Wheat Grown under Three Different Water Regimes. J. Agron. Crop Sci. 2008, 194, 421–428. [Google Scholar] [CrossRef]
  37. Glenn, D.M. An analysis of ash and isotopic carbon discrimination (Δ13C) methods to evaluate water use efficiency in apple. Sci. Hortic. (Amst.) 2014, 171, 32–36. [Google Scholar] [CrossRef]
  38. Glenn, D.M.; Gasic, K. Influence of within year treatments and between year environmental differences on peach leaf ash and carbon isotopic discrimination responses. Sci. Hortic. (Amst.) 2015, 193, 258–260. [Google Scholar] [CrossRef]
  39. Glenn, D.M.; Bassett, C. Apple ∆13C Discrimination Is Related to Shoot Ash Content. HortScience 2011, 46, 213–216. [Google Scholar]
  40. Blum, A. Drought Resistance and Its Improvement. In Plant Breeding for Water-Limited Environments; Blum, A., Ed.; Springer: New York, NY, USA, 2011; pp. 53–152. ISBN 9781441974907. [Google Scholar]
  41. Masle, J.; Farquhar, G.D.; Wong, S.C. Transpiration Ratio and Plant Mineral Content Are Related Among Genotypes of a Range of Species. Aust. J. Plant Physiol. 1992, 19, 709–721. [Google Scholar] [CrossRef]
  42. Layne, R.E.C. Peach Rootstocks. In Rootstocks for Fruit Crops; Rom, R.C., Carlson, R.F., Eds.; Wiley: New York, NY, USA, 1987; pp. 185–216. [Google Scholar]
  43. Bielsa, B.; Jiwan, D.; Fernandez i Marti, A.; Dhingra, A.; Rubio-Cabetas, M.J. Detection of SNP and validation of a SFP InDel (deletion) in inverted repeat region of the Prunus species chloroplast genome. Sci. Hortic. (Amst.) 2014, 168, 108–112. [Google Scholar] [CrossRef]
  44. Byrne, D.H.; Raseira, M.B.; Bassi, D.; Piagnani, M.C.; Gasic, K.; Reighard, G.L.; Moreno, M.A.; Pérez, S. Peach. In Fruit Breeding; Badenes, M.L., Byrne, D.H., Eds.; Springer: Boston, MA, USA, 2012; pp. 505–569. ISBN 978-1-4419-0762-2. [Google Scholar]
  45. Felipe, A.J. ‘Felinem’, ‘Garnem’, and ‘Monegro’ almond × peach hybrid rootstocks. HortScience 2009, 44, 196–197. [Google Scholar]
  46. Lecouls, A.C.; Bergougnoux, V.; Rubio-Cabetas, M.J.; Bosselut, N.; Voisin, R.; Poessel, J.L.; Faurobert, M.; Bonnet, A.; Salesses, G.; Dirlewanger, E.; et al. Marker-assisted selection for the wide-spectrum resistance to root-knot nematodes conferred by the Ma gene from Myrobalan plum (Prunus cerasifera) in interspecific Prunus material. Mol. Breed. 2004, 13, 113–124. [Google Scholar] [CrossRef]
  47. Alimohammadi, A.; Shiran, B.; Martínez-Gómez, P.; Ebrahimie, E. Identification of water-deficit resistance genes in wild almond Prunus scoparia using cDNA-AFLP. Sci. Hortic. (Amst.) 2013, 159, 19–28. [Google Scholar] [CrossRef]
  48. Gradziel, T.M.; Martínez-Gómez, P.; Dicenta, F.; Kester, D.E. The Utilization of Related Prunus Species for Almond Variety Improvement. J. Am. Pomol. Soc. 2001, 55, 100–108. [Google Scholar]
  49. Farquhar, G.D.; Ehleringer, J.R.; Hubick, K.T. Carbon Isotope Discrimination and Photosynthesis. Annu. Rev. Plant Physiol. Plant Mol. Biol. 1989, 40, 503–537. [Google Scholar] [CrossRef]
  50. Francey, R.J.; Tans, P.P.; Allison, C.E.; Enting, I.G.; White, J.W.C.; Trolier, M. Changes in oceanic and terrestrial carbon uptake since 1982. Nature 1995, 373, 326–330. [Google Scholar] [CrossRef]
  51. Doyle, J.; Doyle, J. A rapid DNA isolation procedure for small quantities of fresh leaf tissue. Phytochem. Bull. 1987, 19, 11–15. [Google Scholar]
  52. Hall, T.A. BioEdit: A user-friendly biological sequence alignment editor and analysis program for Windows 95/98/NT. Nucleic Acids. Symp. Ser. 1999, 41, 95–98. [Google Scholar]
  53. Edgar, R.C. MUSCLE: Multiple sequence alignment with high accuracy and high throughput. Nucleic Acids Res. 2004, 32, 1792–1797. [Google Scholar] [CrossRef] [PubMed]
  54. Huang, X.; Madan, A. CAP3: A DNA sequence assembly program. Genome Res. 1999, 9, 868–877. [Google Scholar] [CrossRef] [PubMed]
  55. Tamura, K.; Stecher, G.; Peterson, D.; Filipski, A.; Kumar, S. MEGA6: Molecular Evolutionary Genetics Analysis version 6.0. Mol. Biol. Evol. 2013, 30, 2725–2729. [Google Scholar] [CrossRef] [PubMed]
  56. Saitou, N.; Nei, M. The neighbor-joining method: A new method for reconstructing phylogenetic trees. Mol. Biol. Evol. 1987, 4, 406–425. [Google Scholar] [PubMed]
  57. Felsenstein, J. Confidence limits on phylogenies: An approach using the bootstrap. Evolution 1985, 39, 783–791. [Google Scholar] [CrossRef] [PubMed]
  58. Kimura, M. A simple method for estimating evolutionary rate of base substitutions through comparative studies of nucleotide sequences. J. Mol. Evol. 1980, 16, 111–120. [Google Scholar] [CrossRef] [PubMed]
  59. Lescot, M.; Dehais, P.; Thijs, G.; Marchal, K.; Moreau, Y.; Van de Peer, Y.; Rouze, P.; Rombauts, S. PlantCARE, a database of plant cis-acting regulatory elements and a portal to tools for in silico analysis of promoter sequences. Nucleic Acids Res. 2002, 30, 325–327. [Google Scholar] [CrossRef] [PubMed]
  60. Chang, W.C.; Lee, T.Y.; Huang, H.D.; Huang, H.Y.; Pan, R.L. PlantPAN: Plant promoter analysis navigator, for identifying combinatorial cis-regulatory elements with distance constraint in plant gene groups. BMC Genom. 2008, 9, 561. [Google Scholar] [CrossRef] [PubMed]
  61. Arndt, S.K.; Wanek, W.; Clifford, S.C.; Popp, M. Contrasting adaptations to drought stress in field-grown Ziziphus mauritiana and Prunus persica trees: Water relations, osmotic adjustment and carbon isotope composition. Aust. J. Plant Phisiol. 2000, 27, 985–996. [Google Scholar] [CrossRef]
  62. Brendel, O.; Le Thiec, D.; Scotti-Saintagne, C.; Bodénès, C.; Kremer, A.; Guehl, J.-M. Quantitative trait loci controlling water use efficiency and related traits in Quercus robur L. Tree Genet. Genomes 2008, 4, 263–278. [Google Scholar] [CrossRef]
  63. Gradziel, T.M. Almond (Prunus dulcis) Breeding. In Breeding Plantation Tree Crops: Temperate Species; Jain, S.M., Prriyadarshan, P.M., Eds.; Springer: New York, NY, USA, 2009; pp. 1–32. ISBN 978-0-387-71202-4. [Google Scholar]
  64. Kester, D.E.; Gradziel, T.M. Almonds (Prunus). In Fruit Breeding; Moore, J.N., Janick, J., Eds.; Wiley & Sons: New York, NY, USA, 1996; pp. 1–97.(Prunus). In Fruit Breeding; Moore, J.N., Janick, J., Eds.; Wiley & Sons: New York, NY, USA, 1996; pp. 1–97. [Google Scholar]
  65. Wang, Y.-L. Peach Growing and Germoplasm in China. Acta Hortic. 1985, 173, 51–55. [Google Scholar]
  66. Cao, Y.; Luo, Q.; Tian, Y.; Meng, F. Physiological and proteomic analyses of the drought stress response in Amygdalus Mira (Koehne) Yü et Lu roots. BMC Plant Biol. 2017, 17, 1–16. [Google Scholar] [CrossRef] [PubMed]
  67. Lata, C.; Prasad, M. Role of DREBs in regulation of abiotic stress responses in plants. J. Exp. Bot. 2011, 62, 4731–4748. [Google Scholar] [CrossRef] [PubMed]
  68. Abe, H.; Yamaguchi-Shinozaki, K.; Takeshi, U.; Iwasaki, T.; Hosokawa, D.; Shinozaki, K. Role of Arabidopsis MYC and MYB Homologs in Drought-and Abscisic Acid-Regulated Gene Expression. Plant Cell 1997, 9, 1859–1868. [Google Scholar] [CrossRef] [PubMed]
  69. Roychoudhury, A.; Paul, S.; Basu, S. Cross-talk between abscisic acid-dependent and abscisic acid-independent pathways during abiotic stress. Plant Cell Rep. 2013, 32, 985–1006. [Google Scholar] [CrossRef] [PubMed]
  70. Tran, L.-S.P.; Nakashima, K.; Sakuma, Y.; Simpson, S.D.; Fujita, Y.; Maruyama, K.; Fujita, M.; Seki, M.; Shinozaki, K.; Yamaguchi-Shinozaki, K. Isolation and functional analysis of Arabidopsis stress-inducible NAC transcription factors that bind to a drought-responsive cis-element in the early responsive to dehydration stress 1 promoter. Plant Cell 2004, 16, 2481–2498. [Google Scholar] [CrossRef] [PubMed]
  71. Yoo, C.Y.; Pence, H.E.; Jin, J.B.; Miura, K.; Gosney, M.J.; Hasegawa, P.M.; Mickelbart, M.V. The Arabidopsis GTL1 transcription factor regulates water use efficiency and drought tolerance by modulating stomatal density via transrepression of SDD1. Plant Cell 2010, 22, 4128–4141. [Google Scholar] [CrossRef] [PubMed]
  72. Guo, W.T.; Bell, K.D.; Ou, J.H. Characterization of the hepatitis B virus EnhI enhancer and X promoter complex. J. Virol. 1991, 65, 6686–6692. [Google Scholar] [PubMed]
  73. Lin, C.-Y.; Chen, Y.-H.; Lee, H.-C.; Tsai, H.-J. Novel cis-element in intron 1 represses somite expression of zebrafish myf-5. Gene 2004, 334, 63–72. [Google Scholar] [CrossRef] [PubMed]
  74. Lis, M.; Walther, D. The orientation of transcription factor binding site motifs in gene promoter regions: Does it matter? BMC Genom. 2016, 17, 185. [Google Scholar] [CrossRef]
  75. Zolotarov, Y.; Strömvik, M. De novo regulatory motif discovery identifies significant motifs in promoters of five classes of plant dehydrin genes. PLoS ONE 2015, 10, e0129016. [Google Scholar] [CrossRef] [PubMed]
  76. Garcia-Bañuelos, M.; Gardea, A.; Winzerling, J.; Vazquez-Moreno, L. Characterization of a Midwinter-Expressed Dehydrin (DHN) Gene from Apple Trees (Malus domestica). Plant Mol. Biol. Rep. 2009, 27, 476. [Google Scholar] [CrossRef]
  77. Larkindale, J.; Vierling, E. Core Genome Responses Involved in Acclimation to High Temperature. Plant Physiol. 2008, 146, 748–761. [Google Scholar] [CrossRef] [PubMed]
  78. Dunn, M.A.; White, A.J.; Vural, S.; Hughes, M.A. Identification of promoter elements in a low-temperature-responsive gene (blt4.9) from barley (Hordeum vulgare L.). Plant Mol. Biol. 1998, 38, 551–564. [Google Scholar] [CrossRef] [PubMed]
  79. Sazegari, S.; Niazi, A.; Ahmadi, S.F. A study on the regulatory network with promoter analysis for Arabidopsis DREB-genes. Bioinformation 2015, 11, 101–106. [Google Scholar] [CrossRef] [PubMed]
  80. Sivamani, E.; Bahieldin, A.; Wraith, J.M.; Al-Niemi, T.; Dyer, W.E.; Ho, T.H.D.; Qu, R. Improved biomass productivity and water use efficiency under water deficit conditions in transgenic wheat constitutively expressing the barley HVA1 gene. Plant Sci. 2000, 155, 1–9. [Google Scholar] [CrossRef]
  81. Khan, M.S. The Role of DREB Transcription Factors in Abiotic Stress Tolerance of Plants. Biotechnol. Biotechnol. Equip. 2011, 25, 2433–2442. [Google Scholar] [CrossRef]
  82. Gupta, K.; Jha, B.; Agarwal, P.K. A Dehydration-Responsive Element Binding (DREB) Transcription Factor from the Succulent Halophyte Salicornia brachiata Enhances Abiotic Stress Tolerance in Transgenic Tobacco. Mar. Biotechnol. 2014, 16, 657–673. [Google Scholar] [CrossRef] [PubMed]
  83. Ban, Q.; Liu, G.; Wang, Y. A DREB gene from Limonium bicolor mediates molecular and physiological responses to copper stress in transgenic tobacco. J. Plant Physiol. 2011, 168, 449–458. [Google Scholar] [CrossRef] [PubMed]
  84. Li, C.Y.; Junttila, O.; Ernstsen, A.; Heino, P.; Palva, E.T. Photoperiodic control of growth, cold acclimation and dormancy development in silver birch (Betula pendula) ecotypes. Physiol. Plant. 2003, 117, 206–212. [Google Scholar] [CrossRef]
  85. Yang, Y.; He, M.; Zhu, Z.; Li, S.; Xu, Y.; Zhang, C.; Singer, S.D.; Wang, Y. Identification of the dehydrin gene family from grapevine species and analysis of their responsiveness to various forms of abiotic and biotic stress. BMC Plant Biol. 2012, 12, 140. [Google Scholar] [CrossRef] [PubMed]
  86. Cheng, Z.; Gasic, K.; Wang, Z.; Chen, X. Genetic Diversity and Genetic Structure in Natural Populations of Prunus davidiana Germplasm by SSR Markers. J. Agric. Sci. 2011, 3, 113–125. [Google Scholar] [CrossRef]
Figure 1. Relationship between carbon isotope discrimination [Δ13C (‰)] and leaf ash content (%) for Prunus genotypes. Arrows indicate the negative relation between these two parameters and WUE.
Agronomy 08 00042 g001
Figure 2. Dendrogram representing the phylogenetic differences in PpDhn2 promoter gene regions. The tree was constructed using the neighbor-joining method with 1000 bootstrap replicates.
Agronomy 08 00042 g002
Figure 3. Dendrogram representing the phylogenetic differences in DREB2B promoter gene regions. The tree was constructed using the neighbor-joining method with 1000 bootstrap replicates.
Agronomy 08 00042 g003
Figure 4. Schematic representation of the 1000 pb region upstream of the PpDhn2 (a) and DREB2B (b) promoters in each of the cluster-representing individuals. Promoter regions were defined as the first 1000 pb 5′ of the translation start site. A: Abscisic acid responsive (ABRE)-elements, in red; AB: ABARE-element, in red; AP: APETALA 2/ethylene-responsive element binding factor (AP2/ERF), in black; AS: ASF-1 binding site, in brown; B: myeloblastosis (MYB)-elements, in light green; C: CAAT-box, in dark green; Ca: Calmodulin-binding motif, in black; D: dehydration-responsive (DRE)-elements, in pink; E: ethylene-responsive element (ERE), in dark blue; F: basic leucine zipper (bZIP) TF, in black; G: G-box, in pink; H: heat shock promoter element (HSE), in salmon; L: low-temperature-responsive element (LTRE), in blue; M: myelocytomatosis (MYC)-elements, in orange; S: SEF4 TF, in red; S3: SEF3 TF, in red; T: TATA-box, in yellow; GT3: GT3-box, in purple.
Agronomy 08 00042 g004
Table 1. Carbon isotope discrimination [Δ13C (‰)] and leaf ash content (%) of 21 Prunus genotypes. (SD: Standard Deviation; nd: no data; CV: Coefficient of variation).
GenotypesΔ13C (‰)Ash (%)
P. davidiana T117.7986.190
P. davidiana T218.1575.850
P. davidiana T317.1865.830
P. mira T119.6018.070
P. mira T218.9447.210
P. vavilovi T120.0117.180
P. vavilovi T220.7856.790
P. vavilovi T318.7127.170
P. vavilovi T420.3496.830
P. webbii F17 T119.20211.760
P. webbii F17 T219.78512.840
P. webbii F17 T320.66212.680
P. webbii F3 T120.32112.950
P. webbii F3 T220.9708.000
P. gorki T120.4846.210
P. gorki T221.1398.240
P. gorki T321.0778.050
P. gorki T418.4418.260
P. zabulica F1 T121.0565.750
P. zabulica F1 T221.2416.030
P. zabulica F18 T120.3837.630
P. zabulica F18 T319.1047.850
P. zabulica F18 T420.2578.120
P. bucharica F2 T119.0539.060
P. bucharica F7 T119.7107.990
P. bucharica F7 T221.2008.370
P. bucharica F7 T320.2868.030
P. bucharica F7 T422.3446.930
‘GN-8’20.5489.890
P. persica var. nucipersica20.62711.570
P. orientalis T120.9267.810
P. orientalis T219.7148.450
P. orientalis T321.7898.990
P. orientalis T420.2167.350
P. kotschii T120.1127.010
P. kotschii T221.5966.690
P. kotschii T320.5546.520
P. kotschii T421.2106.030
Cadaman’20.8809.660
Garfi’ almond20.9947.380
‘GN-10’21.15411.540
Barrier’21.29210.860
‘Garnem’21.97914.470
‘Felinem’22.14614.450
‘GF-677′22.23517.970
‘Nemared’ peach23.16914.600
‘Mira × Pecher’22.94817.600
‘Monegro’23.10513.240
Mean20.5309.124
Standard deviation1.3143.102
CV (%)6.40133.998
Table 2. Description of drought-related cis-regulatory elements (CREs) revealed in the promoter region of PpDhn2 and DREB2B.
FamilyElement NameElement Sequence (5→3′)Description
PpDhn2 promoter sequence
bZIPABRELATERD1AACGTAbscisic acid (ABA)-responsive element
(Motif sequence only)ACGTATERD1ACGTABA-responsive element
(Motif sequence only)ABRERATCALMACGYGBABA-responsive element
(Motif sequence only)ACGTABREMOTIFA2OSEM ACGTGKCABA-responsive element
bZIPASF1MOTIFCAMVTGACGASF-1 binding site related to ABA signaling
bZIPDPBFCOREDCDC3 ACACNNGBasic leucine zipper (bZIP) encoded by ABI5
(Motif sequence only)SEF4MOTIFGM7SRTTTTTRSEF4 binding site; ABA-responsive element
(Motif sequence only)ABREDISTBBNNAPAGCCACTTGTCdist B (distal portion of B-box) shown similarity to ABRE/dist B ABRE mediated transactivation by ABI3 and ABI3-dependent response to ABA
(Motif sequence only)ACGTTBOXAACGTTT-box according to the nomenclature of ACGT elements
CG-1; CAMTACAMTA3; SR1[ACG]CGCG[GTC]Calmodulin-binding transcription activator 3
(Motif sequence only)CBFHV RYCGACBinding site of CBF1
(Motif sequence only)DRE1COREZMRAB17 ACCGAGADRE1 core
AP2; ERFDehydration-responsive element (DRE)[AG]CCGACMediates cold or dehydration-inducible transcription
(Motif sequence only)DRE2COREZMRAB17 ACCGACDRE2 core
(Motif sequence only)DRECRTCOREAT RCCGACCore motif of DRE/CRT cis-acting element
DehydrinLTRECOREATCOR15 CCGACCore of low temperature responsive element (LTRE)
(Motif sequence only)ERELEE4AWTTCAAAEthylene responsive element
HSFHeat shock promoter element (HSE)AGAAnnTTCTHeat shock element
(Motif sequence only)LTRE1HVBLT49CCGAAALow-temperature-responsive element (LTRE-1)
(Motif sequence only)MYB2CONSENSUSAT YAACKGMyeloblastosis (MYB) recognition site
MybMYBCORECNGTTRMYB2 TF
(Motif sequence only)MYBCOREATCYCB1 AACGGMYB recognition site
(Motif sequence only)MYBST1GGATAMYB recognition site
(Motif sequence only)MYB1AT WAACCAMYB recognition site
Myb/SANT; MYBMYBGAHV TAACAAAMyb-like DNA-binding domain
(Motif sequence only)MYBPLANT MACCWAMCMYB binding site
bHLHEBOXBNNAPA CANNTGMyelocytomatosis (MYC) recognition site
NAC; NAMMYCATERD1RCCGACMYC recognition sequence
bHLHMYCATRD22 CACATGBinding site for MYC
bHLHG-box CACNTGMYC2 gene
TrihelixGT3 box GGTAAANegative regulator of water use efficiency
DREB2B promoter sequence
bZIP(ABARE) HEXMOTIFTAH3H4 ACGTCAAbscisic acid response element (ABARE)
bZIPABRELATERD1AACGTABA-responsive element
LEA_5ABREMOTIFAOSOSEM /LEA5TACGTGTCMotif A ABRE-like sequence
(Motif sequence only)ABRERATCALMACGYGBABA-responsive element
(Motif sequence only)ACGTABREMOTIFA2OSEM ACGTGKCABA-responsive element
(Motif sequence only)ACGTATERD1ACGTABA-responsive element
bZIPASF1MOTIFCAMVTGACGASF-1 binding site related to ABA signaling
(Others)DPBFCOREDCDC3 ACACNNGNovel bZIP encoded by ABI5
CG-1; CAMTACAMTA3; SR1[ACG]CGCG[GTC]Calmodulin-binding transcription activator 3
(Motif sequence only)ERELEE4 AWTTCAAAEthylene responsive element
HSFHeat shock promoter element (HSE)AGAAnnTTCTHeat shock element
(Motif sequence only)LTRE1HVBLT49CCGAAALow-temperature-responsive element (LTRE-1)
(Motif sequence only)MYB1AT WAACCAMYB recognition site
MybMYBCORECNGTTRMYB2 TF
(Motif sequence only)MYBCOREATCYCB1AACGGMyb core
Myb/SANT; MYBMYBGAHV TAACAAAMyb-like DNA-binding domain
(Motif sequence only)MYBPLANT MACCWAMCMYB binding site
(Motif sequence only)MYBST1GGATAMYB recognition site
bHLHEBOXBNNAPA CANNTGMYC recognition site
(Motif sequence only)MYB2CONSENSUSAT YAACKGMYB recognition site
(Motif sequence only)SEF3MOTIFGM AACCCASEF3 binding site
(Motif sequence only)SEF4MOTIFGM7S RTTTTTRSEF4 binding site

