Article

Quantifying Variability in Maize Yield Response to Nutrient Applications in the Northern Nigerian Savanna

1
Department of Earth and Environmental Sciences, Division of Soil and Water Management, KU Leuven, Kasteelpark Arenberg 20, 3001 Heverlee, Belgium
2
Department of Soil Science, Bayero University Kano, Kano 70001, Nigeria
3
Centre for Dryland Agriculture (CDA), Bayero University Kano, Kano 70001, Nigeria
4
International Institute of Tropical Agriculture, PMB 5320, Oyo Road, Ibadan 200001, Oyo State, Nigeria
5
International Plant Nutrition Institute (IPNI), c/o IFDC—East & Southern Africa Division, ICIPE Compound, Duduville—Kasarani, Thika Road, Nairobi P.O. Box 30772-00100, Kenya
*
Author to whom correspondence should be addressed.
Agronomy 2018, 8(2), 18; https://doi.org/10.3390/agronomy8020018
Submission received: 23 December 2017 / Revised: 7 February 2018 / Accepted: 8 February 2018 / Published: 10 February 2018

Abstract

:
Diagnostic on-farm nutrient omission trials were conducted over two cropping seasons (2015 and 2016) to assess soil nutrients related constraints to maize yield in the northern Nigerian savanna agro-ecological zone and to quantify their variability. Two sets of trials were conducted side by side, one with an open pollinated maize variety (OPV) and the other one with a hybrid maize variety and each set had six equal treatments laid out in 198 farmers’ fields. The treatments comprised (i) a control, (ii) a PK (‘−N,’ without N), (iii) an NK (‘−P,’ without P), (iv) an NP (‘−K,’ without K), (v) an NPK and (vi) an NPK + S + Ca + Mg + Zn + B (‘+SMM,’ NPK plus secondary macro- and micro-nutrients). Moderate to a large variability in most soil characteristics was observed in the studied fields. Consequently, cluster analysis revealed three distinct yield-nutrient response classes common for the two types of maize varieties. These define classes were fields that have (i) no-response to any nutrient, (ii) a large response to N and P and (iii) a large response to N alone. Although overall yield performance of OPV and hybrid varieties was similar, a distinct fourth class was identified for the hybrid variety, (iv) fields with a large response to N and secondary macro- and micro-nutrients. The results indicate that the large variability in soil nutrients related constraints need to be accounted for to optimize maize yield in the northern Nigerian savanna. The development of field- and area-specific fertilizer recommendations is highly needed, using simple decision support tools that consider variable soil fertility conditions and yield responses as obtained from this study.

1. Introduction

Factors such as wide suitability boundaries and multiple socioeconomic uses make maize (Zea mays L.) the most widely grown cereal in Nigeria [1]. According to FAO (Food and Agriculture Organization) data [2], the land area planted to maize in Nigeria increased from 1.38 to 5.20 million hectares (1961–2013). This substantial expansion of the land area devoted to maize cultivation largely resulted in an increase in production from 1.10 to 10.40 million metric tonnes over the same period [2]. However, maize yield per unit area in Nigeria is still low, at about 2 tonnes per hectare (t·ha−1) [2] which is far below yields observed in well-managed field experiments of more than 7 t·ha−1 [3,4,5]. Meanwhile, studies from many parts of the country have shown an increasing demand for maize amidst growing utilization by food processing industries and livestock feed mills [6,7]. Since opportunities to expand a cultivated area are limited [8], further increases in maize production will be derived from sustainable intensification on existing farmland.
Inherent low soil fertility and poor nutrient management have been one of the major factors limiting maize yield in Nigeria [9]. Most Nigerian soils are highly weathered with low activity clays (such as kaolinite) which makes them more vulnerable to fertility degradation under continuous arable use with poor nutrient replenishment [10,11,12]. Deficiencies in soil primary macronutrients (particularly N, P and K) are widespread and have been reported in most parts of the country [9,13,14,15]. In addition, deficiencies of S and some micronutrients have also been reported in some Nigerian savanna soils [16,17,18]. Poor soil fertility is currently being addressed by blanket fertilizer recommendations developed based on agro-ecological zones and they are focused mainly on three primary macronutrients (N, P and K) introduced in the early 1970s by the government of Nigeria [12]. These recommendations were developed for large areas based solely on limited, on-station fertilizer experiments conducted between 1950 and 1970 [12]. For instance, a rate of 120/60/60 in kg·ha−1 for N/P2O5/K2O, respectively, is recommended for maize in the northern Guinea savanna region. Although annual fertilizer consumption in Nigeria has increased from 154 to 550 thousand tonnes [19] from 2002 to 2013, its use efficiency has remained low due to the inability of current blanket recommendations to account for variability in soil fertility between and within farmers’ fields [17,20,21]. Variability in soil fertility may be (i) inherent due to differences in soil forming factors including parent material, local climate and vegetation [22] (ii) and/or due to differences in cropping history and soil management practices depending on farmers’ production potentials and other socio-economic factors [23,24]. Additionally, some of the reasons why optimal nutrient use efficiency is rarely achieved in farmers’ fields despite the NPK addition, may be due to other nutrient limitations [17], together with other factors like water stress, pest and diseases, management etc. For example, responses of maize to S and some micronutrients have been documented in some savanna soils of western and southern Africa [17,25,26,27]. To develop a more robust and effective fertilizer recommendation approach that targets specific field conditions or growing environments, quantifying the variation of soil fertility status and associated responses to nutrient applications is critical.
Multiple location nutrient omission trials conducted in heterogeneous farmers’ fields offer the most effective and simple way to study these variations in response. Thereafter, multivariate cluster analysis may provide an insight into the magnitude, extent and governing factors that are responsible for these variability patterns [28]. Multivariate cluster analyses group fields with similar responses to nutrient application into distinct classes [29]. Previous studies by Kihara et al. [30] and Njoroge et al. [31] attempted to understand the extent and distribution of variability in maize response to fertilizer and amendments in sub-Saharan Africa (SSA). However, Kihara et al. [30] covered only one sentinel site (Pampaida, Ikara located in the northern Guinea savanna of Nigeria) while their findings were invoked as representative for the entire maize production zone in Nigeria. Given the huge variability, this generalization seems insufficient to arrive at proper site-specific fertilizer formulations and recommended application rates to improve fertilizer use efficiency in Nigeria. Therefore, this study was conducted in major maize production areas in northern Guinea and Sudan savanna zones of Nigeria to: (i) assess the status and the extent of spatial variability of soil fertility in maize-based cropping systems, (ii) understand the extent and distribution of different classes of maize yield response to nutrient applications and (iii) delineate soil properties that are responsible for the different yield-nutrient response classes.

2. Materials and Methods

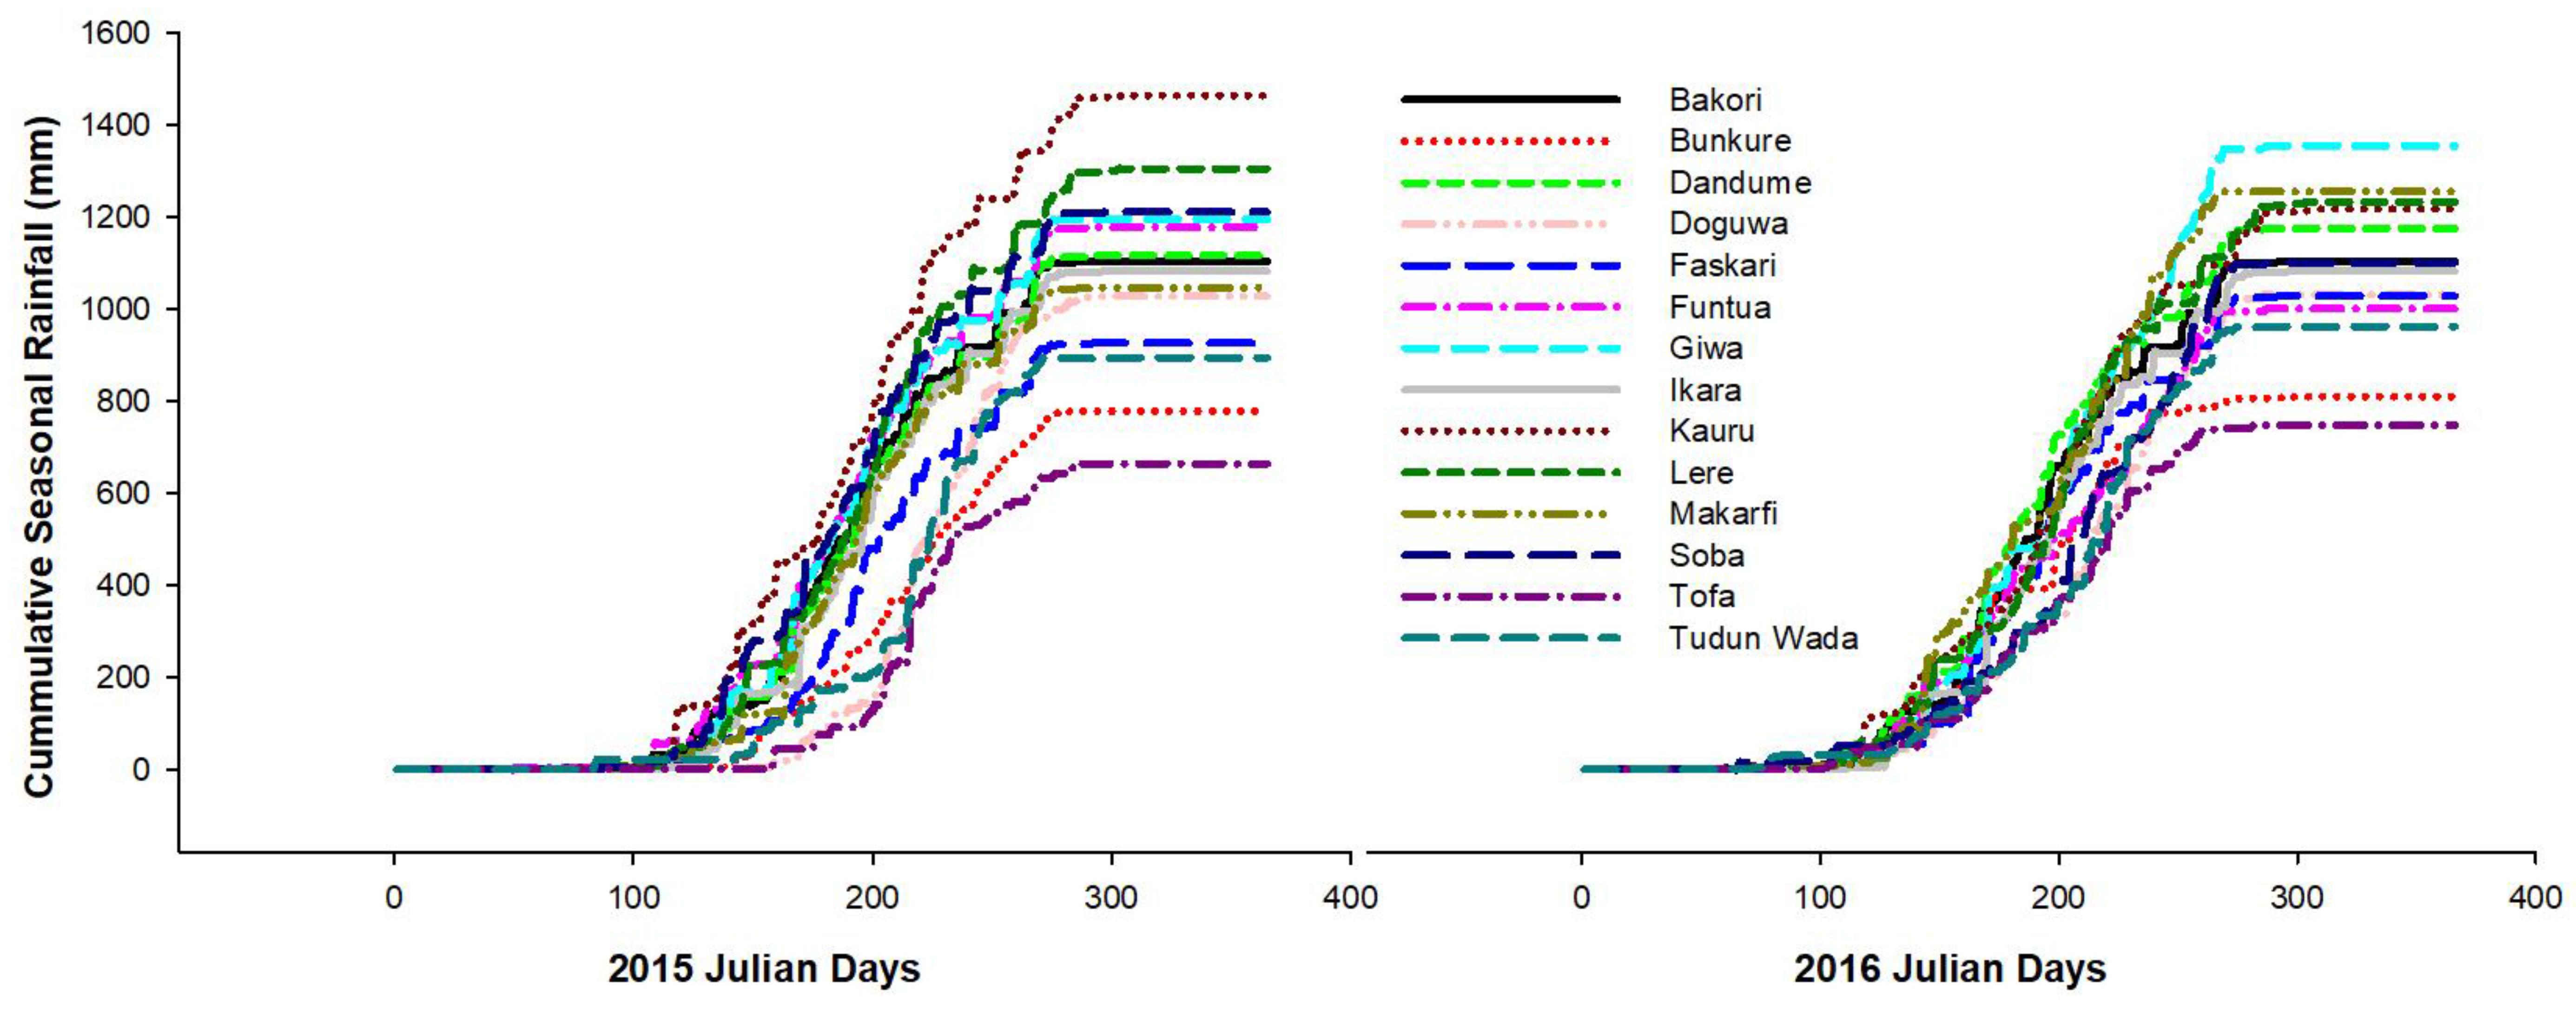
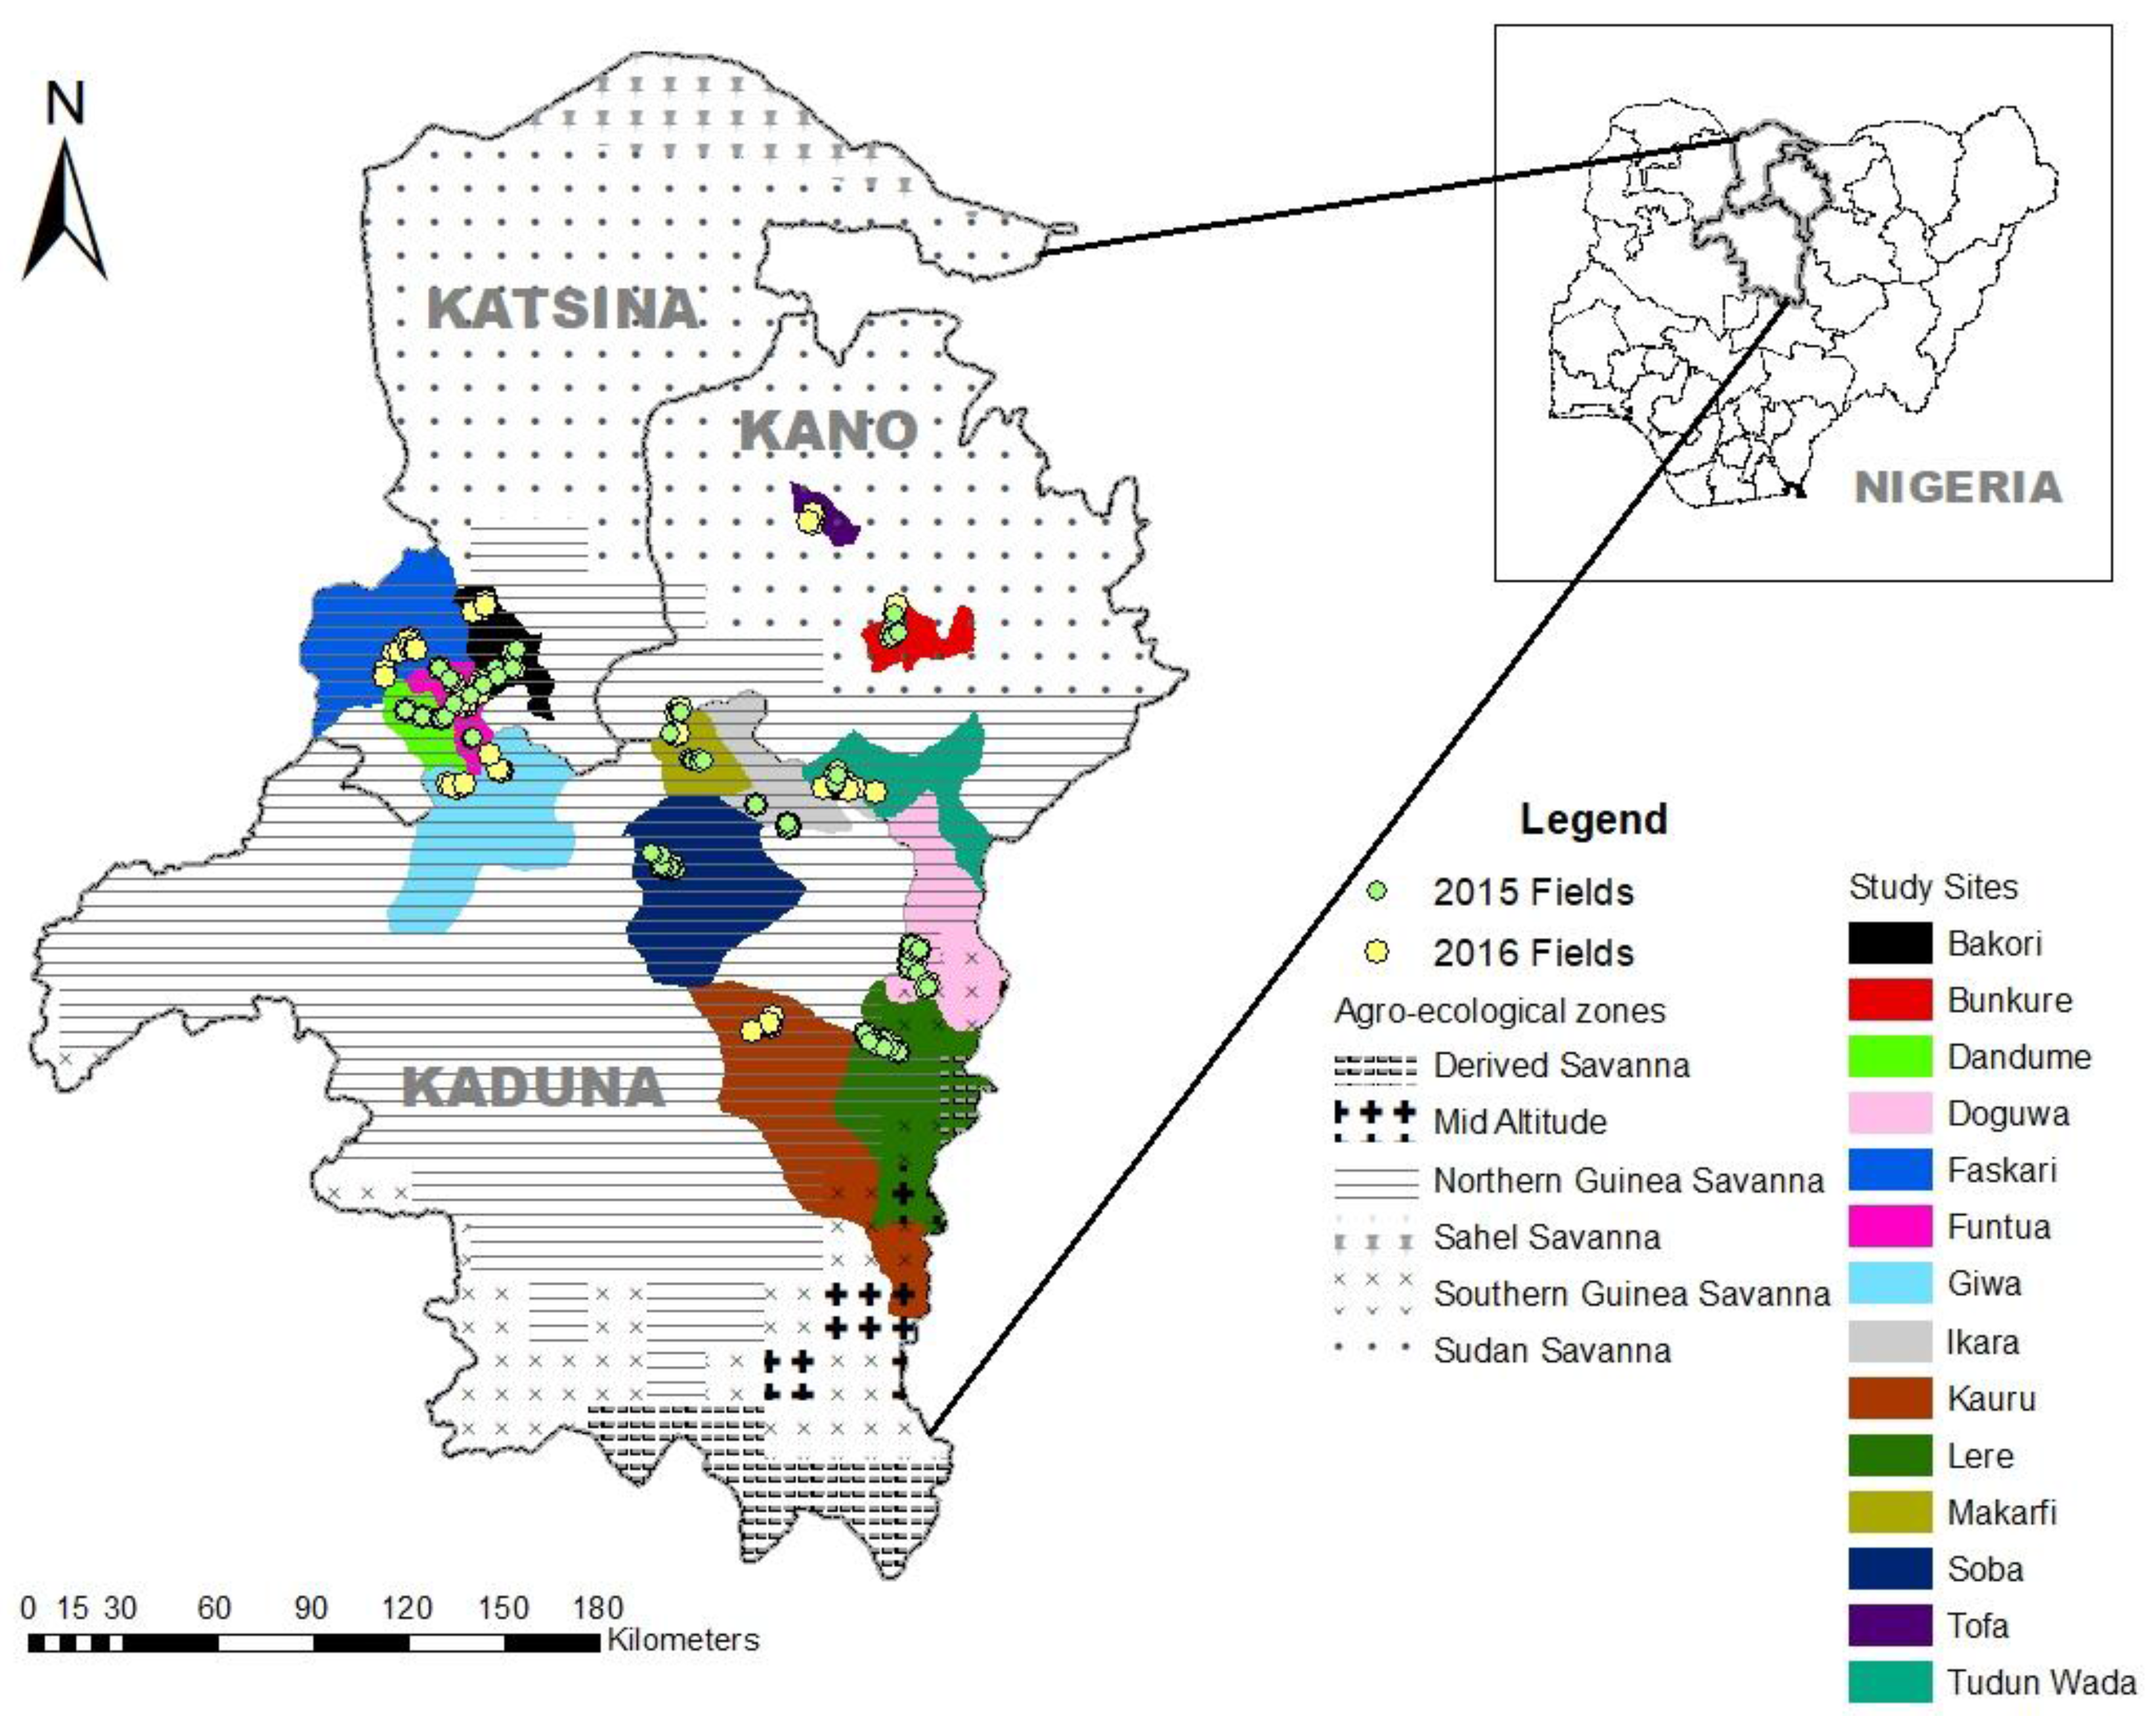
2.1. Site Selection and Description

Diagnostic on-farm nutrient omission trials (NOT) were conducted across fourteen study sites in three administrative states of northern Nigeria: Kaduna (with experimental fields in Lere, Kauru, Soba, Ikara, Makarfi and Giwa local government areas), Katsina (with experimental fields in Funtua, Dandume, Faskari and Bakori) and Kano (with experimental fields in Tofa, Bunkure, Tudun Wada and Doguwa) (Table 1, Figure 1 and Figure 2). The study and field experimental sites were purposefully selected to cover a wide range of maize growing conditions in major maize production potential areas and to cover areas where research for development can support extension support programs engaged in maize value chain initiatives. The northern Guinea savanna (NGS) is the main agro-ecological zone common to all the study sites except Tofa and Bunkure that belong to the Sudan savanna (SS) agro-ecological zone (Figure 1). In each of the fourteen study sites, one to two (depending on the size of the study site) 10 km × 10 km grid(s) were randomly generated using ArcGIS version 10.2.2 software (Environmental System Research Institute, Redlands, CA, USA). Then, within each of these 10 km × 10 km grid(s), five 1 km × 1 km sub-grids were randomly distributed. In each of the 1 km × 1 km sub-grids, one experimental field was randomly selected based on the availability of land for the trial set-up. Ninety-five (95) and one hundred and three (103) experimental fields were selected in the 2015 and 2016 rainy seasons, respectively (Table 1 and Figure 1). In each of the selected experimental field, two sets of trials were established side by side; one with an open pollinated maize variety “OPV” and the other one with a hybrid maize variety “hybrid.”

2.2. Experimental Design, Management and Laboratory Analyses

The on-farm diagnostic field trials were conducted using a modified nutrient omission trial design consisting of six treatments. The treatments included a control (“Cont”) without nutrients applied, N omitted (“−N”) with P and K applied, P omitted (“−P”) with N and K applied, K omitted (“−K”) with N and P applied, NPK treatment (“NPK”) and a treatment (“+SMM”) where secondary macronutrients (S, Ca and Mg) and micronutrients (Zn and B) were applied in addition to the NPK. The primary macronutrients (N, P and K) were applied at 140 kg N·ha−1, 50 kg P2O5·ha−1 and 50 kg K2O·ha−1 for NGS sites; and at 120 kg N·ha−1, 40 kg P2O5·ha−1 and 40 kg K2O·ha−1 for SS sites. The secondary macronutrients and micronutrients were applied at 24 kg S·ha−1, 10 kg Ca·ha−1, 10 kg Mg·ha−1, 5 kg Zn·ha−1 and 5 kg B·ha−1 in all sites. NPK fertilizer nutrients were applied at rates considered to be sufficient to achieve the expected attainable yield without nutrient limitation in each agro-ecological zone. Nitrogen (N) was applied in three equal splits, i.e., at planting (basal), at 21 and 42 days after emergence (DAE). All other nutrients were applied at planting. Nutrients applied at planting were applied using band row placement and incorporated, while the 2nd and 3rd N splits were applied by side dressing and earthen-up. The field trials were established and managed by researchers.
The OPV varieties used were IWD C2 SYN F2 (with 105–110 days to maturity) and EVDT W STR (with 90–95 days to maturity) in NGS and SS study sites, respectively. While hybrid varieties used were OBA SUP-9 (with 105–110 days to maturity) and OBA SUP-1 (with 105–118 days to maturity) for 2015 and 2016 seasons, respectively in all study sites. The treatment plot size was 5 m × 6 m (30 m2) with a plant spacing of 0.75 m (inter-row) × 0.25 m (intra-row).
Four auger soil samples were collected at 0–20 cm depth from each field during trial establishment before application of fertilizer treatments using a V zig-zag random sampling pattern. The four collected samples were thoroughly mixed and passed through 2 mm sieve to have one disturbed composite sample per field for laboratory analysis. In addition, one undisturbed core sample was also collected close to each of the four auger points in each field and used for bulk density determination using the thermo-gravimetric core method [38]; the results were averaged to have one bulk density value per field.
The disturbed composite samples were used to analyse major soil characteristics using wet chemistry. Total soil organic carbon (total C) was measured using a modified Walkley & Black chromic acid wet chemical oxidation and spectrophotometric method [39]. Total nitrogen (total N) was determined using a micro-Kjeldahl digestion method [40]. Soil pH in water (S/W ratio of 1:1) was measured using a glass electrode pH meter and the particle size distribution following the hydrometer method [41]. Available phosphorus (avail. P), available sulphur (avail. S), exchangeable cations (K, Ca, Mg and Na) and micronutrients (Zn, Fe, Cu, Mn and B) were analysed based on the Mehlich-3 extraction procedure [42] preceding inductively coupled plasma optical emission spectroscopy (ICP-OEC, Optima 800, Winlab 5.5, PerkinElmer Inc., Waltham, MA, USA). Exchangeable acidity (H + Al) was determined by extracting soil with 1N KCl and titration of the supernatant with 0.5M NaOH [43]. Effective cation exchange capacity (ECEC) was calculated as the sum of exchangeable cations (K, Ca, Mg and Na) and exchangeable acidity (H + Al). All the laboratory analyses were performed at the IITA laboratories in Ibadan, Nigeria.
Harvesting was carried out at physiological maturity in a net plot of 9 m2 (i.e., comprising four middle rows of 3 m length). Plants in the net plot were harvested and total fresh weights of cobs and stover were recorded. Ten cobs and five stalks of stover were randomly selected as subsamples to account for grain shelling percentage and moisture content after air-drying. The random selection was carried out by first counting the number of cobs or stalks in the net plot and then randomly arranging them in line; the subsamples were then taken at every interval calculated as the total number of cobs or stalks in the net plot over the number of subsamples to be taken. Finally, grain yield was expressed on a dry weight basis at 15.0% moisture content.

2.3. Data Analysis

Descriptive statistics were used to check the average and standard deviation values of each of the soil characteristics at each study site using JMP version 13.0 statistical software [44]. Variation in soil properties was assessed using the coefficient of variation (CV) and rated as small (<15%), moderate (16–35%) and large (>35%) [45]. Analysis of variance on the response of yield to fertilizer treatments was also conducted at each study site using JMP version 13 software, a linear mixed model was used with experimental fields within study sites used as a random term. The analysis excluded fields where responses to treatments were observed to have been affected by waterlogging, poor weed management and excessive damage by intruders (thieves or livestock). Thus, 174 out of 198 fields were analysed. The analysis of variance was conducted at two levels; (i) comparing the control with NPK treatments across the sites to explore the overall effect of NPK and (ii) comparing the yield difference of the treatments relative to NPK to assess yield gain/loss when a nutrient was omitted or applied across the study sites. The treatment effects were also regressed against the ‘environment’ yield (calculated as the average yield for all treatments at a given study site) to evaluate the most stable treatment effect across the study sites [46]. In addition, to assess the impact of rainfall on the effect of treatments, yield treatment effects were correlated and regressed with cumulative rainfall (R) and Shannon rainfall distribution index (I) at 25, 50, 50–75, 75 and 100 days from planting (DFP), respectively. The Shannon rainfall distribution index was calculated as follows [47] where high values stand for equal distribution and low values for a lack of distribution:
I = ( p i ln ( p i ) ) ln ( N )
pi = proportion of total rainfall in day and N = number of days
To obtain a meaningful and straightforward classification of the different fields, grouping those with similar nutrient response patterns, multivariate K-means cluster analysis was used. This provides an opportunity to design appropriate fertility management interventions that can be recommended. The cluster analysis was conducted on the yield difference of each treatment relative to the control. To select an optimal number of clusters, observations on meaningful distinct cluster response patterns and on the high cubic clustering criterion (CCC) [48] were used in 2–10 successive K-means clusters using JMP version 13.0 statistical software. Finally, 3 clusters were retained in OPV and 4 clusters in hybrid trials. A multinomial logistic regression model was then used to understand soil characteristics and the associated nutrient management history responsible for the presence of a field in a specific cluster. Due to some outliers in the soil characteristics, a total of 132 fields for OPV and 115 fields for hybrid were used in the multinomial logistic regression. For each identifiable cluster, an average value of each soil characteristic variable was presented to shed more light on its characteristics.

3. Results

3.1. Soil Physicochemical Characteristics

Soil particle size distribution showed a moderate variability with a dominant sand fraction in all study sites (Table 2). Doguwa, Kauru and Lere sites have a sandy clay loam texture while Bunkure, Tofa and Tudun Wada have a sandy loam texture. The other sites have a loam texture. All the sites apart from Tofa have an average bulk density below 1.6 g·cm−3 considered best for root growth and aeration in a soil with a larger sand fraction relative to clay and silt [49]. Soil pH showed little variability across the sites with a mean value ranging from 5.6 to 6.4 (Table 2) and hence soils are categorized as moderately acid (5.6–6.0) to slightly acid (6.1 to 6.5). Soil total organic carbon (total C) showed a large variation among the experimental fields, although all the average values fell below 10 g·kg−1 which is considered low according to the ratings of the National Special Programme on Food Security (NSPFS) [50]. Soil total nitrogen (total N) content was also generally low like the total C but with a moderate variability among the experimental fields. Available phosphorus (avail. P) differed strongly across the study sites with average values ranging from 3.1 mg·kg−1 to 25.0 mg·kg−1 (Table 2). Low values of avail. P (<7 mg·kg−1) were recorded in Funtua, Dandume, Faskari and Bakori and high values (>20 mg·kg−1) in Tofa. Other remaining sites had moderate contents (7–20 mg·kg−1) according to the same NSPFS [50] categorization. Available sulphur (avail. S) showed a moderate variability in the studied fields with all the mean values occurring within the moderate region (5.1–20 mg·kg−1) according to Horneck et al. [51].
The concentration of exchangeable calcium (Ca) varied moderately across the sites (Table 3), with an average content between 1.42 and 3.21 cmolc·kg−1. However, majority of the sites have a moderate content (2–5 cmolc·kg−1) except for Lere, Faskari and Bunkure sites with a low content (<2 cmolc·kg−1) as suggested by the classification of Esu [52]. Moderate contents of exchangeable magnesium (Mg) concentration (0.3–1.0 cmolc·kg−1) were also observed in all the study sites (Table 3). Exchangeable potassium (K) exhibits large variability across the study sites with an average content ranging from a moderate (0.16) to high (0.35 cmolc·kg−1) values (Table 3). In all the sites (Table 3), the average values of exchangeable sodium (Na), exchangeable acidity ((H + Al) and effective cation exchange capacity (ECEC) were low, i.e., <0.1, <1.0 and <6.0 cmolc·kg−1, respectively. Average values of available iron (Fe), zinc (Zn) and manganese (Mn) in the soils (Table 4) are indicative of a high fertility class as suggested by Esu [52] rating (>5.0, >2.0 and >5.0 mg·kg−1 for Fe, Zn and Mn, respectively). Available copper (Cu) showed a moderate variability across the sites with average values falling between moderate (0.21–2 mg·kg−1) and high (>2.0 mg·kg−1) values (Table 4). Despite a large variability of boron (B) concentration across the study fields (Table 4), the average values below 0.349 mg·kg−1 indicated a very low status following NSFPS [50] classification.

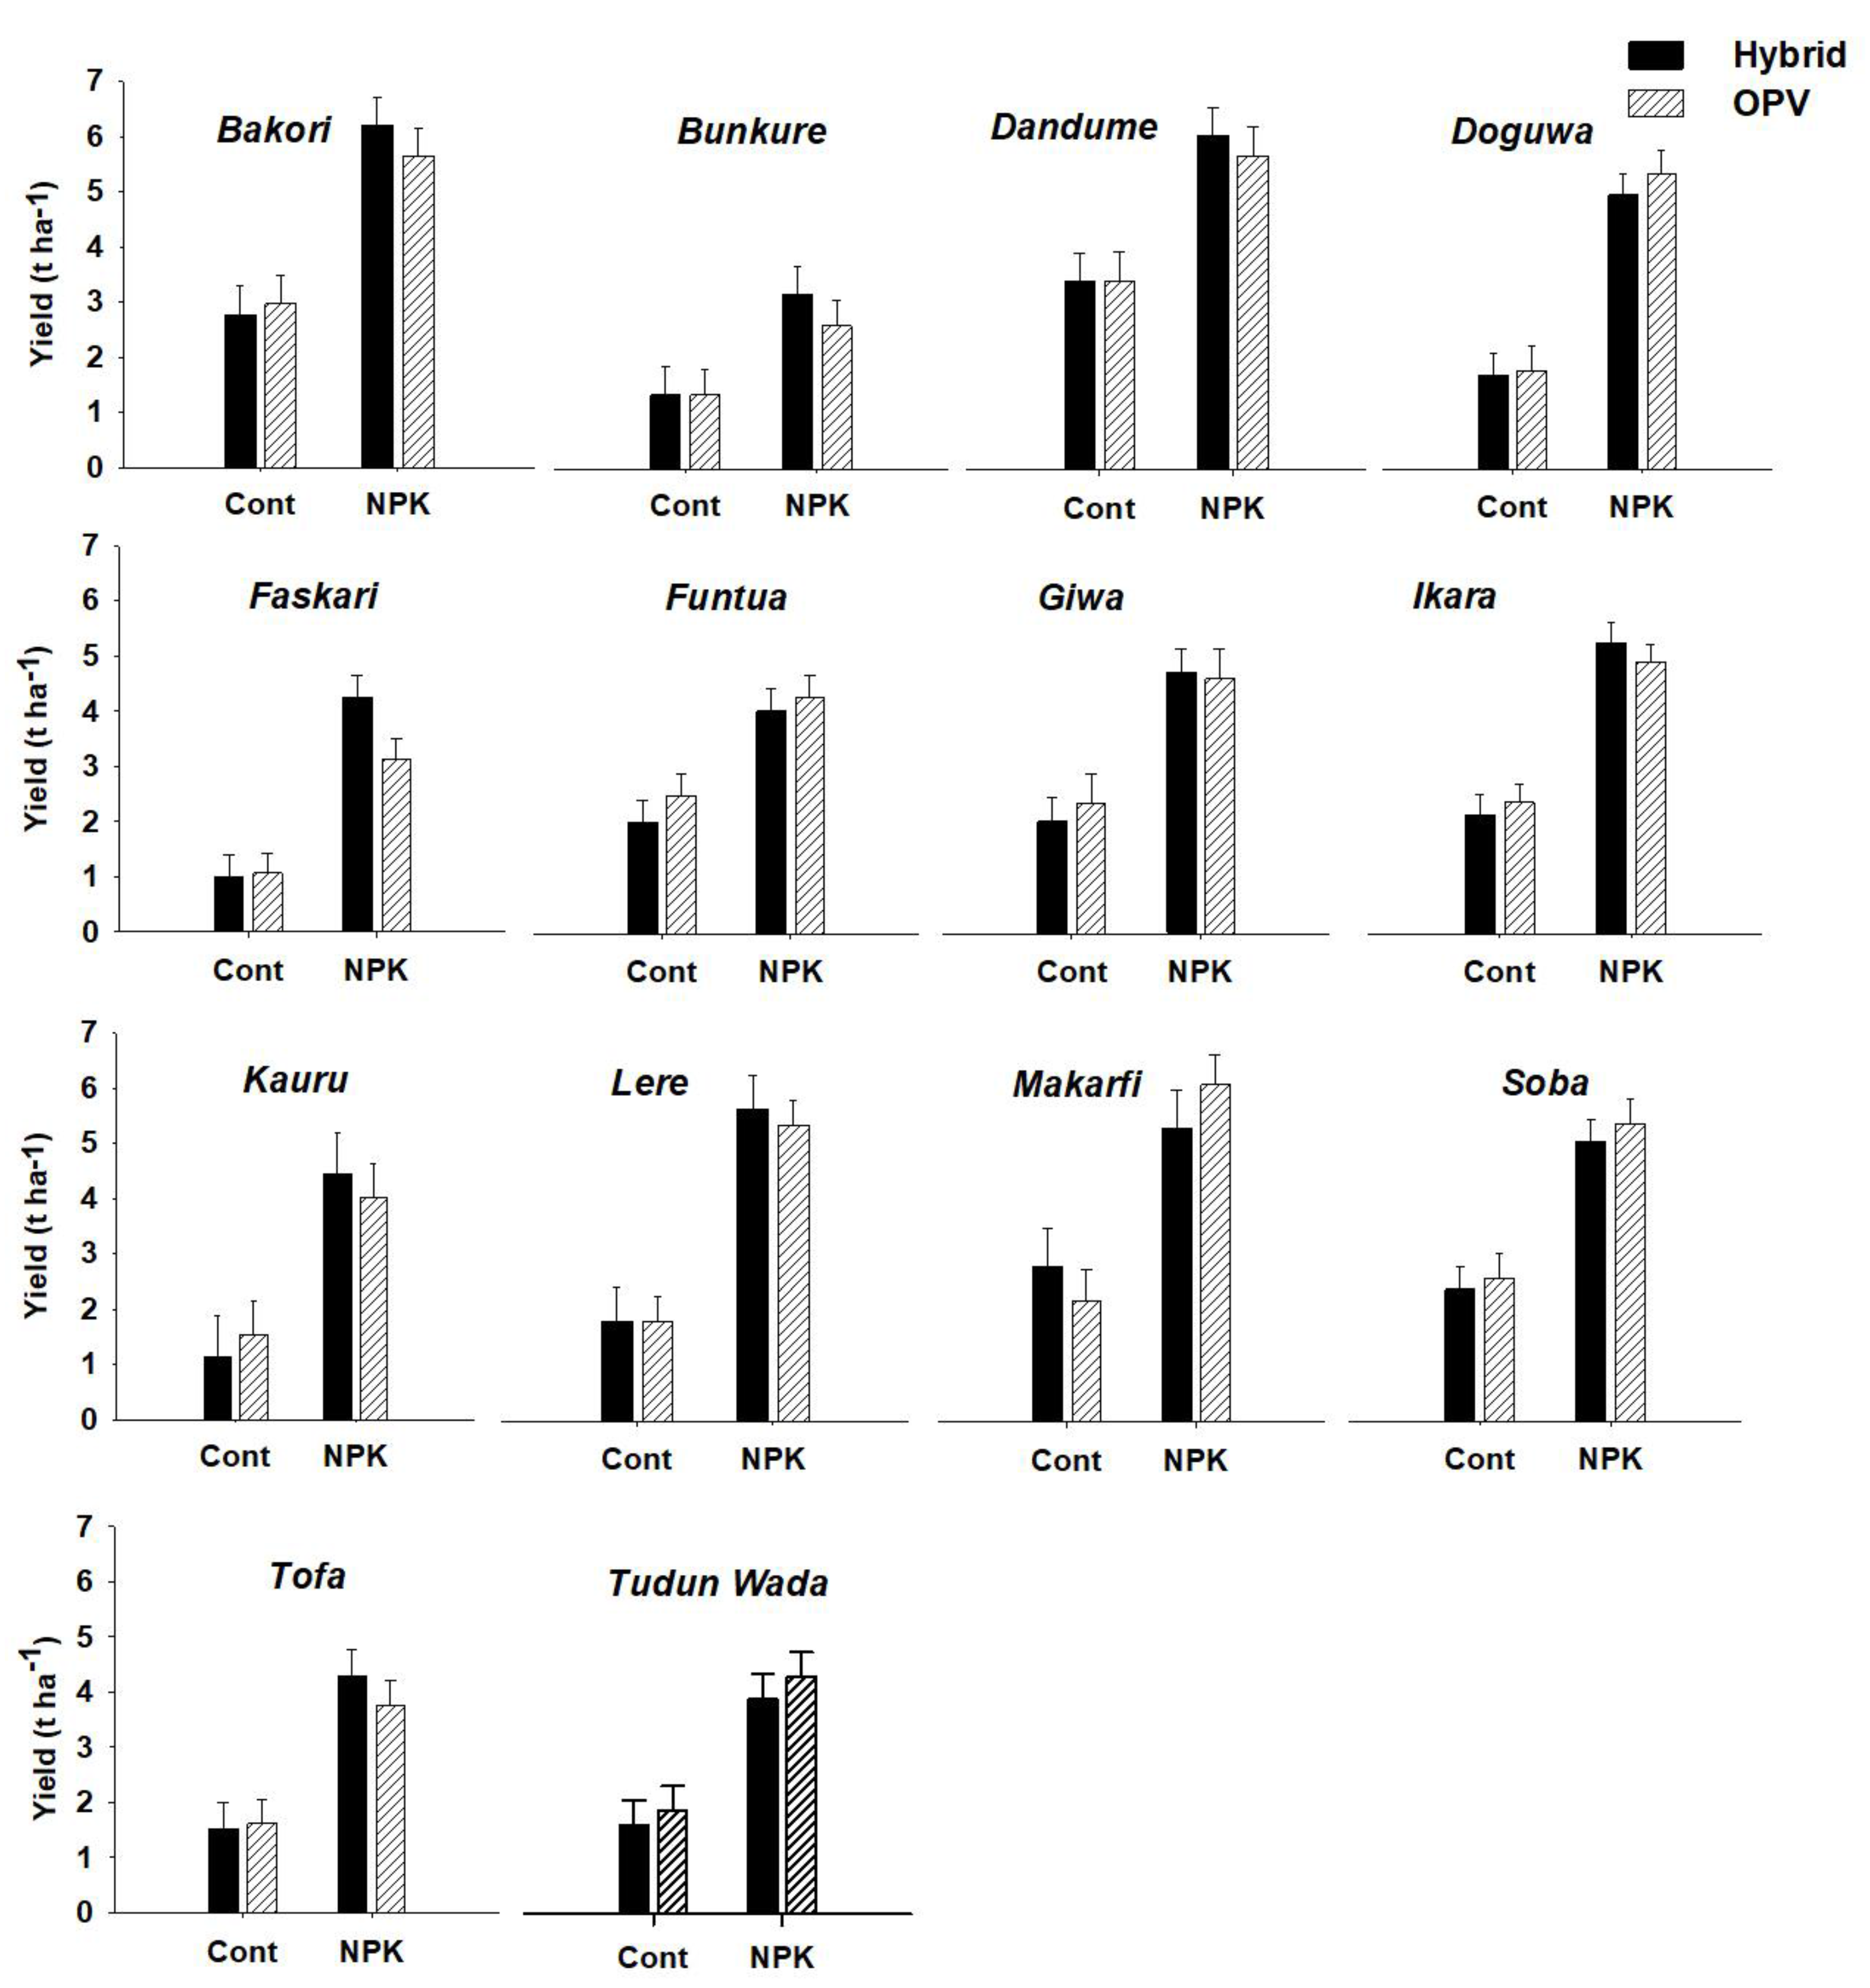
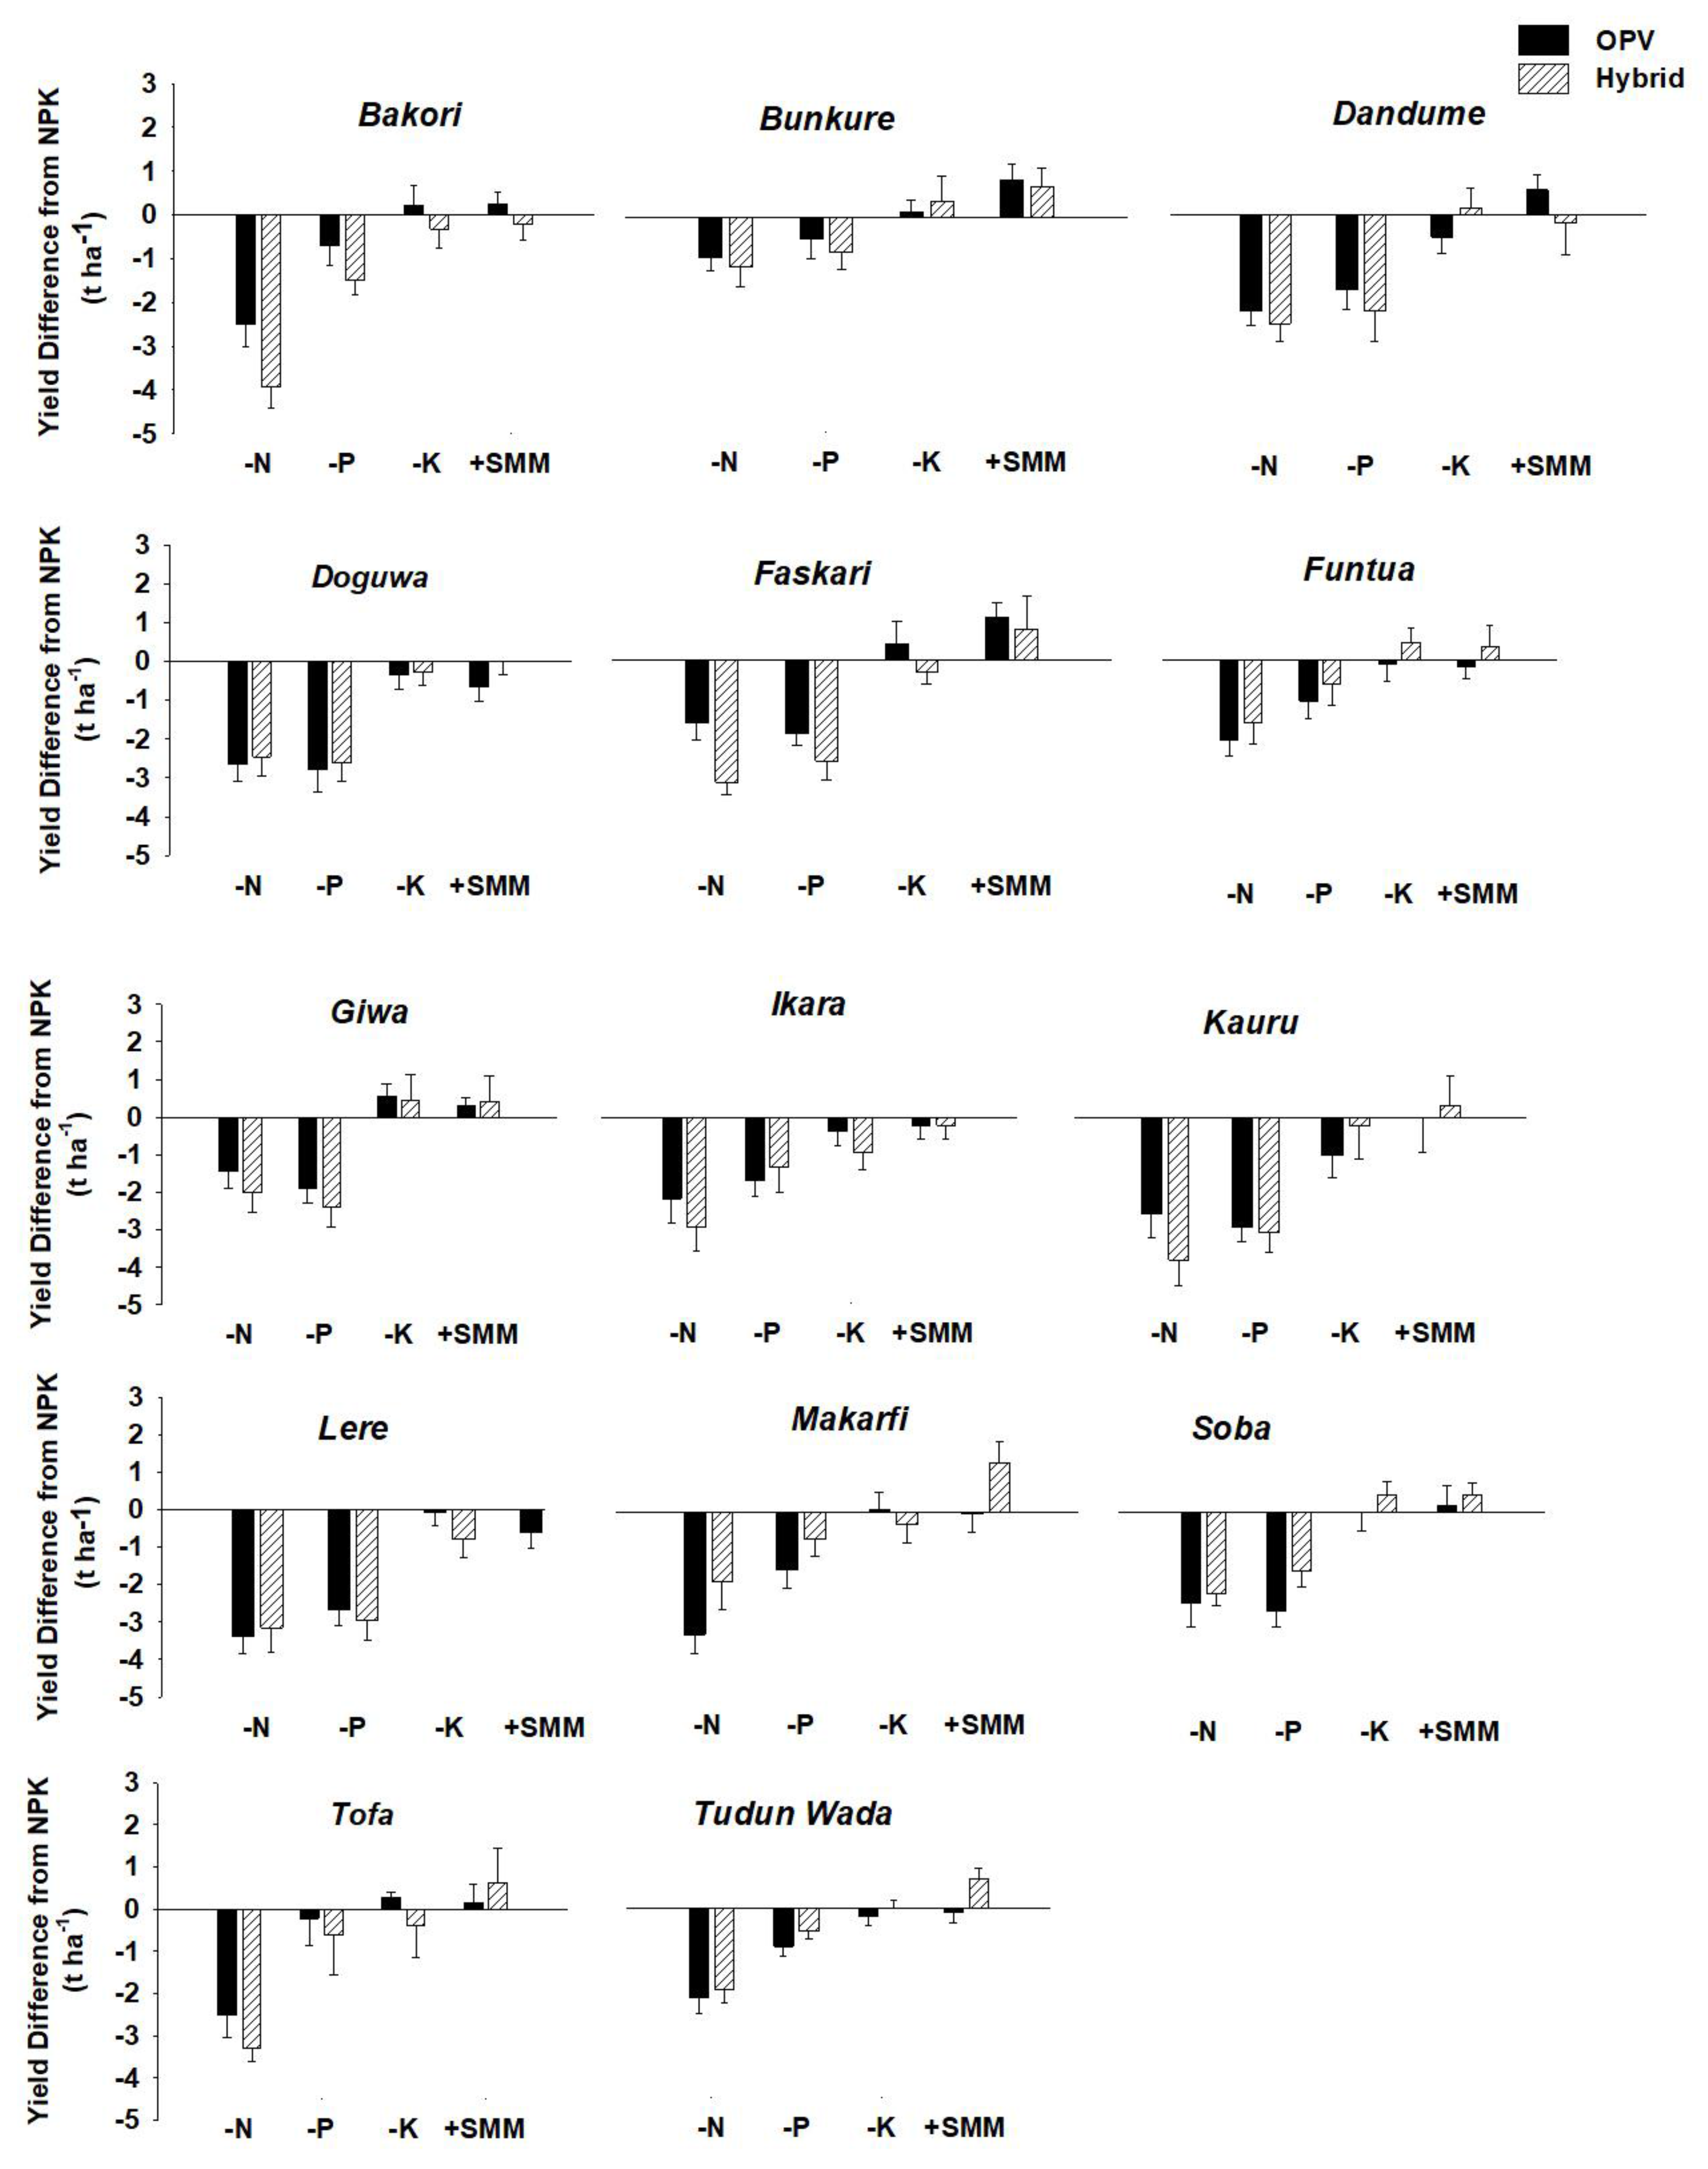
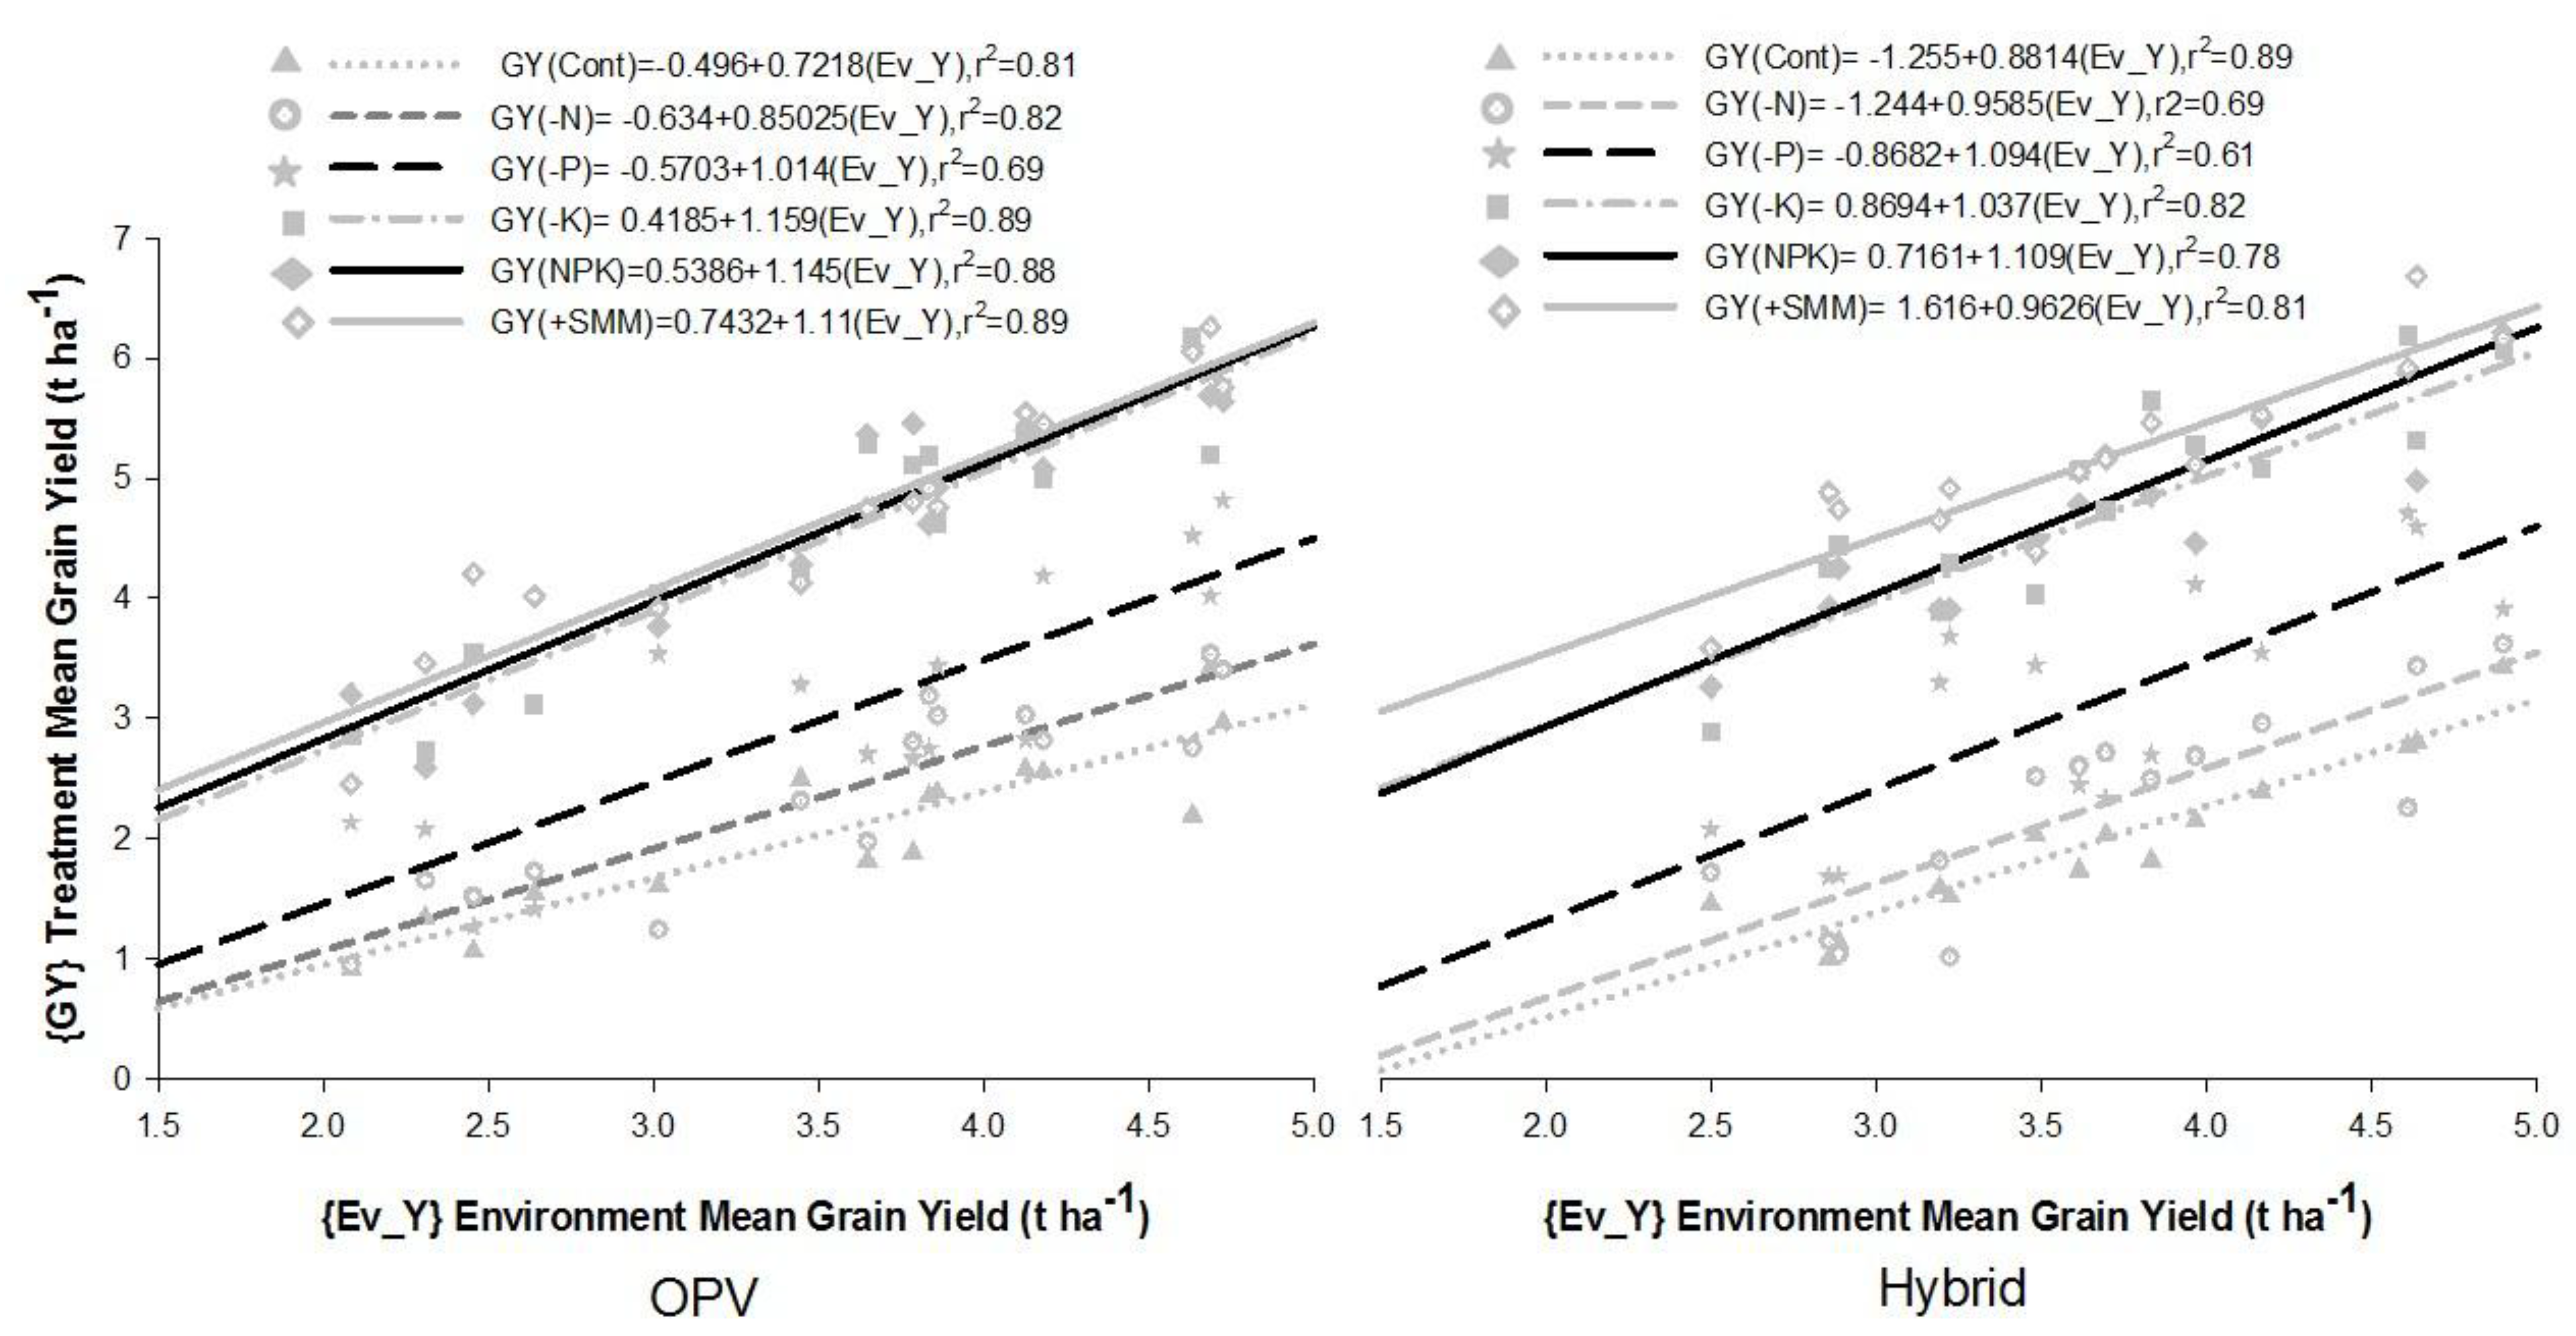
3.2. Yield Response to Fertilizer Treatments

Application of NPK significantly increased grain yield in all the study sites (Figure 3). Averaged across study sites, the overall yield performance of OPV and hybrid varieties was similar. However, the incremental yield response to NPK application relative to control varied among the various sites. In OPV trials, NPK application produced grain yield that was twice as high as that of the control in all sites, except in Giwa, Bunkure, Bakori, Funtua and Dandume where an increase of 97%, 93%, 90%, 72% and 50% was observed, respectively (Figure 3). Similarly, in hybrid trials, application of NPK resulted in grain yield of more than twice that of the control in all study sites except in Dandume where an increase of 53% was observed (Figure 3).
There was a wide variation among the study sites and varieties in terms of loss or gain in maize grain yield resulting from the omission of primary macronutrient(s) from the NPK treatment or addition of secondary macro- and micro-nutrients to the NPK treatment (Figure 4). In both OPV and hybrid trials, an omission of N (−N) from the NPK resulted in a loss in grain yield of at least 1.5 t·ha−1 in all sites except at Bunkure where a reduction of less than 1.2 t·ha−1 was observed (Figure 4). Largest reduction in grain yield of more than 3 t·ha−1 due to −N was found in Lere and Makarfi for the OPV and in Lere, Kauru, Faskari, Bakori and Tofa for the hybrid maize variety. The omission of P (−P) similarly led to a drastic reduction in maize grain yield relative to the NPK treatment in all the sites (Figure 4). P is the next most important yield-limiting nutrient after N; except in Giwa and Doguwa where the reductions in yield were larger for −P compared to −N. In OPV trials, largest yield reductions of more than 2.5 t·ha−1 because of −P were obtained in Lere, Kauru, Soba and Doguwa. In hybrid trials at Lere, Kauru, Faskari and Doguwa reductions of more than 2.5 t·ha−1 were obtained due to −P. The largest decrease in grain yield (0.96 and 0.81 t·ha−1) due to the omission of potassium (−K) was recorded in the trials in Kauru with OPV and in Ikara with hybrid, respectively (Figure 4). Contrary to this, average gains in grain yield in the order of 0.27–0.56 t·ha−1 because of −K were recorded in two sites with OPV trials (Giwa and Tofa) and in two sites with hybrid trials (Soba and Bunkure). The addition of secondary macro- and micro-nutrients (+SMM) resulted in a consistent gain in grain yield of 0.2–1.08 t·ha−1 compared to NPK treatment in both OPV and Hybrid trials in Soba, Giwa, Faskari and Bunkure.
The stability analysis of all trials (Figure 5), allows to draw important conclusions with respect to the overall effectiveness of a given treatment and its resilience against environmental variables. Slope and intercept of the regression lines between treatment means and environment means are crucial in this respect. While the intercept and the general position with respect to the x-axis indicate the yield performance of the different treatments, the slope is indicative of the impact the environment may exert on the variability in yields. Hence, regression lines with small slope values point to a relative insensitivity to environmental factors and consequently to a stable system. First, control (Cont) and minus N (−N) treatments demonstrated the smallest intercepts and smallest slopes in comparison to all other treatments implying that they were more stable but at a poor level of performance. Secondly, the omission of P (−P) resulted in a larger yield compared to Cont and −N treatments in both sets of trials with a slightly larger slope value, indicating a slightly reduced resiliency. Finally, the +SMM, NPK and −K treatments with OPV’s responded equally and perform better in all the environments while in the hybrid trials, +SMM had a slighter slope implying more resilience in the low yielding environments while they responded similarly to NPK and −K in environments where yields were high.
OPV grain yields were not significantly affected, neither by cumulative rainfall (R) nor by its distribution (Shannon distribution index (I)) and this for all six treatments and both years of the study (Table 5). A slightly different picture emerges for the hybrid trials where the high Shannon distribution index (I) computed for the first 75 days from planting (75 DFP) reduced the control yield (Table 6 and Figure 6). In addition, both I and R negatively affected the −P grain yield, for periods 75 and 100 DFP (Table 6 and Figure 6). This indicates that a zero application of nutrients or omission of P from the NPK renders the hybrid maize more negatively susceptible to high rainfall amount and a more equal distribution.

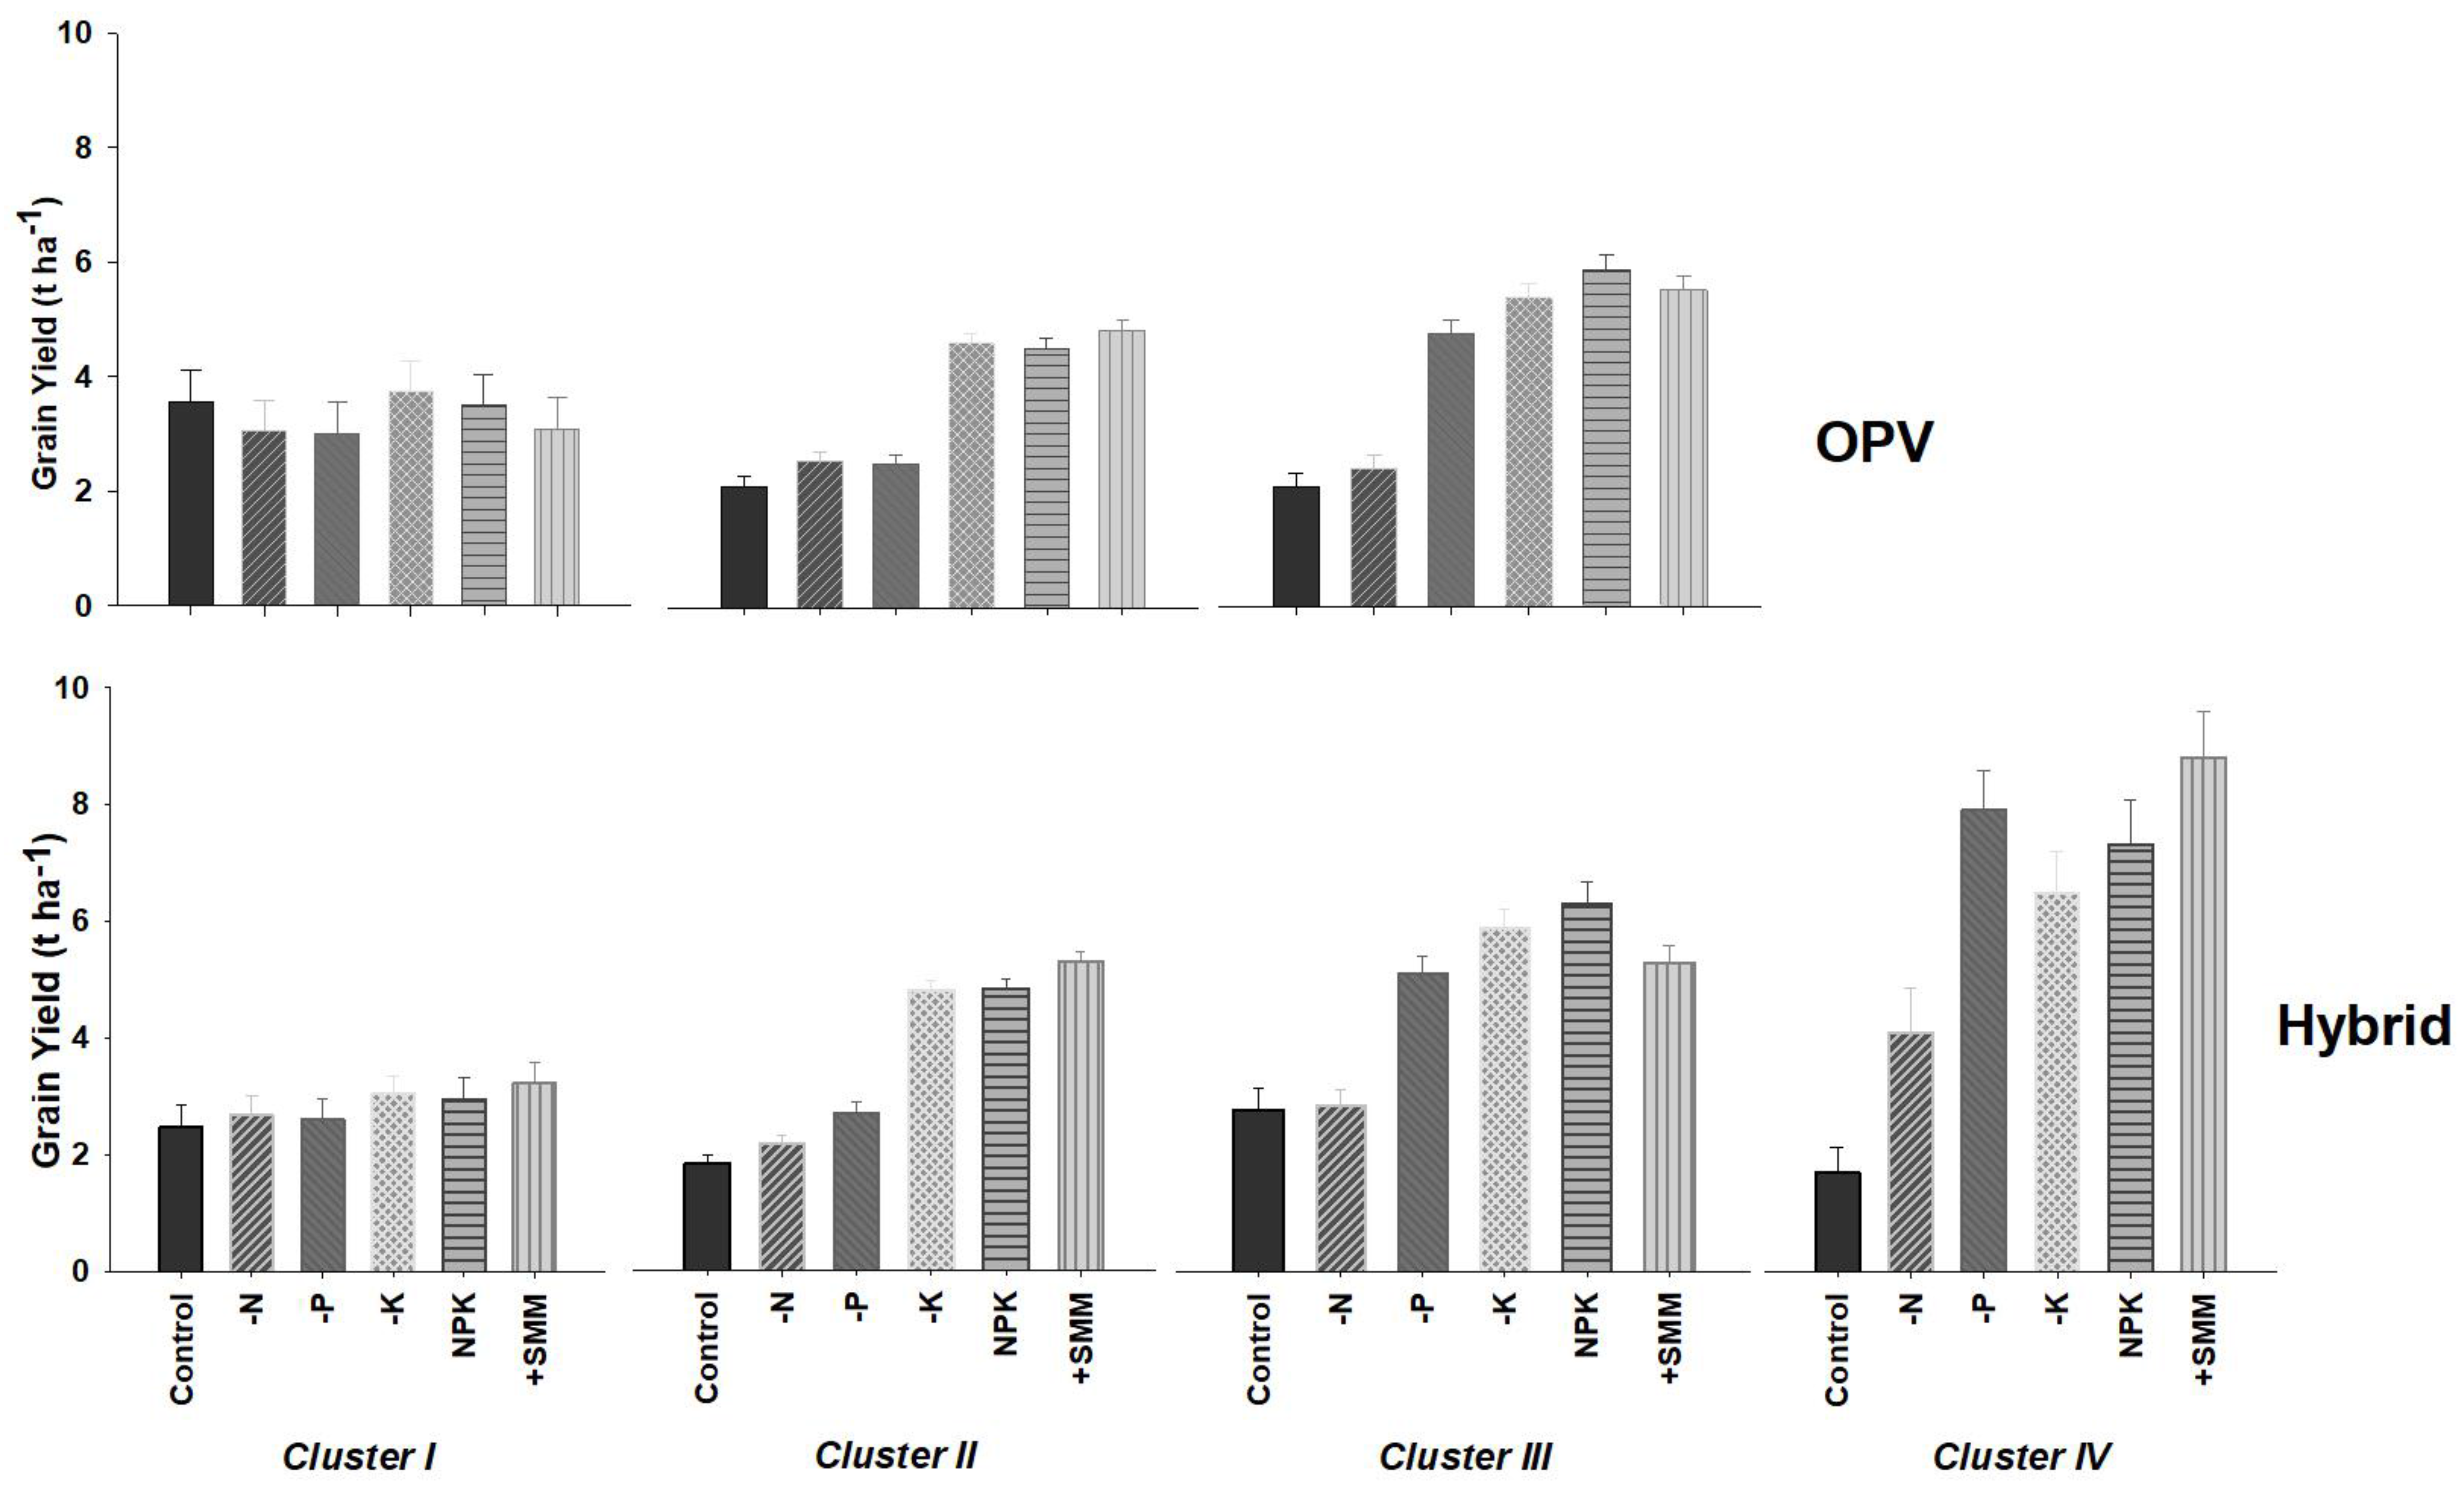
3.3. Yield-Nutrients Variability Response Clusters

From the multivariate K-means cluster analysis, three clusters could be identified in the OPV trials and four clusters in the hybrid trials (Figure 7). Cluster I to III are common to both varietal trials, while cluster IV is specific to hybrid trials only. Attributes of the response clusters are as follows:
  • Cluster I: Fields without yield response to any nutrient application, therefore called “no response fields.” Attainable yield level in this cluster fell between 3 and 3.7 t·ha−1 for OPV and 2.7 and 3.8 t·ha−1 for the hybrid variety, respectively. The cluster contains 9% and 16% of the OPV and hybrid study fields, respectively (Table 7). Among the four clusters, the fields in this cluster received the largest manure application preceding the trials and the smallest urea fertilizer application (Table 8). As a result, the fields in this cluster have the highest soil organic C content. In addition, fields in this cluster also have the highest available Fe content.
  • Cluster II: Fields with a large yield response to N and P, hence known as “N and P response fields.” Attainable yield levels were 4.6 to 4.8 t·ha−1 and 4.8 to 5.3 t·ha−1 for OPV and hybrid variety, respectively (Figure 7). It is the largest cluster containing 63% of the study fields in both OPV and hybrid trials (Table 7). Using no-response cluster I as the reference category, multinomial logistic regression as indicated by significant odds ratios (Table 8), showed that relatively low soil organic C, small Fe and high available S were the soil properties statistically responsible for allocation of fields into this cluster.
  • Cluster III: Fields with a larger yield response to N only and a small response to P, K and SMM (secondary macro- and micro-nutrients), therefore called “N response fields.” The attainable yield in this cluster fell between 4.7 and 5.8 t·ha−1 for OPV and 5.1 and 5.3·ha−1 for hybrid, respectively (Figure 7). Twenty eight percent (28%) and 17% of OPV and hybrid study fields, respectively are assigned to this cluster (Table 7). Low soil organic C, high available P and high bulk density relative to the corresponding values in the reference cluster I (Table 8) were the significant soil characteristics responsible for the allocation of fields into this cluster.
  • Cluster IV: Fields in this cluster have a large yield response to N and SMM, a small response to P and K. Therefore, they are called “N and SMM response fields.” Addition of SMM increased yield by 1.4 t·ha−1 over the NPK. Cluster IV held only 4.0% of the hybrid fields (Table 7) and holds the largest attainable yield compared to all other clusters of 6.4 to 8.3 t·ha−1 (Figure 7). High soil available P as twice the average content of the reference cluster I and low organic C and available B contents were the significant soil characteristics of fields for this cluster (Table 8). In addition, fields in this cluster received the smallest organic matter input and the largest NPK applications before the trials.

4. Discussion

4.1. Soil Characteristics

Most of the studied fields do not have potential acidity problems since the exchangeable acidity (Al + H) is less than 1 cmolc·kg−1 and average pH values are within the range of 5.5–7.0. These values are considered ideal for most crops including maize and lead to pH-values entailing an optimal nutrient availability [53]. The high sand fraction in the soils can be attributed to the parent material as most of these soils were developed on deeply pre-Cambrian basement complex rocks like granite and sandstone. In addition, sorting of soil materials as a result of clay eluviation and wind erosion has been reported as one of the major reason for a high sand fraction in the surface soils of northern Nigeria [54,55]. The low total C-contents (indicative of low organic matter content), total N and ECEC in the soils can be related to two factors; (i) inherently, the sandy nature of the parent material containing a low weatherable mineral reserve necessary for nutrient recharge and a small capacity for carbon storage, (ii) anthropogenically, through burning or complete removal of crop residues for livestock and other needs [56]. Many studies have reported low total C, total N and ECEC contents within the study area [9,13,14,57]. The moderate to high average exchangeable K contents in all the sites can be linked to the presence of an appreciable amount of K-bearing Feldspar minerals in the sand and silt fractions in the study area [58] and the residual effect of the historic K application from NPK fertilizer in the fields.
The low exchangeable Ca concentrations in Lere, Faskari and Bunkure indicate the potential development of Ca-deficiency in those areas. The high concentrations of available Fe and Mn in the soils are not surprising given the soil acidity which is very unlikely to lead to Fe- and/or Mn-deficiency. As reported by Sillanpää [59], only at pH above 7.5 does Mn availability become very small owing to the formation of hydroxides and carbonates. Likewise, Fe is known to be highly soluble under relatively acid and reducing conditions [14]. Møberg and Esu [58] have also documented the predominance of Fe-bearing minerals like haematite and goethite in sand and clay fractions of Nigerian savanna soil. The low B contents in the studied soils are associated with a low organic matter content which is the major reservoir of B and a high leaching potential (B being mobile) due to both high rainfall intensity and coarse-textured soils [60,61].

4.2. Variability in Yield Response to Nutrient Application

A large variability in maize grain yield response to nutrient applications was observed both within and between study sites and varieties (genotype). This indicates a substantial effect of soil variability and varietal characteristics on maize yield nutrient requirements. More than 70% of the study fields (i.e., all except cluster I) showed a larger response to N application and yield was significantly reduced when N was omitted from the NPK in most of the study sites. This asserts that N is the most yield-limiting nutrient. Similarly, other studies have reported a significant response of maize to N application in the Nigerian Savannas [62,63,64]. Overall, N deficiency is recognized as the most limiting nutrient in cereal cropping system over large areas of SSA including Nigeria [65,66]. This suggests that fertilizer practices and technologies that manage N dynamics in the soil are highly required for optimal performance of maize in the northern Nigerian savannas. Rotation of cereal crops with legumes, appropriate application of inorganic N fertilizer combined with well-managed manure [65,67] can help farmers to improve N status in their fields. Phosphorus is the another most important yield-limiting nutrient after N as 63% of the fields showed a larger yield response to P application (cluster II). Kamara et al. [57] and Shehu et al. [14] have reported the occurrence of small available P contents (<7 mg·kg−1) in more than 50% of the fields in some parts of the study area. Average exchangeable K content in most of the study fields is at or above the critical level of 0.16 cmolc·kg−1 [68,69], which is linked to the small response of K application observed in all the clusters.
The no-response fields (cluster I) have noticeably higher organic C (7.7 g·kg−1) and Fe (185.33 mg·kg−1) contents. Although the reason for higher Fe content in this cluster was not clearly understood, the larger historic application of organic resources at 6052.67 kg·ha−1 before the start of the trials attributed to the high organic C. The presence of fields that are non-responsive to nutrients application has been reported elsewhere in sub-Saharan Africa (SAA) [30,67,70]. Relative to no-response fields, lower Fe (144.12 mg·kg−1), lower organic C (6.97 g·kg−1) and higher available S (7.38 mg·kg−1) contents were significantly responsible for allocation of fields into cluster II with larger yield response to N and P. Therefore, this could point towards a high probability that an excess Fe might have substantially reduced mineralization and availability of the applied P in the no-response fields through the formation of insoluble iron phosphates. Meanwhile, the relatively large organic matter content in the no-response fields might have resulted in adequate available N, thus limiting the yield response of fields to the applied N. Soil organic matter, particularly the labile fraction plays a significant role in N mineralization because it acts as an easily accessible source of energy for microorganisms and in return results in greater N mineralization [71]. However, there is a need for more research to investigate the effect of the Fe content and other factors accounting for non-responsiveness to fertilizer application in the no-response fields.
Cluster III and IV with a limited yield response to P have the highest average soil available P contents of 11.21 and 17.7 mg·kg−1, respectively. Both values for available Mehlich-3 P are above the soil critical levels of 10 mg·kg−1 for maize as reported by Redi et al. [72] below which P becomes deficient. The high soil P content is likely due to the residual effect of historical P applications, as P applied through fertilizer or manure, not taken up by the crop or temporarily fixed in the soil is released slowly to the succeeding crops [73]. Therefore, a larger addition of P to those fields could even reduce yield as excessive levels of P in the soil might become toxic or disrupt the nutrient balance. Similar fields with limited yield response to P application have been reported across Sub-Saharan Africa (SAA) under cereal production [30]. Although B content in all the clusters was below the critical level as indicated in the literature ranging between 0.15 to 0.5 mg·kg−1 [60], relatively lower B contents were significantly identified as the major factor for allocation of fields into cluster IV with a large yield response to secondary macro- and micro-nutrients (SMM). It follows that there is a need for comparable diagnostic trials where each individual SMM is omitted to clearly understand their independent role in yield response before designing improved nutrient addition schemes. Stability analysis also supported the need, as the addition of SMM to the NPK treatment resulted in a more stable yield across all the environments but especially for hybrid varieties. This might indicate a potential future deficiency of SMM if the current trend of only using N, P and K based fertilizers with small organic matter additions and complete crop residue removal, as is common among farmers, continues. This may demand reformulation of fertilizers for addressing emerging nutrient requirements for balanced nutrition.

4.3. Management

A small maize yield response to K application was obvious in all clusters. It follows that only small amounts of K applications are required for maintaining high maize yields as well as for maintaining soil K reserves based on site-specific nutrient management (SSNM) principles. SSNM provide guidelines for maintenance K application in high potential maize production environments to avoid depletion of soil K reserves in the long-term [74]. The present results of maize response to K however, do not support the current high rate of K (60 kg K2O·ha−1) recommended in many cropping areas in northern Nigeria savannas. This suggests that farmers who can afford to access K fertilizers to meet the recommended rate are generally applying more K than required for maximizing maize production resulting in lower profitability. Consequently, the blanket recommendation rate of K needs to be adjusted and this adjustment will have large implications for crop production, especially in farming systems where farm level resources are scarce such as in Nigeria as well as in other areas in SSA.
For the largest cluster displaying N and P yield response (cluster II), the focus should be on optimizing N and P supply, while small applications of K and SMM are recommended for maintenance and for a slight increase in attainable yield since balanced application of N, P, K and SMM resulted in a small yield increase of at least 0.3 t·ha−1 over N and P applications alone. Optimal application of N and a small application of P and K is sufficient for fields in cluster III with large yield response to N only, no addition of SMM is required as their application resulted in a slight decrease in yield over the NPK alone. Fields in cluster IV with a large yield response to N and SMM requires an optimal application of N and SMM and a small application of P and K for reserve maintenance. The no-response fields (cluster I) requires specific management once the underlying root causes are clearly understood [74]. Therefore, for now the attention should be directed toward understanding the root causes and management options to restore their responsiveness.

5. Conclusions

Most soil characteristics of the studied fields reveal large variability, while in general they are all characterized by low contents of total C, total N, ECEC and available boron. Consequently, maize showed a large degree of variation in yield response to nutrient applications across the studied fields. Nitrogen and phosphorus were generally the most limiting nutrients for maize production in the northern Nigerian savanna zone. However, in a few study fields, maize yield responded significantly to secondary and micronutrients as well. Overall, the maize yield response to K was small across sites suggesting that only small amounts of K are required for maximizing maize production as well as for soil fertility maintenance to minimize depletion of K reserves and sustain maize productivity in the long-term. It is apparent that the site-specific variations in soil nutrient related constraints need to be matched with specific varietal (genotypic) requirements to optimize maize productivity in the Nigerian savanna. Decision support tools (like Nutrient Expert), if well calibrated using information from the response clusters may offer a feasible and cheaper alternative for the development of fertilizer recommendations that are tailored toward specific fields and farm conditions. Fields without any response to fertilizer application are widespread in the Nigerian savanna and there is a need to investigate the underlying causes to restore their responsiveness for a sustainable maize intensification. In addition, there is also a need for diagnostic trials involving the omission of secondary macro- and micro-nutrients separately to understand their distinctive role in limiting maize yield and the link with underlying soil characteristics.

Acknowledgments

We thank the Bill and Melinda Gates Foundation (BMGF) for providing grant for this research through the project “Taking Maize Agronomy to Scale in Africa (TAMASA)” managed by the International Maize and Wheat Improvement Centre (CIMMYT) in collaboration with the International Institute for Tropical Agriculture (IITA), International Plant Nutrition Institute (IPNI) and Centre for Dryland Agriculture (CDA), Bayero University Kano, Nigeria. We acknowledge the contribution of all staff of CDA, Bayero University Kano, Nigeria and IITA, Nigeria for coordinating the establishment, management and data collection of the trials. We also appreciate the efforts made by laboratory staff of IITA, Nigeria for carrying out the soil analyses.

Author Contributions

B.M.S. conducted the field experiments (with assistance as described in the acknowledgments), analysed the data and wrote the manuscript. R.M., J.M.J., A.Y.K. and J.R. conceived the research and revised the manuscript.

Conflicts of Interest

The authors declare no conflict of interest. The funding sponsors had no role in the design and conduct of the research, or in the decision to publish the results.

References

  1. Adesoji, A.G.; Abubakar, I.U.; Labe, D.A. Economic performance of maize under incorporated legumes and nitrogen in northern Guinea savanna zone of Nigeria. Asian J. Agric. Res. 2016, 10, 38–46. [Google Scholar] [CrossRef]
  2. Food and Agriculture Organization of the United Nations (FAOSTAT). Available online: faostat3.fao.org/download/Q/QC/E (accessed on 3 March 2016).
  3. Fakorede, M.A.B.; Akinyemiyu, O.A. Climatic change: Effects on maize production in a tropical rainforest location. In Maize Revolution in West and Central Africa, Proceedings of Regional Maize Workshop, Cotonou, Benin, 14–18 May 2001; Badu-Apraku, B., Fakorede, M.A.B., Ouedraogo, M., Carsky, R.J., Menkir, A., Eds.; West and Central Africa Collaborative Maize Research Network (WECAMAN), International Institute of Tropical Agriculture (IITA): Idaban, Nigeria, 2003; pp. 272–282. [Google Scholar]
  4. Global Yield Gap Atlas. Basic Data Nigeria. Available online: http://www.yieldgap.org/ (accessed on 24 July 2017).
  5. Sileshi, G.; Akinnifesi, F.K.; Debusho, L.K.; Beedy, T.; Ajayi, O.C.; Mong’omba, S. Variation in maize yield gaps with plant nutrient inputs, soil type and climate across sub-Saharan Africa. Field Crop. Res. 2010, 116, 1–13. [Google Scholar] [CrossRef]
  6. Omobolanle, L.; Ewuola, S.O.L.U.; Daramola, A.G. Socio-economic impact assessment of maize production technology on farmers’ welfare in southwest, Nigeria. J. Cent. Eur. Agric. 2005, 6, 15–26. [Google Scholar]
  7. Girei, A.A.; Galadima, O.E. Resource-use efficiency and profitability of maize production in Lafia local government area of Nasarawa state, Nigeria. Eur. J. Acad. Essays 2016, 3, 234–238. [Google Scholar]
  8. Bojo, J. The costs of land degradation in Sub-Saharan Africa. Ecol. Econ. 1996, 16, 161–173. [Google Scholar] [CrossRef]
  9. Ekeleme, F.; Jibrin, J.M.; Kamara, A.Y.; Oluoch, M.; Samndi, A.M.; Fagge, A.A. Assessment of the relationship between soil properties, Striga hermonthica infestation and the on-farm yields of maize in the dry Savannas of Nigeria. Crop Prot. 2014, 66, 90–97. [Google Scholar] [CrossRef]
  10. Jones, M.J.; Wild, A. Soils of West African Savanna; Technical Communication No. 55; Common Wealth Bureau of Soils: Harpenden, UK, 1975.
  11. Federal Department of Agricultural Land Resources (FDALR). Assessment of Soil Degradation in Nigeria; Project Report; Federal Department of Agricultural Land Resources: Abuja, Nigeria, 1999.
  12. Federal Fertilizer Department (FFD). Fertilizer Use and Management Practices for Nigeria, 4th ed.; Federal Fertilizer Department, Federal Ministry of Agriculture and Rural Development: Abuja, Nigeria, 2012.
  13. Manu, A.; Bationo, A.; Geiger, S.C. Fertility status of selected millet producing soils of West Africa with emphasis on phosphorus. Soil Sci. 1991, 152, 315–320. [Google Scholar] [CrossRef]
  14. Shehu, B.M.; Jibrin, J.M.; Samndi, A.M. Fertility status of selected soils in the Sudan savanna biome of northern Nigeria. Int. J. Soil Sci. 2015, 10, 74–83. [Google Scholar] [CrossRef]
  15. Hengl, T.; Leenaars, J.G.B.; Shepherd, K.D.; Walsh, M.G.; Heuvelink, G.B.M.; Mamo, T.; Tilahun, H.; Berkhout, E.; Cooper, M.; Fegraus, E.; et al. Soil nutrient maps of Sub-Saharan Africa: Assessment of soil nutrient content at 250 m spatial resolution using machine learning. Nutr. Cycl. Agroecosyst. 2017, 109, 77–102. [Google Scholar] [CrossRef]
  16. Lombin, G. Soil and climatic constraints to crop production in the Nigerian savanna region. In Proceedings of the 15th Annual Conference of Soil Science Society of Nigeria, Kaduna, Nigeria, 20–24 September 1987; Soil Science Society of Nigeria: Kaduna, Nigeria, 1987. [Google Scholar]
  17. Nziguheba, G.; Tossah, B.K.; Diels, J.; Franke, A.C.; Aihou, K.; Iwuafor, E.N.O.; Nwoke, C.; Merckx, R. Assessment of nutrient deficiencies in maize in nutrient omission trials and long-term field experiments in the West African Savanna. Plant Soil 2009, 314, 143–157. [Google Scholar] [CrossRef]
  18. Hassan, A.M.; Ogbonnaya, C.S. Status and distribution of available micronutrient in Udic Kanhaplustults of Bauchi local government area, Bauchi state. Sch. J. Agric. Vet. Sci. 2016, 3, 257–261. [Google Scholar]
  19. Food and Agriculture Organization of the United Nations (FAOSTAT). Available online: http://www.fao.org/faostat/en/#country/159 (accessed on 14 December 2017).
  20. Morris, M.; Kelly, V.A.; Kopicki, R.J.; Byerlee, D. Fertilizer Use in African Agriculture Lessons Learned and Good Practice Guidelines; The World Bank: Washington, DC, USA, 2007. [Google Scholar]
  21. Sheahan, M.; Barrett, C.B. Understanding the Agricultural Input Landscape in Sub-Saharan Africa: Recent Plot, Household and Community-Level Evidence; Policy Research Working Paper No. 7014; World Bank Group: Washington, DC, USA, 2014; pp. 1–87. [Google Scholar]
  22. Deckers, J. A systems approach to target balanced nutrient management in soilscapes of Sub-Saharan Africa. In Itegrated Plant Nutrient Management in Sub-Saharan Africa; Vanlauwe, B., Diels, J., Sanginga, N., Merckx, R., Eds.; CAB International: Wallingford, UK, 2002. [Google Scholar]
  23. Tittonell, P.; Vanlauwe, B.; Leffelaar, P.A.; Shepherd, K.D.; Giller, K.E. Exploring diversity in soil fertility management of smallholder farms in western Kenya: II. Within-farm variability in resource allocation, nutrient flows and soil fertility status. Agric. Ecosyst. Environ. 2005, 110, 166–184. [Google Scholar] [CrossRef]
  24. Vanlauwe, B.; Chianu, J.; Giller, K.E.; Merckx, R.; Mokwunye, U.; Pypers, P.; Shepherd, K.; Smaling, E.; Woomer, P.L.; Sanginga, N. Integrated soil fertility management: Operational definition and consequences for implementation and dissemination. Outlook Agric. 2010, 39, 17–24. [Google Scholar] [CrossRef]
  25. Friesen, D.K. Fate and efficiency of sulfur fertilizer applied to food crops in West Africa. Fertil. Res. 1991, 29, 35–44. [Google Scholar] [CrossRef]
  26. Ojeniyi, S.O.; Kayode, G.O. Response of maize to copper and sulfur in tropical regions. J. Agric. Sci. Camb. 1993, 120, 295–299. [Google Scholar] [CrossRef]
  27. Weil, R.R.; Mughogho, S.K. Sulfur nutrition of maize in four regions of Malawi. Agron. J. 2000, 92, 649–656. [Google Scholar] [CrossRef]
  28. Perez-Quezada, J.; FPettygrove, G.S.; Plant, R.E. Spatial—Temporal analysis of yield and soil factors in two-fourcCrop—Rotation fields in the Sacramento valley, California. Agron. J. 2003, 95, 676–687. [Google Scholar] [CrossRef]
  29. Fridgen, J.J.; Kitchen, N.R.; Sudduth, K.A.; Drummond, S.T.; Wiebold, W.J.; Fraisse, C.W. Management zone analyst (MZA): Software for subfield management zone. Agron. J. 2004, 96, 100–108. [Google Scholar]
  30. Kihara, J.; Nziguheba, G.; Zingore, S.; Coulibaly, A.; Esilaba, A.; Kabambe, V.; Njoroge, S.; Palm, C.; Huising, J. Understanding variability in crop response to fertilizer and amendments in sub-Saharan Africa. Agric. Ecosyst. Environ. 2016, 229, 1–12. [Google Scholar] [CrossRef] [PubMed]
  31. Njoroge, S.; Schut, A.G.T.; Giller, K.E.; Zingore, S. Strong spatial-temporal patterns in maize yield response to nutrient additions in African smallholder farms. Field Crop. Res. 2017, 214, 321–330. [Google Scholar] [CrossRef]
  32. Federal Department of Agricultural Land Resources (FDALR). The Reconnaissance Soil Survey of Nigeria (1:65,000); Soils Report Volume 2; Federal Department of Agricultural Land Resources: Abuja, Nigeria, 1990.
  33. Malgwi, W.B.; Tarfa, B.D.; Daudu, C.; Arunah, L.; Omadachi, U.; Idonga, S.; Musa, L.; Amapu, I.Y.; Kuchinda, N.C.; Atala, T.K.; et al. Final Report on Semi-Detail Soil Survey of Selected Areas along Cotton Value Chain in Katsina (Bakori), Zamfara (Tsafe) and Adamawa (Numan); Federal Ministry of Agriculture and Rural Development of Land Resources: Abuja, Nigeria, 2013.
  34. Muhammad, B. Characterization and Fertility Capability Classification of Some Soils on the Basement Complex in Kano State, Nigeria. Master’s Thesis, Bayero University Kano, Kano, Nigeria, 2016. [Google Scholar]
  35. Malgwi, W.B.; Tarfa, B.D.; Daudu, C.; Arunah, L.; Omadachi, U.; Idonga, S.; Musa, L.; Amapu, I.Y.; Kuchinda, N.C.; Atala, T.K.; et al. Final Report on Semi-Detail Soil Survey of Selected Areas along Otton Value Chain, Second Phase in Katsina (Funtua), Zamfara (Gusau), Ogun (Imeko Afon, Yewa North) and Oyo (Iseyin); Federal Ministry of Agriculture and Rural Develoment of Land Resources: Abuja, Nigeria, 2014.
  36. Magaji, M.J. Soil Characterization and Development of Pedotransfer Functions for Estimating Soil Properties in Nigerian Northern and Southern Guinea Savanna. Master’s Thesis, Bayero University Kano, Kano, Nigeria, 2015. [Google Scholar]
  37. Jones, A.; Breuning-Madison, H.; Brossard, M.; Dampha, A.; Deckers, J.; Dewitte, O.; Gallali, T.; Hallet, S.; Jones, R.; Kilsara, M.; et al. Soil Atlas of Africa; European Commission, Publications of the European Union: Luxembourg, 2013. [Google Scholar]
  38. Blake, G.R.; Hartge, K.H. Bulk density, methods of soil analysis. In Part 1. Physical and Mineral Method; Klute, A., Ed.; American Society of Agronomy (ASA), Soil Science Society of America (SSSA): Madison, WI, USA, 1986. [Google Scholar]
  39. Heanes, D.L. Determination of total organic-C in soils by an improved chromic acid digestion and spectrophotometric procedure. Commun. Soil Sci. Plant Anal. 1984, 15, 1191–1213. [Google Scholar] [CrossRef]
  40. Bremner, J.M. Nitrogen-Total. In Methods of Soil Analysis: Chemical Methods; Sparks, D.L., Ed.; American Society of Agronomy and Soil Science Society of America: Madison, WI, USA, 1996. [Google Scholar]
  41. Gee, G.W.; Or, D. Particle-size analysis. In Methods of Soil Analysis. Part 4. Physical Methods; Dane, J.H., Topp, G.C., Eds.; Soil Science Society of America Book Series 5; Soil Science Society of America: Madison, WI, USA, 2002. [Google Scholar]
  42. Mehlich, A. Mehlich 3 soil test extractant: A modification of Mehlich 2 extractant. Commun. Soil Sci. Plant Anal. 1984, 15, 1409–1416. [Google Scholar] [CrossRef]
  43. Anderson, J.M.; Ingram, J.S.I. Tropical Soil Biology and Fertility (TSBF). A Hand Book of Methods, 2nd ed.; CABI International: Wallingford, UK, 1993. [Google Scholar]
  44. SAS Institute Inc. JMP® 13 Documentation Library; SAS Institute Inc.: Cary, NC, USA, 2017. [Google Scholar]
  45. Wilding, L.P. Spatial variability: Its documentation, accommodation and implication to soil surveys. In Soil Spatial Variability; Nielsen, D.R., Bouma, J., Eds.; Pudoc: Wageningen, The Netherlands, 1985. [Google Scholar]
  46. Raun, W.R.; Barreto, H.J.; Westerman, R.L. Use of stability analysis for long-term soil fertility experiments. Agron. J. 1993, 85, 159–167. [Google Scholar] [CrossRef]
  47. Bronikowski, A.; Cobb, W. Appendix: A critical examination of rainfall variability measures used in behavioral ecology studies. Behav. Ecol. Sociobiol. 1996, 39, 27–30. [Google Scholar] [CrossRef]
  48. Sarle, W.S. The Cubic Clustering Creterion; SAS Technical Report A-108; SAS Institute Inc.: Cary, NC, USA, 1983. [Google Scholar]
  49. Arshad, M.A.; Lowery, B.; Grossman, B. Physical tests for monitoring soil quality. In Methods for Assessing Soil Quality; Doran, J.W., Jones, A.J., Eds.; Soil Science Society of America: Madison, WI, USA, 1996. [Google Scholar]
  50. National Special Programme for Food Security (NSPFS). Nigerian Soil Fertility Rating and Thematic Maps; National Special Programme for Food Security: Abuja, Nigeria, 2005. [Google Scholar]
  51. Horneck, D.A.; Sullivan, D.M.; Owen, J.S.; Hart, J.M. Soil Test Interpretation Guide; Oregon State University Extension Publication EC 1478; Oregon State University: Corvallis, OR, USA, 2011. [Google Scholar]
  52. Esu, I.E. Detailed Soil Survey of NIHORT Farm at Bunkure Kano State, Nigeria; Ahmadu Bello University Zaria: Kaduna, Nigeria, 1991. [Google Scholar]
  53. Brady, N.C.; Weil, R.R. The Nature and Properties of Soils, 13th ed.; Pearson Education: Singapore, 2002; ISBN 9780130167637. [Google Scholar]
  54. Voncir, N.; Mustapha, S.; Tenebe, V.A.; Kumo, A.L.; Kushwaha, S. Content and profile distribution of extractable zinc (Zn) and some physicochemical properties of soil along a toposequence at Bauchi, Northern Guinea Savanna of Nigeria. Int. J. Soil Sci. 2008, 3, 62–68. [Google Scholar] [CrossRef]
  55. Malgwi, W.B.; Ojanuga, A.G.; Chude, V.O.; Kparmwang, T.; Raji, B.A. Morphological and physical properties of some soils at Samaru, Zaria, Nigeria. Niger. J. Soil Resour. 2000, 1, 58–64. [Google Scholar]
  56. Kwari, J.D.; Kamara, A.Y.; Ekeleme, F.; Omoigui, L. Soil fertility variability in relation to the yields of maize and soybean under intensifying cropping systems in the tropical savannas of northeastern Nigeria. In Innovations as Key to the Green Revolution in Africa: Exploring the Scientific Facts; Bationo, A., Waswa, B., Okeyo, J.M., Maina, F., Kihara, J.M., Eds.; Springer: Dordrecht, The Netherlands, 2011; pp. 457–464. [Google Scholar]
  57. Kamara, A.Y.; Ekeleme, F.; Jibrin, J.M.; Tarawali, G.; Tofa, I. Assessment of level, extent and factors influencing Striga infestation of cereals and cowpea in a Sudan savanna ecology of northern Nigeria. Agric. Ecosyst. Environ. 2014, 188, 111–121. [Google Scholar] [CrossRef]
  58. Møberg, J.P.; Esu, I.E. Characteristics and composition of some savanna soils in Nigeria. Geoderma 1991, 48, 113–129. [Google Scholar] [CrossRef]
  59. Sillanpää, M. Micronutrients and the Nutrient Status of Soils: A Global Study; FAO Soil Bulletin 48; Werner Söderström Osakeyhtiö Publishers: Helsinki, Finland, 1982. [Google Scholar]
  60. Aref, F. Concentration and uptake of zinc and boron in corn leaf as affected by zinc sulfate and boric acid fertilizers in a deficient soil. Life Sci. J. 2011, 8, 26–32. [Google Scholar]
  61. Ahmad, W.; Zia, M.H.; Malhi, S.S.; Niaz, A.; Saifullah. Boron deficiency in soils and crops: A Review. In Crop Plant; Goyal, A., Ed.; InTech: Rijeka, Croatia, 2012; pp. 77–114. ISBN 978-953-51-0527-5. [Google Scholar]
  62. Kamara, A.Y.; Menkir, A.; Ajala, S.O.; Kureh, I. Performance of diverse maize genotypes under nitrogen deficiency in the northern Guinea savanna of Nigeria. Exp. Agric. 2005, 41, 199–212. [Google Scholar] [CrossRef]
  63. Kamara, A.Y.; Ewansiha, S.U.; Menkir, A. Assessment of nitrogen uptake and utilization in drought tolerant and Striga resistant tropical maize varieties. Arch. Agron. Soil Sci. 2014, 60, 195–207. [Google Scholar] [CrossRef]
  64. Adnan, A.A.; Jibrin, J.M.; Kamara, A.Y.; Abdulrahman, B.L.; Shaibu, A.S. Using CERES-Maize model to determine the nitrogen fertilization requirements of early maturing maize in the Sudan Savanna of Nigeria. J. Plant Nutr. 2017, 40, 1066–1082. [Google Scholar] [CrossRef]
  65. Vanlauwe, B.; Kihara, J.; Chivenge, P.; Pypers, P.; Coe, R.; Six, J. Agronomic use efficiency of N fertilizer in maize-based systems in sub-Saharan Africa within the context of integrated soil fertility management. Plant Soil 2011, 339, 35–50. [Google Scholar] [CrossRef]
  66. Badu-Apraku, B.; Fakorede, M.A.B.; Oyekunle, M.; Yallou, G.C.; Obeng-Antwi, K.; Haruna, A.; Usman, I.S.; Akinwale, R.O. Gains in grain yield of early maize cultivars developed during three breeding eras under multiple environments. Crop Sci. 2015, 55, 527–539. [Google Scholar] [CrossRef]
  67. Zingore, S.; Delve, R.J.; Nyamangara, J.; Giller, K.E. Multiple benefits of manure: The key to maintenance of soil fertility and restoration of depleted sandy soils on African smallholder farms. Nutr. Cycl. Agroecosyst. 2008, 80, 267–282. [Google Scholar] [CrossRef]
  68. Agboola, A.A.; Ayedele, O.J. Prospects and problems of using soil testing for adoption of fertilizer use in Ekiti-Akoko agricultural develepment project area. In Proceedings of Workshops on Appropriate Technologies for Farmers in Semi-Arid West Africa, 2–5 April 1985; Purdue University: West Lafayette, IN, USA, 1985; pp. 123–136. [Google Scholar]
  69. Federal Ministry of Agriculture and Natural Resources (FMANR). Literature Review in Soil Fertility Investigations in Nigeria (in Five Volumes); Federal Ministry of Agriculture and Natural Resources: Lagos, Nigeria, 1990.
  70. Giller, K.E.; Tittonell, P.; Rufino, M.C.; van Wijk, M.T.; Zingore, S.; Mapfumo, P.; Adjei-Nsiah, S.; Herrero, M.; Chikowo, R.; Corbeels, M.; et al. Communicating complexity: Integrated assessment of trade-offs concerning soil fertility management within African farming systems to support innovation and development. Agric. Syst. 2011, 104, 191–203. [Google Scholar] [CrossRef]
  71. Ros, G.H.; Hanegraaf, M.C.; Hoffland, E.; van Riemsdijk, W.H. Predicting soil N mineralization: Relevance of organic matter fractions and soil properties. Soil Biol. Biochem. 2011, 43, 1714–1722. [Google Scholar] [CrossRef]
  72. Redi, M.; Gebremedhin, W.; Merkeb, F. Critical level of extractable phosphorus for maize (Zea mays L.) at Metekel zone, northwestern Ethiopia. World Sci. News 2016, 54, 14–26. [Google Scholar]
  73. Janssen, B.H.; Lathwell, D.J.; Wolf, J. Modeling long-term crop response to fertilizer phosphorus. II. Comparison with field results. Agron. J. 1987, 79, 452–458. [Google Scholar] [CrossRef]
  74. Witt, C.; Dobermann, A.; Abdulrachman, S.; Gines, H.C.; Guanghuo, W.; Nagarajan, R.; Satawatananont, S.; Thuc Son, T.; Sy Tan, P.; Van Tiem, L.; et al. Internal nutrient efficiencies of irrigated lowland rice in tropical and subtropical Asia. Field Crop. Res. 1999, 63, 113–138. [Google Scholar] [CrossRef]
Figure 1. A map of Nigeria showing study sites and experimental fields for on-farm diagnostic nutrient omission trials (NOTs) established in 2015 and 2016 cropping seasons.
Agronomy 08 00018 g001
Figure 2. Seasonal cumulative rainfall recorded in two cropping seasons, 2015 and 2016, at each on-farm diagnostic nutrient omission trial (NOTs) study site.
Agronomy 08 00018 g002
Figure 3. Observed maize grain yield in control versus NPK treatment across the study sites. Error bars are standard error of means.
Agronomy 08 00018 g003
Figure 4. Effect of omission of primary macro-nutrients and application of secondary macro- and micro-nutrients on maize grain yield difference relative to NPK across the study sites. Error bars are standard error of means.
Agronomy 08 00018 g004
Figure 5. Stability analysis of maize grain yields in different nutrient omission treatments for fourteen different environments (sites) in the northern Nigeria savanna in 2015 and 2016 cropping seasons. OPV: open pollinated maize variety.
Agronomy 08 00018 g005
Figure 6. Regression of grain yield versus Shannon rainfall distribution index (I) (A) and cumulative rainfall (R) (B) in case where correlation coefficient revealed a significant relationship (see Table 6) for the 14 study sites, 2015–2016.
Agronomy 08 00018 g006
Figure 7. Maize grain yield from fields classified under different clusters following K-means clustering. Error bars are standard error of means.
Agronomy 08 00018 g007
Table 1. Description of study sites and number of experimental fields where the on-farm diagnostic nutrient omission trials (NOTs) were conducted in northern Nigerian savanna in 2015 and 2016 cropping seasons.
Study SitesStateAgro-Ecological ZoneMajor Soil TypesNo. of Experimental FieldsYear (Season)
BakoriKatsinaNGSLuvisols, Lixisols [32,33]202015 & 2016
BunkureKanoSSCambisols & Acrisols [34]152015 & 2016
DandumeKatsinaNGSLixisols, Cambisols & Luvisols [35]152015 & 2016
DoguwaKanoNGSPlinthosols [34]202015 & 2016
FaskariKatsinaNGSLixisols, Cambisols & Luvisols [35]102016
FuntuaKatsinaNGSLixisols, Cambisols & Luvisols [35]192015 & 2016
GiwaKadunaNGSCambisols & Acrisols [36]102016
IkaraKadunaNGSCambisols & Acrisols [36]182015 & 2016
KauruKadunaNGSLixisols [32]52016
LereKadunaNGSAcrisols & Lixisols [36]152015 & 2016
MakarfiKadunaNGSCambisols & Acrisols [36]142015 & 2016
SobaKadunaNGSCambisols & Acrisols [36]182015 & 2016
TofaKanoSSPlinthosols [37]5 2016
Tudun WadaKanoNGSCambisols, Plinthosols & Gleysols [34]142015 & 2016
Total198
NGS = Northern Guinea savanna agro-ecological zone, SS = Sudan savanna agro-ecological zone, [32,33,34,35,36,37] = source references.
Table 2. Selected physical (texture and bulk density) and chemical (pHH2O, total C- and total N-, available P- and available S- contents) characteristics of the study sites.
Study SitesSand Silt Clay Bulk DensitypHH2OTotal C Total N Avail. P Avail. S
(%)(%)(%)(g·cm−3) (g·kg−1)(g·kg−1)(mg·kg−1)(mg·kg−1)
Bakori51 (7)30 (6)19 (3)1.48 (0.11)6.2 (0.4)6.40 (2.15)0.37 (0.07)3.96 (3.70)6.41 (1.06)
Bunkure68 (4)17 (4)14 (2)1.54 (0.13)6.4 (0.5)4.74 (2.23)0.29 (0.06)10.90 (9.20)5.21 (0.88)
Dandume46 (8)32 (8)22 (4)1.60 (0.05)5.8 (0.4)7.44 (2.22)0.46 (0.08)4.00 (2.35)7.39 (1.08)
Doguwa36 (6)35 (5)29 (6)1.51 (0.16)5.8 (0.5)8.39 (2.03)0.55 (0.12)12.52 (7.66)8.32 (1.75)
Faskari46 (7)29 (6)25 (3)1.53 (0.17)5.6 (0.5)5.39 (1.07)0.46 (0.11)3.08 (3.04)6.95 (1.50)
Funtua43 (6)34 (6)23 (4)1.5 (0.07)5.8 (0.4)6.87 (2.51)0.46 (0.12)4.37 (3.40)7.10 (1.09)
Giwa43 (6)34 (5)23 (3)1.47 (0.14)5.8 (0.6)6.31 (1.45)0.53 (0.12)9.88 (9.22)7.10 (0.84)
Ikara48 (8)30 (5)22 (6)1.57 (0.15)5.6 (0.4)6.55 (2.43)0.45 (0.08)12.73 (8.68)7.28 (1.64)
Kauru57 (4)21 (7)22 (4)1.56 (0.09)5.7 (0.2)6.34 (0.54)0.46 (0.05)18.34 (1.78)7.66 (1.59)
Lere54 (8)24 (4)22 (6)1.60 (0.10)5.7 (0.5)5.85 (1.71)0.38 (0.10)9.22 (6.86)6.77 (0.97)
Makarfi45 (8)33 (5)22 (6)1.55 (0.15)5.7 (0.4)7.6 (2.66)0.43 (0.09)9.56 (9.43)7.56 (1.44)
Soba44 (7)36 (6)20 (3)1.59 (0.11)5.9 (0.4)8.28 (2.94)0.51 (0.10)12.98 (8.55)7.34 (1.52)
Tofa70 (7)15 (4)15 (4)1.62 (0.04)5.7 (0.7)2.72 (0.72)0.25 (0.06)24.98 (2.79)5.39 (0.64)
Tudun Wada59 (7)23 (7)18 (3)1.52 (0.08)6.2 (0.6)6.21 (1.96)0.49 (0.10)17.24 (10.03)7.77 (1.41)
CV (%)22.427.7268.08.437.628.587.721.1
CV: coefficient of variation; Numbers are mean with standard deviation in brackets.
Table 3. Exchangeable cation concentrations, ECEC and exchangeable acidity of the different soils in the study sites.
Study Sites CaMgKNaExchange AcidityECEC
(cmolc·kg−1)(cmolc·kg−1)(cmolc·kg−1)(cmolc·kg−1)(cmolc·kg−1)(cmolc·kg−1)
Bakori2.51 (0.52)0.82 (0.20)0.23 (0.17)0.09 (0.01)0.00 (0.00)3.64 (0.63)
Bunkure1.88 (0.88)0.51 (0.16)0.23 (0.10)0.08 (0.03)0.01 (0.04)2.69 (0.99)
Dandume2.16 (0.59)0.61 (0.19)0.17 (0.09)0.08 (0.01)0.00 (0.00)3.01 (0.69)
Doguwa2.82 (0.81)0.93 (0.30)0.2 (0.10)0.09 (0.02)0.03 (0.08)4.05 (0.96)
Faskari1.42 (0.27)0.73 (0.19)0.35 (0.21)0.09 (0.01)0.07 (0.10)2.64 (0.40)
Funtua2.43 (0.75)0.77 (0.26)0.2 (0.10)0.08 (0.02)0.03 (0.07)3.48 (0.84)
Giwa2.24 (0.56)1.00 (0.30)0.16 (0.07)0.09 (0.00)0.06 (0.09)3.54 (0.71)
Ikara2.26 (0.73)0.49 (0.23)0.28 (0.15)0.07 (0.02)0.10 (0.11)3.18 (0.89)
Kauru2.03 (0.27)0.81 (0.14)0.16 (0.07)0.09 (0.00)0.00 (0.00)3.07 (0.32)
Lere1.8 (0.83)0.48 (0.26)0.20 (0.05)0.07 (0.02)0.02 (0.04)2.55 (1.04)
Makarfi2.06 (0.65)0.68 (0.22)0.20 (0.16)0.08 (0.01)0.15 (0.31)3.16 (0.94)
Soba2.13 (0.58)0.72 (0.17)0.17 (0.08)0.08 (0.01)0.00 (0.00)3.09 (0.68)
Tofa2.64 (0.33)0.42 (0.13)0.19 (0.07)0.09 (0.00)0.09 (0.08)3.41 (0.39)
Tudun Wada3.21 (0.92)0.73 (0.24)0.27 (0.11)0.08 (0.02)0.00 (0.00)4.27 (1.20)
CV (%)34.639.259.823.23.429.0
CV: coefficient of variation; Numbers are mean with standard deviation in brackets.
Table 4. Soil available micronutrients (Zn, Cu, Mn, Fe and B) contents in the study sites.
Study SitesZnCuMnFeB
(mg·kg−1)(mg·kg−1)(mg·kg−1)(mg·kg−1)(mg·kg−1)
Bakori8.88 (2.38)2.25 (0.77)24.24 (13.06)107.99 (31.10)0.02 (0.008)
Bunkure4.77 (2.49)1.47 (0.49)34.13 (23.77)202.89 (17.16)0.01 (0.004)
Dandume9.92 (4.87)2.70 (1.03)21.48 (5.59)106.41 (30.43)0.02 (0.008)
Doguwa12.60 (9.75)1.70 (1.02)40.49 (19.98)109.98 (44.14)0.05 (0.020)
Faskari2.28 (2.12)2.36 (0.59)30.90 (17.17)104.40 (28.57)0.02 (0.005)
Funtua4.81 (2.30)1.76 (0.63)33.44 (36.33)217.86 (116.88)0.03 (0.017)
Giwa9.72 (5.59)1.49 (0.56)36.86 (12.96)131.4 (117.70)0.03 (0.011)
Ikara6.7 (3.48)1.84 (1.06)33.36 (22.94)183.57 (50.09)0.03 (0.019)
Kauru15.30 (1.66)1.13 (0.49)41.77 (7.88)133 (36.83)0.07 (0.040)
Lere4.71 (2.40)1.58 (0.63)30.57 (20.21)203.59 (79.25)0.04 (0.019)
Makarfi9.65 (8.37)2.01 (0.74)20.80 (9.79)129.50 (59.73)0.02 (0.010)
Soba10.98 (5.37)2.20 (1.16)43.01 (20.58)104.25 (38.97)0.02 (0.011)
Tofa6.73 (0.73)1.49 (0.40)77.39 (8.38)158.30 (9.78)0.01 (0.012)
Tudun Wada14.78 (8.46)1.58 (0.66)45.21 (17.49)231.01 (78.66)0.05 (0.030)
CV (%)72.846.56451.681.7
CV: coefficient of variation; Numbers are mean with standard deviation in brackets.
Table 5. Correlation coefficients among treatment yields with Shannon rainfall distribution indices (I) and cumulative rainfall (R) in OPV trials.
Grain Yield (Control)Grain Yield (−N)Grain Yield (−P)Grain Yield (−K)Grain Yield (NPK)Grain Yield (+SMM)
I (25 DFP)0.300.290.090.040.240.10
R (25 DFP)0.070.09−0.02−0.15−0.010.03
I (50 DFP)−0.11−0.07−0.25−0.070.07−0.11
R (50 DFP)−0.14−0.10−0.21−0.14−0.13−0.15
I (50–75 DFP)−0.22−0.12−0.190.18−0.01−0.11
R (50–75 DFP)−0.17−0.02−0.130.330.18−0.01
I (75 DFP)−0.25−0.12−0.330.140.05−0.15
R (75 DFP)−0.29−0.11−0.310.190.05−0.13
I (100 DFP)−0.150.05−0.280.190.09−0.12
R (100 DFP)−0.180.01−0.270.140.04−0.17
I = Shannon rainfall distribution index, R = cumulative rainfall (mm), DFP = days from planting.
Table 6. Correlation coefficients among treatment yields with Shannon rainfall distribution indices (I) and cumulative rainfall (R) in hybrid trials.
Grain Yield (Control)Grain Yield (−N)Grain Yield (−P)Grain Yield (−K)Grain Yield (NPK)Grain Yield (+SMM)
I (25 DFP)0.170.290.170.130.26−0.09
R (25 DFP)0.100.010.14−0.050.21−0.15
I (50 DFP)−0.17−0.01−0.21−0.100.25−0.29
R (50 DFP)−0.13−0.15−0.19−0.110.09−0.20
I (50–75 DFP)−0.40−0.18−0.42−0.22−0.23−0.14
R (50–75 DFP)−0.30−0.03−0.36−0.11−0.140.02
I (75 DFP)−0.44 *−0.22−0.50 *−0.24−0.04−0.30
R (75 DFP)−0.39−0.18−0.50 *−0.18−0.01−0.14
I (100 DFP)−0.35−0.17−0.43 *−0.24−0.12−0.34
R (100 DFP)−0.31−0.11−0.47 *−0.110.03−0.22
I = Shannon rainfall distribution index, R = cumulative rainfall (mm), DFP = days from planting, * p < 0.05.
Table 7. Distribution of fields across study sites in the various OPV and hybrid yield-nutrients response clusters.
Study SitesOPVHybrid
Cluster ICluster IICluster IIICluster ICluster IICluster IIICluster IV
Bakori37611141
Bunkure11117311
Dandume2832830
Doguwa113321410
Faskari0710710
Funtua4854760
Giwa0710710
Ikara28811051
Kauru0500500
Lere09521020
Makarfi0664512
Soba113221130
Tofa0230410
Tudun Wada1563712
Total15 (9.0%)109 (63.0%)50 (28.0%)28 (16.0%)109 (63.0%)30 (17.0%)7 (4.0%)
Table 8. Multinomial logistic regression showing soil characteristics responsible for the allocation of fields to specific yield-nutrients response clusters.
# Cluster ICluster IICluster IIICluster IV
MeanMeanOdds RatioMeanOdds RatioMeanOdds Ratio
Soil Characteristics
pH6.05.80.545.90.666.00.98
OC (g·kg−1)7.76.970.81 *6.520.75 *5.980.45 *
N (g·kg−1)0.440.461.520.453.260.49>1000
P (mg·kg−1)7.768.721.0511.211.09 **17.701.20 **
Sand (%)50.9447.72el49.47el50.8el
Silt (%)28.1229.71el29.89el29.09el
Clay (%)20.9522.59el20.64el20.12el
Ca (cmolc·kg−1)2.382.381.132.301.032.962.12
Mg (cmolc·kg−1)0.630.725.080.666.750.610.54
K (cmolc·kg−1)0.220.232.870.222.500.213.07
Na (cmolc·kg−1)0.080.080.590.08<0.0010.09>1000
E.A. (cmolc·kg−1)0.020.05el0.04el0.00el
ECEC (cmolc·kg−1)3.313.44el3.28el3.86el
Zn (mg·kg−1)8.748.571.008.701.0214.211.07
Cu (mg·kg−1)2.011.920.901.991.142.141.91
Mn (mg·kg−1)29.7833.750.9834.420.9839.830.93
Fe (mg·kg−1)185.33144.120.99 *157.220.99165.480.99
B.D. (g·cm−3)1.551.542.711.6045.68 *1.509.67
B (mg·kg−1)0.040.03<0.0010.02<0.0010.01<0.001 *
S (mg·kg−1)6.957.381.42 *6.991.346.681.44
Fertilizer Management History
Farm Size (ha)1.291.56el1.17el0.54el
Organic fertilizer (kg·ha−1)6052.674035.720.992129.270.98 *21200.99
NPK fertilizer (kg·ha−1)223.08166.82el252.75el280.4el
SSP fertilizer (kg·ha−1)0.004.76el9.45el9.1el
UREA fertilizer (kg·ha−1)36.1777.99el96.53el229.87el
* and ** indicates differences at p < 0.05 and p < 0.01, respectively from the reference # cluster I (No response fields). Model p-value = 0.0081 **, el = eliminated in the model, E.A. = exchangeable acidity (Al + H), B.D. = bulk density.

