Abstract
Individual sugars were analyzed by High Performance Liquid Chromatography (HPLC) in plum juice samples obtained from “Stanley”, “Vânăt de Italia”, and “Tuleu Gras”. The samples were harvested from the inside and periphery of the crown during six development phases. The aim of the present study was to determine the individual sugars in plum juice by the HPLC and Fourier transform mid-infrared spectroscopy (FT-MIR) methods and to validate them. Our findings were as follows: levels between 0.26–3.73% for fructose, 1.43–1.10% for glucose, and 0.01–10.19% for sucrose. The FT-MIR analyses confirmed the differences between the juice samples, mainly in the spectral region characteristic to sugars which ranged from 900 to 1500 cm−1. FT-MIR coupled with Partial least squares (PLS) was used to develop calibration models for estimating individual plum juice sugars, the predictive characteristics being assessed. The optimal regions and spectral pretreatments were 800–1600 cm−1 and Savitzky Golay first derivative (d1) for fructose, 800–1600 cm−1 for glucose, and 915–1145 cm−1 and second derivative (d2) for sucrose. The selection of optimal spectral zones and pre-treatments led to PLS calibration models with acceptable predictive abilities for glucose, very good for sucrose, and less satisfactory for fructose. Moreover, the FT-MIR results were compared to the HPLC results in external validation tests and reference values included.
1. Introduction
In countries of the European Union, more than 190 thousand hectares are cultivated with Prunus domestica L., which is one of the preferred plum trees, in this part of the world. The EU production (1.6 million tonnes) of Prunus domestica plums constitutes 15% of the global production of this fruit [1]. As it is so highly appreciated by consumers all over the world, this fruit species has become outstandingly popular [2]. Sugars reach up to a concentration of 93% of the total soluble solid content, in plum juice [3]. The carbohydrates contained in the fruit provide energy to consumers; the sweetness of the fruit enhances consumers’ pleasure while eating it, thus determining the edibility of the fruit [4]. During growth and development plants need soluble sugars for reaching complete maturity [5]. In the fleshy fruit, accumulation of soluble sugar during the fruit development causes the sweetness when the fruit is ripe and ready for harvest. Although there are reports on carbohydrate accumulation in fruits and changes caused by enzymes during growth, sugar accumulation remains unclear, being regulated at the level of genes’ expression [6,7].
It is known that instrumental techniques for determining carbohydrates are costly and require considerable work. Recently, Fourier Infrared Medium Transform (FT-MIR) has become a widely accepted method for determining chemical compounds in food, as it is a fast, practical and environmentally friendly method. The absorption zones in the MIR region are characterized by the bonds and functional groups of a molecule [8].
The MIR spectroscopy associated with chemometry has been successfully applied to predict the chemical composition (sugars, organic acids, acidity, dry matter, polyphenols, proteins, humidity, fats, micronutrients, etc.) of various food products, such as: mango juice [9], apple juice [10], or even the whole fruit of apricots [11], or tomatoes [12], wine [13,14], honey [15], leaves and trunk of vine [16], pomegranates [17,18,19], grapes [20], wheat [21], milk [22], lemon [23], black beans [24] and chocolate [25]. The use of FT-MIR for the prediction of sucrose, glucose and fructose was also confirmed by Karoui [26] for plums and by Mureşan [27] for the apple fruit, together with linear discriminant analysis, principal component (PCR) and partial least squares (PLS) regressions.
The purpose of the study is identifying, quantifying and monitoring the dynamics of sugar accumulation during the growth and development of the three plum varieties (Stanley, Vânăt de Italia and Tuleu Gras) by HPLC (High performance liquid chromatography). The study also aims to provide help to horticulturists in making the best use of the plums resulting from physiological fall.
In addition, this study provides support to horticulture specialists in finding out the optimum time to harvest the plums according to the amount of sugars by means of quick and nondestructive methods (FT-MIR). The selection of optimal spectral zones and pre-treatments to achieve PLS calibration models for predicting individual sugars concentrations will significantly contribute for monitoring individual sugar concentrations during the plum fruit growth. Moreover, a direct rapid method (FT-MIR coupled to chemometrics) for determining the concentration of sugars in different plum juice qualities will be useful in future breeding researches carried out on monitoring the sugar content of the fruit obtained from new hybrids during growth. Consequently, the current study firstly aims to determine the individual sugars in the juice of three plum varieties (“Stanley”, “Vânăt de Italia” and “Tuleu Gras”) during their growth and maturation by HPLC. Secondly, it aims to develop FT-MIR calibration models for the same samples set, external validation tests being also performed.
2. Materials and Methods
2.1. Plant Material
In this study, three plum varieties of Prunus domestica, namely: “Vânăt de Italia”, “Tuleu Gras” and “Stanley” were used. They were harvested in the phase of fruit growth, in a farm from Cluj-Napoca. Harvesting resulted in 36 samples (36 different samples = 3 varieties × 6 harvesting phases × 2 crown positions—Figure 1). The harvesting protocol in 2013 was identical for all these plum varieties (Figure 2).
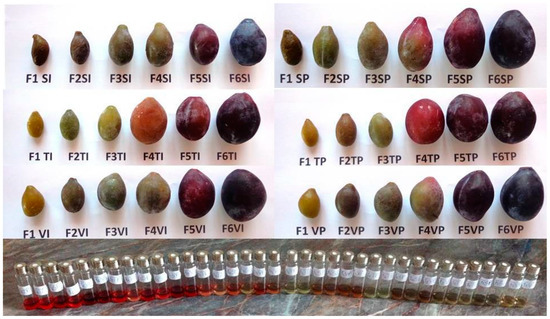
Figure 1.
The samples used in the experiment (F1 → F6—Harvesting phases; S—“Stanley”; T—“Tuleu Gras”; V—“Vânăt de Italia”; P—Periphery of the tree crown; I—Inside of the tree crown).
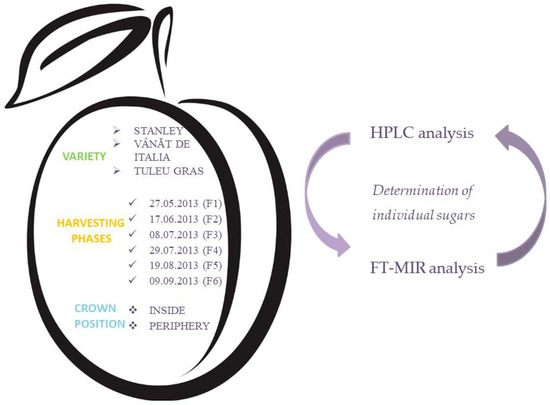
Figure 2.
Experimental design. HPLC: High performance liquid chromatography; FT-MIR: Fourier transform mid-infrared spectroscopy.
2.2. Sample Preparation
Until further analysis was carried out, the 36 harvested samples were packaged under vacuum and stored at −18 °C. The correspondent plum juice (Figure 1) obtained by pressing the pulp of each sample was stored at −18 °C in two separate containers until further analysis (i.e., HPLC and FT-MIR analyses—Figure 2).
2.3. Determination of Individual Sugars by HPLC
Determination of sugars in the plum juice obtained from the studied samples was performed according to what Mureșan et al. [27] had suggested, but with some modifications. After filtration through a 0.45 μm Millipore filter, the individual sugar content of each sample was determined by HPLC coupled with a refraction index detector. The identification of sugars was based on the retention times of standards. Quantification was based on the calibration curves obtained for each sugar, after injecting known concentrations of a standard. The equipment used was a Shimadzu HPLC system (Shimadzu Corporation, Kyoto, Japan) consisting of a controller, auto-sampler, degasser, pump and IR detector. The separation was performed on a modified Amino colum–Alltima Amino 100 A, 5 μm, 250 × 4.6 mm. The mobile phase flow rate was 1.3 mL/min. The column temperature was set at 30 °C and the sample injection volume was 20 μL. Isocratic conditions were selected by using acetonitrile/water (75/25; volume/volume (v/v)) as mobile phase. Each determination was repeated twice.
2.4. FT-MIR Analysis
FT-MIR plum juice spectra, which were obtained from the studied samples, were recorded using Shimadzu IR Prestige-21 equipment (Shimadzu Corporation, Kyoto, Japan). Each spectrum was recorded from 650–4000 cm−1, in three repetitions, consisting of the average of 128 separate scans. The treatments applied to experimental data and mathematical calibration models were made using the The Unscrambler v9.7 chemometric software (CAMO Software, Oslo, Norway).
2.5. Statistical Analysis
The influence of the harvesting phase, variety and crown position on the concentrations of plum juice fructose, glucose and sucrose were analysed by means of the three-way ANOVA (Analysis of Variance) General Linear Model, one-way ANOVA and Tukey’s comparison statistical tests.
3. Results
3.1. HPLC Analysis of Plum Juice Sugars Obtained from Fruits Harvested during Development
Table 1 shows the carbohydrate concentration for each cultivar, depending on the position and harvesting phase. The plum fruit fructose content shows a general upward trend during growth and development, in the six harvesting stages, with slight fluctuations in the harvesting phases 2 and 6. The content of glucose has significantly increased (p < 0.05) for the fruit harvested during phase 6, with small oscillations, though.

Table 1.
Changes in the individual sugar content of three varieties of plum fruit during growth and development.
The main composition of sugars changed in different stages of development. During the growth and development of plums, the glucose levels reached a peak in the first developmental phases, while the sucrose values were lower than 0.02 g/100 g of juice. In addition, depending on the variety, in the process of growth and maturation of plums, the content of glucose and sucrose reached the highest point between 6.35 and 12.10 g/100 g of juice for glucose, and 6.15 and 10.19 g/100 g of juice for sucrose, respectively. In the first stage of development, the content of fructose also increased from 0.26 to 1.33 g/100 g of juice depending on the variety and crown position and from 1.31 to 3.73 g/100 g of juice in the last stage of maturation. Similarly, Zhao et al. [28] demonstrated that the fructose and glucose content increased steadily during maturation, in the wolfberry fruit.
The concentration of fructose was considerably lower than the glucose concentration over the entire period of the plum development. A similar pattern of changes in sugar concentration was reported by Serrano et al. [29], for loquat fruit and by Wu et al. [30] for peaches.
Increases in fructose and glucose concentrations were recorded during the development and maturation of apple fruit [7], medlar [31], strawberry [32] and grape [33].
The sucrose content of the analyzed plums increased throughout the course of the study. In the early harvesting stages, sucrose grew slowly, by an insignificant percentage (p > 0.05), while in the last two phases it increased reaching a significant value (p < 0.05).
Due to the irregular fluctuations in the sucrose content of the fruits studied during their growth and development, it is hard to classify the species by the dynamic accumulation of sucrose. However, the findings of our study showed that in the last harvesting phase, the largest amount of sucrose was found, in the “Stanley” variety, both inside the crown and at the periphery of the tree crown. The next highest level was shown by the “Vânăt de Italia” variety, which presented higher values for the plums harvested within the interior of the tree crown than those harvested in the “Tuleu Gras” variety and the values found in the fruit harvested from the crown periphery which were statistically insignificant (p > 0.05).
Sucrose is the predominant sugar in mature plum fruit, similarly to peach [34] or citrus [35] fruit, its progressive accumulation being realized in the last stages of development. The mechanism of rapid accumulation of sucrose in the last stages of fruit development is explicable by the high level of TMT (tonoplastic monosaccharide transporter) in the leaves, which further on promotes the transport of sucrose to the fruit [34].
3.2. Applicability FT-MIR Spectroscopy Coupled with Chemometric Techniques to Predict Concentrations of Soluble Sugars from the Plum Fruit during their Growth and Development
3.2.1. Spectra Description
The standard solution set was developed in order to have the concentrations of these mixed standard solutions close to the values determined by HPLC method. Table 2 shows the specific standard solutions obtained in the current study, namely:
Table 2.
Concentrations of carbohydrate standard solutions set (concentrations of glucose 0–15%; fructose 0–5%; sucrose 0–15%).
- 3 individual standard solutions 15% glucose (Sample “STD28”; its abbreviation is explained in Table 2), 5% fructose (“STD29”) and 15% sucrose (“STD30”);
- 27 mixed standard solutions with fructose concentrations between 0–5%; glucose between 0–15%, and sucrose between 0–15%.
The FT-MIR spectra of the 30 standard solutions are shown in Figure 3A,B. Between 1500–1800 cm−1 and 2800–3700 cm−1 the solutions present strong absorption bands of water molecules, suggesting an apparent similarity of all the solutions. However, differentiation between the mixed solutions of soluble sugars can be obtained by evaluating the spectral region characteristic to this class of compounds between 900–1500 cm−1 (marked with a red box in Figure 3A,B). These regions were also taken into account in the determination of sugars in the passion fruit [36].
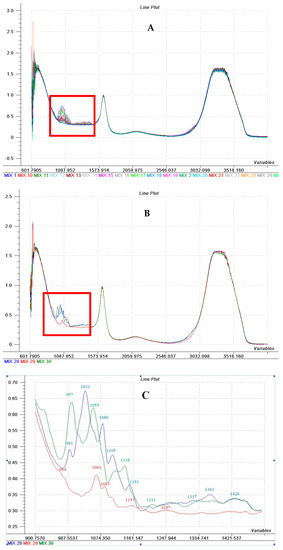
Figure 3.
FT-MIR spectra of standard sugars solutions (A) FT-MIR spectra of the standard solutions set described on Table 2 (B) FT-MIR spectra of individual glucose solution (15%—blue line), fructose (5%—the red line) and sucrose (15%—green line); (C) Spectral area 900–1500 cm−1 characteristic to carbohydrates for glucose individual solution (15%—blue line), fructose (5%—the red line) and sucrose (15%—green line). The X-axis—Wavenumber (cm−1), the Y-axis name—Absorbance (a.u.).
Absorption bands characteristic to glucose are presented in Figure 3C (maximum 991, 1033, 1080, 1105, 1151, 1317, 1361, 1429 cm−1) to fructose (peak specific to the 966, 1063, 1083, 1157, 1247 cm−1) and sucrose (specific peak at 997, 1055, 1138, 1211 cm−1).
Alongside with the aforementioned and discussed spectra of the standard solutions of sugars, the FT-MIR spectra (650–4000 cm−1) of fruit juices obtained from the “Stanley”, “Vânăt de Italia”, and “Tuleu Gras” varieties which were harvested throughout their growth and development, show three areas of relevant importance: 2800–3700 cm−1, 1500–1800 cm−1 şi 900–1500 cm−1. According to already published data [37], water molecules are assigned to the first two areas, the studied plum juice having a high level of water content. The characteristic feature for sugars is the area between 900–1500 cm−1, showing their accumulation during the plum fruit growth and development. Studied sugars: fructose, glucose and sucrose are characteristic to this area, showing intense absorption bands. –CH2 distortions and C-C-H and H-C-O angular distortion are assigned to bands in the area 900–1200 cm−1 [13]. The bands within the 900–1500 cm−1 area explain the differences between the plum juice samples collected during the fruit growth and development. Baseline shift and multiplicative interferences corrections were performed using mathematical treatments (standard normal variate (SNV), first and second derivatives). A better glucose prediction was obtained by Bureau et al. [11], who reported R2 (coefficient of determination) = 0.87 and root mean square error of calibration (RMSEC) = 12% for apricot pulp using the 900–1500 cm−1 spectral range with 7 latent variables (LVs) in the MIR regions. Better results were found in the quantification of tomato fructose, with R2 of 0.92 and root mean square error of prediction (RMSEP) of 6.8% using the 920–1200 cm−1 spectral range, 8 LVs and the preprocessing of SNV [12].
3.2.2. Optimal Spectral Area and Pre-Treatments Selection
In the first stage the cutting out of the optimal spectral area was performed (Table 3), by using the PLS method (cross-validation) for the juice spectra of the plum samples (n = 36) harvested during the fruit growth and development, in order to obtain the model with the most performant characteristics.
Table 3.
FT-MIR prediction of sugars in plum juice obtained from the fruit of three cultivars during their development—descriptive statistics and PLS (partial least squares) calibration models performance for selecting optimal spectral region and pre-treatments.
Performing the analyses for plum juice onto such a variety of samples provided a wide range of fructose (0.43–3.94%), glucose (1.34–12.11%) and sucrose (0.006–10.19%) concentrations, while providing a database of spectral characteristics of such fruit, with concentrations of sugars from the lower to the higher level. Consequently, these results offer a high degree of originality (most studies so far have focused on the analysis of plum juice obtained from fruit harvested at their technological maturity and/or consumption maturity). Checking the feasibility of the calibration models was the first step for the realization and implementation of FT-MIR fast methods in order to analyze the dynamics of plum sugars during growth and development.
In order to optimize the calibration models, different spectral areas were selected. Based on the best regression coefficients obtained from the calibration models performed for the full spectrum region (650–4000 cm−1) with no spectra pre-treatments involved, several spectral regions were further proposed. In order to predict fructose based on the FT-MIR spectrum (with no pre-treatments applied), the regression coefficients obtained highlight the importance of the area that contains the wavenumbers distinctive to fructose (1063, 1155, 1254, 1345, 1416 cm−1), the results being correlated with those discussed for the spectrum of the standard fructose solution.
To achieve performant calibration models, the key factors are the wavenumbers characterized by high absolute regression coefficients values, which show a major impact on the response variables Y (reference values), indicating their importance for further use in calibration models [12]. The regression coefficients noise regions were removed from the models. In order to select relevant spectral regions, this analysis pattern was used for each type of sugar. The highest values for the Rcal2, Rcval2 (Coefficient of determination for calibration and cross validations) and RPD (ratio of performance of deviation) original spectra (without pre-treatments), while the lowest for SEC (standard error of calibration) and SECV (standard error of cross-validation) were obtained for the 800–1600 cm−1 spectral area, for fructose, 800–1600 cm−1 for glucose, and 915–1145 cm−1 for sucrose, respectively (Table 3).
The optimal pre-treatment of infrared spectra for each type of sugar was further performed. Several pre-treatment were tested, namely: SNV (Standard Normal Variate), d1 (7, 2) (first derivative Savitzky Golay 7 Smoothing points and second polynomial order) and d2 (9, 2) (second derivative Savitzky Golay, 9 Smoothing points and second polynomial order). According to the calibration models assessment performed (high values for Rcal2, Rcval2 and RPD and low values for SEC and SECV), the final conclusion was that the optimal spectra pre-treatments were: d1 (7, 2) for fructose, d2 (9, 2) for sucrose, while for glucose the pre-treatment optimization led to less satisfactory results.
The selection of optimal spectral regions and pre-treatments led to PLS calibration models, which had very successful results for sucrose (Rcval2 = 0.95; SECV = 0.71) and acceptable ones for glucose (Rcval2 = 0.90; SECV = 0.98). For fructose content of the plum juice, optimizing the spectral region and spectra pre-treatments led to calibration models with less satisfactory performance.
3.2.3. External Validation
For each type of sugar, an independent external validation set was developed in order to validate the optimized calibration models. Out of the 36 samples, two sets were obtained: a calibration set (C1) consisting of 24 samples and representing 66.6% of the total number of samples; an external validation set (V1) consisting of 12 samples and representing 33.3% of the total number of samples. The samples were randomly divided, according to the criterion of representative distribution of all the samples alongside with a wider range of concentrations. Thus, averages, standard deviations and calibration set ranges (n = 24) were very close to the values of the validation set (n = 12) (Table 4).
Table 4.
External validation sets assessment—Descriptive statistics and performance of PLS calibration models for the prediction of sugars in the plum juice obtained from the fruit of three cultivars during their development.
The set of plum juice samples (set V2; n = 36) obtained in six different phases of growth and development was used in order to verify the feasibility of the calibration model developed based on the 30 mixed standard sugars solutions spectra (set STD; n = 30). For each type of sugar, the predicted values obtained were compared with those resulted from the HPLC reference analysis. The results (average, standard deviation, and chemometrics specific parameters) are shown in Table 4.
Considering the hypothesis that a set consisting of all mixed standard solutions and authentic plum juices would have high predictive capacity, a calibration set C2 (n = 54) was built up based on the 30 samples of sugar standard solutions (set STD, previously described), together with 24 samples of authentic plum juices (set C1, previously described). For the validation of this calibration model based on C2, the V1 validation set was used (Table 4). As described previously, the V1 validation set is consisted of 12 samples of authentic juices, which had not been included in the calibration set.
The performance of the PLS calibration models based on C1, STD, and C2 sets was assessed by external validation while using V1 and V2 validation sets as presented in Table 4, alongside specific chemometrics parameters. For the calibration models developed (Sets C1, STD, and C2; described on Table 4), irrespective of the type of sugar, coefficients of determination near the unit were obtained (values Rcal2 for fructose C1 = 0.94 STD = 0.99 C2 = 0.91; for glucose C1 = 0.95, STD = 0.99, C2 = 0.94; for sucrose C1 = 0.99 STD = 0.99, C2 = 0.98).
In the case of external validation for sucrose, the best results were obtained in predicting both external validation sets (V1 and V2) regardless of the calibration model used (Table 4). Thus, using the PLS calibration model based on the C1 set, a coefficient of determination Rp2 of 0.96, a SEP of 0.64 and a RPDP of 5.36, was obtained in the external validation for sucrose (please note the marked grey lines on Table 4). The RPDP values of 5.36 and 6.01, demonstrate the fact that the calibration models developed for sucrose while containing genuine plum juices samples in the sets (Set C1 and C2, Table 4), present not only “screening” features, but can be also used for quality control purposes. Concerning glucose, satisfactory results were obtained (Rp2 of 0.83, and SEP of 1.11), when the predictions of V1 validation set were based on calibration model developed for C1 set (marked on grey in Table 4). In the case of fructose, none of the external validation sets (V1 and V2), used in current study, provided satisfactory results. This can be explained by the narrow interval of fructose concentration in plum juices for both calibration and validation sets (0.43–3.94 concentrations interval, and 0.93–0.97 standard deviation range), as presented on Table 4.
External validation of infrared calibration models is increasingly used for various determinations. In the case of passion fruit Oliveira-Folado et al. [36] reported 98 spectra, so that multivariate calibration of the proposed models could be developed. They also determined the content of soluble solids (SSC) and titratable acid content (TA) by different pre-processing methods. The best calibration models for SSC and TA prediction were selected after cross-validation. These models were then applied to the 32 fruits samples, which were selected for external validation. The same study also reported good correlations between the reference and predicted values for the quantification of glucose, fructose and sucrose. The regression coefficients obtained by the MIR models for the calibration and cross-validation sets were found satisfactory for all sugars, while for the external validation, high regression coefficient values were reported. Validation of the MIR potential for quality assessment and control over the manufacturing process of infant formulae and dairy products was reported by Wang et al. [38] for proteins and fats. This validation process was also used for determining the astringency of red and rosé wines [14] and of rice wine, with excellent results for glucose [39]. Clark [40] proposed a fast FTIR determination for sugar–acid composition of citrus juices, while titratable acidity, soluble solids, and the Californian–Australian citrus industry BRIMA index were included for developing predictive models based on attenuated total reflectance FTIR spectra. They showed that single species provided better prediction errors (0.12 °Brix, 0.027% TA, 3.1 BRIMA units) than the generic models (0.18 °Brix, 0.055% TA and 4 BRIMA units), suggesting the suitability of using spectroscopy coupled with chemometrics for replacing conventional wet chemistry methods.
4. Conclusions
An increase in the concentrations of studied sugars (fructose, glucose, sucrose) was found during the growth and development of the plum fruit. The PCA analysis for these parameters showed a grouping in the harvesting stage (F1 → F6) but no evidence related to the variety of the plum variety or position in the crown of the tree. Optimization of the spectral region and pre-treatment led to PLS calibration models with very good results for sucrose and acceptable ones for glucose. Although there were attempts to optimize the pre-treatments and calibration models developed for fructose, they led to less satisfactory performance results. For sucrose and glucose, the best results were achieved in predicting external sets obtained when the model was based on authentic juice; in the case of fructose, no calibration model could be successfully used to predict its concentrations in external validation sets.
Author Contributions
Conceptualization, S.M. and V.M.; Investigation, R.A.V., A.E.M. and G.S.P.; Methodology, R.A.V., A.E.M. and V.M.; Supervision, C.C.M., S.M. and V.M.; Validation, C.C.M. and S.M.; Writing—original draft, R.A.V.; Writing—review & editing, V.M.
Funding
This research was funded by European Social Fund, Human Resources Development Operational Program 2007–2013, project no. POSDRU/159/1.5/S/132765.
Conflicts of Interest
The authors declare no conflict of interest.
References
- FAOSTAT Statistics Division, Food and Agriculture Organization of the United Nations. Available online: http://faostat3.fao.org/home/E (accessed on 9 April 2018).
- Diaz-Mula, H.M.; Zapata, P.J.; Guillen, F.; Castillo, S.; Martinez-Romero, D.; Valero, D.; Serrano, M. Changes in physicochemical and nutritive parameters and bioactive compounds during development and on-tree ripening of eight plum cultivars: A comparative study. J. Sci. Food Agric. 2008, 88, 2499–2507. [Google Scholar] [CrossRef]
- Pereira, F.M.V.; Carvalho, A.S.; Cabeça, L.F.; Colnago, L.A. Classification of intact fresh plums according to sweetness using time-domain nuclear magnetic resonance and chemometrics. Microchem. J. 2013, 108, 14–17. [Google Scholar] [CrossRef]
- Borsanie, J.; Budde, C.O.; Porrini, L.; Lauxmann, M.A.; Lombardo, V.A.; Murray, R. Carbon metabolism of peach fruit after harvest: Changes in enzymes involved in organic acid and sugar level modifications. J. Exp. Bot. 2009, 60, 1823–1837. [Google Scholar] [CrossRef] [PubMed]
- Ruan, Y.L.; Jin, Y.; Yang, Y.J.; Li, G.J.; Boyer, J. Sugar input, metabolism, and signaling mediated by invertase: Roles in development, yield potential, and response to drought and heat. Mol. Plant 2010, 3, 942–955. [Google Scholar] [CrossRef] [PubMed]
- Mingjun, L.; Engjuan, F.; Lailiang, C. Expression patterns of genes involved in sugar metabolism and accumulation during apple fruit development. PLoS ONE 2012, 7, e33055. [Google Scholar] [CrossRef]
- Zhang, Y.; Li, P.; Cheng, L. Developmental changes of carbohydrates, organic acids, amino acids, and phenolic compounds in ‘Honeycrisp’ apple flesh. Food Chem. 2010, 123, 1013–1018. [Google Scholar] [CrossRef]
- Kelly, D.J.F.; Gerard, D. Detection of sugar adulterants in apple juice using Fourier transform infrared spectroscopy and chemometrics. J. Agric. Food Chem. 2005, 53, 3281–3286. [Google Scholar] [CrossRef] [PubMed]
- Duarte, I.F.; Barros, A.; Delgadillo, I.; Almeida, C.; Gil, A.M. Application of FTIR spectroscopy for quantification of sugars in mango juice as a function of ripening. J. Agric. Food Chem. 2002, 50, 3104–3111. [Google Scholar] [CrossRef] [PubMed]
- Leopold, L. HPLC and IR/RAMAN Markers for Oils, Juices and Cereals Authenticity. Ph.D. Thesis, USAMV Cluj-Napoca, Cluj Napoca, Romania, September 2010. [Google Scholar]
- Bureau, S.; Ruiz, D.; Reich, M.; Gouble, B.; Bertrand, D.; Audergon, J.M.; Renard, C.M.G.C. Application of ATR-FTIR for a rapid and simultaneous determination of sugars and organic acids in apricot fruit. Food Chem. 2009, 115, 1133–1140. [Google Scholar] [CrossRef]
- Scibisz, I.; Reich, M.; Bureau, S.; Gouble, B.; Causse, M.; Bertrand, D.; Renard, C.M.G.C. Mid-infrared spectroscopy as a tool for rapid determination of internal quality parameters in tomato. Food Chem. 2011, 125, 1390–1397. [Google Scholar] [CrossRef]
- Aleixandre-Tudo, J.L.; Nieuwoudt, H.; Aleixandre, J.L.; du Toit, W. Chemometric compositional analysis of phenolic compounds in fermenting samples and wines using different infrared spectroscopy techniques. Talanta 2018, 176, 526–536. [Google Scholar] [CrossRef] [PubMed]
- Costa, A.M.S.; Sobral, M.M.C.; Delgadillo, I.; Cerdeira, A.; Rudnitskaya, A. Astringency quantification in wine: Comparison of the electronic tongue and FT-MIR spectroscopy. Sens. Actuators B Chem. 2015, 207, 1095–1103. [Google Scholar] [CrossRef]
- Das, C.; Chakraborty, S.; Acharya, K.; Bera, N.K.; Chattopadhyay, D.; Karmakar, A.; Chattopadhyay, S. FT-MIR supported Electrical Impedance Spectroscopy based study of sugar adulterated honeys from different floral origin. Talanta 2017, 171, 327–334. [Google Scholar] [CrossRef] [PubMed]
- De Bei, R.; Fuentes, S.; Sullivan, W.; Edwards, E.J.; Tyerman, S.; Cozzolino, D. Rapid measurement of total non-structural carbohydrate concentration in grapevine trunk and leaf tissues using near infrared spectroscopy. Comput. Electron. Agric. 2017, 136, 176–183. [Google Scholar] [CrossRef]
- Arendse, E.; Fawole, O.A.; Opara, U.L. Effects of postharvest handling and storage on physiological attributes and quality of pomegranate fruit (Punica granatum L.): A review. Int. J. Postharvest Technol. Innov. 2015, 5, 13–31. [Google Scholar] [CrossRef]
- Arendse, E.; Fawole, O.A.; Magwaza, L.S.; Nieuwoudt, H.; Opara, U.L. Comparing the analytical performance of near and mid infrared spectrometers for evaluating pomegranate juice quality. LWT 2018, 91, 180–190. [Google Scholar] [CrossRef]
- Arendse, E.; Fawole, O.A.; Magwaza, L.S.; Nieuwoudt, H.H.; Opara, U.L. Development of calibration models for the evaluation of pomegranate aril quality by Fourier-transform near infrared spectroscopy combined with chemometrics. Biosyst. Eng. 2017, 159, 22–32. [Google Scholar] [CrossRef]
- Musingarabwi, D.M.; Nieuwoudt, H.H.; Young, P.R.; Eyéghè-Bickong, H.A.; Vivier, M.A. A rapid qualitative and quantitative evaluation of grape berries at various stages of development using Fourier-transform infrared spectroscopy and multivariate data analysis. Food Chem. 2016, 190, 253–262. [Google Scholar] [CrossRef] [PubMed]
- Shi, H.; Yu, P. Comparison of grating-based near-infrared (NIR) and Fourier transform mid-infrared (ATR-FT/MIR) spectroscopy based on spectral preprocessing and wavelength selection for the determination of crude protein and moisture content in wheat. Food Control 2017, 82, 57–65. [Google Scholar] [CrossRef]
- Fleming, A.; Schenkel, F.S.; Chen, J.; Malchiodi, F.; Ali, R.A.; Mallard, B.; Sargolzaei, M.; Corredig, M.; Miglior, F. Variation in fat globule size in bovine milk and its prediction using mid-infrared spectroscopy. J. Dairy Sci. 2017, 100, 1640–1649. [Google Scholar] [CrossRef] [PubMed]
- Berezin, K.V.; Likhter, A.M.; Shagautdinova, I.T.; Chernavina, M.L.; Novoselova, A.V. FT-IR and DFT study of lemon peel. In Proceedings of the Saratov Fall Meeting 2016: Optical Technologies in Biophysics and Medicine XVIII, Astrakhan, Russia, 4 March 2017. [Google Scholar] [CrossRef]
- Santiago-Ramos, D.; Figueroa-Cárdenas, J.D.; Véles-Medina, J.J.; Salazar, R. Physicochemical properties of nixtamalized black bean (Phaseolus vulgaris L.) flours. Food Chem. 2018, 240, 456–462. [Google Scholar] [CrossRef] [PubMed]
- Hu, Y.; Pan, Z.J.; Liao, W.; Li, J.; Gruget, P.; Kitts, D.D.; Lu, X. Determination of antioxidant capacity and phenolic content of chocolate by attenuated total reflectance-Fourier transformed-infrared spectroscopy. Food Chem. 2016, 202, 254–261. [Google Scholar] [CrossRef] [PubMed]
- Karoui, R.; Downey, G.; Blecker, C. Mid-infrared spectroscopy coupled with chemometrics: A tool for the analysis of intact food systems and the exploration of their molecular structure-quality relationships—A review. Chem. Rev. 2010, 110, 6144–6168. [Google Scholar] [CrossRef] [PubMed]
- Mureşan, A.E.; Muste, S.; Vlaic, R.A.; Bobis, O.; Mureşan, C.; Socaciu, C.; Mureşan, V. HPLC determination and FT-MIR prediction of sugars from juices of different apple cultivars during fruit development. Not. Bot. Horti Agrobot. Cluj-Napoca 2015, 43, 222–228. [Google Scholar] [CrossRef]
- Zhao, J.; Li, H.; Xi, W.; An, W.; Niu, L.; Cao, Y.; Wang, H.; Yin, Y. Changes in sugars and organic acids in wolfberry (Lycium barbarum L.) fruit during development and maturation. Food Chem. 2015, 173, 718–724. [Google Scholar] [CrossRef] [PubMed]
- Serrano, M.; Zapata, P.; Pretel, M.T.; Almansa, M.S.; Botella, M.A.; Amorós, A. Changes in organic acid and sugars levels during ripening of five loquat (Eriobotrya japonica Lindl.) cultivars. In First International Symposium on Loquat; Llácer, G., Badenes, M.L., Eds.; Ciheam: Zaragoza, Spain, 2003; pp. 157–160. Available online: http://om.ciheam.org/om/pdf/a58/03600157.pdf (accessed on 9 September 2018).
- Wu, B.H.; Quilot, B.; Genard, M.; Kervella, J.; Li, S.H. Changes in sugar and organic acid concentrations during fruit maturation in peaches, P. davidiana and hybrids as analyzed by principal component analysis. Sci. Hortic. 2005, 103, 429–439. [Google Scholar] [CrossRef]
- Glewa, R.H.; Ayazb, F.A.; Sanzc, C.; Vander-Jagta, D.J.; Huangd, H.S.; Chuangd, L.T. Changes in sugars, organic acids and amino acids in medlar (Mespilus germanica L.) during fruit development and maturation. Food Chem. 2003, 83, 363–369. [Google Scholar] [CrossRef]
- Basson, C.E.; Groenewald, J.H.; Kossmann, J.; Cronjé, C.; Bauer, R. Sugar and acid-related quality attributes and enzyme activities in strawberry fruits: Invertase is the main sucrose hydrolysing enzyme. Food Chem. 2010, 121, 1156–1162. [Google Scholar] [CrossRef]
- Wu, B.H.; Liu, H.F.; Guan, L.; Fan, P.G.; Li, S.H. Carbohydrate metabolism in grape cultivars that differ in sucrose accumulation. VITIS 2011, 50, 51–57. Available online: https://www.vitis-vea.de/admin/volltext/W0%2011%201170.pdf (accessed on 28 August 2018).
- Wang, X.; Fu, X.; Chen, M.; Huan, L.; Liu, W.; Qi, Y.; Gao, Y.; Xiao, W.; Chen, X.; Li, L.; et al. Ultraviolet B irradiation influences the fruit quality and sucrose metabolism of peach (Prunus persica L.). Environ. Exp. Bot. 2018, 153, 286–301. [Google Scholar] [CrossRef]
- Zhou, Y.; He, W.; Zheng, W.; Tan, Q.; Xie, Z.; Zheng, C.; Hu, C. Fruit Sugar and Organic Acid Were Significantly Related to Fruit Mg of Six Citrus Cultivars. Food Chem. 2018, 259, 278–285. [Google Scholar] [CrossRef] [PubMed]
- Oliveira-Folador, G.; de Oliveira Bicudo, M.; de Andrade, E.F.; Renard, C.M.; Geneviè, C.; Bureau, S.; de Castilhos, F. Quality traits prediction of the passion fruit pulp using NIR and MIR spectroscopy. LWT 2018, 95, 172–178. [Google Scholar] [CrossRef]
- Bureau, S.; Scibisz, I.; Bourvellec, C.; Renard, C.M.G.C. Effect of sample preparation on the measurement of sugars, organic acids, and polyphenols in apple fruit by mid-infrared spectroscopy. J. Agric. Food Chem. 2012, 60, 3551–3563. [Google Scholar] [CrossRef] [PubMed]
- Wang, X.; Esquerre, C.; Downey, G.; Henihan, L.; O’Callaghan, D.; O’Donnell, C. Assessment of infant formula quality and composition using Vis-NIR, MIR and Raman process analytical technologies. Talanta 2018, 183, 320–328. [Google Scholar] [CrossRef] [PubMed]
- Shen, F.; Ying, Y.; Li, B.; Zheng, Y.; Hu, J. Prediction of sugars and acids in Chinese rice wine by mid-infrared spectroscopy. Food Res. Int. 2011, 44, 1521–1527. [Google Scholar] [CrossRef]
- Clark, C.J. Fast determination by Fourier-transform infrared spectroscopy of sugar–acid composition of citrus juices for determination of industry maturity standards. N. Z. J. Crop Hortic. Sci. 2016, 44, 69–82. [Google Scholar] [CrossRef]
© 2018 by the authors. Licensee MDPI, Basel, Switzerland. This article is an open access article distributed under the terms and conditions of the Creative Commons Attribution (CC BY) license (http://creativecommons.org/licenses/by/4.0/).