Apparent Accumulated Nitrogen Fertilizer Recovery in Long-Term Wheat–Maize Cropping Systems in China


Abstract
1. Introduction
2. Materials and Methods
2.1. Sampling and Analysis
2.2. Calculation and Statistical Analysis
3. Results
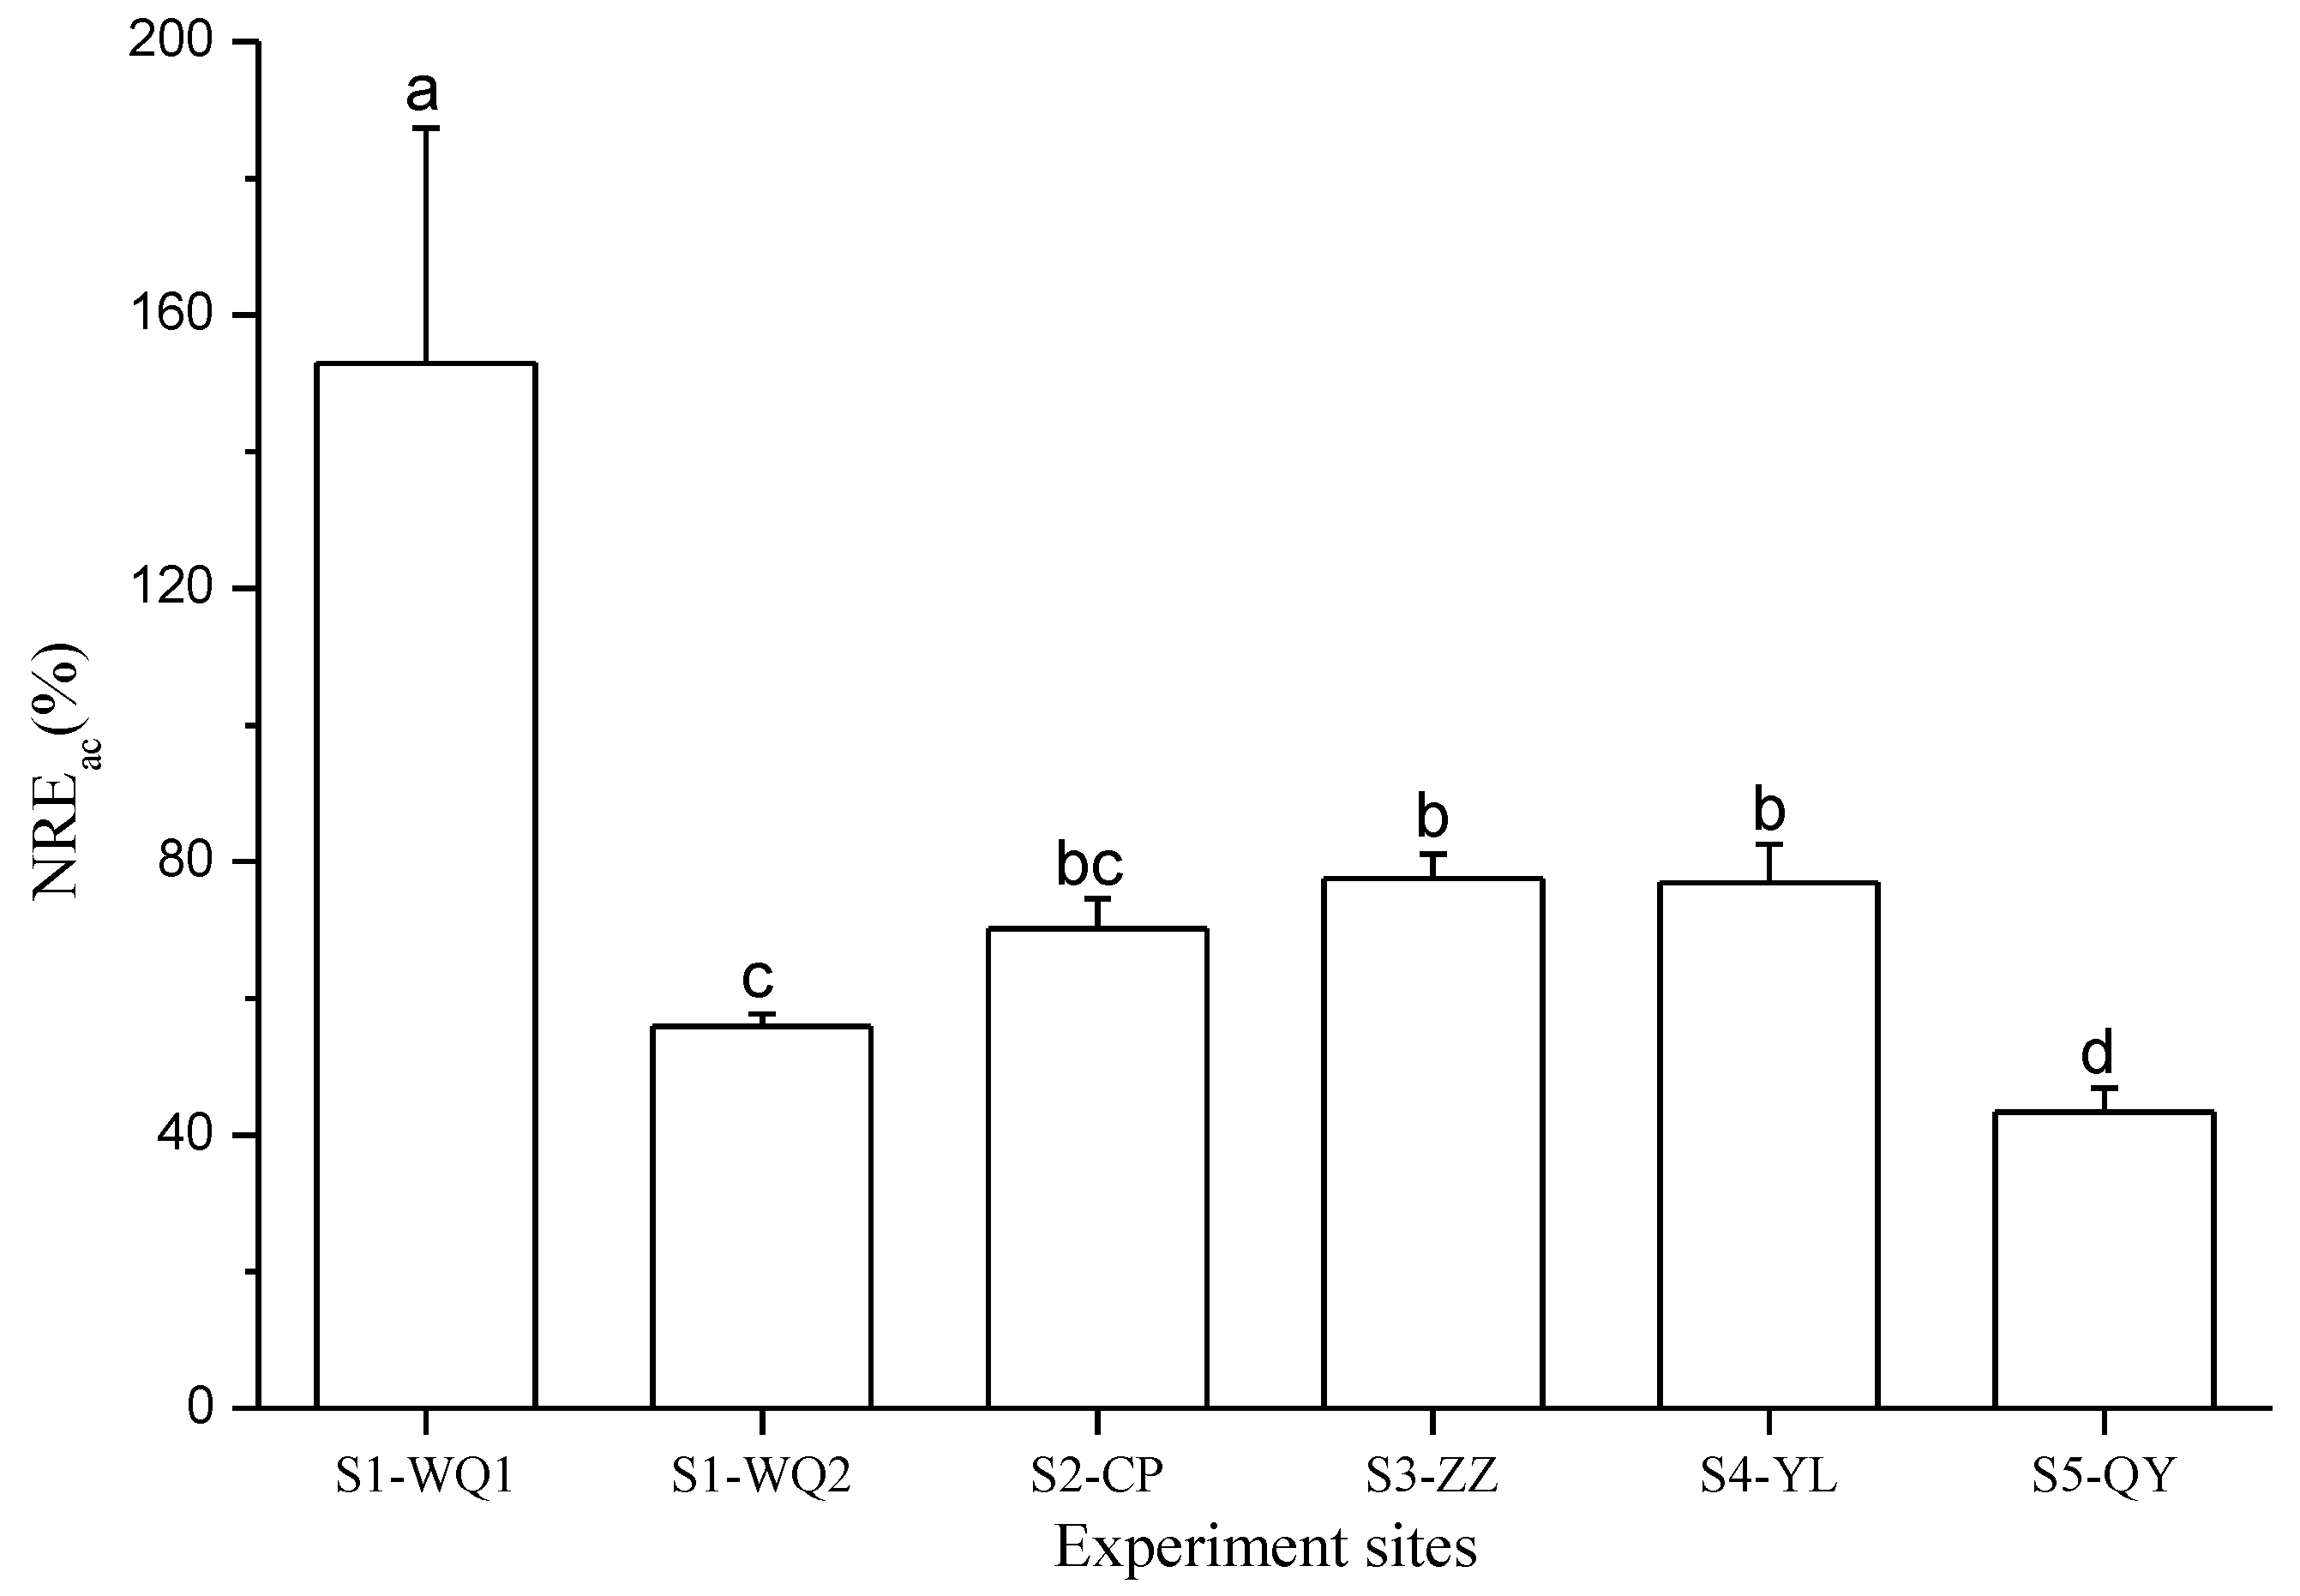
3.1. Factors Affecting NREac
3.2. Assessment of Nf.opt and Relationship between Yieldopt and Yield0
4. Discussion
5. Conclusions
Author Contributions
Funding
Acknowledgments
Conflicts of Interest
Appendix A

| Sites | Treatments | Applied Rate (kg ha−1) | Grain Yield (kg ha−1) | r2 | References | ||
|---|---|---|---|---|---|---|---|
| Village, Province | N | P | K | Wheat | |||
| Kaoshan, | N0P2K2 | 0 | 72 | 150 | 4260 | 0.946 | 1 |
| Anhui | N1P2K2 | 90 | 72 | 150 | 5280 | ||
| N2P2K2 | 180 | 72 | 150 | 6645 | |||
| N3P2K2 | 270 | 72 | 150 | 6390 | |||
| Xinji, | N0P2K2 | 0 | 26 | 75 | 2766 | 0.997 | 2 |
| Anhui | N1P2K2 | 98 | 26 | 75 | 4820 | ||
| N2P2K2 | 195 | 26 | 75 | 5852 | |||
| N3P2K2 | 293 | 26 | 75 | 6524 | |||
| Gupeizhen, | N0P2K2 | 0 | 90 | 150 | 3178 | 0.997 | 3 |
| Anhui | N1P2K2 | 90 | 90 | 150 | 6392 | ||
| N2P2K2 | 180 | 90 | 150 | 7206 | |||
| N3P2K2 | 270 | 90 | 150 | 6321 | |||
| Hengshan, | N0P2K2 | 0 | 90 | 150 | 4435 | 0.993 | 3 |
| Anhui | N1P2K2 | 90 | 90 | 150 | 5728 | ||
| N2P2K2 | 180 | 90 | 150 | 6826 | |||
| N3P2K2 | 270 | 90 | 150 | 6964 | |||
| Mingdong, | N0P2K2 | 0 | 90 | 150 | 5195 | 0.940 | 3 |
| Anhui | N1P2K2 | 90 | 90 | 150 | 6818 | ||
| N2P2K2 | 180 | 90 | 150 | 8358 | |||
| N3P2K2 | 270 | 90 | 150 | 7318 | |||
| Nongkesuo, | N0P2K2 | 0 | 90 | 150 | 4040 | 0.990 | 3 |
| Anhui | N1P2K2 | 90 | 90 | 150 | 5912 | ||
| N2P2K2 | 180 | 90 | 150 | 7070 | |||
| N3P2K2 | 270 | 90 | 150 | 6502 | |||
| Pancun, | N0P2K2 | 0 | 90 | 150 | 5460 | 0.994 | 3 |
| Anhui | N1P2K2 | 90 | 90 | 150 | 7463 | ||
| N2P2K2 | 180 | 90 | 150 | 8160 | |||
| N3P2K2 | 270 | 90 | 150 | 8314 | |||
| Shaogang, | N0P2K2 | 0 | 90 | 150 | 3847 | 0.984 | 3 |
| Anhui | N1P2K2 | 90 | 90 | 150 | 6084 | ||
| N2P2K2 | 180 | 90 | 150 | 7121 | |||
| N3P2K2 | 270 | 90 | 150 | 5630 | |||
| Shiba, | N0P2K2 | 0 | 90 | 150 | 3551 | 0.999 | 3 |
| Anhui | N1P2K2 | 90 | 90 | 150 | 6027 | ||
| N2P2K2 | 180 | 90 | 150 | 7050 | |||
| N3P2K2 | 270 | 90 | 150 | 7022 | |||
| Zhaoxin, | N0P2K2 | 0 | 90 | 150 | 5220 | 0.920 | 3 |
| Anhui | N1P2K2 | 90 | 90 | 150 | 6183 | ||
| N2P2K2 | 180 | 90 | 150 | 7878 | |||
| N3P2K2 | 270 | 90 | 150 | 7586 | |||
| Longkang, | N0P2K2 | 0 | 52 | 124 | 2754 | 0.984 | 4 |
| Anhui | N1P2K2 | 98 | 52 | 124 | 4367 | ||
| N2P2K2 | 195 | 52 | 124 | 5987 | |||
| N3P2K2 | 293 | 52 | 124 | 6090 | |||
| Xiaolou, | N0P2K2 | 0 | 43 | 81 | 5147 | 0.908 | 5 |
| Anhui | N1P2K2 | 98 | 43 | 81 | 5876 | ||
| N2P2K2 | 195 | 43 | 81 | 7209 | |||
| N3P2K2 | 293 | 43 | 81 | 6917 | |||
| Gaohuang, | N0P2K2 | 0 | 33 | 81 | 4545 | 1.000 | 6 |
| Anhui | N1P2K2 | 113 | 33 | 81 | 6240 | ||
| N2P2K2 | 225 | 33 | 81 | 7200 | |||
| N3P2K2 | 338 | 33 | 81 | 7350 | |||
| Xuji, | N0P2K2 | 0 | 26 | 75 | 4223 | 0.999 | 7 |
| Anhui | N1P2K2 | 90 | 26 | 75 | 5646 | ||
| N2P2K2 | 180 | 26 | 75 | 6198 | |||
| N3P2K2 | 270 | 26 | 75 | 5663 | |||
| Toupu, | N0P2K2 | 0 | 39 | 62 | 3945 | 0.952 | 8 |
| Anhui | N1P2K2 | 83 | 39 | 62 | 5444 | ||
| N2P2K2 | 165 | 39 | 62 | 7314 | |||
| N3P2K2 | 248 | 39 | 62 | 6935 | |||
| Yonggu, | N0P2K2 | 0 | 39 | 60 | 5475 | 0.972 | 9 |
| Anhui | N1P2K2 | 90 | 39 | 60 | 6375 | ||
| N2P2K2 | 180 | 39 | 60 | 7238 | |||
| N3P2K2 | 270 | 39 | 60 | 7035 | |||
| Dazhuang (a), | N0P2K2 | 0 | 39 | 87 | 3522 | 0.921 | 10 |
| Gansu | N1P2K2 | 60 | 39 | 87 | 4482 | ||
| N2P2K2 | 120 | 39 | 87 | 5460 | |||
| N3P2K2 | 180 | 39 | 87 | 4716 | |||
| Dazhuang (b), | N0P2K2 | 0 | 39 | 87 | 1511 | 0.963 | 10 |
| Gansu | N1P2K2 | 60 | 39 | 87 | 2825 | ||
| N2P2K2 | 120 | 39 | 87 | 3021 | |||
| N3P2K2 | 180 | 39 | 87 | 3263 | |||
| Handian, | N0P2K2 | 0 | 39 | 87 | 2883 | 0.898 | 10 |
| Gansu | N1P2K2 | 60 | 39 | 87 | 3294 | ||
| N2P2K2 | 120 | 39 | 87 | 3833 | |||
| N3P2K2 | 180 | 39 | 87 | 3512 | |||
| Nanhu, | N0P2K2 | 0 | 39 | 87 | 3960 | 0.995 | 10 |
| Gansu | N1P2K2 | 60 | 39 | 87 | 4200 | ||
| N2P2K2 | 120 | 39 | 87 | 4095 | |||
| N3P2K2 | 180 | 39 | 87 | 3465 | |||
| Tonghua, | N0P2K2 | 0 | 39 | 87 | 2129 | 0.990 | 10 |
| Gansu | N1P2K2 | 60 | 39 | 87 | 3458 | ||
| N2P2K2 | 120 | 39 | 87 | 4467 | |||
| N3P2K2 | 180 | 39 | 87 | 4322 | |||
| Yongning, | N0P2K2 | 0 | 39 | 87 | 3020 | 0.855 | 10 |
| Gansu | N1P2K2 | 60 | 39 | 87 | 3455 | ||
| N2P2K2 | 120 | 39 | 87 | 4313 | |||
| N3P2K2 | 180 | 39 | 87 | 3932 | |||
| Yuebao, | N0P2K2 | 0 | 39 | 87 | 2297 | 0.708 | 10 |
| Gansu | N1P2K2 | 60 | 39 | 87 | 2314 | ||
| N2P2K2 | 120 | 39 | 87 | 2409 | |||
| N3P2K2 | 180 | 39 | 87 | 2168 | |||
| Zhaodun, | N0P2K2 | 0 | 39 | 87 | 834 | 0.728 | 10 |
| Gansu | N1P2K2 | 60 | 39 | 87 | 1536 | ||
| N2P2K2 | 120 | 39 | 87 | 3858 | |||
| N3P2K2 | 180 | 39 | 87 | 2505 | |||
| Gaocheng (City, a), | N0P2K2 | 0 | 65 | 124 | 5805 | 0.998 | 11 |
| Hebei | N1P2K2 | 113 | 65 | 124 | 6795 | ||
| N2P2K2 | 225 | 65 | 124 | 6915 | |||
| N3P2K2 | 338 | 65 | 124 | 5985 | |||
| Gaocheng (City, b), | N0P2K2 | 0 | 65 | 124 | 5685 | 0.967 | 11 |
| Hebei | N1P2K2 | 113 | 65 | 124 | 7545 | ||
| N2P2K2 | 225 | 65 | 124 | 7950 | |||
| N3P2K2 | 338 | 65 | 124 | 8715 | |||
| Gaocheng (City, c), | N0P2K2 | 0 | 65 | 124 | 6555 | 0.925 | 11 |
| Hebei | N1P2K2 | 113 | 65 | 124 | 6915 | ||
| N2P2K2 | 225 | 65 | 124 | 7350 | |||
| N3P2K2 | 338 | 65 | 124 | 7140 | |||
| Gaocheng (City, d), | N0P2K2 | 0 | 65 | 100 | 5910 | 0.980 | 11 |
| Hebei | N1P2K2 | 90 | 65 | 100 | 7275 | ||
| N2P2K2 | 180 | 65 | 100 | 7260 | |||
| N3P2K2 | 270 | 65 | 100 | 6570 | |||
| Wangguaying, | N0P2K2 | 0 | 31 | 60 | 4886 | 0.995 | 12 |
| Henan | N1P2K2 | 81 | 31 | 60 | 6270 | ||
| N2P2K2 | 162 | 31 | 60 | 6615 | |||
| N3P2K2 | 243 | 31 | 60 | 6324 | |||
| Xieqiaozhen, | N0P2K2 | 0 | 39 | 87 | 3810 | 0.989 | 13 |
| Jiangsu | N1P2K2 | 105 | 39 | 87 | 5745 | ||
| N2P2K2 | 210 | 39 | 87 | 6270 | |||
| N3P2K2 | 315 | 39 | 87 | 6345 | |||
| Liutao, | N0P2K2 | 0 | 33 | 50 | 4503 | 0.930 | 14 |
| Jiangsu | N1P2K2 | 135 | 33 | 50 | 5623 | ||
| N2P2K2 | 270 | 33 | 50 | 5558 | |||
| N3P2K2 | 405 | 33 | 50 | 5367 | |||
| Sitaocun, | N0P2K2 | 0 | 33 | 50 | 3420 | 0.979 | 15 |
| Jiangsu | N1P2K2 | 135 | 33 | 50 | 5145 | ||
| N2P2K2 | 270 | 33 | 50 | 5445 | |||
| N3P2K2 | 405 | 33 | 50 | 5400 | |||
| Qianshan, | N0P2K2 | 0 | 37 | 31 | 4770 | 0.946 | 16 |
| Qinghai | N1P2K2 | 59 | 37 | 31 | 5760 | ||
| N2P2K2 | 117 | 37 | 31 | 7571 | |||
| N3P2K2 | 176 | 37 | 31 | 7650 | |||
| Chengguan, | N0P2K2 | 0 | 120 | 90 | 7464 | 1.000 | 17 |
| Shaanxi | N1P2K2 | 75 | 120 | 90 | 8122 | ||
| N2P2K2 | 150 | 120 | 90 | 8543 | |||
| N3P2K2 | 225 | 120 | 90 | 8671 | |||
| Chuanyuan, | N0P2K2 | 0 | 52 | 100 | 4458 | 0.993 | 18 |
| Shaanxi | N1P2K2 | 90 | 52 | 100 | 6568 | ||
| N2P2K2 | 180 | 52 | 100 | 7442 | |||
| N3P2K2 | 270 | 52 | 100 | 8111 | |||
| Qili, | N0P2K2 | 0 | 28 | 60 | 3750 | 0.992 | 19 |
| Sichuan | N1P2K2 | 59 | 28 | 60 | 5040 | ||
| N2P2K2 | 117 | 28 | 60 | 5622 | |||
| N3P2K2 | 176 | 28 | 60 | 6260 | |||
| Qixiang, | N0P2K2 | 0 | 90 | 30 | 5760 | 0.973 | 20 |
| Xinjiang | N1P2K2 | 98 | 90 | 30 | 6690 | ||
| N2P2K2 | 195 | 90 | 30 | 7980 | |||
| N3P2K2 | 293 | 90 | 30 | 8175 | |||
| Zepu (County), | N0P2K2 | 0 | 39 | 25 | 5000 | 1.000 | 21 |
| Xinjiang | N1P2K2 | 93 | 39 | 25 | 7046 | ||
| N2P2K2 | 186 | 39 | 25 | 8182 | |||
| N3P2K2 | 279 | 39 | 25 | 8455 | |||
| Maize | |||||||
| Caozhuang, | N0P2K2 | 0 | 589 | 75 | 5562 | 0.895 | 22 |
| Anhui | N1P2K2 | 113 | 589 | 75 | 5926 | ||
| N2P2K2 | 225 | 589 | 75 | 6176 | |||
| N3P2K2 | 338 | 589 | 75 | 5548 | |||
| Sanshipu, | N0P2K2 | 0 | 47 | 119 | 5259 | 0.999 | 23 |
| Anhui | N1P2K2 | 150 | 47 | 119 | 7069 | ||
| N2P2K2 | 300 | 47 | 119 | 8112 | |||
| N3P2K2 | 450 | 47 | 119 | 8108 | |||
| Gengzhuang, | N0P2K2 | 0 | 52 | 100 | 10869 | 0.967 | 24 |
| Liaoning | N1P2K2 | 105 | 52 | 100 | 12300 | ||
| N2P2K2 | 210 | 52 | 100 | 12401 | |||
| N3P2K2 | 315 | 52 | 100 | 12134 | |||
| Sandu(a), | N0P2K2 | 0 | 26 | 124 | 6204 | 0.967 | 25 |
| Guangxi | N1P2K2 | 105 | 26 | 124 | 8898 | ||
| N2P2K2 | 210 | 26 | 124 | 9102 | |||
| N3P2K2 | 315 | 26 | 124 | 8726 | |||
| Caohai, | N0P2K2 | 0 | 380 | 274 | 8266 | 0.988 | 26 |
| Guizhou | N1P2K2 | 235 | 380 | 274 | 9942 | ||
| N2P2K2 | 470 | 380 | 274 | 9845 | |||
| N3P2K2 | 705 | 380 | 274 | 10614 | |||
| Shazi(a), | N0P2K2 | 0 | 52 | 149 | 5369 | 0.967 | 27 |
| Guizhou | N1P2K2 | 90 | 52 | 149 | 7204 | ||
| N2P2K2 | 180 | 52 | 149 | 7604 | |||
| N3P2K2 | 270 | 52 | 149 | 7437 | |||
| Shazi(b), | N0P2K2 | 0 | 65 | 199 | 6503 | 0.998 | 27 |
| Guizhou | N1P2K2 | 113 | 65 | 199 | 7637 | ||
| N2P2K2 | 225 | 65 | 199 | 8571 | |||
| N3P2K2 | 338 | 65 | 199 | 8071 | |||
| Tianping, | N0P2K2 | 0 | 59 | 174 | 8199 | 1.000 | 28 |
| Guizhou | N1P2K2 | 105 | 59 | 174 | 8653 | ||
| N2P2K2 | 210 | 59 | 174 | 8639 | |||
| N3P2K2 | 315 | 59 | 174 | 9204 | |||
| Lejian(a), | N0P2K2 | 0 | 52 | 149 | 1766 | 0.987 | 29 |
| Guizhou | N1P2K2 | 90 | 52 | 149 | 4295 | ||
| N2P2K2 | 180 | 52 | 149 | 4467 | |||
| N3P2K2 | 270 | 52 | 149 | 2298 | |||
| Lejian(b), | N0P2K2 | 0 | 59 | 174 | 4176 | 0.996 | 29 |
| Guizhou | N1P2K2 | 105 | 59 | 174 | 6392 | ||
| N2P2K2 | 210 | 59 | 174 | 6902 | |||
| N3P2K2 | 315 | 59 | 174 | 6854 | |||
| Zhuping (County, a), | N0P2K2 | 0 | 39 | 75 | 4886 | 1.000 | 30 |
| Henan | N1P2K2 | 120 | 39 | 75 | 6683 | ||
| N2P2K2 | 240 | 39 | 75 | 7518 | |||
| N3P2K2 | 360 | 39 | 75 | 6828 | |||
| Zhuping (County, b), | N0P2K2 | 0 | 39 | 75 | 5423 | 0.995 | 30 |
| Henan | N1P2K2 | 120 | 39 | 75 | 7265 | ||
| N2P2K2 | 240 | 39 | 75 | 8100 | |||
| N3P2K2 | 360 | 39 | 75 | 7857 | |||
| Zhuping (County, c), | N0P2K2 | 0 | 33 | 62 | 4962 | 0.999 | 30 |
| Henan | N1P2K2 | 105 | 33 | 62 | 7203 | ||
| N2P2K2 | 210 | 33 | 62 | 8255 | |||
| N3P2K2 | 315 | 33 | 62 | 7322 | |||
| Zhuping (County, d), | N0P2K2 | 0 | 33 | 62 | 4590 | 0.964 | 30 |
| Henan | N1P2K2 | 105 | 33 | 62 | 6713 | ||
| N2P2K2 | 210 | 33 | 62 | 7560 | |||
| N3P2K2 | 315 | 33 | 62 | 6870 | |||
| Zhuping (County, e), | N0P2K2 | 0 | 33 | 62 | 3311 | 0.997 | 30 |
| Henan | N1P2K2 | 105 | 33 | 62 | 4658 | ||
| N2P2K2 | 210 | 33 | 62 | 6102 | |||
| N3P2K2 | 315 | 33 | 62 | 5778 | |||
| Zhuping (County, f), | N0P2K2 | 0 | 26 | 50 | 4806 | 0.998 | 30 |
| Henan | N1P2K2 | 90 | 26 | 50 | 5429 | ||
| N2P2K2 | 180 | 26 | 50 | 6228 | |||
| N3P2K2 | 270 | 26 | 50 | ||||
| Jiaohe (City), | N0P2K2 | 0 | 26 | 62 | 7275 | 0.993 | 31 |
| Jilin | N1P2K2 | 75 | 26 | 62 | 9030 | ||
| N2P2K2 | 150 | 26 | 62 | 10230 | |||
| N3P2K2 | 225 | 26 | 62 | 10395 | |||
| Shuangdian, | N0P2K2 | 0 | 21 | 102 | 5054 | 0.941 | 32 |
| Jiangsu | N1P2K2 | 150 | 21 | 102 | 8607 | ||
| N2P2K2 | 300 | 21 | 102 | 9970 | |||
| N3P2K2 | 450 | 21 | 102 | 10813 | |||
| Wangji, | N0P2K2 | 0 | 39 | 100 | 5130 | 0.998 | 33 |
| Jiangsu | N1P2K2 | 165 | 39 | 100 | 6375 | ||
| N2P2K2 | 330 | 39 | 100 | 8025 | |||
| N3P2K2 | 495 | 39 | 100 | 7620 | |||
| Gengzhuang (b), | N0P2K2 | 0 | 52 | 100 | 6245 | 0.986 | 34 |
| Liaoning | N1P2K2 | 90 | 52 | 100 | 7620 | ||
| N2P2K2 | 180 | 52 | 100 | 8349 | |||
| N3P2K2 | 270 | 52 | 100 | 8100 | |||
| Yezhai, | N0P2K2 | 0 | 65 | 50 | 6905 | 0.999 | 35 |
| Ningxia | N1P2K2 | 113 | 65 | 50 | 9944 | ||
| N2P2K2 | 225 | 65 | 50 | 10779 | |||
| N3P2K2 | 338 | 65 | 50 | 11219 | |||
| Huangguan, | N0P2K2 | 0 | 52 | 50 | 4268 | 0.994 | 36 |
| Ningxia | N1P2K2 | 248 | 52 | 50 | 7016 | ||
| N2P2K2 | 495 | 52 | 50 | 8577 | |||
| N3P2K2 | 743 | 52 | 50 | 8129 | |||
| Gongu (County), | N0P2K2 | 0 | 72 | 49 | 12330 | 0.994 | 1 |
| Xinjiang | N1P2K2 | 48 | 72 | 49 | 13140 | ||
| N2P2K2 | 97 | 72 | 49 | 13350 | |||
| N3P2K2 | 145 | 72 | 49 | 14820 | |||
| Wenyaer, | N0P2K2 | 0 | 42 | 25 | 11700 | 0.994 | 38 |
| Xinjiang | N1P2K2 | 113 | 42 | 25 | 14588 | ||
| N2P2K2 | 225 | 42 | 25 | 16538 | |||
| N3P2K2 | 338 | 42 | 25 | 12278 | |||
| Jiucheng, | N0P2K2 | 0 | 33 | 50 | 4553 | 0.970 | 39 |
| Yunnan | N1P2K2 | 113 | 33 | 50 | 5654 | ||
| N2P2K2 | 225 | 33 | 50 | 6603 | |||
| N3P2K2 | 338 | 33 | 50 | 6804 | |||
| Luoxiong, | N0P2K2 | 0 | 52 | 90 | 6326 | 0.960 | 40 |
| Yunnan | N1P2K2 | 138 | 52 | 90 | 7268 | ||
| N2P2K2 | 276 | 52 | 90 | 8111 | |||
| N3P2K2 | 414 | 52 | 90 | 7808 | |||
| Zhongcun, | N0P2K2 | 0 | 24 | 75 | 3510 | 0.986 | 41 |
| Zhejiang | N1P2K2 | 86 | 24 | 75 | 5444 | ||
| N2P2K2 | 173 | 24 | 75 | 5734 | |||
| N3P2K2 | 259 | 24 | 75 | 6240 | |||
Appendix References
- Huang, S.; Zhang, Z. Study on “3414” fertilizer effect experiment of wheat in kaoshan village, Dingyuan County in 2006. Agric. Technol. Serv. 2008, 25, 39–40. (In Chinese)
- Li, J.; Li, Z.; Li, K.; Huang, S. Report on “3414” fertilization experiment of wheat. Anhui Agric. Sci. Bull. 2008, 14, 142–175. (In Chinese)
- You, J.; Zhou, F.; Li, P.; Yu, Y.; Ma, B.; Jiang, H. Study on soil testing and fertilization of wheat in Mingguang City. Anhui Agric. Sci. Bull. 2007, 13, 120–122. (In Chinese)
- Ma, L.; Zhao, Y.; Yang, L.; Zhan, Q.; Fang, Y. Preliminary report on “3414” fertilization experiment of wheat. Anhui Agric. Sci. Bull. 2009, 15, 90–189. (In Chinese)
- Zhang, W. Report on fertilizer effect of “3414” field wheat experiment. Anhui Agric. Sci. Bull. 2009, 15, 62–63, 167. (In Chinese)
- Dai, H. Report on “3414” formula fertilization experiment of wheat. Anhui Agric. Sci. Bull. 2009, 15, 131–132. (In Chinese)
- Zhang, D.; Liu, L.; Hu, S.; Zhao, Q. Preliminary report on “3414” fertilizer effect experiment of wheat. J. Anhui Agric. Sci. 2008, 36, 15587–15589. (In Chinese)
- Liu, S. Report on “3414” fertilizer effect field wheat experiment in Wuhe County in 2007. Anhui Agric. Sci. Bull. 2008, 14, 89, 105. (In Chinese)
- Wu, X.; Chen, J.; Wang, G.; Xu, H. Study on the economic benefits of balance fertilizer of N, P and K to wheat. J. Hebei Agric. Sci. 2008, 12, 47–48, 78. (In Chinese)
- Zhao, Z. Study on indices of soil testing and fertilization of wheat in Zhuanglang County. Gansu Agric. Sci. Technol. 2009, 7, 30–33. (In Chinese)
- Sun, Y.; Du, J.; Jia, L.; Liu, M. Study on fertilizer effect of “3414” experiment of winter wheat in Gaocheng city, Hebei province. J. Hebei Agric. Sci. 2008, 12, 84–86. (In Chinese)
- Li, M.; Wang, L. Preliminary report on “3414” experiment of winter wheat in Lushang County in 2007. Anhui Agric. Sci. Bull. 2008, 14, 67–71. (In Chinese)
- Chen, A.; Jiang, D.; Wang, H.; Mao, X. A “3414” fertilizer effect experiment of weak gluten wheat in oil sandy soil. Mod. Agric. Sci. Technol. 2009, 19, 15–16. (In Chinese)
- Gong, C. Preliminary study on fertilization of P and K to wheat. Barly Cereal Sci. 2008, 1, 39–42. (In Chinese)
- Wang, K.; Zhu, H.; Wu, L.; Xu, l. Fertilization effect of “3414” experiment on wheat in Sandy loam soil in Xiangshui County in 2007–2008. Mod. Agric. Sci. Technol. 2008, 24, 177–178. (In Chinese)
- Ren, J. Fertilization effect of “3414” experiment on wheat in Guide County shallow hill region. Agric. Technol. Serv. 2009, 26, 40. (In Chinese)
- Fan, L.; He, L. Preliminary report on “3414” fertilizer effect experiment of wheat. Plant Prot. 2009, 11, 35–36. (In Chinese)
- Du, J.; Zhu, S.; Yuan, W.; Hou, X. The application of “3414” experiment in the production of Wheat. Shaanxi J. Agric. Sci. 2009, 6, 12–14. (In Chinese)
- Li, C. Study on of “3414” fertilizer effect experiment of wheat. Jiangsu Agric. Sci. 2009, 4, 336–338. (In Chinese)
- Li, W. Summary on “3414” experiment of wheat in Maigaiti County. Xinjiang Agric. Sci. Technol. 2008, 180, 27. (In Chinese)
- Tuohetiniyazi, N.; Ta, Y. Summary on “3414” experiment of winter wheat. Xinjiang Agric. Sci. Technol. 2008, 181, 29. (In Chinese)
- Shao, L. Fertilization effect of “3414” experiment on summer maize. Anhui Agric. Sci. Bull. 2008, 14, 129–130. (In Chinese)
- Sun, Y. Fertilization effect of “3414” field experiment on maize in Yingzhou region in 2008. Mod. Agric. Sci. Technol. 2009, 15, 12, 14. (In Chinese)
- Huang, L. Study on “3414” fertilizer effect experiment of maize in Gengzhuang town, Haicheng city. Rain Fed Crops 2009, 29, 148–149. (In Chinese)
- Wei, Z.; Zeng, G.; Wei, M.; Peng, C. Preliminary report on fertilizer effect of “3414” soil testing and fertilization experiment on maize. Mod. Agric. Sci. 2009, 16, 48–49, 51. (In Chinese)
- Deng, D.; Xiao, G.; Wei, X.; Liu, Q.; Kong, F. Fertilizer effect on maize with “3414” experiment in high elevation mountainous area of Weining County. Mod. Agric. Sci. Technol. 2009, 5, 156, 158. (In Chinese)
- Jiang, Z. “3414” fertilizer effect experiment of maize in Qinglong County. Agric. Technol. Serv. 2008, 25, 45–46. (In Chinese)
- Yuan, M. “3414+1” fertilizer effect experiment of maize in Tianping country, Tongzhi County. Agric. Technol. Serv. 2009, 26, 38–39. (In Chinese)
- Huang, L.; Kuang, Y.; Feng, S.; Zhen, L.; He, D. Fertilization effect of “3414” experiment on maize in yellow earths. Agric. Technol. Serv. 2009, 26, 50–51. (In Chinese)
- Yan, H.; Jing, S.; Song, Q.; Zhang, J.; Song, X. Preliminary report on “3414” fertilizer effect field experiment of summer maize. J. Seed Ind. Guide 2009, 3, 27–29. (In Chinese)
- Jin, F.; Yan, X.; Lin, Y.; Gao, Y.; Liu, W. Study on fertilizer effect of N, P and K on maize. J. Jilin Agric. Sci. 2008, 33, 48–50. (In Chinese)
- Shen, J.; Song, Y.; Mao, B.; Xu, Q.L.C.; Zhou, M. Preliminary study on “3414” fertilizer effect experiment of maize in albic soils in Donghai County. Mod. Agric. 2009, 3, 29–30. (In Chinese)
- Wang, L.; Wang, C.; Liu, Y. “3414” fertilizer effect experiment of maize. Mod. Agric. Sci. Technol. 2008, 15, 201–202.
- Shao, L. “3414” fertilizer effect experiment of summer maize. Anhui Agric. Sci. Bull. 2008, 14, 129–130. (In Chinese)
- Wang, W.; He, X.; Wang, G.; Wang, L.; Li, X.; Li, W. “3414” fertilizer effect experiment of maize in southern Ningxia mountain area. Ningxia J. Agric. For. Sci. Technol. 2008, 6, 77–79. (In Chinese)
- Yin, X.; Zhu, G.; Ji, W.; Sun, W.; Wang, S.; Dong, P. Effects of “3414” different fertilizer ratio experiment on the yield of maize interplanted with wheat in Ningxia. Ningxia J. Agric. For. Sci. Technol. 2008, 3, 31–32. (In Chinese)
- Shadekebieke, T.; Baxian, W. Study on “3414” fertilizer experiment of maize. Rural Sci. Technol. 2008, 2, 19–20. (In Chinese)
- Wang, N.; Yang, A.; Huang, H.; Wu, S.; Wang, T. Report of “3414” experiment of maize in Wenyaer vellige, Yining County. Xinjiang Agric. Sci. Technol. 2008, 182, 25. (In Chinese)
- Zhu, N.; Wan, Y.; He, Y.; Du, W. Preliminary report on “3414” soil testing and fertilization experiment of maize in Luxi County. Yunnan Agric. Sci. Technol. 2009, S, 51–52. (In Chinese)
- Qin, X.; Ruan, Y. Study on “3414” soil testing and fertilization experiment of maize in Luoping County. Yunnan Agric. 2009, 4, 26–27. (In Chinese)
- Chen, X. Preliminary report on optimal fertilization of maize in southern Zhejiang yellow mud gravel area. Mod. Agric. Sci. Technol. 2008, 24, 181, 184. (In Chinese)
References
- Cassman, K.; Dobermann, A.; Walters, D. Agroecosystems, nitrogen-use efficiency, and nitrogen management. AMBIO J. Hum. Environ. 2002, 31, 132–140. [Google Scholar] [CrossRef]
- Frink, C.; Waggoner, P.; Ausubel, J. Nitrogen fertilizer: Retrospect and prospect. Proc. Natl. Acad. Sci. USA 1999, 96, 1175–1180. [Google Scholar] [CrossRef] [PubMed]
- Roy, R.; Misra, R.; Montanez, A. Decreasing reliance on mineral nitrogen-yet more food. AMBIO J. Hum. Environ. 2002, 31, 177–183. [Google Scholar] [CrossRef]
- National Bureau of Statistics. China Statistical Yearbook; China Statistics Press: Beijing, China, 2012. [Google Scholar]
- Fixen, P.; West, F. Nitrogen fertilizers: Meeting contemporary challenges. AMBIO J. Hum. Environ. 2002, 31, 169–176. [Google Scholar] [CrossRef]
- Tilman, D.; Cassman, K.; Matson, P.; Naylor, R.; Polasky, S. Agricultural sustainability and intensive production practices. Nature 2002, 418, 671–677. [Google Scholar] [CrossRef]
- Liu, G.; Wu, W.; Zhang, J. Regional differentiation of non-point source pollution of agriculture-derived nitrate nitrogen in groundwater in northern China. Agric. Ecosyst. Environ. 2005, 107, 211–220. [Google Scholar] [CrossRef]
- Olfs, H.; Blankenau, K.; Brentrup, F.; Jasper, J.; Link, A.; Lammel, J. Soil-and plant-based nitrogen-fertilizer recommendations in arable farming. J. Plant Nutr. Soil Sc. 2005, 168, 414–431. [Google Scholar] [CrossRef]
- Hong, N.; Scharf, P.; Davis, J.; Kitchen, N.; Sudduth, K. Economically optimal nitrogen rate reduces soil residual nitrate. J. Environ. Qual. 2007, 36, 354–362. [Google Scholar] [CrossRef]
- Benbi, D.; Biswas, C. Nitrogen balance and N recovery after 22 years of maize-wheat-cowpea cropping in a long-term experiment. Nutr. Cycl. Agroecosyst. 1996, 47, 107–114. [Google Scholar] [CrossRef]
- Truog, E. Fifty years of soil testing. In Proceedings of the Transactions of 7th International Congress of Soil Science, Madison, WI, USA, 15 August 1960; Volume 4, pp. 46–52. [Google Scholar]
- Stanford, G. Rationale for optimum nitrogen fertilization in corn production. J. Environ. Qual. 1973, 2, 159–166. [Google Scholar] [CrossRef]
- Stanford, G.; Hunter, A. Nitrogen requirements of winter wheat (Triticum aestivum, L.) varieties ‘Blueboy’and ‘Redcoat’. Agron. J. 1973, 65, 442–447. [Google Scholar] [CrossRef]
- Shapiro, C.A.; Ferguson, R.B.; Hergert, G.W.; Wortmann, C.S.; Walters, D.T. Fertilizer Suggestions for Corn. 2003. Available online: http://www.ianrpubs.unl.edu/live/ec117/build/ec117.pdf (accessed on 3 October 2018).
- Beegle, D.; Wolf, A. Soil Test Recommendations Handbook for Agronomic Crops; Agricultural Analytical Services Lab, Pennsylvania State University: University Park, TX, USA, USA. 2000; Available online: https://agsci.psu.edu/aasl/soil-testing/soil-fertility-testing/handbooks/agronomic (accessed on 3 October 2018).
- Hoeft, R.; Peck, T.; Boone, L. Soil testing and fertility. In Illinois Agronomy Handbook: 2000–2001; University of Illinois: Urbana-Champaign, IL, USA, 2001; pp. 84–124. [Google Scholar]
- Dahnke, W.; Fanning, C.; Cattanach, A. Fertilizing Corn Grain, Popcorn, Silage Corn, and Sweet Corn. North Dakota State University Institutional Repository. 2010. Available online: http://hdlhandlenet/10365/9362 (accessed on 3 October 2012).
- Rao, A.; Smith, J.; Parr, J.; Papendick, R. Considerations in estimating nitrogen recovery efficiency by the difference and isotopic dilution methods. Fertil. Res. 1992, 33, 209–217. [Google Scholar] [CrossRef]
- Stanford, G.; Legg, J. Correlation of soil N availability indexes with N uptake by plants. Soil Sci. 1968, 105, 320–326. [Google Scholar] [CrossRef]
- Storrier, R.; Hanly, A.; Nicol, H. An evaluation of indices of available soil nitrogen. Anim. Prod. Sci. 1970, 10, 89–94. [Google Scholar] [CrossRef]
- Schomberg, H.; Wietholter, S.; Griffin, T.; Reeves, D.; Cabrera, M.; Fisher, D.; Endale, D.; Novak, J.; Balkcom, K.; Raper, R. Assessing indices for predicting potential nitrogen mineralization in soils under different management systems. Soil Sci. Soc. Am. J. 2009, 73, 1575–1586. [Google Scholar] [CrossRef]
- Cui, Z.; Chen, X.; Miao, Y.; Li, F.; Zhang, F.; Li, J.; Ye, Y.; Yang, Z.; Zhang, Q.; Liu, C. On-farm evaluation of winter wheat yield response to residual soil nitrate-N in North China Plain. Agron. J. 2008, 100, 1527–1534. [Google Scholar] [CrossRef]
- Lund, L. Variations in nitrate and chloride concentrations below selected agricultural fields. Soil Sci. Soc. Am. J. 1982, 46, 1062–1066. [Google Scholar] [CrossRef]
- Tanji, K.; Fried, M.; Van De Pol, R. A steady-state conceptual nitrogen model for estimating nitrogen emissions from cropped lands. J. Environ. Qual. 1977, 6, 155–159. [Google Scholar] [CrossRef]
- Liu, J.; Liu, H.; Huang, S.; Yang, X.; Wang, B.; Li, X.; Ma, Y. Nitrogen efficiency in long-term wheat–maize cropping systems under diverse field sites in China. Field Crop Res. 2010, 118, 145–151. [Google Scholar] [CrossRef]
- Page, A.L. Part 2. Chemical and microbiological properties. In Methods of Soil Analysis; Wi American Society of Agronomy Inc. & Soil Science Society of America Inc.: Wisconsin, USA, 1982. [Google Scholar]
- Meisinger, J. Evaluating plant-available nitrogen in soil-crop systems. Nitrogen Crop Prod. 1984, 4, 391–416. [Google Scholar]
- Gaffke, N.; Krafft, O. Exact D-optimum designs for quadratic regression. J. R. Stat. Soc. B 1982, 44, 394–397. [Google Scholar]
- Chen, X.; Zhang, F. Construction of index system on soil test and formula fertilization based on 3414 experiment. China Agric. Technol. Ext. 2006, 22, 36–39. (In Chinese) [Google Scholar]
- NAPCIDC. National Agricultural Product Cost and Income Data Compilation; China Statistics Press: Beijing, China, 2015. (In Chinese) [Google Scholar]
- Mitchell, C.; Westerman, R.; Brown, J.; Peck, T. Overview of long-term agronomic research. Agron. J. 1991, 83, 24–29. [Google Scholar] [CrossRef]
- Peterson, T.; Varvel, G. Crop yield as affected by rotation and nitrogen rate. I. Soybean. Agron. J. 1989, 81, 727–731. [Google Scholar] [CrossRef]
- Peterson, T.; Varvel, G. Crop Yield as Affected by Rotation and Nitrogen Rate. II. Grain Sorghum. Agron. J. 1989, 81, 731–734. [Google Scholar] [CrossRef]
- Peterson, T.; Varvel, G. Crop yield as affected by rotation and nitrogen rate. III. Corn. Agron. J. 1989, 81, 735–738. [Google Scholar] [CrossRef]
- Hassink, J. Effects of soil texture and grassland management on soil organic C and N and rates of C and N mineralization. Soil Biol. Biochem. 1994, 26, 1221–1231. [Google Scholar] [CrossRef]
- Malhi, S.; Harapiak, J.; Nyborg, M.; Flore, N. Soil chemical properties after long-term n fertilization of bromegrass: Nitrogen rate. Commun. Soil Sci. Plan. 1991, 22, 1447–1458. [Google Scholar] [CrossRef]
- Malhi, S.; Brandt, S.; Ulrich, D.; Lemke, R.; Gill, K. Accumulation and distribution of nitrate-nitrogen and extractable phosphorus in the soil profile under various alternative cropping systems. J. Plant Nutr. 2002, 25, 2499–2520. [Google Scholar] [CrossRef]
- Guillard, K.; Griffin, G.; Allinson, D.; Yamartino, W.; Rafey, M.; Pietrzyk, S. Nitrogen utilization of selected cropping systems in the US Northeast: II. Soil profile nitrate distribution and accumulation. Agron. J. 1995, 87, 199–207. [Google Scholar] [CrossRef]
- Yang, X.; Zhang, S.; Yuan, X.; Tong, Y. A long-term experiment on effects of organic manure and chemical fertilization on distribution, accumulation and movement of NO3−-N in soil. Plant Nutr. Fertil. Sci. 2001, 7, 134–138. (In Chinese) [Google Scholar]
- Bao, D.; Huang, S.; Huang, X.; Zhang, H. Effect of long-term fertilization on nitrate movement and distribution in Fluvo-aquic soil. In Proceedings of the 5th Cross-Strait Workshop on Soil and Fertilizer; 2004. (In Chinese). [Google Scholar]
- Zhang, Y.; Liu, H.; Li, Z.; Lin, B.; Zhang, F. Study of nitrate leaching potential from agricultural land in Northern China under long-term fertilization conditions. Plant Nutr. Fertil. Sci. 2005, 11, 711–716. (In Chinese) [Google Scholar]
- Cui, Z.; Zhang, F.; Miao, Y.; Sun, Q.; Li, F.; Chen, X.; Li, J.; Ye, Y.; Yang, Z.; Zhang, Q. Soil nitrate-N levels required for high yield maize production in the North China Plain. Nutr. Cycl. Agroecosyst. 2008, 82, 187–196. [Google Scholar] [CrossRef]
- Fang, Q.; Yu, Q.; Wang, E.; Chen, Y.; Zhang, G.; Wang, J.; Li, L. Soil nitrate accumulation, leaching and crop nitrogen use as influenced by fertilization and irrigation in an intensive wheat–maize double cropping system in the North China Plain. Plant Soil 2006, 284, 335–350. [Google Scholar] [CrossRef]
- Ju, X.; Liu, X.; Zhang, F.; Roelcke, M. Nitrogen fertilization, soil nitrate accumulation, and policy recommendations in several agricultural regions of China. AMBIO J. Hum. Environ. 2004, 33, 300–305. [Google Scholar] [CrossRef]
- Cui, Z.; Zhang, F.; Chen, X.; Miao, Y.; Li, J.; Shi, L.; Xu, J.; Ye, Y.; Liu, C.; Yang, Z. On-farm evaluation of an in-season nitrogen management strategy based on soil Nmin test. Field Crops Res. 2008, 105, 48–55. [Google Scholar] [CrossRef]
- Miller, G. Establishing Realistic Yield Goals; Cooperative Extension Service, Iowa State University: Ames, IA, USA, 1986. [Google Scholar]
- Timlin, D.; Pachepsky, Y.; Snyder, V.; Bryant, R. Spatial and temporal variability of corn grain yield on a hillslope. Soil Sci. Soc. Am. J. 1998, 62, 764–773. [Google Scholar] [CrossRef]
- Machado, S.; Bynum, E., Jr.; Archer, T.; Lascano, R.; Wilson, L.; Bordovsky, J.; Segarra, E.; Bronson, K.; Nesmith, D.; Xu, W. Spatial and temporal variability of corn grain yield: Site-specific relationships of biotic and abiotic factors. Precis. Agric. 2000, 2, 359–376. [Google Scholar] [CrossRef]


| Sites | |||||
|---|---|---|---|---|---|
| Items | S1-WQ | S2-CP | S3-ZZ | S4-YL | S5-QY |
| Location | Wulumuqi, Xinjiang | Changping, Beijing | Zhengzhou, Henan | Yangling, Shaanxi | Qiyang, Hunan |
| Longitude | 87°25′58″ E | 116°12′08″ E | 113°39′25″ E | 108°03′54″ E | 111°52′32″ E |
| Latitude | 43°58′23″ N | 40°12′34″ N | 34°47′02″ N | 34°16′49″ N | 26°45′12″ N |
| Mean annual temperature, °C | 7.4 | 11.8 | 14.2 | 12.7 | 18.3 |
| Annual rainfall, mm | 247 | 577 | 644 | 542 | 1276 |
| Cropping, per year | wheat or maize | wheat–maize | wheat–maize | wheat–maize | wheat–maize |
| Soil classification in China | Grey desert soil | Fluvo-aquic soil | Fluvo-aquic soil | Loessial soil | Red earth |
| Soil classification in FAO | Calcaric Cambisol | Haplic Luvisol | Calcaric Cambisol | Calcaric Regosol | Eutric Cambisol |
| Sand/Silt/Clay (%) | 18.5/53.2/28.3 | 20.3/65.0/14.7 | 26.5/60.7/12.8 | 31.6/51.6/16.8 | 3.7/34.9/61.4 |
| Soil pH (water/soil = 2.5) | 8.1 | 8.2 | 8.3 | 8.6 | 5.7 |
| Organic carbon (g kg−1) | 8.8 | 7.1 | 6.7 | 6.3 | 6.7 |
| Total N (g kg−1) | 0.87 | 0.64 | 1.01 | 0.83 | 1.07 |
| Total P (g kg−1) | 0.67 | 0.69 | 0.65 | 0.61 | 0.45 |
| Total K (g kg−1) | 23 | 14.6 | 16.9 | 22.8 | 13.7 |
| Treatment | Experiment Site (%) | |||||
|---|---|---|---|---|---|---|
| S1-WQ1 | S1-WQ2 | S2-CP | S3-ZZ | S4-YL | S5-QY | |
| N | 149 ab | 40 b | 39 e | 43 f | 40 c | 24 e |
| NK | 115 bc | 38 bc | 47 d | 50 e | 42 c | 30 d |
| NP | 155 ab | 58 a | 66 b | 77 a | 70 b | 39 c |
| NPK | 161 a | 62 a | 70 a | 78 a | 77 a | 43 b |
| FS | 103 c | 51 ab | 48 d | 64 c | 74 ab | 47 ab |
| FM | 50 d | 43 b | 65 b | 70 b | 78 a | 49 a |
| HF | 31 d | 26 c | 58 c | 56 d | 71 b | 47 ab |
© 2018 by the authors. Licensee MDPI, Basel, Switzerland. This article is an open access article distributed under the terms and conditions of the Creative Commons Attribution (CC BY) license (http://creativecommons.org/licenses/by/4.0/).
Share and Cite
Liu, J.; Li, J.; Ma, Y.; Jia, Y.; Liang, Q. Apparent Accumulated Nitrogen Fertilizer Recovery in Long-Term Wheat–Maize Cropping Systems in China. Agronomy 2018, 8, 293. https://doi.org/10.3390/agronomy8120293
Liu J, Li J, Ma Y, Jia Y, Liang Q. Apparent Accumulated Nitrogen Fertilizer Recovery in Long-Term Wheat–Maize Cropping Systems in China. Agronomy. 2018; 8(12):293. https://doi.org/10.3390/agronomy8120293
Chicago/Turabian StyleLiu, Jie, Jumei Li, Yibing Ma, Yuehui Jia, and Qiong Liang. 2018. "Apparent Accumulated Nitrogen Fertilizer Recovery in Long-Term Wheat–Maize Cropping Systems in China" Agronomy 8, no. 12: 293. https://doi.org/10.3390/agronomy8120293
APA StyleLiu, J., Li, J., Ma, Y., Jia, Y., & Liang, Q. (2018). Apparent Accumulated Nitrogen Fertilizer Recovery in Long-Term Wheat–Maize Cropping Systems in China. Agronomy, 8(12), 293. https://doi.org/10.3390/agronomy8120293