Abstract
The present study assesses the response of hybrid rice (variety Arize 6444) to potassium (K) application during rainy (wet) seasons of 2016 and 2017 in coastal saline soils of West Bengal, India. The study was conducted at the Regional Research Farm, Bidhan Chandra Krishi Viswavidyalaya, Kakdwip, West Bengal. The soil is clayeywith acidic pH (5.91), saline (Electrical conductivity/EC 1.53 dS m−1) and of high K fertility (366 kg ha−1). The experimental plots were laid out in a randomized complete block design with five (5) K treatments (0, 30, 60, 90, and 120 kg K2O ha−1) with four replications. Plant height, dry matter (DM) in different plant parts, number of tillers, and grain yield were measured in each treatment for the determination of optimum K dose. The study revealed that the stem, leaf, and grain dry matter production at 60 days after transplanting (DAT) and harvest were significantly (p ≤ 0.05) higher at 90 kg K2O ha−1 application. The number of tillers hill−1 was also higher (p ≤ 0.05) in plants fertilized with 90 kg K2O ha−1 over K omission. At harvest, grain K concentration improved (p ≤ 0.05) with K fertilization at 90 kg K2O ha−1, 116% more than the zero-K. Omission of K application from the best treatment (90 kg K2O ha−1) reduced grain yield by 3.5 t ha−1 even though the available K content was high. Potassium uptake restriction due to higher Mg content in the soil may have caused reduced uptake of K leading to yield losses. The present study also showed higher profits with 90 kg K2O ha−1 with higher net returns (US$ 452 ha−1) and benefit:cost ratio (1.75) over other treatments from hybrid rice (var. Arize 6444). From the regression equation, the economic optimum level of K (Kopt) was derived as 101.5 kg K2O ha−1 that could improve productivity of hybrid rice during the wet season in coastal saline soils of West Bengal.
1. Introduction
With growing population and urbanization, the total area under rice cultivation in India as well as in the state of West Bengal is decreasing at a rapid rate. However, the demand for rice in the future is bound to increase with the growing population [1]. Predominantly medium and low lands in the eastern part of India leave no other option for farmers but to go for rice cultivation in the rainy (khairf/wet) season. Rice is grown in about 1 million hectares under the coastal ecosystem of West Bengal, accounting for nearly 17% of the net ricearea in the state. The farmers usually grow low yielding, long duration (145–150 days) traditional rice cultivars during the kharif (rainy) season, while the landsremainfallow during the rabi (winter) season [2].
Salinity is a major yield-reducing factor in thecoastal ecosystems for rice [3]. Rice experiences osmotic stress in saline soils that result in reduced osmotic potential and water stress [4]. Salinity reduces dry matter, grain yield, and the harvest index, and thus affects bothvegetative and reproductive stages of the crop [5]. The productivity of rice is not satisfactory in the coastal areas due to aberrant climatic conditionsand non-availability of hybrid varieties [6]. Water stagnation (medium-deep, 25–50 cm) for most of the crop growing season, flash floods (complete submergence for 1–2 weeks), and water and soil salinity [7] are typical deterrents to high productivity. The South 24-Parganas district ranks 12th amongst all rice growing districts of West Bengal in rice productivity [8]. Considering the demand–supply gap of rice, adoption of superior rice varieties could be effective for narrowing yield gap, and for breaking the yield ceiling in the coastal ecosystem.
Large scale adoption of hybrid rice during wet season in the coastal area could boost rice yield by about 15–20% with the same level of input [6,9]. The hybrid seeds are also tolerant to biotic and abiotic stresses [10]. Along with the improved seeds, a good nutrient management plan is also needed to make the higher production sustainable.
Hybrid rice varieties were already introduced to the region to augment the rice production. However, lack of awareness about the recommended package of practices was the main barrier to its adoption [11]. Consequently, an inadequate nutrient management strategy failed to produce the desired result. The use of nutrient rates suitable for high yielding varieties (HYVs) did not produce the higher yields expected from hybrid rice varieties [12]. Hybrid varieties with higher yield potential require larger quantities of nutrients compared to HYVs. Studies in West Bengal have shown that integrated and adequate use of chemical fertilizers and organic sources of fertilizers can result in improved soil fertility, higher nutrient-use efficiency, and better crop growth, translating into higher yield and profit [13,14].
Potassium is a key nutrient required for optimum yield of hybrid rice. Hybrid rice with high yield potential per unit area and time requires higher amount of K than HYVs. On an average, the crop accumulates 27–36 kg K ha−1 to produce a ton of grain, with an equal amount of straw during wet season [15]. A K management strategy based only on attainable yield potential of HYVs are not sufficient to supply the requirement of hybrid rice [9]. Hybrid rice was reported to absorb 79% of total K requirement from soil and remainder from the fertilizer, and utilized 28.1% of the applied K [16]. For improved K use efficiency (KUE) of hybrid rice, appropriate K fertilization strategies should be adopted to fine tune the supply–demand balance of crop and soil. A regular application of K to the crop increased total tillers, dry matter accumulation, effective tillers, number and weight of filled grains and KUE, and enhanced the grain yield besides improving soil properties [17,18]. It was also reported that greater K uptake improved carbohydrate metabolism in plants [18], and adequate K increases the translocation of N to the grain during grain filling period, increasing efficiency of N. Potassium helps to overcome stresses common in this region, and high K uptake in the panicle, especially at the early developmental stage, mitigates the negative effect of sodium uptake by the panicles [3].
For exploiting the full heterotic potential of hybrids, it is necessary to assess the performance of promising rice hybrids at graded levels of K when other management practices are optimum. A quantitative understanding of the crop response to K fertilizer is crucial to optimize K input for higher productivity. Reports on yield performance of superior hybrid rice cultivars under proper K management in the coastal saline soils are limited. The present study evaluates the effects of K fertilization on growth, yield and K-acquisition pattern to estimate appropriate K rates for achieving optimum yield and KUE in hybrid rice cultivation.
2. Materials and Methods
2.1. Field Site
The field study was undertaken during two consecutives rainy (wet) seasons of 2016 and 2017 at the Research Farm of Bidhan Chandra Krishi Viswavidyalaya (BCKV), Kakdwip, South 24-Parganas, West Bengal (22°40′ N latitude, 88°18′ E longitude and 7 m above mean sea level). The maximum and minimum air temperatures fluctuated from 24.9 to 32.1 °C and from 12.3 to 20.4°C during rainy season of 2016, and from 23.2 to 32.9°C and from 12.1 to 19.3 °C during the same period of 2017, respectively. The maximum and minimum air relative humidity was between 85% and 86% (max) and 49% and 63% (min) during rainy season of 2016 and between 87% and 89% (max) and 34% and 58% (min) during rainy season of 2017. The rainfall during the experimental period (July to November) was 474 mm and 654 mm during 2016 and 2017, respectively. The long-term average values of weather parameters showed that average maximum and minimum temperatures fluctuated from 25.3 °C to 35.7 °C and from 10.5 °C to 24.3 °C during rainy season, respectively. The average maximum and minimum relative humidity prevailed between 84% and 85% (max) and 50% and 65% (min) during rainy season, respectively. The long-term average of total rainfall during July to November was 524 mm. Hence, overall weather conditions during the experimental periods were congenial for growth and development of hybrid rice.
Surface soil samples from the field site were collected and analyzed using established procedures mentioned in Table 1.

Table 1.
Initial physico-chemical properties of the experimental soil (0–30 cm depth).
2.2. Treatment Arrangements and Cultural Practices
The experimental plots were laid out in a randomized complete block design with five rates of K (0, 30, 60, 90, and 120 kg K2O ha−1) that were replicated four times. The individual plot size was 5 × 5 m. Pre-germinated seeds of hybrid rice var. Arize 6444 with 125 days duration (produced and marketed by Bayer Crop Science Company and notified by Govt. of India) were sown at 20 g m−2 of nursery area on the second week of July. In the main field, total 3–4 ploughings were done followed by one laddering. For the next 5–7 days, standing water (5–7 cm) was maintained to control all weeds and full decomposition of stubbles. Then another 2–3 ploughings were given followed by laddering in order to make leveled land. Seedlings of 25 days old were manually transplanted in the first week of August on puddled and leveled land at 1 seedling hill−1 with a spacing of 20 × 20 cm. Urea, single super phosphate (SSP) and muriate of potash (MOP) were manually applied as sources of N, P and K, respectively. Based on the soil test recommendations provided by Chinsurah Rice Research Station, Government of West Bengal, 80 kg N ha−1 and 40 kg P ha−1 were applied in all plots. About 25% of total N, entire amount of P, and 75% of the K as per treatments were applied as basal after draining out the standing water but before final puddling. Rest of the N was top-dressed in threeequal splits, each at an interval of threeweeks, i.e., after transplanting, panicle initiation (PI), and panicle emergence stages. The remaining 25% of the K fertilizer was also applied at the PI stage. Post-emergence application of Bispyribac sodium 10% soluble concentrates/SC (Nominee Gold) at 200 mL ha−1 at 15 days after transplanting (DAT) followed by one hand weeding (HW) at 42 DAT were done to promote early crop growth by controlling weeds. Other agronomic management practices were followed based on recommended standards for the coastal region of West Bengal [24] and were applied uniformly across all treatments. The crop was harvested in the first week of November when 80% of the grains in the panicles were ripe, and later dried, winnowed, and weighed for yield estimation.
2.3. Field Measurements
At harvest maturity, plants from 25 hills (1 m2 area) were harvested and grains were separated to estimate grain yield, while the moisture content of grain was adjusted to 0.15 g H2O g−1. Growth attributes and yield components were measured from randomly harvested 10 plants. The plants were then partitioned into leaf, stem and panicles. Production of stem, leaf and grain dry matter (DM) was recorded at 60 DAT and harvest. Panicles were hand-threshed, and the filled and unfilled seeds were separated by submerging them into water. Light weight unfilled seeds floating on the water surface were removed, while filled seeds settled down. Filled seeds were further sun-dried to 14% moisture. Dry weight of different plant parts, after oven-drying at 70 °C until constant weight, was determined to estimate above-ground biomass. The grain weight was determined from filled grains per panicle.
2.4. Potassium Determination and Performance Indicators
For K analysis, plant samples (stem, leaf, and grain) were digested with tri-acid mixture (HNO3:H2SO4:HClO4, 9:1:4), and the K concentration (K%) in plant was determined using a flame photometer [25].
Total K uptake was first calculated by the following formula [26].
To measure the re-translocation efficiency of absorbed K from vegetative plant parts to grain and also to measure K partitioning in plant, K harvest index (KHI) was estimated as per the following formula [27].
K mobilization efficiency index (KMEI) of applied K was calculated using the following expressions [28].
KUE was calculated using following formulae [29].
where, Y and U refer to grain yield and K uptake by hybrid rice and subscripts K and C refer to K fertilized and control plots, respectively. Ka refers to applied fertilizer K. All values are in kg ha−1.
2.4.1. Dose–Response Curve
Dose–response curves were drawn to evaluate the changes in grain yieldwith increasing dose of K fertilization. The curve was drawn by fitting the following quadratic response model to grain yield data
where a, b, and c are the regression co-efficient of the quadratic equation; y is the grain yield (kg ha−1); K is the applied fertilizer K (kg ha−1).
The economic optimum for K (Kopt) was estimated from the above quadratic regression by using the formula [29]
where, q is price per kg of K, and p is price per kg of grain.
2.4.2. Sustainable Yield Index (SYI)
In this study, the SYI for each treatment was calculated from the ratio of minimum assured grain yield to maximum observed yield [28].
where, Ya = mean yield achieved with the treatment, σ = standard deviation of yield, Ym = maximum yield achieved with the treatment. The SYI is a quantitative measure to judge sustainability of an agricultural practice [30]. Under SYI concept, low value of σ suggests sustainability of anagricultural system. Conversely, if the σ value is large then SYI will be low indicating unsustainable agricultural practice. The value of SYI varies between zero and unity. The best technology is one where σ is zero and mean = maximum observed yield (Ym), indicating SYI = 1, hence, the practice gives consistently maximum yield over the years.
2.5. Potassium Balance
The post-harvest pH, EC, and available K contents were assessed for each of the treatments and the extent of change of these values as compared to the initial soil values were estimated. The K balance sheet was prepared according to nutrient balance sheet model [31]. Expected balance was derived from the equation
where total K available is the sum of initial K content and K applied through fertilizer. Total K uptake is the sum of K uptake in stem, leaf, and grain at harvest. Actual K balance represents the values derived from post-harvest soil analysis. Finally, net K gain (+) or loss (−) in post-harvest soil was estimated by subtracting actual balance from expected balance.
2.6. Economic Analysis
Common cost of hybrid rice cultivation was derived from summing all expenditure, excluding fertilizer cost. The cost of fertilizer (treatment cost) was estimated on the basis of average retail price in West Bengal. The gross returns from the crop were calculated based on minimum procurement price of the Government of West Bengal. The following equations were used for calculating gross returns, net returns and benefit:cost ratio [28].
where GR is gross returns (US$ ha−1); NR is net returns (US$ ha−1); BCR is benefit: cost ratio; Yt is grain yield (t ha−1); Pt is the minimum support price of grain (US$ t−1) and Cp is total cost of production. All economic data were converted into US$ using an exchange rate of 1 US$ = INR 64.56.
2.7. Statistical Analysis
Experimental data were subjected to analysis of variance (ANOVA) as randomized complete block design and the mean values were adjudged by Tukey’s HSD (honest significant difference) test method using SPSS (Version 23.0, IBM SPSS Statistics for Windows, IBM Corporation, Armonk, NY, USA) software. Bartlett’s chi-square test was performed to test the homogeneity of variance over both the years and pooled values of observations are given to explain the results logically. The Excel software (version 2007, Microsoft Inc., Redmond, WA, USA) was used to draw graphs and figures.
3. Results
3.1. Grain and Straw Yield and Yield Components of Hybrid Rice
Both grain and straw yield of hybrid rice (var. Arize 6444) were significantly (p ≤ 0.05) influenced by K application levels (Table 2); grain yield increased with the increase in K level from 0 to 90 kg K2O ha−1. The grain and straw yielddid not vary significantly between 90 kg and 120 kg K2O ha−1. The grain yield obtained with 90 kg K2O ha−1 was 85% more than the yield obtained with control (zero-K). Figure 1 depicts the regression between applied fertilizer K and grain yield of hybrid rice. Straw yield also increased with increase in K from 0 to 90 kg K2O ha−1. Significantly (p ≤ 0.05) higher straw yield was obtained with 90 kg K2O ha−1, 80.9% more than with K omission. Zero K resulted in the largest reduction in grain and straw yield.
Table 2.
Yield components and yield of hybrid rice (var. Arize 6444) as influenced by potassium fertilization (means for 2016 and 2017).
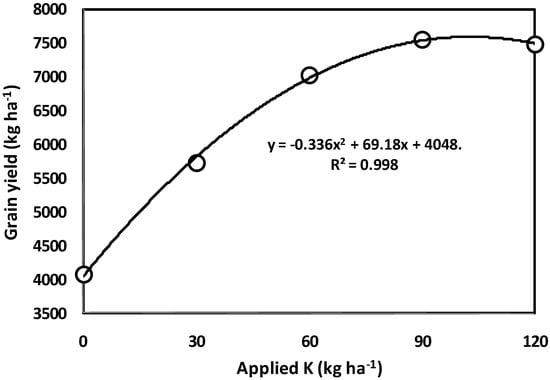
Figure 1.
Dose–response curve showing the regression between applied K (kg ha−1) and grain yield (kg ha−1) (Optimum dose of potassium/Kopt = 101.5 kg ha−1).
3.2. Growth Attributes of Hybrid Rice
The growth attributes (except plant height) of hybrid rice were influenced (p ≤ 0.05) by different K levels (Table 3). Dry weights of stem and leaf were higher (p ≤ 0.05) at 90 kg K2O ha−1 compared to the treatments receiving less K, and were statistically at par with 120 kg K2O ha−1. Similar trend was observed for leaf dry matter at harvest although no significant difference was observed for the stem dry matter. The grain dry weight was also higher (p ≤ 0.05) with 120 kg K2O ha−1 compared to the lower application rates. The number of tillers hill−1 increased significantly (p ≤ 0.05) with 120 kg K2O ha−1, accounting for 64.3% more tillers than that with K omission.
Table 3.
Growth attributes of hybrid rice (var. Arize 6444) as influenced by potassium fertilization (means for 2016 and 2017).
K fertilization significantlyaffected (p ≤ 0.05) yield components of hybrid rice, such as, number of filled seeds panicle−1, number of unfilled seeds panicle−1 and panicle weight, while the effect was non-significant (p ≥ 0.05) for number of panicles hill−1, panicle length and 1000-seed weight (Table 3). K application at 90 kg K2O ha−1 produced higher number of filled seeds panicle−1 accounting for 26.4% more than that with K omission. Panicle weight increased with increase in K dose up to 60 kg ha−1, remained at par at K dose of 90 kg ha−1, and decreased with further increase in K rate. Plants in the control plot produced the lowest panicle weight.
3.3. K Accumulation in Different Plant Parts
The K concentration (%) in stem at peak growth stage, i.e., 60 DAT, increased steadily upto 90 kg K2O ha−1 although the difference is statistically non-significant (p ≥ 0.05) (Table 4). The leaf K concentration also increased up to 60 kg K2O ha−1, although insignificantly. A similar trend of K concentration was observed for stem, leaf, and grain at harvest (Table 4). As expected, the K accumulation in grain was lower than in stem or leaf. The relationships between grain yield and stem (R2 = 0.77) as well as grain K concentration (R2 = 0.89) were significant (p ≤ 0.05), while between grain yield and leaf K concentration was non-significant (R2 = 0.32) (Figure 2).
Table 4.
Potassium concentration (%) in different plant parts, mobilization, and utilization by hybrid rice (var. Arize 6444) as influenced by potassium fertilization (means for 2016 and 2017).
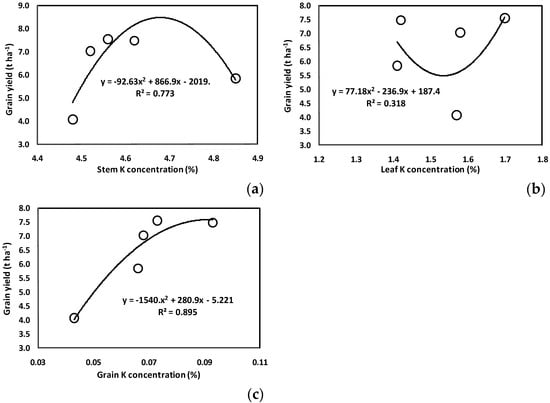
Figure 2.
Relationship between grain yield (t ha−1) and stem (a), leaf (b), and grain (c) K concentration (%).
3.4. K-Use Efficiency, Sustainable Yield Index, and Partial Factor Productivity
Potassium harvest index (KHI) in hybrid rice ranged from 1.29 to 2.96% at different K rates (Table 4). Potassium fertilization had a significant (p ≤ 0.05) influence on KHI of the tested hybrid, and it was maximum with 120 kg K2O ha−1, accounting for 130% higher KHI over the control. Theapplication rates of 30, 60, and 90 kg K2O ha-1 resulted in statistically at par KHI values. Potassium mobilization efficiency index (KMEI) in the tested hybrid rice cultivar ranged from 0.71 to 1.54% (Table 4), with significant (p ≤ 0.05) variation over control. Agronomic efficiency and physiological efficiency decreased with every incremental dose of K (Table 5). The KUE indices were highest at 30 kg K ha−1 and lowestat the highest K dose (120 kg K2O ha−1).
Table 5.
Potassium use efficiency, sustainable yield index, and partial factor productivity of hybrid rice as influenced by potassium fertilization (means for 2016 and 2017).
Overall trend shows that the SYI varied from 0.64 to 0.83 due to changes in K rates from 30 to 120 kg K2O ha−1 (Table 5). The highest value of SYI (0.83) was obtained with 30 kg K2O ha−1. Partial factor productivity (PFPK) decreased as the K ratesincreased from 30 to 120 kg K2O ha−1. As expected, the highest PFPK (191.33 kg grain kg−1 of K fertilizer) was recorded in plots with 30 kg K2O ha−1 and the lowest (62.42 kg grain kg−1 of K-fertilizer) was found at 120 kg K2O ha−1.
3.5. Post-Harvest Soil Status and K Balance Sheet
Significant changes in pH, EC, and available K in post-harvest soil was observed compared to their initial values (Figure 3). K application significantly reduced the soil pH (7.8 to 12.9% lower than the initial value) (Figure 3a). The EC of the post-harvest soil increased with K application beyond 30 kg K2O ha−1 (6.5 to 34.6% higher than initial value) (Figure 3b). The available K content in post-harvest soil samples improved significantly (p ≤ 0.05) over the initial value by 24 to 91% when the crop received K fertilization (Figure 3c). For better understanding of K gain or loss, we followed a balance sheet approach (Table 6). A positive balance of K in all plots was observed, irrespective of K rates. The actual net gain (+) of K in post-harvest soil was higher compared to the expected net gain.
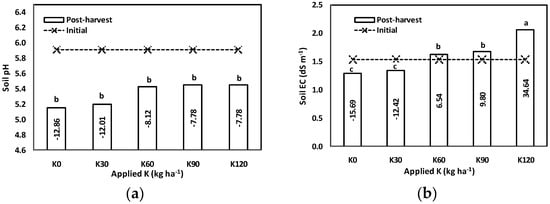
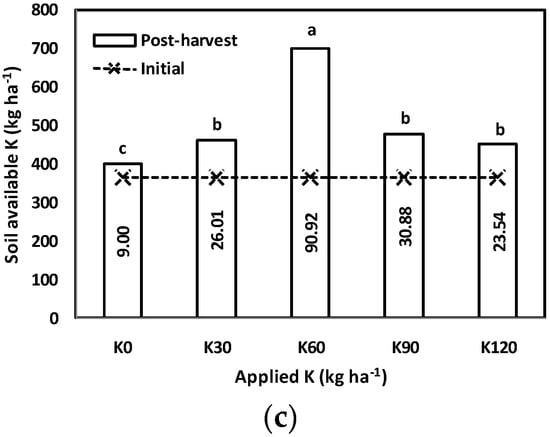
Figure 3.
Soil pH (a), EC (dS m−1) (b), and available K (kg ha−1) (c) at different levels of K (kg ha−1) (means followed by same letter are statistically at par, otherwise significantly different at p ≤ 0.05 by Tukey’s HSD (honest significant difference) test; data within bars are percent increase or decrease (−) in any parameter from its initial value).
Table 6.
Potassium balance in soil after harvesting of hybrid rice (var. Arize 6444) as influenced by potassium fertilization (means for 2016 and 2017).
3.6. Economic Returns
Higher profitability from hybrid rice was achieved with 90 kg K2O ha−1 due to higher net returns (US$ 452 ha−1) and BCRs (1.75) over other treatments (Table 7). Both higher (120 kg ha−1) and lower K rates (30 kg K2O ha−1) resulted in decline in net return and BCR. Both net return and BCR showed a sharp decline in the K omission treatment.
Table 7.
Economic analysis of hybrid rice (var. Arize 6444) cultivation as influenced by potassium fertilization (means for 2016 and 2017).
4. Discussion
The cultivation of hybrid rice using K rates applicable to high yielding varieties (HYVs) has failed to realize higher yields under any given conditions [12]. Thus, improved K management (particularly timing and splitting) for superior cultivarsis required to increase yield and KUE of hybrid rice. An uninterrupted supply of K during the entire crop growth period was found to be more effective as it increased growth parameters, yield attributes, yield, and KUE of rice hybrids [17]. The present study quantified the impact of K fertilization on growth, development, and yield of var. Arize 6444. In this study, leaf and grain dry matter (DM) at harvest and number of tillers hill−1 were highest at 120 kg K2O ha−1, followed by 90 kg K2O ha−1. This finding is supported by a previous study indicating improved growth parameters due to increase in K level [32]. Higher uptake of K in above-ground biomass with high dose of K might have resulted in larger canopy of the hybrid cultivar [33]. Another study has shown that macro and micronutrient uptake increased considerably under higher K application rates. Hence, increased apparent recovery of N, P, S, and Ca with higher K application rates could improve growth of rice hybrids [12]. Other investigators opined that significant (p ≥ 0.05) increase in total photosynthetic rate and net assimilation rate at heading and maturing stages with high K application might have led to greater DM production [34]. On the other hand, plants in control plots had lower DM accumulation. This result is in conformity with the findings of other investigators who observed increased total tillers, dry matter accumulation, and effective tillers with 75 kg K2O ha−1 [17].
We observed significant (p ≤ 0.05) beneficial effect of K fertilization on yield components of hybrid rice, mainly on number of filled and unfilled grains panicle−1 and panicle weight, and K application at 90 kg ha−1 had the best result. In line with our results, other investigators found that high levels of K significantly increased (p ≥ 0.05) panicle weight due to higher number of filled grains panicle−1 [35,36]. Potassium appeared to help enhance grain weight by delaying abscisic acid (ABA) peak by fourto fivedays, thereby delaying maturation and increasing carbohydrate translocation to the seeds [37]. The same study also reported that K application markedly reduced the number of unfilled spikelets due to its promoting effect on cytokinin synthesis, which resulted in less zygote degeneration.
The present study highlights that the number of filled grains panicle−1 and panicle weight were strongly associated with grain yield. This finding again confirms that productivity of crop is collectively determined by vegetative growth and its yield components. Better vegetative growth coupled with higher yield components might have resulted in higher grain and straw yield of hybrid rice [9,13,14,38]. In addition, limited supply of assimilates to the grains might be responsible for the reduced panicle weight at lower doses of K. The panicle length and test weight had non-significant contribution to grain yield. Several investigators identified the number of grains panicle−1 as the key yield components for higher grain yield in hybrids, rather than panicle number and panicle length [39]. Similar to the present study, other researchers also did not find any relation between test weight and grain yield of hybrid rice grown in the wet season [1].
The regression between K and grain yield indicated that the relationship was highly significant in the observed quadratic relationship (Figure 1). From the regression equation, the economic optimum level of K (Kopt) was derived as 101.5 kg K2O ha−1. Other investigators also used a similar approach for determining Kopt and found 80 kg K2O ha−1 as the best dose for hybrid rice in summer season at red and lateritic soils of Orissa [40]. Results are in accordance with earlier reports [17], wherein higher yield response of hybrid rice to K nutrition was found at 75 kg ha−1. However, in the salt affected soil the K requirement is higher as the soil salinity caused a reduction in growth and yield of rice and higher K is required for alleviation [41]. A study in a coastal saline soil of Bangladesh reported that the required K dose is more than 100 kg ha−1 to achieve hybrid rice yield of 4 t ha−1 [41], which is similar to the present study.
The K content of rice plant is an important index for obtaining higher grain yield of hybrid rice [42]. The regression study with grain yield as a dependent variable showed that the stem (R2 = 0.77) and grain K concentrations (R2 = 0.89) had positive significant relationship with yield. Strategies to increase stem and grain K concentration can thereby enhance grain yield. However, leaf K concentration was not a good indicator of the response of hybrid rice to K fertilization. Information regarding increase of both grain yield and KUE, as well as their relationship with K accumulation and utilization characteristics is limited. Only few earlier studies revealed higher K accumulation during the period from primary branch initiation to spikelet initiation [43]. About 45–67% of total K accumulation was observed from panicle initiation (PI) to heading stage. In addition, 50% of the K in leaf sheath might had been translocated to spikelets after heading which accounted for two-thirds of grain K concentration [43]. In the present study, Arize 6444 had high K accumulation both in vegetative (particularly leaf) and reproductive part (grain) at harvest with 90 and 120 kg K2O ha−1 that might have contributed significantly to high yield. Additionally, the higher K accumulation in its stems both at 60 DAT and harvest helped increase lodging resistance [44]. The present work has also shown that K omission treatment decreased K uptake, transfer and efficiency.
The KUE indices (agronomic efficiency and physiological efficiency) for the tested hybrid cultivar decreased with the increase in K from 30 to 120 kg ha−1, being maximum and minimum at 30 and 120 kg K2O ha−1, respectively. There was not much difference in SYI of hybrid rice due to variation in K fertilization. The fertilizer productivity, estimated as PFP, decreased with the increasing level of K fertilization. This indicates poor rate of K utilization at higher application rates. This might be due to the curvilinear return to the conversion of K to seed as yield approaches the ceiling at higher K-levels [24,45]. The fertilizer productivity decreased to a greater degree passing from 30 to 60 kg K2O ha−1 (PFP 117.33 kg grain kg−1 of K-fertilizer) than passing from 60 to 90 (PFP 84.00 kg grain kg−1 K) or 90 to 120 (PFP 62.42 kg grain kg−1 K). The results point to the advantage of using an optimum K rate that creates the right balance between efficiency and effectivity of applied K fertilizer.
The K balance in the post-harvest soil was positive for all the treatments. Interestingly, the net K balance was positive even for the K omission plots. Thepositive balance was driven by the high initial K level of the experimental soil (366 kg K2O ha−1). A recent study [46] from the same area revealed that the soils of the area are rich in illitic clays and are expected to release non-exchangeable K (NEK)effectively when under stress. The same study, through sequential extraction with boiling 1M HNO3, showed that the NEK release could be triggered at a relatively high activity coefficient (ARK) of K [46]. Such NEK release could augment the already high native K level in the soil and may explain the positive net K balance observed in our study. Crop response to K fertilizer application in soils with such high initial K level is not expected. However, every incremental dose of K over the zero-K treatment produced significant yield increases in this study, and the best yield was achieved at 90 kg K2O ha−1. This suggest that hybrid rice was unable to use the native K till K fertilizer application increased the activity of K to a sufficiently high level. Such K uptake restriction may happen when soils have high magnesium concentration relative to K concentration. The Mg-induced K deficiency in crops is well documented and can occur in soils with an available K/Mg concentration below 0.32 [47]. A recent assessment of K+/(Ca2+ + Mg2+) ratios in soils from two similar locations nearby our experimental sites indicated values less than 0.17 [46]. Such low values of the said ratio in our study area may create restriction to K uptake leading to hybrid rice yield losses when K fertilizer was not applied.
Application of 90 kg K2O ha−1 has been found to be economically effective, mainly because of increased grain yield realized at this K application rate. However, the economic optimum level of Kopt was derived from regression study as 101.5 kg K2O ha−1. On the contrary, the lowest net returns and BCR were found in K-omitted plots because of lower grain yield, resulting from a smaller number of filled grains panicle−1, short length of panicle and reduced panicle weight. This result corroborates the earlier studies that hybrid rice cultivars responded to K application appreciably, although economic efficiency of K declined at higher levels of application [9,32,33].
5. Conclusions
In the main rice growing areas of the coastal saline belt of West Bengal (India), productivity, and profitability of hybrid rice (var. Arize 6444) could be increased through site-specific K management practice. Our research confirms that adequate K application is necessary to obtain high grain yield in hybrid rice even though the soils of the coastal areas are high in illitic clay and high available K content. This explains why a K management strategy appropriate for HYVs may not work for hybrid rice. Our results also confirm that the present recommended level (40 kg K2O ha−1) is inadequate to support attainable yield potentials of hybrid rice. A rate of 101.5 kg K2O ha−1 (through muriate of potash/MOP) may be recommended to achieve higher productivity of hybrid rice during wet season in coastal region of West Bengal (India).
Author Contributions
H.B. and S.K.D. conceived and designed the experiment; H.B. and S.K.D. conducted the experiments; H.B. recorded the data; H.B. and K.R. analyzed the data; H.B. and K.R. wrote the paper; S.K.D., K.M., T.S., and J.T. reviewed, edited, and approved the final manuscript.
Funding
This work was funded by International Plant Nutrition Institute (IPNI), South-Asia Program.
Acknowledgments
Authors pay special thanks to Bidhan Chandra KrishiViswavidyalaya (BCKV), India, for giving the opportunity to conduct field experiment in their Research Farm. We are grateful to Pravat Kumar Maity, Ajay Kar, and GurupadaKhanra for managing the field experiments at Kakdwip, West Bengal. We also thank BiswanathHalder who carried out the chemical analysis for plant and soil samples at BCKV.
Conflicts of Interest
The authors declare no conflict of interest.
References
- Banerjee, H.; Pal, S. Effect of planting geometry and different levels of nitrogen on hybrid rice. Oryza 2011, 48, 274–275. [Google Scholar]
- Banerjee, H.; Chatterjee, S.; Sarkar, S.; Gantait, S.; Samanta, S. Evaluation of rapeseed-mustard cultivars under late sown condition in coastal ecosystem of West Bengal. J. Appl. Natl. Sci. 2017, 9, 940–949. [Google Scholar] [CrossRef]
- Asch, F.; Dingkuhn, M.; Wittstock, C.; Doerffling, K. Sodium and potassium uptake of rice panicles as affected by salinity andseason in relation to yield and yield components. Plant Soil 1999, 207, 133–145. [Google Scholar] [CrossRef]
- Castillo, E.G.; Tuong, T.P.; Ismail, A.M.; Inubushi, K. Response to Salinity in Rice: Comparative Effects of Osmotic and Ionic Stresses. Plant Prod. Sci. 2007, 10, 159–170. [Google Scholar] [CrossRef]
- Aslam, M.; Qureshi, R.H.; Ahmad, N. A rapid screening technique for salt tolerance in rice (Oryza sativa L.). Plant Soil 1993, 150, 99–107. [Google Scholar] [CrossRef]
- Mondal, P.; Pal, S.; Alipatra, A.; Mandal, J.; Banerjee, H. Comparative study on growth and yield of promising rice cultivars during wet and dry season. Plant Arch. 2012, 12, 659–662. [Google Scholar]
- Islam, M.R.; Sarker, M.R.A.; Sharma, N.; Rahman, M.A.; Collard, B.C.Y.; Gregorio, G.B.; Ismail, A.M. Assessment of adaptability of recently released salt tolerant rice varieties in coastal regions of South Bangladesh. Field Crop. Res. 2016, 190, 34–43. [Google Scholar] [CrossRef]
- Adhikari, B.; Bag, M.K.; Bhowmick, M.K.; Kundu, C. Status Paper on Rice in West Bengal. In Rice Knowledge Management Portal (RKMP); Directorate of Rice Research: Hyderabad, India, 2011. [Google Scholar]
- Banerjee, H.; Pal, S. Response of hybrid rice to nutrient management during wet season. Oryza 2012, 49, 108–111. [Google Scholar]
- Khandkar, V.; Gandhi, V.P. Post-adoption experience of hybrid rice in India: Farmers’ satisfaction and willingness to grow. Agric. Econ. Res. Rev. 2018, 31, 95–104. [Google Scholar] [CrossRef]
- Singh, A.; Kumar, B.; Baghel, R.; Singh, R. Sustainability of hybrid rice technology vis a vis inbred rice in Uttar Pradesh. Ind. Res. J. Ext. Educ. 2009, 9, 22–25. [Google Scholar]
- Pattanayak, S.K.; Mukhi, S.K.; Majumdar, K. Potassium unlocks the potential for hybrid rice. Better Crop. 2008, 92, 8–9. [Google Scholar]
- Mondal, S.; Mallikarjun, M.; Ghosh, M.; Ghosh, D.C.; Timsina, J. Effect of Integrated Nutrient Management on Growth and Productivity of Hybrid Rice. J. Agric. Sci. Technol. 2015, 297–308. [Google Scholar]
- Mondal, S.; Mallikarjun, M.; Ghosh, M.; Ghosh, D.C.; Timsina, J. Influence of integrated nutrient management (INM) on nutrient use efficiency, soil fertility and productivity of hybrid rice. Arch. Agron. Soil Sci. 2016. [Google Scholar] [CrossRef]
- Fageria, N.K.; Sant’ana, E.P.; Morais, O.P.; de Morais, O.P. Response of promising upland rice genotypes to soil fertility. Pesqui. Agropecu. Bras. 1995, 30, 1155–1161. [Google Scholar]
- Shi, H.; Zhang, X.H.; Pan, X.H.; Guo, J.Y.; Zhang, P. Studies on the characteristics of potassium absorption and yield formation on early hybrid rice. Acta Agric. Univ. JiangXiensis 1990, 12, 54–59. [Google Scholar]
- Meena, S.L.; Singh, S.; Shivay, Y.S. Response of hybrid rice (Oryza sativa) to nitrogen and potassium application. Ind. J. Agron. 2002, 47, 207–211. [Google Scholar]
- Prasad, K.; Chauhan, R.P.S. Efficiency of potassium under rainfed lowland rice. Ann. Plant Soil Res. 1999, 1, 52–57. [Google Scholar]
- Jackson, M.L. Soil Chemical Analysis; Prentice Hall of India Pvt. Ltd.: New Delhi, India, 1967. [Google Scholar]
- Dewis, J.; Freitas, F. Physical and Chemical Methods of Soil and Water Analysis. In Soil Bulletin; FAO: Rome, Italy, 1984. [Google Scholar]
- Subbiah, B.; Asija, G.L. A rapid procedure for the estimation of available N in soils. Curr. Sci. 1956, 25, 259–260. [Google Scholar]
- Olsen, S.R.; Cole, C.V.; Watanale, F.S.; Dean, L.A. Estimation of Available Phosphorus in Phosphorus in Soils by Extraction with Sodium Bicarbonate; United States Department of Agriculture: Washington, DC, USA, 1954.
- Hanway, J.J.; Heidel, H. Soil analysis methods as used in Iowa State College Soil Testing Laboratory. Iowa Agric. 1952, 57, 1–13. [Google Scholar]
- Sarangi, S.K.; Maji, B.; Singh, S.; Sharma, D.K.; Burman, D.; Mandal, S.; Haefele, S.M. Using improved variety and management enhances rice productivity in stagnant flood-affected tropical coastal zones. Field Crop. Res. 2016, 190, 70–81. [Google Scholar] [CrossRef]
- Jackson, M.L. Soil Chemical Analysis; Prentice Hall of India Pvt. Ltd.: New Delhi, India, 1973; pp. 38–56. [Google Scholar]
- Sharma, N.K.; Singh, R.J.; Kumar, K. Dry matter accumulation and nutrient uptake by wheat (Triticumaestivum L.) under poplar (Populusdeltoides) based agroforestry system. ISRN Agron. 2012, 2012, 359673. [Google Scholar]
- Fageria, N.K. Nitrogen harvest index and its association with crop yields. J. Plant Nutr. 2014, 37, 795–810. [Google Scholar] [CrossRef]
- Sarkar, S.; Banerjee, H.; Ray, K.; Ghosh, D. Boron fertilization effects in processing grade potato on an inceptisol of West Bengal, India. J. Plant Nutr. 2018, 41, 1456–1470. [Google Scholar] [CrossRef]
- Mozumder, M.; Banerjee, H.; Ray, K.; Paul, T. Evaluation of potato (Solanumtuberosum) cultivars for productivity, N requirement and eco-friendly indices under different nitrogen levels. Ind. J. Agron. 2014, 59, 327–335. [Google Scholar]
- Vittal, K.P.R.; MaruthiSankar, G.R.; Singh, H.P.; Samra, J.S. Sustainability of Practices of Dryland Agriculture: Methodology and Assessment. Available online: http://www.crida.in/AICRPDA/Sustainability.pdf (accessed on 4 October 2018).
- Rana, R.; Banerjee, H.; Dutta, S.K.; Ray, K.; Majumdar, K.; Sarkar, S. Management practices of macronutrients for potato for smallholder farming system at alluvial soil (Entisols) of India. Arch. Agron. Soil Sci. 2017, 63, 1963–1976. [Google Scholar] [CrossRef]
- Maiti, S.; Saha, M.; Banerjee, H.; Pal, S. Integrated nutrient management under hybrid rice—Hybrid rice (Oryza sativa) cropping sequence. Ind. J. Agron. 2006, 51, 157–159. [Google Scholar]
- Banerjee, H.; Pal, S. Integrated nutrient management for rice-rice cropping system. Oryza 2009, 46, 32–36. [Google Scholar]
- Fan, M.; Ge, D.Z. Potassium nutrition in hybrid rice. Int. Rice Res. Newsl. 1987, 12, 21. [Google Scholar]
- Thakur, R.B.; Pandey, S.K.; Singh, H. Contribution of production factors on yield of midland rice. Oryza 1994, 31, 271–293. [Google Scholar]
- Bhowmick, N.; Nayak, R.L. Response of hybrid rice (Oryza sativa L.) varieties to nitrogen, phosphorus and potassium fertilizers during dry (boro) season in West Bengal. Ind. J. Agron. 2000, 45, 323–326. [Google Scholar]
- Yuan, L.; Huang, J.G. Effects of potassium on the variation of plant hormones in developing seeds of hybrid rice. J. South West Agric. Univ. 1993, 15, 38–41. [Google Scholar]
- Dwivedi, A.P.; Dixit, R.S.; Singh, G.R. Effect of nitrogen, phosphorus and potassium levels on growth, yield and quality of hybrid rice (Oryza sativa L.). Oryza 2006, 43, 64–66. [Google Scholar]
- Om, H.; Katyal, S.K.; Dhiman, S.D. Effect of time of transplanting and rice (Oryza sativa) hybrids on growth and yield. Ind. J. Agron. 1997, 42, 261–264. [Google Scholar]
- Das, L.K.; Panda, S.C. Economics of hybrid rice cultivation as influenced by nitrogen and potassium levels. J. Res. Orissa Univ. Agric. Technol. 2002, 20, 50–52. [Google Scholar]
- Kibria, M.G.; Farhad; Hoque, M.A. Alleviation of soil salinity in rice by potassium and zinc fertilization. Int. J. Exp. Agric. 2015, 5, 15–21. [Google Scholar]
- Li, M.; Zhang, H.; Yang, X.; Ge, M.; Ma, Q.; Wei, H.; Dai, Q.; Huo, Z.; Xu, K.; Luo, D. Accumulation, and utilization of nitrogen, phosphorus and potassium of irrigated rice cultivars with high productivities and high N use efficiencies. Field Crop. Res. 2014, 161, 55–63. [Google Scholar] [CrossRef]
- Huang, Y.M.; Li, Y.Z.; Zheng, J.S.; Zhung, Z.L. Studies on the NPK accumulation and transfer of high yielding colony of hybrid rice. J. Fujian Acad. Agric. Sci. 1997, 12, 1–6. [Google Scholar]
- Yang, C.; Yang, L.; Yan, T.; Ou-Yang, Z. Effects of nutrient and water regimes on lodging resistance of rice. Chin. J. Appl. Ecol. 2004, 15, 646–650, (In Chinese with English abstract). [Google Scholar]
- Premi, O.P.; Rathore, S.S.; Shekhawat, K.; Kandpal, B.K.; Chauhan, J.S. Sustainability of fallow-Indian mustard (Brassica juncea) system as influenced by green manure, mustard straw cycling and fertilizer application. Ind. J. Agron. 2012, 57, 229–234. [Google Scholar]
- Sarkar, G.K.; Chattopadhyay, A.P.; Sanyal, S.K. Release pattern of non-exchangeable potassium reserves in Alfisols, Inceptisols and Entisols of West Bengal, India. Geoderma 2013, 207–208, 8–14. [Google Scholar] [CrossRef]
- Hannan, J.M. Potassium-Magnesium Antagonism in High Magnesium Vineyard Soils. Available online: https://lib.dr.iastate.edu/etd/12096 (accessed on 24 May 2018).
© 2018 by the authors. Licensee MDPI, Basel, Switzerland. This article is an open access article distributed under the terms and conditions of the Creative Commons Attribution (CC BY) license (http://creativecommons.org/licenses/by/4.0/).