Improving High-Latitude Rice Nitrogen Management with the CERES-Rice Crop Model

 ,
,  ,
,
Abstract
1. Introduction
2. Materials and Methods
2.1. Study Site Description
2.2. Field Management
2.3. Plant Sampling and Measurements
2.4. Model Calibration and Evaluation
2.5. Weather Type Classification
2.6. Estimating Long-Term, Economically Optimum N Rates for Varieties and Different Weather Types
2.7. Evaluation of Different N Management Strategies
3. Results and Discussion
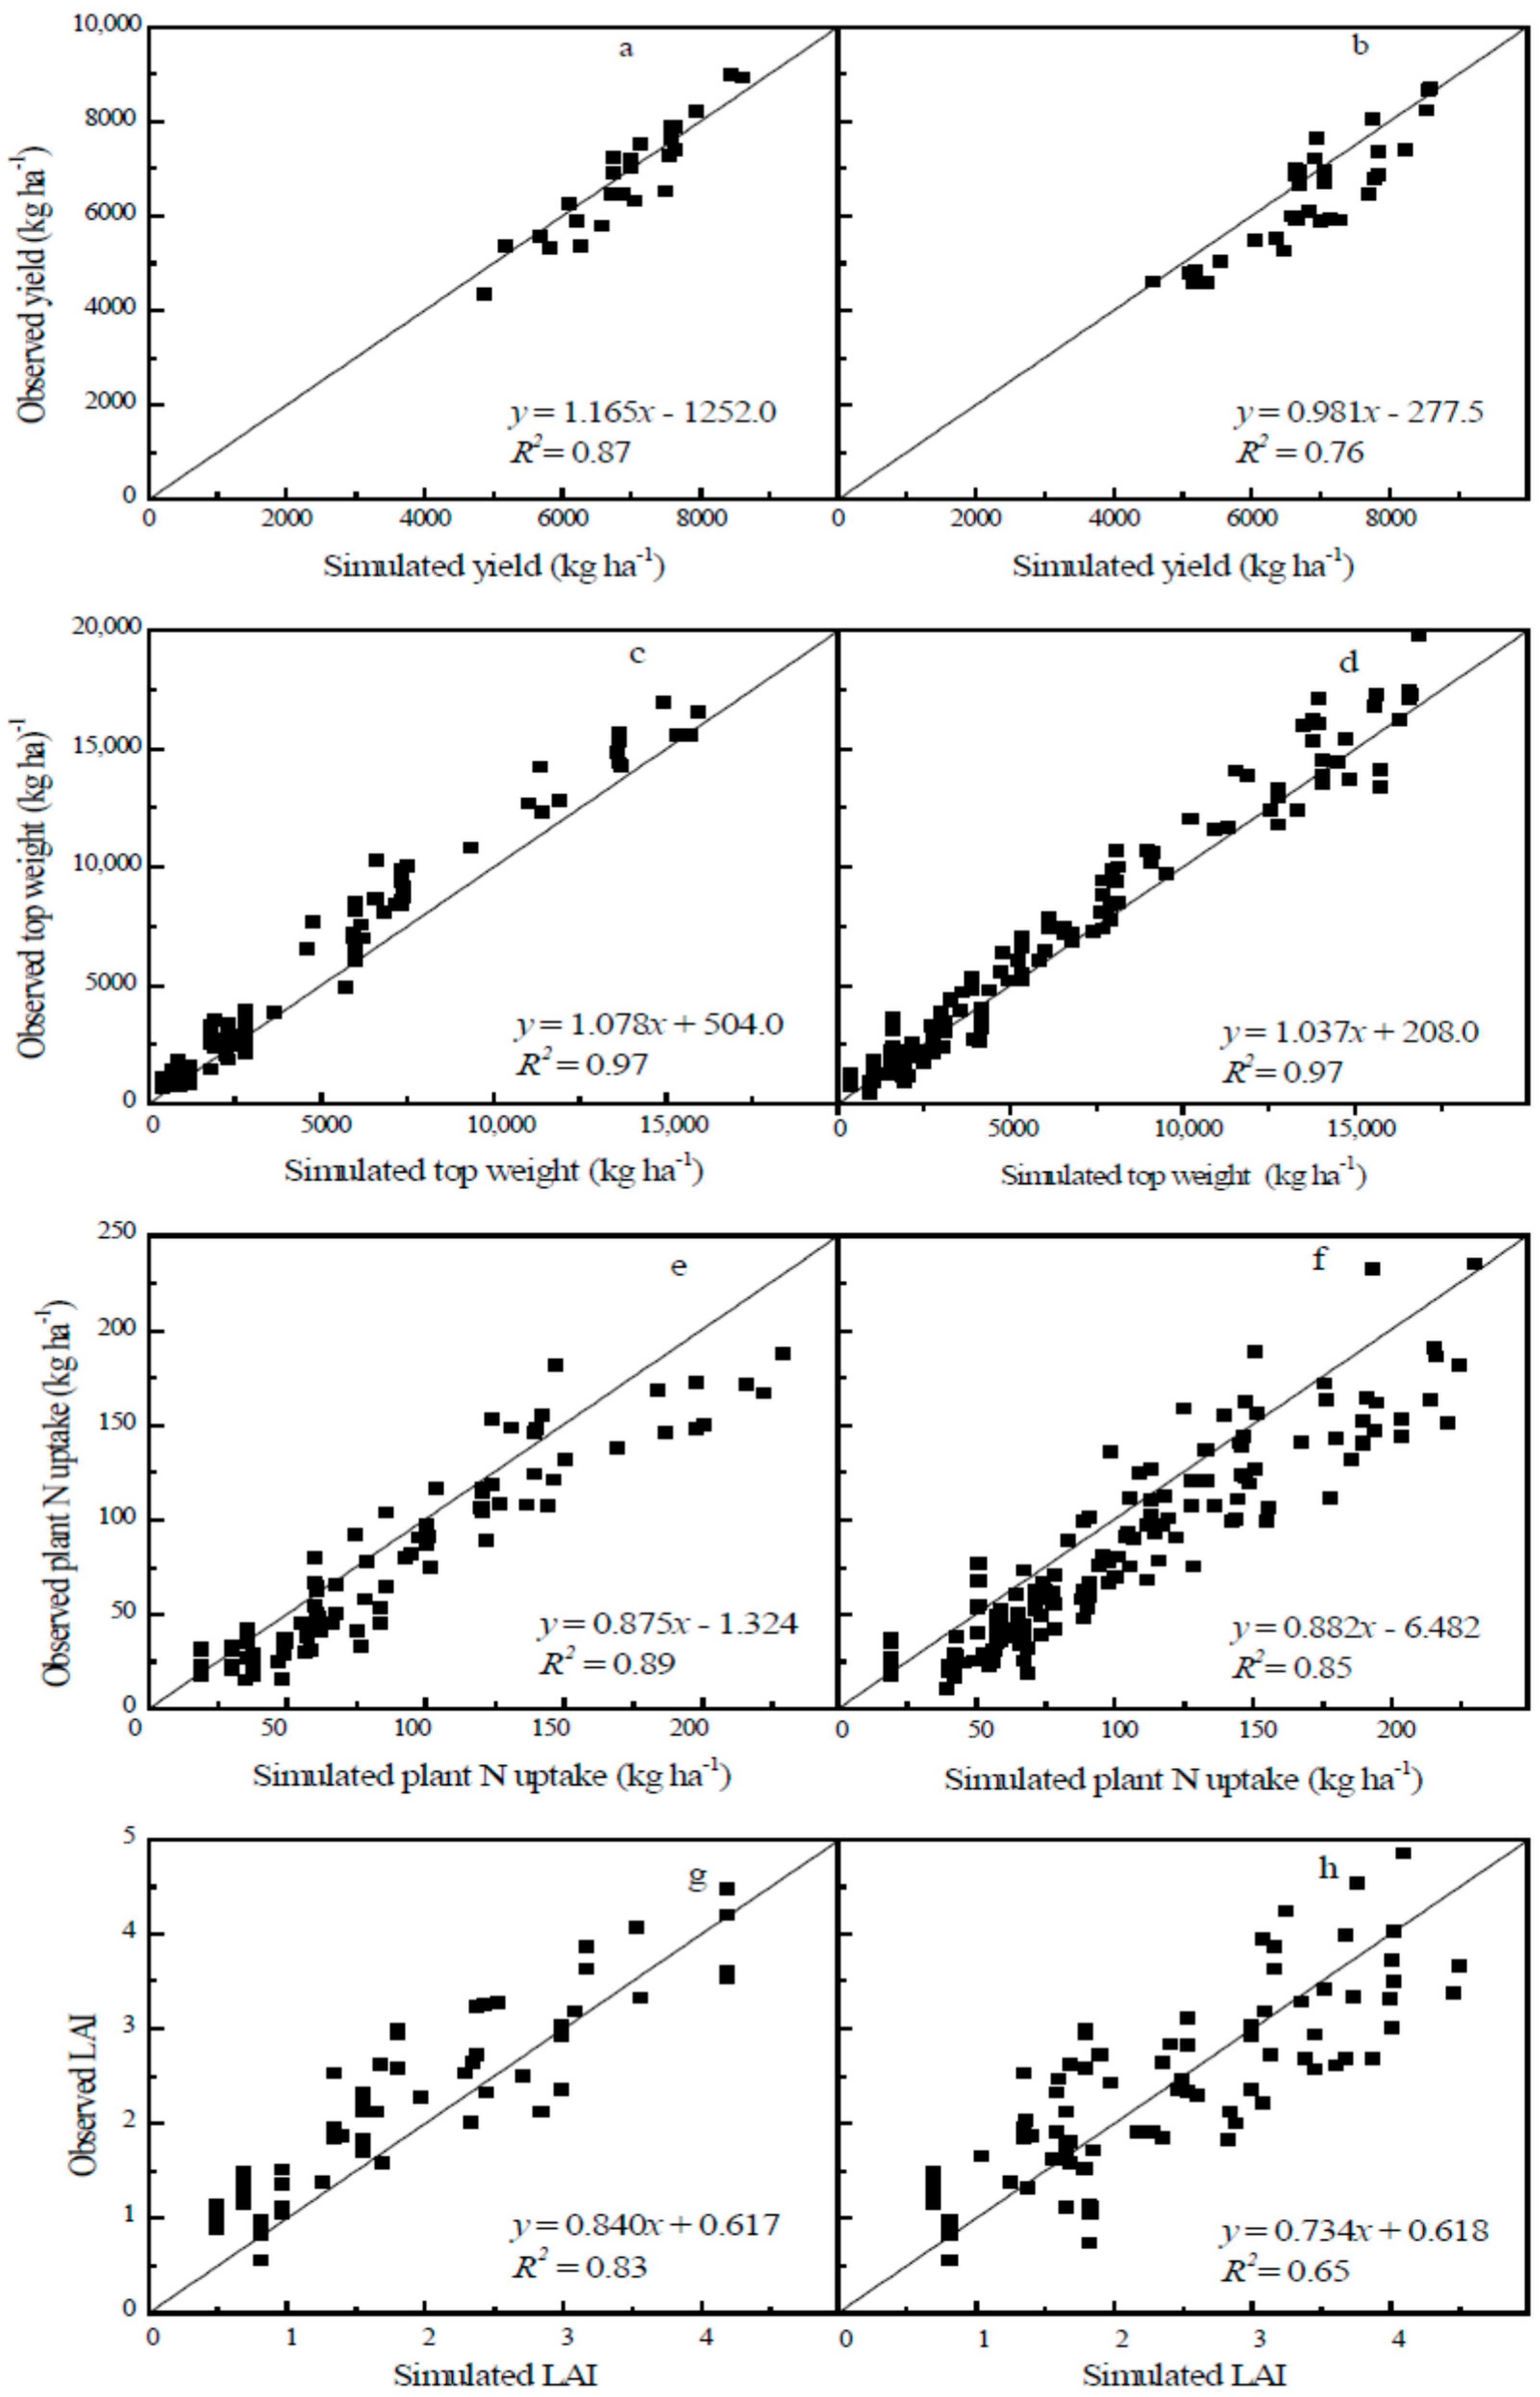
3.1. Model Calibration and Evaluation
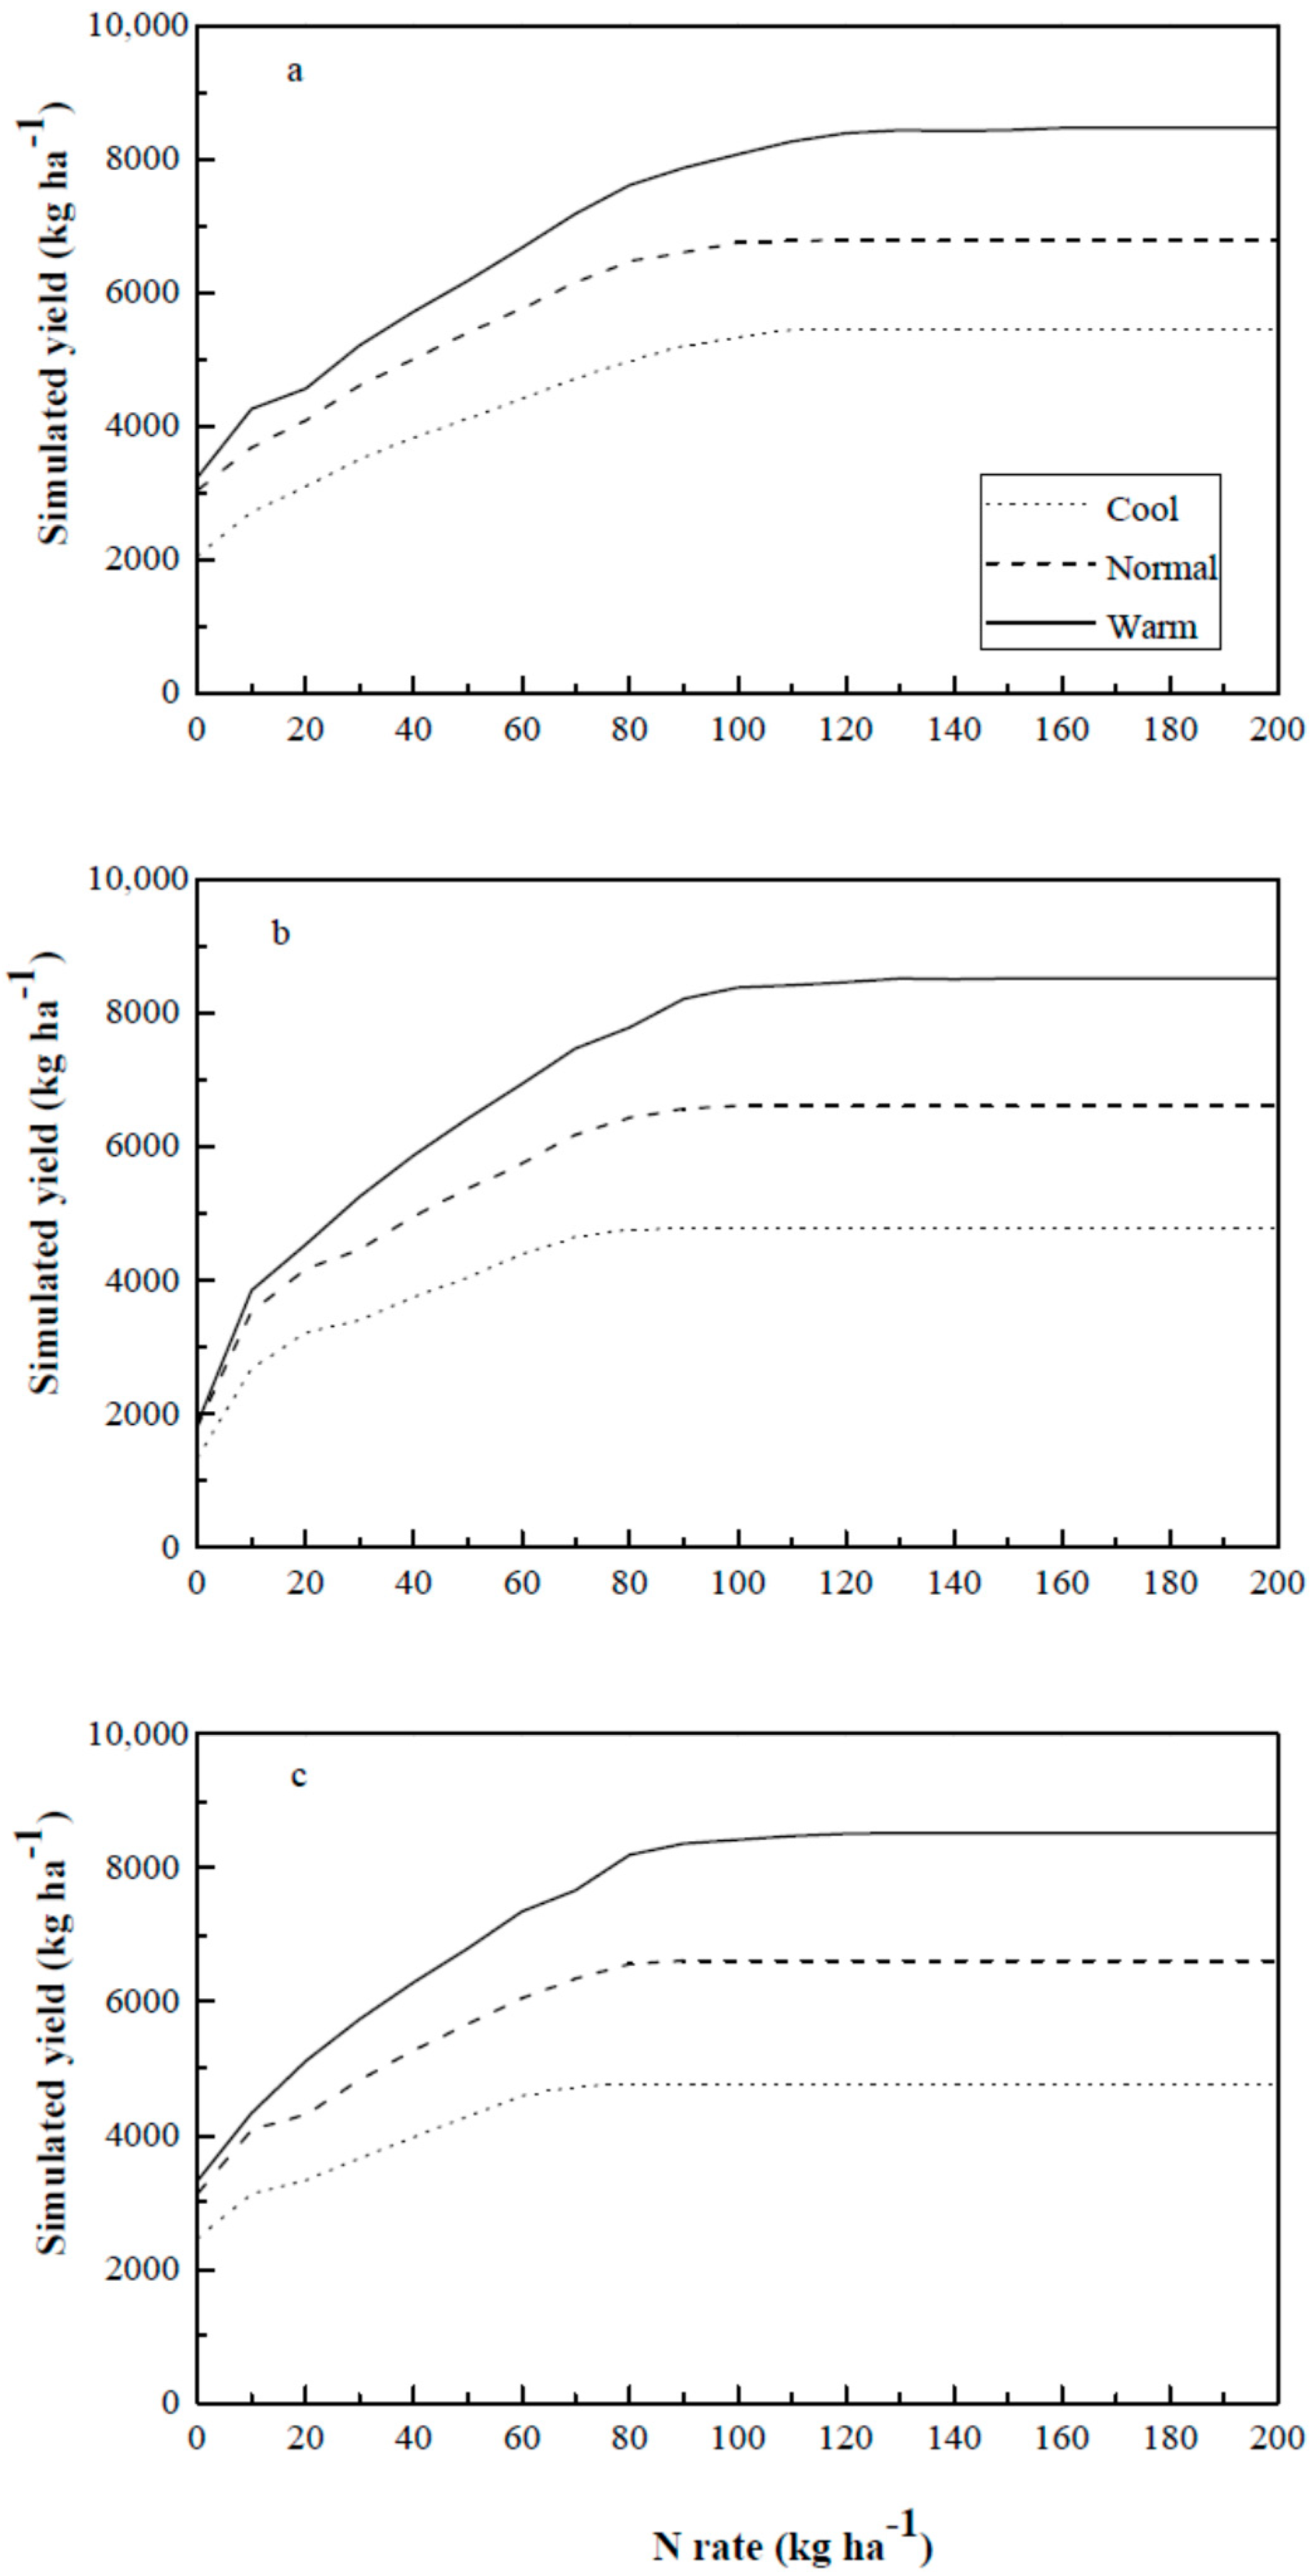
3.2. Simulating Economically Optimum N Rates and Yields of Three Varieties Under Three Weather Types
3.3. Evaluating Different N Management Strategies
3.4. Implications for Rice N Management
4. Conclusions
Author Contributions
Funding
Acknowledgments
Conflicts of Interest
References
- Seck, P.A.; Diagne, A.; Mohanty, S.; Wopereis, M.C.S. Crops that feed the world 7: Rice. Food Secur. 2012, 4, 7–24. [Google Scholar] [CrossRef]
- Peng, S.; Buresh, R.J.; Huang, J.; Zhong, X.; Zou, Y.; Yang, J.; Wang, G.; Liu, Y.; Hu, R.; Tang, Q.; et al. Improving nitrogen fertilization in rice by site-specific N management—A review. Agron. Sustain. Dev. 2010, 30, 649–656. [Google Scholar] [CrossRef]
- Pan, G.X.; Li, L.Q.; Wu, L.S.; Zhang, X.H. Storage and sequestration potential of topsoil organic carbon in China’s paddy soils. Glob. Chang. Biol. 2003, 10, 79–92. [Google Scholar] [CrossRef]
- Zhao, G.; Miao, Y.; Wang, H.; Su, M.; Fan, M.; Zhang, F.; Jiang, R.; Zhang, Z.; Liu, C.; Liu, P. A preliminary precision rice management system for increasing both grain yield and nitrogen use efficiency. Field Crops Res. 2013, 154, 23–30. [Google Scholar] [CrossRef]
- Su, M.; Huang, S.; Zhao, G.; Zhao, Q.; Yao, Y.; Miao, Y. Current rice management practices of farmers in Heilongjiang land reclamation area and improvement strategies. North. Rice 2012, 42, 28–33, (In Chinese with English Abstract). [Google Scholar]
- Cao, Q.; Miao, Y.; Wang, H.; Huang, S.; Cheng, S.; Khosla, R.; Jiang, R. Non-destructive estimation of rice plant nitrogen status with Crop Circle multispectral active canopy sensor. Field Crops Res. 2013, 154, 133–144. [Google Scholar] [CrossRef]
- Cui, Z.; Chen, X.; Zhang, F. Development of regional nitrogen rate guidelines for intensive cropping systems in China. Agron. J. 2013, 105, 1411–1416. [Google Scholar] [CrossRef]
- Wu, L.; Chen, X.; Cui, Z.; Wang, G.; Zhang, W. Improving nitrogen management via a regional management plan for Chinese rice production. Environ. Res. Lett. 2015, 10. [Google Scholar] [CrossRef]
- Cao, Q.; Miao, Y.; Feng, G.; Gao, X.; Liu, B.; Liu, Y.; Li, F.; Khosla, R.; Mulla, D.J.; Zhang, F. Improving nitrogen use efficiency with minimal environmental risks using an active canopy sensor in a wheat-maize cropping system. Field Crops Res. 2017, 214, 365–372. [Google Scholar] [CrossRef]
- Flowers, M.; Weisz, R.; Heiniger, R.; Osmond, D.; Crozier, C. In-season optimization and site-specific nitrogen management for soft red winter wheat. Agron. J. 2004, 96, 124–134. [Google Scholar] [CrossRef]
- Miao, Y.; Mulla, D.J.; Batchelor, W.D.; Paz, J.O.; Robert, P.C. Evaluating management zone optimal N rates with a crop growth model. Agron. J. 2006, 98, 545–553. [Google Scholar] [CrossRef]
- Miao, Y.; Mulla, D.J.; Hernandez, J.A.; Wiebers, M.; Robert, P.C. Potential impact of precision nitrogen management on corn yield, protein content, and test weight. Soil Sci. Soc. Am. J. 2007, 71, 1490–1499. [Google Scholar] [CrossRef]
- Huang, S.; Miao, Y.; Zhao, G.; Yuan, F.; Ma, X.; Tan, C.; Yu, W.; Gnyp, M.L.; Lenz-Wierdemann, V.I.S.; Rascher, U.; et al. Satellite remote sensing-based in-season diagnosis of rice nitrogen status in Northeast China. Remote Sens. 2015, 7, 10646–10667. [Google Scholar] [CrossRef]
- Lu, J.; Miao, Y.; Shi, W.; Li, J.; Yuan, F. Evaluating different approaches to non-destructive nitrogen status diagnosis of rice using portable RapidSCAN active canopy sensor. Sci. Rep. 2017, 7. [Google Scholar] [CrossRef] [PubMed]
- Mulla, D.J.; Miao, Y. Precision Farming. In Land Resources Monitoring, Modeling, and Mapping with Remote Sensing; Thenkabail, P.S., Ed.; CRC Press: Boca Raton, FL, USA, 2016. [Google Scholar]
- Batchelor, W.D.; Basso, B.; Paz, J.O. Examples of strategies to analyze spatial and temporal yield variability using crop models. Eur. J. Agron. 2002, 18, 141–158. [Google Scholar] [CrossRef]
- Thorp, K.R.; Batchelor, W.D.; Paz, J.O.; Steward, B.L.; Caragea, P.C. Methodology to link production and environmental risks of precision nitrogen management strategies in corn. Agric. Syst. 2006, 89, 272–298. [Google Scholar] [CrossRef]
- Sala, S.; van Es, H.M.; Moebius-Clune, B.N.; Marjerison, R.; Moeblus-Clune, D.; Schindelbeck, R.; Severson, K.; Young, E. Dynamic model improves agronomic and environmental outcomes for maize nitrogen management over static approach. J. Environ. Qual. 2017, 46, 311–319. [Google Scholar] [CrossRef] [PubMed]
- Hoogenboom, G.; Jones, J.W.; Porter, C.H.; Wilkens, P.W.; Boote, K.J.; Hunt, L.A.; Tsuji, G.Y. Decision Support System for Agrotechnology Transfer Version 4.5; Volume 1: Overview; University of Hawaii: Honolulu, HI, USA, 2010. [Google Scholar]
- Link, E.J.; Graeff, S.S.; Batchelor, W.D.; Claupein, W. Evaluating the economic and environmental impact of a German compensation payment policy under uniform and variable-rate nitrogen management strategies using a crop model. Agric. Syst. 2006, 91, 135–153. [Google Scholar] [CrossRef]
- Link, E.J.; Graeff, S.; Batchelor, W.D. Evaluation of current and model-based site-specific nitrogen applications on wheat (Triticum aestivum L.) yield and environmental quality. Precis. Agric. 2008, 9, 251–267. [Google Scholar] [CrossRef]
- Paz, J.O.; Batchelor, W.D.; Colvin, T.S.; Logsdon, S.D.; Kaspar, T.C.; Karlen, D.L.; Babcock, B.A.; Pautsch, G.R. Model-based techniques to determine variable rate nitrogen for corn. Agric. Syst. 1999, 60, 69–75. [Google Scholar] [CrossRef]
- Paz, J.O.; Batchelor, W.D.; Jones, J.W. Estimating potential economic return for variable rate soybean variety management. Trans. ASAE 2003, 46, 1225–1234. [Google Scholar]
- Cheyglinted, S.; Ranamukhaarachchi, S.L.; Singh, G. Assessment of the CERES-Rice model for rice production in the central plain of Thailand. J. Agric. Sci. 2001, 137, 289–298. [Google Scholar] [CrossRef]
- Singh, H.; Singh, K.N.; Hasan, B. Evaluation of CERES-Rice model (V. 4.0) under temperate conditions of Kashmir Valley, India. Cereal Res. Commun. 2007, 35, 1723–1732. [Google Scholar] [CrossRef]
- Vilayvong, S.; Banterng, P.; Patanothai, A.; Pannangpetch, K. Evaluation of CSM-CERES-Rice in simulating the response of lowland rice cultivars to nitrogen application. Aust. J. Crop Sci. 2012, 6, 1534–1541. [Google Scholar]
- Yao, F.; Xu, Y.; Feng, Q.; Lin, E.; Yan, X. Simulation and validation of CERES-rice model in main rice ecological zones in China. Acta Agron. Sin. 2015, 31, 545–550. [Google Scholar]
- Ahmad, S.; Ahmad, A.; Tojo Soler, C.M.; Ali, H.; Zia-Ul-Haq, M.; Anothai, J.; Hussain, A.; Hoogenboom, G.; Hasanuzzaman, M. Application of the CSM-CERES-Rice model for evaluation of plant density and nitrogen management of fine transplanted rice for an irrigated semiarid environment. Precis. Agric. 2012, 13, 200–218. [Google Scholar] [CrossRef]
- Gerardeaux, E.; Giner, M.; Ramanantsoanirina, A.; Dusserre, J. Positive effects of climate change on rice in Madagascar. Agron. Sustain. Dev. 2012, 32, 619–627. [Google Scholar] [CrossRef]
- Yan, M.; Deng, W.; Chen, P. Climate change in the Sanjiang Plain disturbed by large-scale reclamation. J. Geogr. Sci. 2002, 12, 405–412. [Google Scholar]
- Zhou, Z.; Liu, T. The current status, threats and protection way of Sanjiang Plain wetland, northeast China. J. For. Res. 2005, 16, 148–152. [Google Scholar]
- Bo, J.H.; Wang, K.R.; Chu, Z.D.; Chen, B.; Li, S.K. Comparative study on the measure methods of the leaf area. J. Shihezi Univ. 2005, 23, 216–218. [Google Scholar]
- Iwata, F. Heat Unit Concept of Crop Maturity, Physiological Aspects of Dry Land Farming; Gupta, U.S., Ed.; Oxford and IBH Publishers: New Delhi, India, 1984; pp. 351–370. [Google Scholar]
- Gao, L.; Jin, Z.; Huang, Y.; Zhang, L. Rice clock model: A computer model into simulate rice development. Agric. For. Meteorol. 1992, 60, 1–16. [Google Scholar] [CrossRef]
- Basso, B.; Liu, L.; Ritchie, J.T. A Comprehensive Review of the CERES-Wheat, -Maize and -Rice Models’ Performances. Adv. Agron. 2016, 136, 27–132. [Google Scholar]
- Zhang, F.S.; Chen, X.P.; Chen, Q. Guidelines for Fertilization in Northeast China. Guide to Fertilization for Major Crops in China; China Agricultural University Press: Beijing, China, 2009; pp. 48–53. [Google Scholar]
- Wang, X.; Xu, S. Experimental study on the effect of climate warming on soil fertilizer and fertilizer efficiency. Meteorology 1996, 22, 12–16, (In Chinese with English Abtract). [Google Scholar]
- Gao, J.; Liu, Y. Climate warming and land use change in Heilongjiang Province, Northeast China. Appl. Geogr. 2011, 31, 476–482. [Google Scholar] [CrossRef]
- Yang, X.; Lin, E.; Ma, S.; Ju, H.; Guo, L.; Xiong, W.; Li, Y.; Xu, Y. Adaptation of agriculture to warming in Northeast China. Clim. Chang. 2007, 84, 45–58. [Google Scholar] [CrossRef]
- Saleque, M.A.; Naher, U.A.; Choudhury, N.N.; Hossain, A.T.M.S. Variety-specific nitrogen fertilizer recommendation for lowland rice. Commun. Soil Sci. Plant Anal. 2005, 35, 1891–1903. [Google Scholar] [CrossRef]
- Miao, Y.; Mulla, D.J.; Robert, P.C.; Hernandez, J.A. Within-field variation in corn yield and grain quality responses to nitrogen fertilization and hybrid selection. Agron. J. 2006, 98, 129–140. [Google Scholar] [CrossRef]
- Yao, Y.; Miao, Y.; Huang, S.; Gao, L.; Ma, X.; Zhao, G.; Jiang, R.; Chen, X.; Zhang, F.; Yu, K.; et al. Active canopy sensor-based precision N management strategy for rice. Agron. Sustain. Dev. 2012, 32, 925–933. [Google Scholar] [CrossRef]


| Cultivar Coefficient | Definition | Longjing 21 | Longjing 31 | Kongyu 131 |
|---|---|---|---|---|
| P1 | Time period expressed as growing degree days (GDD) 1 from emergence during which the plant is not responsive to photoperiod | 209 | 161.5 | 184.5 |
| P2O | Critical photoperiod at which the development occurs at the maximum rate (hours) | 13 | 13 | 13 |
| P2R | Extent to which phasic development leading to panicle initiation is delayed for each hour increase in photoperiod above P2O (GDD) | 5 | 5 | 5 |
| P5 | GDD from beginning of grain filling to physiological maturity | 620 | 540 | 545 |
| G1 | Potential spikelet number per g main culm | 90 | 86 | 90 |
| G2 | Single grain weight under ideal growing conditions, mg | 0.027 | 0.027 | 0.027 |
| G3 | Tillering coefficient relative to IR64 cultivar under ideal conditions | 0.9 | 0.9 | 1 |
| G4 | Temperature tolerance coefficient. | 1 | 1 | 1 |
| PHINT | Phyllochron interval, °C | 70 | 74 | 80 |
| Variety | Parameter | Calibration | Evaluation | ||||
|---|---|---|---|---|---|---|---|
| R2 | Mean | RMSE | R2 | Mean | RMSE | ||
| Longjing 21 | Yield (kg ha−1) | 0.71 | 6520 | 550 | 0.80 | 6197 | 758 |
| Plant N uptake (kg ha−1) | 0.91 | 72 | 22 | 0.83 | 85 | 29 | |
| Top weight (kg ha−1) | 0.98 | 5507 | 993 | 0.96 | 7036 | 1094 | |
| Leaf area index | 0.90 | 2.29 | 0.47 | 0.64 | 2.60 | 0.62 | |
| Longjing 31 | Yield (kg ha−1) | 0.80 | 6370 | 306 | 0.74 | 6068 | 632 |
| Plant N uptake (kg ha−1) | 0.88 | 61 | 15 | 0.85 | 75 | 26 | |
| Top weight (kg ha−1) | 0.97 | 4214 | 1594 | 0.97 | 5989 | 1158 | |
| Leaf area index | 0.85 | 2.31 | 0.69 | 0.73 | 2.00 | 0.58 | |
| Kongyu 131 | Yield (kg ha−1) | 0.95 | 7259 | 359 | 0.85 | 6283 | 403 |
| Plant N uptake (kg ha−1) | 0.88 | 86 | 23 | 0.92 | 70 | 27 | |
| Top weight (kg ha−1) | 0.98 | 6287 | 1268 | 0.98 | 5275 | 672 | |
| Leaf area index | 0.71 | 2.49 | 0.90 | 0.70 | 1.74 | 0.50 | |
| Variety | Economically Optimum N Rate | |||
|---|---|---|---|---|
| Mean (kg ha−1) | Max. (kg ha−1) | Min. (kg ha−1) | CV (%) | |
| Longjing 21 | 119 | 180 | 80 | 18 |
| Longjing 31 | 100 | 170 | 50 | 19 |
| Kongyu 131 | 91 | 160 | 50 | 23 |
| Weather Type | Economically Optimum N Rate | |||
|---|---|---|---|---|
| Mean (kg ha−1) | Max. (kg ha−1) | Min. (kg ha−1) | CV (%) | |
| Cool | 99 | 160 | 50 | 20 |
| Normal | 100 | 170 | 60 | 22 |
| Warm | 115 | 180 | 70 | 24 |
| Variety Weather Type | Economically Optimum N Rate | ||||
|---|---|---|---|---|---|
| Mean (kg ha−1) | Max. (kg ha−1) | Min. (kg ha−1) | CV (%) | ||
| Longjing 21 | Cool | 114 | 160 | 80 | 17 |
| Normal | 114 | 170 | 90 | 24 | |
| Warm | 134 | 180 | 90 | 18 | |
| Longjing 31 | Cool | 94 | 110 | 50 | 18 |
| Normal | 98 | 150 | 70 | 19 | |
| Warm | 111 | 170 | 70 | 23 | |
| Kongyu 131 | Cool | 88 | 100 | 50 | 16 |
| Normal | 87 | 150 | 60 | 23 | |
| Warm | 101 | 160 | 70 | 26 | |
| Strategy | N rate (kg ha−1) | Variety | Weather Type | MNR ($ ha−1) | PFP(N) (kg kg−1) | Yield (kg ha−1) |
|---|---|---|---|---|---|---|
| FP | 150 | Longjing 21 | 2938 | 48.3 | 7238 | |
| Longjing 31 | 2792 | 44.5 | 6668 | |||
| Kongyu 131 | 2791 | 44.4 | 6665 | |||
| Average | 2840 | 45.7 | 6857 | |||
| RONM | 120 | Kongjing 21 | 2920 | 57.8 | 6931 | |
| Longjing 31 | 2800 | 55.4 | 6651 | |||
| Longyu 131 | 2794 | 55.3 | 6636 | |||
| Average | 2838 | 56.2 | 6739 | |||
| WSNM | 100 | Longjing 21 | Normal | 2712 | 64.2 | 6424 |
| Longjing 31 | Normal | 2634 | 62.4 | 6242 | ||
| Kongyu 131 | Normal | 2624 | 62.2 | 6218 | ||
| 115 | Longjing 21 | Warm | 3225 | 66.4 | 7633 | |
| Longjing 31 | Warm | 3106 | 64.0 | 7358 | ||
| Kongyu 131 | Warm | 3088 | 63.6 | 7316 | ||
| Average | 2826 | 63.5 | 6694 | |||
| VSNM | 119 | Longjing 21 | 3097 | 58.2 | 6931 | |
| 100 | Longjing 31 | 2770 | 65.5 | 6548 | ||
| 91 | Kongyu 131 | 2769 | 72.0 | 6556 | ||
| Average | 2879 | 65.3 | 6678 | |||
| WVNM | 114 | Longjing 21 | Normal | 2739 | 57.0 | 6502 |
| 134 | Longjing 21 | Warm | 3288 | 58.2 | 7801 | |
| 98 | Longjing 31 | Normal | 2625 | 63.3 | 6206 | |
| 111 | Longjing 31 | Warm | 3072 | 65.4 | 7262 | |
| 87 | Kongyu 131 | Normal | 2622 | 71.4 | 6211 | |
| 101 | Kongyu 131 | Warm | 3077 | 72.1 | 7285 | |
| Average | 2831 | 64.4 | 6706 |
© 2018 by the authors. Licensee MDPI, Basel, Switzerland. This article is an open access article distributed under the terms and conditions of the Creative Commons Attribution (CC BY) license (http://creativecommons.org/licenses/by/4.0/).
Share and Cite
Zhang, J.; Miao, Y.; Batchelor, W.D.; Lu, J.; Wang, H.; Kang, S. Improving High-Latitude Rice Nitrogen Management with the CERES-Rice Crop Model. Agronomy 2018, 8, 263. https://doi.org/10.3390/agronomy8110263
Zhang J, Miao Y, Batchelor WD, Lu J, Wang H, Kang S. Improving High-Latitude Rice Nitrogen Management with the CERES-Rice Crop Model. Agronomy. 2018; 8(11):263. https://doi.org/10.3390/agronomy8110263
Chicago/Turabian StyleZhang, Jing, Yuxin Miao, William D. Batchelor, Junjun Lu, Hongye Wang, and Shujiang Kang. 2018. "Improving High-Latitude Rice Nitrogen Management with the CERES-Rice Crop Model" Agronomy 8, no. 11: 263. https://doi.org/10.3390/agronomy8110263
APA StyleZhang, J., Miao, Y., Batchelor, W. D., Lu, J., Wang, H., & Kang, S. (2018). Improving High-Latitude Rice Nitrogen Management with the CERES-Rice Crop Model. Agronomy, 8(11), 263. https://doi.org/10.3390/agronomy8110263