Article

Green Manuring Effect on Changes of Soil Nitrogen Fractions, Maize Growth, and Nutrient Uptake

1
Graduate School, Chinese Academy of Agricultural Sciences, Beijing 100081, China
2
Key Laboratory of Plant Nutrition and Fertilizer, Ministry of Agriculture and Rural Affairs/Institute of Agricultural Resources and Regional Planning, Chinese Academy of Agricultural Sciences, Beijing 100081, China
3
Institute of Soil & Fertilizer and Resources & Environment, Jiangxi Academy of Agricultural Sciences, Nanchang 330200, China
*
Author to whom correspondence should be addressed.
Agronomy 2018, 8(11), 261; https://doi.org/10.3390/agronomy8110261
Submission received: 10 September 2018 / Revised: 8 November 2018 / Accepted: 9 November 2018 / Published: 12 November 2018
(This article belongs to the Special Issue Fertilizer Application on Crop Yield)

Abstract

:
Green manure is a promising, at least partial, substitution for chemical fertilizer in agriculture, especially for nitrogen (N), which in soil can be radically changed by exogenous input. However, it is not well understood how, after green manure incorporation, soil N changes coordinate with crop N uptake and consequently contribute to fertilizer reduction in a maize–green manure rotation. A four-year field study was performed consisting of (1) control, no fertilization; (2) F100, recommended inorganic fertilization alone; (3) G, green manure incorporation alone; (4) F70 + G (70% of F100 plus G); (5) F85 + G; and (6) F100 + G. The results show that treatments with 15–30% reduction of inorganic fertilizer (i.e., F70 + G and F85 + G) had similar grain yield, dry matter (DM) accumulation, and N uptake as F100 treatment. F100 + G maize had 17% greater DM and 15% more N uptake at maturity relative to F100. Of the five soil N fractions examined, dissolved organic N (DON) and mineral N (Nmin) explained over 70% of the variation of maize DM and N accumulation. Partial least squares path modeling further revealed that soil N fractions had positive indirect effects on DM production through N uptake, which might be coordinated with improved DON and Nmin status at both early and mid-late stages of maize growth. Overall, the results highlight enhanced maize production with reduced fertilizer inputs based on green manure incorporation in temperate regions.

1. Introduction

Improving crop yield and nutrient use efficiency simultaneously is challenging due to the increasing demand for food and intensifying environmental issues [1,2]. To pursue higher crop yields, farmers in some intensive agriculture areas of China apply excessively high rates of nitrogen (N) and phosphorous (P) fertilizer. The annual N fertilizer input in a maize–wheat cropping system in North China is up to 588 kg ha−1 year−1, which far exceeds levels in the United States and Northern European countries [3]. However, the substantial inputs do not reliably maintain the expected yields [3,4]. The ratio of an average farmer’s yield-to-yield potential is 0.41 [5], which illuminates a large yield gap for maize in this region. Much of the applied N fertilizer is lost to the environment [6], through nitrates leaching to groundwater [7] and greenhouse gas emissions [8]. Thus, it is of great importance to produce more grain yield with less environmental impact, e.g., lower nutrient losses [3,4].
Substitution of inorganic fertilizer by green manure has been adopted to reduce chemical inputs in agriculture [9,10]. Winter green manure Orychophragmus violaceus (OV)-maize rotation is an innovative eco-agricultural practice in the North China Plain, where OV is cultivated during the winter–spring fallow season (September to April) and well matched with the sowing of maize [11,12]. It is an alternative to maize-fallow or maize-wheat rotation that consumes plenty of groundwater and causes severe nutrient losses during the winter wheat season [13]. Integrated incorporation of OV residues with chemical fertilizers has been practiced to reduce nitrogen losses and improve grain yield and N economy in maize [11,12]. OV belongs to the Brassicaceae family, without the ability to fix atmospheric N2, but it can trap residual nitrate and reduce N leaching losses. Other members of the Brassicaceae family have been found to have extensive rooting depth, which has been shown to correlate with soil N depletion [10,14]. Therefore, in green manure-based systems, both inputs and losses of inorganic N fertilizer could be decreased [15,16,17]. In addition, previous studies have shown that, although OV crop is less capable than legume green manure Vicia villosa of enhancing soil N availability, the total ecological service value is slightly greater for OV crops (by 3.5%) in terms of succeeding crop production, greenhouse gas and air pollutant reduction, water and soil conservation, and soil nutrient improvement [18]. The green manure-maize rotation may give farmers less gross return relative to wheat-maize rotation, while it is ecologically beneficial for sustainable development, at least outperforming maize-fallow rotation [18].
The effects of green manuring on crop growth and nutrient utilization are associated with an improvement in soil physiochemical properties, such as bulk density, water conductivity, and carbon and N levels [10,19]. Increasing N use efficiency in crop production highly depends on the synchrony between crop N demand and supply from various sources through the growing season [4,20]. A model-driven integrated soil-crop management system has been well established for maize production in the North China Plain based on the timing of in-season soil N monitoring and application [4], while many farmers are still applying N as basal fertilizer for maize in practice, leading to N losses and a mismatch between N supply and crop demand [6]. A previous study using 15N isotope technique showed that with the combination of green manure and fertilizer, N supply is greatly consistent with maize N requirements at different stages [11]. This is associated with the concept that green manure N could potentially be retained longer in soil when combined with inorganic N [11,21], implying coordinated effects of green manure incorporation on N uptake in maize. However, it is still not well understood how the coordination is processed between maize N uptake and soil N changes after OV incorporation.
The changes of soil N pools after green manure incorporation involve transformations between soil N fractions, such as microbial biomass N, dissolved organic N, and mineral N. The positive effect of green manure incorporation on succeeding crop growth is proposed to relate to the stimulated microbial processes. Along with nitrate and ammonium, dissolved organic N is another soluble N source for microbes or plant uptake [22]. These three components are recognized as active fractions in soil N cycling and closely associated with plant N uptake [23]. Given the crucial role of soil N fractions in influencing crop N utilization, the objective of this study was to investigate the temporal changes of soil N fractions after OV incorporation and their effects on subsequent maize growth and N uptake in an OV-maize rotation system.

2. Materials and Methods

2.1. Field Experiments

The field experiments were carried out from 14 September 2008, to 13 August 2012, at the Wanzhuang Experimental Station (116°35’ E, 39°34’ N), Chinese Academy of Agricultural Sciences, China, on calcareous sandy soil. Before the start of the field experiment, maize was cultivated followed by a fallow season each year. Soil background properties at 0–20 cm depth were: organic matter 4.16 g kg−1, pH (H2O) 8.39, soil total N 0.34 g kg−1, Olsen-P 4.20 mg kg−1, and NH4OAc-K 73.0 mg kg−1. Green manure Orychophragmus violaceus L. (OV) was planted in September and incorporated into the soil the following April at its full blooming stage, followed by maize (hybrid Zhengdan 958) cultivation from May to August each year. The total yearly precipitation was 514 mm, with 70% distributed in June, July, and August based on a 30-year average from 1981 to 2010 (http://data.cma.cn/). Starting from October 2010 (the third cycle of OV-maize rotation), in-season meteorological data were recorded until the end of the experiment (Figure 1).
The following regimes of inorganic fertilization or green manure incorporation were followed, as given in Table 1: (1) control, no fertilizer application and no OV incorporation; (2) F100, the recommended fertilizer rate, alone; (3) G, incorporation of green manure OV alone; (4) F70 + G (70% of F100 plus G); (5) F85 + G (85% of F100 plus G); and (6) F100 + G. The 6 treatments were imposed on a randomized complete block design with 4 replications. Each treatment was in the same plot in all study years. Each plot was 4.8 m long and 2.4 m wide. The fertilizer rate of F100 was recommended by the National Soil Testing and Fertilization Recommendation Project on a yield basis for farmers in this region of China, which was also consistent with other reports [4,24]. Amounts of 225 kg N ha−1, 49 kg P ha−1, and 94 kg K ha−1 were applied as urea, super phosphate, and potassium sulfate, respectively. A half rate of N and full rates of P and K were applied as base fertilizer before sowing, and the remaining half rate of N was top-dressed at maize tasseling. Maize seedlings were hand-thinned to a stand of 75,000 plants ha−1.
No fertilizer was applied during the OV growth. Green manure OV was grown in situ and incorporated from 2008 to 2011, while part of the OV residues was imported to the field with an OV incorporation amount of 22,500 kg/ha in 2012 (Table 2). That year, the biomass of green manure in some of the plots, such as in treatment G, was extremely low. To investigate the effects of green manure incorporation, certain amounts of OV residues were introduced from an adjacent field. The water content of fresh OV residues for incorporation ranged from 83.4% to 87.5%, and the carbon (C), N, P, and K concentrations were, respectively, 38.2%, 2.38–3.36%, 0.33–0.51%, and 3.32–3.53% on a dry weight basis in different years. Fresh OV residues were incorporated into 0–20 cm soil 8 days before maize sowing each year. The total amounts of OV incorporation and nutrients introduced each year are listed in Table 2. The C/N ratio of decomposing OV residues in maize season (from OV incorporation to maize maturity) ranged from 9.7 to 15.3, with an average of 13 [25].

2.2. Sampling and Measurements

Maize grain yield was measured based on the entire plot every year, while the dynamics of soil N fractions and their effects on maize N uptake were investigated in the final year, 2012. Plants and 0–20 cm soils were sampled at the V3 (third leaf fully expanded), V8 (eighth leaf fully expanded), VT (tasseling), R3 (milk), and R6 (physiological maturity) stages of maize growth. Soil samples at the maize tasseling stage were taken before the second N application. At each harvest, 3 uniform and randomly selected maize plants from each plot were cut at the stem base. The shoot parts were dried at 70 °C to a constant weight, weighed, and ground to a fine powder. Around 0.2 g of plant material was used to determine total N concentration using a modified Kjeldahl digestion method [26]. The remaining digests were used for analysis of total P concentration (molybdivanadate method) by automated colorimetry [27] and total K concentration by a flame photometer [28].
Soil N fractions were analyzed as follows: (1) Soil total N content was measured with a Kjeldahl method [29]. (2) Soil mineral N (Nmin = NO3-N + NH4+-N) was extracted with 2 mol L−1 KCl and measured with continuous flow analysis (Seal AA3, Norderstedt, Germany). (3) Soil organic N: soil samples were extracted by 2 mol L−1 KCl (soil-to-solution ratio 1:5, w:v) for 60 min. The supernatant was carefully discarded, and the soil was re-extracted by 2 mol L−1 KCl (soil-to-solution ratio 1:2.5, w:v) for 20 min and centrifuged, and the supernatant was removed. The pellet soil was washed with distilled water by shaking for 20 min, dried at 60 °C, and analyzed for N content with the Kjeldahl method [29]. (4) The fumigation extraction method was used to determine soil microbial biomass N (SMBN) [30]. Briefly, each fresh soil sample was divided into 6 subsamples (equivalent to 25 g oven-dried weight). Three unfumigated subsamples were immediately extracted with 100 mL 0.5 M K2SO4 on a rotary shaker at 220 rpm for 30 min and then filtered through Whatman qualitative filter paper. The remaining 3 subsamples were fumigated with alcohol-free chloroform for 24 h at 25 °C, and then extracted and filtered as described above. Soil filtrates were stored at −20 °C prior to N assay. The SMBN content was calculated by the N differences between fumigated and unfumigated samples with a conversion factor of 0.54 [30]. (5) The soil dissolved organic N (DON) content was expressed as the difference between total dissolved N content and Nmin content, extracted with 0.5 M K2SO4 and 2 M KCl, respectively, using the method by Jones and Willett [31].

2.3. Statistical Analysis

Data were subjected to analysis of variance using PROC ANOVA with SAS package 9.1 (SAS Institute, Cary, NC, USA). The management of OV incorporation and/or fertilizer application was treated as a fixed effect and replications as random factors. The least significant difference (LSD) was used to determine treatment differences at a p < 0.05 level of probability.
The relative weight analysis and partial least squares path modeling (PLS-PM) were performed in R with “relweights” [32] and “plspm” [33] packages, respectively. Pooled data from 120 samples across treatments and stages were used for the analysis. The PLS-PM model path used 1000 bootstraps to validate the estimates of path coefficients and the coefficients of determination (r2). The direct effects were represented by path coefficients, indicating the direction and strength of the linear relationships between variables. Indirect effects were the sum of multiplied path coefficients between a predictor and a response variable except the direct effect. Path model was evaluated using the goodness of fit statistic to measure its overall predictive power.

3. Results

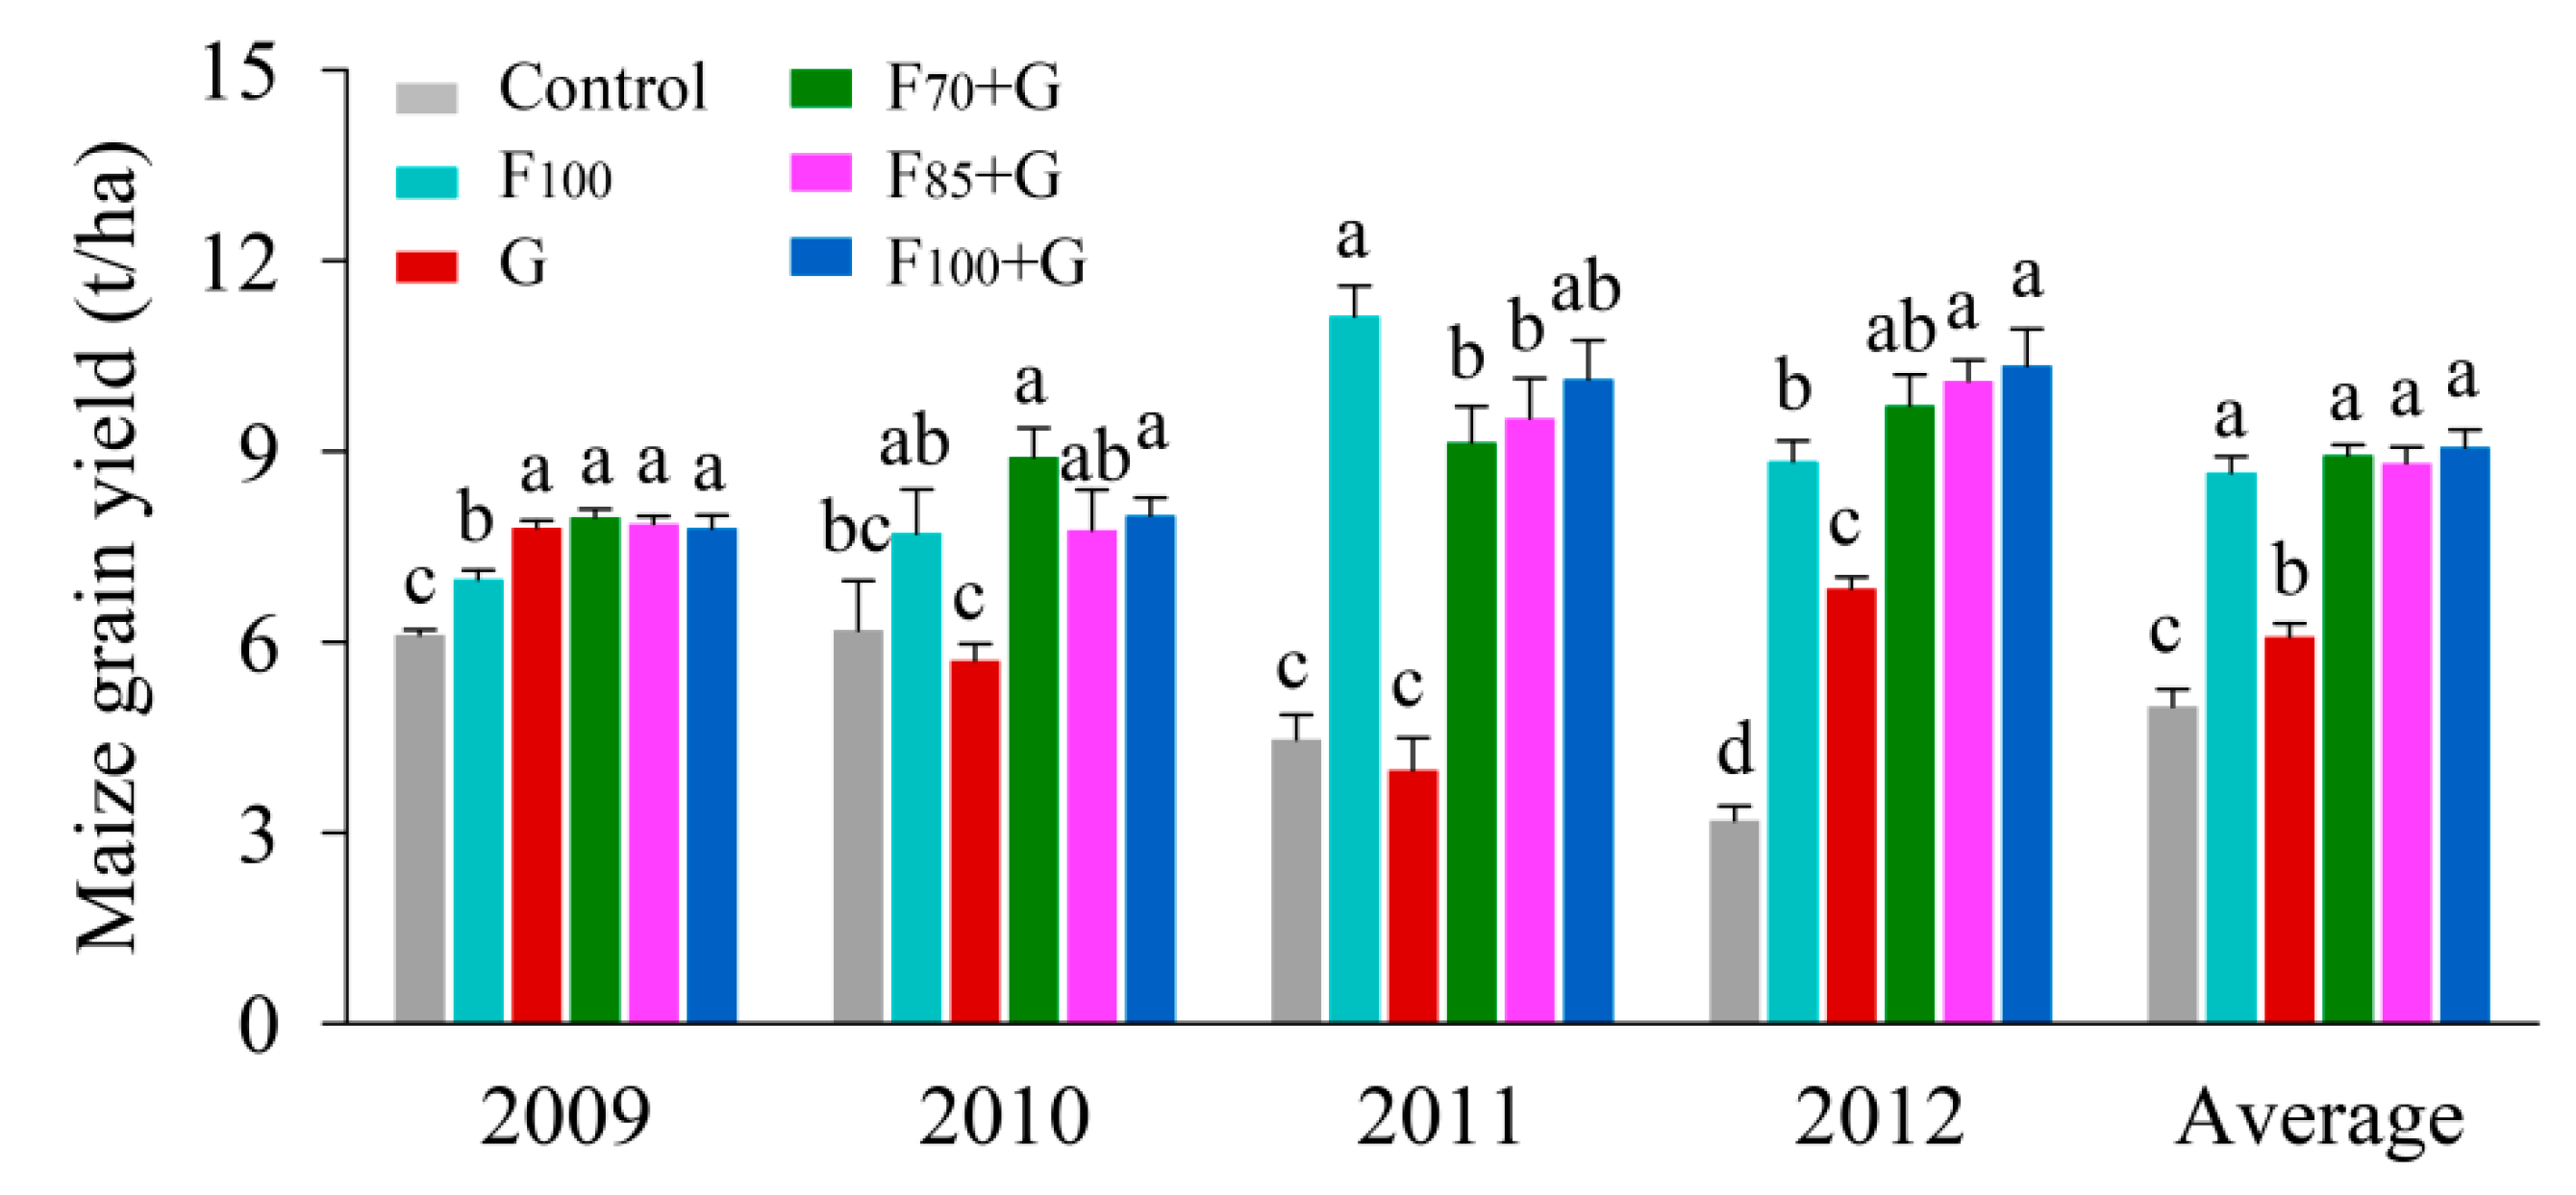
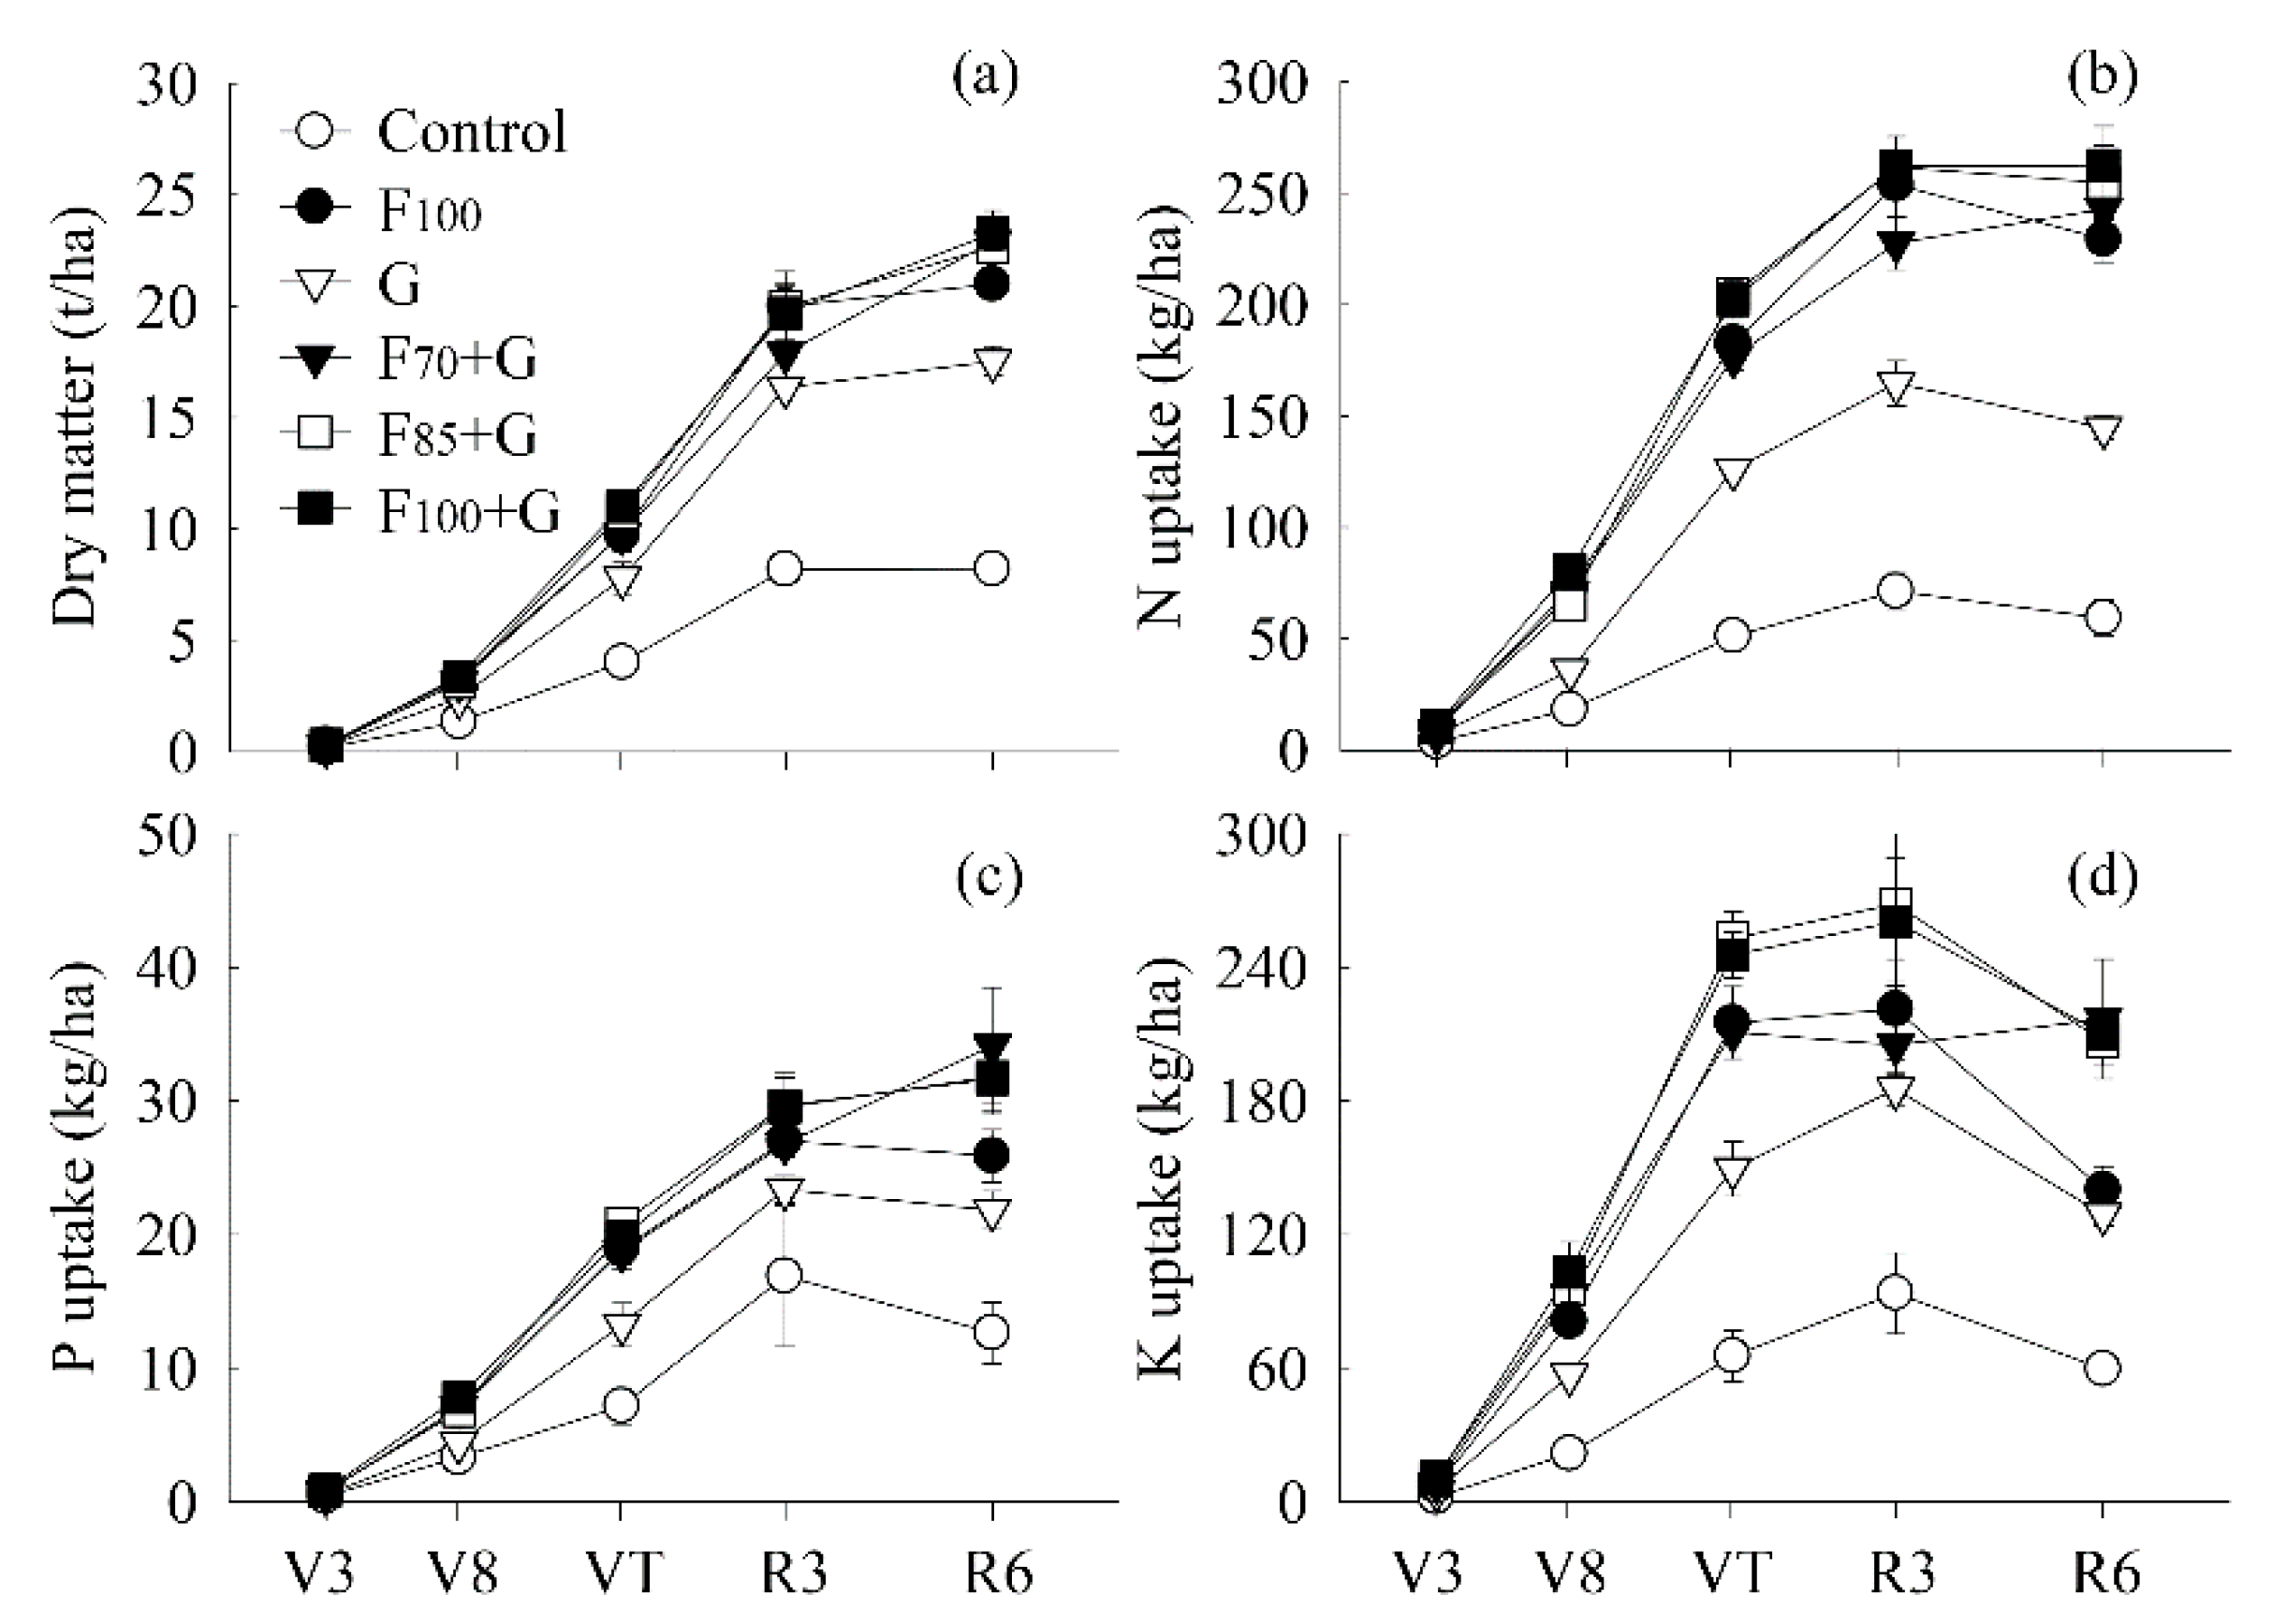
3.1. Effects of OV Incorporation on Maize Growth, Yield, and Nutrient Uptake

High variability was observed between years (p = 0.0013), as well as between treatments (p < 0.0001) and years by treatment (p < 0.0001) (Figure 2). Maize grain yield in the control without fertilization declined from 6.1 to 3.2 t ha−1 over the years, implying an unsustainable development of maize production (Figure 2). Compared to the control, the average grain yield was 22% greater in the G treatment, and was further increased by the F plus G combinations (p < 0.05; Figure 2). On average, similar grain yield around 9 t ha−1 was observed in the F100, F70 + G, and F85 + G treatments.
Dry matter (DM) accumulation and N uptake in the G treatment were 28–114% and 83% to 146% greater, respectively, than the control across maize developmental stages, but were still far lower than other F plus G treatments (Figure 3a,b). No significant differences were detected between F100, F70 + G, and F85 + G treatments. Compared to F100, maize plants in the F100 + G treatment had 17% greater DM accumulation and 15% more N uptake at maturity, respectively (p < 0.05; Figure 3a,b). In addition, the P and K uptake in G-treated maize was 0.7- and 1.2-fold greater, respectively, than in the control plants. F70 + G, F85 + G, and F100 + G treatments had similar P uptake compared to F100 treatment, while K uptake was significantly increased by 55%, 48%, and 50%, respectively, at maturity (Figure 3c,d).

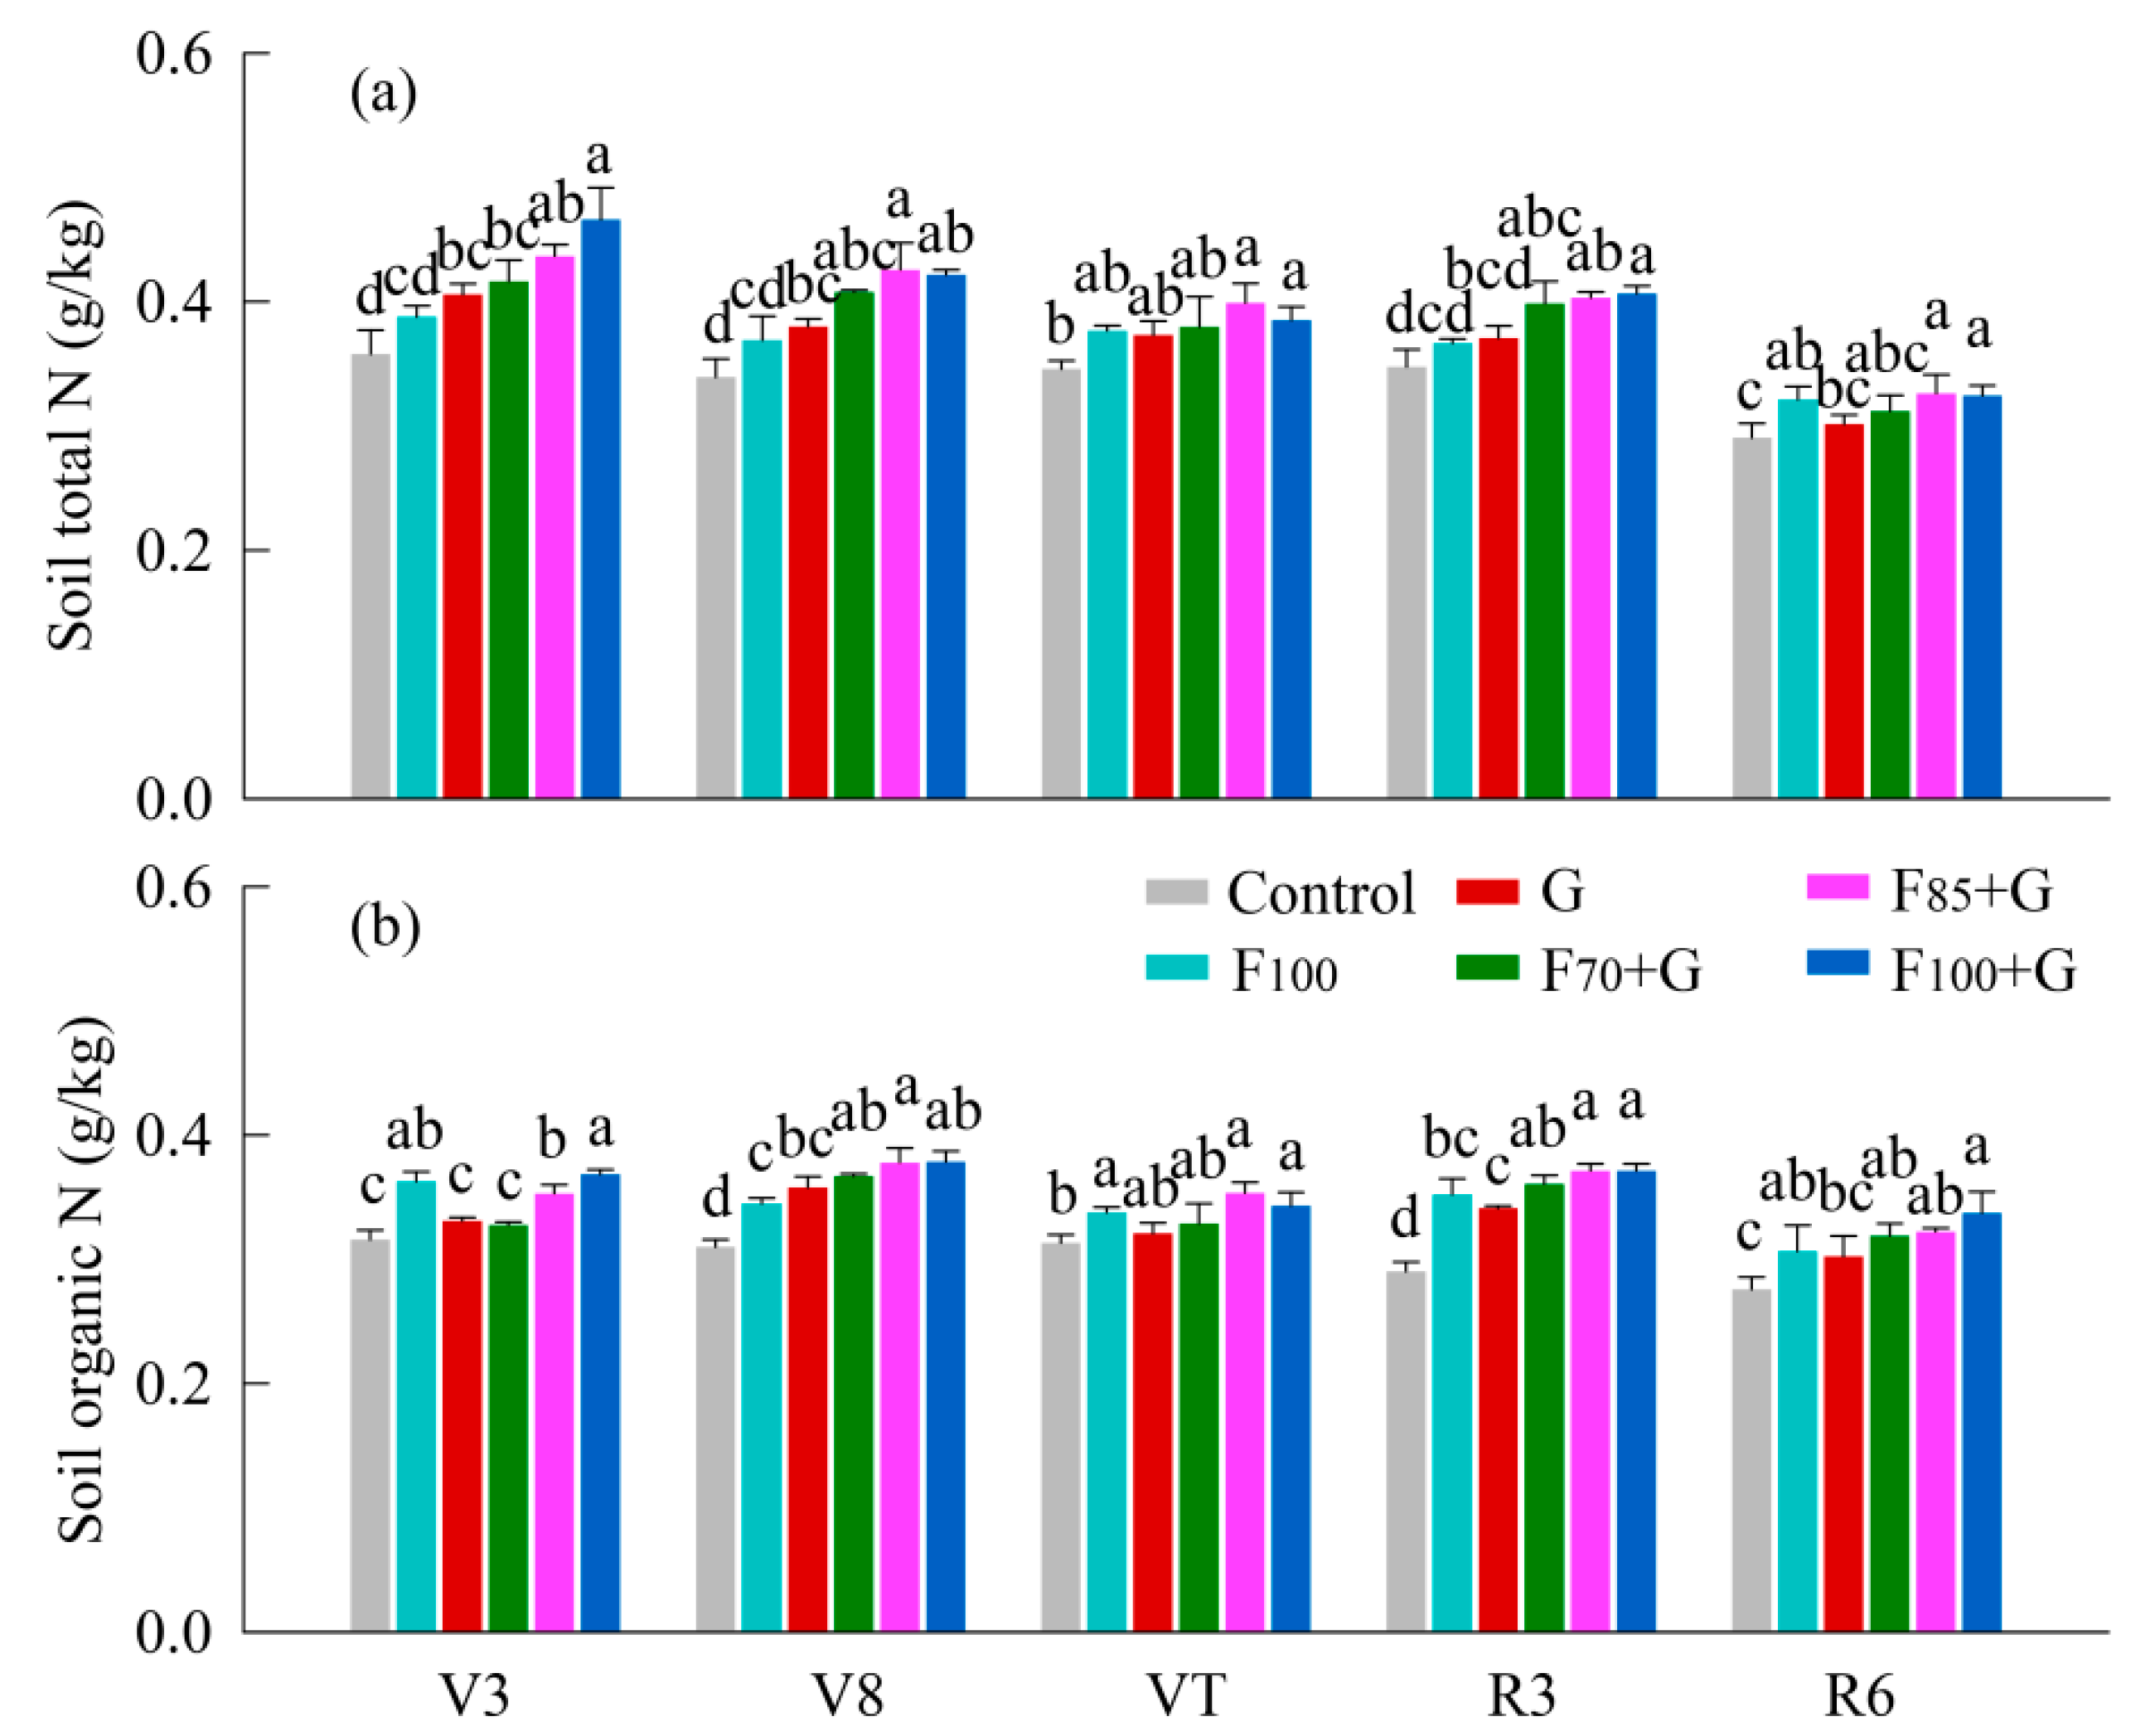
3.2. Temporal Changes of Soil N Fractions during Maize Growth as Influenced by Fertilizer Application and OV Incorporation

Total N and organic N contents of soil were relatively constant during maize growth, with a slight decrease after harvest (Figure 4). Compared to the initial total soil N content (0.34 g/kg) in 2008, the value in the control treatment remained fairly constant, while total soil N increased in most treatments with fertilizer and OV incorporation. F70 + G, F85 + G, and F100 + G treated soil had similar or greater contents of total N and organic N than F100 treatment through the maize growing seasons. The OV incorporation alone led to lower levels of soil total N and organic N than F plus G treatments (Figure 4).
In contrast to soil total N and organic N, the contents of soil microbial biomass N (SMBN), mineral N (Nmin), and dissolved organic N (DON) fluctuated over maize development stages, with greater values occurring at V3 and V8 (Figure 5). At these two stages, the SMBN content was 25–44% greater in the F70 + G, F85 + G, and F100 + G treatments than both control and F100 treatment (Figure 5a). The DON content was also significantly increased in F plus G treatments over control or F100 during maize growth, especially at the stem elongation V8 (Figure 5b). The Nmin content was quite sensitive to inorganic fertilizer N input and environmental conditions, where the higher fertilizer N application generally produced more Nmin than the control or G treatment (Figure 5c). However, with 15–30% reduction of fertilizer N application, similar Nmin content was obtained with F70 + G and F85 + G and F100 treatments, while it was further increased by F100 + G treatment. Soil Nmin content decreased to a low level after the V8 stage, but was still greater in F and G treatments than control.

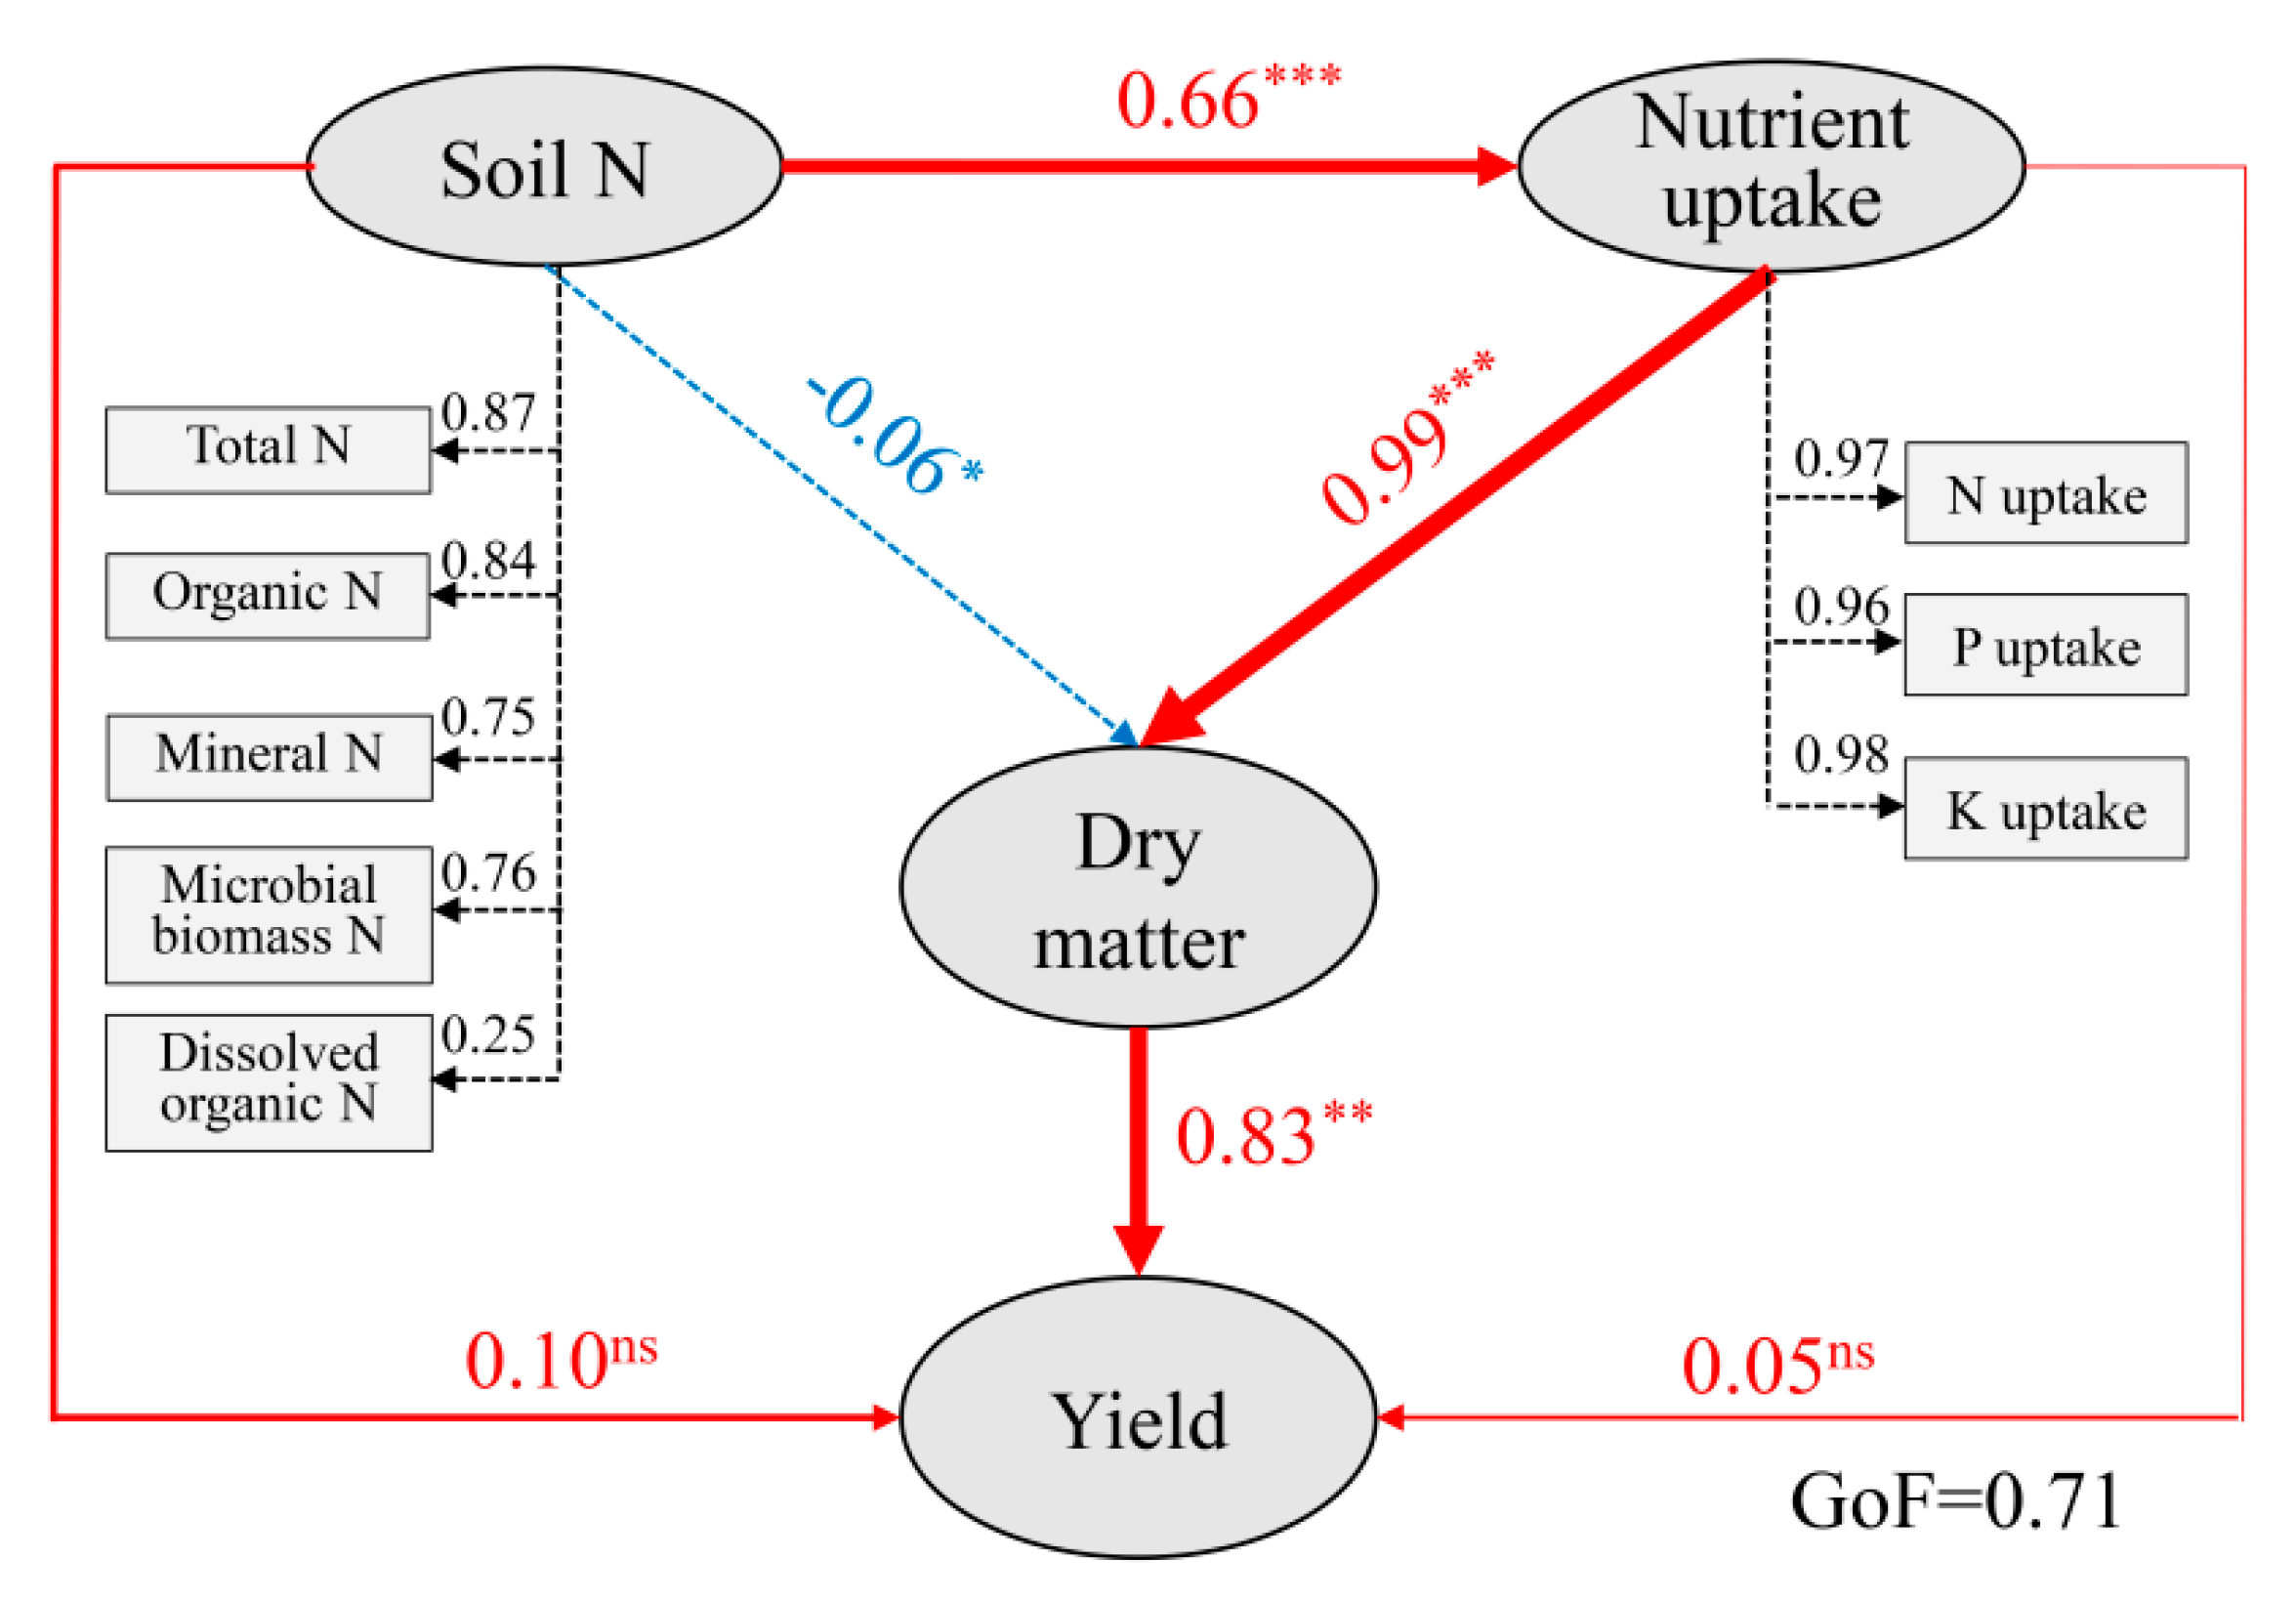
3.3. Interactions between Soil N Fractions and Maize Growth and Nutrient Uptake

A relative weights analysis was performed to quantify the relative contribution of soil N fractions to maize growth and N uptake (Figure 6). Of the five N fractions examined in the present study, DON and Nmin together explained over 70% of the variation in DM production and N uptake, i.e., there was a greater contribution of these two N components than other variables (soil total N, organic N, and SMBN).
Further, large indirect effects (0.53, calculated as the sum of multiplied path coefficients from soil N to yield except the direct effect) of soil N status on maize grain yield were observed through plant nutrient uptake and DM production in the PLS-PM model (Figure 7). The direct effects of soil N on nutrient uptake, plant NPK uptake on dry matter production, and dry matter production on final grain yield were 0.66 (p < 0.001), 0.99 (p < 0.001), and 0.83 (p < 0.01), respectively, which together constituted a predominant indirect path from soil N pools to grain yield (Figure 7).

4. Discussion

4.1. At Least 15–30% of Inorganic Fertilizer Input Could Be Reduced in the OV Incorporation-Based Maize Rotation

From 1980 to 2010, the inorganic N input on cropland in China increased from 9.4 to 28.9 Tg/year [34], while the rates of cereal grain yield increased slowly [4,20]. Often twice as much fertilizer N and P is applied than is recovered in crops, and this nutrient imbalance in turn aggravates environmental issues [4,20]. Thus, it is very important to reduce the chemical fertilizer input to the agricultural system, while also maintaining or increasing crop yield [1]. One of the realistic ways is to substitute chemical N or P by green manure. Many studies have shown that either green manure alone or combined with fertilizer can stimulate the following crop growth, yield, and nutrient uptake [11,12,15]. Under the present conditions, the yield, biomass, and N uptake of F70 + G and F85 + G treatments were similar to or even greater than the recommended fertilization (F100), indicating that with OV incorporation, 15–30% reduction of fertilizer input could still maintain soil N availability to sustain maize growth and yield. In addition, green manure incorporation further increased maize yield and N uptake based on the full rates of fertilizer recommendations, showing stimulated crop growth and N uptake, which was in agreement with other studies using either legume or non-legume green manures [11,12,15]. Overall, the results highlight the crucial role of OV incorporation in enhancing maize growth and nutrient uptake under reduced inorganic fertilizer input.

4.2. Integrated Management of OV Incorporation and Fertilizer Application Compensated for Soil N Pools

Leguminous green manure is mainly cultivated for its ability to fix, accumulate, and supply large amounts of N, while non-legumes are mainly used to prevent soil erosion, trap N, and reduce leaching to the water table [10,35]. Among the desired effects of green manure are improving soil fertility and increasing the stability of N supply [10]. OV incorporation with reduced chemical fertilizer application increased the soil total N content in most cases compared to control, which is in agreement with other reports that application of either inorganic fertilizer or organic substrates can increase soil total N storage [10,36]. Green manure application combined with reduced fertilization had similar or greater soil total N and organic N content than the recommended fertilization through the maize growing season, indicating that OV incorporation well compensated for soil N reserves when 15–30% of fertilizer N input was removed. This was associated with the N supplement by OV incorporation per se, since there was a certain amount of green manure N imported to F plus G treatments, partially contributing to total N increase. For instance, in 2012, exogenous N inputs through imported OV plants were 78.5, 45.8, 26.5, and 29.4 kg/ha in the G, F70 + G, F85 + G, and F100 + G treatments, respectively (Table 2). A previous study showed that 67.5% of OV residues can be decomposed during the maize growing season, and 85.3% of OV’s N can be released to the soil [25]. Such substantial N release likely furnished the soil N pools, while it is hard to quantify the contribution of exogenous N input to soil total N increase in the present study.
Alternatively, the amount of OV’s N input was not the only factor affecting soil total N levels, since N input in the G treatment (from OV alone) was about one-third of that in the F100 treatments (from fertilizer N), but it produced slightly more soil total N content during maize season, an average of 0.37 vs. 0.36 g kg−1 (Figure 4a). In this case, it might be attributed to enhanced mineralization of soil residual organic matter by OV incorporation, as indicated by similar or greater SMBN content in G relative to F100 treatment (Figure 5a). Although we claim that N, P, and K in green manure were taken up and returned in situ within the system from 2008 to 2011, and not considered as exogenous inputs (such as fertilizer application), the OV incorporation may affect the in-season mineralization processes of organic residues and soil nutrient availability. In addition, the pattern of maize grain yield in the first year was different from other years; for example, yield in G treatment was significantly greater than in F100 treatment. This further supports the point of stimulated N mineralization by OV incorporation.

4.3. Temporal Changes of Soil N Pools Highlights Dominant Contribution of Dissolved Organic N and Mineral N to Maize N Uptake and Growth

DON and Nmin represent the soluble organic and inorganic N fractions related to quick turnover of soil N pools, which fluctuated over maize growth with higher content at the V3 or V8 stage. These results imply that even at early and fast-growing stages, OV’s N could be quickly and easily released to increase soil N availability (Figure 3) due to the low-residue C/N ratio (~13) [25]. Other studies found that a lower substrate C/N ratio favors N mineralization [15,23,37]. Mineral N and DON are two major N sources for microbes and plant uptake, and play a pivotal role in crop N utilization [22,38]. Dissolved organic N mainly consists of amino acids, amino sugars, and low-molecular-mass proteins. These N-containing compounds can be taken up by plants directly through roots or mycorrhiza, especially for the amino acid groups [38,39]. There was a tight relationship between SMBN and DON after long-term fertilization, suggesting a close interaction of these soil N forms in the mineralization processes from incorporated organic residues [23,36].
Under the present conditions, F70 + G, F85 + G, and F100 + G treated soil had significantly greater DON content than control or F100 treatment at early (particularly V3 and V8) and mid-late stages. Similar Nmin content was obtained with F100 and F70 + G, F85 + G and even increased in the F100 + G treatment (Figure 5), which was consistent with the similar or greater N uptake and yield in the F plus G treatments. The relative weight analysis showed that the variation of N uptake and dry matter production of maize was mainly contributed by DON and Nmin, rather than other variables of soil total N, organic N, and SMBN (Figure 6). This might be because Nmin and DON, but not SMBN, are two major inorganic and organic sources of plant-available N in soil. The changes of Nmin and DON could directly influence plant N uptake, while the effects of SMBN have to be achieved through N mineralization (involving the turnover of organic and inorganic N fractions). Taken together with the partial least squares path modeling, soil N pools had a positive indirect effect on dry matter production through N uptake (Figure 7), and the enhanced N uptake of maize plants with integrated application of green manure and fertilizer might be coordinated with improved soil DON and Nmin content, even at the mid-late stages.
In addition, the overall dramatic decrease of DON and Nmin after the maize V8 stage corresponded to a period with continuous and heavy rainfall (Figure 1), implying N leaching losses by the precipitation. As with nitrate, DON leaching is also a significant pathway of N losses because of its easy movement along the soil profile [7,40]. The nitrate and DON contents in deeper soil layers were not investigated in the present study; however, since other studies have shown that N leaching losses were reduced under OV incorporation [12], it was speculated that the uptake of leached nitrate or DON below the 20 cm layer might be enhanced in the F plus G treatments, which partly contributed to the greater N uptake in maize.

5. Conclusions

In conclusion, the present study demonstrated a promising way of protecting N in fallow seasons by green manure cultivation and reducing the fertilizer inputs in maize production. Due to the enhanced dissolved organic and inorganic N levels by OV incorporation and increased nutrient uptake in soil, 15–30% of recommended fertilizer input could be reduced for maize. The results suggest that green manure–maize rotation could hold great promise in substituting a certain amount of inorganic fertilizer input by OV incorporation without sacrificing crop yield in the North China Plain and other temperate regions.

Author Contributions

Conceptualization, L.Y., J.B., J.L., N.Z., and W.C.; Funding acquisition, W.C.; Project administration, J.B. and N.Z., Supervision, W.C.; Methodology, L.Y., J.B., and J.L.; Software, L.Y.; Investigation, L.Y., J.B., and J.L.; Formal analysis, L.Y. and J.L.; Writing—original draft preparation, L.Y.; Writing—review and editing, L.Y. and W.C.

Funding

This work was supported by China Agriculture Research System-Green Manure, Science and Technology Innovation Project of Chinese Academy of Agricultural Sciences, and Chinese Outstanding Talents Program in Agricultural Science.

Acknowledgments

The authors would like to thank Songjuan Gao, Jing Xiong, and Danna Chang for their assistance with the field work, and Michael J.W. Maw at Abraham Baldwin Agricultural College, USA, and Charles B. Krueger at the University of Missouri, USA, for their comments and language editing.

Conflicts of Interest

The authors declare no conflict of interest.

References

  1. Chen, X.; Cui, Z.; Fan, M.; Vitousek, P.; Zhao, M.; Ma, W.; Wang, Z.; Zhang, W.; Yan, X.; Yang, J.; et al. Producing more grain with lower environmental costs. Nature 2014, 514, 486. [Google Scholar] [CrossRef] [PubMed]
  2. Yu, W.; Elleby, C.; Zobbe, H. Food security policies in India and China: Implications for national and global food security. Food Secur. 2015, 7, 405–414. [Google Scholar] [CrossRef]
  3. Vitousek, P.M.; Naylor, R.; Crews, T.; David, M.B.; Drinkwater, L.E.; Holland, E.; Johnes, P.J.; Katzenberger, J.; Martinelli, L.A.; Matson, P.A.; et al. Nutrient imbalances in agricultural development. Science 2009, 324, 1519–1520. [Google Scholar] [CrossRef] [PubMed]
  4. Chen, X.P.; Cui, Z.L.; Vitousek, P.M.; Cassman, K.G.; Matson, P.A.; Bai, J.S.; Meng, Q.F.; Hou, P.; Yue, S.C.; Römheld, V.; et al. Integrated soil-crop system management for food security. Proc. Natl. Acad. Sci. USA 2011, 108, 6399–6404. [Google Scholar] [CrossRef] [PubMed] [Green Version]
  5. Meng, Q.; Hou, P.; Wu, L.; Chen, X.; Cui, Z.; Zhang, F. Understanding production potentials and yield gaps in intensive maize production in China. Field Crop Res. 2013, 143, 91–97. [Google Scholar] [CrossRef] [Green Version]
  6. Ju, X.T.; Xing, G.X.; Chen, X.P.; Zhang, S.L.; Zhang, L.J.; Liu, X.J.; Cui, Z.L.; Yin, B.; Christie, P.; Zhu, Z.L.; et al. Reducing environmental risk by improving N management in intensive Chinese agricultural systems. Proc. Natl. Acad. Sci. USA 2009, 106, 3041–3046. [Google Scholar] [CrossRef] [PubMed] [Green Version]
  7. Zhou, J.; Gu, B.; Schlesinger, W.H.; Ju, X. Significant accumulation of nitrate in Chinese semi-humid croplands. Sci. Rep. 2016, 6, 25088. [Google Scholar] [CrossRef] [PubMed] [Green Version]
  8. Zheng, X.; Han, S.; Huang, Y.; Wang, Y.; Wang, M. Re-quantifying the emission factors based on field measurements and estimating the direct N2O emission from Chinese croplands. Glob. Biogeochem. Cycles 2004, 18, GB2018. [Google Scholar] [CrossRef]
  9. Xie, Z.; Tu, S.; Shah, F.; Xu, C.; Chen, J.; Han, D.; Liu, G.; Li, H.; Muhammad, I.; Cao, W. Substitution of fertilizer-N by green manure improves the sustainability of yield in double-rice cropping system in south China. Field Crop Res. 2016, 188, 142–149. [Google Scholar] [CrossRef] [Green Version]
  10. Thorup-Kristensen, K.; Magid, J.; Jensen, L.S. Catch crops and green manures as biological tools in nitrogen management in temperate zones. Adv. Agron. 2003, 79, 227–302. [Google Scholar]
  11. Yang, L.; Cao, W.; Thorupkristensen, K.; Bai, J.; Gao, S.; Chang, D. Effect of Orychophragmus violaceus incorporation on nitrogen uptake in succeeding maize. Plant Soil Environ. 2015, 61, 260–265. [Google Scholar] [CrossRef]
  12. Bai, J.; Cao, W.; Xiong, J.; Zeng, N.; Gao, S.; Katsuyoshi, S. Integrated application of February Orchid (Orychophragmus violaceus) as green manure with chemical fertilizer for improving grain yield and reducing nitrogen losses in spring maize system in northern China. J. Integr. Agric. 2015, 14, 2490–2499. [Google Scholar] [CrossRef]
  13. Li, H.; Zheng, L.; Lei, Y.; Li, C.; Liu, Z.; Zhang, S. Estimation of water consumption and crop water productivity of winter wheat in North China Plain using remote sensing technology. Agric. Water Manag. 2008, 95, 1271–1278. [Google Scholar] [CrossRef]
  14. Thorup-Kristensen, K. Are differences in root growth of nitrogen catch crops important for their ability to reduce soil nitrate-N content, and how can this be measured? Plant Soil 2001, 230, 185–195. [Google Scholar] [CrossRef]
  15. Zhang, D.; Yao, P.; Na, Z.; Yu, C.; Cao, W.; Gao, Y. Contribution of green manure legumes to nitrogen dynamics in traditional winter wheat cropping system in the Loess Plateau of China. Eur. J. Agron. 2016, 72, 47–55. [Google Scholar]
  16. Yu, Y.; Xue, L.; Yang, L. Winter legumes in rice crop rotations reduces nitrogen loss, and improves rice yield and soil nitrogen supply. Agron. Sustain. Dev. 2014, 34, 633–640. [Google Scholar] [CrossRef]
  17. Hooker, K.V.; Coxon, C.E.; Hackett, R.; Kirwan, L.E.; O’Keeffe, E.; Richards, K.G. Evaluation of cover crop and reduced cultivation for reducing nitrate leaching in Ireland. J. Environ. Qual. 2008, 37, 138–145. [Google Scholar] [CrossRef] [PubMed]
  18. Zhou, Z.; Zhang, L.; Cao, W.; Huang, Y. Appraisal of agro-ecosystem services in winter green manure-spring maize. Ecol. Environ. Sci. 2016, 25, 597–604, (In Chinese with English Abstract). [Google Scholar]
  19. Mandal, U.K.; Singh, G.; Victor, U.S.; Sharma, K.L. Green manuring: Its effect on soil properties and crop growth under rice-wheat cropping system. Eur. J. Agron. 2003, 19, 225–237. [Google Scholar] [CrossRef]
  20. Zhang, F.; Cui, Z.; Chen, X.; Ju, X.; Shen, J.; Chen, Q.; Liu, X.; Zhang, W.; Mi, G.; Fan, M. Chapter one-Integrated nutrient management for food security and environmental quality in China. Adv. Agron. 2012, 116, 1–40. [Google Scholar]
  21. Glasener, K.M.; Wagger, M.G.; Mackown, C.T.; Volk, R.J. Contributions of shoot and root nitrogen-15 labeled legume nitrogen sources to a sequence of three cereal crops. Soil Sci. Soc. Am. J. 2002, 66, 523–530. [Google Scholar] [CrossRef]
  22. Kielland, K. Amino acid absorption by arctic plants: Implications for plant nutrition and nitrogen cycling. Ecology 1994, 75, 2373–2383. [Google Scholar] [CrossRef]
  23. Stark, C.; Condron, L.M.; Stewart, A. Influence of organic and mineral amendments on microbial soil properties and processes. Appl. Soil Ecol. 2007, 35, 79–93. [Google Scholar] [CrossRef] [Green Version]
  24. Wu, L.Q.; Wu, L.; Cui, Z.L.; Chen, X.P.; Zhang, F.S. Basic NPK fertilizer recommendation and fertilizer formula for maize production regions in China. Acta Pedol. Sin. 2015, 52, 802–817, (In Chinese with English Abstract). [Google Scholar]
  25. Liu, J.; Chen, X.; Zhang, J.; Xu, C.; Cao, W. Study on characteristics of decomposition and nutrients release of winter green manure crop Orychophragmus violaceus in North China. Chin. J. Grassl. 2013, 35, 58–63, (In Chinese with English Abstract). [Google Scholar]
  26. Nelson, D.W.; Sommers, L.E. Determination of total nitrogen in plant material. Agron. J. 1973, 65, 109–112. [Google Scholar] [CrossRef]
  27. Soon, Y.K.; Kalra, Y.P. A comparison of plant tissue digestion methods for nitrogen and phosphorus analyses. Can. J. Soil Sci. 1995, 75, 243–245. [Google Scholar] [CrossRef]
  28. Walker, J.M.; Barber, S.A. Absorption of potassium and rubidium from the soil by corn roots. Plant Soil 1962, 17, 243–259. [Google Scholar] [CrossRef]
  29. Bremner, J.M. Determination of nitrogen in soil by the Kjeldahl method. J. Agric. Sci. 1960, 55, 11–33. [Google Scholar] [CrossRef]
  30. Brookes, P.C.; Landman, A.; Pruden, G.; Jenkinson, D.S. Chloroform fumigation and the release of soil nitrogen: A rapid direct extraction method to measure microbial biomass nitrogen in soil. Soil Biol. Biochem. 1985, 17, 837–842. [Google Scholar] [CrossRef]
  31. Jones, D.L.; Willett, V.B. Experimental evaluation of methods to quantify dissolved organic nitrogen (DON) and dissolved organic carbon (DOC) in soil. Soil Biol. Biochem. 2006, 38, 991–999. [Google Scholar] [CrossRef]
  32. Kabacoff, R. R in Action: Data Analysis and Graphics with R.; Manning Publications Co.: Shelter Island, NY, USA, 2015. [Google Scholar]
  33. Sanchez, G. Plsdepot: Partial Least Squares (PLS) Data Analysis Methods v. 0.1.17. 2012. Available online: http://cran.r-project.org/web/packages/plsdepot/index.html (accessed on 9 September 2018).
  34. Gu, B.; Ju, X.; Chang, J.; Ge, Y.; Vitousek, P.M. Integrated reactive nitrogen budgets and future trends in china. Proc. Natl. Acad. Sci. USA 2015, 112, 8792. [Google Scholar] [CrossRef] [PubMed]
  35. Tosti, G.; Benincasa, P.; Farneselli, M.; Pace, R.; Tei, F.; Guiducci, M.; Thorup-Kristensen, K. Green manuring effect of pure and mixed barley-hairy vetch winter cover crops on maize and processing tomato N nutrition. Eur. J. Agron. 2012, 43, 136–146. [Google Scholar] [CrossRef]
  36. Liang, B.; Yang, X.; He, X.; Zhou, J. Effects of 17-year fertilization on soil microbial biomass C and N and soluble organic C and N in Loessial soil during maize growth. Biol. Fertil. Soils 2011, 47, 121–128. [Google Scholar] [CrossRef]
  37. Kumar, K.; Goh, K.M. Crop Residues and Management Practices: Effects on Soil Quality, Soil Nitrogen Dynamics, Crop Yield, and Nitrogen Recovery. Adv. Agron. 2000, 68, 197–319. [Google Scholar]
  38. Streeter, T.C.; Bol, R.; Bardgett, R.D. Amino acids as a nitrogen source in temperate upland grasslands: The use of dual labelled (13C, 15N) glycine to test for direct uptake by dominant grasses. Rapid Commun. Mass Spectrom. 2015, 14, 1351–1355. [Google Scholar] [CrossRef]
  39. Jones, D.L.; Darrah, P.R. Amino-acid influx at the soil-root interface of Zea mays L. and its implications in the rhizosphere. Plant Soil 1994, 163, 1–12. [Google Scholar] [CrossRef]
  40. Yu, Z.S.; Northup, R.R.; Dahlgren, R.A. Determination of dissolved organic nitrogen using persulfate oxidation and conductimetric quantification of nitrate-nitrogen. Commun. Soil Sci. Plant Anal. 1994, 25, 3161–3169. [Google Scholar] [CrossRef]
Figure 1. Monthly total precipitation (pre.) and average temperature (tem.) during the green manure (Orychophragmus violaceus (OV)) season (blue) and maize growing season (red) based on the 30-year average from 1981–2010 and in-season recording from October 2010 to August 2012.
Agronomy 08 00261 g001
Figure 2. Maize grain yield and average yield from 2009 to 2012. Data are mean ± standard error (vertical bars, n = 4). Different letters above columns indicate statistical differences between treatments by least significant difference (LSD) test (p < 0.05). Control, no fertilization; F100, recommended inorganic fertilization alone; G, green manure incorporation alone; F70 + G, F85 + G, and F100 + G are 70%, 85%, and 100% of F100 plus G, respectively.
Agronomy 08 00261 g002
Figure 3. (a) Dry matter accumulation, (b) nitrogen (N) uptake, (c) phosphorus (P) uptake, and (d) potassium (K) uptake along maize development stages in 2012. Vertical bars indicate standard error of means (n = 4). V3 and V8 (the third and eighth leaf fully expanded, respectively), VT (tasseling), R3 (milk), and R6 (physiological maturity). Control, no fertilization; F100, recommended inorganic fertilization alone; G, green manure incorporation alone; F70 + G, F85 + G, and F100 + G are 70%, 85%, and 100% of F100 plus G, respectively.
Agronomy 08 00261 g003
Figure 4. Changes of soil (a) total N and (b) organic N in the 0–20 cm soil layer during maize growth. Data are mean ± standard error (vertical bars, n = 4). Different letters above columns at each harvest indicate statistical differences between treatments by LSD test (p < 0.05). V3 and V8 (the third and eighth leaf fully expanded, respectively), VT (tasseling), R3 (milk), and R6 (physiological maturity). Control, no fertilization; F100, recommended inorganic fertilization alone; G, green manure incorporation alone; F70 + G, F85 + G, and F100 + G are 70%, 85%, and 100% of F100 plus G, respectively.
Agronomy 08 00261 g004
Figure 5. Changes in (a) soil microbial biomass N (SMBN), (b) dissolved organic N (DON), and (c) mineral N (Nmin) in the 0–20 cm soil layer during maize growth. Data are mean ± standard error (vertical bars, n = 4). Different letters above columns at each harvest indicate statistical differences between treatments by LSD test (p < 0.05). V3 and V8 (the third and eighth leaf fully expanded, respectively), VT (tasseling), R3 (milk), and R6 (physiological maturity). Control, no fertilization; F100, recommended inorganic fertilization alone; G, green manure incorporation alone; F70 + G, F85 + G, and F100 + G are 70%, 85%, and 100% of F100 plus G, respectively.
Agronomy 08 00261 g005
Figure 6. Relative influences of soil nitrogen (N) fractions on (a) dry matter production and (b) N uptake of maize. TN, total N; SON, soil organic N; SMBN, soil microbial biomass N; DON, dissolved organic N; Nmin, mineral N.
Agronomy 08 00261 g006
Figure 7. Partial least squares path model based on the effects of soil N fractions, nutrient uptake, and dry matter production on maize grain yield. The loading for soil N pools and plant nutrient uptake that create the latent variables are shown in rectangles. Numbers adjacent to arrows are standardized path coefficients. Continuous red and dashed blue arrows indicate positive and negative effects, respectively. Width of arrows is proportional to the strength of path coefficients. Coefficients differing significantly from zero are indicated by ** p < 0.01, and *** p < 0.001; ns, not significant. The model is assessed using the goodness of fit (GoF) statistic, a measure of overall prediction performance.
Agronomy 08 00261 g007
Table 1. Cropping system and chemical fertilizer input for each treatment.
TreatmentCropping SystemInput of Chemical Fertilizer Each Year (kg/ha) 1
NPK
ControlMaize-winter fallow000
F100Maize-winter fallow2254994
GMaize-green manure000
F70 + GMaize-green manure1583466
F85 + GMaize-green manure1914280
F100 + GMaize-green manure2254994
1 Chemical fertilizer was applied only for maize growth, and not for green manure. F100, the recommended fertilizer rate, alone; G, incorporation of green manure OV alone; F70 + G, 70% of F100 plus G; F85 + G, 85% of F100 plus G.
Table 2. Amounts of incorporated green manure and introduced nutrients for each treatment.
TreatmentIncorporated Amount of Green Manure (Fresh Weight, t ha−1) 1Amount of Introduced Nutrient by Green Manure (N–P–K) (kg ha−1)
20092010201120122009201020112012
Control00000000
F10000000000
G15.6n.d. 24.622.5 (18.7) 352.6–9.6–77.4n.d.21.5–2.2–21.294.0–9.8–99.2 (78.5–8.2–82.7) 3
F70 + G15.6n.d.10.222.5 (10.9)52.6–9.6–77.4n.d.48.0–4.8–47.094.0–9.8–99.2 (45.8–4.8–48.2)
F85 + G15.6n.d.19.022.5 (6.3)52.6–9.6–77.4n.d.89.8–9.0–87.994.0–9.8–99.2 (26.5–2.8–27.9)
F100 + G15.6n.d.15.222.5 (7.0)52.6–9.6–77.4n.d.71.5–7.2–70.094.0–9.8–99.2 (29.4–3.1–31.0)
1 Water content of fresh green manure residue ranged from 83.4% to 87.5%. 2 n.d., not determined. 3 Numbers in brackets indicate amounts of exogenous import of OV green manure and introduced nutrients other than that grown in situ.

