Article

Rigput Brome (Bromus diandrus Roth.) Management in a No-Till Field in Spain

1
Weed Science and Plant Ecology Group, Department of Hortofruticulture, Botany and Gardening, Escola Tècnica Superior d’Enginyeria Agraria (ETSEA), University of Lleida, Agrotecnio. Alcalde Rovira Roure 191, 25198 Lleida, Spain
2
Bayer CropScience SL, C/Charles Robert Darwin, 13, 46980 Paterna, Valencia, Spain
*
Author to whom correspondence should be addressed.
Agronomy 2018, 8(11), 251; https://doi.org/10.3390/agronomy8110251
Submission received: 1 October 2018 / Revised: 31 October 2018 / Accepted: 1 November 2018 / Published: 4 November 2018
(This article belongs to the Special Issue Weed Management & New Approaches)

Abstract

:
The adoption of no-till (NT) in the semi-arid region of Mediterranean Spain has promoted a weed vegetation change, where rigput brome (Bromus diandrus Roth) represents a main concern. In order to avoid complete reliance on herbicides, the combination of several control methods, without excluding chemical ones, can contribute to an integrated weed management (IWM) system for this species. In this field study, 12 three-year management programs were chosen, in which alternative non-chemical methods—delay of sowing, crop rotation, sowing density and pattern, stubble removal—are combined with chemical methods to manage B. diandrus in winter cereals under NT. Moreover, their effects on weed control and crop productivity were analyzed from the point of view of the efficiency of the control methods, based on a previously developed emergence model for B. diandrus. All management programs were effective in reducing the weed infestation, despite the different initial weed density between blocks. For high weed density levels (60–500 plants m−2), two years of specific managements resulted in ≥99% reduction of its population. For even higher density levels, three years were needed to assure this reduction level. Both the emergence of the weed and the crop yields are mainly driven by the seasonal climatic conditions in this semi-arid area. For this reason, among the non-chemical methods, only crop rotation and sowing delay contributed to an effective weed population decrease as well as an increase in the economic income of the yield. The other alternative methods did not significantly contribute to controlling the weed. This work demonstrates that mid-term management programs combining chemical with non-chemical methods can effectively keep B. diandrus under control with economic gains compared to traditional field management methods in semi-arid regions.

1. Introduction

No-till (NT) in winter cereals has been adopted over the last 30 years to reduce costs and increase the crop productivity in those areas where precipitation is a limiting factor [1], which is the case in Mediterranean climates, particularly in the semi-arid Ebro basin in northeastern Spain. However, this modification of the soil management has also promoted a change in the weed flora, with the entrance of species that typically appear in field margins and edges [2,3]. Among these species, rigput brome (Bromus diandrus Roth.) has become the most problematic weed [4,5], as it can reduce crop yield from 22% with moderate infestations (12 plants m−2) up to 71% with severe ones (500 plants m−2) [6].
In order to control this noxious weed in NT fields of Mediterranean semi-arid areas, few chemical options are found. Some herbicides offer successful control over B. diandrus, but most of them can only be applied in wheat. A combination of flufenacet plus diflufenican in PRE and iodosulfuron-methyl plus mesosulfuron-methyl in POST obtained 98% of control efficacy, while the application of iodosulfuron-methyl plus mesosulfuron-methyl alone and pyroxsulam plus florasulam 0.275 kg ha−1 obtained 92% and 88% efficacy, respectively [7]. The application of isoproturon plus beflubutamid at 2.5 L ha−1, an herbicide that can be applied to barley, only obtained 5% efficacy in this same study. Despite the good control of some of these herbicides, the efficacies could be affected by the weed density, if weeds were unable to be adequately sprayed. In this sense, García et al. [6] observed that the efficacies could be reduced down to 55% with very high densities (>1000 plants m−2), in contrast to efficacies up to 100% with lower densities. Moreover, staggered emergence [8] allows some B. diandrus individuals to escape herbicide application. B. diandrus control relies on acetolactate synthase (ALS) inhibitors, and consequently the threat of easily developing resistance to this herbicide family is present, as has occurred for Lolium rigidum Gaudin [9]. For this reason, integrated weed management (IWM) programs seem to be the best options. The objective in IWM is focused in the cropping system rather than in the crop itself, integrating crop management with direct weed control methods [10]. Thus, the combination of different measures can guarantee adequate weed management [11] and prevent the evolution of herbicide resistances.
Sowing delay (SD), crop rotation, crop density, sowing pattern, and stubble removal after harvest have been considered for IWM. In particular, SD has widely been studied for weed control. García et al. [6] saw that a one-month delay, from mid-October to mid-November, could allow the reduction of B. diandrus by up to 96% of the initial quantity due to pre-sowing glyphosate spraying, and up to 99% if SD is continued to early-December. García et al. [12] also saw that the combination of SD with an effective herbicide application in wheat can reduce very high infestations from >500 plants m−2 to 1 plant m−2 after three seasons, while these were reduced to 60 plants m−2 without SD. Crop rotation and diversification are also main approaches to successfully carry IWM strategies (European Union Directive 2009/128/CE). In this sense, crop rotation offers important alternatives that allow interrupting the life cycle of weeds, such as crop sowing date variation, harvest date variation, crop competition, and alternation of the herbicide site of action (SoA) [13,14]. Three-year crop rotation programs, alternating wheat, barley, and field pea, have been demonstrated to successfully reduce B. diandrus infestations [15]. Crop density has also been studied for the control of many weed species. The competitive effect of the crop itself is able to reduce the fecundity of the surviving weed individuals [12,16,17,18]. This allows the reduction of the seedbank recruitment, contributing to the decrease of infestation levels. Furthermore, some studies have demonstrated that the competitive effect of the crop is enhanced when the distance between crop seedlings is homogeneous, compared to when the crop is sown in rows [16,19,20]. This way, the competitive effect of the crop is improved and the fitness of the weed diminished. In this aspect, the problem is the lack of specific machinery and the most similar pattern would be a random sowing. Finally, destroying or removing the stubble has also been proposed and effectively used for the control of herbicide-resistant L. rigidum in Australia [21,22]. The seed rain of the most important weed species, including B. diandrus, occurs at harvest [23]. Seeds remain on the soil surface with the crop stubble. Thus, destroying or removing the stubble could also help remove the weed seeds and it could partially contribute to the reduction of the seedbank.
All of these methods have been useful for the control of several weeds, but studies of a combination of these methods over time are scarce. For this reason, the objective of this work was to study 12 three-year IWM programs, with different combinations of the abovementioned cultural methods and chemical methods, for the control of B. diandrus in NT.

2. Material and Methods

2.1. Site Description

The experiment was established in a commercial winter cereal field in the province of Lleida, in northeastern Spain. The field, located in Agramunt (41°46′31″ N; 01°04′02″ E, 360 m.a.s.l.), presented a high infestation of B. diandrus and was used for winter cereal production in NT for the last three seasons. Barley was sown the previous season, so there had not been any successful control and the infestation was assured for the season starting the experiment. The field had a 2% slope to the north and the soil structure was 30% sand, 52% clay, and 18% silt, with 2.3% organic matter and a pH of 8.5.

2.2. Integrated Weed Management Assessments

The B. diandrus management was carried out over three seasons, from 2014–2015 to 2016–2017, and the effect of 12 IWM programs on the abundance of the weed was evaluated. The experiment was set as split-plot randomized blocks with three replicates. Each management plot measured 15 m × 6 m to facilitate sowing, herbicide applications, and harvest, leaving a 10-m buffer alley surrounding the trial.
For each IWM program crop rotation, SD, crop density, random sowing, removal of the stubble, chisel plow, and herbicide rotation were combined to reduce the great brome population (Table 1): (1) traditional cereal monocrop (TRAD-1), two seasons with wheat (Triticum aestivum L.) and alternation to barley (Hordeum vulgare L.), with chemical control the third season; (2) wheat (WHEAT), wheat monocrop with SoA rotation; (3) stubble removal (CER-SR), cereal monocrop with wheat-barley-wheat sequence, SD, chemical control, and removal of the stubble after harvest; (4) cultural cereal monocrop (CER-CM), cereal monocrop with wheat-barley-wheat sequence, with chemical control and a combination of cultural managements, SD, stubble removal-high density-random sowing; (5) random sowing (CER-RdS), cereal monocrop wheat-barley-barley, SD, chemical control and random sowing the third season; (6) high density (CER-HD) cereal monocrop wheat-wheat-barley, SD, herbicide SoA rotation and high crop density (250 kg ha−1) for all three seasons; (7) field pea (Pisum sativum L.) rotation with cereals (PEA-CER), crop rotation field pea-barley-wheat, with SD and SoA rotation; (8) rapeseed (Brassica napus L.) rotation (RAPE), crop rotation canola-wheat-barley, with SD the second and third seasons and SoA rotation; (9) camelina (Camelina sativa L.) rotation (CAME), crop rotation camelina-wheat-barley, with SD the second and third seasons and SoA rotation; (10) traditional cereal monocrop with sowing delay (TRAD-2), wheat-barley-wheat, with SD the second season and SoA rotation; (11) pea rotation with wheat (PEA-WHE), rotation pea-wheat-wheat, with SD and SoA rotation; (12) pea rotation with chisel plow (PEA-CH), rotation pea-wheat-barley with SD, with chisel plow, and without chemical control the first and third seasons.
Sowing was done with a 3-m wide NT disc drill, regulating the sowing depth in the case of the chisel plow program (PEA-CH).
In all IWM programs, a pre-seeding glyphosate application was done, except in PEA-CH (12). In some plots, the B. diandrus suppression promoted the growth of corn poppy (Papaver rhoeas L.). For this reason a POST herbicide was applied to control this weed. Table 2 compiles the chemical products, as well as their characteristics and application doses.

2.3. Estimation of Eliminated Population Due to Sowing Date

As there is an existing hydrothermal time (HTT)-based emergence model developed by García et al. [8] (1), the proportion of the population that emerged and was then eliminated previous to the sowing date was estimated. This approach employing the HTT emergence model has been successfully applied in previous studies [6,24]. For this estimation, HTT had to be calculated as proposed by Spokas and Forcella [25], using the STM2 program.
y = 100 × (1 − [exp{−0.013x}])21.4389
where y is the percentage of emergence and x is the cumulated HTT on a certain date.
The weather data (maximum and minimum temperatures and precipitation) were taken from a meteorological station located in Tornabous (Lleida), 7.5 km away from the field (ruralcat.cat).
The chemical management of the programs, applied herbicides and coadjuvants (if necessary), and timings are specified in Table 3. In all three seasons, Bromoxynil (23.8%) + 2,4-D (23.8%) had to be applied to TRAD-1 for the control of P. rhoeas. This same herbicide was also applied in CER-CM in season 2016–2017 for the same reason. In season 2015–2016, glyphosate in pre-seeding was not needed as a severe drought prevented weeds from emerging.

2.4. Data Collection

The density of B. diandrus was counted in 10 randomly thrown quadrats at pre-sowing, before herbicide application and 30 and 60 days after application (DAA). Due to the reduction in the weed density in the second and third seasons, and because it was proved that no statistical difference was obtained with a higher number of density samples, the number of quadrats was reduced to five per plot in 2015–2016 and 2016–2017. At flowering, an estimation of the density of panicles was visually performed in two 6-m2 transects in the middle of the plots, with a total of 12 m2 assessed per plot, and transformed to a mean of four panicles/plant accordingly to random observations of 10 plants, in order to estimate B. diandrus density. Harvest of the field was conducted on 18 June 2015, 15 July 2016, and 26 June 2017 with a micro-harvester (Wintersteiger classic plot combine micro-harvester). In 2015, the harvest date was too late for camelina, which should have been done by 20 May, and suffered between 15% and 45% yield loss due to ant predation. For this reason, corrections of the yield results were made with the corresponding yield loss. The estimation of the economic income was performed according to the prices of the crops each year in the agricultural cooperative of Agramunt, which were the following: June 2015, wheat 178 €/Tn, field pea 240 €/Tn, oilseed rape 314 €/Tn, camelina 314 €/Tn; June 2016, wheat 180 €/Tn, barley 156 €/Tn; June 2017, wheat 165 €/Tn, barley 158 €/Tn.

2.5. Statistical Analysis

Statistical analysis was performed with SPSS 15.0 (SPSS Inc., Chicago, IL, USA). Results of the final density (FD) of B. diandrus were each analyzed with a parametric one-way analysis of variance, with the management program being the unique factor, the FD of each season being variable, and—due to the great differences in the initial densities (ID) of the weeds between blocks—the ID being considered as a random effect. This analysis was performed for every season’s final density. Due to the lack of normality of the samples, a transformation of the data into log(x + 0.1) was conducted. The statistical analysis for the reduction of density from the first to the third season was performed with Kruskal-Wallis one-way analysis of variance on ranks due to the lack of normality of these data. For the analysis of the economic income of the yields, this was performed only for the overall income for the three seasons together; the three blocks were considered together and parametric one-way analysis of variance was applied. The yields were not compared season by season is because the aim of the study was to consider each of the three-year managements as a whole.

3. Results

The three growing seasons differed in terms of temperature and precipitation: 2014–2015 was the warmest season (Table 4) but had quite a large range, with a difference of 18.5 °C between the coldest and warmest months. This contrast was much lower in 2015–2016, only 13.8 °C, and the growing season was the coldest, although it presented the warmest winter. The 2016–2017 growing season was in between the other two (mean 12 °C), but the contrast between the coldest and warmest months was the highest among the three seasons (19.8 °C). With respect to precipitation, 2014–2015 and 2015–2016 showed similar amounts of rain, but differed in the distribution throughout the seasons (Table 4): 2014–2015 presented a wet autumn (124.5 mm September–November), while it had a dry spring (34.8 mm March–May); in contrast, the autumn of 2015–2016 was extremely dry (34.4 mm September–November), which prolonged into the next two months (December–January), while spring was quite humid (139.7 mm March–May). Finally, 2016–2017 was the wettest season (315 mm), with autumn being reasonably wet (83 mm) and spring being very wet (158 L/m2). These patterns, mainly those of precipitation, affected the emergence of B. diandrus and thus the efficacy of the management programs, as will be explained later on.

3.1. Management Programs

The initial density (ID) between blocks varied significantly, from 139 plants m−2 in the first to 812 plants m−2 in the second and 2105 plants m−2 in the third block. The ID variation in 2014–2015 between management programs is explained by the different sowing dates, which allowed for greater emergence in the later sown plots, and by the patchy distribution of the weed. The final densities achieved each season for each of the management programs revealed their effectiveness, which was excellent in most cases. Overall, in the three seasons B. diandrus was almost completely controlled (>99.9%) and no significant differences were found between management programs.
Differences for the control of B. diandrus between the management programs were found in the first and the third seasons, but not in the second (Table 5). A significant block effect on the effectiveness of the management programs was observed the first and the second seasons (<0.002; Table 5), but was not observed the third season.

3.2. Estimation of Eliminated Population Due to Sowing Date

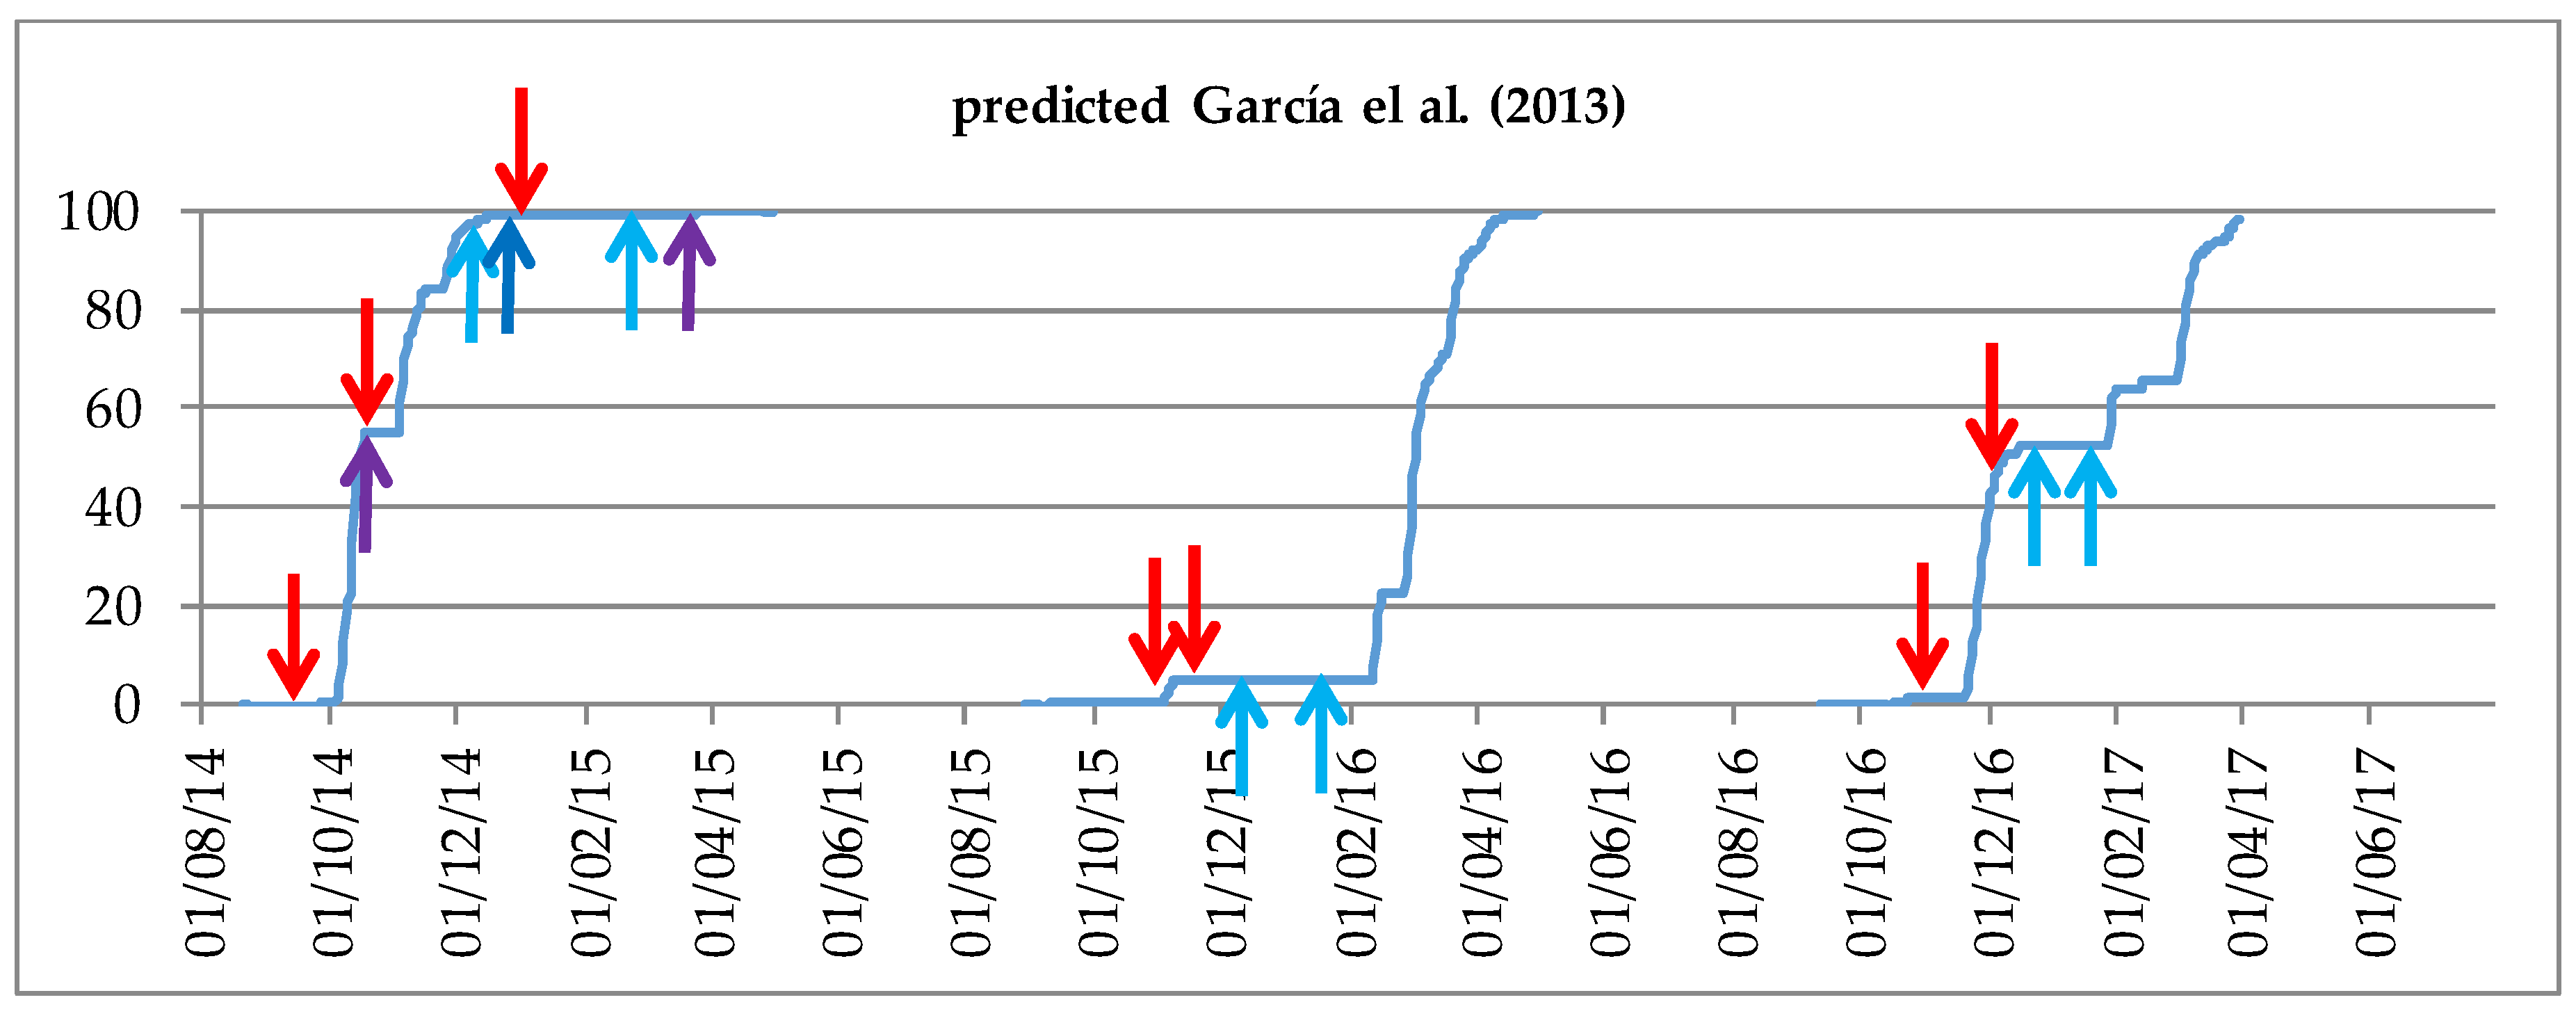
When the emergence characteristics—estimated with the emergence model from García et al. [8]—were analyzed (Figure 1) and related to the amount of rainfall and the distribution of each season (Table 4), a significant variation on the emergence of B. diandrus was observed. There was also a significant variation in the proportion of the population that was killed each season due to the sowing dates (red arrows). Autumn 2014 was very rainy and around 90% emergence was achieved on 28 November. In relation to the sowing dates that season, by 29 September (RAPE) only 0.18% of B. diandrus had emerged; but by 29 October 55% of B. diandrus had emerged and was killed with glyphosate; finally, by 23 January 99.3% had emerged and only 0.7% emerged afterwards. On the other hand, autumn 2015 was extremely dry, and according to the model the real emergence did not start until 12 February. In this season, 90% emergence was not achieved until 27 March.

3.3. Yield Results

Yield was affected by sowing delay and the climatic characteristics of each season (Table 6). Except in the first season, TRAD-1 obtained lower yields despite being sown earlier than the other programs. Despite this, and due to the variance present between the results, the economic income that these yields represent over all three seasons do not differ between management programs (Table 6).

4. Discussion

4.1. Management Programs

Although the results of the experiment have been conditioned by the initial B. diandrus density in each block, this helps us to understand the efficacy of these management programs. The results show that initial moderate densities (139 plants m−2, block 1) are relatively easy to control and by the end of the season this was almost 100%, which was confirmed by the low ID observed in the second season (4 plants m−2) that was further controlled. High IDs require more efforts to control B. diandrus; in block two (812 plants m−2), two seasons of control led to important weed density reductions, but there were still up to 18 plants m−2 in some programs and at the beginning of the third season there were, on average, 6.6 plants m−2. Finally, very high IDs, such as that in block three (2105 plants m−2), would require at least a fourth season of specific management to ensure an almost complete depletion of the B. diandrus seedbank, as at the beginning of the third season there were still 11 plants m−2 and almost all managements had some individuals (0.04–1.5 plants m−2) at the end of the season. Thus, the initial infestation level is very important to the design of an optimal management strategy. Similar levels of control were achieved from similar IDs by García et al. [6] by delaying for three consecutive seasons the sowing date from mid-October to early November and early December.
The differences observed according to the ID were diluted over time with a proper control of B. diandrus (lack of interaction management program vs block in 2016–2017, Table 5). In this situation, crop rotation was essential, as it allowed the application of grass killer herbicides which worked better than the others, particularly in the first season. Nevertheless, four out of the best six managements (PEA-CER, RAPE, CAME, and PEA-WHE) were applied in rotation in 2014–2015. On the other hand, the worst management program tested over the three seasons was PEA-CHI, with limited herbicide application only to the first season and exclusive mechanical control the second and the third seasons. Despite this, the mean control achieved, considering the three blocks, reached 99.9% (Table 7), without significant differences with respect to the other programs. A special mention should be made to acknowledge the CAME program in the first season, as even through the harvest was conducted on 18 June due to technical reasons, camelina had matured before cereals and could have been harvested as early as 20 May. This sowing date is usual in the area for this crop [26], and would allow the avoidance of the seed rain of most weed species [26], including B. diandrus (block 3). According to the dates, this usually occurs in the area (mid-June–harvest) [23].
All the management programs controlled B. diandrus and there were no statistical differences in this sense. Despite this, some management showed higher relevance than others. In this sense, crop rotation with a dicotyledonous crop reported higher percentages of control and more benefits than sowing only cereals, and sowing delays to late November/early December did not significantly affect the crop, while an important percentage of the B. diandrus population was killed (only in 2014–2015 and 2016–2017). On the other hand, stubble removal, random sowing, and higher sowing densities did not seem to improve the control of this weed, while the costs of production increased. Therefore, these managements seem not to be worth enough to be implemented for the control of B. diandrus.

4.2. Estimation of Eliminated Population Due to Sowing Date

The results obtained in 2015–2016 are in contrast with other authors’ observations [6,27], who reported early autumn flushes for B. diandrus. For that growing season, neither sowing dates (normal (4 November) and delayed (27 November)) nor herbicide applications (23 December and 20 January) could kill almost any B. diandrus. This emergence pattern explains the presence of some B. diandrus plants at the end of the season, which were late emerged individuals that escaped the herbicide application. According to Kleemann and Gill [28], the increased incidence of brome grass is associated with management practices that have inadvertently selected biotypes with greater seed dormancy. This selection process might allow the avoidance of pre-seeding controls or early POST treatments, and thrive in no-till, cereal-intense farming systems. Finally, autumn 2016 was quite wet, but the winter colder than usual. Thus, after a first flush of emergence there was a standby from December to January, and secondary important flushes occurred in February and April 2017. In this late season, only 1% of emergences were killed with the first sowing, but up to 42.4% were killed with the sowing delay to 2 December. Despite this, herbicide application in January was performed before the secondary flushes (Figure 1), to which most of the individuals sampled at flowering in blocks 2 and 3 belonged (Table 7).

4.3. Yield Results

The results obtained in the harvest for cereals are confirmed by findings of Plaza-Bonilla et al. [29], who observed higher yields in barley with sowing delayed to November and December and in wheat when the years were wet, in western Mediterranean areas.
With respect to the effect of the climatic characteristics, the wet autumn and dry spring in 2014–2015 affected the cereal, and yields were extremely low. The period of 2015–2016 was very good for barley according to the obtained yields (Table 6). Despite the dry autumn, some rain in November allowed good establishment of the crop, and late winter and spring were homogeneously wet. The period of 2016–2017 was better for wheat (according to the yield results, Table 6); the precipitation in spring was similar to 2015–2016 but autumn was wetter, while temperatures rose significantly in spring (mean temperatures of 10.5, 12.5, and 17.7 °C for March, April, and May, compared to 8.4, 12.1, and 15.2 °C for those same months in 2016), which could have affected more barley than wheat. The increase of temperature during anthesis [30] and grain filling [31] is known to negatively affect the yield of wheat and barley. These previous studies explain the result for barley, but not for wheat. On the contrary, the fact that the base temperature for grain filling is higher in wheat (8.2 °C) [32] than in barley (7.5 °C) [33] could partially explain the contrasted yields of the crops each season.

4.4. Implication for IWM in NT Fields in Mediterranean Semi-Arid Regions

Winter crop yields are mostly driven by the climatic conditions of each season. In recent years the erratic precipitation has reached an extreme: long drought periods have occurred during the crop cycle, and the distribution of precipitation along this cycle has conditioned the yields. Similarly, the emergence of B. diandrus, which begins after the first autumn rains [8], was affected by each season’s conditions, and delayed to the end of winter when an autumn drought occurred. The implement of delayed sowing in these conditions was thus not effective that season. Despite this, continuous delay of the sowing date in NT for 22 years can lead to a significant reduction of B. diandrus populations [24]. On the other hand, the specific control of B. diandrus allowed the increase of other problematic weeds, such as corn poppy (Papaver rhoeas), which in the study area is usually resistant to synthetic auxins and/or to acetolactate synthase (ALS) inhibitors [13,14,34]. So, applying either crop rotation or the delay of the sowing date for the control of B. diandrus will probably need to be followed by or combined with IWM strategies for the control of corn poppy. As suggested by Rey-Cabalero et al. [13] and Torra et al. [14], some of which are commonly used, these strategies may include sowing delay and the use of short cycle crops [34].
Very high (>1000 plants m−2) densities of B. diandrus are not abundant in the region, and this three-season IWM demonstrates that the control of this weed is feasible in this period of time, which will be required in certain fields. However, in most fields, with low to moderate infestation levels, one to two growing seasons would be enough to achieve successful population reduction levels, always taking into account the emergence pattern of B. diandrus according to the climatic conditions.

Author Contributions

Conceptualization, A.R.-E., J.R., and J.G.; Data curation, A.R.-E., J.R., and J.T.; Formal analysis, A.R.-E.; Funding acquisition, A.R.-E., J.R., and J.G.; Investigation, A.R.-E., J.R., and J.T.; Methodology, A.R.-E., J.R., and J.T.; Project administration, A.R.-E. and J.R.; Supervision, J.R. and J.G.; Writing—original draft, A.R.-E.; Writing—review and editing, A.R.-E., J.R., J.G., and J.T.

Funding

This research was funded by Bayer CropScience, grant number C14045, and the Economy Ministry of Spain, grant number AGL2014-52465-C4-2-R.

Acknowledgments

The results of this research come from two parallel integrated weed management programs established in the same field with the support of Bayer Cropscience and the project AGL2014-52465-C4-2-R of the Economy Ministry of Spain (MIMECO). We also want to thank Eva Edo-Tena, María Casamitjana, Berta Singla, Neus Mas, and Joachim Ricomà for field assistance, as well as Joan Ribes, Antoni Balaguerò, and Carlos Cortés for technical support.

Conflicts of Interest

The authors declare no conflict of interest.

Abbreviations

TRAD-1traditional 1, wheat-wheat-barley
WHEATwheat monocrop with SoA rotation
CER-SRcereal monocrop, wheat-barley-wheat, with stubble removal
CER-CMcereal monocrop, wheat-barley-wheat, with cultural managements
CER-RdScereal monocrop, wheat-barley-barley, with random sowing
CER-HDcereal monocrop, wheat-wheat-barley, at high crop density
PEA-CERcrop rotation pea-barley-wheat
RAPEcrop rotation canola-wheat-barley
CAMEcrop rotation camelina-wheat-barley
TRAD-2traditional 2, wheat-barley-wheat, and SoA rotation
PEA-WHErotation pea-wheat-wheat, and SoA rotation
PEA-CHrotation pea-wheat-barley with chisel plow
AtlAtlantis
Bbarley
BcBuctril Universal
BrdBroadway
Cacamelina
CMcultural management
CntCenturión
DAAdays after application
ECemulsion able concentration
FDfinal density
Happlied herbicides
HDhigh density
H + SHerold + Sencor
HTThydrothermal time
IDInitial density
IWMintegrated weed management
MoMonolith
NTno-till
POSTpost-emergence herbicide application
Raoilseed rape
RdSrandom sowing
SCconcentrated suspension
SDsowing delay
SLsoluble concentration
SoAsite of action
Wwheat
WGwater dispersible granulate
€/Tneuros per ton

References

  1. Cantero-Martínez, C.; Angas, P.; Lampurlanés, J. Growth, yield and water productivity of barley (Hordeum vulgare L.) affected by tillage and N fertilization in Mediterranean semiarid, rainfed conditions in Spain. Field Crops Res. 2003, 84, 341–357. [Google Scholar] [CrossRef]
  2. Royo-Esnal, A.; Torra, J.; Conesa, J.A.; Recasens, J. The application of agri-environment schemes in semiarid landscapes in NE of Spain involves changes on weed flora? In Proceedings of the 4th Workshop on Weeds and Biodiversity, Dijon, France, 28 February–2 March 2011. [Google Scholar]
  3. Swanton, C.J.; Shrestha, A.; Roy, R.C.; Ball-Coelho, B.R.; Knezevic, S.Z. Effect of tillage systems, N, and cover crop on the composition of weed flora. Weed Sci. 1999, 47, 454–461. [Google Scholar]
  4. Moreno, F.; Arrúe, J.L.; Cantero-Martínez, C.; López, M.V.; Murillo, J.M.; Sombrero, A.; López-Garrido, R.; Madejón, E.; Moret, D.; Álvaro-Fuentes, J. Conservation agriculture under Mediterranean conditions in Spain. In Biodiversity, Biofuels, Agroforestry and Conservation Agriculture. Sustainable Agriculture Reviews; Litchfouse, E., Ed.; Springer: London, UK, 2010; pp. 175–193. [Google Scholar]
  5. Riba, F.; Recasens, J. Bromus diandrus Roth en cereales de invierno. In La Biología de las Malas Hierbas de España; Sans, F.X., Fernández-Quintanilla, C., Eds.; Phytoma España-Sociedad Española de Malherbología: Valencia, Spain, 1997; pp. 25–35. [Google Scholar]
  6. García, A.L.; Royo-Esnal, A.; Torra, J.; Cantero-Martínez, C.; Recasens, J. Integrated management of Bromus diandrus in dry-land cereal fields under no-till. Weed Res. 2014, 54, 408–417. [Google Scholar] [CrossRef]
  7. INTIA. Control de Malas Hierbas en Cereal de Invierno. Technical Report 2012. Available online: http://www.nolaboreo.es/fotosbd/herbis-web.pdf (accessed on 14 June 2018).
  8. García, A.L.; Recasens, J.; Forcella, F.; Torra, J.; Royo-Esnal, A. Hydrothermal emergence model for rigput brome (Bromus diandrus). Weed Sci. 2013, 61, 146–153. [Google Scholar] [CrossRef]
  9. Owen, M.J.; Martínez, N.J.; Powles, S.B. Multiple herbicide-resistant Lolium rigidum (annual ryegrass) now dominates across Western Australia grain belt. Weed Res. 2014, 54, 314–324. [Google Scholar] [CrossRef]
  10. Melander, B.; Rasmussen, I.A.; Bàrberi, P. Integrating physical and cultural methods of weed control—Examples from European research. Weed Sci. 2005, 53, 269–381. [Google Scholar] [CrossRef]
  11. Theisen, G.; Bastiaans, L. Low disturbance seeding suppresses weeds in no-tillage soyabean. Weed Res. 2016, 55, 598–608. [Google Scholar] [CrossRef]
  12. García, A.L.; Torra, J.; Royo-Esnal, A.; Recasens, J. Integrated effect of crop sowing date and herbicide stress on Bromus diandrus fitness. Span. J. Agric. Res. 2015, 13, 1–9. [Google Scholar] [CrossRef]
  13. Rey-Caballero, J.; Royo-Esnal, A.; Recasens, J.; González, I.; Torra, J. Management options for multiple herbicide-resistant corn poppy (Papaver rhoeas) in Spain. Weed Sci. 2017, 65, 295–304. [Google Scholar] [CrossRef]
  14. Torra, J.; Royo-Esnal, A.; Rey-Caballero, J.; Recasens, J.; Salas, M.L. Management of herbicide-resistant corn poppy (Papaver rhoeas) under different tillage systems does not change the frequency of resistant plants. Weed Sci. 2018, 1–9. [Google Scholar] [CrossRef]
  15. Montull, J.M.; Llenes, J.M.; Taberner, A. Integrated weed management of Bromus diandrus. Results of three years of field tests. In Proceedings of the XV SEMh Congress, Sevilla, Spain, 19–22 October 2015; pp. 29–34. [Google Scholar]
  16. Olsen, J.M.; Griepentrog, H.W.; Nielsen, J.; Weiner, J. How important are crop spatial pattern and density for weed suppression by spring wheat? Weed Sci. 2012, 60, 501–509. [Google Scholar] [CrossRef]
  17. Weiner, J.; Andersen, S.B.; Wille, W.K.M.; Griepentrog, H.W.; Olsen, J.M. Evolutionary agroecology: The potential for cooperative, high density, weed-suppressing cereals. Evol. Appl. 2010, 3, 473–479. [Google Scholar] [CrossRef] [PubMed]
  18. Scursoni, J.A.; Satorre, E.H. Barley (Hordeum vulgare) and wild oat (Avena fatua) competition is affected by crop and weed density. Weed Technol. 2005, 19, 790–795. [Google Scholar] [CrossRef]
  19. Lemerle, D.; Lockley, P.; Koetz, E.; Diffey, S. Herbicide efficacy for control of annual ryegrass (Lolium rigidum Gaud.) is influenced more by wheat seeding rate than row spacing. Crop Pasture Sci. 2013, 64, 708–715. [Google Scholar] [CrossRef]
  20. Kristensen, L.; Olsen, J.; Weiner, J. Crop density, sowing pattern, and nitrogen fertilization effects on weed suppression and yield in spring wheat. Weed Sci. 2008, 56, 97–102. [Google Scholar] [CrossRef]
  21. Walsh, M.; Newman, P.; Powles, S.B. Targeting weed seeds in crop: A new global paradigm for global agriculture. Weed Technol. 2012, 27, 431–436. [Google Scholar] [CrossRef]
  22. Gill, G.S.; Holmes, J.E. Efficacy of cultural control methods for combating herbicide-resistant Lolium rigidum. Pestic. Sci. 1997, 51, 352–358. [Google Scholar] [CrossRef]
  23. Westerman, P.R.; Atanackovic, V.; Royo-Esnal, A.; Torra, J. Differential weed seed predation in dryland cereals. Arthropod-Plant Interact. 2012, 6, 591–599. [Google Scholar] [CrossRef]
  24. Recasens, J.; García, A.L.; Cantero-Martínez, C.; Torra, J.; Royo-Esnal, A. Long-term effect of different tillage systems on the emergence and demography of Bromus diandrus in rainfed cereal fields. Weed Res. 2016, 56, 31–40. [Google Scholar] [CrossRef]
  25. Spokas, K.; Forcella, F. Software tools for weed seed germination modeling. Weed Sci. 2009, 57, 216–227. [Google Scholar] [CrossRef]
  26. Royo-Esnal, A.; Valencia-Gredilla, V. Camelina as a rotation crop for weed control in organic farming in a semiarid Mediterranean climate. Agriculture 2018, 8, 156. [Google Scholar] [CrossRef]
  27. Kleemann, S.G.L.; Gill, G. The role of imidazolinone herbicides for the control of Bromus diandrus (rigid brome) in wheat in Southern Australia. Crop Prot. 2009, 28, 913–916. [Google Scholar] [CrossRef]
  28. Kleemann, S.G.L.; Gill, G. Seed dormancy and seedling emergence in rigput brome (Bromus diandrus) populations in Southern Australia. Weed Sci. 2013, 61, 222–229. [Google Scholar] [CrossRef]
  29. Plaza-Bonilla, D.; Álvaro-Fuentes, J.; Bareche, J.; Masgoret, A.; Cantero-Martínez, C. Delayed sowing improved barley yield in a no-till rainfed Mediterranean agroecosystem. Agron. J. 2017, 109, 1250–1260. [Google Scholar] [CrossRef]
  30. García, G.A.; Serrago, R.A.; Dreccer, F.; Miralles, D.J. Post-anthesis warm nights reduce grain weight in field-grown wheat and barley. Field Crops Res. 2016, 195, 50–59. [Google Scholar] [CrossRef]
  31. Serrago, R.A.; Alzueta, I.; Savin, R.; Slafer, G.A. Understanding grain yield response to source-sink ratios during grain filling in wheat and barley under contrasting environments. Field Crops Res. 2013, 150, 42–51. [Google Scholar] [CrossRef]
  32. Slafer, G.A.; Savin, R. Developmental base temperature in different phenological phases of wheat (Triticum aestivum). J. Exp. Bot. 1991, 42, 1077–1082. [Google Scholar] [CrossRef]
  33. Gualano, N.A.; Benech-Arnold, R.L. Predicting pre-harvest sprouting susceptibility in barley: Looking to sensitivity windows to temperature throughout grain filling in various commercial cultivars. Field Crops Res. 2009, 114, 35–44. [Google Scholar] [CrossRef]
  34. Torra, J.; Royo-Esnal, A.; Recasens, J. Management of herbicide-resistant Papaver rhoeas in dry land cereal fields. Agron. Sustain. Dev. 2011, 31, 483–490. [Google Scholar] [CrossRef]
Figure 1. Simulation of the percentages of emergence for rigput brome (Bromus diandrus Roth) throughout the three seasons, estimated with the emergence model developed by García et al. (2013). The initial hydrothermal time count started each season with the first important rains in September. Red arrows represent the sowing dates each season (24 September, 31 October, 23 January in 2014–2015; 6 and 27 November in 2015–2016; and 4 November and 2 December in 2016–2017). Purple arrows indicate the first centurion application (left) in RAPE on 29 October. The second application coincided with the herbicide application of the first sowing dates (light blue arrow, left), and centurion application in the pea crops (right) on 31 March. Light blue arrows indicate the applications of the corresponding herbicide in the first (left) and second (right) sowing dates (17 December and 4 March in 2014–2015; 23 December and 20 January in 2015–2016; 12 December and 25 January in 2016–2017). The dark blue arrow indicates the application of Buctril Universal in TRAD-1 on 15 January 2015; in 2015–2016 and 2016–2017 this application coincided with the second herbicide application dates (right light blue arrows).
Agronomy 08 00251 g001
Table 1. Management details of each program during the three seasons.
Season 2014–2015Season 2015–2016Season 2016–2017
Prog. Int.CropSowHCMCropSowHCMCropSowHCM
1 TRAD-1W31/10Atl; Bc W06/11Atl; Bc B04/11H + S; Bc
2 WHEATW23/01Brd W06/11Atl W04/11Brd
3 CER-SRW23/01AtlSRB27/11H + SSRW04/11Mo
4 CER-CMW23/01AtlSRB27/11H + S W02/12MoRdS
5 CER-RdSW23/01Atl B27/11H + S B02/12H + SRdS
6 CER-HDP23/01AtlHDW27/11AtlHDB02/12H + SHD
7 PEA-CERRa25/09Cnt B27/11H+S W02/12Mo
8 RAPECa31/10Cnt * W27/11Atl B02/12H + S
9 CAMEW31/10Cnt W27/11Atl B02/11H + S
10 TRAD-2W31/10Atl B27/11H + S W04/11Mo
11 PEA-WHEP23/01Cnt W27/11Atl W02/12Brd
12 PEA-CHP23/01CntCh ^W27/11-HDB02/12 Ch
In columns, for each season: Crop, sown crop (W, wheat; P; pea; Ra; rapeseed; Ca, camelina; B, barley); Sow, sowing dates; H, applied herbicides (Atl, Atlantis, Bc, Buctril Universal, Cnt, Centurion, H + S, Herold + Sencor, Mo, Monolith, Brd, Broadway); CM, cultural management (SR, stubble removal; RdS, random sowing; HD, high density −250 kg/ha; Ch, chisel plow). In season 2014–2015, sowing was performed on 29 September in RAPE (8), 31 October in TRAD-1 (1), CAME (9), and TRAD-2 (10), and 23 January in CER-SR (3), CER-CM (4), CER-RdS (5), CER-HD (6), PEA-CER (7), PEA-WHE (11), and PEA-CHI (12); in season 2015–2016, sowing was performed on 6 November in TRAD-1 (1) and WHEAT (2) and on 27 November in the rest of the managements; and in season 2016–2017, sowing was performed on 4 November in TRAD-1 (1), WHEAT (2), CER-CM (4), and TRAD-2 (10), and on 2 December in the rest of the management programs. * In the season when camelina was sown, there was no registered herbicide in Spain for its crop. An herbicide registered for rapeseed and with active ingredients similar to an authorized herbicide for camelina in the USA was used. ^ When chisel plow was applied, no glyphosate treatments prior to crop sowing were conducted.
Table 2. Applied herbicides during the three growing seasons.
ProductActive IngredientFormulationDose
TouchdownGlyphosate (36%)SL3 L/ha
Centurión PlusClethodim (12%)EC1.5 L/ha
Atlantis WGMesosulfuron-methyl (3%), iodosulfuron-methyl-sodium (0.6%), mefenpyr-dietil (9%)WG0.5 kg/ha
Monolith WGMesosulfuron-methyl (4.5%), propoxycarbazone-sodium (6.75%), mefenpyr-diethyl (9%)WG0.33 kg/ha
BiopowerAlkyletersulfate, sodium salt (27.65%)SL1 L/ha
SencorMetribuzin (60%)SC0.125 L/ha
HeroldFlufenacet (40%), diflufenican (20%)SC0.6 L/ha
BroadwayPiroxsulam (6.83%), Florasulam (2.28%)WG0.275 kg/ha
PG SupermojanteAlkylphenol ethoxylate (102.6%), propoxylateSL1 L/ha
Buctril UniversalBromoxynil (23.8%), 2,4-D (23.8%)EC1 L/ha
SL, soluble concentration; EC, emulsion able concentration; WG, water dispersible granulate; SC, concentrated suspension.
Table 3. Dates of herbicide application and chisel plow management in each program.
1. TRAD-12. WHEAT3. CER-SR4. CER-CM5. CER-RdS6. CER-HD7. PEA-CER8. RAPE9. CAME10. TRAD-211. PEA-WHE12. PEA-CH
Presowing Glyphosate25 October 201425 October 20143 December 20143 December 20143 December 20143 December 20143 December 201424 September 201425 October 201425 October 20143 December 2014
Chisel plow 22 January 2015
Centurión Plus 31 March 201529 October 2014
3 December 2014
3 December 2014 31 March 201531 March 2015
Atlantis WG + Biopower17 December 2014 4 March 20154 March 20154 March 20154 March 2015 4 March 2015
Broadway + PG Supermojante 4 March 2015
Buctril Universal15 January 2015
Presowing GlyphosateNoNoNoNoNoNoNoNoNoNoNo
Chisel plow 26 November 2015
Herbaflex 23 December 2015
Atlantis WG + Biopower23 December 201523 December 2015 20 January 2016 20 January 201620 January 2016 20 January 2016
Herold + Sencor SC 20 January 201620 January 201620 January 2016 20 January 2016 20 January 2016
Buctril Universal20 January 2016
Presowing Glyphosate26 October 201626 October 20161 December 201626 October 20161 December 20161 December 20161 December 20161 December 20161 December 201626 October 20161 December 2016
Chisel plow 1 December 2016
Monolith WG + Biopower 25 January 201712 December 2016 25 January 2017
Herold + Sencor SC12 December 2016 25 January 201725 January 2017 25 January 201725 January 2017
Broadway + PG Supermojante 25 January 2017 25 January 201725 January 2017
Buctril Universal25 January 2017 25 January 2017
Table 4. Monthly temperature and precipitation along the three growing seasons.
Mean Temperature (°C)Precipitation (mm)
2014–20152015–20162016–20172014–20152015–20162016–2017
September20.417.519.926.313.76.6
October15.913.914.523.12.435.4
November10.78.98.475.118.341
December4.35.83.612.13.410.6
January3.26.52.99.85.914.4
February4.77.17.612.052.38.8
March10.58.410.515.226.8100.3
April13.412.112.514.957.333.5
May17.915.217.74.755.624.2
June21.720.322.753.612.540.2
Mean (°C)/Total (mm)12.311.612.0246.8248.2315.0
Table 5. Results of the ANCOVA applied to the final densities of B. diandrus in each season. df, degrees of freedom; F, F test of Fisher; Sig., significance.
SourceType III Sum of SquaresdfMean SquareFSig.
2014–2015
Intercept24,246124,24614,0440.007
Error11,93269111726
Manag. Program85,83011780350280.001
Block38582192912430.309
Program * Block32,59221155210,4320.000
Error48,2053240.149
2015–2016
Intercept33,276133,27664,5620.000
Error287955860.515
Manag. Program4955110.45011300.387
Block130320.65116340.219
Program * Block8368210.39822780.002
Error25,1931440.175
2016–2017
Intercept45,098145,098790,1660.000
Error126022,0720.057
Manag. Program4187110.38141900.002
Block0.03620.0180.1970.823
Program * Block1907210.0910.7640.758
Error17,1121440.119
Table 6. Yield (kg/ha) (+SE) obtained in each management each growing season.
2014–20152015–20162016–20172014–20152015–20162016–2017Total
kg/hakg/hakg/ha€/ha€/ha€/ha€/ha **
1. TRAD-1W 981 ± 103W 3212 ± 406B 3341 ± 852175 ± 18578 ± 73528 ± 1351281 ± 179
2. WHEATW 1171 ± 95W 4880 ± 487W 3945 ± 396208 ± 17878 ± 88659 ± 661745 ± 202
3. CER-SRW 1216 ± 343B 5015 ± 512W 4371 ± 818216 ± 61782 ± 80730 ± 1371728 ± 243
4. CER-CMW 853 ± 350B 5467 ± 125W 3878 ± 338152 ± 62853 ± 20648 ± 561653 ± 42
5. CER-RsDW 886 ± 255B 4852 ± 275B 4202 ± 438158 ± 46757 ± 43664 ± 691579 ± 124
6. CER-HDW 982 ± 286W 3661 ± 288B 4225 ± 237175 ± 51659 ± 52668 ± 371502 ± 110
7. PEA-CERP 1237 ± 192B 4785 ± 59W 4515 ± 176297 ± 46746 ± 9754 ± 291797 ± 30
8. RAPERa 1124 ± 230W 3239 ± 200B 3921 ± 217353 ± 72583 ± 36620 ± 341556 ± 91
9. CAMECa 1220 ± 384W 2933 ± 165B 4639 ± 386383 ± 121528 ± 30733 ± 611644 ± 108
10. TRAD-2W 733 ± 145B 5827 ± 254W 3897 ± 313130 ± 26909 ± 40651 ± 531690 ± 222
11. PEA-WHEP 1027 ± 55W 4283 ± 438W 4324 ± 403246 ± 13771 ± 79722 ± 671739 ± 167
12. PEA-CHP 603 ± 309W 4458 ± 585B 3345 ± 458145 ± 74802 ± 105529 ± 721476 ± 191
The result of the statistical analysis for the overall income of each program is included in the last column. W, wheat; B, barley; P, pea; Ra, oilseed rape; Ca, camelina. ** One-way ANOVA gave no statistical differences (F = 0.844, P = 0.568) between management programs over all three growing seasons.
Table 7. Initial (ID) and final (FD) B. diandrus density means (plants m−2) under different management strategies by blocks, in 2014–2015, 2015–2016, and 2016–2017.
2014–20152015–20162016–2017
BlockManagementIDFDIDFDIDFDRD
1TRAD-1946003.80100
WHEAT264260.0200100
CER-SR97130.0200100
CER-CM79410.081.30100
CER-RsD10651010100
CER-HD8641010100
PEA-CER11000000100
RAPE18065000100
CAME14204010100
TRAD-2243030.1660100
PEA-WHE128080.02120100
PEA-CHI13413160.42220.2399.83
MEAN 1393.440.14.30.0299.99
2TRAD-1179850080.399.98
WHEAT5040140.15180100
CER-SR94279160.870100
CER-CM89826720.4120.2599.97
CER-RsD93122720.0200.0899.99
CER-HD76344000100
PEA-CER9793960.290100
RAPE1401016020.499.71
CAME80804010100
TRAD-243402060100
PEA-WHE746060.0240.0699.99
PEA-CHI80325380.44120.699.93
MEAN 81214.5280.26.60.1299.96
3TRAD-12283000.02180.4599.80
WHEAT18361240.61140100
CER-SR2669231300.310.04100
CER-CM2701371620.740100
CER-RsD2701621621261.599.94
CER-HD27323768010.06100
PEA-CER29171840.08310.1100
RAPE180514010.0499.98
CAME284711240.0250.499.99
TRAD-21349040.17120100
PEA-WHE2571060.10120.1100
PEA-CHI252842361.1081.399.95
MEAN 210520680.3110.3399.97
The reduction of density (RD) from ID 2014–2015 to FD 2016–2017 is also provided. For clarity, data results are shown separately for each block. No significant (p > 0.05) differences were detected by means of the Kruskal-Wallis test at the 5% level of probability for the RD analysis.

