Article

Leaf Eh and pH: A Novel Indicator of Plant Stress. Spatial, Temporal and Genotypic Variability in Rice (Oryza sativa L.)

1
Africa Rice Center, 01 BP 2551, Bouake 01, Ivory Coast
2
Centre de Coopération Internationale en Recherche Agronomique pour le Développement (CIRAD), Unité Propre de Recherche Agroécologie et Intensification Durable des cultures Annuelles (UPR AIDA), F-34398 Montpellier, France
3
Agroécologie et Intensification Durable des cultures Annuelles (AIDA), Univ Montpellier, Centre de Coopération Internationale en Recherche Agronomique pour le Développement (CIRAD), 34090 Montpellier, France
4
Centre d’Etude Régional pour l’Amélioration de l’Adaptation à la Sécheresse (CERAAS), BP 3320 Thiès Escale, Senegal
5
Centre de Coopération Internationale en Recherche Agronomique pour le Développement (CIRAD), Unité Mixte de Recherche Amélioration Génétique et Adaptation des Plantes méditerranéennes et tropicales (UMR AGAP), 34398 Montpellier, France
6
Amélioration Génétique et Adaptation des Plantes méditerranéennes et tropicales (AGAP), Univ Montpellier, Centre de Coopération Internationale en Recherche Agronomique pour le Développement (CIRAD), Institut National de Recherche Agronomique (INRA), Montpellier SupAgro, 34398 Montpellier, France
7
Agricultural Research Institute and Agrotest Fyto, Kroměříž 76701, Czech Republic
8
Institut National de Recherche Agronomique (INRA), Unité Mixte de Recherche (UMR) 1349 Institut de Génétique, Environnement et Protection des Plantes (IGEPP), BP35327, F-35653 Le Rheu CEDEX, France
9
Institut National Polytechnique de Toulouse (INPT), (Institut National de Recherche Agronomique) INRA, University of Toulouse, Unité Mixte de Recherche (UMR) 1248 AGroécologie, Innovations et TeRritoires (AGIR), BP 52627, 31326 Castanet-Tolosan, France
10
School of Materials Science and Engineering, University of New South Wales, Kensington, NSW 2052, Australia
11
Institute of Resource, Ecosystem and Environment of Agriculture, Nanjing Agricultural University, Nanjing 210095, China
12
Discipline of Chemistry, University of Newcastle, Callaghan, NSW 2308, Australia
*
Author to whom correspondence should be addressed.
Agronomy 2018, 8(10), 209; https://doi.org/10.3390/agronomy8100209
Submission received: 7 September 2018 / Revised: 20 September 2018 / Accepted: 26 September 2018 / Published: 29 September 2018
(This article belongs to the Section Farming Sustainability)

Abstract

:
A wealth of knowledge has been published in the last decade on redox regulations in plants. However, these works remained largely at cellular and organelle levels. Simple indicators of oxidative stress at the plant level are still missing. We developed a method for direct measurement of leaf Eh and pH, which revealed spatial, temporal, and genotypic variations in rice. Eh (redox potential) and Eh@pH7 (redox potential corrected to pH 7) of the last fully expanded leaf decreased after sunrise. Leaf Eh was high in the youngest leaf and in the oldest leaves, and minimum for the last fully expanded leaf. Leaf pH decreased from youngest to oldest leaves. The same gradients in Eh-pH were measured for various varieties, hydric conditions, and cropping seasons. Rice varieties differed in Eh, pH, and/or Eh@pH7. Leaf Eh increases and leaf pH decreases with plant age. These patterns and dynamics in leaf Eh-pH are in accordance with the pattern and dynamics of disease infections. Leaf Eh-pH can bring new insight on redox processes at plant level and is proposed as a novel indicator of plant stress/health. It could be used by agronomists, breeders, and pathologists to accelerate the development of crop cultivation methods leading to agroecological crop protection.

1. Introduction

pH has been recognized for long as a master variable in plant physiology, from subcellular to cellular and at the whole plant levels [1]. The recognition of the role of redox regulation is more recent, but a wealth of publications in the last decade demonstrate the tremendous progresses achieved by plant physiologists in understanding redox signaling in plants. Reactive oxygen species (ROS), which largely determine redox status in the plant, are no longer seen as toxic by-products of aerobic pathways but as beneficial companions of plants’ developmental processes [2]. The consensus view is that redox signaling is intrinsic to many developmental processes and responses to the environment [3,4,5] and that reactive oxygen species (ROS) have a profound influence on almost every aspect of plant biology [6].
ROS are further recognized as important molecules that affect vegetative and pathogenic processes in pathogenic fungi. They are not only secreted during the interaction of host and pathogen but also are involved in tightly controlled intracellular processes [7]. For instance, powdery mildew resistance has been associated to redox balance in pea [8] and the importance of regulation of nitric oxide (NO) and ROS in potatoes’ response to pathogens has been highlighted [9]. It is thus expected that a multitude of redox enzymes play an important role in plant immunity regulation [10,11].
Recent research has also pointed to the role of ROS in the functioning of beneficial fungi. For instance, ROS regulate mutualistic interactions between Epichloe festucae and its grass host [12] and play a role in the proliferation of arbuscular mycorrhizae (AM) fungi in plants and in plant/AM interactions [13]. Lucas et al. (2014) also found that a strain of rhizobacteria associated with rice plants primed enzymes related with the detoxification of ROS [14]. Finally, redox signaling has been identified as a possible unifying mechanism for the mode of action of the wide range of chemical- and hormone-based plant bioregulators [15].
Thus, the current increased understanding of ROS acting as signaling molecules has opened new avenues to exploit redox biology for crop improvement required for sustainable food security [16].
However, these works on redox regulations remained largely at cellular and organelle levels. Despites some advances and a growing interest in the understanding of redox mechanisms of plant systemic responses to pathogens and abiotic stresses [4], an understanding of redox regulation at both plant level and field level is still needed. Thus, Noctor et al. [17] stressed the need: (i) to gauge the oxidative stress intensity (or the intensity of the plant response) to establish whether and to what extent a given genetic modification or condition is generating oxidative stress, and (ii) to provide new insight into the mechanisms of oxidative stress and redox regulation in plants. Noctor et al. [17] also emphasized the need for identification of reliable and informative markers, which are crucial to understanding how plants exploit and respond to oxidative stress and how such markers should greatly aid stress diagnostics in agriculture and environmental science.
Developing indicators of plant stress received a lot of attention and various methods have been proposed, as chlorophyll fluorescence [18], photo-oxidative stress markers (including photosynthetic pigments, PSII efficiency, ROS, reactive carbonyl species, antioxidant systems) [19], or digital imaging [20]. Eh (redox potential, measuring the oxidation/reduction state) is often measured at cellular and subcellular levels. However, despites the possible interactions between Eh and pH, studies of redox regulations are generally disconnected from studies of pH, and Eh-pH interactions are ignored most of the time [21]. Correcting Eh to pH7 (Eh@pH7) or calculating pe (electronic potential) + pH, which are equivalent notions, could help better define the redox conditions [22].
Thus, it can be expected that measuring both Eh and pH, at plant level, could provide a good indicator of global plant stress.
For agronomists, having such a means to measure directly the reaction of a plant to soil conditions and cropping practices (soil amendment, fertilization, varieties, crop rotation, pesticide application, etc.) could greatly help and speed up the processes of developing new agronomic methods, variety selection, and plant protection approaches.
The aim of the studies presented in this paper was therefore to develop a simple but reliable method for measuring leaf Eh and pH, and produce new insight into redox processes at plant level for agronomists. Rice (Oryza sativa L.) was used as a model plant for redox studies because of its ability to grow in a very wide range of soil redox conditions, under aerobic or anaerobic field conditions. We present here the results of a series of experiments in pots. We first report the temporal variability in Eh-pH of the last fully expanded leaf of the main tiller, according to the time of day, plant age, and across the seasons. We then present the varietal variations for 3 rice varieties, and we finally present the spatial variations of leaf Eh-pH (intra and inter-leaf variations). This knowledge allows us to propose the use of leaf Eh-pH as an indicator of plant health, which could be a useful and powerful tool for agronomist, breeders and plant pathologists.

2. Materials and Methods

2.1. Soil, Nutrients, Plants, and Water Management

In all experiments but one, the soil used was produced by Africa Rice farm unit, as a thoroughly homogenized clayey soil coming from the “bas-fond” area of the experimental station. The 11 dm3 pots were filled-in with 8 dm3 of soil. Only the third season of the “Intra leaf variability” experiment was conducted with a thoroughly homogenized mixture of sandy soil (Arenosol) and organic matter (forest top soil).
In the first experiment of each series, no fertilizer was added. In the next experiments, 1 g of NPK fertilizer (15-15-15) diluted in 1 dm3 of water was added in each pot the day before sowing. Finally, in the last experiment of each series, Hoagland solution [23] was used instead of NPK fertilizer to prevent any risk of nutrient deficiency (1 dm3/pot before sowing, 1 dm3/pot 30 days after sowing (DAS)). Hoagland’s solution was prepared with Sigma Aldrich (Saint-Louis, MO, USA) products suitable for plant cell culture.
Genetically pure rice seeds were obtained from the Genetic Resources unit of Africa Rice in Cotonou.
Before planting rice seeds pre-germinated for 72 h, soils were first saturated with water by addition of 3 dm3/pot for all treatments. In the “lowland management” treatments, pots were kept submerged with 2 cm of water above the soil surface during the complete cultivation period. In the “upland management” treatments, two hours after saturation with water, pots were opened in the bottom by 8 mm diameter holes. They were then watered every day with 1 dm3/pot, to prevent any water stress. Soil water content was kept permanently between 18% and 35% on a volume basis, and was between 21% and 27%, close to field capacity, during all the periods of measurement.

2.2. Experimental Settings

Three series of experiments were conducted concomitantly, at the Africa Rice research station in Cotonou, Bénin (6°25’13” N; 2°19’38” E, 12 m above mean sea level), as summarized in Table 1.
For all series of experiments, the pots were arranged at 1 × 1 m, directly on the soil, in an open field, and the treatments were randomly arranged in each block (first series) or fully randomized (second and third series).

2.2.1. Diurnal Change Experiments

In the first series of experiments, we studied the diurnal changes of the middle part of the last fully expanded leaf (i.e., the last fully developed leaf) of the main tiller in three rice (Oryza sativa L.) varieties, with a measurement every 30 min for each variety, from 6:00 a.m. (before sunrise) to sunset. Plants were grown outside, in 11 dm3 plastic pots, in aerobic conditions (“upland management”). For each of the three varieties, five pre-germinated rice seeds were planted per pot. Fifteen pots were planted for each variety, arranged in 5 blocks with 3 pots of each variety. The day of the measurement, plants with the same development stage were selected (with the same number of tillers and leaves per tiller) and measured in a randomized order, with one replication of each variety every 30 min.
This experiment was conducted 4 times (= four “seasons”), with variations in fertilization (No fertilization during the first season, NPK fertilizer in the second and third season, and Hoagland solution in the last season) and varieties. In the first two seasons, three upland rice varieties were used, with an equivalent cycle of 90–95 days from sowing to 50% maturity:
  • an O. sativa sub. japonica upland rice variety: IDSA6 = IRAT216
  • an O. sativa sub. indica upland rice variety: IRBLTA-2Pi
  • a crossing between O. glaberrima × O. sativa, upland rice variety: Nerica4
In the next seasons, IDSA6 was replaced by another O. sativa sub. japonica upland rice variety: Azucena, frequently used by plant physiologists.
In total, measurements were conducted for 14 days and 3 varieties per day. Measurements on 10 October 2016 and 31 January 2017 were abandoned due to strong storms. Thus, we report here the results for 36 days × varieties.

2.2.2. Intra-Leaf Variability Experiments

In the second series of experiments, we studied the Eh and pH variations within the leaves in four experiments. Plants were grown in 11 dm3 pots, with 1 plant per pot, and 4 pots for each treatment. For each leaf measured (last fully expanded leaf in the first three seasons, last and third last fully expanded leaves in the last season), the base, the middle, and the tip of each leaf were measured in a randomized order.
Nerica4 variety was grown:
  • in “upland” conditions, without fertilizer in the first season.
  • in “upland” (aerobic) and in “lowland” (permanently submerged) conditions with NPK fertilizer in the second season.
  • in “upland” and in “lowland” conditions with Hoagland solution in the third season.
IR64 variety was grown in lowland conditions and Hoagland solution in the last season.

2.2.3. Inter-Leaf Variability Experiments

In the third series, we studied the spatial variability according to leaf position on the plant, measuring Eh and pH in the middle part of each leaf, for each tiller. Plants were grown in 11 dm3 pots, with one plant per pot to avoid competition for light. Six pots were planted for each treatment and measurement date, and randomly arranged outside in a field. Measurements were conducted plant after plant. All the leaves of one plant were measured in a randomized order and all the measurements were conducted between 11:00 a.m. and 4:00 p.m. This experiment was conducted four times in pots, using Nerica4 variety, with some variations in the growing conditions:
In the first and the second seasons, the experiments were conducted in aerobic conditions (“upland management”), without fertilizer during the first season and with NPK application during the second season.
In the third season, as Husson et al. [24] have shown that soil Eh-pH gradient could be inverted by cropping practices. The experiment was conducted in aerobic conditions in two treatments creating inversed Eh and pH gradients in soil, to assess the impact of Eh-pH soil gradient on plants. Instead of mixing the arenosol and the organic soil in the pots, a “natural soil gradient” was created by filling the bottom half of the pots with the arenosol and the upper part with the organic soil, and a “reversed soil gradient” was created doing the opposite (organic soil in the bottom and arenosol in the upper half). To prevent nutrient deficiency, Hoagland solution was applied in both treatments.
In the fourth season, the experiment was conducted with Nerica4 variety grown in anaerobic conditions (“lowland management”) and a lowland variety (IR64, O. sativa sub. Indica, well-known by physiologists) grown both in aerobic (“upland management”) and in anaerobic (“lowland management”) conditions, with application of Hoagland solution.
In a fifth season, Nerica4 variety was grown in a field, in upland conditions at Africa Rice Station in Cotonou, on an arenosol, with application of 200 kg/ha NPK fertilizer (15-15-15) at sowing.

2.3. Eh and pH Measurements

2.3.1. Soil Eh and pH

Soil Eh was measured with WTW (Weilhem, Germany) ProfiLine pH 3110 pH meters (>5 × 10¹² Ohm input resistance), using radiometer analytical Ag/AgCl (KCl 3M) reference electrodes Ref 321 and custom-made Paleo terra (Amsterdam, The Netherlands) platinum electrodes. These electrodes were 30 cm long, 8 mm in diameter, and made from fiberglass-reinforced epoxy with 3 platinum rings (width: 0.4 mm; surface: 5 mm2) inserted at 5 cm distance into the pot soil. Two electrodes were directly inserted into the soil, to locate the platinum rings at 3, 8, and 13 cm deep. For each depth, the two electrodes were connected in parallel to a WTW ProfiLine pH 3110 m, and a reference-electrode connected to the voltmeter was inserted into the soil surface. Measurements were taken after stabilization of the voltage (less than 1 mV drift in one minute). The electrodes were cleaned and tested each day, before and after each set of measurements, according to the procedure indicated by Husson et al. [22] with a Hach (Loveland, Colorado, CO, USA) 220 mV redox buffer solution (ref LZW9400.99), and in the same solution diluted (1%) in 0.1 M KCl solution.
All redox potential data presented are actual Eh (mV) vs. standard hydrogen electrode (SHE), The measured E (mV vs. Ag/AgCl 3M) values have been corrected to Eh (mV) as a function of the temperature through the equation: Eh (mV) = E (mV) + 225.8 − 0.73 t (°C) derived from the table provided by Radiometer Analytical (Vaux-en-Velin, France) for the REF 321 Ag/AgCl KCl 3M electrode.
Soil pH and temperature were taken with a Hach 5014T pH combined electrode (LZW5014T.97.002) directly inserted in the humid soil, and connected to WTW 3110 pHmeter. Calibration of the pH meter was performed every day, with Hach pH buffer solution at pH 7.00 (LZW9464.98) and pH 4.01 (LZW9463.99).
Soil humidity was measured with a WET 2 sensor connected to a Delta HH2 moisture Meter (Delta-T Devices, Cambridge, UK), calibrated for “clayey” soil.

2.3.2. Leaf Eh and pH

The method for measuring leaf Eh has been adapted from Benada [25,26].
It aimed at a direct measurement in a living organism, in aerobic conditions, recognizing that respiration and photosynthesis strongly impact Eh and that Eh of living organisms should be measured when they are still alive, in their natural conditions i.e., aerobic conditions in the case of plants.
Leaf Eh was measured with WTW ProfiLine pH 3110 pH meters (>5 × 10¹² Ohm input resistance), using radiometer analytical Ag/AgCl (KCl 3M) reference electrodes Ref 321 and Radiometer Analytical Platinum electrodes (M241 Pt-E31M001, with a platinum plate having a surface of 5 mm × 5 mm = 25 mm2).
The choice of the location for conducting the measurements is crucial for leaf Eh measurement, as it is influenced by electromagnetic waves as shown for soil Eh measurement by Husson et al. [22]. These effects are even stronger when measuring in plant leaves, having a high water content and being less poised than soils. All measurements were therefore conducted outdoor, in an environment identified as being free of electromagnetic interference.
As for soil measurement, the electrodes were cleaned and checked before each set of measurements, in the 220 mV buffer solution and in its dilution at 1% in 0.1 M KCl.
A filter paper was placed in a Petri dish and watered with 0.1 M KCl solution (used as an electric bridge). The reference electrode was placed vertically on a support, standing with the porous plug on the filter paper. The middle part of the leaf was taken from the living plant and rapidly (within 1 min) rolled in order to make several layers, sufficiently thick to allow penetration of the whole platinum plate (5 mm, requiring usually twelve layers for rice leaf). The platinum electrode was then pinched into the rolled leaf, parallel to the main vein, at equal distance between the main vein and the edge of the leaf. The leaf and the electrode were then placed with the electrode standing vertically on the leaf, placed on the filter paper at approx. 2–3 cm from the reference electrode, as seen in Figure S1. The electric potential between the two electrodes showed a decrease, reaching a plateau within a few minutes, and then started rising. This lower turn point value was taken as the measured value, reflecting the Eh of the living leaf. The platinum electrode was then removed from the leaf and pinched again, on the other side of the main vein of the leaf. In some cases, the value on the voltmeter immediately raised. In such case, the first measurement was considered as the measured E (vs. Ag/AgCl) value for the leaf. In other cases, it showed again a decrease, reaching a plateau, usually a few mV lower than the first one. In this case, the lowest of the two measurements was considered as the E (vs. Ag/AgCl) of the plant.
All the measured values of E (vs. Ag/AgCl) were corrected to Eh (vs. SHE), as for soils.
Eh@pH7, which is equivalent to pe + pH, can be used in addition to Eh and pH to better define the redox conditions of a system, characterizing the electron activity independently of the proton activity [22]. Eh@pH7 was calculated as Eh@pH7 = Eh + (pH−7) × R × T × Ln10/F, where Eh is measured in volts, R is the perfect gas constant (8.314471 JK−1 mol−1), F is the Faraday constant (96485.3383 C mol−1) and T is the temperature in Kelvin.
The leaf was then rinsed with a few drops of distilled water, dried by vigorous shaking and placed into a ceramic mortar. It was gently hand-crushed for 1 min and placed in a 5 mL plastic syringe. Pressing the plunger of the syringe allowed the extraction of a few drops which were used for direct measurement of pH and temperature with an ISFET type pH meter (Hach H160 pH Meter with a PHW37-SS electrode), calibrated each day before measurement with Hach pH buffer solution at pH 7.00 (LZW9464.98) and pH 4.01 (LZW9463.99).
Solar radiation was measured at each sampling time with a LI-250A Radiometer/Photometer and a LIC190RBN02 Quantum captor from LI-COR (Lincoln, NE, USA).

2.4. Statistical Analysis

Scatter plots were performed for the relationship between Eh, pH, Eh@pH7 and time or leaf length showing different types of relationships. Quadratic regressions between Eh, pH, Eh@ph7 and time of the day were performed for the different DAS × varieties of measurements. Linear regressions were performed between and Eh, pH, Eh@pH7 and the leaf length for the first three age classes.
Analysis of variance (ANOVA) was conducted on Eh, pH, Eh@ph7, temperature, and solar radiation for comparison of growing seasons, plant age (DAS) and varieties. ANOVAs were followed by a comparison of means using the Ryan-Einot-Gabriel-Welsh test Q (REGW-Q) as it provides the best compromise between the need to have a powerful test and the need to limit the familywise error rate at α, according to Howell (2009) [27].
All statistical analyses were performed with XLSTAT (XLSTAT Premium, v. 2018.5, Addinsoft, Paris, France) [28].

3. Results

3.1. Temporal Variations of Eh, pH and Eh@pH7 in Rice Leaves

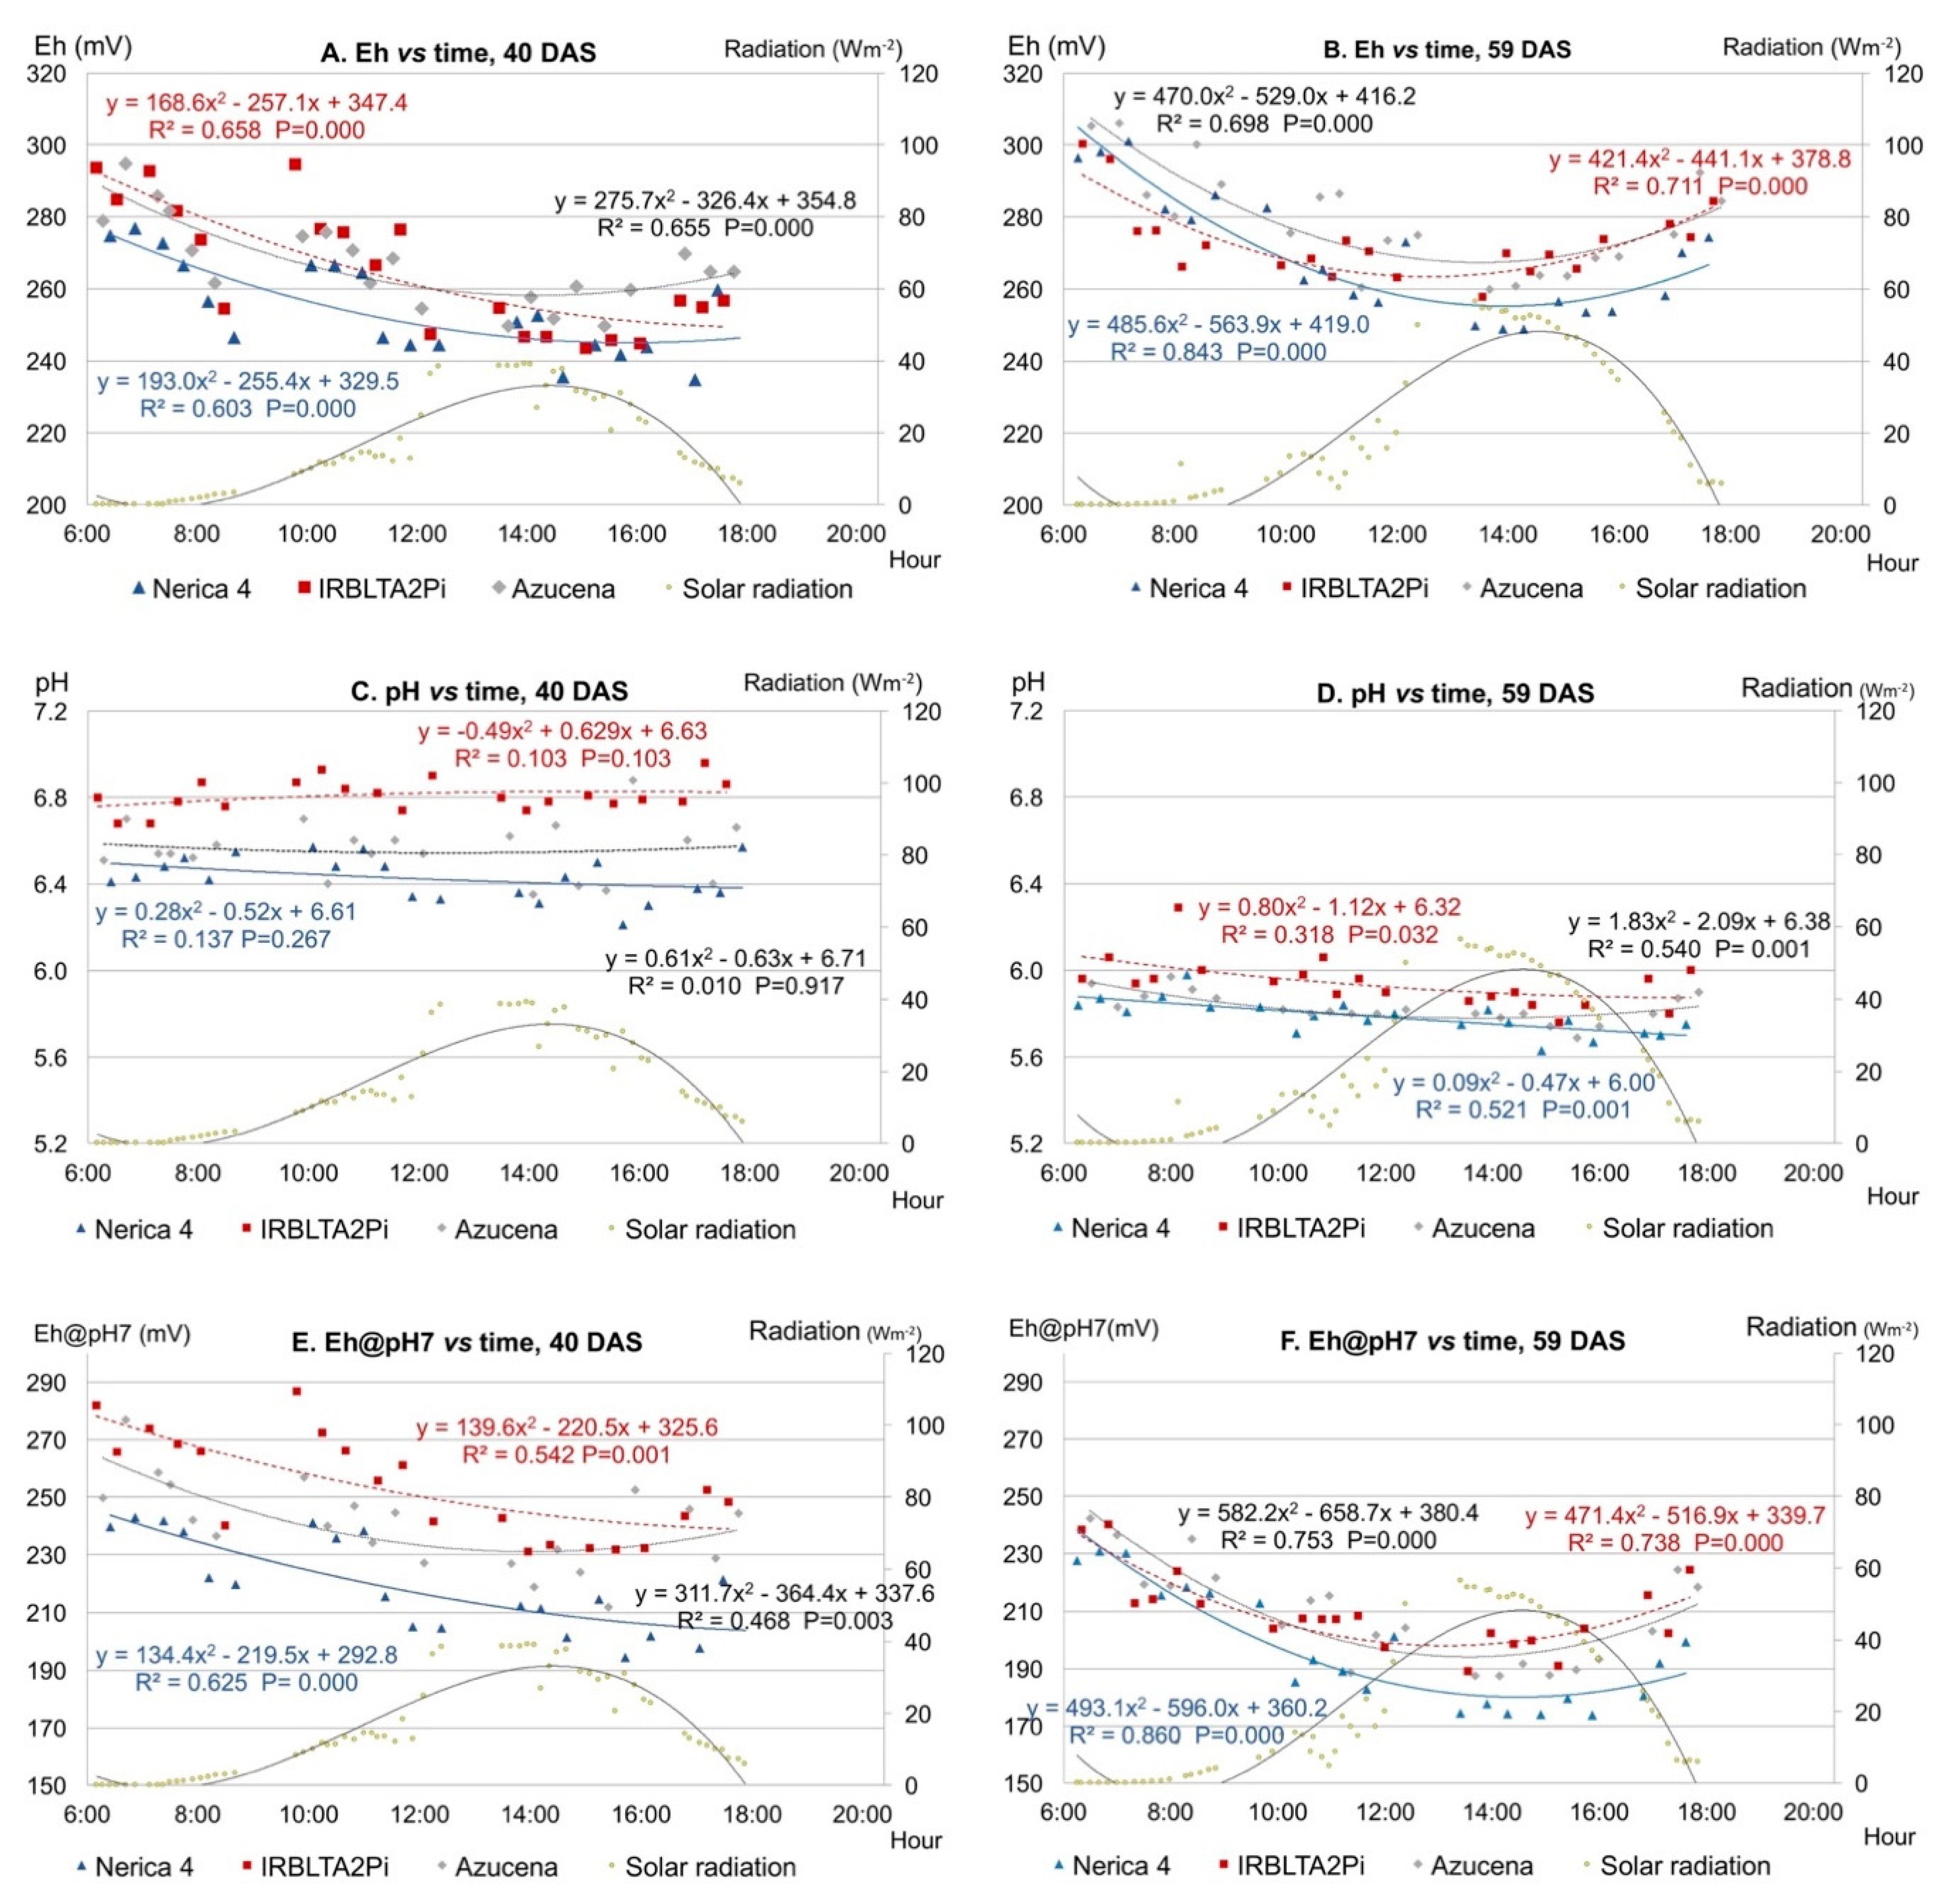
3.1.1. Diurnal Variations

Eh of the last fully expanded leaf of the main tiller showed the same diurnal variations, for all the varieties and for each of the 12 days of measurement. Eh was maximum at the end of the night and decreased during the morning until 10:00 to 11:00 a.m. It was stable in the middle of the day, as seen in Figure 1, until 4:00 to 5:00 p.m., when it started to increase again. Significant quadratic correlations between Eh and time of the day were measured for the 36 days × varieties of measurement, shown in Table S1.1, with R2 ranging from 0.30 to 0.85, and a median R2 of 0.65.
pH of the last fully expanded leaf appeared to be more stable than Eh and was weakly correlated with time in most of the days (significant correlation in only 13 days × variety), with a R2 above 0.5 in only 11% of the cases, a median R2 of 0.27, and a maximum R2 of 0.71 over the 36 days × varieties of measurement (Figure 1 and Table S1.1).
Eh@pH7 (Eh corrected to pH 7) showed the same diurnal variations as Eh, with a significant correlation in 30 over 36 days × variety, a maximum R2 of 0.86 and a median R2 of 0.51 (Figure 1 and Table S1.1).
Eh and Eh@pH7 were also correlated with:
  • temperature, with a median R2 of 0.48 and 0.39 respectively, as seen in Table S1.2, and
  • solar radiation, with median R2 of 0.58 and 0.47 respectively, as seen in Table S1.3.

3.1.2. Plant Age

Plants that had grown for 60 days after sowing (DAS) appeared to be significantly more oxidized (higher Eh) and acidic (lower pH) than plants after 40 DAS, for all the varieties and the different seasons experienced during the experiment, as shown in Figure 1 and Figure 2A and Table 2. Importantly, this cannot be explained by differences in temperature or solar radiation at the day of measurement, as measurements at 40 DAS were carried out at higher temperature and lower solar radiation than at 60 DAS during season III, and the opposite during season IV. Interestingly, the increase in Eh with plant age was not related to an increase in Eh@pH7: depending on cropping season and fertilization, as seen in Figure 1 and Figure 2A,B, Table 2 and Tables S2, S3.1, S3.2 and S4, Eh@pH7 could decrease with plant age as in season III with NPK fertilizer, or increase as in season IV with Hoagland solution.

3.1.3. Cropping Season

Highly significant differences in Eh and significant differences in pH and Eh@pH7 were measured for the fully expended leaf (last fully expanded leaf) of the Nerica4 rice variety, as seen in Table 3, for plants grown in the same conditions (same variety, soil, fertilization, water management, and plant age) and at different periods of the year (second and third “seasons” of the series). The same trend was observed for IRBLTA-2Pi variety, but differences were not significant. Temperature was not significantly different between cropping seasons, as seen in Table 3, while solar radiation was significantly different.
Higher pH and lower Eh and Eh@pH7 were observed when solar radiation was high (Table 3 and Tables S5.1 and S5.2). The same trends in Eh and pH were measured, with significant differences, for: (i) the two varieties tested during the second, third and fourth seasons (Table S5.1), and (ii) the three varieties tested during the third and fourth seasons (Table S5.2) although the fertilization during the fourth season was different: NPK in seasons II and III was replaced by Hoagland’s solution [23] in the fourth season.

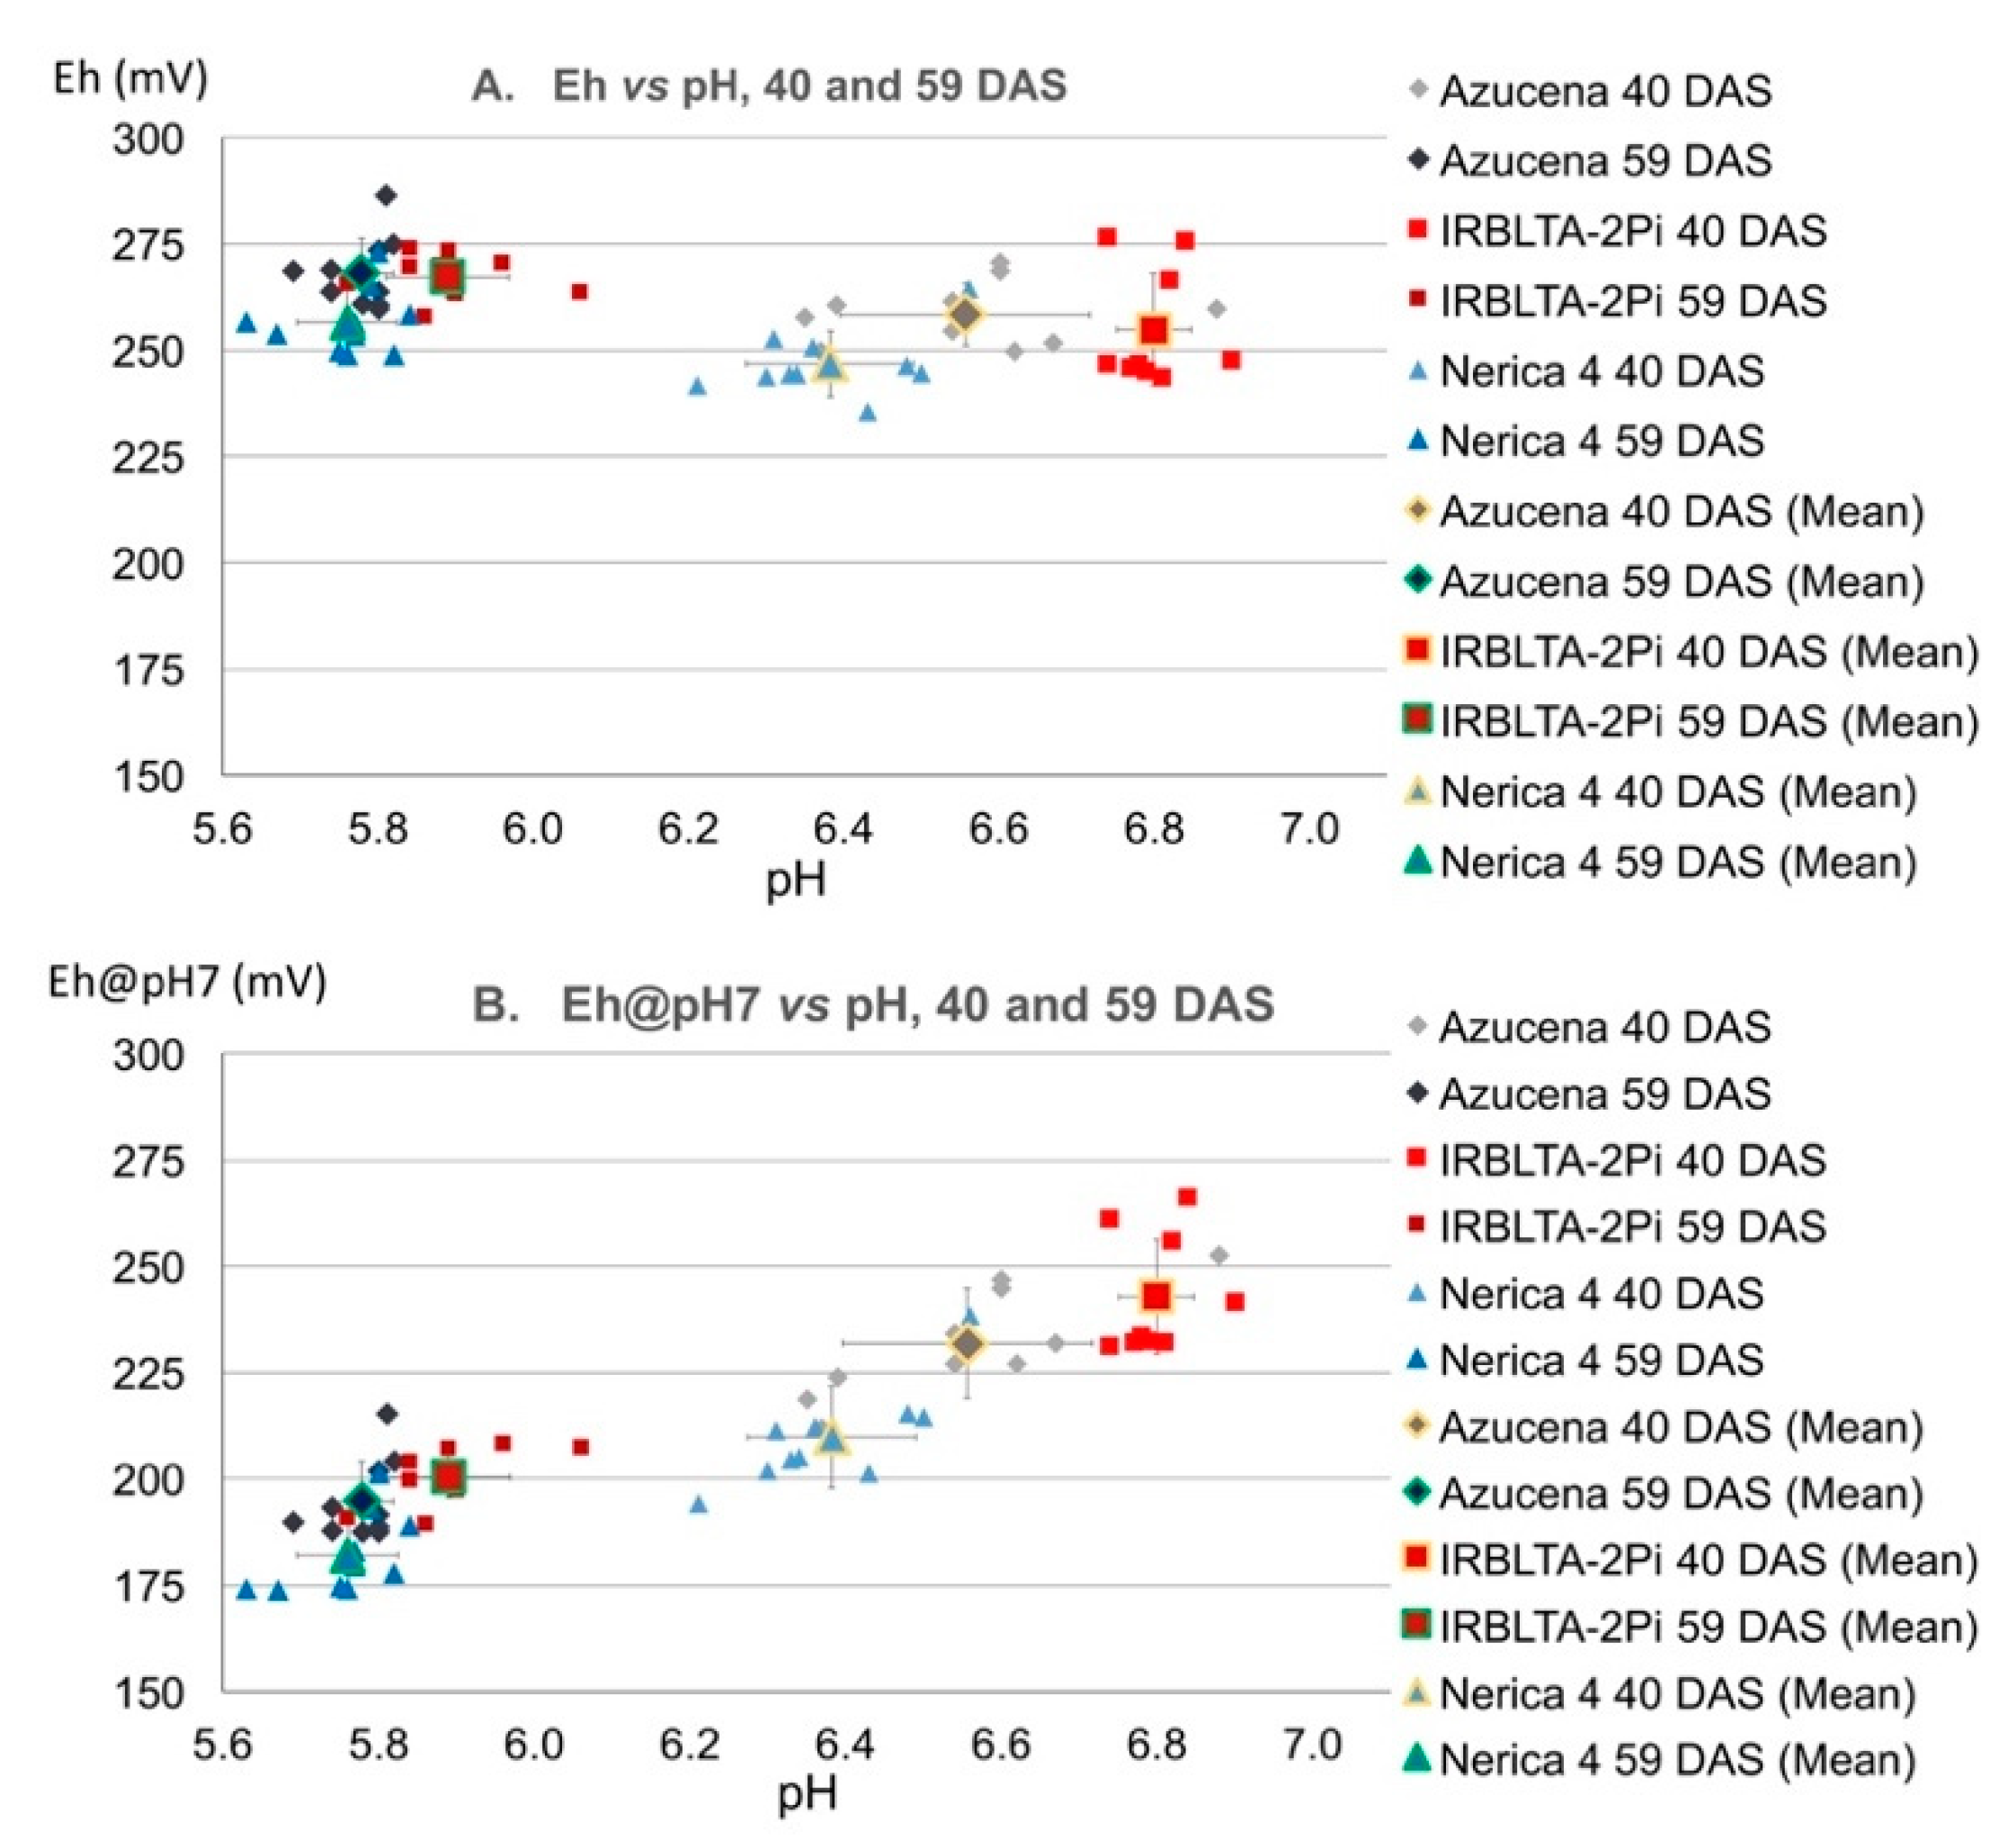
3.2. Varietal Differences in Eh, pH and Eh@pH7

The measurements made on the last fully expanded leaf of the main tiller between 11:00 a.m. and 4:00 p.m., during a period of low fluctuation of the 3 parameters, were used to compare varieties. They showed significant differences in Eh, pH and/or Eh@pH7, shown in Figure 2A,B, Table 4 and Table S4 for all cropping seasons and plant ages.
Nerica4 had a significantly lower Eh than the other varieties. IRBLTA-2Pi had a higher pH than Azucena. Nerica4 had a significantly lower Eh@pH7 than Azucena, and IRBLTA-2Pi had significantly the highest Eh@pH7 (Figure 1; Table 4 and Table S4).

3.3. Spatial Variations of Leaf Eh, pH and Eh@pH7 in Rice Leaves

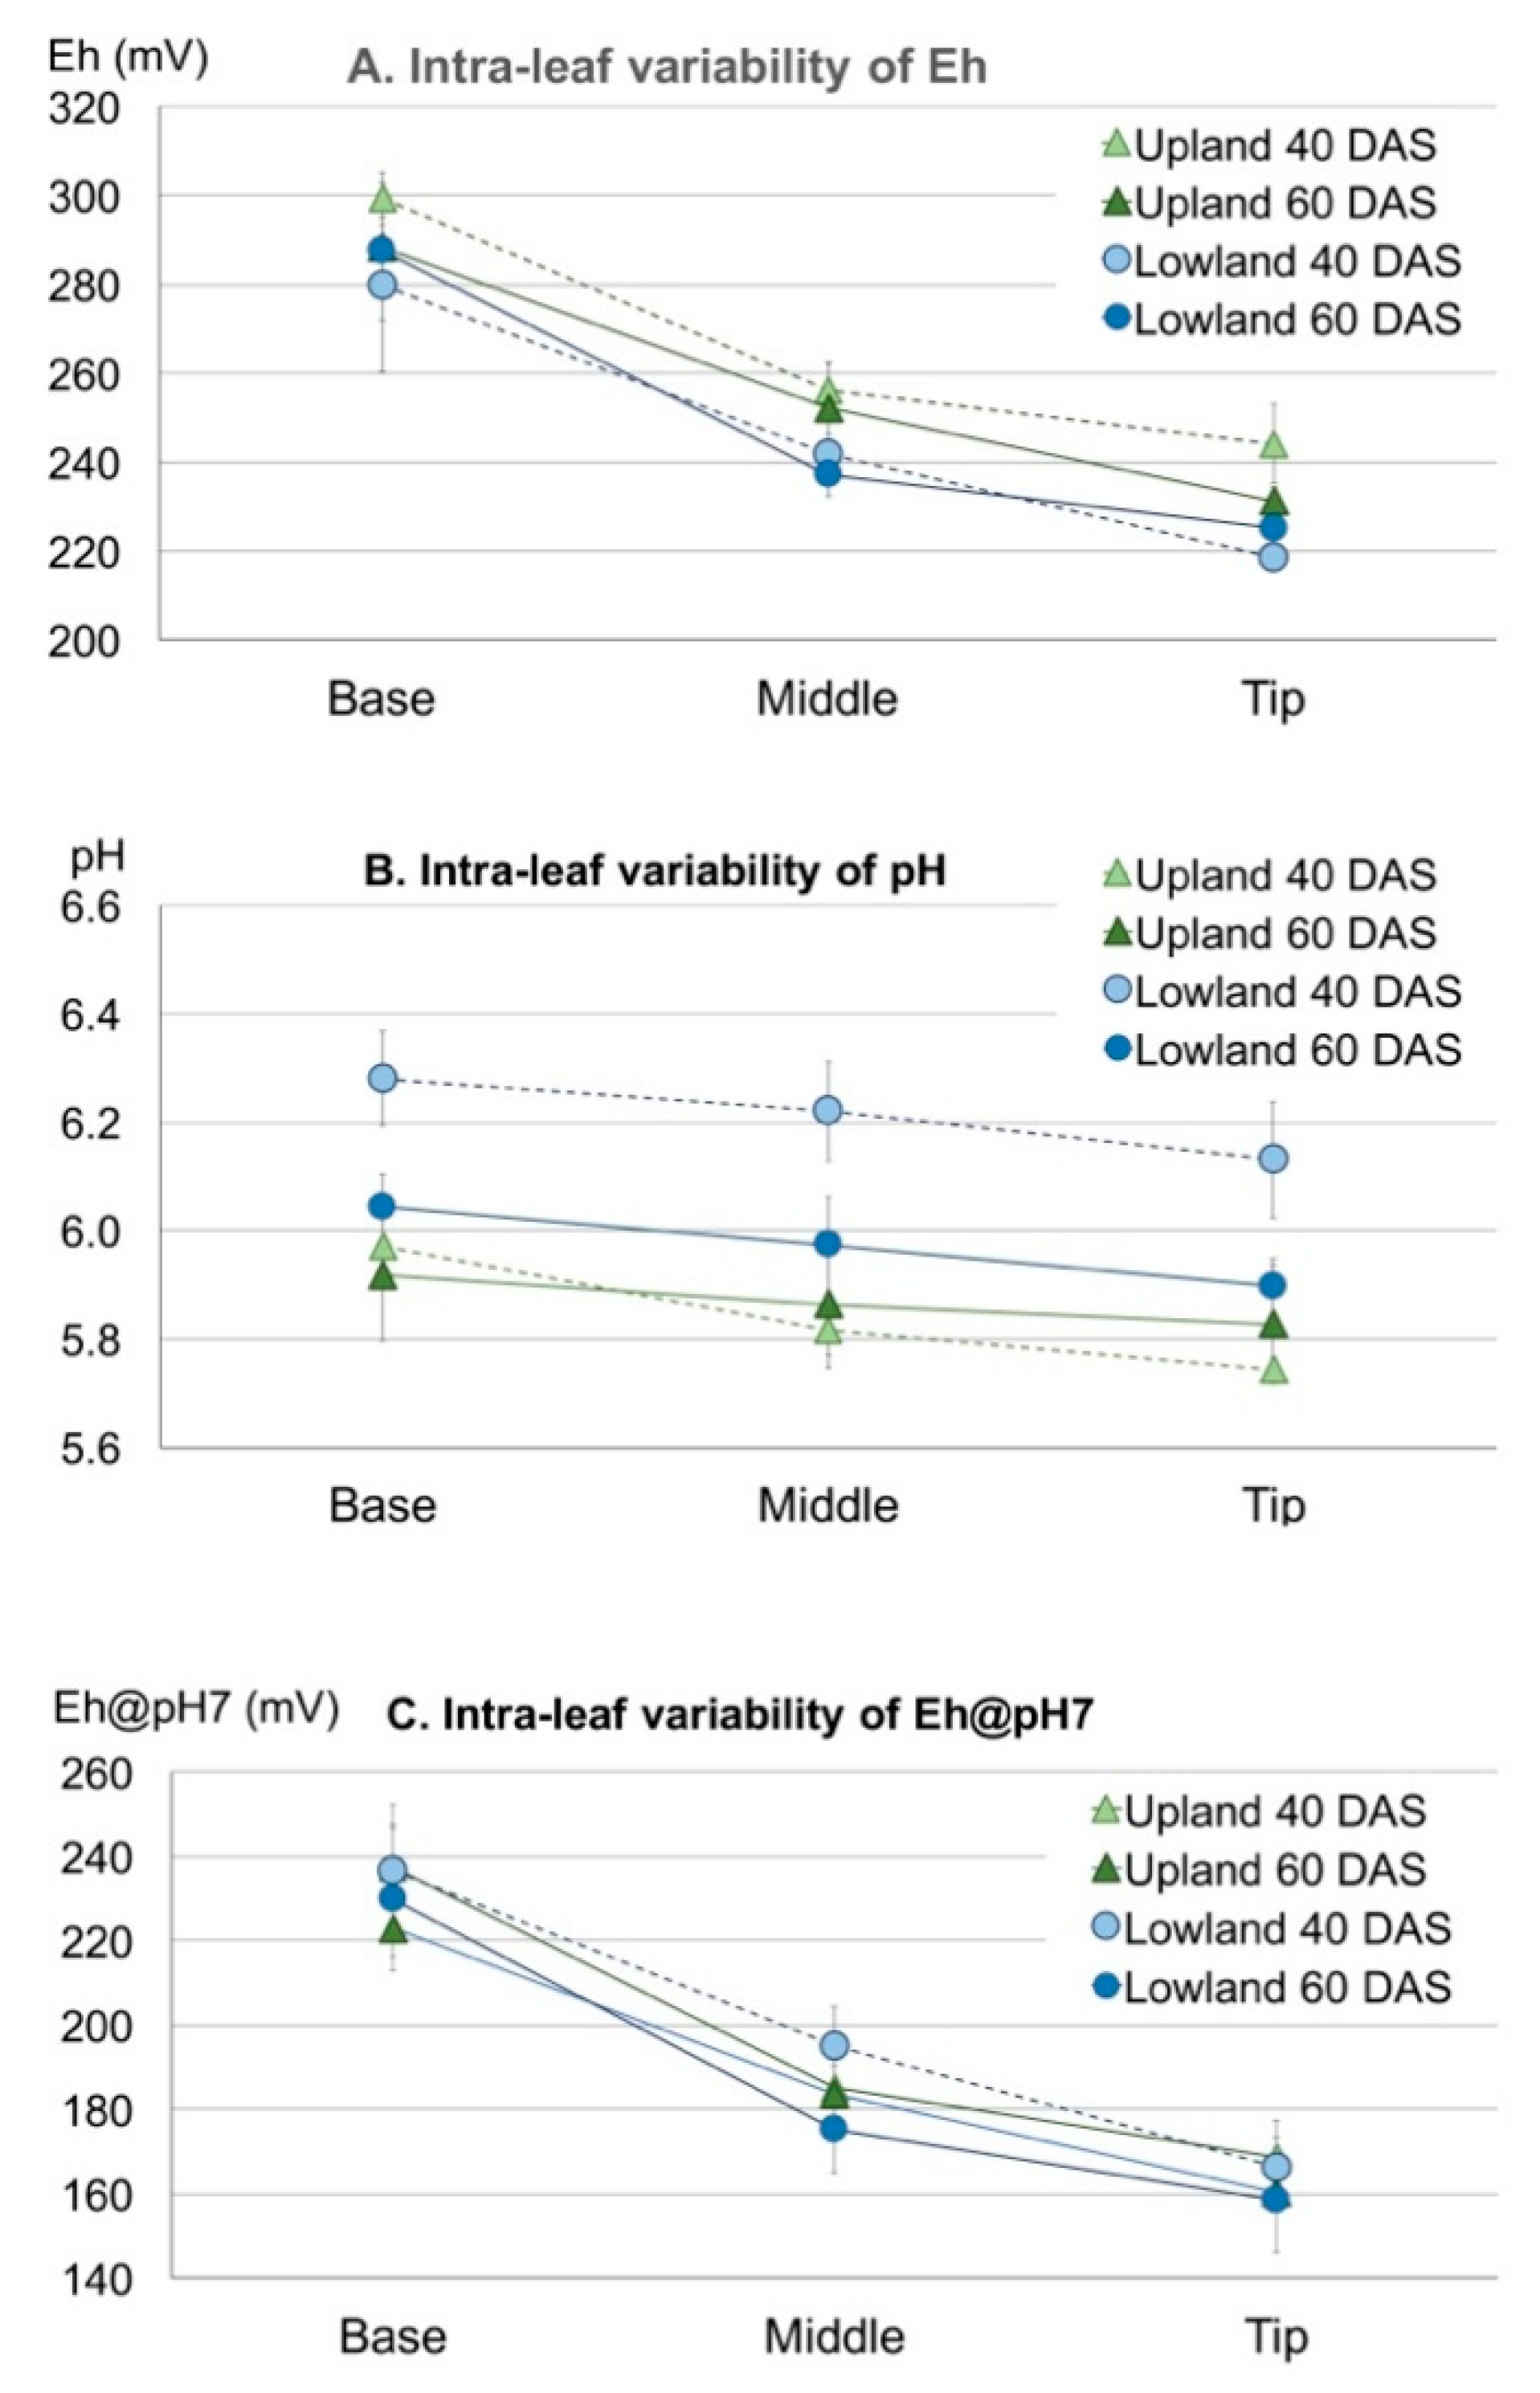
3.3.1. Intra-Leaf Variability

In most cases, the base of the leaf had higher Eh and pH than the tip of the leaf, as seen in Figure 3 and Table S2, and the middle part being most of the time at an intermediate Eh and pH. This was observed over the four seasons, on Nerica4 (upland variety, Oryza sativa type japonica x O. glaberrima) and IR 64 (lowland variety, Oryza sativa sub. indica), in aerobic (“upland” water management) and anaerobic (“lowland” management, with submersion) conditions, for the last fully expanded leaves of all primary tillers, and for older leaves in the main tiller, as seen in Table S2.

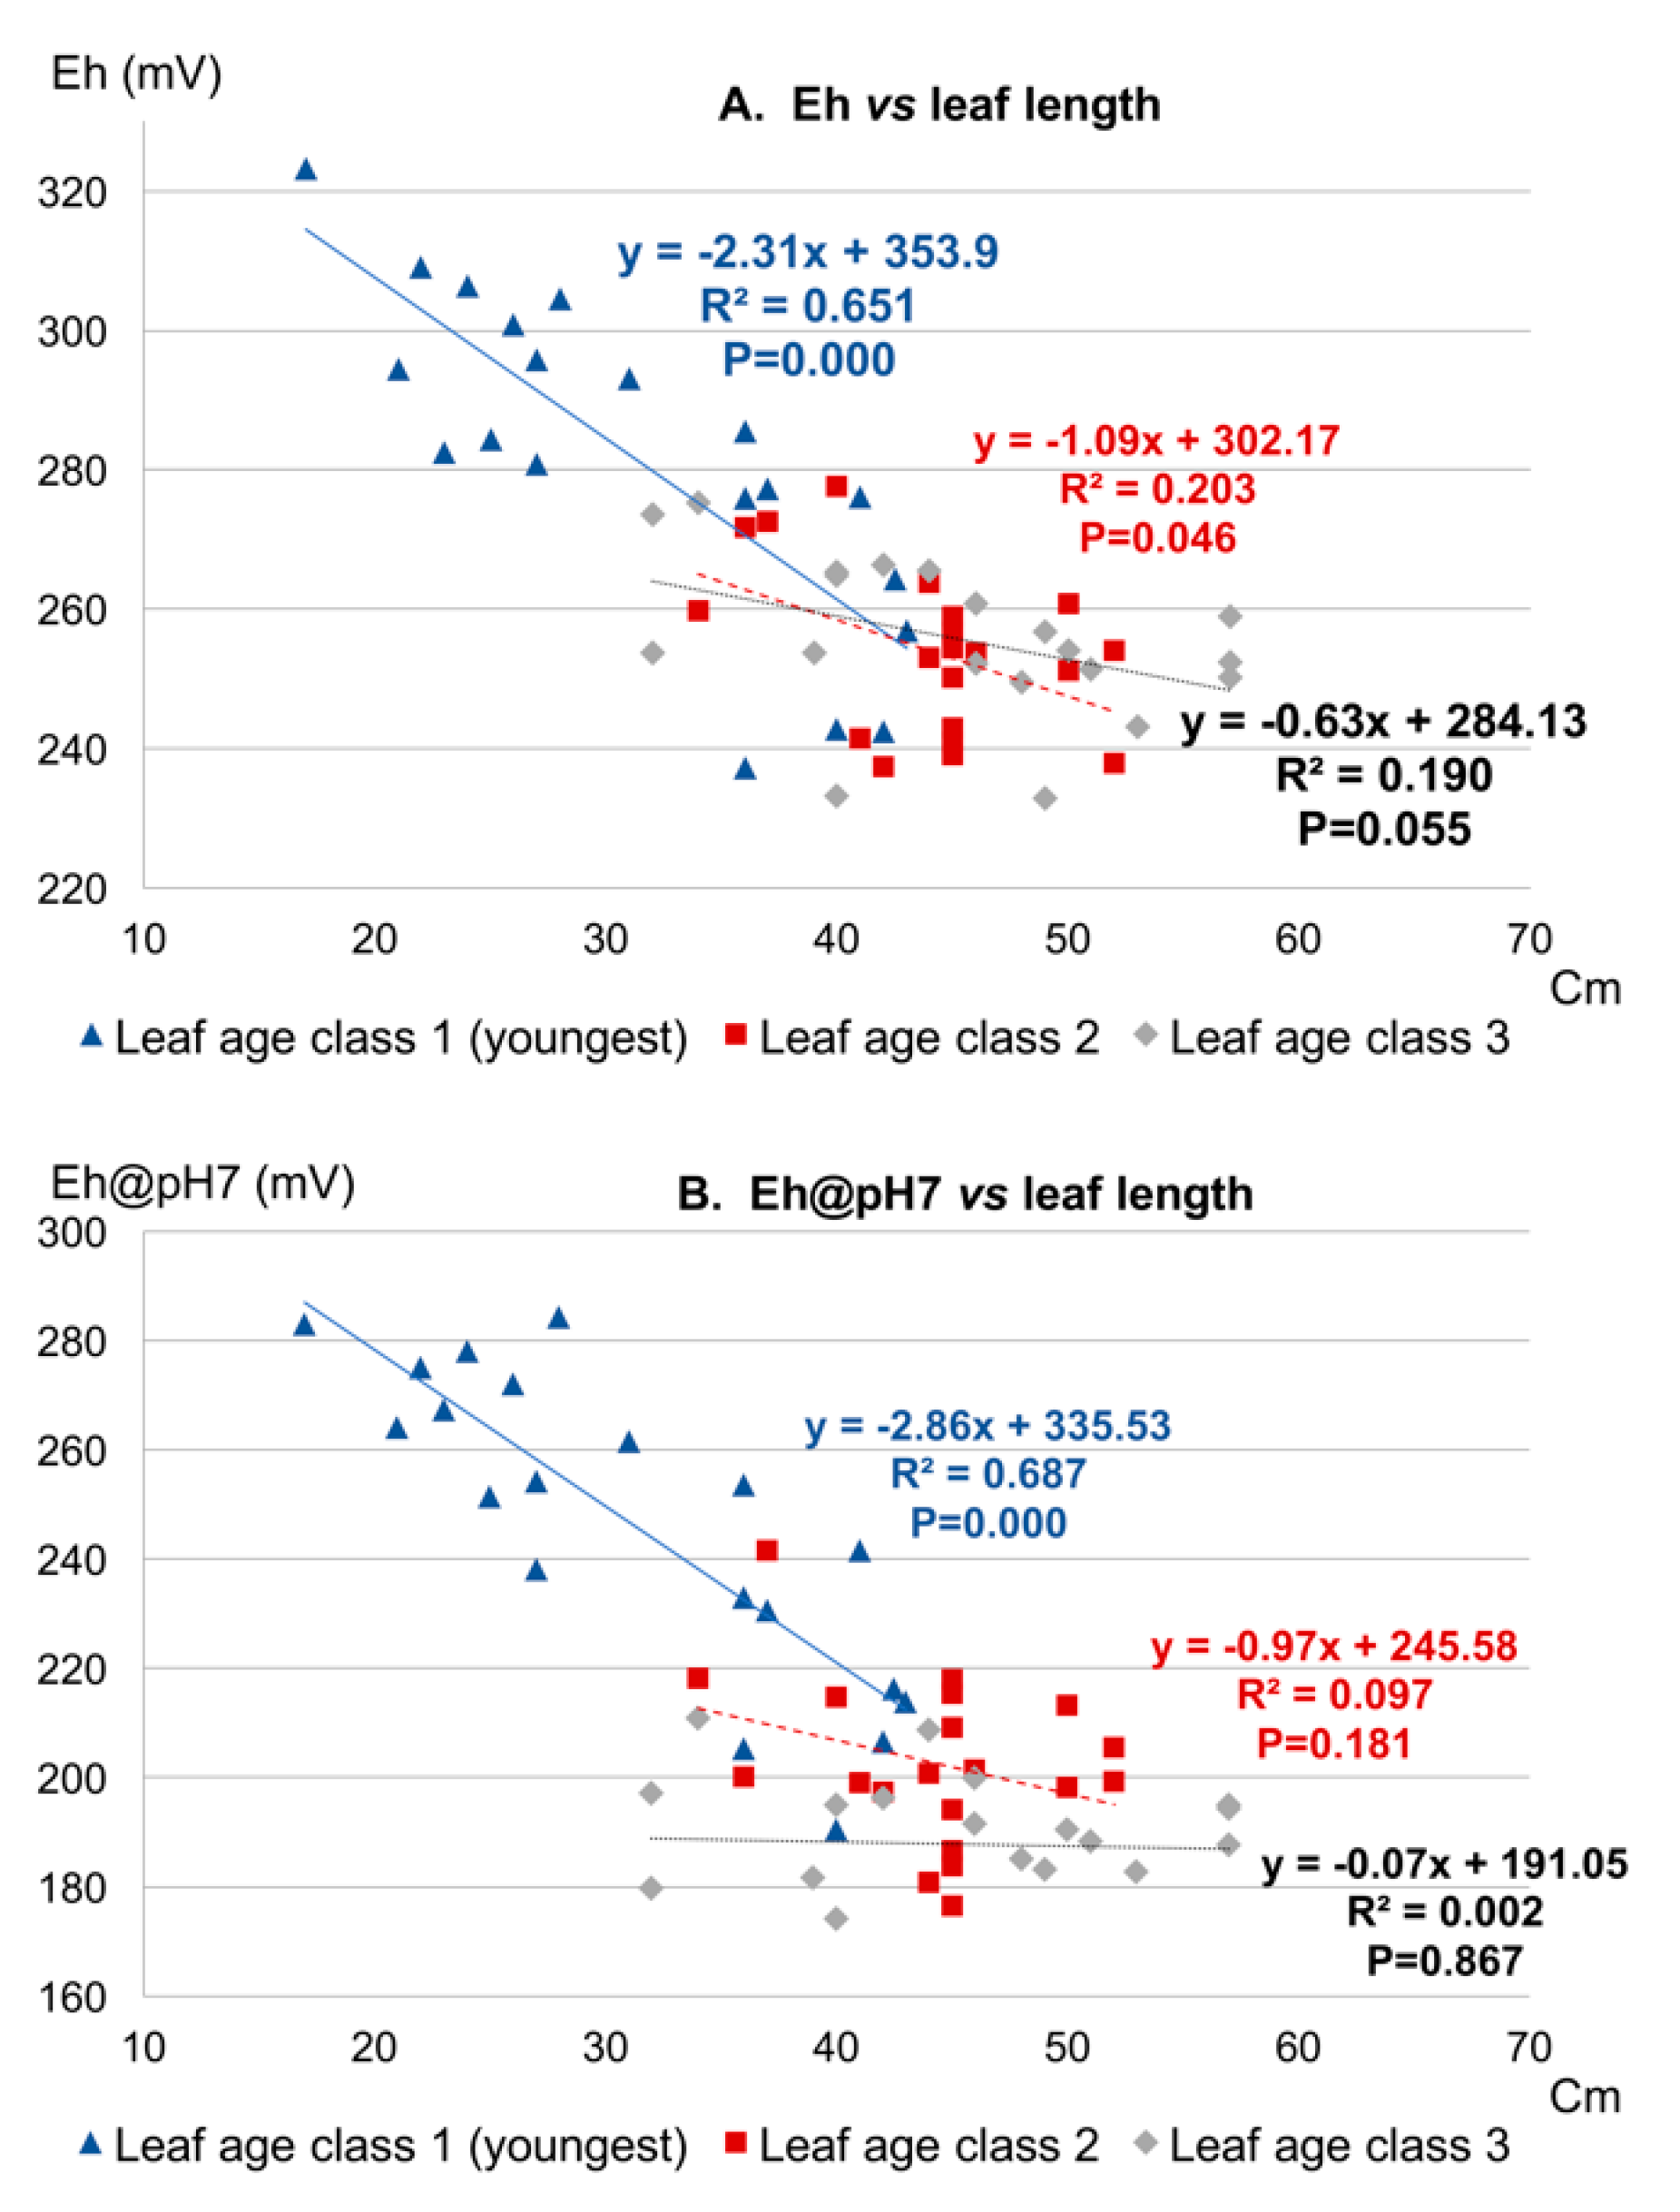
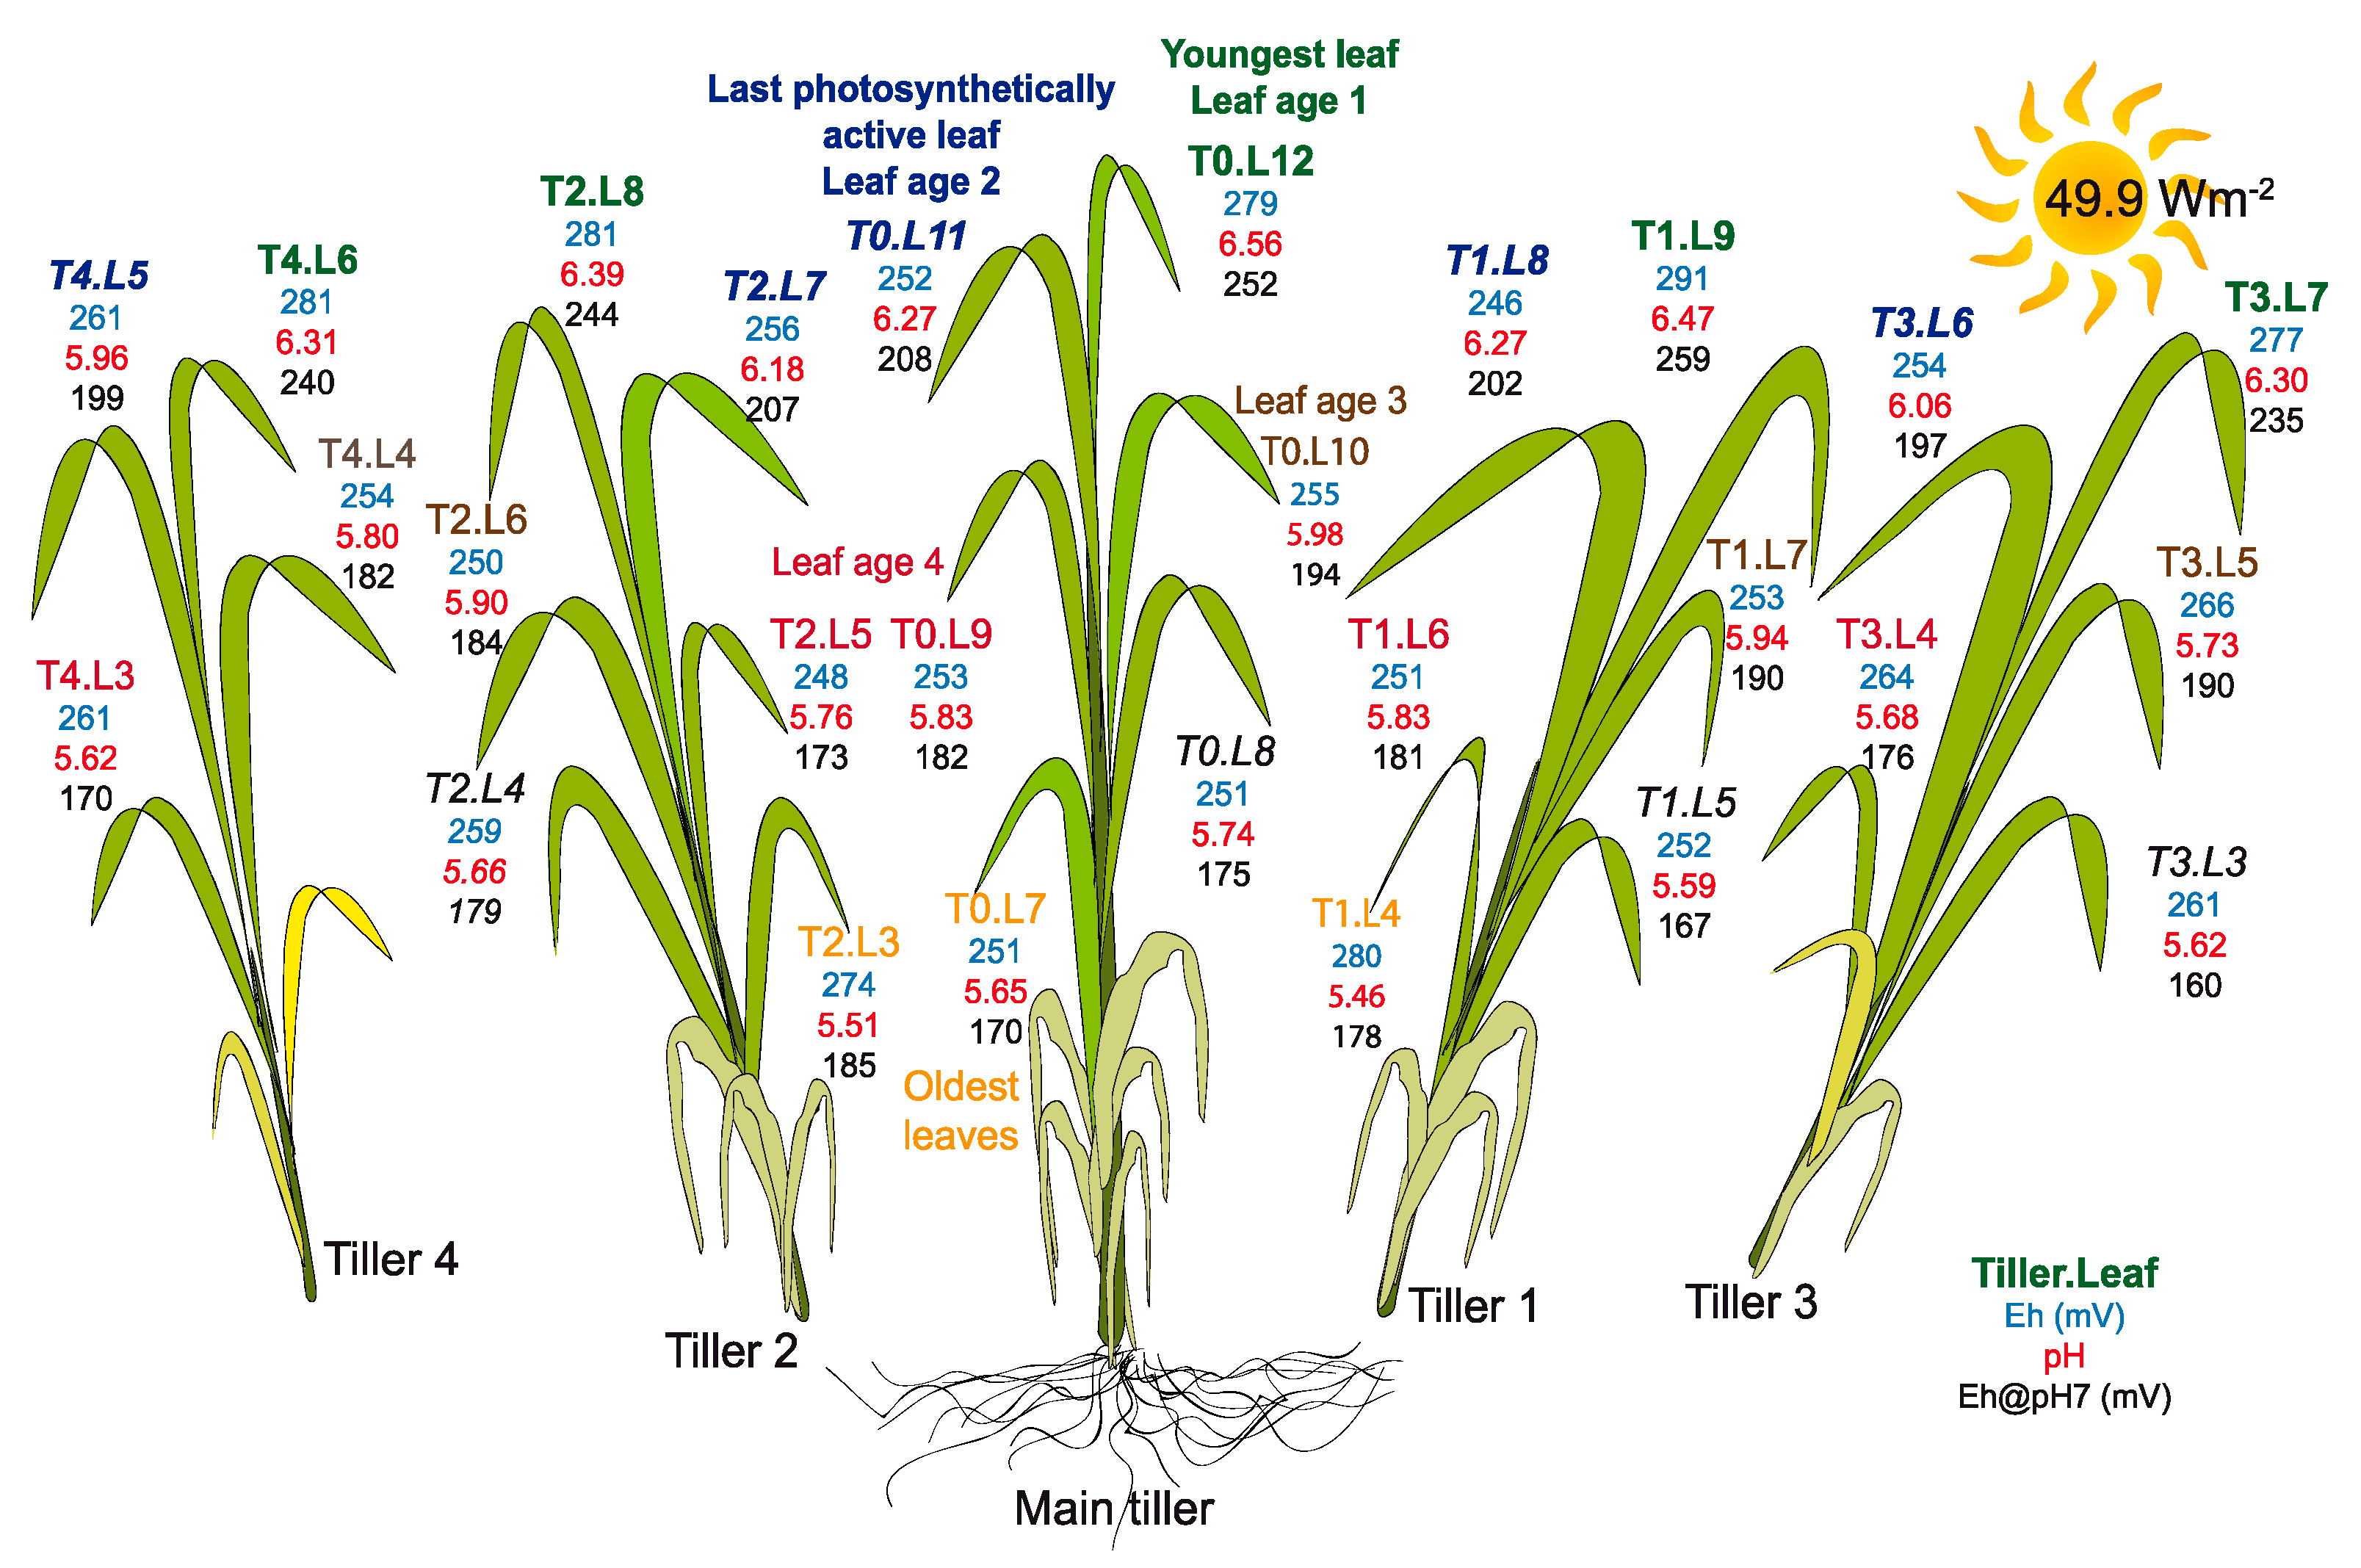
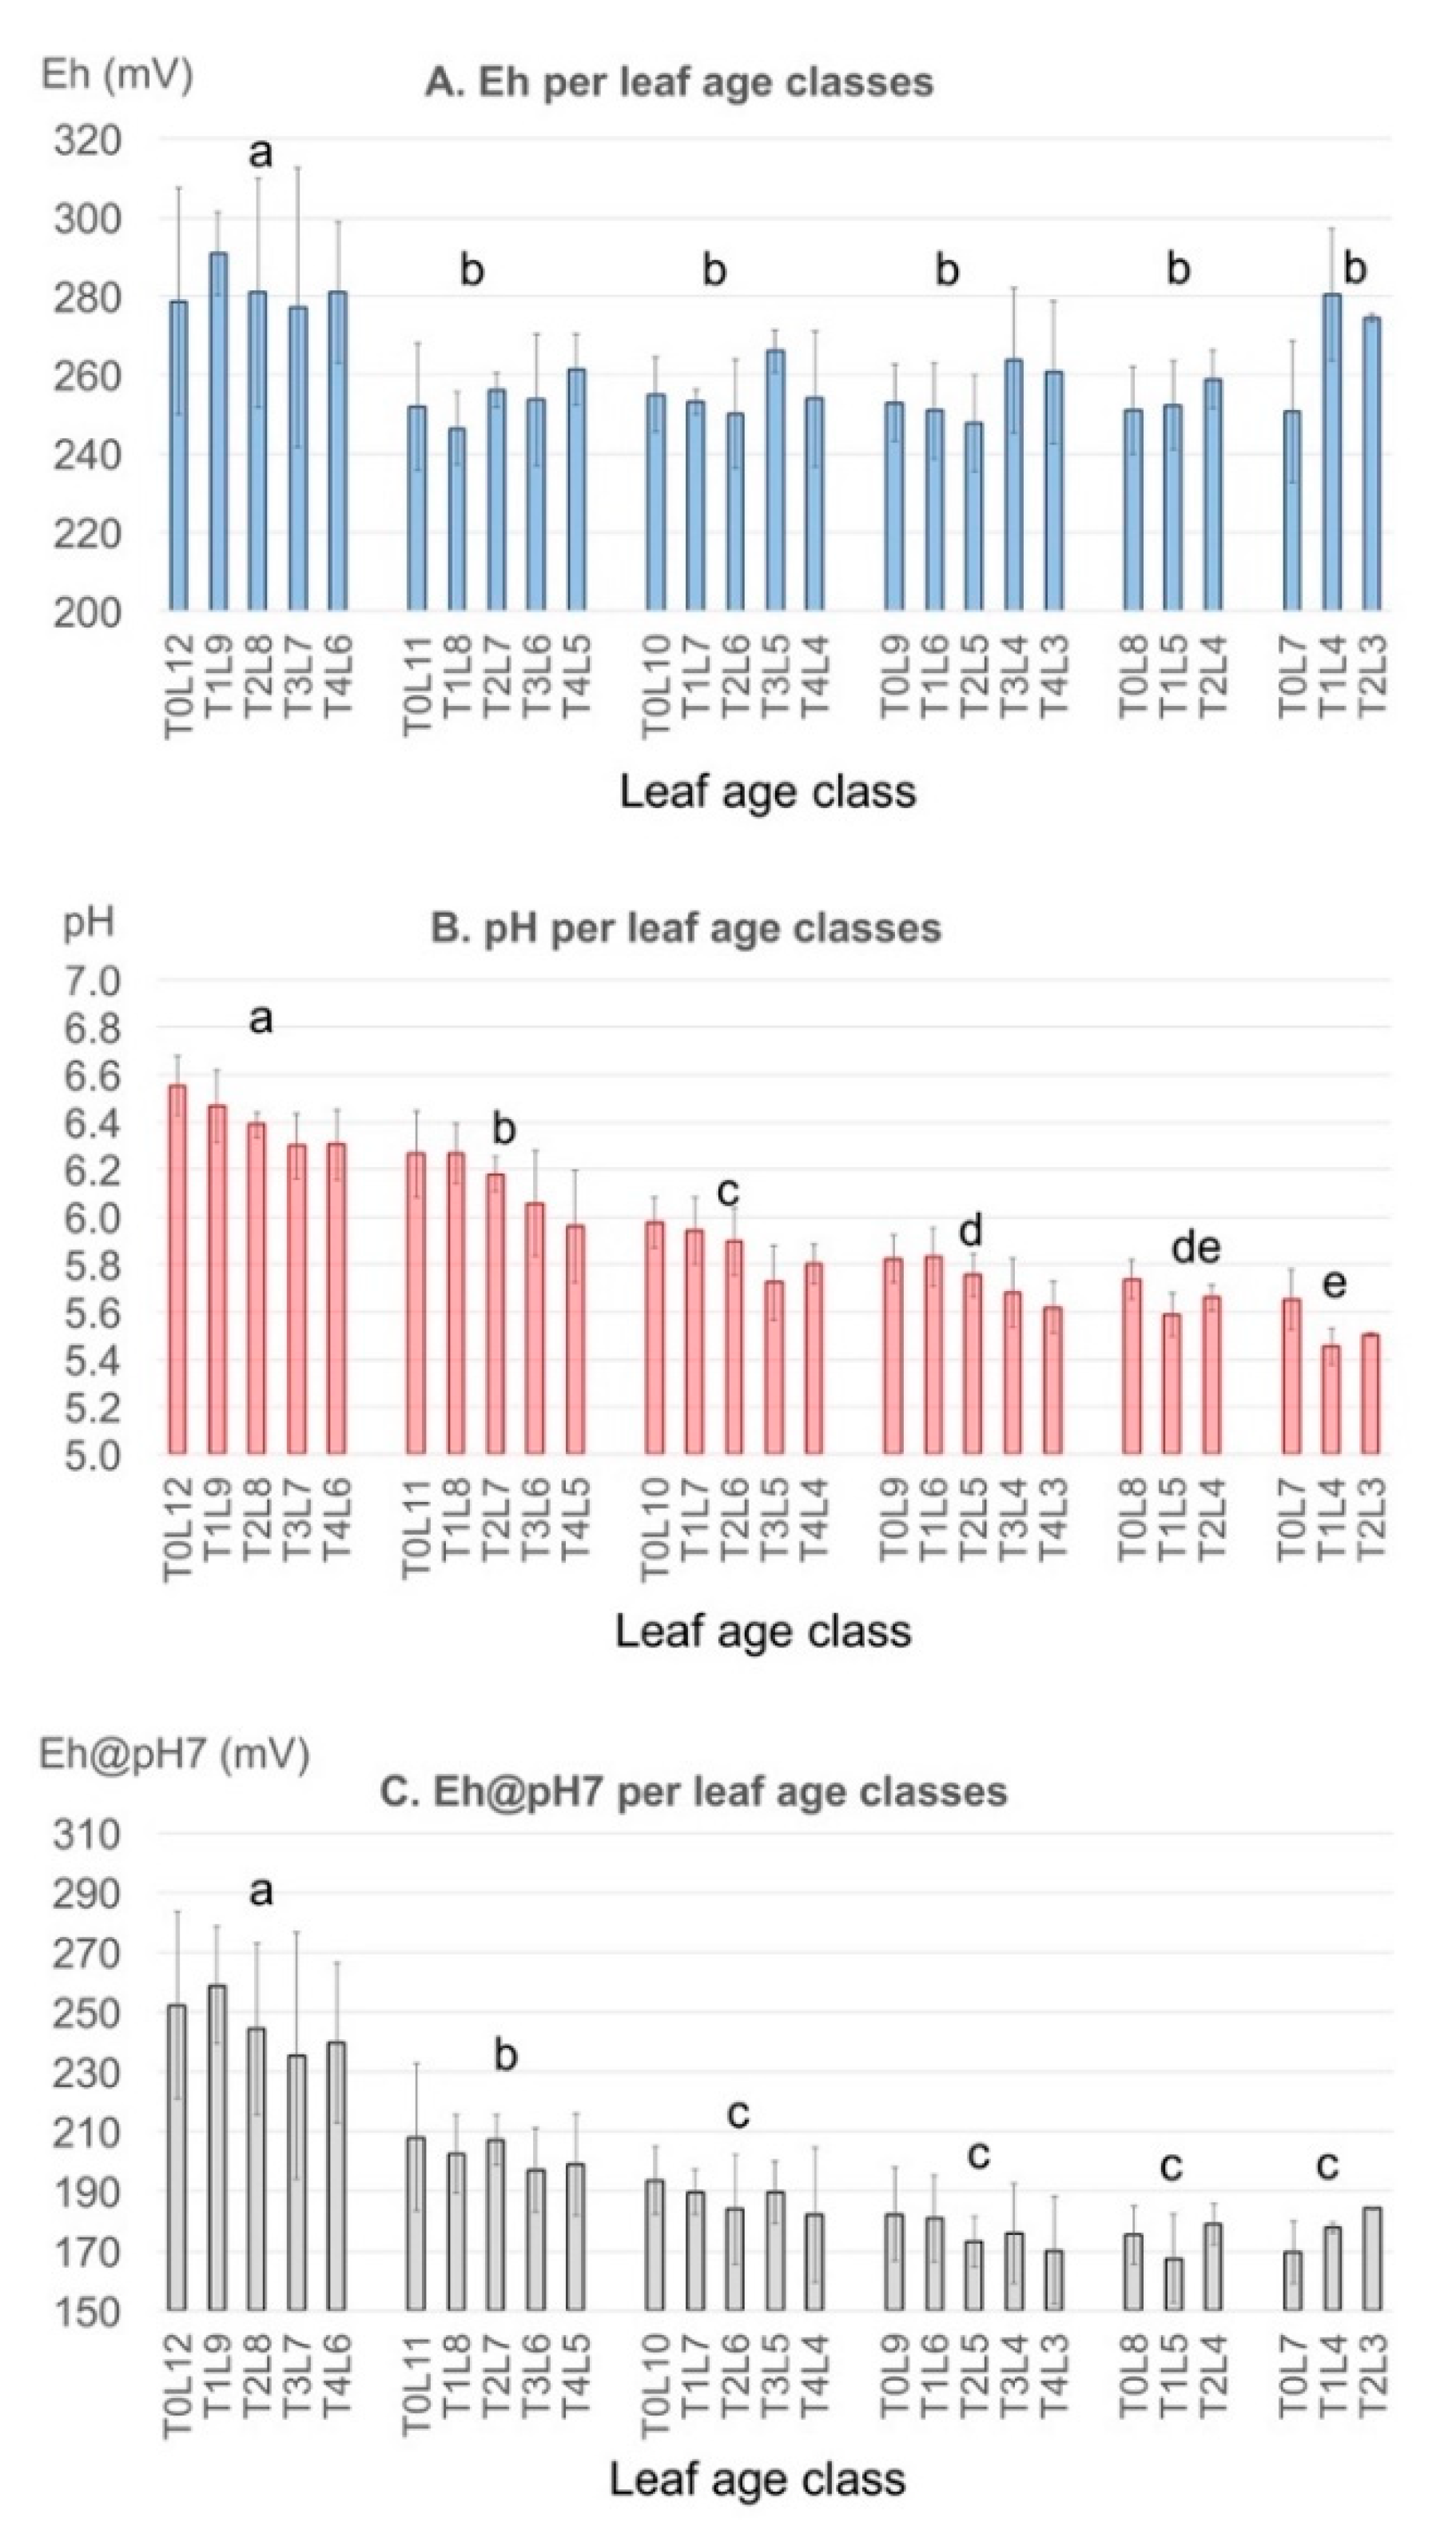
3.3.2. Inter-Leaf Variability: Eh-pH “Gradients” in Rice Plants

Leaf Eh and pH presented the same patterns in all rice plants and for all tillers and it was possible to group leaves according to their age, as seen in Figure 4, Figure 5 and Figure 6A,B and Tables S3.1–S3.7.
Eh of the last (youngest) leaf was high and highly variable, as seen in Figure 4A, and correlated with leaf length. Eh of the last and second last fully expanded leaves (second and third leaf from the top of the tiller) was the lowest in the plant. Eh of the photosynthetically active leaves were either equal, as seen in Figure 5 and Figure 6A, or, in most cases, increasing from the last fully expanded leaf to older leaves, from the second leaf from top to bottom of the plant, with a strong increase in old, dying leaves, as shown in Tables S3.1–S3.7.
pH showed a very clear and significant pattern, decreasing from top to bottom of the plant. pH was always maximum in the youngest leaves, and minimum in the oldest leaves, as seen in Figure 5 and Figure 6B and Tables S3.1–S3.7.
Eh@pH7, as a consequence, was significantly the highest. It was correlated with leaf length in the youngest leaf, as seen in Figure 4B. It was slightly decreasing from top to bottom (from young to older leaves) in most of the cases, as shown in Figure 5 and Figure 6C, and Tables S3.1–S3.7.
The same trends were observed for all seasons and fertilization levels, in all tillers, and for all plant ages, as shown in Tables S5.1–S5.7. Interestingly, leaves of the same age on a single rice plant showed similar Eh-pH in all the primary tillers, as seen in Figure 5 and Tables S3.1–S3.7, indicating that leaf Eh-pH is related to leaf age.
These gradients in leaf Eh and pH were not related to Eh-pH gradients in soil horizons, as reversing the soil gradient did not affect Eh-pH gradients in leaves, as recorded in Tables S3.4 and S3.5.
The same gradients were also measured for upland (Nerica4) and lowland (IR64) varieties, in aerobic (“upland” water management) and anaerobic (“lowland” management, with submersion) conditions as shown in Table S3.6.
Finally, rice plants grown in natural field conditions presented the same Eh-pH gradients as those measured in pots, as seen in Table S3.7.

4. Discussion

4.1. Spatial and Temporal Variability

Photosynthesis is the fundamental reduction reaction and thus the electron accumulation process at the origin of the energetic functioning of all living organisms on earth. It affects both plant Eh and pH.
As it could be expected, the spatial and temporal variations measured in leaf Eh, pH and Eh@pH7 are in accordance with the well-known variations in photosynthetic activity:
Eh, pH and Eh@pH7 (and their variability) were maximum in the top, youngest leaf, in which photosynthetic activity had not fully started yet, and Eh was maximum in the lowest, oldest leaves, in which photosynthesis was probably not fully functional any longer. Inversely, the lowest Eh and Eh@pH7 were observed in the youngest fully developed and photosynthetically active leaves, intercepting high solar radiation and in which photosynthetic activity is expected at its highest intensity [29].
The lower Eh, pH, and Eh@pH7 in the tip of the leaf might also be attributed to higher photosynthetic activity, this part of the leaf capturing more light than the base, which is more in a vertical and shaded position [29].
Similarly, the temporal variations measured in leaf Eh, pH and Eh@pH7 are in accordance with the variations in photosynthetic activity:
On a daily basis, Eh and Eh@pH7 decreased when two major factors impacting photosynthesis, light and temperature [29], increased.
Variations across seasons might also be explained by differences in photosynthetic activity. Lower Eh, pH, and Eh@pH7 have been measured when solar radiation and temperature were higher, as seen in Table S5.2.
To confirm the relation of photosynthetic activity and Eh-pH, the stomatal conductance, another major determinant of photosynthetic rate in rice [30], should be measured in future experiments.
Interestingly, aging seems to be related to oxidation and strong acidification of plant leaves. However, despite a global trend always showing a decrease in pH with age, increase in Eh is not always significant, and as a consequence, changes in Eh@pH7 are variable. Variations in leaf Eh, pH, and Eh@pH7 with age also seem to depend on the environment (soil and climate) and cropping practices (water management, fertilization, and cropping season). This can be seen when comparing Eh and pH across the different experiments and seasons of our study. Breaking down the complexity of genotype × environment × management (G × E × M) interactions [31] into variations of Eh-pH-Eh@pH7 depending on genotype, environmental factors and cropping practices would be an extremely useful tool to decipher these complex dynamics and patterns.

4.2. Validation of The Measurement Method

The measurement method can certainly be improved (especially reducing the variability). However, the repeatability of the results, the moderate variability, and the significance of the differences measured in space, in time, and between varieties indicate that the method developed here can confidently be used and developed in further studies.
This study also provides essential information to define the conditions of measurement for these parameters to be used in various disciplines like agronomy, plant breeding, or pathology. It confirmed the importance to measure Eh-pH in living plants and to assure that the measuring takes place in an environment free of electromagnetic fields interfering with the measurement.
More important, this study showed that:
  • As photosynthesis and respiration strongly affect redox level in plants, the measurements should be done in a time window during which solar radiation and temperature variations, hence when Eh variations, are minor: between 11:00 a.m. and 16:00 p.m. in our experimental conditions.
  • Because of the high spatial and temporal variability of leaf Eh-pH, the measurement should be always conducted on the same part of the same leaf: in the case of upright monocotyledon plants such as rice, we propose to use the middle part of the last fully expanded leaf, as it has the lowest Eh of the plant and the second highest pH, and presents a low variability with time. The last, youngest leaf, which is in rapid development, is not recommended for measurement as its Eh is very variable. Old, senescent leaves are not recommended either, as their Eh also evolves rapidly with leaf age and thus leads to very variable measurements.
  • As plant age impacts leaf Eh and pH, this parameter should also be taken into account when comparing plants.

4.3. Leaf Eh-pH and Eh@pH7 as an Indicator of Plant Stresses

Eh and pH regulation is central in plant physiology and phenology and the vast majority of biotic and abiotic stresses are translated into redox signals in plants [21]. Therefore, it can be hypothesized that a mean Eh-pH value at leaf level can be a good indicator, integrating and synthetizing the various stresses as well as beneficial factors faced by the whole plant.
The method proposed here simply aims at measuring such a “mean” Eh and pH at the “coarse” scale of plant organs, not taking into account the important compartmentation of pH and Eh [3]. This study shows that, despites the apparent limitations, a mean value of Eh-pH at plant and organ level can bring important information for agronomy and related disciplines and can be proposed as an indicator of plant stress. It can bring new perspectives, coming as complementary information and adding to the wealth of knowledge on molecular redox processes at cell and organelle levels developed by physiologists and pathologists in recent years [17,32].
Interestingly, differences between varieties were often more significant according to Eh@pH7 than Eh or pH separately (Table 4 and Table S4). This confirms that Eh and pH are interacting in plants. Unfortunately, most of the studies on redox and pH in plants have been conducted independently up to now. Integrating oxidation-reduction and acid-base conditions in future studies would certainly help in deciphering these complex, interacting processes.
It would be interesting in further studies to assess the impact of various kinds of biotic and abiotic stresses on leaf Eh and pH and relate these indicators to stress intensity. Overproduction of reactive oxygen species (ROS) in plants is induced by various environmental perturbations like drought, heat, high light intensity, salinity, osmotic stress, chilling, herbicides, heavy metals, pathogens, wounding, ozone (O3) and atmospheric pollutants [33,34,35]. It can be expected that these ROS affect Eh and pH at the plant level. Could Eh-pH be a unifying indicator, integrating a multiplicity of plant stresses? If so, it would be a powerful tool to analyze genotype × environment × management × bioagressors interactions (G × E × M × B).
Next studies could also use leaf Eh-pH measurements to identify rapidly beneficial effects of e.g., soil amendments, fertigation blends, plant defense elicitors, pest treatments or new land management practices on plant health and growth.
Follow-up studies could also link the variations of Eh and pH to the physiological changes within the leaf during ageing, and how Eh-pH signals interact with programmed cell death [36].
Furthermore, extending the cropping area of a given plant species over a range of latitudes and climatic zones has been a major challenge during plant domestication [37]. Follow-up studies on the relationship between leaf Eh-pH levels at different latitudes and the genetic diversity or plasticity within plant species would deepen our understanding of the adaptability of plants to climate. It could bring new insights in the context of adaptation to climate change.
Finally, plant and canopy architecture influence growth and response to stress [38]. Follow-up studies on monocotyledons with contrasted plant stand (such as rosette-like) or dicotyledons would deepen our understanding of the impact of plant architecture on plant growth.

4.4. Spatial and Temporal Variations of Leaf Eh-pH and Disease Patterns and Dynamics

It is striking that the pattern and dynamics of Eh and pH in plants and leaves revealed in this study are in accordance with the pattern and dynamic of development of the major diseases in rice.

4.4.1. Fungi

Fungi in soil exhibit wider pH range for optimal growth than bacteria [39]. However, in plant many pathogenic fungi develop preferably at a slightly acidic pH and seem to be hindered by low Eh and favored by high Eh [21,40]. Rice blast for instance has a good growth on medium at pH ranging from 6 to 7, with an optimum growth at pH 6.5. Its growth is reduced at very low pH [41].
It is remarkable that rice susceptibility/resistance to blast is in accordance with leaf Eh-pH:
  • Roumen [42] reports that at the 6th leaf stage, blast lesion density was lower in one week-old leaves than in younger, 1–2 days-old leaves, i.e., blast development was higher in the high Eh conditions of immature leaves than in photosynthetically active leaves, at lower Eh.
  • The decline in blast lesion density with leaf age was faster under higher radiation and temperature conditions, i.e., lower Eh and under more active photosynthesis [42].
  • Susceptibility of rice to blast decreases from the vegetative stage to the reproductive stage [43], which could be related to decreasing leaf pH (going below 6) and Eh@pH7.
The fact that fungi develop their appressoria in the early morning hours as observed by Benada [42] for Erysiphe graminis might also be related to the high redox potential at this period of the day, when photosynthesis did not yet set in again.

4.4.2. Viruses

Several studies have shown that virus development is slowed down by low soil and plant pH, and favored by high pH and high Eh [21]. From our study, at the plant level, high Eh and pH (and thus high Eh@pH7) are found in rather young plants, and in the youngest leaf. It is also remarkable that the rice yellow mottle virus (RYMV) inoculation is the most efficient on young rice plants and disease severity is the highest in the flag leaf as compared to older leaves [44,45].

4.4.3. Bacteria

Bacteria have a narrow pH range for optimal growth [46]. Pathogenic bacteria seem to be favored by neutral pH. For instance, optimum pH for Xanthomonas oryzae pv. oryzae is 7.0 [47]. This Gram-negative bacteria is obligate aerobic, using oxygen as terminal electron acceptor [48] but as many pathogenic bacteria is sensitive to ROS, the major defense of the host plant [49,50].
In rice leaves, neutral pH with a moderate Eh are found in young plants but not in the oldest leaves where both pH and Eh are lower. Again, this is in accordance with the resistance of rice to bacterial blast (Xanthomonas campestris pv. oryzae), which increases considerably with plant age, and is higher in older, mature leaves [51].
These examples suggest that leaf Eh and pH, reflecting the physiological state of plants, could explain the variable resistance of cereals to obligates parasites, and especially (i) the disease gradients on plants, (ii) the change of susceptibility of organs during the ontogeny and growth, (iii) the difference in resistance in individual plant cells and (iv) the rapid change of resistance in a couple of hour [52].
The possible role of Eh-pH homeostasis in plant health is also reflected in the importance of major rice diseases in different rice ecosystems [53]: rice blast is found mainly in upland conditions (with often oxidized and acidic soil conditions) and more rarely observed in irrigated conditions, especially in Sahelian environment (with high light intensity). Inversely, RYMV and bacterial blight are dominant in irrigated and lowland environment, i.e., in submerged conditions, in which soil pH is increased and soil Eh is decreased by submersion [54].

4.5. Eh-pH Homeostasis as a Mechanism of Resistance/Tolerance to Major Diseases?

This accordance between spatial and temporal variations of leaf Eh-pH and disease patterns and dynamics suggests that Eh-pH homeostasis could be an overlooked mechanism of resistance/tolerance to major diseases. Evidence of the role of redox regulation in host plant-pathogen interactions is accumulating [55,56,57,58]. Sclerotinia sclerotiorum (via oxalic acid) generates a reducing environment in host cells that suppress host defense responses including the oxidative burst [59]. The genome of the generalist plant pathogen Fusarium avenaceum is enriched with genes involved in redox signaling [60].
In the rice blast fungus Magnaporthae oryzae, robust anti-oxidant defenses confer tolerance to the host oxidative burst [61]. Magnaporthe grisea also undergoes an oxidative burst of its own during plant infection, which is associated with its development of appressoria [62,63]. The same authors report that ascorbic acid, a scavenger of oxygen radicals, significantly delayed spore germination and appressorium formation in a dose-dependent manner. All these authors mention that these processes are particularly important in the early stage of infection, in the apoplasm.
pH also impacts M. oryzae’s biology. Conidia production was 5-fold higher at pH 8 than at pH 5, while conversely, conidia germination decreased from pH 8 to pH 3 [64]. As for Eh, M. oryzae also modulates the pH of its environment [64].
Furthermore, virulence of M. oryzae has also been related to Eh-pH regulation [64,65].
The stability of RYMV is pH dependent, with a swollen, unstable form of the virus at basic pH [66]. Furthermore, reversible protein modification by redox alterations could be a key regulatory mechanism for the control of RNA silencing and such a RYMV-encoded viral suppressor of RNA silencing protein (P1) has been identified, with redox dependent flexibility [67].
A final example of how Eh-pH regulation may be an important factor of control of pathogens is the protection of rice against Xanthomonas oryzae by salicylic-acid induced accumulation of superoxide anion [68].
All these studies brought together suggest that each plant pathogen is adapted to specific Eh-pH conditions. They may be able to develop only at certain stages of plant development and when plants are unbalanced and not able to sustain Eh-pH conditions or modify them to prevent the pathogen development.
Similarly, oxidation-reduction processes are also involved in interactions between herbivorous insects and plants [21] and it can be hypothesized that plant Eh-pH conditions affect insects attacks/plant resistance as recently shown for aphids [69].

4.6. Leaf Eh-pH and Eh@pH7 as an Indicator of Plant Health

Thus, it is proposed to use leaf Eh-pH not only as an indicator of plant stress, but also as an indicator of plant health. A global Eh-pH perspective at the organ and plant levels could therefore bring new insights for agronomists, pathologists, entomologists, and epidemiologists. For instance, this Eh-pH perspective may help in deciphering:
  • the spatial and temporal changes in host phenology related to plant and leaf age as observed by Farber and Mundt [70] and the induction of resistance to disease during plant development [71];
  • the complex interactions between Genotype, Environment and Management practices and the development of pests and diseases, including the interactions between plant nutrition and diseases [72,73,74] and the interactions between light and diseases [75];
  • the variable effects of soil amendment, especially biochar addition on plant diseases [76], and how biochar addition influences severity of diseases [77,78];
  • the co-infection and pathogen-pathogen-host interactions, which has been recently recognized as deserving more attention [79], and the suppression of diseases by growth promoting bacteria [80];
  • the trade-off between disease resistance and plant fertility [81] and between disease resistance and abiotic stress tolerance [82];
  • the processes of co-evolution of plants and their pathogens [83].

5. Conclusions

Agronomists could use plant Eh-pH to rapidly assess the impact of cropping practices on plant health and relate it to soil health. This could be a very useful tool for the design of innovative cropping systems and the steering of cropping practices.
An Eh-pH approach could also bring original perspectives for breeders. For instance, breeding for resistance/tolerance to specific pathogens could be facilitated by creating environments favoring the development of these specific pathogens through management practices and thus creating a high pressure for selection. It can also be a useful variable to measure to further optimize the inoculation efficiency by adapting the location and time of inoculation to specific pathogens in addition to the current empirical knowledge. Such an Eh-pH approach might also make it possible to develop methods for early and rapid screening of varieties for their resistance/sensitivity to major pathogens.
A major challenge for the future is therefore to develop an intelligence of how environment and practices, particularly through soil characteristics, interact with genotype and impact plant Eh and pH and, as a consequence, pathogen development. This would pave the way towards agroecological crop protection driven by Eh and pH, reducing the environmental impact of agriculture, which is essential [84].

Supplementary Materials

The following are available online at https://www.mdpi.com/2073-4395/8/10/209/s1, Table S1.1: Diurnal variation in Eh, pH and Eh@pH7 for four rice varieties (IDSA 6, Azucena, IRBLTA2Pi, Nerica4), Table S1.2: Temperature dependent variation in Eh, pH and Eh@pH7 for four rice varieties (IDSA 6, Azucena, IRBLTA2Pi, Nerica4), Table S1.3: Solar radiation dependent variation in Eh, pH and Eh@pH7 for four rice varieties (IDSA 6, Azucena, IRBLTA2Pi, Nerica4), Table S2: Means and pairwise comparisons of Eh, pH and Eh@pH7 for three leaf parts (Base, Middle, Tip) in three growing seasons (II to IV) for increasing plant age (DAS from 40 to 80) and two water managements (Upland = aerobic; Lowland = anaerobic)Table S3.1: Intra-plant spatial variability of leaf Eh, pH and Eh@pH7 in season I on 39–40 DAS-old plants, Table S3.2: Intra-plant spatial variability of leaf Eh, pH and Eh@pH7 in season II on 40–41 DAS-old plants, Table S3.3. Intra-plant spatial variability of leaf Eh, pH and Eh@pH7 in season II on 61–64 DAS-old plants, Table S3.4: Effect of two opposite soil gradients (T1 = natural; T2 = opposite) on intra-plant spatial variability of leaf and soil Eh, pH and Eh@pH7 in season III for 30 DAS-old plants, Table S3.5. Effect of two opposite soil gradients (T1 = natural; T2 = opposite) on intra-plant spatial variability of leaf and soil Eh, pH and Eh@pH7 in season III for 58 DAS-old plants, Table S3.6: Effect of two water management regimes (Upland = aerobic; Lowland = anaerobic) and variety on intra-plant spatial variability of leaf Eh (Upper panel), pH (Middle panel) and Eh@pH7 (Lower panel) in season IV for 43–46 DAS-old plants, Table S3.7: Field condition intra-plant spatial variability of leaf Eh, pH and Eh@pH7 on 44–46 DAS-old plants of the rice variety Nerica 4 in Upland management in season V, Table S4: Means and pairwise comparisons of Eh, pH and Eh@pH7 for four rice varieties (IDSA 6, Azucena, IRBLTA2Pi, Nerica4) in four growing seasons (I to IV) and increasing plant age (DAS from 39 to 74), Table S5.1: Means and pairwise comparisons of Eh, pH and Eh@pH7 in three growing seasons (II, III, IV) for two rice varieties (IRBLTA2Pi, Nerica4) at 59–60 DAS, Table S5.2: Means and pairwise comparisons of Eh, pH and Eh@pH7 in two growing seasons (III, IV) for three rice varieties (Azucena, IRBLTA2Pi, Nerica4) at 39–40 DAS, Figure S1: Measurement of leaf Eh and pH in a field laboratory to prevent electromagnetic interference.

Author Contributions

O.H. developed the concept and the hypotheses, co-designed the experiments, analyzed the data, and wrote the first draft. A.A. contributed to the development of the hypotheses, the design of the experiments, and the interpretation of the results. J.B. developed the initial method of measurement and contributed to the interpretation of the results. B.S. and F.T. co-designed and implemented the experiments, conducted the measurements, contributed to the improvement of the method, and processed the data. I.D. co designed the experiments and contributed to the statistical analyses. J.-P.S., L.B., S.J., P.M., S.B. and K.F. contributed to the development of the research program, the design of the experiments, the improvement of the method for measurement, and the interpretation of the results. All authors contributed to the writing and the improvement of the manuscript.

Funding

This research was funded by CIRAD (UPR AIDA and CRESI action) and Africa Rice Center.

Acknowledgments

The authors would like to thank Hans-Peter Schmidt (Ithaka Institute, Switzerland) for his valuable comments on the manuscript.

Conflicts of Interest

The authors declare having no conflict of interest.

References

  1. Rengel, Z. Handbook of Plant Growth. pH as the Master Variable; Marcel Dekker: New York, NY, USA, 2002; ISBN 0-8247-0761-3. [Google Scholar]
  2. Singh, R.; Singh, S.; Parihar, P.; Mishra, R.K.; Tripathi, D.K.; Singh, V.P.; Chauhan, D.K.; Prasad, S.M. Reactive oxygen species (ROS): Beneficial companions of plants’ developmental processes. Front. Plant Sci. 2016, 7, 1299. [Google Scholar] [CrossRef] [PubMed]
  3. Noctor, G.; Foyer, C.H. Intracellular redox compartmentation and ROS-related communication in regulation and signaling. Plant Physiol. 2016, 171, 1581–1592. [Google Scholar] [CrossRef] [PubMed]
  4. Dietz, K.-J.; Mittler, R.; Noctor, G. Recent progress in understanding the role of reactive oxygen species in plant cell signaling. Plant Physiol. 2016, 171, 1535–1539. [Google Scholar] [CrossRef] [PubMed]
  5. Considine, M.J.; Foyer, C.H. Redox regulation of plant development. Antioxid. Redox Signal. 2014, 25. [Google Scholar] [CrossRef] [PubMed]
  6. Foyer, C.H.; Noctor, G. Stress-triggered redox signalling: What’s in pROSpect? Plant Cell Environ. 2016, 39, 951–964. [Google Scholar] [CrossRef] [PubMed]
  7. Marschall, R.; Tudzynski, P. Reactive oxygen species in development and infection processes. Semin. Cell Dev. Biol. 2016, 57, 138–146. [Google Scholar] [CrossRef] [PubMed]
  8. Mohapatra, C.; Chand, R.; Navathe, S.; Sharma, S. Histo-chemical and biochemical analysis reveals association of er1 mediated powdery mildew resistance and redox balance in pea. Plant Physiol. Biochem. 2016, 106, 54–63. [Google Scholar] [CrossRef] [PubMed]
  9. Floryszak-Wieczorek, J.; Arasimowicz-Jelonek, M. Contrasting regulation of NO and ROS in potato defense-associated metabolism in response to pathogens of different lifestyles. PLoS ONE 2016, 11, 1–24. [Google Scholar] [CrossRef] [PubMed]
  10. Spoel, S.H.; Loake, G.J. Redox-based protein modifications: The missing link in plant immune signalling. Curr. Opin. Plant Biol. 2011, 14, 358–364. [Google Scholar] [CrossRef] [PubMed]
  11. Elmer, W.H.; Datnoff, L.E. Mineral nutrition and suppression of plant disease. Encycl. Agric. Food Syst. 2014, 4, 231–244. [Google Scholar] [CrossRef]
  12. Tanaka, A.; Christensen, M.J.; Takemoto, D.; Park, P.; Scott, B. Reactive oxygen species play a role in regulating a fungus–perennial ryegrass mutualistic interaction. Society 2006, 18, 1052–1066. [Google Scholar] [CrossRef] [PubMed]
  13. Nanda, A.K.; Andrio, E.; Marino, D.; Pauly, N.; Dunand, C. Reactive oxygen species during plant-microorganism early interactions. J. Integr. Plant Biol. 2010, 52, 195–204. [Google Scholar] [CrossRef] [PubMed]
  14. Lucas, J.A.; García-Cristobal, J.; Bonilla, A.; Ramos, B.; Gutierrez-Mañero, J. Beneficial rhizobacteria from rice rhizosphere confers high protection against biotic and abiotic stress inducing systemic resistance in rice seedlings. Plant Physiol. Biochem. 2014, 82, 44–53. [Google Scholar] [CrossRef] [PubMed]
  15. Srivastava, A.K.; Pasala, R.; Minhas, P.S.; Suprasanna, P. Plant bioregulators for sustainable agriculture: Integrating redox signaling as a possible unifying mechanism. Adv. Agron. 2016, 137, 237–278. [Google Scholar]
  16. Kerchev, P.; De Smet, B.; Waszczak, C.; Messens, J.; Van Breusegem, F. Redox strategies for crop improvement. Antioxid. Redox Signal. 2015, 23, 1186–1205. [Google Scholar] [CrossRef] [PubMed]
  17. Noctor, G.; Mhamdi, A.; Foyer, C.H. Oxidative stress and antioxidative systems: Recipes for successful data collection and interpretation. Plant Cell Environ. 2016, 39, 1140–1160. [Google Scholar] [CrossRef] [PubMed]
  18. Kalaji, H.M.; Jajoo, A.; Oukarroum, A.; Brestic, M.; Zivcak, M.; Samborska, I.A.; Cetner, M.D.; Łukasik, I.; Goltsev, V.; Ladle, R.J. Chlorophyll a fluorescence as a tool to monitor physiological status of plants under abiotic stress conditions. Acta Physiol. Plant. 2016, 38, 102. [Google Scholar] [CrossRef]
  19. Pintó-Marijuan, M.; Munné-Bosch, S. Photo-oxidative stress markers as a measure of abiotic stress-induced leaf senescence: Advantages and limitations. J. Exp. Bot. 2014, 65, 3845–3857. [Google Scholar] [CrossRef] [PubMed]
  20. Carter, G.A.; Miller, R.L. Early detection of plant stress by digital imaging within narrow stress-sensitive wavebands. Remote Sens. Environ. 1994, 50, 295–302. [Google Scholar] [CrossRef] [Green Version]
  21. Husson, O. Redox potential (Eh) and pH as drivers of soil/plant/microorganism systems: A transdisciplinary overview pointing to integrative opportunities for agronomy. Plant Soil 2013, 362, 389–417. [Google Scholar] [CrossRef] [Green Version]
  22. Husson, O.; Husson, B.; Brunet, A.; Babre, D.; Alary, K.; Sarthou, J.P.; Charpentier, H.; Durand, M.; Benada, J.; Henry, M. Practical improvements in soil redox potential (Eh) measurement for characterisation of soil properties. Application for comparison of conventional and conservation agriculture cropping systems. Anal. Chim. Acta 2016, 906, 98–109. [Google Scholar] [CrossRef] [PubMed]
  23. Hoagland, D.R.; Arnon, D.I. The water-culture method for growing plants without soil. Calif. Agric. Exp. Stn. Circ. 1950, 347, 1–32. [Google Scholar]
  24. Husson, O.; Brunet, A.; Babre, D.; Charpentier, H.; Durand, M.; Sarthou, J.-P.J.; Temp, M. Conservation agriculture systems alter the electrical characteristics (Eh, pH and EC) of four soil types in France. Soil Tillage Res. 2018, 176, 57–68. [Google Scholar] [CrossRef]
  25. Benada, J. The measurement of redox potential in plants and some applications on the growth and development of cereals. Flora Abt. A 1968, 159, 104–127. [Google Scholar] [CrossRef]
  26. Benada, J. Measurement of redox potential and ph in plants and their function in the mechanism of plant resistance and in plant physiology. Int. J. Adv. Res. Electr. Electron. Instrum. Eng. 2016, 1111–1116. [Google Scholar] [CrossRef]
  27. Howell, D.C. Statistical Methods for Psychology; Cengage Learning: Stamford, CT, USA, 2009; ISBN 9780495597841. [Google Scholar]
  28. Addinsoft XLSTAT. Available online: https://www.xlstat.com/fr/solutions/premium (accessed on 28 September 2018).
  29. Yoshida, S. Fundamentals of Rice Crop Science; The Internstional Rice Research Interest: Los Banos, Philippines, 1981. [Google Scholar]
  30. Kusumi, K.; Hirotsuka, S.; Kumamaru, T.; Iba, K. Increased leaf photosynthesis caused by elevated stomatal methylation and chromatin patterning conductance in a rice mutant deficient in SLAC1, a guard cell anion channel protein. J. Exp. Bot. 2012, 63, 5636–5644. [Google Scholar] [CrossRef] [PubMed]
  31. Hatfi, J.L.; Walthall, C.L. Meeting global food needs: Realizing the potential via genetics × environment × management interactions. Agron. J. 2015, 107, 1215–1226. [Google Scholar] [CrossRef]
  32. Foyer, C.H.; Ruban, A.V.; Noctor, G. Viewing oxidative stress through the lens of oxidative signalling rather than damage. Biochem. J. 2017, 474, 877–883. [Google Scholar] [CrossRef] [PubMed] [Green Version]
  33. Zhang, D.; Tong, J.; He, X.; Xu, Z.; Xu, L.; Wei, P.; Huang, Y.; Brestic, M.; Ma, H.; Shao, H. A novel soybean intrinsic protein gene, GmTIP2;3, involved in responding to osmotic stress. Front. Plant Sci. 2016, 6, 1–10. [Google Scholar] [CrossRef] [PubMed]
  34. Kapoor, D.; Sharma, R.; Handa, N.; Kaur, H.; Rattan, A.; Yadav, P.; Gautam, V.; Kaur, R.; Bhardwaj, R. Redox homeostasis in plants under abiotic stress: Role of electron carriers, energy metabolism mediators and proteinaceous thiols. Front. Environ. Sci. 2015, 3, 1–12. [Google Scholar] [CrossRef]
  35. Tang, X.; Mu, X.; Shao, H.; Wang, H.; Brestic, M. Global plant-responding mechanisms to salt stress: Physiological and molecular levels and implications in biotechnology. Crit. Rev. Biotechnol. 2015, 35, 425–437. [Google Scholar] [CrossRef] [PubMed]
  36. Gadjev, I.; Stone, J.M.; Gechev, T.S. Programmed cell death in plants: New insights into redox regulation and the role of hydrogen peroxide. Int. Rev. Cell Mol. Biol. 2008, 270, 87–144. [Google Scholar] [PubMed]
  37. Pereira, A. Plant abiotic stress challenges from the changing environment. Psychiatr. Danub. 2016, 7 (Suppl. S1), 2013–2015. [Google Scholar] [CrossRef] [PubMed]
  38. Chen, T.; My, T.; Nguyen, N.; Kahlen, K.; Stützel, H. Quantification of the effects of architectural traits on dry mass production and light interception of tomato canopy under different temperature regimes using a dynamic functional–structural plant model. J. Exp. Bot. 2014, 65, 6399–6410. [Google Scholar] [CrossRef] [PubMed]
  39. Poole, L.B.; Karplus, P.A.; Claiborne, A. Protein sulfenic acids in redox signaling. Annu. Rev. Pharmacol. Toxicol. 2004, 44, 325–347. [Google Scholar] [CrossRef] [PubMed]
  40. Singh, M.P.; Lee, F.N.; Counce, P.A.; Gibbons, J.H.; Barr, H.; Pyricularia, S. Mediation of partial resistance to rice blast through anaerobic induction of ethylene. Phytopathology 2004, 94, 819–825. [Google Scholar] [CrossRef] [PubMed]
  41. Hossain, M.M.; Srikant, K.; Hegde, Y.R. Physiological and nutritional studies on Pyricularia grisea, the causal agent of blast of rice. Karnataka J. Agric. Sci. 2004, 17, 851–853. [Google Scholar]
  42. Roumen, E.C. Effect of leaf age on components of partial resistance in rice to leaf blast. Euphytica 1992, 63, 271–279. [Google Scholar] [CrossRef]
  43. Challagulla, V.; Bhattarai, S.; Midmore, D.J. In-vitro vs in-vivo inoculation: Screening for resistance of Australian rice genotypes against blast fungus. Rice Sci. 2015, 22, 132–137. [Google Scholar] [CrossRef]
  44. Ndjiondjop, M.-N.; Albar, L.; Fargette, D.; Fauquet, C.; Ghesquière, A. The genetic basis of high resistance to rice yellow mottle virus (RYMV) in cultivars of two cultivated rice species. Plant Dis. 1999, 83, 931–935. [Google Scholar] [CrossRef]
  45. Joseph, A.; Olufolaji, D.; Nwilene, F.; Onasanya, A.; Omole, M.; Onasanya, R.; Sere, Y. Effect of leaf age on rice yellow mottle virus severity and chlorophyll content with mechanical inoculation and vector transmission method. Trends Appl. Sci. Res. 2011, 6, 691–698. [Google Scholar] [CrossRef]
  46. Rousk, J.; Bååth, E.; Brookes, P.C.; Lauber, C.L.; Lozupone, C.; Caporaso, J.G.; Knight, R.; Fierer, N. Soil bacterial and fungal communities across a pH gradient in an arable soil. ISME J. 2010, 4, 1340–1351. [Google Scholar] [CrossRef] [PubMed] [Green Version]
  47. Suresh, S.R.; Yenjerappa, S.T.; Naik, M.K.; Mallesh, S.B.; Kalibavi, C.M. Studies on cultural and physiological characters of Xanthomonas oryzae pv. oryzae causing bacterial blight of rice. Karnataka J. Agric. Sci. 2013, 26, 214–216. [Google Scholar]
  48. Fuangthong, M.; Mongkolsuk, S. Isolation and characterization of a multiple peroxide resistant mutant from Xanthomonas campestris pv. phaseoli. FEMS Microbiol. Lett. 1997, 152, 189–194. [Google Scholar] [CrossRef] [PubMed]
  49. Jha, G.; Sonti, R.V. Attack and defense in Xanthomonas-rice interactions. Proc. Indian Natn Sci. Acad. 2009, 75, 49–68. [Google Scholar]
  50. Niño-Liu, D.O.; Ronald, P.C.; Bogdanove, A.J. Xanthomonas oryzae pathovars: Model pathogens of a model crop. Mol. Plant Pathol. 2006, 7, 303–324. [Google Scholar] [CrossRef] [PubMed]
  51. Koch, M.; Mew, T. Effect of plant age and leaf maturity on the quantitative resitance of rice cultivars to Xanthomonas campestris pv. oryzae. Plant Dis. 1991, 75, 901–904. [Google Scholar] [CrossRef]
  52. Benada, J. Redox Potential and pH in Plants and Their Function in the Mechanism of Resistance to Diseases and in Plant Physiology; Agrotest fyto s.r.o. Zemědělský výzkumný ústav Kroměříž: Kroměříž, Czech Republic, 2008; ISBN 978-80-87555-06-4. [Google Scholar]
  53. Séré, Y.; Fargette, D.; Abo, M.E.; Wydra, K.; Bimerew, M.; Onasanya, A.; Akator, S.K. Managing the major diseases of rice in Africa. In Realizing Africa’s Rice Promise; Wopereis, M., Johnson, D., Ahmadi, N., Tollens, E., Jalloh, A., Eds.; CABI Publishing: Wallingford, UK, 2013; pp. 213–228. [Google Scholar]
  54. Ponnamperuma, F.N. The chemistry of submerged soils. Adv. Agron. 1972, 24, 29–96. [Google Scholar]
  55. Vanacker, H.; Carver, T.L.W.; Foyer, C.H. Pathogen-induced changes in the antioxidant status of the apoplast in barley leaves. Plant Physiol. 1998, 117, 1103–1114. [Google Scholar] [CrossRef] [PubMed]
  56. Wang, Z.; Thornton, C.R.; Kershaw, M.J.; Debao, L.; Talbot, N.J. The glyoxylate cycle is required for temporal regulation of virulence by the plant pathogenic fungus Magnaporthe grisea. Mol. Microbiol. 2003, 47, 1601–1612. [Google Scholar] [CrossRef] [PubMed]
  57. Liu, G.; Ji, Y.; Bhuiyan, N.H.; Pilot, G.; Selvaraj, G.; Zou, J.; Wei, Y. Amino acid homeostasis modulates salicylic acid-associated redox status and defense responses in Arabidopsis. Plant Cell Online 2010, 22, 3845–3863. [Google Scholar] [CrossRef] [PubMed]
  58. Galhano, R.; Talbot, N.J. The biology of blast: Understanding how Magnaporthe oryzae invades rice plants. Fungal Biol. Rev. 2011, 25, 61–67. [Google Scholar] [CrossRef]
  59. Williams, B.; Kabbage, M.; Kim, H.J.; Britt, R.; Dickman, M.B. Tipping the balance: Sclerotinia sclerotiorum secreted oxalic acid suppresses host defenses by manipulating the host redox environment. PLoS Pathog. 2011, 7, e1002107. [Google Scholar] [CrossRef] [PubMed] [Green Version]
  60. Lysøe, E.; Harris, L.J.; Walkowiak, S.; Subramaniam, R.; Divon, H.H.; Riiser, E.S.; Llorens, C.; Gabaldón, T.; Kistler, H.C.; Jonkers, W.; et al. The genome of the generalist plant pathogen Fusarium avenaceum is enriched with genes involved in redox, signaling and secondary metabolism. PLoS ONE 2014, 9, e112703. [Google Scholar] [CrossRef] [PubMed] [Green Version]
  61. Samalova, M.; Meyer, A.J.; Gurr, S.J.; Fricker, M.D. Robust anti-oxidant defences in the rice blast fungus Magnaporthe oryzae confer tolerance to the host oxidative burst. New Phytol. 2014, 201, 556–573. [Google Scholar] [CrossRef] [PubMed] [Green Version]
  62. Egan, M.J.; Wang, Z.-Y.; Jones, M.A.; Smirnoff, N.; Talbot, N.J. Generation of reactive oxygen species by fungal NADPH oxidases is required for rice blast disease. Proc. Natl. Acad. Sci. USA 2007, 104, 11772–11777. [Google Scholar] [CrossRef] [PubMed] [Green Version]
  63. Wilson, R.A.; Gibson, R.P.; Quispe, C.F.; Littlechild, J.A.; Talbot, N.J. An NADPH-dependent genetic switch regulates plant infection by the rice blast fungus. Proc. Natl. Acad. Sci. USA 2010, 107, 21902–21907. [Google Scholar] [CrossRef] [PubMed] [Green Version]
  64. Landraud, P.; Chuzeville, S.; Billon-Grande, G.; Poussereau, N.; Bruel, C. Adaptation to pH and role of PacC in the rice blast fungus Magnaporthe oryzae. PLoS ONE 2013, 8, e69236. [Google Scholar] [CrossRef] [PubMed]
  65. Guo, M.; Guo, W.; Chen, Y.; Dong, S.; Zhang, X.; Zhang, H.; Song, W.; Wang, W.; Wang, Q.; Lv, R.; et al. The basic leucine zipper transcription factor Moatf1 mediates oxidative stress responses and is necessary for full virulence of the rice blast fungus Magnaporthe oryzae. Mol. Plant Microbe Interact. 2010, 23, 1053–1068. [Google Scholar] [CrossRef] [PubMed]
  66. Brugidou, C.; Opalka, N.; Yeager, M.; Beachy, R.N.; Fauquet, C. Stability of rice yellow mottle virus and cellular compartmentalization during the infection process in Oryza sativa (L.). Virology 2002, 297, 98–108. [Google Scholar] [CrossRef] [PubMed]
  67. Gillet, F.X.; Cattoni, D.I.; Petiot-Bécard, S.; Delalande, F.; Poignavent, V.; Brizard, J.P.; Bessin, Y.; Dorsselaer, A.V.; Declerck, N.; Sanglier-Cianférani, S.; et al. The RYMV-encoded viral suppressor of RNA silencing P1 is a zinc-binding protein with redox-dependent flexibility. J. Mol. Biol. 2013, 425, 2423–2435. [Google Scholar] [CrossRef] [PubMed]
  68. Le Thanh, T.; Thumanu, K.; Wongkaew, S.; Boonkerd, N.; Teaumroong, N.; Phansak, P.; Buensanteai, N. Salicylic acid-induced accumulation of biochemical components associated with resistance against Xanthomonas oryzae pv. oryzae in rice. J. Plant Interact. 2017, 12, 108–120. [Google Scholar] [CrossRef]
  69. Rasool, B.; Mcgowan, J.; Pastok, D.; Marcus, S.E.; Morris, J.A.; Verrall, S.R.; Hedley, P.E.; Hancock, R.D.; Foyer, C.H. Redox control of aphid resistance through altered cell wall composition and nutritional quality. Plant Physiol. 2017, 175, 259–271. [Google Scholar] [CrossRef] [PubMed]
  70. Farber, D.H.; Mundt, C.C. Effect of plant age and leaf position on susceptibility to wheat stripe rust. Phytopathology 2017, 412–417. [Google Scholar] [CrossRef] [PubMed]
  71. Develey-Rivière, M.P.; Galiana, E. Resistance to pathogens and host developmental stage: A multifaceted relationship within the plant kingdom. New Phytol. 2007, 175, 405–416. [Google Scholar] [CrossRef] [PubMed]
  72. Chant, S.R.; Gbaja, I.S. Effect of nutrition on the interaction of viruses and Fusarium Oxysporum in tomato seedlings. Phytoparasitica 1985, 13, 47–57. [Google Scholar] [CrossRef]
  73. Dordas, C. Role of nutrients in controlling plant diseases in sustainable agriculture. A review. Agron. Sustain. Dev. 2008, 28, 33–46. [Google Scholar] [CrossRef]
  74. Fagard, M.; Launay, A.; Clément, G.; Courtial, J.; Dellagi, A.; Farjad, M.; Krapp, A.; Soulié, M.C.; Masclaux-Daubresse, C. Nitrogen metabolism meets phytopathology. J. Exp. Bot. 2014, 65, 5643–5656. [Google Scholar] [CrossRef] [PubMed] [Green Version]
  75. Trotta, A.; Rahikainen, M.; Konert, G.; Finazzi, G.; Kangasjärvi, S. Signalling crosstalk in light stress and immune reactions in plants. Philos. Trans. R. Soc. B Biol. Sci. 2014, 369, 20130235. [Google Scholar] [CrossRef] [PubMed]
  76. Bonanomi, G.; Ippolito, F.; Scala, F. A black future for plant pathology? Biochar as a new soil amendment for controlling plant diseases. J. Plant Pathol. 2015, 97, 223–234. [Google Scholar] [CrossRef]
  77. Joseph, S.; Chia, C.; Munroe, P.; Donne, S.; Thomas, T.; Nielsen, S.; Marjo, C.; Rutlidge, H.; Li, L.; Taylor, P.; et al. Shifting paradigms: Development of high-efficiency biochar fertilizers based on nano-structures and soluble components. Carbon Manag. 2013, 4, 323–343. [Google Scholar] [CrossRef]
  78. Graber, E.R.; Frenkel, O.; Jaiswal, A.K.; Elad, Y. How may biochar influence severity of diseases caused by soilborne pathogens? Carbon Manag. 2014, 5, 169–183. [Google Scholar] [CrossRef]
  79. Tollenaere, C.; Lacombe, S.; Wonni, I.; Barro, M.; Ndougonna, C.; Gnacko, F.; Sérémé, D.; Jacobs, J.; Hebrard, E.; Cunnac, S.; et al. Virus-bacteria rice co-infection in Africa: Field estimation, reciprocal effects, molecular mechanisms, and evolutionary implications. Front. Plant Sci. 2017, 8, 645. [Google Scholar] [CrossRef] [PubMed]
  80. Filippi, M.C.C.; da Silva, G.B.; Silva-Lobo, V.L.; Côrtes, M.V.C.B.; Moraes, A.J.G.; Prabhu, A.S. Leaf blast (Magnaporthe oryzae) suppression and growth promotion by rhizobacteria on aerobic rice in Brazil. Biol. Control 2011, 58, 160–166. [Google Scholar] [CrossRef]
  81. Bart, R.; Ronald, P.; Hake, S. Fertility versus disease resistance, a hard choice. Genes Dev. 2006, 20, 1215–1217. [Google Scholar] [CrossRef] [PubMed] [Green Version]
  82. Xiong, L.; Yang, Y. Disease resistance and abiotic stress tolerance in rice are inversely modulated by an abscisic acid–inducible mitogen-activated protein kinase. Plant Cell 2003, 15, 745–759. [Google Scholar] [CrossRef] [PubMed]
  83. Rausher, M.D. Co-evolution and plant resistance to natural enemies. Nature 2001, 411, 857–864. [Google Scholar] [CrossRef] [PubMed]
  84. Meynard, J.M.; Dedieu, B.; Bos, A.P.B. Re-design and co-design of farming systems. An overview of methods and practices. In Farming Systems Research into the 21st Century: The New Dynamic; Darnhofer, I., Gibon, D., Dedieu, B., Eds.; Springer: New York, NY, USA, 2012; pp. 407–432. [Google Scholar]
Figure 1. Diurnal and genotypic variability of leaf redox potential (Eh), pH and redox potential corrected to pH 7 (Eh@pH7) at two plant ages (40 and 59 DAS) for three rice varieties (Nerica4, IRBLTA2Pi, Azucena). Regression equations over time and strength of the relationship (R2 and p values) are given for each variety. (A,B). Diurnal changes in Eh (mV) for the two plant ages. (C,D) Diurnal changes in pH for the two plant ages. (E,F). Diurnal changes in Eh@pH7 (mV) for the two plant ages.
Agronomy 08 00209 g001
Figure 2. Varietal variability of leaf Eh, pH and Eh@pH7. pH-Eh (A) and pH-Eh@pH7 (B) diagrams for three varieties and two plant ages. Mean values for each group are indicated with standard deviation. Rice was grown in aerobic conditions, fertilized with Hoagland solution. Data are from season IV, sown 2 December 2016. Measurements were made on the middle part of the last fully expanded leaf of the main tiller.
Agronomy 08 00209 g002
Figure 3. Intra-leaf variability of Eh (mV) (A), pH (B) and Eh@pH7 (mV) (C) respectively, for three leaf positions (Base, Middle, Tip), at two plant ages (40 and 59 DAS (days after sowing)), under two water management treatments (“Upland” = aerobic conditions, “Lowland” = anaerobic conditions). Error bars represent one standard deviation. Data are means of the last fully expanded leaf of the main tiller of three plants from season III, sown 13 January 2017.
Agronomy 08 00209 g003
Figure 4. Correlation of leaf Eh (A) and Eh@pH7 (B) respectively with leaf length (cm) for 3 leaf age classes. Measurements made on the middle part of the leaf of four 61 to 64-day-old plants from season II, sown 17 August 2016 under upland management.
Agronomy 08 00209 g004
Figure 5. Map of inter-leaf variability in pH, Eh and Eh@pH7 over tillers and leaf ranks. Leaf and tiller numbering according to Katayama (1951). Data are means (n = 4) of the middle part of the leaf of four 61 to 64-day-old plants from season II, sown 17 August 2016 under upland management.
Agronomy 08 00209 g005
Figure 6. Inter-leaf variability of Eh (A), pH (B) and Eh@pH7 (C) respectively and pairwise comparisons between six age groups. Data are means of the middle part of the leaf of four 61 to 64-day-old plants from season II, sown 17 August 2016 under upland management. Age groups with different letters are significantly different at 95% confidence interval (REGW-Q test).
Agronomy 08 00209 g006
Table 1. Synthesis of the three series of experiments. For each trial, trial replication number (“season”), fertilization, soil type, varieties, water management (“upland” for drained pots, “lowland” for permanently submerged pots), sowing date and measurement dates are indicated, with the corresponding age of the plants at measurement
Trial NameSeasonFertilizationSoil TypeVarietiesWater ManagementSowing DateMeasurement 1Measurement 2
Diurnal changeSeason I-ClayeyNerica 4, IRBLTA-2Pi, IDSA6Upland11 December 201528 January 2016, 48 DAS22 February 2016, 73 DAS
Diurnal changeSeason IINPKClayeyNerica 4, IRBLTA-2Pi, IDSA6Upland25 April 201620 June 2016, 56 DAS21 June 2016, 57 DAS
Diurnal changeSeason IIINPKClayeyNerica 4, IRBLTA-2Pi, AzucenaUpland12 August 201620–21 September 2016, 39–40 DAS10–11 October 2016, 59–60 DAS *
Diurnal changeSeason IVHoaglandClayeyNerica 4, IRBLTA-2Pi, AzucenaUpland2 December 201610–11 January 2017, 39–40 DAS30–31 January 2017, 59–60 DAS *
Intra leaf variabilitySeason I-ClayeyNerica 4Upland11 February 20167 March 2016, 25 DAS
Intra leaf variabilitySeason IINPKClayeyNerica 4Upland and lowland17 August 201617–20 October 2016, 61–64 DAS2 November 2016, 80 DAS
Intra leaf variabilitySeason IIIHoaglandSandyNerica 4Upland and lowland13 January 201722 February 2017, 40 DAS14 March 2017, 60 DAS
Intra leaf variabilitySeason IVHoaglandClayeyIR 64Lowland22 February 201719 April 2017, 55 DAS
Inter leaf variabilitySeason I-ClayeyNerica 4Upland11 February 201622–23 March 2016, 39–40 DAS12–13 April 2016, 61–62 DAS
Inter leaf variabilitySeason IINPKClayeyNerica 4Upland17 August 201627–28 September 2016, 40–41 DAS17–20 October 2016, 61–64 DAS
Inter leaf variabilitySeason IIIHoaglandClayeyNerica 4Upland, 2 soil gradients19–22 November 201619–22 December 2016, 30 DAS16–21 January 2017, 58 DAS
Inter leaf variabilitySeason IVHoaglandClayeyNerica 4 and IR 64Upland and lowland13 February 201728–31 March 2017, 43–46 DAS
Inter leaf variabilitySeason VField + NPKSandyNerica 4Upland20 February 20175–7 April 2017, 44–46 DAS
* Measurements interrupted by heavy rains/stormy weather on 10 October 2016 and 31 January 2017 have not been used in the analysis. DAS, for days after sowing are indicated.
Table 2. Means and pairwise comparisons of Eh, pH, Eh@pH7, mean temperature and solar radiation intensity at two plant ages (39–40 and 60 DAS days after sowing) for three rice varieties (Nerica4, IRBLTA2Pi, Azucena) in two growing seasons/fertilization, in aerobic conditions. In season III plants were sown 12 August 2016 and fertilized with NPK. In season IV plants were sown 2 December 2016 and fertilized with Hoagland solution. Measurements were made on the middle part of the last fully expanded leaf of the main tiller. F and p values of the analysis of variance (ANOVA) are indicated. Values followed by different letters indicate significant difference between plant ages at 95% confidence interval Ryan-Einot-Gabriel-Welsh test Q (REGW-Q).
Season IIIVarietynDays after SowingFpSeason IVVarietynDays after SowingFp
40 DAS60 DAS39 DAS59 DAS
Eh (mV)Nerica410235.7 b265.4 a47.97<0.0001Eh (mV)Nerica410240.3 b256.1 a22.190.000
IRBLTA-2Pi10241.8 b276.8 a48.57<0.0001IRBLTA-2Pi10250.7 b267.2 a38.84<0.0001
Azucena10253.9 b279.4 a42.13<0.0001Azucena10246.1 b268.1 a31.57<0.0001
pHNerica4106.16 a5.85 b56.06<0.0001pHNerica4106.50 a5.76 b592.81<0.0001
IRBLTA-2Pi106.20 a6.17 a1.140.302IRBLTA-2Pi106.79 a5.89 b381.94<0.0001
Azucena96.09 a5.84 b23.610.000Azucena106.44 a5.78 b168.91<0.0001
Eh@pH7 (mV)Nerica410185.0 b196.4 a4.480.049Eh@pH7 (mV)Nerica410210.2 a182.1 b43.38<0.0001
IRBLTA-2Pi10195.0 b226.8 a24.390.000IRBLTA-2Pi10239.0 a200.5 b167.23<0.0001
Azucena9199.2 a209.9 a4.130.059Azucena10210.6 a194.7 b13.920.002
Temperature (°C)Nerica41030.03 a29.25 b7.010.016Temperature (°C)Nerica41027.40 b29.43 a16.720.001
IRBLTA-2Pi1029.97 a29.20 b5.490.031IRBLTA-2Pi1027.39 b29.41 b16.000.001
Azucena1029.92 a29.15 b5.970.025Azucena1027.52 a29.44 a14.350.001
Solar radiation (Wm−2)Nerica41049.61 a28.44 b5.280.031Solar radiation (Wm−2)Nerica41038.13 a30.73 a1.080.312
IRBLTA-2Pi1047.31 a27.66 b8.320.010IRBLTA-2Pi1032.45 a34.68 a0.070.788
Azucena1049.91 a27.30 b10.090.005Azucena1030.85 a36.79 a0.570.459
Table 3. Means and pairwise comparisons of Eh, pH, Eh@pH7, temperature and solar radiation intensity in two growing seasons (II and III) for 59–60-day-old plants, for two rice varieties (Nerica 4, IRBLTA2Pi). Plants were sown 25 April 2016 in season II and 12 August 2016 in season III, grown in aerobic conditions, fertilized with NPK. Measurements were made on the middle part of the last fully expanded leaf of the main tiller. F and p values of the ANOVA are indicated. Values followed by different letters indicate significant difference between seasons at 95% confidence interval (REGW-Q test).
VarietynSeasonFp
Season IISeason III
Eh (mV)Nerica410249.6 b265.2 a27.39<0.0001
IRBLTA-2Pi10264.1 a276.8 b3.880.065
pHNerica4105.95 a5.85 b5.630.030
IRBLTA-2Pi106.24 a6.17 a2.600.125
Eh@pH7 (mV)Nerica410186.4 b196.4 a5.840.027
IRBLTA-2Pi10218.6 a226.8 a1.230.283
Temperature (°C)Nerica41029.71 a29.25 a2.270.150
IRBLTA-2Pi1029.72 a29.20 a2.560.128
Solar radiation (Wm−2)Nerica41068.91 a28.44 b19.740.000
IRBLTA-2Pi1077.35 a27.66 b25.66<0.0001
Table 4. Means and pairwise comparisons of Eh, pH and Eh@pH7 of three rice varieties (Nerica4, IRBLTA2Pi, Azucena) at two plant ages (39–40 and 60 DAS, (days after sowing)) in two growing seasons/fertilization, in aerobic conditions. In season III plants were sown 12 August 2016 and fertilized with NPK. In season IV plants were sown 2 December 2016 and fertilized with Hoagland solution. Measurements were made on the middle part of the last fully expanded leaf of the main tiller. Mean temperature and solar radiation at the day of measurement are indicated. Data for the plant ages 39 and 40 were pooled, details and pairwise comparisons are given in Table S4. F and p values of the ANOVA are indicated. Values followed by different letters indicate significant difference between varieties at 95% confidence interval (REGW-Q test).
DASnVarietiesFpTemperature (°C)Solar Radition (Wm−2)
IRBLTA-2PiAzucenaNerica4
Season III
Eh (mV)39–40 DAS20242.6 b250.8 a237.6 b9.540.00029.2027.80
60 DAS10276.8 a279.4 a265.2 b4.480.02129.2251.04
pH39–40 DAS206.24 a6.06 b6.18 a10.050.00029.2027.80
60 DAS106.17 a5.84 b5.85 b45.31<0.000129.2251.04
Eh@pH7 (mV)39–40 DAS20198.1 a194.2 ab188.2 b3.040.05629.2027.80
60 DAS10226.8 a209.9 b196.4 c12.860.00029.2251.04
Season IV
Eh (mV)39–40 DAS20252.8 a252.3 a243.6 b5.610.00627.3329.04
59 DAS10267.2 a268.1 a256.5 b8.060.00229.4336.53
pH39–40 DAS206.79 a6.50 b6.43 B46.11<0.000127.3329.04
59 DAS105.89 a5.78 b5.76 b11.980.00029.4336.53
Eh@pH7 (mV)39–40 DAS20241.0 a222.4 b210.1 c31.22<0.000127.3329.04
59 DAS10200.5 a194.7 a182.1 b12.010.00029.4336.53

