Article

Yield and Quality Characteristics of Different Quinoa (Chenopodium quinoa Willd.) Cultivars Grown under Field Conditions in Southwestern Germany

Department of Agronomy, Institute of Crop Science, University of Hohenheim, Stuttgart 70599, Germany
*
Author to whom correspondence should be addressed.
Agronomy 2018, 8(10), 197; https://doi.org/10.3390/agronomy8100197
Submission received: 6 August 2018 / Revised: 14 September 2018 / Accepted: 18 September 2018 / Published: 20 September 2018

Abstract

:
Due to its highly nutritive compounds, the demand for quinoa, a small grain originating from the Andean region of South America, increased rapidly over the last years. However, the main producing countries Bolivia and Peru cannot cover the growing demand. Therefore, the interest of European farmers in cultivating quinoa as a profitable source of income rose very fast. Thanks to a broad genetic diversity an adaption to various climatic conditions is possible. The objective of this study was to evaluate the stability of agronomic performance in two consecutive growing periods (2015 and 2016) of four European quinoa cultivars (Puno, Titicaca, Jessie, Zeno), originating from different genepools to identify a suitable cultivar to grow in southwestern Germany. Measurements included grain yield, thousand kernel weight (TKW), saponin content, protein content, crude fat content, amino acid profile and fatty acid profile. This study demonstrated the possibility of an economic production of quinoa under the environmental conditions in southwestern Germany, combining competitive yields (1.73–2.43 Mg ha−1) with a high grain quality regarding protein content (11.9–16.1%), essential amino acid content (20.35–30.02 g 100 g−1 crude protein), fat content (5.5–7.5%) and fatty acid profile (consists of 60% linoleic acid). Depending on cultivar, the investigated yield (TKW and protein content)-and quality ((semi-)essential amino acids)-traits varied more or less sensitive, which was attributed to lower precipitation and higher temperatures in 2015. Furthermore, best yield- and quality-characteristics were not combined in one cultivar, wherefore the selection of a specific quinoa cultivar has to be aligned with the production aim.

1. Introduction

Quinoa (Chenopodium quinoa Willd.) is an annual dicotyledonous herbaceous crop of the Amaranthaceae family and native to the Andean region, including Colombia, Peru, Ecuador, Argentina, Chile and Bolivia [1,2]. For thousands of years, the cereal grain-like achenes of quinoa served as staple food for the indigenous Andean populations until it gained increasing interest during the last years, due to the highly nutritive compounds contained in the seeds [3,4,5]. The exceptional nutritious components of interest include high protein contents combined with a high quality, regarding essential amino acid contents. Further, quinoa seeds provide essential (poly-) unsaturated fatty acids, minerals and a large antioxidant capacity [6,7,8]. Moreover, it is suitable for celiac patients, due to the absence of gluten [9]. Therefore, the demand for quinoa products and consequently the price increased rapidly over the last years [1,10]. In order to meet the requirements of the increasing demand for raw quinoa the main producing countries Bolivia and Peru expanded the agricultural production area. This was accompanied with unsustainability, e.g., disappearance of natural vegetation, growing quinoa on contaminated soils and degradation of land, which resulted in severe consequences on the livelihood of the indigenous population [10,11,12,13].
To buffer the discrepancies between demand and supply of quinoa, while simultaneously generating profitable sources of income for European farmers, there is a remarkable interest in growing quinoa at European latitudes [14,15]. As a result of different agro-ecological extremes (soils, rainfall, temperatures, and altitude) within the areas of origin, quinoa shows a broad genetic diversity and can be divided into five ecotypes highly adapted to specific environments, being tolerant against various abiotic stress factors (frost, drought, and salinity) [1,2,16]. However, the sensitivity against photoperiod is the most important factor in creating new varieties adopted to higher latitudes [17]. In most cases quinoa is a facultative short-day plant where flowering occurs under any photoperiod, but photoperiods longer than 12 h will disrupt seed filling and maturation [18,19,20,21]. Nevertheless, landraces adopted to the climatic conditions of Chile and southern Bolivia (both attributed to the coastal ecotype) were found to be less sensitive against photoperiod and used for further development resulting in daylength neutral genotypes, which are the only cultivars to grow in Europe [14,15,22,23]. Consequently, there is a loss in alleles limiting the possibilities for creating quinoa varieties adapted to special environments within Europe if only landraces (crop populations showing high levels of intra-varietal diversity) originating from the same ecotype were used [10]. Parents were mostly chosen based on multi-environment long-term results for seed yield, seed size, sensitivity against photoperiod, tolerance to lodging, drought tolerance, or pre-harvest sprouting resistance [24]. However, despite complex interactions between genotypic properties and environmental factors, quinoa breeding programs mainly focused on cultivars producing high yields [25,26,27]. Even though, some studies highlighted abiotic factors to influence the nutritional profile of quinoa seeds [28,29,30], there is little information on quality of different European quinoa cultivars or rather the mechanisms triggering quality changes [3,31,32]. Nonetheless, to competitively produce quinoa raw material for the growing demand on the world market, high yields and high quality have to be linked with each other. Therefore, the objectives of this study were to (i) evaluate the stability of agronomic performance of four European quinoa cultivars (Puno, Titicaca, Jessie, Zeno), originating from different genepools, (ii) identify a suitable cultivar for southwestern Germany with regard to grain yield, TKW, saponin content, protein content, crude fat content, amino acid profile and fatty acid profile.

2. Materials and Methods

2.1. Plant Material

An important attribute to secure a successful quinoa cultivation in northern Europe is the daylength neutrality and consequently an early maturity [14]. Since there are only nine registered European quinoa cultivars [14], two out of three most frequently tested cultivars (outside the Andes), namely cv. Puno and cv. Titicaca [10,27], were chosen to evaluate the agronomic performance of commercially available quinoa cultivars. Since these cultivars were created by the same breeder (Table 1), and therefore could have similar selection criteria regarding the originally used landraces, we additionally examined another registered European quinoa cultivar (cv. Jessie) as well as one European cultivar under development (cv. Zeno) to cover different genepools. According to the breeders cv. Jessie and Zeno were successfully cultivated in northern Germany and Austria, respectively. Except the French cultivar cv. Jessie, all selected genotypes should produce considerable amounts of bitter saponins as seed constituents, which could be a positive feature in organic farming [14].

2.2. Experimental Conditions

Field experiments were conducted in two consecutive growing seasons (2015 and 2016) at the experimental station “Ihinger Hof” belonging to the University of Hohenheim in southwestern Germany (48°44′ N, 8°55′ E, 478 m a.s.l.). According to the World Reference Base [33], experimental soils can be characterized as vertic Luvisol and vertic Cambisol in 2015 and 2016, respectively. Under temperate conditions of central Europe, Luvisols and Cambisols are often associated, providing well drained, highly fertile conditions for intensive agriculture [34]. In combination with quinoas´ characteristic to maintain its productivity even under poor soils [1], the soils used in 2015 and 2016 are comparable. The similarity was also reflected by the topsoils of the experimental fields, which had a similar texture (silt loam) with around 26% clay, 14% sand and 60% silt (Table 2).
Long-term average temperature and precipitation during growth period of quinoa (April to September) at the experimental location were 16.2 °C and 380 mm, respectively. In comparison to the long-term average, mean temperatures of the experimental years 2015 and 2016 were very similar with values of 16.8 and 16.1 °C, respectively. While precipitation in 2016 (388 mm) was also in accordance with the long-term average, it was much lower in 2015 (315 mm).
Comparing single months within both experimental periods, considerable differences occurred during June and July with 75.2 and 28.9 mm in 2015 compared to 108.3 and 64.8 mm in 2016. Maximum temperatures were generally higher in 2015 except June and September (Figure 1). Meteorological data were collected from an automatic weather station close to the experimental fields.

2.3. Experimental Design

For both growing seasons the experiments were arranged in a randomized, complete block design with three replications for each cultivar. Plot size was 30 m2 (10.7 m × 2.8 m) including eight rows with an inter row spacing of 0.35 m. The row orientation was east-west. Around six months before sowing, fields were ploughed to a depth of 0.3 m. The seed bed was prepared using a rotary harrow to a depth of 8 cm. On 29 April, sowing was done mechanically in both years at 1 cm depth to a theoretical density of 230 plants m−2. The plots were fertilized with calcium ammonium nitrate. Target values of nitrogen application were set to 80 and 100 kg ha−1 in 2015 and 2016, respectively. Soil mineral nitrogen contents were taken into account and subtracted from the target values. The difference was divided in two equal parts and broadcasted on two dates at sowing and 4 weeks after field emergence during vegetative growth. Intra and inter row weed control was done manually by hand and mechanically by hoeing.

2.4. Harvest

Harvest dates for each cultivar were set in accordance with plant senescence [35]. The difference in ripening (drydown) between some of the cultivars resulted in different harvest dates and consequently growing periods, varying between 122 and 154 days (Table 3).
In 2015, plots were hand-harvested at a 3 m section of four center rows (4.2 m2) by cutting the inflorescences at the field. Subsequently the samples were subjected to drying by ventilation (40 °C) for 48 h and threshed by a stationary ear thresher. In 2016, the four center rows of each plot were harvested completely using a plot combine harvester (Zürn 170, Zürn Harvesting GmbH & Co, Schöntal-Westernhausen, KG, Germany). To avoid border effects, a section of 0.72 m (1 m2) at the beginning and end of each plot was excluded. Final harvest area was 13 m2. Seeds were dried by ventilation (40 °C, 48 h) and cleaned using an air separator. In both years grain moisture was determined by drying a subsample of 50 g at 100 °C (24 h) immediately after harvest. Based on the determined grain dry matter contents absolute dry weights (0% moisture) were calculated to display grain yields. Furthermore, thousand kernel weight (TKW) was obtained by doing seed counts using a Contador® seed counter (Pfeuffer GmbH, Kitzingen, Germany). Saponin removal of seed subsamples (30–40 g) was done by polishing (1 min per sample) with a mechanical dehuller (LA-H, Westrup A/S, Slagelse, Denmark).

2.5. Chemical Analysis

Soil mineral N contents (Nmin) were determined colorimetrically after Bassler and Hoffman [36], using a flow injection analyser (FIAstar 5000 Analyzer, FOSS GmbH, Hamburg, Germany). For determination of total N contained in seeds, samples were measured according to the principles described by Dumas [37], using a vario Macro cube (Elementar Analysesysteme GmbH, Hanau, Germany). The total N contents of the seed samples were multiplied by a conversion factor of 6.25 to determine crude protein contents [29,38]. Grain saponin contents were estimated using a standardized afrosimetric foam test, developed by Koziol [39].
For a presumptive estimation of total lipids contained in the seed samples, the concentration of crude fat was analyzed. After grinding (0.5 mm, MM200, Retsch GmbH, Haan, Germany) the samples, fat extraction was done according to the European Commission Regulation 152/III H procedure B by semi-continuous extraction in a Soxhlet apparatus with petroleum benzine as solvent [40]. An amount of 5 g per sample was placed in an Erlenmeyer flask. After adding 100 mL of 3 M hydrochloric acid and three boiling chips, the flask was connected to a reflux condenser. The mixture was gently brought to boil and kept for one hour. A moistened, fat-free, filter paper (MN 715 ¼ ø 240 mm, MACHEREY-NAGEL GmbH & Co. KG, Düren, Germany) was used for filtration. The filtered residue was dried for one hour (95 °C) and extracted using a Soxhlet apparatus for six hours with petroleum benzine as solvent (100 mL, boiling range 30–50 °C; Carl Roth GmbH + Co. KG, Karlsruhe, Germany). The solvent was distilled off and the residue was dried for one hour in a drying oven at 103 °C. The content of crude fat is expressed as percentage (%) of sample on dry weight basis.
In order to determine the fatty acid (FA) profile of the extracted crude fat, we adapted different methods converting fatty acids to fatty acid methyl esters (FAMEs) by rapid saponification and esterification with methanolic BF3 (BF3·CH3OH) [41,42,43]. Briefly, 20 µL of the internal standard nonadecylic acid (C19:0, Merck KGaA, Darmstadt, Germany) (5 mg mL−1 hexane) was pipetted into each screw cap culture tube (DURAN GL14) and allowed to evaporate for 15 min in the fume hood. Saponification of the triglycerides was performed by treating around 5 mg crude fat sample with 0.5 mL methanolic KOH (0.5 M) in tubes at 80 °C for 5 min. After cooling, 2 mL methanolic BF3 was added to each sample and subsequently heated again to 80 °C for 5 min. After cooling down again for 10 min in an ice bath, 2 mL of n-hexane and 1 mL of saturated NaCl2 solution was added. Finally the organic phase, including the FAMEs, was separated and stored at −24 °C for subsequent analysis by gas chromatography (GC). FAME standard (Marine Oil FAME Mix, 35066 + 35021, Restek Ltd., Bellefonte, PA, USA) (10 mg mL−1 hexane) containing a mixture of FAs with even and odd number of C-atoms (including the internal standard, nonadecylic acid) was used for calibration with concentrations of 0.25, 0.5 and 1 mg mL−1. For FAME analysis, we used a GC appliance (Shimadzu GC-2010 Plus, Shimadzu Corp., Kyoto, Japan) equipped with a flame ionization detector (Shimadzu FID-2010 Plus). A total of 1.0 μL of each sample solution was injected by an auto sampler (Shimadzu AOC-201). A 30 m × 0.25 mm inner diameter fused silica capillary column coated with 0.25 μm polyethylene glycol (FAMEWAX, Restek Ltd., Bellefonte, PA, USA) was installed in the GC oven. Helium (purity 99.9%) was used as carrier gas, at a constant flow rate of 25.7 mL min−1. The GC oven temperature program started at 180 °C, heated at 5 °C min−1 to 220 °C (held for 1 min), then 5 °C min−1 to 240 °C (held for 8 min) and finally, 5 °C min−1 to 250 °C (held for 4 min). The total runtime was 26 min. The analyses were performed in duplicate for each cultivar and fatty acid contents were calculated using their peak area relative to that of the internal standard.
The amino acid (AA) profiles of seed samples were analyzed according to European Commission Regulation 152/III F [40]. Seeds were ground to 0.5 mm (MM200, Retsch GmbH, Haan, Germany) and a sample of 2 g (±0.2 mg) was transferred into a 225 mL borosilicate digestion tube. For determination of all proteogenic AAs except tryptophan (Trp), and S-containing methionine (Met) and Cysteine (Cys), the sample was subjected to acid hydrolysis with 100 mL phenolic hydrochloric acid (2 g phenol to 960 mL 37% HCl) at 110 °C for 24 h. To determine Met and Cys, aliquots were oxidized with 10 mL phenol-containing performic acid for 16 h. Subsequently, excess performic acid was neutralized by adding 1.68 g of Na2S2O5. This set of sample was also subjected to acid hydrolysis. Each hydrolysate was diluted in a 200 mL volumetric flask with HPLC grade water up to mark and then filtered (ash free, MN 615 ¼ ø 185 mm, MACHEREY-NAGEL GmbH & Co. KG, Düren, Germany). 1 mL 400 µg mL−1 DL-Norleucine (Merck KGaA, Darmstadt, Germany) was added as internal standard to a labelled 100 mL round bottom flask, after which 2 mL of filtered hydrolysate was added. After rotor evaporation to remove HCl, the hydrolysate was re-dissolved in small amounts Na-acetate buffer (pH 2.2) by swirling under sonication. This was then transferred to a 20 mL volumetric flask and filled up to mark with Na-acetate buffer. Around 1.5 mL hydrolysate was filtered (0.20 µm, ø 25 mm, LLG Labware, Meckenheim, Germany) into a 2 mL auto-sampler vial and the AA profile was measured by ion-exchange chromatography (Amino Acid Analyzer, Biochrom 30, Laborservice Onken, Gründau, Germany) using post-column derivatization with ninhydrin, followed by photometric detection at 570 nm and 440 nm for Proline [44]. The analysis of tryptophan (Trp) concentration in quinoa seeds by alkaline hydrolysis was according to the European Commission Regulation 152/III G [40]. 0.3 g sample was weighed and transferred into PTFE bottles. 4.2 g Ba(OH2)·8H2O and 8 mL deionized water was added, the mixture was autoclaved for 16 h at 125 °C. After carefully lowering of the pH of the hydrolysate to 3–3.5, it was transferred into 100 mL volumetric flasks and filled up to mark with deionized water. Around 40 mL of diluted hydrolysate was centrifuged (3400 rpm for 10 min.) and around 1.5 mL of the supernatant was transferred into multisampler injector vials. Separation and measurement of Trp concentration was done by reversed phase high performance liquid chromatography (Agilent 1200 series, Agilent Technologies Inc., Santa Clara, CA, USA; injection volume 10 µL, flow rate 1.3 mL min−1) equipped with EC 125/4.6 Nucleodur® C18 Pyramid, 5 µm column (MACHEREY-NAGEL GmbH & Co. KG, Düren, Germany). Tryptophan was measured with a fluorescent detector (excitation: 283 nm, emission: 355 nm).

2.6. Statistics

To determine significant differences between years and cultivars, the “gls”-function, included in the “nlme” package [45], was used to fit a linear model with the R programming language [46]. The fixed effects were year, cultivar and block. The fitted model was as follows:
y i j k = µ + α i + β j + ( α β ) i j + ( τ ) i k + ε i j k
where y i j k is the observed value for the i-th year, the j-th cultivar and the k-th block, µ is the overall value, α i is the main effect of the i-th year, β j is the main effect of the j-th cultivar, ( α β ) i j is the interaction effect of the i-th year and the j-th cultivar, ( τ ) i k is the effect of the k-th block in the i-th year and ε i j k is the error attributed to the observation y i j k . To assess homogeneity of variance and normal distribution of the data, Levene´s test and Shapiro Wilk test were used which are included in the “car” package of the R programming language. Then an analysis of variance (ANOVA) with a significance level of 5% was performed (Table 4). Finally, pairwise comparison between (i) the cultivars within year and (ii) the two years for the same cultivar were made with the Tukey test at a significance level of 5%.

3. Results

The tested cultivars reached sufficient maturity (grain dry matter contents between 83 and 89%) during both growing seasons. On average the demand for growing degree days until harvest expanded by 234.4 °Cd in 2015 compared to 2016 (Table 3). ANOVAs conducted for the different investigated yield- and quality parameters showed significant year × cultivar interactions for grain TKW, grain saponin (non-polished and polished), grain protein and amino acids (essential and semi-essential). Therefore, the means were separated and analyzed for each year separately (Table 4). Furthermore, significant cultivar effects occurred for grain yield, grain crude fat, and non-essential amino acids. In this case the two-year mean values of each cultivar were analyzed.

3.1. Yield Parameters

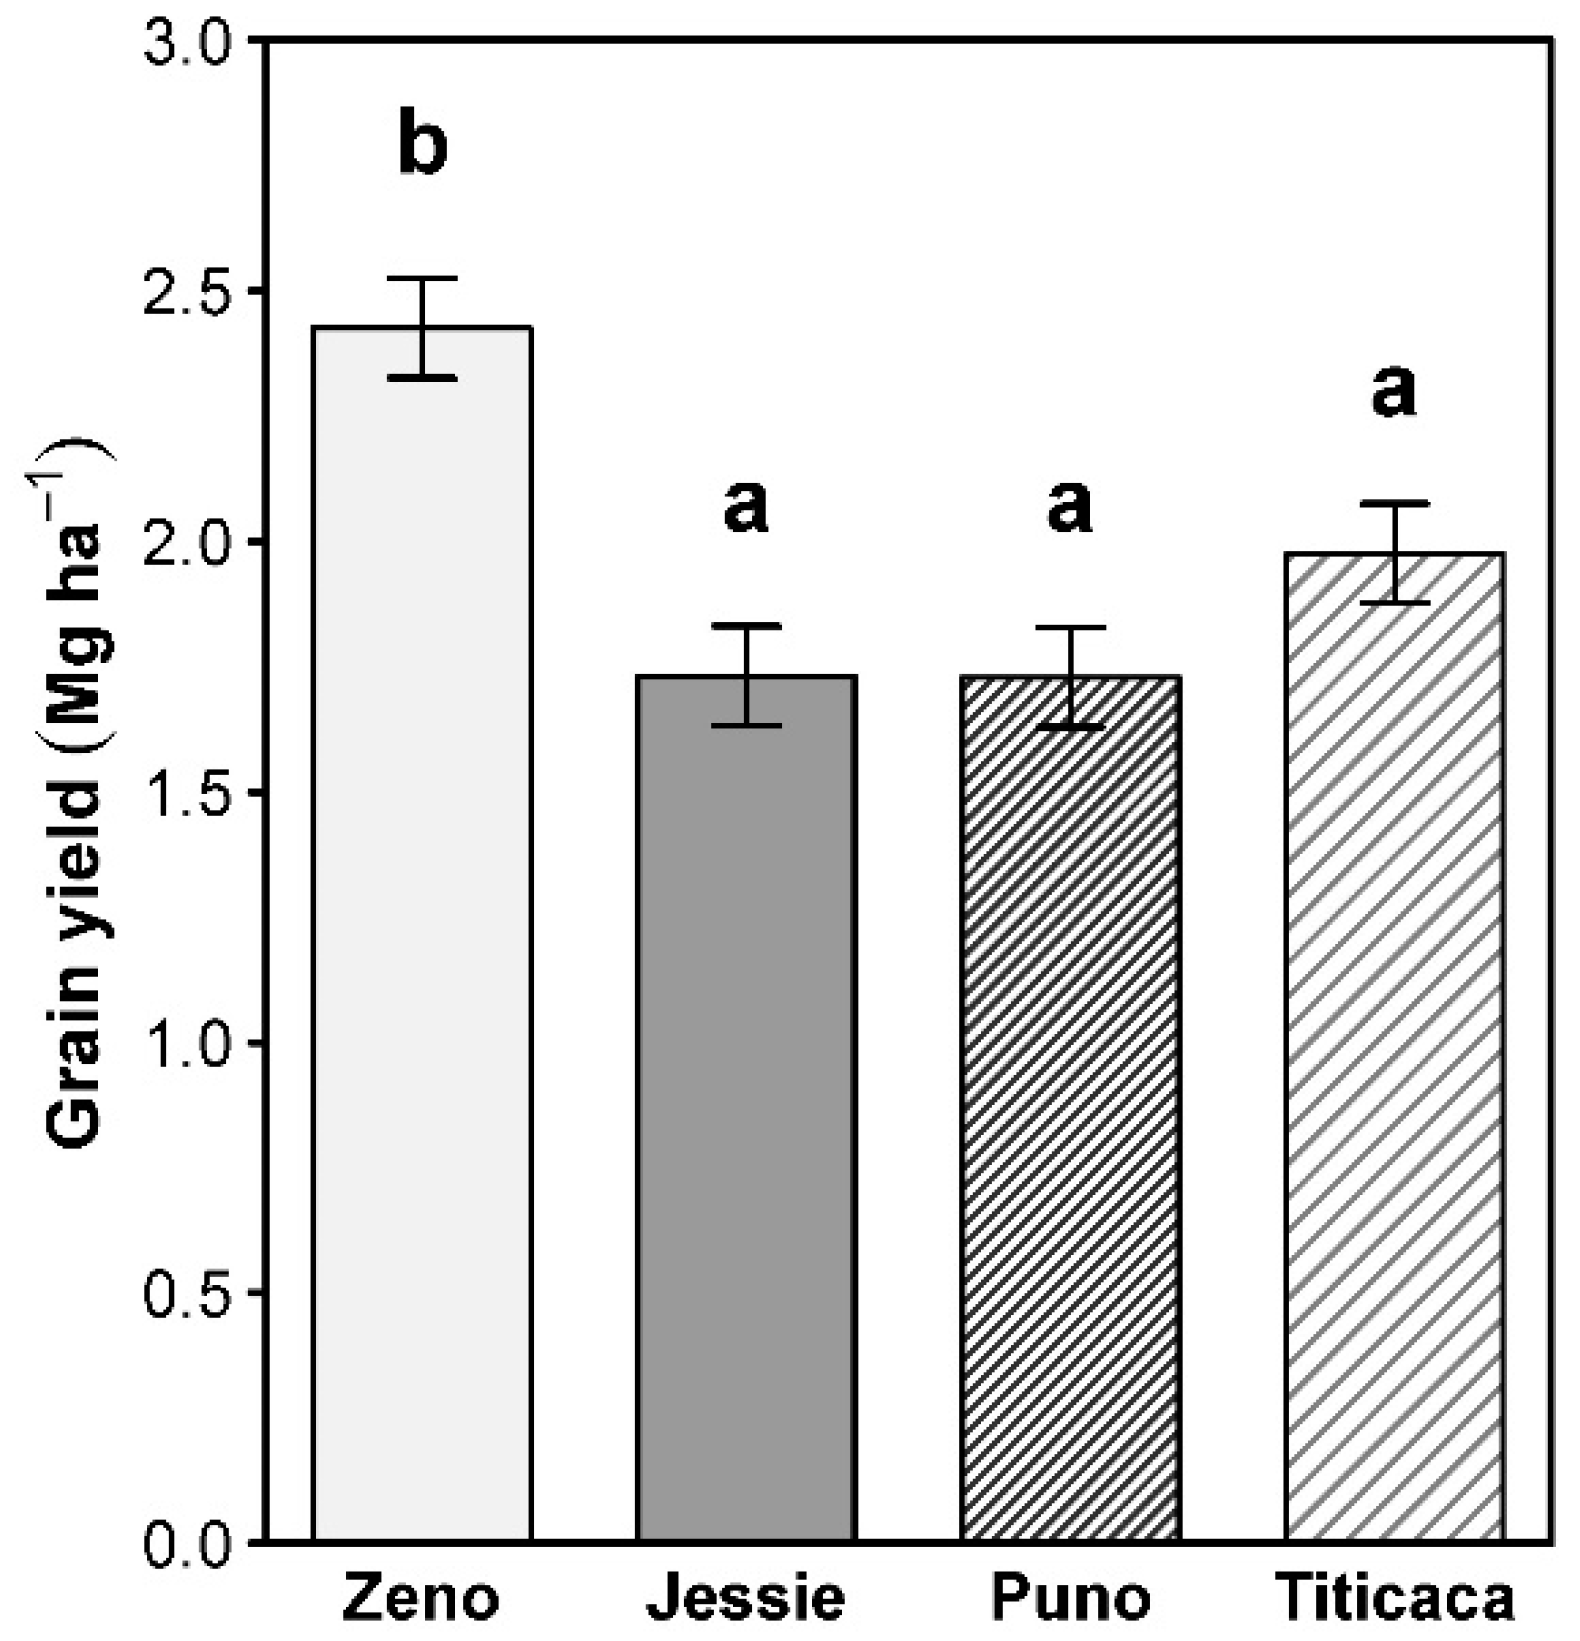
Averaged over 2015 and 2016, cv. Zeno showed a significantly higher grain yield (2.43 Mg ha−1) compared to the other tested cultivars (Figure 2). In comparison to cv. Zeno, registered grain yields for the cultivars cv. Jessie and cv. Puno, which showed very similar two-year averages around 1.73 Mg ha−1, and also for cv. Titicaca (1.98 Mg ha−1) were considerably reduced by 29% and 19%, respectively. The TKWs differed significantly between cultivars and years (Figure 3). Regarding both years, TKW across the four cultivars ranged between 1.2 g (cv. Puno) and 3.3 g (cv. Zeno), with significantly higher values in 2016 (+46%) for all investigated cultivars. With an increase in TKW around 66% in 2016 (2.0 g) compared to 2015 (1.2 g) cv. Puno varied the most between years. In contrast, cv. Zeno showed the lowest increment (+27%) of the four cultivars from 2.6 g (2015) to 3.3 g (2016). Generally, cv. Zeno reached a significantly higher TKW than cv. Puno, cv. Jessie and cv. Titicaca during both years with TKWs being 63% (2015) and 38% (2016) higher compared to the mean of the other three cultivars. On the other side cv. Puno showed the lowest TKW in both years, while the values for cv. Jessie and cv. Titicaca were between the other two with significant differences between each other only in 2015.
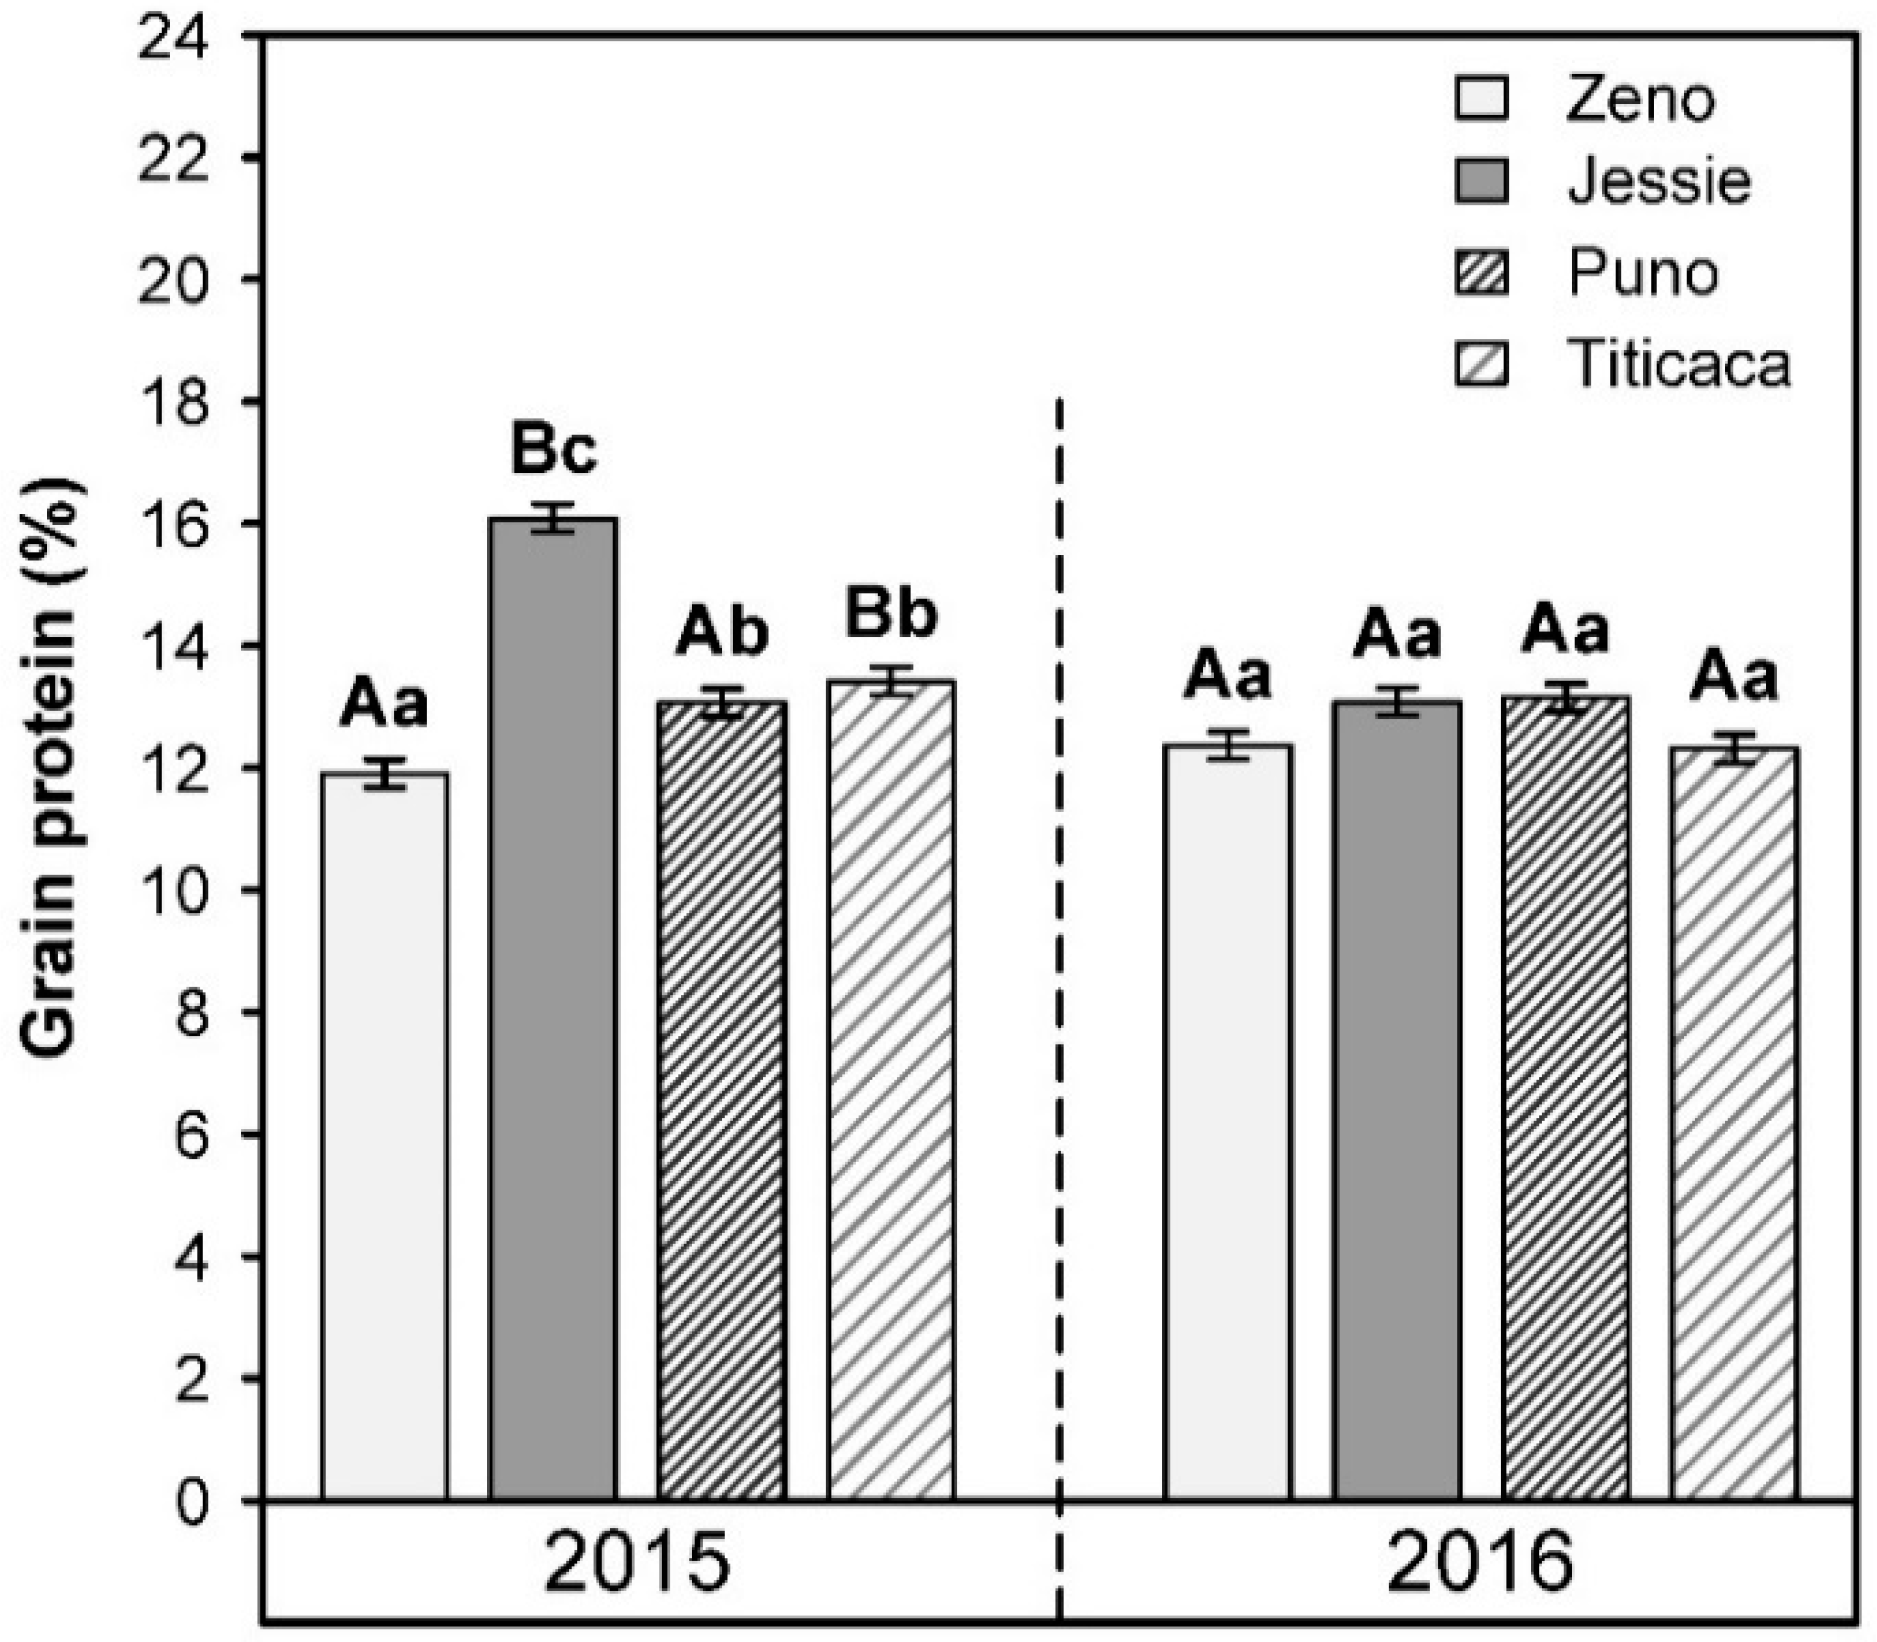
Regarding grain protein concentrations, the four cultivars showed significant differences within and between years, however, within year differences occurred only in 2015 (Figure 4). In 2015, grain protein contents varied significantly between 11.9 (cv. Zeno) and 16.1% (cv. Jessie), whereas values in 2016 were nearly at the same level (12.3–13.1%).
Comparing the two growing seasons, variability of grain protein contents depended highly on cultivar. Compared to 2015, values for cv. Jessie and cv. Titicaca in 2016 were significantly reduced by 19% (from 16.1 to 13.1%) and 8% (from 13.4 to 12.3%), respectively. Whereas, the other cultivars showed stable protein contents around 12.0 (cv. Zeno) and 13.0% (cv. Puno) in both years.
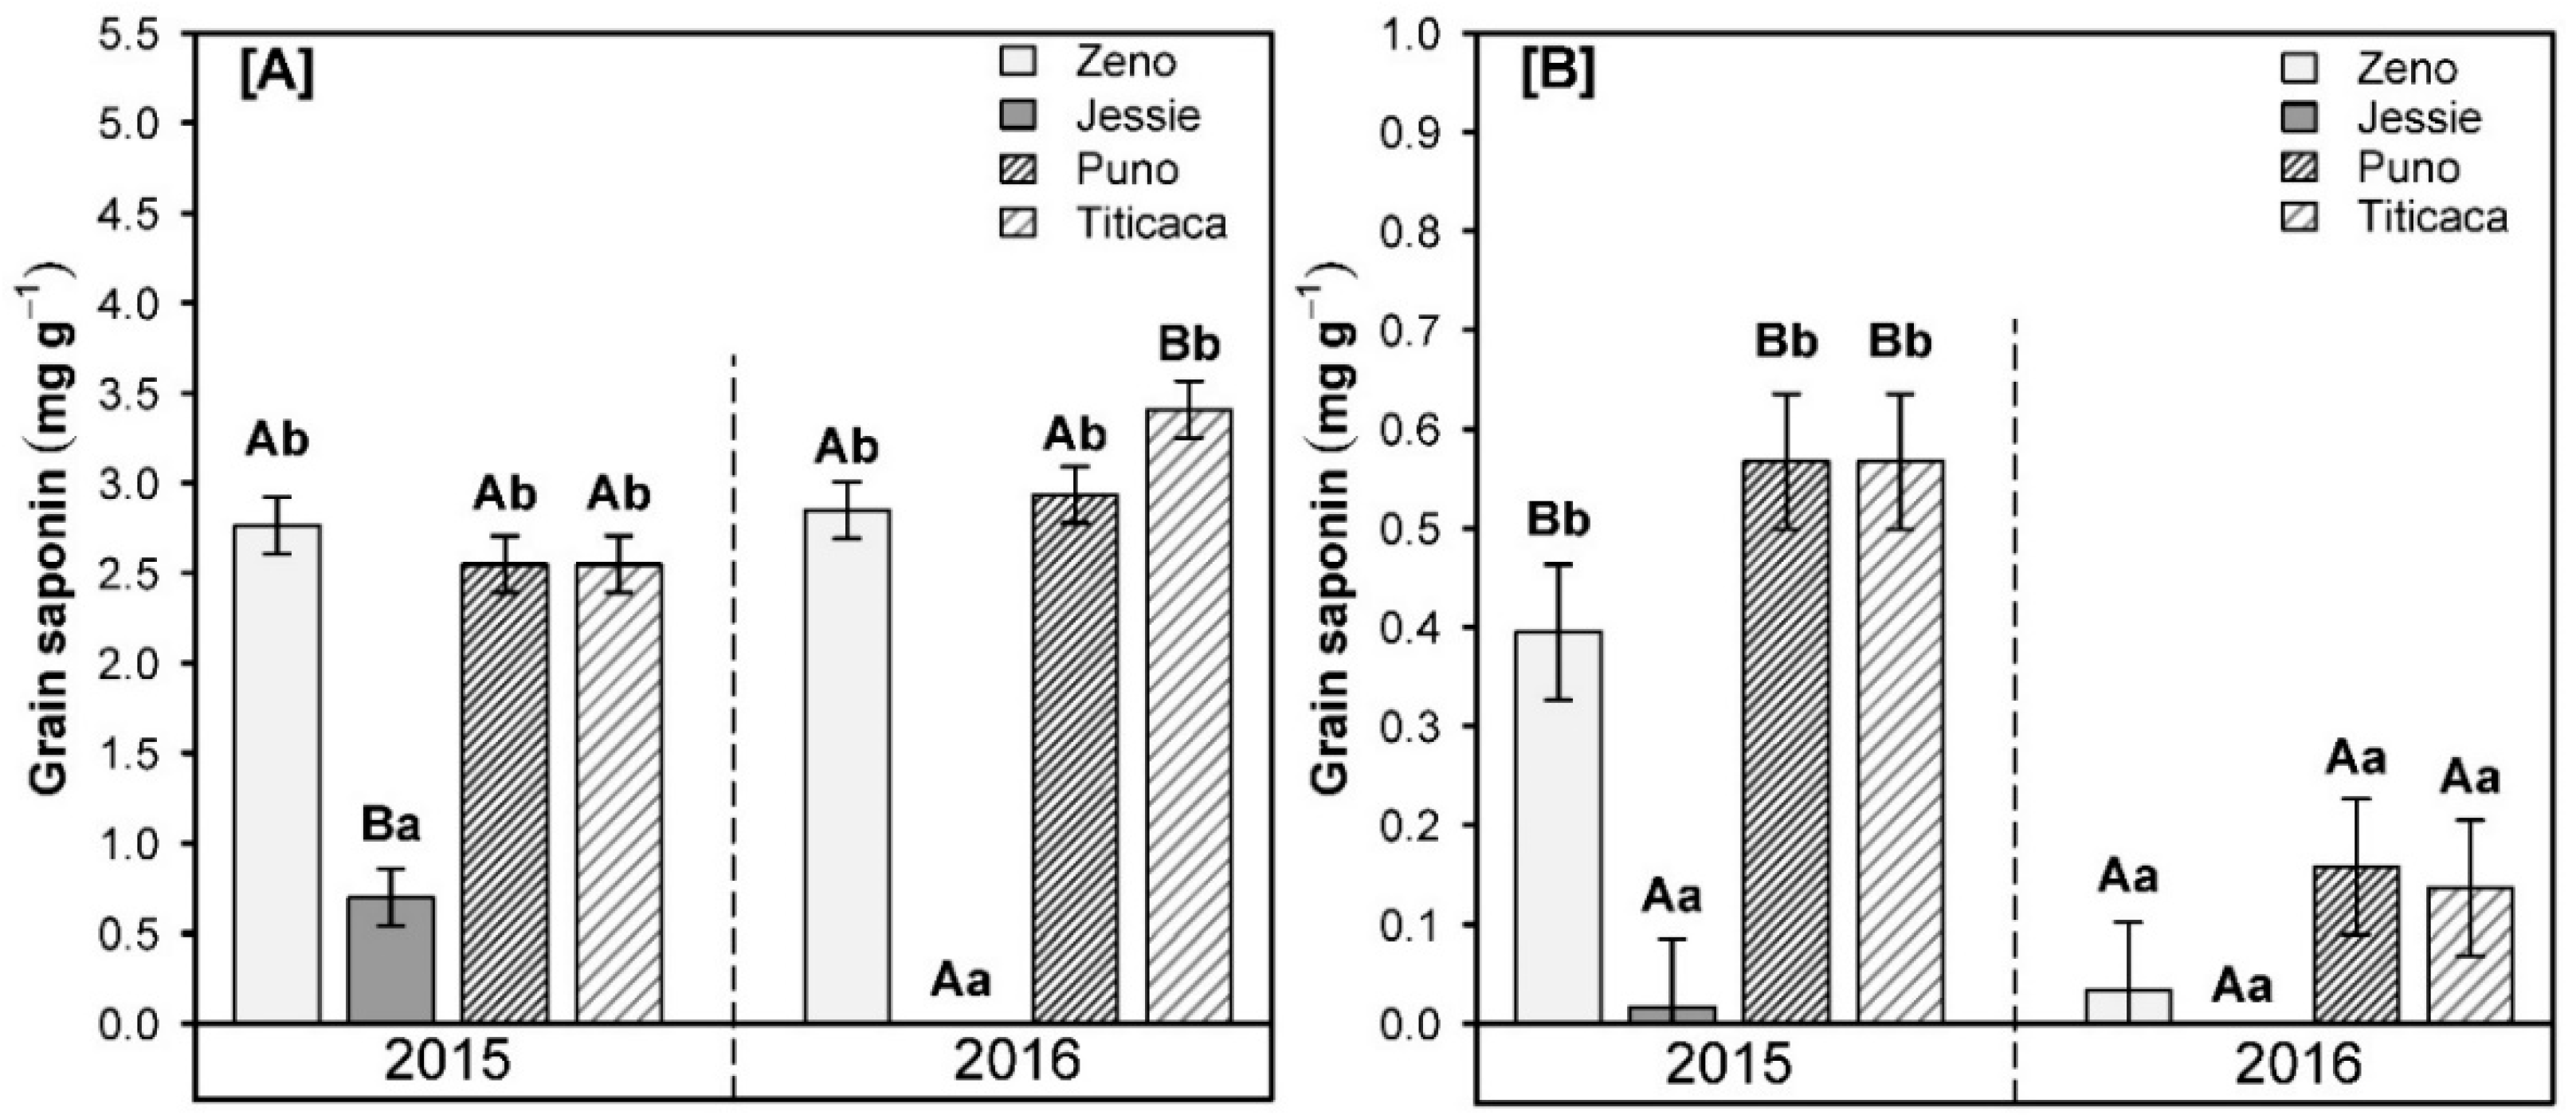
The significantly lowest saponin content in both growing seasons (0.7 mg g−1 in 2015 and 0.0 mg g−1 in 2016 was measured, as expected, for the sweet cultivar cv. Jessie. The other three tested cultivars produced considerable amounts of the bitter seed constituent (Figure 5A). Within year, the bitter cultivars cv. Zeno, cv. Puno and cv. Titicaca did not differ significantly in grain saponin content.
On average, the mean value of these three cultivars was 2.6 (2015) and 3.1 mg g−1 (2016). Comparing the two growing seasons, the grain saponin contents for cv. Zeno and cv. Puno tended to be marginally higher in 2016, whereas values for cv. Titicaca increased significantly from 2.5 mg g−1 in 2015 to 3.4 mg g−1 (+36%) in 2016. In both years, polishing grains with a mechanical dehuller was sufficient for all cultivars tested to get well below the critical grain saponin limit of 1.0 mg g−1, without significant differences between cultivars (except cv. Jessie) (Figure 5B). However, despite the tendency of higher initial grain saponin contents in 2016, polishing generally led to significantly less saponin residues compared with 2015. On average, the amounts of grain saponin residues after polishing were reduced by 79% in 2016 compared to 2015 for the three bitter cultivars.

3.2. Quality Parameters

3.2.1. Amino Acids

The composition of essential and semi-essential amino acids showed significant differences among cultivars and experimental years (Table 4). Proteins of grains harvested in 2016 accumulated (tendentially) higher contents of total essential and semi-essential amino acids than corresponding grains in 2015 (Table 5 and Table 6). In comparison with 2015, the largest increase in total amounts of essential amino acids in 2016 were recorded for cv. Jessie (+26%) and cv. Zeno (+22%), whereas contents for cv. Puno (+7%) and cv. Titicaca (+2%) increased only slightly. Within years, total essential amino acids ranged from 20.4 (cv. Zeno) to 27.8 g 100 g−1 crude protein (cv. Puno) in 2015 and from 25.0 (cv. Zeno) to 30.0 g 100 g−1 crude protein (cv. Jessie) in 2016. Quantitatively, the main constituents of essential amino acids for all tested cultivars were leucine, lysine and valine. Mean values across cultivars were 4.5 (leucine), 3.5 (lysine) and 4.4 g 100 g−1 crude protein (valine) in 2015, and 5.0 (leucine), 4.5 (lysine) and 4.7 g 100 g−1 crude protein (valine) in 2016. In comparison to 2015, increase in protein lysine concentrations, 30% across cultivars, appeared to be one of the main reasons for higher total amounts of proteogenic essential amino acids in 2016. By contrast, minor constituents of essential amino acid composition across cultivars with low variability for the two years were tryptophan, methionine and histidine showing cultivar mean values between 0.9 (2015) and 1.0 g 100 g−1 crude protein (2016), 1.4 (2015) and 1.7 g 100 g−1 crude protein (2016), and 1.7 (2015) and 2.2 g 100 g−1 crude protein (2016), respectively.
Comparing total semi-essential amino acids in 2016 to 2015, a significant increase was observed for cv. Zeno (+31%), cv. Jessie (+22%) and cv. Puno (+18.3%), while contents for cv. Titicaca (+5%) increased only slightly (Table 6). Within year, the staggering in total amounts of semi-essential amino acids for the tested cultivars was similar to essential amino acids. In 2015, semi-essential amino acids ranged from 11.6 (cv. Zeno) to 16.7 g 100 g−1 crude protein (cv. Puno) and from 15.2 (cv. Zeno) and 19.7 g 100 g−1 crude protein (cv. Puno) in 2016 (Table 6). The larger amounts of semi-essential amino acids in 2016 were mainly attributed to the increased synthesis of arginine across all tested cultivars.
Contrary to the results of (semi-)essential amino acids, the non-essential part of amino acid composition, contained in crude protein, did not differ significantly between experimental years. On average, total amounts varied significantly among cultivars between 17.6 (cv. Zeno) and 26.5 g 100 g−1 crude protein (cv. Puno) (Table 7). For all tested cultivars, main constituents of non-essential amino acid composition were glutamic acid and aspartic acid, ranging from 6.9 (cv. Zeno) to 11.8 g 100 g−1 crude protein (cv. Puno) and from 5.2 (cv. Zeno) to 7.1 g 100 g−1 crude protein (cv. Puno), respectively. The minor constituents’ serine and alanine showed similar averages across cultivars with around 3.3 g 100 g−1 crude protein.

3.2.2. Crude Fat and Fatty Acids

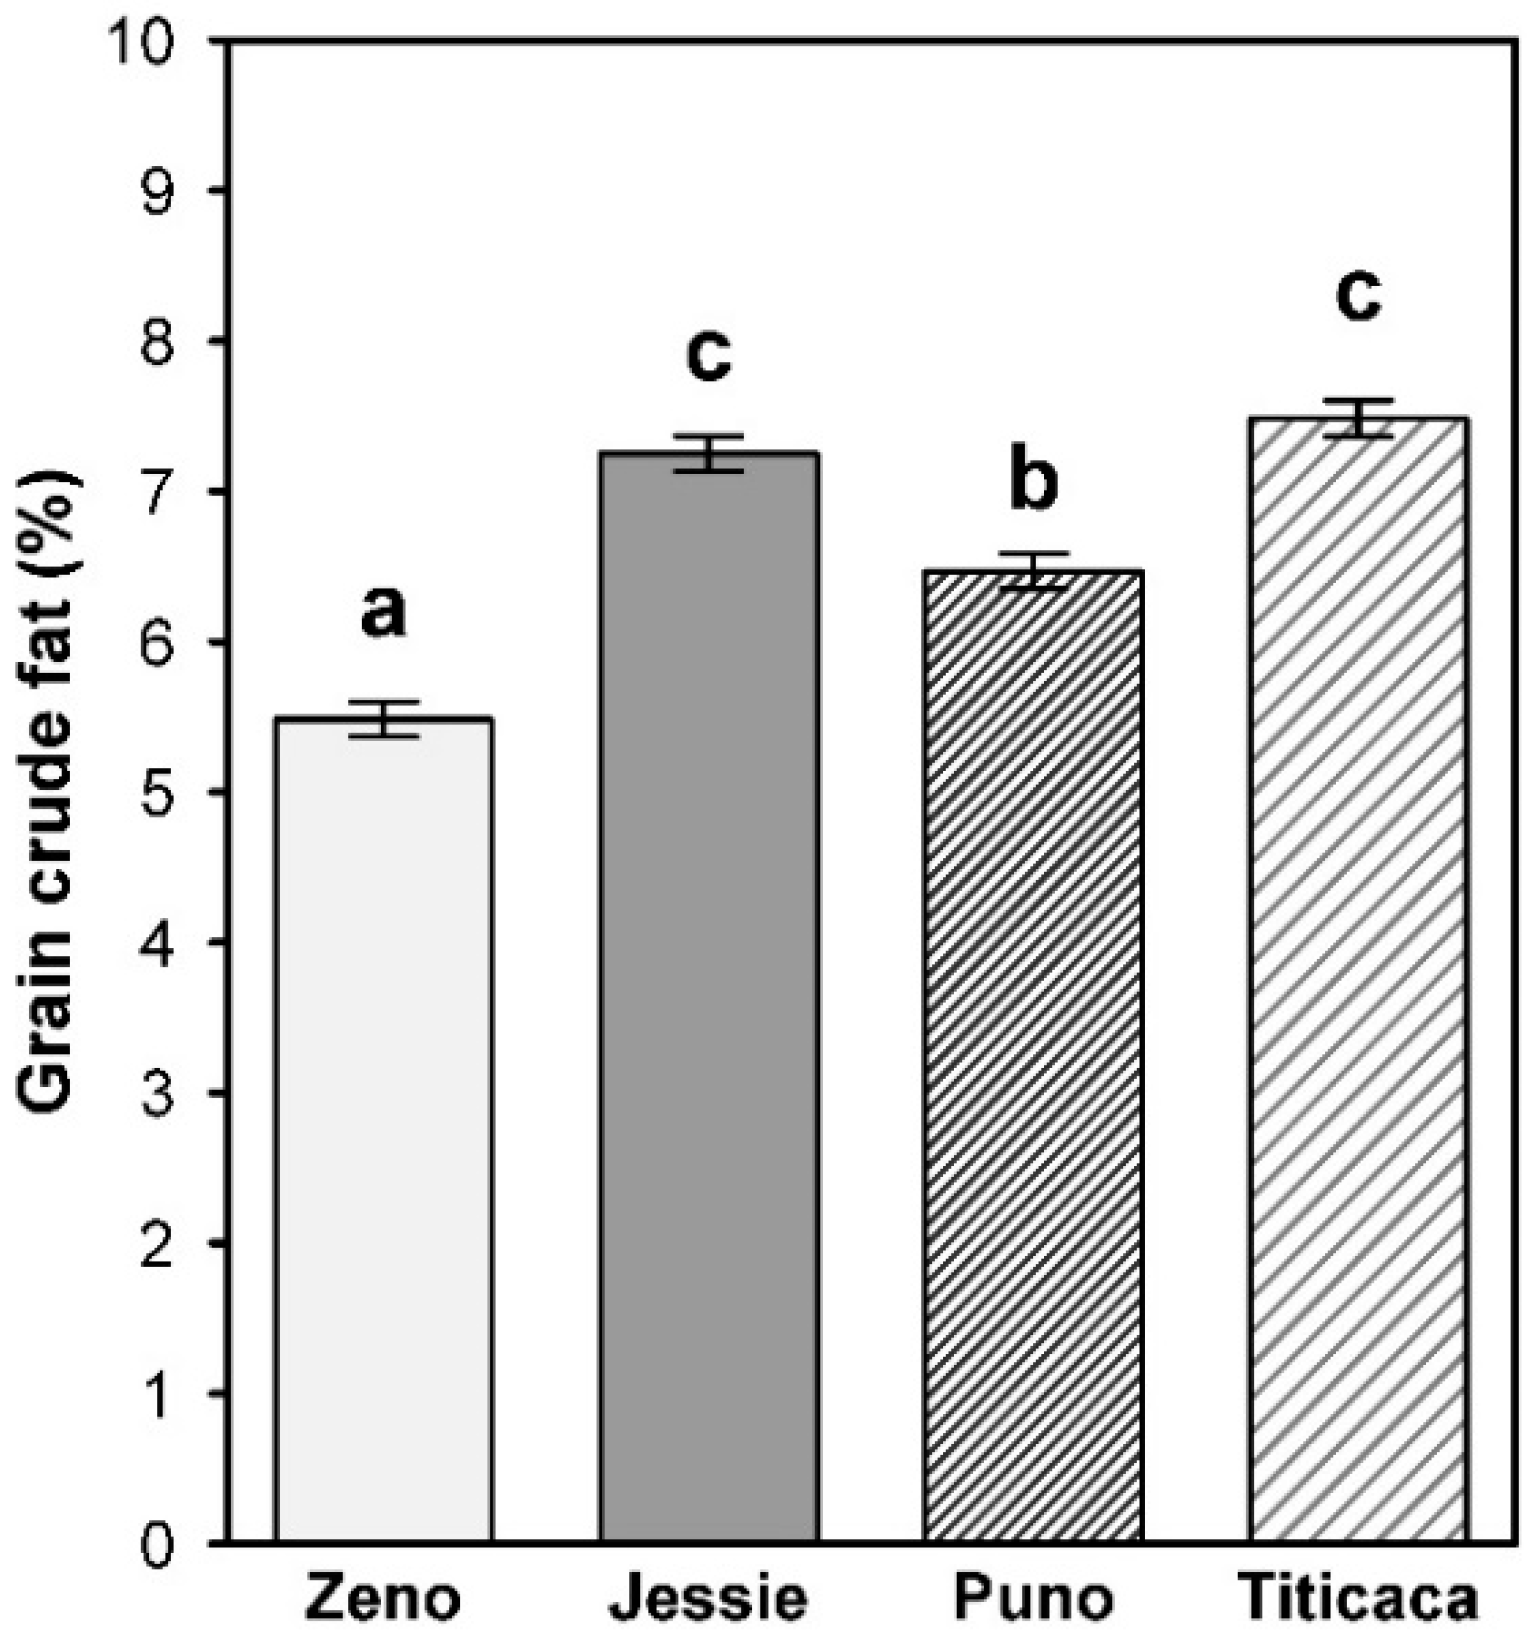
Over both growing seasons, cv. Titicaca (7.5%) and cv. Jessie (7.3%) showed the highest concentrations of grain crude fat (Figure 6). In comparison to these similar fat contents, recorded two-year averages for cv. Zeno (5.5%) and cv. Puno (6.5%) were significantly reduced around 26% and 12%, respectively. Analyses of the grain crude fat composition resulted neither in significant differences between experimental years, nor between tested cultivars. Across cultivars, the largest proportion (60%) of fatty acids contained in crude fat was represented by linoleic acid, which is a polyunsaturated ω-6 fatty acid (Table 8). The mean content of linoleic acid across cultivars was 40 g 100 g−1 crude fat. Furthermore, considerable amounts of oleic acid, palmitic acid and α-linolenic acid were found, with cultivar mean values around 14.3, 7.7 and 4.4 g 100 g−1 crude fat, respectively.

4. Discussion

The quinoa cultivars selected for this study reached maturity and did not differ markedly regarding growth period and timing of harvest. Therefore, the expected insensitivity of European quinoa cultivars against photoperiod can be confirmed [14] and consequently the general suitability for cultivation in southwestern Germany.
Averaged over both growing seasons, cv. Zeno showed the highest yield potential (2.43 Mg ha−1) in this study. The other cultivars tested produced similar, significantly less grain yields, varying between 1.73 and 1.98 Mg ha−1. In comparison to other studies, these grain yields can be regarded as medium. Lesjak and Calderini reported considerably higher grain yields between 2.93 and 6.0 Mg ha−1 evaluating the influence of increased night temperatures for two of the topmost sown quinoa cultivars in southern Chile. In contrast to our field trials, the plants were fertilized with 200 kg N ha−1 and had non-limiting water availability (regularly watering) [31], which could be a reason for the yield gap. Another study conducted at the northern part of India investigated the genetic variability of 27 lines originating from different parts of the Andean region and South America. Grain yields varied widely between 0.47 and 6.01 Mg ha−1 [47]. Our values for yield are comparable to yields registered during an open field experiment comparing 16 quinoa cultivars in Columbia ranging between 1.7 and 2.7 Mg ha−1 [48]. A similar range from 1.44 to 2.85 Mg ha−1 was recorded for 9 cultivars originating from the Bolivian Altiplano and cultivated under drought conditions at two different agro-ecological regions of Argentina [29]. De Santis et al. tested 24 South American quinoa lines under field conditions in southern Italy, including one commercial cultivar (Regalona Baer). Grain yields were also in agreement with our results showing values from 0.11 to 3.01 Mg ha−1 [49]. In contrast to our grain yields for cv. Titicaca (1.98 Mg ha−1), Pulvento et al. reported higher average yields (+25%) around 2.5 Mg ha−1 using the same cultivar during a bi-annual field trial on quinoa drought stress in southern Italy [30]. Two other studies using Puno for assessing potential yield of quinoa under rainfed conditions in southern Europe, reported grain yields of 1.72 Mg ha−1 [50] and 1.9 Mg ha−1 [51], which are nearly in line with our findings (1.73 Mg ha−1). According to Stikic et al. a medium yield level is attributed to low precipitation and high temperatures during the drought sensitive phase of quinoa (from flowering to seed filling) in July [50]. During the two experimental years, especially in 2015, precipitation was considerably reduced compared with the long-term average (Figure 1). Therefore, this might be a reason for not reaching the attainable yield. Geerts et al. reported that the economic yield quality (referring to seed size and TKW) is most sensitive to drought stress during flowering and milk grain stage [52]. On the other hand, well-planned deficit irrigation strategies (vegetative phase) can be used to inure quinoa for not suffering too much during these sensitive developmental stages and therefore to stabilize or even enhance yields [52].
With regard to TKW, the importance of adequate water availability for the generative phase of quinoa was also illustrated in our field studies, representing two years with very different distribution of precipitation. During the above-mentioned sensitive phases in July, the precipitation in 2015 was reduced by 55% compared to 2016, resulting in significantly lower TKWs for all cultivars. In general, the sensitivity against drought stress, but also the TKW itself depended on genotype (Figure 3). Values ranged from 1.2 g (cv. Puno) to 2.6 g (cv. Zeno) and from 2.0 g (cv. Puno) to 3.3 g (cv. Zeno) in 2015 and 2016, respectively, indicating a degree of variability among cultivars between 26% (cv. Zeno) and 66% (cv. Puno) for the two years. The genetic diversity of quinoa for TKW and consequently for grain size, an important factor regarding marketability of the raw product, was also reported in former literature [47,49]. Contrary to results of Curti et al., our cultivars showed no negative correlation between grain yield or its main determinant grain number and TKW [53]. In general, the TKWs of our cultivars agreed with ranges reported for studies in South Asia (1.4–3.7 g; [47]) or southern Europe (1.8–3.6 g; [51]), but differed in comparison with results from the Andean region (3.0–4.7 g; [54]).
Regarding the amounts of saponin contained in seeds, our cultivar comparison showed the significantly lowest concentrations in grains of cv. Jessie (sweet cultivar). At both growing seasons the values were well below the critical limit of 1.0 mg g−1 [6,39]. Since saponins, due to their interference with quinoa’s palatability and digestibility, have to be removed before consumption [55], this seems to be a favorable property of cv. Jessie compared to the other cultivars tested (2.5–3.4 mg g−1, Figure 5A). On the other hand, sweet cultivars often show low pest-resistance [55]. Indeed, saponins were reported to exert a strong insecticidal or protective activity against a broad range of insects, herbivores (e.g., birds) and even microbial infections [55,56,57]. The formation of saponins contained in quinoa seeds is promoted by the availability of water during the growth cycle, therefore deficit irrigation can be used as sustainable practice to reduce saponin levels in quinoa seeds [25,30,58,59]. This agrees with our results especially for cv. Titicaca, showing significant increases (+36%) in 2016 compared with 2015 (dry year), but also for cv. Puno and cv. Zeno with slightly higher saponin contents in 2016. In general, the saponin levels of our bitter cultivars can be regarded as low in comparison to other studies reporting ranges from 4.8 to 11.4 mg g−1 [30,59]. These discrepancies are probably attributed to our method of determination, which is only an estimate of total saponins [39,60]. However, the average losses in saponin content around 80% (2015) and 96% (2016) (Figure 5B) through dehulling of seeds are consistent with previous literature [60]. Therefore, abrasive processing turned out to be a suitable method for saponin removal, due to the greatest abundance of saponins in the pericarp of seeds [61]. Differences between years in the amounts of saponin residues after dehulling might occur due to a modification in the composition of the three main aglycones (oleanolic acid, phytolaccagenic acid, hederagenin), as a consequence of abiotic stress (e.g., drought) [59,62].
The nutritional properties, especially the high protein contents or rather the well-balanced composition of proteogenic amino acids, are two of the most promising features of quinoa [63,64]. Depending on genotype, our results for protein content indicate the importance of environmental conditions modulating the protein accumulation. While cv. Jessie (16.1% in 2015; 13.1% in 2016) and cv. Titicaca (13.4% in 2015; 12.3% in 2016) showed significant differences across years, protein contents remained stable for cv. Zeno (approx. 12%) and cv. Puno (approx. 13%) (Figure 4). Similarly to our results for cv. Jessie and cv. Titicaca, Reguera et al. found changes in the protein content of three quinoa cultivars (Regalona, Salcedo, Titicaca) grown in three different agro-ecological zones (Peru, Chile, Spain), reporting a range from 14.8 to 17.5% [28]. Another study conducted in two different environments of Argentina showed changes in grain protein contents of ten quinoa cultivars ranging between 9.2 and 15.4% [29]. On the other side, two cultivars (Regalona and Villarica) tested under contrasting environmental conditions in Chile did not vary in protein contents (18.2 to 19.7%), wherefore it was assumed that these cultivars have a great adaptability against differing agro-climatic conditions [65]. In comparison to other studies, the seed protein contents of our cultivars were similar to those reported by Miranda et al. (11.3–16.1%; [66]) or Nowak et al. (9.1–15.7%; [3]). Higher values were achieved by Barghava et al. (12.5–21.0%; [47]).
Even more important than protein content is the associated nutritional protein quality, determined by the proportion of essential amino acids [64]. According to the World Health Organization (WHO) there are nine amino acids (phenylalanine, isoleucine, leucine, lysine, methionine, threonine, tryptophan, valine, histidine) being strictly essential for adult humans, whereas semi-essential amino acids can become indispensable only under specific physiological conditions (e.g., cysteine, tyrosine, glycine, arginine, proline) [67].
Our analysis showed considerable amounts of all essential amino acids to be synthesized in quinoa grain proteins of the four tested cultivars. In both experimental years, main constituents of essential amino acid composition were lysine, leucine and valine. This is in accordance with previous literature and illustrates the high protein quality [3,68]. However, we found remarkable variations across cultivars and years in the composition of the essential amino acid profile (Table 5). Therefore, significant differences between cultivars and years (except cv. Puno and cv. Titicaca) occurred for total amounts ranging from 20.4 (cv. Zeno) to 27.8 g 100 g−1 crude protein (cv. Puno) and from 25.0 (cv. Zeno) to 30.0 g 100 g−1 crude protein (cv. Jessie) in 2015 and 2016, respectively. Thus, the genetic characteristic of quinoa cultivars and the corresponding environmental conditions can decisively influence the amino acid profile [32,54]. Across 10 quinoa cultivars and two contrasting environments comparable ranges for total essential amino acids (18.1–37.5 g 100 g−1 crude protein) were reported during field studies in Argentina [29]. Contrarily, an average content for total essential amino acids of 34.1 with a maximum of 35.9 g 100 g−1 crude protein was reported for 6 quinoa cultivars tested across three different locations in Chile [54]. The importance of adequate environmental conditions can be highlighted with results from Serbia showing total essential amino acid contents of 38.7 g 100 g−1 crude protein for the cultivar Puno [50]. Compared to our results the composition differed mainly in valine, leucine and phenylalanine. The variation in amino acid profile from growing one cultivar in different environments are assumed to play a role in stress tolerance mechanisms because of their role as osmolytes [69]. Quinoa could induce the production of free amino acids in response to abiotic stress (e.g., drought, salinity) and therefore reduce synthesizing or even start degradation of proteogenic amino acids [32]. The possible modulation of free amino acid content in quinoa seeds was also demonstrated during field trials in Chile, Spain and Peru [28]. Thus, abiotic stress in 2015 could be a plausible reason for lower (semi-)essential amino acid contents compared with 2016.
As mentioned above, also the total semi-essential amino acid contents in quinoa grains varied significantly over years, with higher values in 2016. Furthermore, we found significant differences between the cultivars tested (Table 6). The ranges of total amounts from 11.6 (cv. Zeno) to 16.7 (cv. Puno) in 2015 and from 15.2 (cv. Zeno) to 19.7 g 100 g−1 crude protein (cv. Puno) in 2016 were comparable to other studies [29,70]. Contrarily to (semi-)essential amino acid contents, the non-essential part of amino acid profile remained stable over years and differed only between cultivars (Table 4). In accordance with literature [50,54], the most abundant were glutamic acid and aspartic acid showing cultivar mean values of 8.9 and 6.1 g 100 g−1 crude protein (Table 7).
Beside protein content and amino acid profile, other health-promoting properties of quinoa grains are the comparatively high fat contents or rather the related favorable fatty acid profile [6,63]. This was also demonstrated in our study. Contrary to the AA-Profiles the composition of fatty acids did not vary significantly over years (Table 4). The grain crude fat contents agreed well with the ranges of 6.0 to 6.7% [71] and 4.0 to 7.6% [3] previously reported in literature. Considerably less grain crude fat contents were detected by Miranda et al. (2.9–5.6%; [65]) and Pulvento et al. (5.2–5.8%; [30]). The fatty acid profile of our cultivars consisted mainly of the poly-and mono unsaturated fatty acids linoleic acid and oleic acid, ranging from 33.1 (cv. Titicaca) to 45.7 (cv. Jessie) and from 13.1 (cv. Titicaca) to 16.6 g 100 g−1 crude fat (cv. Jessie), respectively. Across cultivars the essential linoleic acid [55], accounted for 60% of the complete fatty acid content, detected in our analysis. These results agree with fatty acid profiles reported for quinoa grains cultivated in the south-eastern part of Canada [71] and Chile [54]. Due to the high contents of (poly-)unsaturated fatty acids in our cultivars tested, which are attributed to many health benefits [64], the fatty acid profiles of our tested cultivars can be considered as being of high nutritional quality.

5. Conclusions

This study showed that an economic production of quinoa, combining competitive yields with a high grain quality, is possible under the environmental conditions in southwestern Germany. However, over the two growing periods, the four cultivars tested showed differences in the sensitivity against different environmental conditions regarding both, yield parameters (TKW, protein content) and quality traits (essential and semi-essential amino acids). These changes were most probably attributed to the lower water availability in 2015 compared to 2016. Contrarily, the fatty acid profiles were not influenced by differing growing conditions and remained stable over the experimental years. The cultivar cv. Zeno seems to be the most suitable under the current climatic conditions, showing the greatest yield potential with the lowest variability in grain size, which was generally most favorable for this cultivar. On the other hand, cv. Jessie and cv. Puno performed best regarding the protein contents or the synthesis of (semi-) essential amino acids. Consequently, the decision for growing a specific quinoa cultivar has to be aligned with the production aim. Furthermore, the variability in yield- and quality-traits shows the possibility for further improvement or rather to stabilize yield and grain quality of European quinoa cultivars on a high level, using suitable agronomic practices. The most promising could be an additional irrigation in particularly sensitive stages of development (flowering and milk grain stage), but also fertilization strategies or differing sowing dates should be considered. Therefore, further studies are needed to investigate the physiological responses of European quinoa cultivars influenced by the dynamic environmental conditions of field cultivation.

Author Contributions

Conceptualization, A.P., S.M. and S.G.-H.; Methodology, B.M., P.M.N. and A.P.; Formal Analysis, A.P.; Investigation, A.P., P.M.N.; Resources, B.M.; Data Curation, A.P.; Writing-Original Draft Preparation, A.P.; Writing-Review & Editing, S.G.-H., S.M., P.M.N.; Visualization, A.P.; Supervision, S.G.-H., S.M.; Project Administration, S.G.-H.; Funding Acquisition, S.G.-H. Please turn to the CRediT taxonomy for the term explanation.

Funding

The German Federal Ministry for Economic Affairs and Energy is sincerely appreciated for funding this research within the Central Innovation Program for SMEs (16KN050521).

Acknowledgments

The authors would like to thank the technical staff of the experimental station “Ihinger Hof” for the agronomic management of the field trials and the staff of Core Facility Hohenheim Module 3 for the help with the amino acid analytics.

Conflicts of Interest

The authors declare no conflict of interest. The funders had no role in the design of the study; in the collection, analyses, or interpretation of data; in the writing of the manuscript, and in the decision to publish the results.

References

  1. Ruiz, K.B.; Biondi, S.; Oses, R.; Acuña-Rodríguez, I.S.; Antognoni, F.; Martinez-Mosqueira, E.A.; Coulibaly, A.; Canahua-Murillo, A.; Pinto, M.; Zurita-Silva, A.; et al. Quinoa biodiversity and sustainability for food security under climate change. A review. Agron. Sustain. Dev. 2014, 34, 349–359. [Google Scholar] [CrossRef]
  2. Fuentes, F.F.; Bazile, D.; Bhargava, A.; Martínez, E.A. Implications of farmers’ seed exchanges for on-farm conservation of quinoa, as revealed by its genetic diversity in Chile. J. Agric. Sci. 2012, 150, 702–716. [Google Scholar] [CrossRef] [Green Version]
  3. Nowak, V.; Du, J.; Charrondière, R. Assessment of the nutritional composition of quinoa (Chenopodium quinoa Willd.). Food Chem. 2016, 193, 47–54. [Google Scholar] [CrossRef] [PubMed]
  4. Martínez, E.A.; Fuentes, F.F.; Bazile, D. History of Quinoa: Its Origin, Domestication, Diversification, and Cultivation with Particular Reference to the Chilean Context. In Quinoa: Improvement and Sustainable Production, 1st ed.; Murphy, K., Matanguihan, J., Eds.; John Wiley & Sons, Inc.: Hoboken, NJ, USA, 2015; pp. 19–24. ISBN 978-1-118-62805-8. [Google Scholar]
  5. Cusack, D.F. Quinua: Grain of the Incas. Ecologist 1984, 14, 21–31. [Google Scholar]
  6. Vega-Gálvez, A.; Miranda, M.; Vergara, J.; Uribe, E.; Puente, L.; Martínez, E.A. Nutrition facts and functional potential of quinoa (Chenopodium quinoa Willd.), an ancient Andean grain: A review. J. Sci. Food Agric. 2010, 90, 2541–2547. [Google Scholar] [CrossRef] [PubMed]
  7. Abugoch James, L.E. Quinoa (Chenopodium quinoa Willd.): Composition, chemistry, nutritional, and functional properties. Adv. Food Nutr. Res. 2009, 58, 1–31. [Google Scholar] [CrossRef] [PubMed]
  8. Pasko, P.; Barton, H.; Zagrodzki, P.; Gorinstein, S.; Folta, M.; Zachwieja, Z. Anthocyanins, total polyphenols and antioxidant activity in amaranth and quinoa seeds and sprouts during their growth. Food Chem. 2009, 115, 994–998. [Google Scholar] [CrossRef]
  9. Peñas, E.; Uberti, F.; di Lorenzo, C.; Ballabio, C.; Brandolini, A.; Restani, P. Biochemical and Immunochemical Evidences Supporting the Inclusion of Quinoa (Chenopodium quinoa Willd.) as a Gluten-free Ingredient. Plant Foods Hum. Nutr. 2014, 69, 297–303. [Google Scholar] [CrossRef] [PubMed]
  10. Bazile, D.; Jacobsen, S.E.; Verniau, A. The Global Expansion of Quinoa: Trends and Limits. Front. Plant Sci. 2016, 7, 1–6. [Google Scholar] [CrossRef] [PubMed] [Green Version]
  11. Perreault, T. Dispossession by Accumulation? Mining, Water and the Nature of Enclosure on the Bolivian Altiplano. Antipode 2013, 45, 1050–1069. [Google Scholar] [CrossRef]
  12. Jacobsen, S.E. The Situation for Quinoa and Its Production in Southern Bolivia: From Economic Success to Environmental Disaster. J. Agron. Crop Sci. 2011, 197, 390–399. [Google Scholar] [CrossRef]
  13. Biodiversity International 2007. Quinoa: A delicate balancing act. In Biodiversity International Annual Report; Biodiversity International: Rome, Italy, 2006; pp. 17–19. [Google Scholar]
  14. Jacobsen, S.E. The scope for adaptation of quinoa in Northern Latitudes of Europe. J. Agron. Crop Sci. 2017, 203, 603–613. [Google Scholar] [CrossRef]
  15. Jacobsen, S.E. The Worldwide Potential for Quinoa (Chenopodium quinoa Willd.). Food Rev. Int. 2003, 19, 167–177. [Google Scholar] [CrossRef]
  16. Jacobsen, S.E.; Mujica, A.; Jensen, C.R. The resistance of quinoa (Chenopodium quinoa Willd.) to adverse, abiotic factors. Food Rev. Int. 2003, 19, 99–109. [Google Scholar] [CrossRef]
  17. Bertero, H.D. Effects of photoperiod, temperature and radiation on the rate of leaf appearance in quinoa (Chenopodium quinoa Willd.) under field conditions. Ann. Bot. 2001, 87, 495–502. [Google Scholar] [CrossRef]
  18. Bendevis, M.A.; Sun, Y.; Rosenqvist, E.; Shabala, S.; Liu, F.; Jacobsen, S.E. Photoperiodic effects on short-pulse 14C assimilation and overall carbon and nitrogen allocation patterns in contrasting quinoa cultivars. Environ. Exp. Bot. 2014, 104, 9–15. [Google Scholar] [CrossRef]
  19. Christiansen, J.L.; Jacobsen, S.E.; Jørgensen, S.T. Photoperiodic effect on flowering and seed development in quinoa (Chenopodium quinoa Willd.). ACTA AGR. SCAND. B-S.P. 2010, 60, 539–544. [Google Scholar] [CrossRef]
  20. Bertero, H.D.; de la Vega, A.J.; Correa, G.; Jacobsen, S.E.; Mujica, A. Genotype and genotype-by-environment interaction effects for grain yield and grain size of quinoa (Chenopodium quinoa Willd.) as revealed by pattern analysis of multi-environmental trials. Field Crops Res. 2004, 89, 299–318. [Google Scholar] [CrossRef]
  21. Bertero, H.D.; King, R.W.; Hall, A.J. Photoperiod-sensitive development phases in quinoa (Chenopodium quinoa Willd.). Field Crops Res. 1999, 60, 231–243. [Google Scholar] [CrossRef]
  22. Jacobsen, S.E. Adaptation of quinoa (Chenopodium quinoa) to Northern European agriculture: Studies on developmental pattern. Euphytica 1997, 96, 41–48. [Google Scholar] [CrossRef]
  23. Jacobsen, S.E.; Stølen, O. Quinoa—Morphology and phenology and prospects for its production as a new crop in Europe. Europ. J. Agron. 1993, 2, 19–29. [Google Scholar] [CrossRef]
  24. Murphy, K.M.; Bazile, D.; Kellogg, J.; Rahmanian, M. Development of a worldwide consortium on evolutionary participatory breeding in Quinoa. Front. Plant Sci. 2016, 7, 1–7. [Google Scholar] [CrossRef] [PubMed] [Green Version]
  25. Ramakrishna, A.; Ravishankar, G.A. Influence of abiotic stress signals on secondary metabolites in plants. Plant Signal. Behav. 2011, 6, 1720–1731. [Google Scholar] [CrossRef] [PubMed] [Green Version]
  26. Wimalasekera, R. Role of seed quality in improving crop yields. In Crop production and Global Environmental Issues, 1st ed.; Hakeem, K.R., Ed.; Springer International Publishing: Basel, Switzerland, 2015; pp. 153–168. ISBN 978-3-319-23162-4. [Google Scholar]
  27. Bazile, D.; Pulvento, C.; Verniau, A.; Al-Nusari, M.S.; Ba, D.; Breidy, J.; Hassan, L.; Mohammed, M.I.; Mambetov, O.; Sepahvand, N.A.; et al. Worldwide Evaluations of Quinoa: Preliminary Results from Post International Year of Quinoa FAO Projects in Nine Countries. Front. Plant Sci. 2016, 7, 1–18. [Google Scholar] [CrossRef] [PubMed] [Green Version]
  28. Reguera, M.; Conesa, C.M.; Gil-Gomez, A.; Haros, C.M.; Pérez-Casas, M.A.; Briones-Labarca, V.; Bolaños, L.; Bonilla, I.; Álvarez, R.; Pinto, K.; et al. The impact of different agroecological conditions on the nutritional composition of quinoa seeds. PeerJ 2018, 6, 1–20. [Google Scholar] [CrossRef] [PubMed]
  29. Gonzalez, J.A.; Konishi, Y.; Bruno, M.; Valoy, M.; Prado, F.E. Interrelationships among seed yield, total protein and amino acid composition of ten quinoa (Chenopodium quinoa) cultivars from two different agroecological regions. J. Sci. Food Agric. 2012, 92, 1222–1229. [Google Scholar] [CrossRef] [PubMed]
  30. Pulvento, C.; Riccardi, M.; Lavini, A.; Lafelice, G.; Marconi, E.; d´Andria, R. Yield and Quality Characteristics of Quinoa Grown in Open Field Under Different Saline and Non-Saline Irrigation Regimes. J. Agron. Crop Sci. 2012, 198, 254–263. [Google Scholar] [CrossRef]
  31. Lesjak, J.; Calderini, D.F. Increased Night Temperature Negatively Affects Grain Yield, Biomass and Grain Number in Chilean Quinoa. Front. Plant Sci. 2017, 8, 1–11. [Google Scholar] [CrossRef] [PubMed]
  32. Aloisi, I.; Parrotta, L.; Ruiz, K.B.; Landi, C.; Bini, L.; Cai, G.; Biondi, S.; Del Duca, S. New insight into quinoa seed quality under salinity: Changes in proteomic and amino acid profiles, phenolic content, and antioxidant activity of protein extracts. Front. Plant Sci. 2016, 7, 1–21. [Google Scholar] [CrossRef] [PubMed]
  33. IUSS Working Group WRB. World Reference Base for Soil Resources 2006, First Update 2007. In World Soil Resources Reports No. 103; FAO: Rome, Italy, 2007. [Google Scholar]
  34. Driessen, P.; Deckers, J.; Spaargaren, O.; Nachtergaele, F. Lecture notes on the major soils of the world. In Word Soil Resources Reports No. 94; FAO: Rome, Italy, 2001. [Google Scholar]
  35. Gimplinger, D.M.; Dobos, G.; Schoenlechner, R.; Kaul, H.P. Yield and quality of grain amaranth (Amaranthus sp.) in Eastern Austria. Plant Soil Environ. 2007, 53, 105–112. [Google Scholar] [CrossRef]
  36. Bassler, R.; Hoffmann, G. Bestimmung von mineralischem, (Nitrat-) Stickstoff in Bodenprofilen, Nmin-Labormethode. In VDLUFA Methodenbuch Band I, 4th ed.; Deller, B., Ed.; VDLUFA-Verlag: Darmstadt, Germany, 1997; pp. A6.1.4.1.1–Ag.1.4.1.20. ISBN 978-3-941273-21-4. [Google Scholar]
  37. Dumas, A. Stickstoffbestimmung nach Dumas (N-determination according to Dumas). In Die Praxis des Organischen Chemikers, 41st ed.; Gattermann, L., Wieland, H., Eds.; De Gruyter: Berlin, Germany, 1962; pp. 45–51. [Google Scholar]
  38. AOAC. Official Methods of Analysis, 15th ed.; Association of Official Analytical Chemists, Inc.: Arlington, TX, USA, 1990; p. 70. ISBN 0-935584-42-0. [Google Scholar]
  39. Koziol, M.J. Afrosimetric Estimation of Threshold Saponin Concentration for Bitterness in Quinoa (Chenopodium quinoa Willd.). J. Sci. Food Agric. 1991, 54, 211–219. [Google Scholar] [CrossRef]
  40. European Commission Directive EC/152. laying down the methods of sampling and analysis for the official control of feed. Off. J. EU 2009, 54, 23–39. [Google Scholar]
  41. Metcalfe, L.D.; Schmitz, A.A.; Pelka, J.R. Rapid preparation of fatty acid esters from lipids for gas chromatographic analysis. Anal. Chem. 1966, 38, 514–515. [Google Scholar] [CrossRef]
  42. DGF. Fettsäuremethylester. In Einheitsmethoden zur Untersuchung von Fetten, Fettprodukten, Tensiden und verwandten Stoffen, 2nd ed.; Deutsche Gesellschaft für Fettwissenschaft e.V., Ed.; Wissenschaftliche Verlagsgesellschaft mbH: Stuttgart, Germany, 2018; sect. C-VI 11d/ 1998, 978-3-8047-3024-3. [Google Scholar]
  43. Thurnhofer, S.; Vetter, W. A Gas Chromatography/Electron Ionization−Mass Spectrometry−Selected Ion Monitoring Method for Determining the Fatty Acid Pattern in Food after Formation of Fatty Acid Methyl Esters. J. Agric. Food Chem. 2005, 53, 8896–8903. [Google Scholar] [CrossRef] [PubMed]
  44. Fontaine, J.; Schirmer, B.; Horr, J. Near-Infrared Reflectance Spectroscopy (NIRS) Enables the Fast and Accurate Prediction of Essential Amino Acid Contents. 2. Results for Wheat, Barley, Corn, Triticale, Wheat Bran/Middlings, Rice Bran, and Sorghum. J. Agric. Food Chem. 2002, 50, 3902–3911. [Google Scholar] [CrossRef] [PubMed]
  45. Pinheiro, J.; Bates, D.; DebRoy, S.; Sarkar, D.; Heisterkamp, S.; Van Willigen, B.; R Core Team. nlme: Linear and Nonlinear Mixed Effects Models. R Package Version 3. 1–137. 2018. Available online: http://CRAN.R-project.org/package=nlme (accessed on 3 August 2018).
  46. R Core Team. The R Project for Statistical Computing. 2018. Available online: https://www.R-project.org/ (accessed on 3 August 2018).
  47. Bhargava, A.; Shukala, S.; Ohri, D. Genetic variability and interrelationship among various morphological and quality traits in quinoa (Chenopodium quinoa Willd.). Field Crops Res. 2007, 101, 104–116. [Google Scholar] [CrossRef]
  48. Delgado, A.I.; Palacios, J.H.; Betancourt, C. Evaluation of 16 genotypes of sweet quinoa (Chenopodium quinoa Willd.) in the municipality of Iles, Nariño (Colombia). Agron. Colomb. 2009, 27, 159–167. [Google Scholar]
  49. De Santis, G.; D´Ambrosio, T.; Rinaldi, M.; Rasico, A. Heritabilities of morphological and quality traits and interrelationships with yield in quinoa (Chenopodium quinoa Willd.) genotypes in the Mediterranean environment. J. Cereal Sci. 2016, 70, 177–185. [Google Scholar] [CrossRef]
  50. Stikic, R.; Glamoclija, D.; Demin, M.; Vucelic-Radovic, B.; Jovanovic, Z.; Milojkovic-Opsenica, D.; Jacobsen, S.E.; Milovanovic, M. Agronomical and nutritional evaluation of quinoa seeds (Chenopodium quinoa Willd.) as an ingredient in bread formulations. J. Cereal Sci. 2012, 55, 132–138. [Google Scholar] [CrossRef]
  51. Pulvento, C.; Riccardi, M.; Lavini, A.; d´Andria, R.; Lafelice, G.; Marconi, E. Field Trial Evaluation of Two Chenopodium quinoa Genotypes Grown Under Rain-Fed Conditions in a Typical Mediterranean Environment in South Italy. J. Agron. Crop Sci. 2010, 196, 407–411. [Google Scholar] [CrossRef]
  52. Geerts, S.; Raes, D.; Garcia, M.; Vacher, J.; Mamani, R.; Mendoza, J.; Huanca, R.; Morales, B.; Miranda, R.; Cusicanqui, J.; et al. Introducing deficit irrigation to stabilize yields of quinoa (Chenopodium quinoa Willd.). Europ. J. Agron. 2008, 28, 427–436. [Google Scholar] [CrossRef]
  53. Curti, R.N.; De la Vega, A.J.; Andrade, A.J.; Bramardi, S.J.; Bertero, H.D. Multi-environmental evaluation for grain yield and its physiological determinants of quinoa genotypes across Northwest Argentina. Field Crops Res. 2014, 166, 46–57. [Google Scholar] [CrossRef]
  54. Miranda, M.; Vega-Gálvez, A.; Martinez, E.; López, J.; Rodríguez, M.J.; Henríquez, K.; Fuentes, F. Genetic diversity and comparison of physicochemical and nutritional characteristics of six quinoa (Chenopodium quinoa Willd.) genotypes cultivated in Chile. Food Sci. Tech. 2012, 32, 835–843. [Google Scholar] [CrossRef]
  55. Graf, B.L.; Rojas-Silva, P.; Rojo, L.E.; Delatorre-Herrera, J.; Baldeón, M.E.; Raskin, I. Innovations in health value and functional food development of quinoa (Chenopodium quinoa Willd.). Compr. Rev. Food Sci. Food Saf. 2015, 14, 431–445. [Google Scholar] [CrossRef] [PubMed]
  56. De Geyter, E.; Lambert, E.; Geelen, D.; Smagghe, G. Novel advances with plant saponins as natural insecticides to control pest insects. Pest Technol. 2007, 1, 96–105. [Google Scholar]
  57. Augustin, J.M.; Drok, S.; Shinoda, T.; Sanmiya, K.; Nielsen, J.K.; Khakimov, B.; Olsen, C.E.; Hansen, E.H.; Kuzina, V.; Ekstrøm, C.T.; et al. UDP-glycosyltransferases from the UGT73C Subfamily in Barbarea vulgaris catalyse Sapogenin 3-O-glucosylation in Saponin-mediated Insect resistance. Plant Physiology 2012, 160, 1881–1895. [Google Scholar] [CrossRef] [PubMed]
  58. De Santis, G.; Maddaluno, C.; D’Ambrosio, T.; Rascio, A.; Rinaldi, M.; Troisi, J. Characterisation of quinoa (Chenopodium quinoa Willd.) accessions for the saponin content in Mediterranean environment. Ital. J. Agron. 2016, 11, 277–281. [Google Scholar] [CrossRef]
  59. Gómez-Caravaca, A.M.; Iafelice, G.; Lavini, A.; Pulvento, C.; Caboni, M.F.; Marconi, E. Phenolic compounds and saponins in quinoa samples (Chenopodium quinoa Willd.) grown under different saline and nonsaline irrigation regimens. J. Agric. Food. Chem. 2012, 60, 4620–4627. [Google Scholar] [CrossRef]
  60. Ridout, C.L.; Price, K.R.; Dupont, M.S.; Parker, M.L.; Fenwick, G.R. Quinoa saponins—Analysis and preliminary investigations into the effects of reduction by processing. J. Sci. Food Agric. 1991, 54, 165–176. [Google Scholar] [CrossRef]
  61. Ando, H.; Chen, Y.C.; Tang, H.; Shimizu, M.; Watanabe, K.; Mitsunaga, T. Food components in fractions of quinoa seed. Food Sci. Technol. Res. 2002, 8, 80–84. [Google Scholar] [CrossRef]
  62. Ruiz, K.B.; Khakimov, B.; Engelsen, S.B.; Bak, S.; Biondi, S.; Jacobsen, S.E. Quinoa seed coats as an expanding and sustainable source of bioactive compounds: An investigation of genotypic diversity in saponin profiles. Ind. Crops Prod. 2017, 104, 156–163. [Google Scholar] [CrossRef]
  63. Repo-Carrasco, R.; Espinoza, C.; Jacobsen, S.E. Nutritional value and use of the Andean crops quinoa (Chenopodium quinoa) and kañiwa (Chenopodium pallidicaule). Food Rev. Int. 2003, 19, 179–189. [Google Scholar] [CrossRef]
  64. Filho, A.M.M.; Pirozi, M.R.; Borges, J.T.D.S.; Pinheiro Sant’Ana, H.M.; Chaves, J.B.P.; Coimbra, J.S.D.R. Quinoa: Nutritional, functional, and antinutritional aspects. Crit. Rev. Food Sci. Nutr. 2017, 57, 1618–1630. [Google Scholar] [CrossRef] [PubMed]
  65. Miranda, M.; Vega-Gálvez, A.; Martínez, E.A.; López, J.; Marín, R.; Aranda, M.; Fuentes, F. Influence of contrasting environments on seed composition of two quinoa genotypes: Nutritional and functional properties. Chil. J. Agric. Res. 2013, 73, 108–116. [Google Scholar] [CrossRef]
  66. Miranda, M.; Vega-Gálvez, A.; Quispe-Fuentes, I.; Rodríguez, M.J.; Maureira, H.; Martínez, E.A. Nutritional aspects of six quinoa (Chenopodium quinoa Willd.) ecotypes from three geographical areas of Chile. Chil. J. Agric. Res. 2012, 72, 175–181. [Google Scholar] [CrossRef]
  67. World Health Organization. Protein and Amino Acid Requirements in Human Nutrition: Report of a Joint WHO/FAO/UNU Expert Consultation. In World Health Organization Technical Report Series; World Health Organization: Geneva, Switzerland, 2007; p. 29. [Google Scholar]
  68. Mota, C.; Santos, M.; Mauro, R.; Samman, N.; Matos, A.S.; Torres, D.; Castanheira, I. Protein content and amino acids profile of pseudocereals. Food Chem. 2016, 193, 55–61. [Google Scholar] [CrossRef] [PubMed]
  69. Joshi, V.; Joung, J.G.; Fei, Z.; Jander, G. Interdependence of threonine, methionine and isoleucine metabolism in plants: Accumulation and transcriptional regulation under abiotic stress. Amino Acids 2010, 39, 933–947. [Google Scholar] [CrossRef] [PubMed]
  70. Wright, K.H.; Pike, O.A.; Fairbanks, D.J.; Huber, C.S. Composition of Atriplex hortensis, sweet and bitter Chenopodium quinoa seeds. J. Food Sci. 2002, 67, 1383–1385. [Google Scholar] [CrossRef]
  71. Tang, Y.; Li, X.; Chen, P.X.; Zhang, B.; Liu, R.; Hernandez, M.; Draves, J.; Massimo, F.M.; Tsao, R. Assessing the fatty acid, carotenoid, and tocopherol compositions of amaranth and quinoa seeds grown in Ontario and their overall contribution to nutritional quality. J. Agric. Food Chem. 2016, 64, 1103–1110. [Google Scholar] [CrossRef] [PubMed]
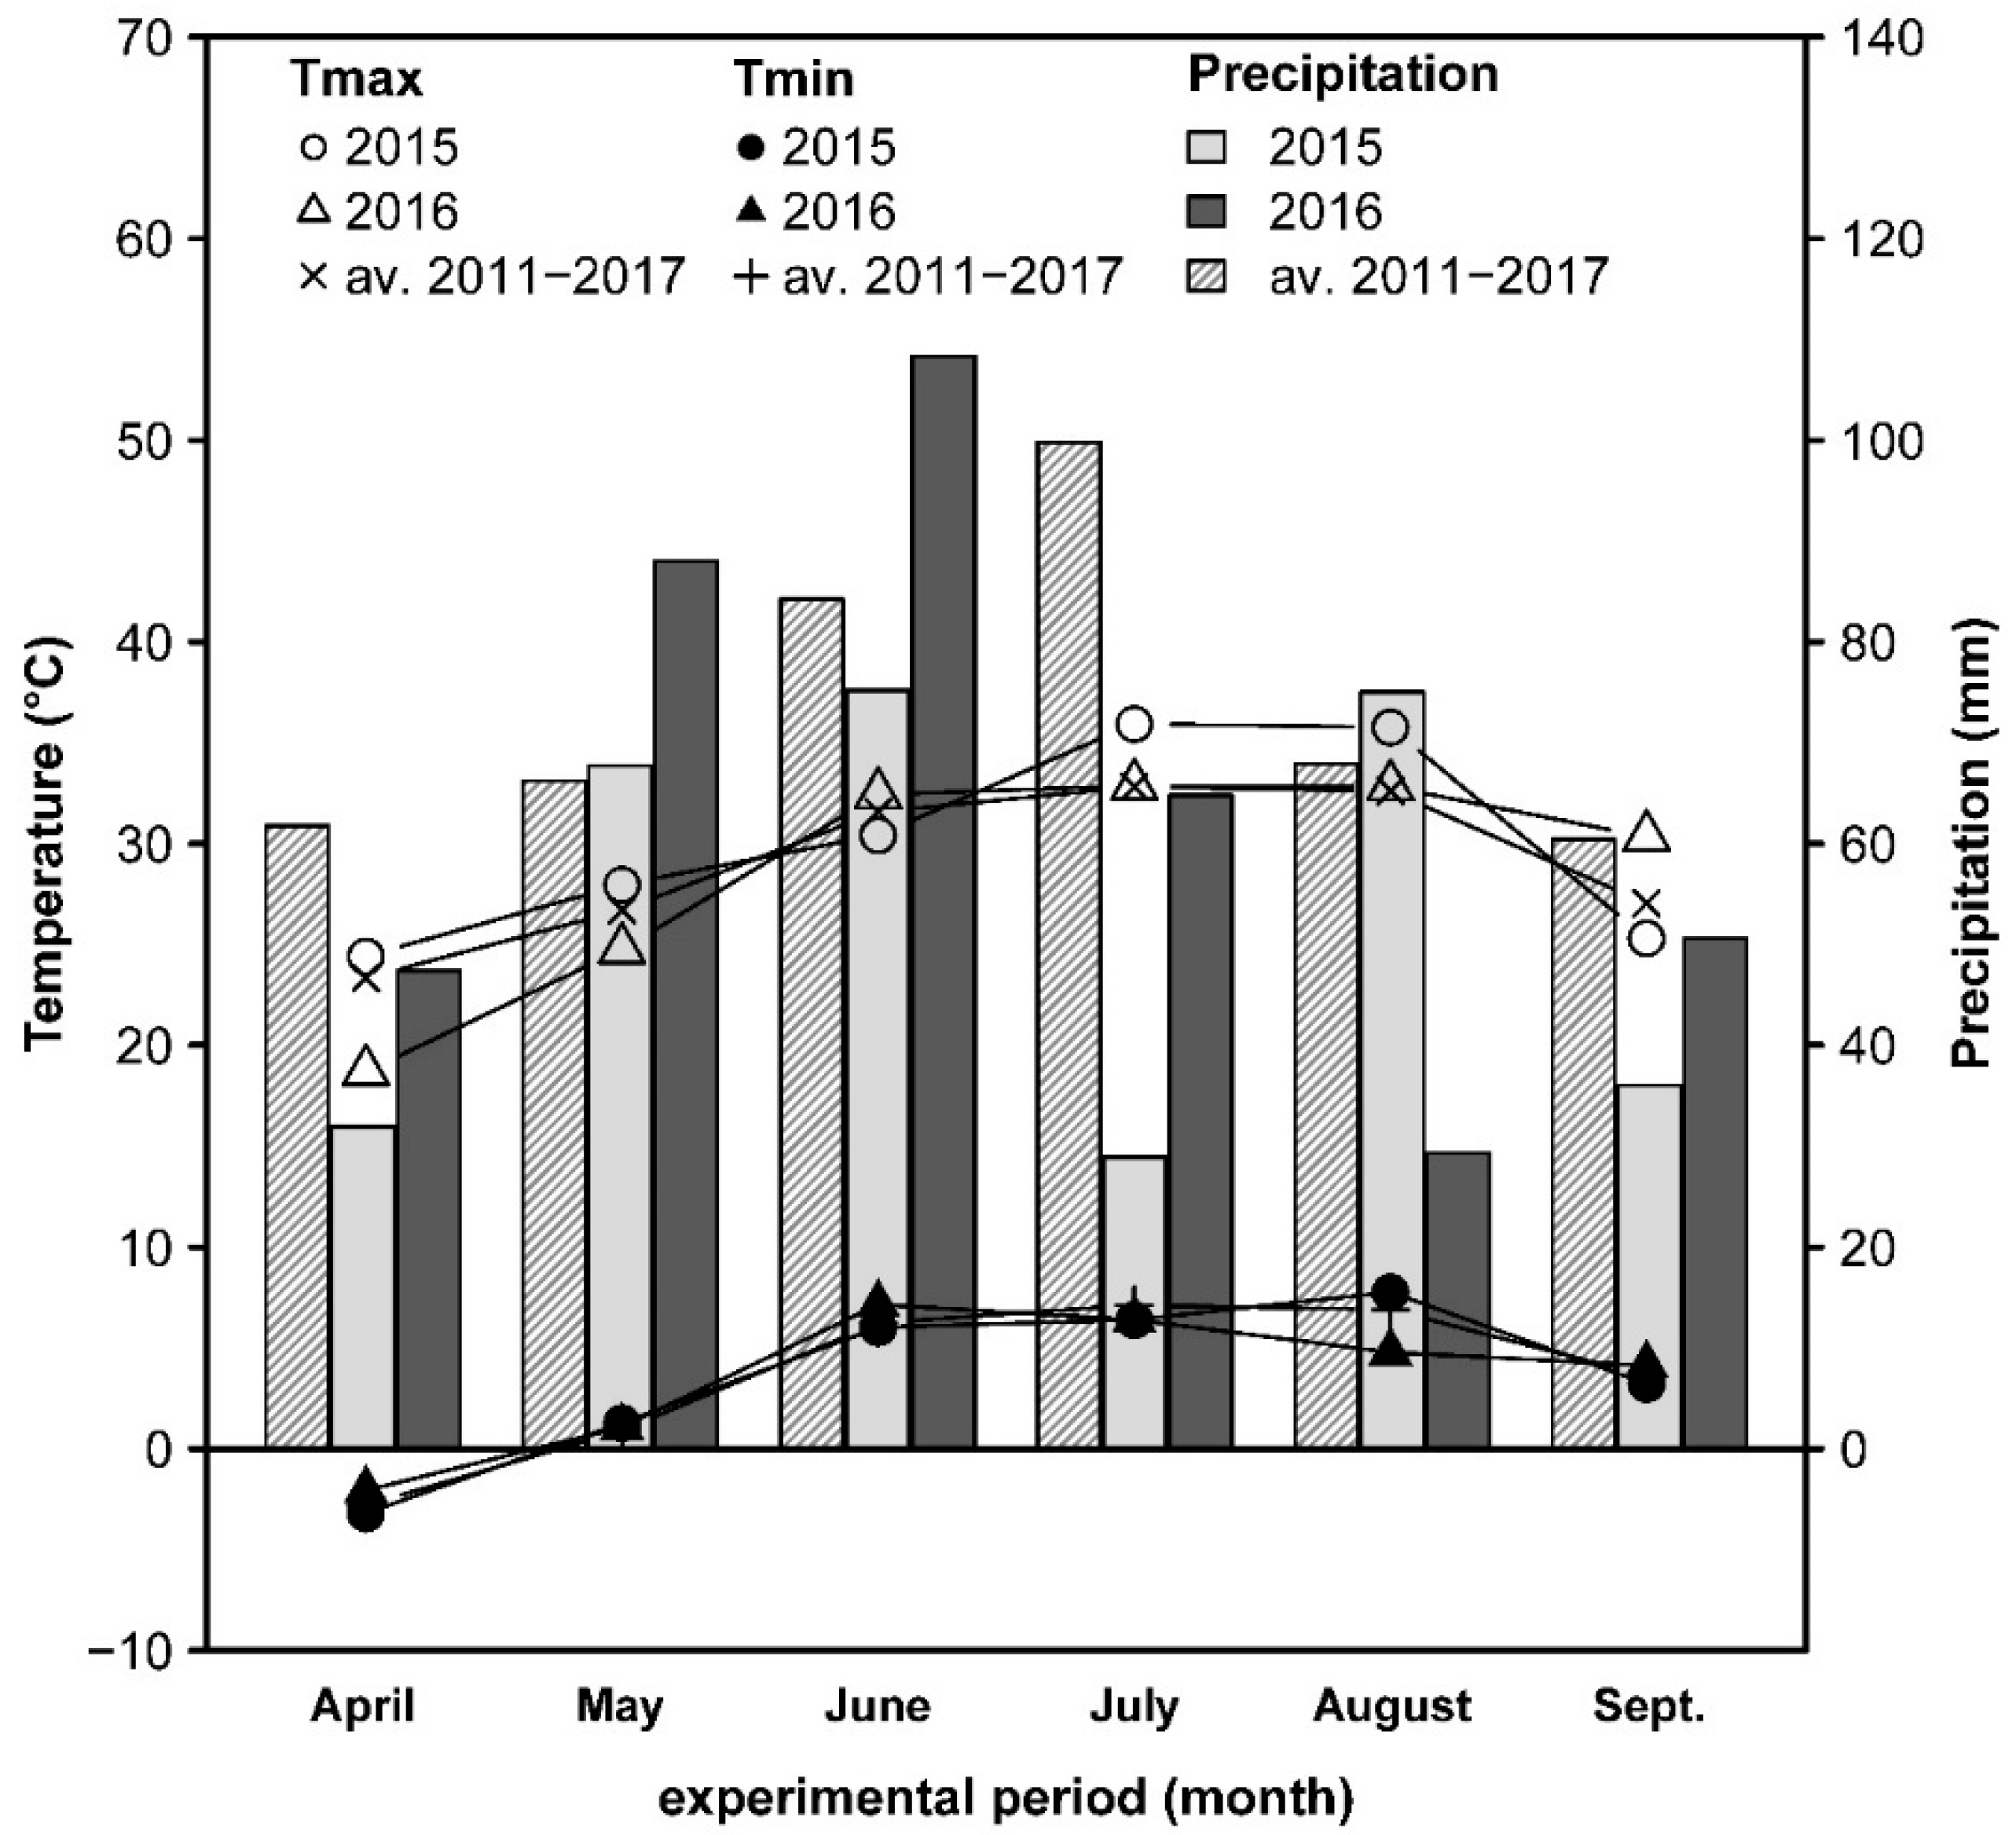
Figure 1. Total monthly precipitation, long-term average (av.) monthly precipitation, mean monthly maximum (Tmax) and minimum temperature (Tmin) and long-term av. monthly maximum and minimum temperature during the experimental period in 2015 and 2016.
Agronomy 08 00197 g001
Figure 2. Two-year mean values of grain yield (Mg ha−1) for the four quinoa cultivars (Zeno, Jessie, Puno, Titicaca). Bars headed by the same letter are not significantly different at p < 0.05. Error bars indicate the standard error of the mean.
Agronomy 08 00197 g002
Figure 3. Thousand kernel weight (g) for the two years and four quinoa cultivars (Zeno, Jessie, Puno, Titicaca). Within year, bars headed by the same lowercase letter are not significantly different (p < 0.05). Capital letters compare the two years for the same cultivar, bars headed by the same letter are not significantly different (p < 0.05). Error bars indicate the standard error of the mean.
Agronomy 08 00197 g003
Figure 4. Grain protein (%) content for the two years and four quinoa cultivars (Zeno, Jessie, Puno, Titicaca). Within year, bars headed by the same lowercase letter are not significantly different (p < 0.05). Capital letters compare the two years for the same cultivar, bars headed by the same letter are not significantly different (p < 0.05). Error bars indicate the standard error of the mean.
Agronomy 08 00197 g004
Figure 5. Saponin (mg g−1) content of non-polished (A) and polished (B) grains for the two years and four quinoa cultivars (Zeno, Jessie, Puno, Titicaca). Within year, bars headed by the same lowercase letter are not significantly different (p < 0.05). Capital letters compare the two years for the same cultivar, bars headed by the same letter are not significantly different (p < 0.05). Error bars indicate the standard error of the mean. Notice the change in vertical scale between figures.
Agronomy 08 00197 g005
Figure 6. Two-year mean values of grain crude fat (%) for the four quinoa cultivars (Zeno, Jessie, Puno, Titicaca). Bars headed by the same letter are not significantly different at p < 0.05. Error bars indicate the standard error of the mean.
Agronomy 08 00197 g006
Table 1. Characteristics of the tested quinoa cultivars.
CultivarOriginBreederNote
PunoDenmarkQuinoa Quality 1Bitter 4
TiticacaDenmarkQuinoa Quality 1Bitter 4
JessieFranceAbbottAgra 2Sweet 4
ZenoAustriaZeno Projekte 3Bitter 4
1 Quinoa Quality, Teglvaerksvej 10, DK-4420 Regstrup, Denmark. 2 AbbottAgra, Loire-Anjou-Touraine Natural Regional Park, Le Cossonnieres, 49160 Longue-Jumelles, France. 3 Zeno Projekte, Pötzleinsdorfer Str. 10, 1180 Vienna, Austria. 4 Critical grain saponin level of 1 mg g–1.
Table 2. Physical and chemical soil characteristics of the experimental field in 2015 and 2016.
YearDepth (cm)Clay (%)Sand (%)Silt (%)pHNmin 1 (kg ha−1)
20150–3026.613.859.67.29.3
201530–6032.816.550.7-10.7
201560–9037.614.847.6-11.9
20160–3025.314.660.17.56.5
201630–6016.428.655.0-5.1
201660–90----11.3
1 Nmin = mineral nitrogen content.
Table 3. Harvest dates in 2015 and 2016.
Cultivar20152016
Harvest
(DD.MM.YY)
Harvest
(DAS) 1
Harvest
(GDD, °Cd) 2
Harvest
(DD.MM.YY)
Harvest
(DAS)
Harvest
(GDD, °Cd)
Zeno01.09.20151251793.4829.08.20161221574.31
Jessie01.09.20151251793.4829.08.20161221574.31
Puno30.09.20151542067.5508.09.20161331721.28
Titicaca10.09.20151341874.3408.09.20161331721.28
Mean-134.51882.21-127.51647.80
1 DAS: Days after sowing. 2 GDD: Growing degree days with a base temperature of 3 °C.
Table 4. Results of ANOVAs (factors, degrees of freedom and p-values) carried out for the different yield- and quality-parameters.
FactorsDF 1Grain YieldGrain TKW 2Grain Saponin
Non-PolishedPolished
Year1<0.0001<0.00010.6780<0.0001
Cultivar30.0012<0.0001<0.00010.0003
Year × Cultivar30.20830.00980.00040.0254
Block40.18760.14710.07640.3240
FactorsDFGrain crude fatFatty acids
C 16:0C 18:0C18:1 ol. 3
Year10.00430.44160.09340.0984
Cultivar3<0.00010.18990.07950.2635
Year × Cultivar30.16220.26290.06440.3333
Block40.74380.72230.98480.9498
FactorsDFFatty acidsGrain protein
C 18:1 vac. 4C 18:2C 18:3
Year10.19060.04950.07510.0001
Cultivar30.06090.17950.1204<0.0001
Year × Cultivar30.06920.63510.4908<0.0001
Block40.66180.93510.84710.1771
FactorsDFAmino acids
EssentialSemi-essentialNon-essential
Year1<0.0001<0.00010.0651
Cultivar3<0.0001<0.0001<0.0001
Year × Cultivar30.00450.04060.0983
Block40.13080.46070.9646
1 DF: degrees of freedom. 2 TKW: thousand kernel weight. 3 ol.: oleic acid. 4 vac.: vaccenic acid.
Table 5. Composition of essential amino acids (AA) (in g 100 g−1 crude protein, ± SE 1) for the two years and four quinoa cultivars (Zeno, Jessie, Puno, Titicaca). Total amount means within year in one row followed by the same lower-case letter are not significantly different from each other (p < 0.05). Capital letters compare the two years for the same cultivar, means in one column followed by the same letter are not significantly different (p < 0.05).
AAessentialZenoJessiePunoTiticacaMeancultivars
2015
Ile2.00 (±0.11)2.42 (±0.14)3.21 (±0.03)2.67 (±0.09)2.58 (±0.09)
Leu3.67 (±0.15)4.26 (±0.15)5.41 (±0.04)4.81 (±0.10)4.54 (±0.11)
Lys2.77 (±0.12)3.46 (±0.10)3.95 (±0.03)3.70 (±0.05)3.47 (±0.08)
Met1.10 (±0.04)1.39 (±0.02)1.51 (±0.07)1.39 (±0.03)1.35 (±0.04)
Phe2.20 (±0.10)2.66 (±0.22)3.55 (±0.12)2.96 (±0.08)2.84 (±0.13)
Thr2.13 (±0.12)2.55 (±0.07)3.27 (±0.02)2.83 (±0.04)2.70 (±0.06)
Trp0.97 (±0.16)0.85 (±0.05)1.02 (±0.02)0.89 (±0.09)0.93 (±0.08)
Val4.18 (±0.14)4.38 (±0.25)4.00 (±0.05)4.88 (±0.05)4.36 (±0.12)
His1.33 (±0.05)1.79 (±0.04)1.89 (±0.02)1.87 (±0.02)1.72 (±0.03)
total20.35 Aa (±0.67)23.76 Ab (±0.67)27.81 Ac (±0.67)26.00 Abc (±0.67)24.49 (±0.67)
2016
Ile2.51 (±0.06)2.82 (±0.14)3.19 (±0.06)2.57 (±0.11)2.77 (±0.09)
Leu4.50 (±0.10)5.25 (±0.18)5.55 (±0.12)4.64 (±0.13)4.99 (±0.13)
Lys3.98 (±0.06)4.90 (±0.19)4.99 (±0.08)4.22 (±0.12)4.52 (±0.11)
Met1.43 (±0.06)1.80 (±0.03)1.80 (±0.02)1.63 (±0.06)1.67 (±0.04)
Phe2.75 (±0.10)3.17 (±0.12)3.50 (±0.22)2.81 (±0.11)3.06 (±0.14)
Thr2.63 (±0.06)3.15 (±0.10)3.20 (±0.07)2.72 (±0.06)2.93 (±0.07)
Trp0.88 (±0.01)0.98 (±0.02)1.11 (±0.03)1.01 (±0.02)1.00 (±0.02)
Val4.40 (±0.18)5.67 (±0.42)3.80 (±0.09)4.94 (±0.04)4.70 (±0.18)
His1.89 (±0.03)2.29 (±0.07)2.48 (±0.05)2.03 (±0.06)2.17 (±0.05)
total24.97 Ba (±0.67)30.02 Bb (±0.67)29.63 Ab (±0.67)26.57 Aa (±0.67)27.81 (±0.67)
1 SE: standard error of the mean.
Table 6. Composition of semi-essential amino acids (AA) (in g 100 g−1 crude protein, ± SE 1) for the two years and four quinoa cultivars (Zeno, Jessie, Puno, Titicaca). Total amount means within year in one row followed by the same lower-case letter are not significantly different from each other (p < 0.05). Capital letters compare the two years for the same cultivar, means in one column followed by the same letter are not significantly different (p < 0.05).
AAsemi-essential ZenoJessiePunoTiticacaMeancultivars
2015
Cys0.95 (±0.04)1.18 (±0.01)1.33 (±0.02)1.23 (±0.02)1.17 (±0.02)
Tyr1.64 (±0.09)1.98 (±0.07)2.30 (±0.02)2.01 (±0.05)1.98 (±0.06)
Gly2.95 (±0.11)3.75 (±0.03)4.68 (±0.05)4.11 (±0.07)3.87 (±0.07)
Arg3.79 (±0.17)5.17 (±0.03)5.21 (±0.08)5.16 (±0.05)4.83 (±0.08)
Pro2.25 (±0.07)2.70 (±0.01)3.14 (±0.03)3.17 (±0.11)2.82 (±0.06)
total11.58 Aa (±0.48)14.78 Ab (±0.48)16.66 Ab (±0.48)15.68 Ab (±0.48)14.67 (±0.48)
2016
Cys1.13 (±0.03)1.40 (±0.03)1.49 (±0.02)1.33 (±0.03)1.34 (±0.03)
Tyr1.92 (±0.05)2.33 (±0.08)2.38 (±0.05)2.01 (±0.07)2.16 (±0.06)
Gly3.71 (±0.08)4.57 (±0.18)4.99 (±0.08)4.12 (±0.10)4.35 (±0.11)
Arg5.57 (±0.10)6.56 (±0.24)7.51 (±0.20)5.98 (±0.16)6.41 (±0.18)
Pro2.85 (±0.07)3.24 (±0.15)3.34 (±0.06)2.98 (±0.20)3.10 (±0.12)
total15.18 Ba (±0.48)18.10 Bbc (±0.48)19.71 Bc (±0.48)16.42 Aab (±0.48)17.36 (±0.48)
1 SE: standard error of the mean.
Table 7. Two-year mean values of non-essential amino acid (AA) composition (in g 100 g−1 crude protein, ± SE 1) for the four quinoa cultivars (Zeno, Jessie, Puno, Titicaca). Total amount means in one row followed by the same letter are not significantly different from each other (p < 0.05).
AAnon-essential ZenoJessiePunoTiticacaMeancultivars
Ser2.77 (±0.15)3.34 (±0.14)3.75 (±0.05)3.27 (±0.05)3.28 (±0.10)
Asp5.18 (±0.26)6.04 (±0.25)7.07 (±0.10)5.93 (±0.12)6.06 (±0.18)
Glu6.89 (±0.54)8.54 (±0.49)11.81 (±0.44)8.28 (±0.24)8.88 (±0.43)
Ala2.78 (±0.14)3.34 (±0.16)3.88 (±0.04)3.33 (±0.08)3.33 (±0.11)
total17.62 a (±0.69)21.26 b (±0.69)26.51 c (±0.69)20.81 b (±0.69)21.55 (±0.69)
1 SE: standard error of the mean.
Table 8. Two-year mean values of fatty acid composition (in g 100 g−1 crude fat, ± SE 1) for the four quinoa cultivars (Zeno, Jessie, Puno, Titicaca). Means in one row followed by the same letter are not significantly different from each other (p < 0.05).
Fatty AcidsZenoJessiePunoTiticacaMeancultivars
C16:06.96 a (±0.66)8.56 a (±0.66)8.48 a (±0.66)6.97 a (±0.66)7.74 (±0.66)
C18:00.45 a (±0.07)0.65 a (±0.07) 0.71 a (±0.07)0.45 a (±0.07)0.57 (±0.07)
C18:1oleate13.14 a (±1.32)16.55 a (±1.32)14.41 a (±1.32)13.08 a (±1.32)14.30 (±1.32)
C18:1vaccean0.92 a (±0.07)1.04 a (±0.07)1.07 a (±0.07)0.79 a (±0.07)0.95 (±0.07)
C18:2 40.67 a (±3.73) 45.68 a (±3.73)40.39 a (±3.73)33.07 a (±3.73)39.95 (±3.73)
C18:34.55 a (±0.48)4.98 a (±0.48)4.59 a (±0.48)3.29 a (±0.48)4.35 (±0.48)
1 SE: standard error of the mean.