3.1. Effect of the Environment on Growth and Development
Table 4 shows the mean squares of the combined Analysis of Variance (ANOVA) for the variables “days to tuber set”, “days to senescence” and “plant height”. Highly significant differences were observed for environments, genotypes, and genotype by environment interaction for all three variables. For those environments in which homogeneity of variances was established, a combined analysis was pursued: three environments for variable “days to tuber set” variable (
Table 5) and four environments for the variables “days to senescence” and “plant height” variables (
Table 6 and
Table 7).
Table 4.
Mean squares of the combined ANOVA for key variables of crop development for 10 potato genotypes under aeroponics.
Table 4.
Mean squares of the combined ANOVA for key variables of crop development for 10 potato genotypes under aeroponics.
| Source of Variation | DF Ɨ | Mean Square-Days to Tuber Set | DF | Mean Square -Days to Senescence | DF | Mean Square-Plant Height |
|---|
| Environments | 2 | 2783.4 ** | 3 | 25,300.4 ** | 3 | 218,840.6 ** |
| Blocks/environments | 6 | 22.32 * | 8 | 60.51 * | 8 | 12.22 |
| Gen | 9 | 2789.3 ** | 9 | 5604.7 ** | 9 | 46,121.8 ** |
| Gen/environments | 18 | 587.6 ** | 27 | 1416.2 ** | 27 | 6065.2 ** |
| Overall error | 54 | 5.3 | 72 | 3.6 | 72 | 21.4 |
| CV (%) | | 4.9 | | 0.8 | | 2,6 |
| General mean | | 47.3 | | 230.2 | | 174.8 |
Table 5.
G × E interaction effects for the “days to tuber set” (days) variable.
Table 5.
G × E interaction effects for the “days to tuber set” (days) variable.
| Environment | T1 | T2 | T3 | T4 | T5 | T6 | T7 | T8 | T9 | T10 |
|---|
| LM1 | 38.3 b | 41.3 c | 24.0 b | 43.4 b | 31.7 a | 41.3 a | 58.3 b | 53.3 b | 68.3 b | 53.3 b |
| LM3 | 16.7 c | 53.3 b | 16.7 c | 16.7 c | 16.7 b | 16.7 b | 73.3 a | 68.3 a | 73.3 a | 43.3 c |
| HY1 | 68.7 a | 74.7 a | 53.3 a | 68.3 a | 16.0 b | 15.7 b | 73.3 a | 68.3 a | 73.7 a | 68.8 a |
Table 6.
G × E interaction effects for the “days to senescence” (days) variable.
Table 6.
G × E interaction effects for the “days to senescence” (days) variable.
| Environment | T1 | T2 | T3 | T4 | T5 | T6 | T7 | T8 | T9 | T10 |
|---|
| LM1 | 235.3 b | 238.3 c | 162.7 d | 235.3 b | 162.7 c | 163.3 c | 240.3 b | 240.0 b | 239.0 c | 224.0 b |
| LM2 | 275.3 a | 291.3 a | 251.3 a | 293.3 a | 251.3 a | 260.7 a | 291.3 a | 275.3 a | 291.3 a | 251.3 a |
| LM3 | 218.7 d | 253.0 b | 172.0 c | 230.7 c | 230.7 b | 230.0 b | 230.7 c | 230.0 d | 251.3 b | 172.0 c |
| HY1 | 224.0 c | 236.7 c | 225.0 b | 237.7 b | 161.3 c | 161.3 c | 189.7 d | 234.3 c | 224.0 d | 221.7 b |
Table 7.
G × E interaction effects for the “plant height” (cm) variable.
Table 7.
G × E interaction effects for the “plant height” (cm) variable.
| Environment | T1 | T2 | T3 | T4 | T5 | T6 | T7 | T8 | T9 | T10 |
|---|
| LM1 | 337.8 a | 369.1 a | 295.3 a | 357.2 a | 106.6 b | 92.4 b | 352.1 a | 332.8 a | 293.3 a | 217.8 a |
| LM2 | 181.0 b | 192.3 b | 119.0 c | 190.0 c | 119.0 a | 58.7 c | 282.3 b | 271.0 b | 210.7 b | 214.0 a |
| LM3 | 187.0 b | 189.3 b | 158.3 b | 210.7 b | 113.3 ab | 108.7 a | 204.0 c | 225.0 c | 210.0 b | 125.0 b |
| HY2 | 30.3 c | 141.7 c | 35.3 d | 36.3 d | 15.7 c | 16.0 d | 205.0 c | 114.7 d | 57.0 c | 15.7 c |
Table 5,
Table 6 and
Table 7 show the G × E interaction effects for the “days to tuber set”, “days to senescence” and “plant height” variables. With reference to the moderately late to late genotypes (T1, T2, T7 and Y10), it was observed that under conditions of the LM3 environment, a comparatively short time period to tuber initiation was recorded for the genotypes T1 (Chucmarina) and T10 (Yana Imilla), with 16.7 and 43.3 days, respectively (
Table 5). On the other hand, for the genotypes T7 (Serranita) and T2 (Venturana) tuber initiation was earliest in the LM1 environment with 58.3 and 41.3 days, respectively. In the HY1 environment, these four genotypes required more time for tuber initiation.
For the early genotypes (T3, T4, T5, T6, T8 and T9), a differentiated behavior was observed when grown under LM1 versus LM3 environmental conditions. The genotypes T3 (395434.1), T4 (397036.7), T5 (397077.16) and T6 (397073.16) significantly reduced the number of days to tuber initiation to 16.7 days. On the other hand, the genotypes T8 (Tigoni) and T9 (Victoria) increased the number of days required from 53.3 and 58.3 days to 68.3 and 73.3 days, respectively. The response of T8 (Tigoni) and T9 (Victoria) grown under LM3 versus HY1 environment conditions did not produce significant differences. T3 (395434.1) and T4 (397036.7) showed a significant increase in the number of days needed for tuber initiation in the HY1 environment. The strongest environmental effect was experienced by the genotypes T3 (395434.1) and T4 (397036.7).
Low temperatures (12–16 °C) stimulate tuberization [
19] and such conditions occur mainly in the highland environment. However, in the HY1 environment this response was observed only for two out of 10 of the genotypes evaluated (T5 and T6). Conversely, the LM3 environment presented the highest temperature averages (above 20 °C) at the beginning of the growing cycle and it was in this environment that the lowest tuberization induction time occurred for most of the genotypes. This was particularly so at the beginning of the plants’ development cycle when most genotypes in environment LM 3 showed rapid tuber set. Radiation is an important factor influencing tuberization and may partially explain the early tuber set observed in the LM3 environment, even though the average temperatures were comparatively high [
15,
20].
The moderately late and late genotypes experienced significant variations in their response for “days to senescence” (
Table 6). In the LM2 environment, the longest vegetative cycle was observed for all genotypes. Particularly, the genotypes T2 (Venturana) and T7 (Serranita) were very late taking up to 291.3 days to senescence. Similarly, long vegetative periods were recorded for the T1 (Chucmarina) and T10 (Yana Imilla) genotypes in the LM2 environment. Yet, these same genotypes showed the lowest number of “days to senescence” needed to reach maturity in the LM3 environment with 218.7 and 172 days, respectively. The genotypes T2 (Venturana) and T7 (Serranita) needed the least number of “days to senescence” to reach maturity in the HY1 environment with 236.7 and 198.7 days, respectively.
Also, for the group of early genotypes the longest life cycles were observed in the LM2 environment, reaching a maximum of 293.3 days for the genotypes T4 (397036.7). Overall, the genotypes T3 (395434.1), T5 (397077.16) and T6 (397073.16) showed the strongest environmental effect for “days to senescence”. The genotype T3 (395434.1) expressed a low number of “days to senescence” with 162.7 and 172 days in the LM1 and LM3 environments, respectively. Also, the genotypes T5 (397077.16) and T6 (397073.16) were early maturing in the LM1 and HY1 environments with 163.3 and 161.3 “days to senescence”, respectively. Contrary to earliness attributed under field growing conditions, the genotypes T8 (Tigoni) and T9 (Victoria) did not show precocity under aeroponics management in any of the environments.
There was an increase in the vegetative cycle for all the genotypes grown with aeroponics as compared to what was expected considering reported maturity under field conditions. This is consistent with results obtained by Otazú and Chuquillanqui [
12] who reported an increase of up to 30 days for the potato varieties Canchan, Perricholi and Yungay grown in an aeroponics system as compared with cultivation in pots in conditions of the central Andean highlands of Peru. Likewise, Kang
et al. [
21] also reported an increase in the vegetative period of potato plants when grown in an aeroponics system. They [
21] concluded this effect was due to the high availability of nutrients, especially nitrogen. The LM2 environment had warm conditions for at least seven months of the growing season, causing an unusual lengthening of the vegetative periods of all genotypes. These results are similar to those found by Khedher and Ewing [
22] who observed a delay in the maturing of 11 potato clones cultivated in a greenhouse under heat-stress conditions.
Table 7 provides an overview of the G × E interaction effect for the variable “plant height”. For the moderately late and late genotypes it was observed that all were tallest in the LM1 environment. The overall tendency for the genotypes T1 (Chucmarina) and T2 (Venturana) was similar across the different environments with the tallest and the smallest plants recorded in the LM1 and HY2 environments respectively. The plant height of the genotypes T7 (Serranita) and T10 (Yana Imilla) was statistically the same for the LM3 and HY2 and LM1 and LM2 environments, respectively.
For the early genotypes, the strongest environmental effect for the variable “plant height” variable was observed for the genotypes T3 (395434.1), T4 (397036.7), T8 (Tigoni) and T9 (Victoria). For these genotypes, the tallest “plant height” was recorded in the LM1 environment and the lowest “plant height” in the HY2 environment. The environmental effect of HY2 significantly reduced the magnitude of the response variable for all the genotypes. The genotypes T5 (397077.16) and T6 (397073.16) showed significant differences for “plant height” across environments but contrary to all other genotypes reached maximum height in the LM2 and LM3 environments, respectively.
The highest records for the variable “plant height” occurred in the warmest environments (Coast). In the highland environment (HY2), which presented events of low night temperatures, genotypes consistently had their lowest records for the variable “plant height”. Wolf
et al. [
23] emphasize that warm temperatures cause a greater translocation of photosynthates towards the vegetative organs (stems and leaves) and conclude that there is a significant effect of temperature on the plant height and final number of potato leaves. Other authors have also pointed out that high temperatures induce plants with thin stems, small leaves, and greater length of internodes [
24]. The temperature of the root environment of the HY2 environment presented average records below 10 °C during the initial months of plant development. This was due to the presence of frost in the external environment, which could have significantly affected the final plant height of the genotypes evaluated. Indeed, Cooper [
25] highlights that mean root temperatures below 10 °C can give rise to potato plants of less than 8 cm in height. It is also clear that aeroponics results in much higher plant height than would normally be the case under open field conditions.
3.2. Effect of the Environment on Weight and Number of Tubers Per Plant
Table 8 shows the AMMI analysis for yield variables taking into consideration all five study environments: “weight” (grams per plant) and “number of mini-tubers” per plant. Highly significant differences were observed for the principal effects for genotypes, environment, and for the G × E interaction. This shows that the genotypes had a differential behavior for yield variables across the different environments.
The AMMI analysis for the yield variable “weight” of the 10 genotypes evaluated in the different environments determined that 49.3% of the total sum of squares was attributable to genotypic effects, while the environmental and the G × E interaction effects explained 12.8% and 20.5%, respectively. Clearly the greatest attribution of the variation in “weight” was caused by the genotypic effect, possibly due to the ample diversity of genetic material used. The magnitude of the sum of squares of the G × E interaction was almost 2.5 times lower than that attributed to the genotypic effect, but 1.6 times greater than the sum of squares attributed to the environment. This clearly indicates different responses of the genotypes across the different environments. The first three principal components’ axis (PCA1, PCA2 and PCA3) were all highly significant (
Table 8). The first axis of the analysis of interaction components (PCA1) explained or captured 63.6% of the sum of squares of the interaction, and the second axis (PCA2) 22.8%. These results show that the effect of the G × E interaction was explained for 86.4% by the first two principal components.
Table 8.
AMMI analysis for the yield variables “weight” (g/plant) and “number of mini tubers” per plant for 10 genotypes evaluated in five different environments.
Table 8.
AMMI analysis for the yield variables “weight” (g/plant) and “number of mini tubers” per plant for 10 genotypes evaluated in five different environments.
| Source of Variation | Weight (g/Plant) | Number of Mini-Tubers Per Plant |
|---|
| | D.F. Ɨ | Sum of squares | Mean squares | Explains | D.F. | Sum of squares | Mean squares | Explains |
| Corrected total | 149 | 19,043,207 | | | 149 | 110,338 | | |
| Environments | 4 | 2,437,402 | 609,350 ** | 12.80% | 4 | 8042 | 2010.6 ** | 7.30% |
| Blocks (environ.) | 10 | 2,531,269 | 25,317 ** | 13.30% | 10 | 1177 | 117.7 | 1.10% |
| Genotypes | 9 | 9,395,130 | 1,043,903 ** | 49.30% | 9 | 67,732 | 7525.7 ** | 61.40% |
| G × E interaction | 36 | 3,897,583 | 108,266 ** | 20.50% | 36 | 27,583 | 766.2 ** | 25.00% |
| PCA1 | 12 | 2,480,433.1 | 206,702.76 ** | 63.60% | 12 | 16,014.7 | 1334.55 ** | 58.10% |
| PCA2 | 10 | 887,684 | 88,768.4 ** | 22.80% | 10 | 8662.6 | 866.85 ** | 31.40% |
| PCA3 | 8 | 418,285.4 | 52,285.67 ** | 10.70% | 8 | 2166.9 | 270.86 ** | 7.90% |
| Residual | 90 | 781,823 | 18,530.1 | 4.10% | 90 | 5804 | 64.5 | 5.30% |
| CV % | | 21 | | | | 16.4 | | |
| General mean | | 444.2 | | | | 48.99 | | |
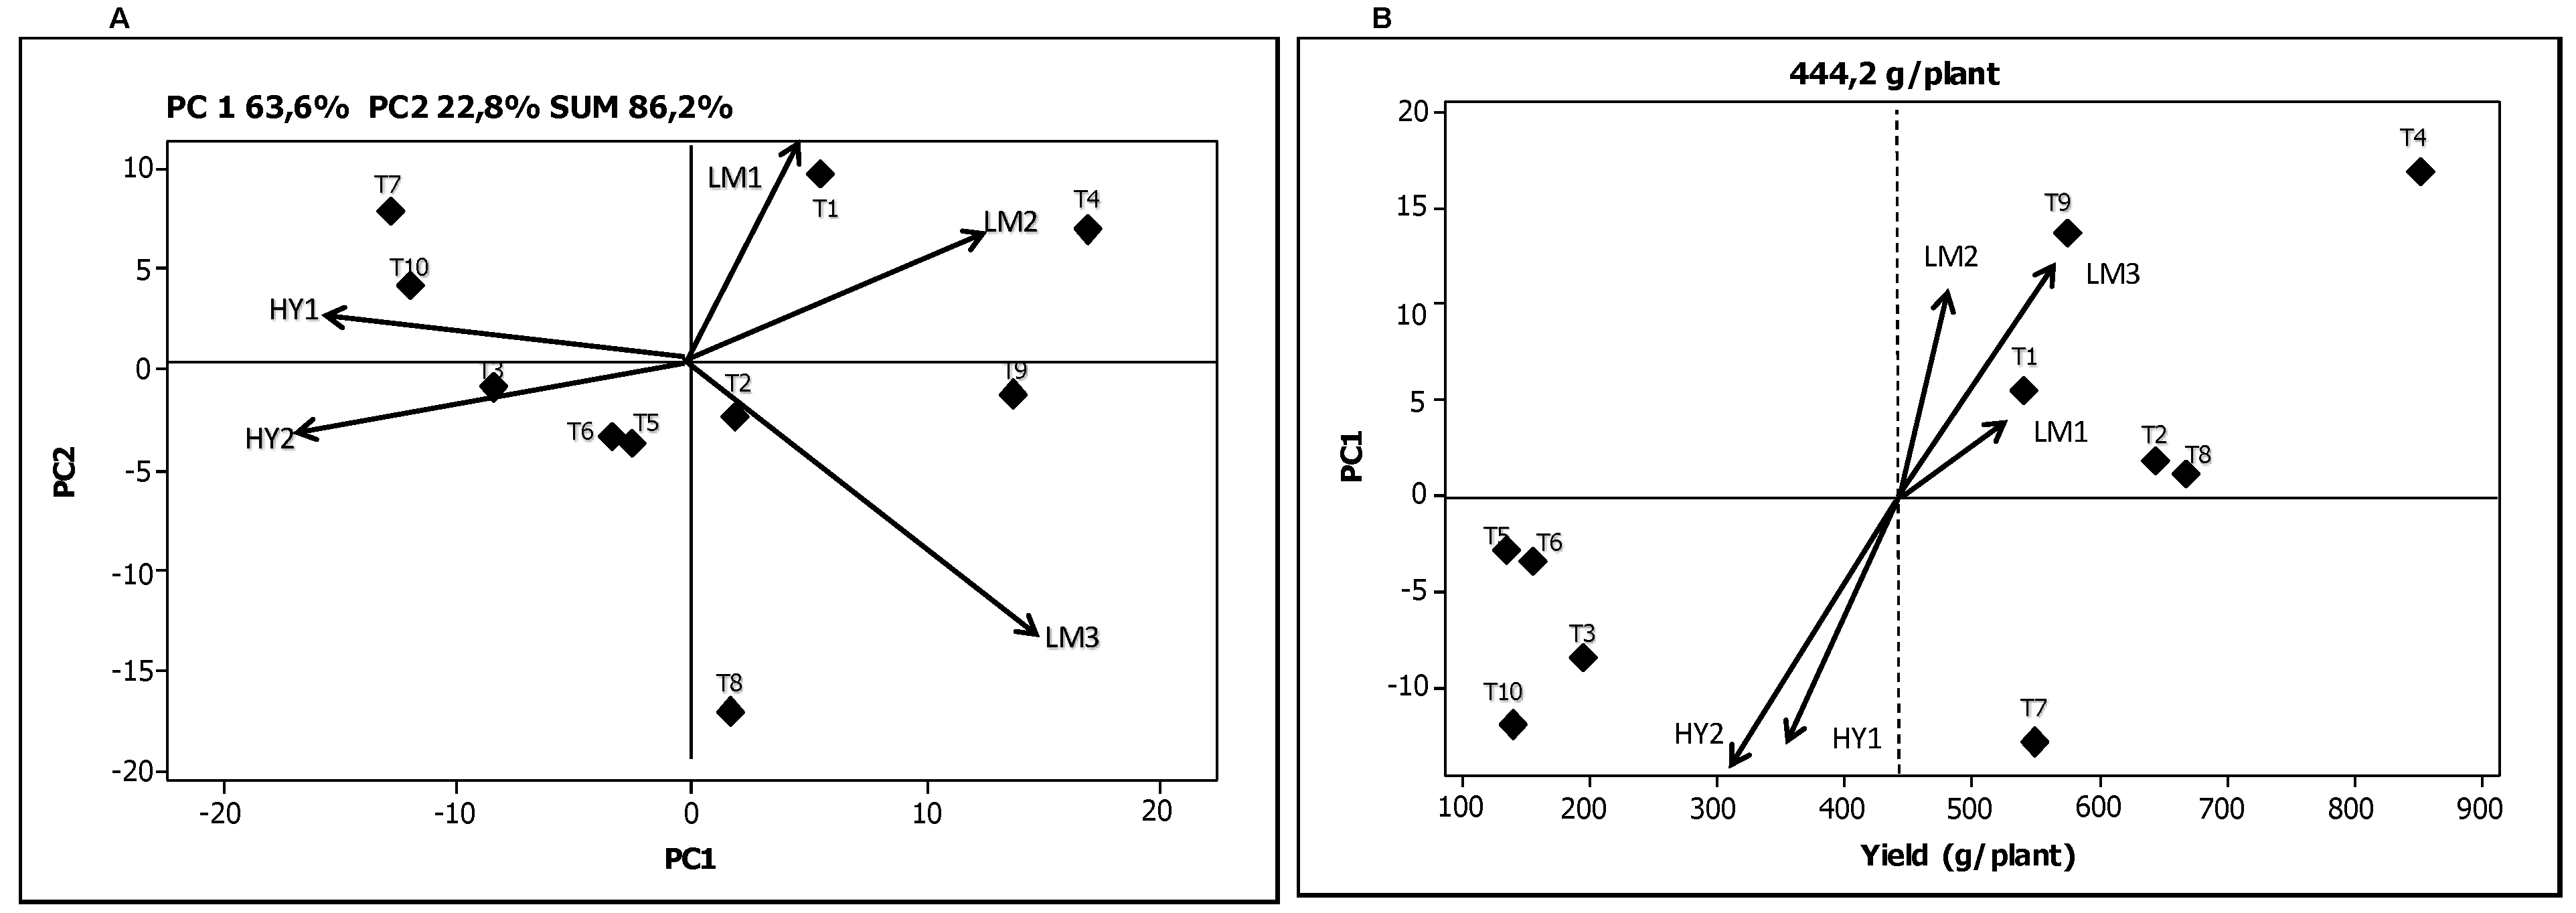
The biplot in
Figure 1A makes it possible to link the genotypes and environments based on the G × E interaction for the variable “weight” (g/plant). The biplot has four quadrants in which genotypes and environments with PCA values of the same sign interact positively. In other words, the grouping of the genotypes and the environments in the same quadrant indicates a positive association between them. The environments are located in the four sections and represented by a vector line while the genotypes are represented by diamonds. For the variable “weight”, the genotype T1 showed the best adaptation in the environment LM1, the genotype T4 in LM2, while the genotypes T2, T8 and T9 were more closely aligned with the environment LM3. Likewise, the genotypes T7 and T10 performed best in the environment HY1, and the genotypes T3, T5 and T6 in the environment HY2. Genotypes situated near the center of biplot axis were least affected by the G × E interaction. Consequently the genotypes T2, T5, and T6 can be considered the most stable in their final response for the variable “weight”, while the genotypes T1, T4, T7, and T9 had a greater effect of the environment on their response.
The biplot in
Figure 1B shows the “weight” variable per plant according to the coordinates of PCA1. The dotted vertical line represents the average weight (
x = 444.2 g/plant). Again, the environments are indicated by a vector line and the genotypes by diamonds. Crossa
et al. [
26] report that the genotypes and environments with high coordinates on PCA1 contribute to a greater extent to the G × E interaction while the genotypes and environments with PCA1 coordinates close to zero have little participation in this effect. In accordance with this interpretation, it can be observed that genotypes T2 and T8 contributed little to the interaction.
Figure 1.
Biplots for the yield variable total average mini-tuber “weight” (g/plant). (A) Graphical representation of the two principal components explaining the G × E interaction; (B) Graphical representation of the first principal component as a function of mini-tuber “weight”.
Figure 1.
Biplots for the yield variable total average mini-tuber “weight” (g/plant). (A) Graphical representation of the two principal components explaining the G × E interaction; (B) Graphical representation of the first principal component as a function of mini-tuber “weight”.
The genotypes T4, T8, and T2 had the highest values for “weight” per plant. The environment LM1 contributed least to the interaction while the environment LM3 was found to be where the variable “weight” per plant was best expressed. On the contrary, the environment HY2 was where the lowest averages values were registered. Both the environments HY2 and HY1 contributed significantly to the interaction effect. Yan
et al. [
17] point out that those environments that exhibit an angle of less than 90° between them have the quality of accommodating the genotypes in a similar way. Consequently, it can be observed that the environments LM1, LM2 and LM3
versus HY1 and HY2 resulted in comparatively similar expressions for the variable “weight” per plant. With reference to the “number of mini-tubers” per plant, the AMMI analysis determined that 61.4% of the total sum of squares was attributable to genotypic effects while the environmental and the G × E interaction effects explained 7.3% and 25.0%, respectively (
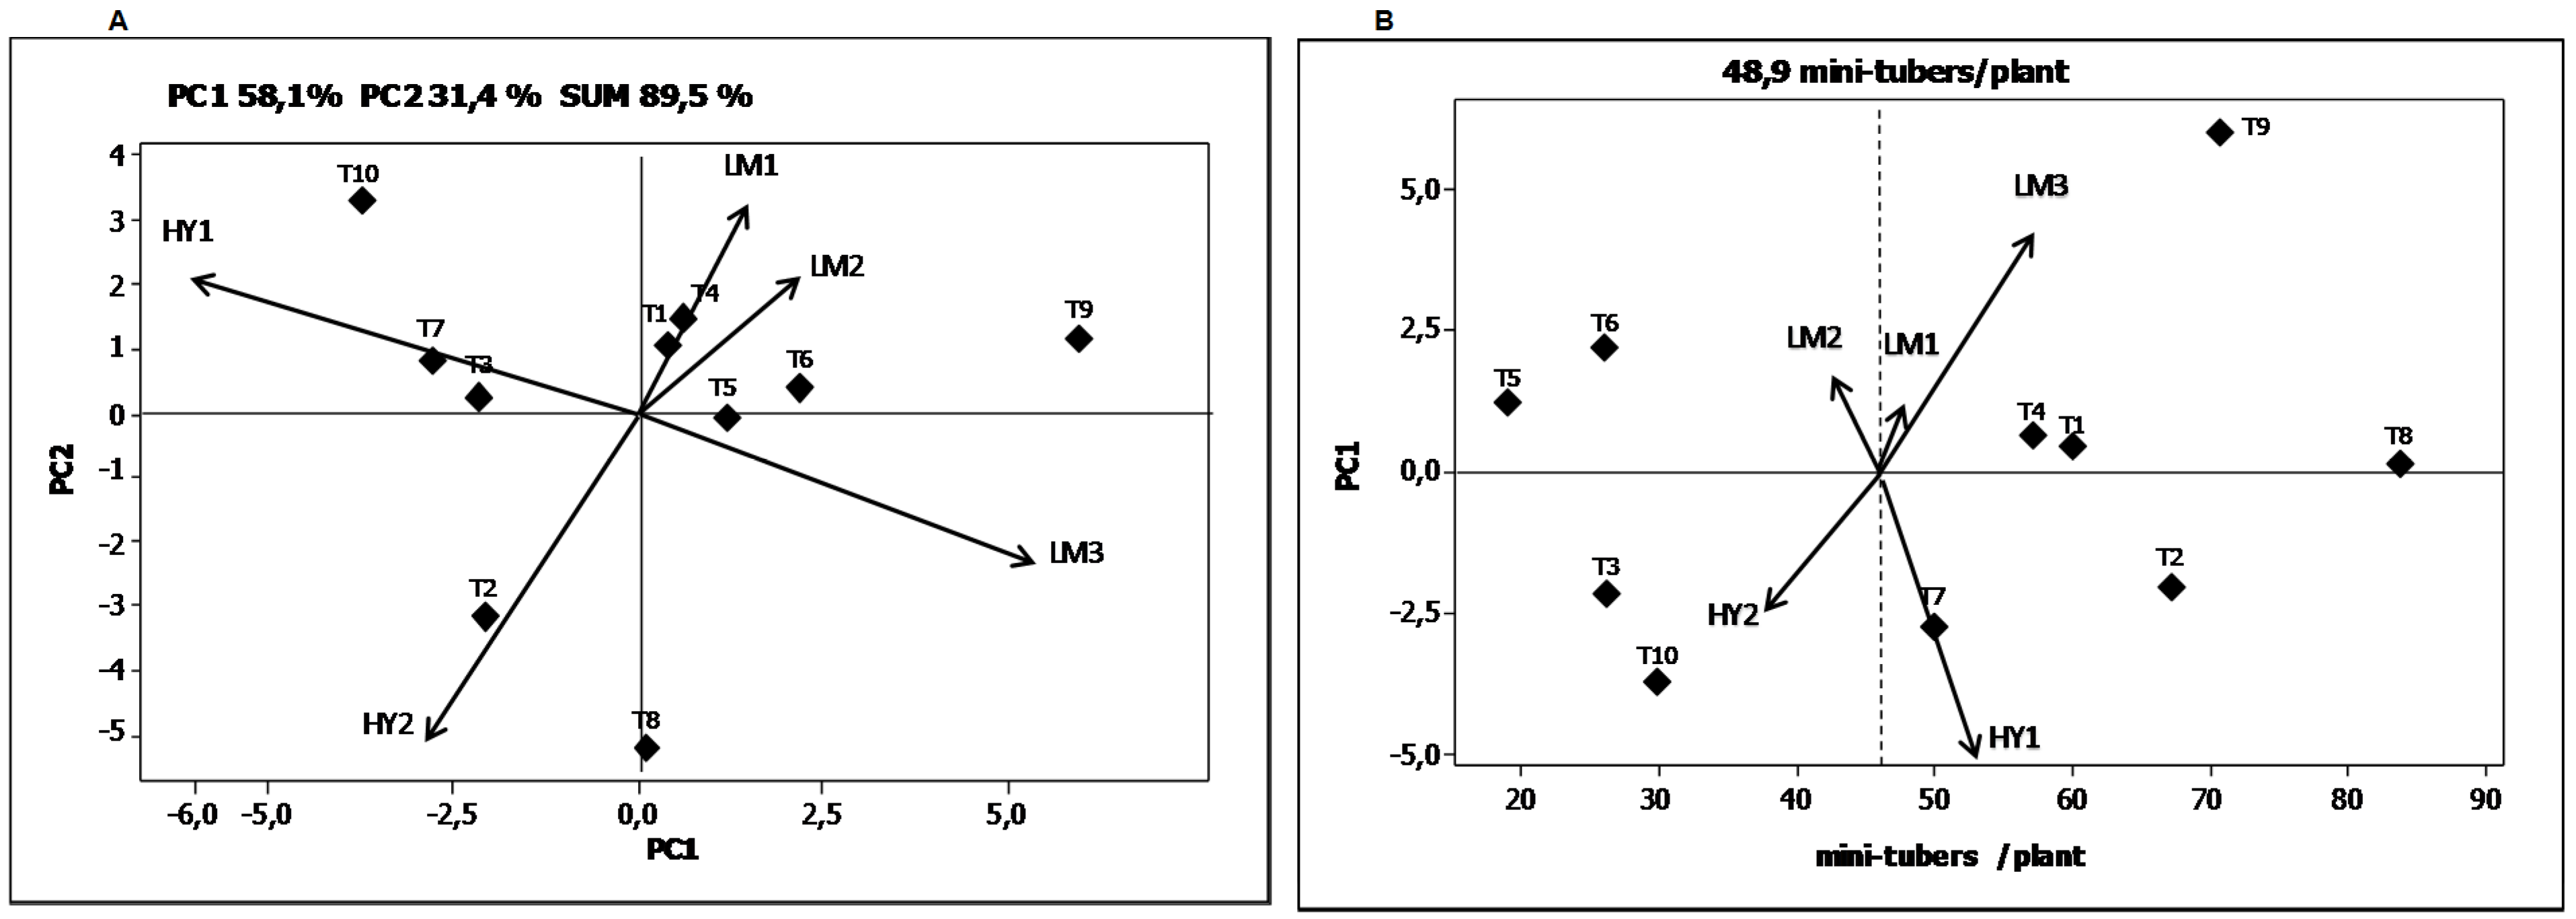
Table 8). The magnitude of the sum of squares of the G × E interaction was almost 2.4 times lower than that attributed by the genotypic effect but 3.4 times higher than the sum of squares ascribed to the environmental effect. The first three principal components’ axis (PCA1, PCA2 and PCA3) were all highly significant. The first axis of the principal component analysis (PC1) captures 58.1% of the sum of squares of the interaction, and the second axis (PC2) 31.4%. These results show that the effect of the G × E interaction for “number of mini-tuber” per plant was explained 89.5% by the first two principal components.
The genotypes T1 and T4 showed the best response in the environment LM1, the genotype T2 genotype in the environment HY2, and the genotypes T7 and T3 in the environment HY1 (
Figure 2A). The genotypes T1, T3, T5 and T6 were stable in their response in the five environments for the variable “number of mini-tuber” per plant. On the other hand, the genotypes T2, T8, T9, and T10 experienced the environmental effect to the greatest extent.
Figure 2.
Biplots for the yield variable total average “number of mini-tubers” per plant. (A) Graphical representation of the two principal components explaining the G × E interaction; (B) Graphical representation of the first principal component as a function of the “number of mini-tubers” per plant.
Figure 2B shows the average “number of mini-tubers” per plant according to the coordinates of the PCA1. The dotted vertical line represents the average “number of mini-tubers” per plant (
x = 48.9 mini-tubers/plant). In this figure, the genotypes that are close have similar adaptation. Consequently, genotypes like T1 and T4 have a similar adaptation. The genotypes which contributed to a greater extent to the G × E interaction were T9, T6, T7 and T10. The environments that contributed the most to a differential G × E interaction were HY1 followed by LM3. The highest average “number of mini-tubers” per plant was obtained in the LM3 environment followed by HY1. The lowest average “number of mini-tubers” per plant was obtained in the coastal environment during the summer season (LM2) and the highland environment during the dry season (HY2). In the environment LM2, the daytime greenhouse temperatures were above 30 °C during some months of crop development. On the other hand, the HY2 environment had night temperatures dropping to under 5 °C during the early months of crop development. Both environments can be considered extreme and notably affected the number of mini-tubers per plant obtained.


