1. Introduction
Soil health is a critical component of ecosystem functioning, reflecting its ability to support essential processes including nutrient availability, moisture regulation, and the suppression of pests and diseases, ultimately sustaining overall farm productivity. It is shaped by a complex interaction between physical and chemical properties that determine viability. Key physical soil properties such as soil texture, structure, bulk density and porosity are vital for maintaining healthy farmlands. These characteristics help to reduce erosion and runoff, enable proper root penetration, enhance moisture retention, and ensure adequate aeration [
1]. Similarly, chemical properties like soil pH, organic matter content and sufficient levels of macronutrients (like nitrogen, phosphorus and potassium) and micronutrients (like iron and zinc) are fundamental to nutrient uptake, stress tolerance, and long-term crop productivity [
2,
3]. At the core of soil health, however, are the diverse microbial communities that drive critical ecosystem functions such as nutrient cycling and the decomposition of organic residues. Beneficial microbes, including bacteria, fungi and actinomycetes, not only enhance soil fertility and carbon sequestration but also help suppress soil-borne pests and pathogens. These microbial contributions are essential for promoting the sustainability and resilience of farming systems [
4,
5]. Soil health indicators increasingly integrate biological, chemical, and physical parameters to provide a holistic evaluation of ecosystem functioning and resilience, with microbial diversity recognized as a sensitive indicator of soil management impacts and restoration potential.
Over the past few decades, smallholder agricultural production in sub-Saharan Africa (SSA) has experienced a steady decline. This downward trend can largely be attributed to a range of unsustainable farming practices that have degraded the natural resources essential for productive agriculture. Key contributing factors include inadequate land management, particularly poor land and water conservation practices. Additional widespread issues, such as intensive tillage, monocropping, overgrazing, deforestation, and excessive reliance on chemical fertilizers, have further weakened local ecosystems [
6]. Intensive or repeated tillage, especially with heavy machinery, disrupts soil structure and microbial life, often leading to compaction and waterlogging. Monocropping without proper crop rotation depletes specific soil nutrients, making it increasingly difficult for crops to thrive [
7]. Deforestation and overgrazing reduce vegetation cover, accelerating erosion and limiting the return of organic matter. Moreover, overreliance on synthetic fertilizers negatively impacts soil biology, contributing to acidification and further nutrient imbalances. Collectively, these practices have severely compromised soil fertility, the foundation of any sustainable agricultural system. Soil fertility influences critical functions such as nutrient availability, pest and disease suppression, and carbon sequestration, all of which are essential to maintaining resilient and productive farming systems [
8].
In Kenya, particularly in the western region, soil degradation and declining fertility pose a serious threat to smallholder farming systems. The primary cause includes over- cultivation, which leads to nutrient mining, excessive use of synthetic fertilizers and pesticides, and the erosion of topsoil due to uneven terrain, deforestation, and other unsustainable land use practices [
9]. Although awareness of sustainable approaches such as agroecology and nature-positive agriculture is growing, limited research has examined different land-use systems’ influence on soil health and, in turn, farming system performance. This study focuses on three predominant farming systems: Aggregated farms (A and B) follow the participatory approach at the community level. Farm aggregation is a model in which smallholder farmers combine their land, pool resources, and share benefits to enhance overall farm efficiency and economic viability [
10]. Aggregated farm (A) has remained fallow for the past 30 years, while aggregated farm (B) has been under continuous production, though plagued by low productivity. In contrast, farm C represents non-aggregated, conventional smallholder farms characterized by higher input use and more uneven topography (
Supplementary Figure S1). Although farm C shows signs of diversification, including maize, legumes, bananas, and vegetables, as well as the use of cover crops, both farm B and farm C are marked by intensive land use practices. These include frequent tillage, monocropping, and heavy reliance on chemical fertilizers, all of which contribute significantly to soil degradation over time.
This study aims to bridge existing knowledge gaps by characterizing and comparing three degraded yet contrasting land use systems, while offering a holistic framework for assessing overall soil health. Despite growing recognition of soil health as a cornerstone of sustainable agriculture, there remains limited empirical understanding of how contrasting land-use histories and management intensities shape soil physicochemical properties and microbial community structures in smallholder systems of sub-Saharan Africa. Given the urgent need to understand the biological dimension of soil fertility and edaphic conditions, this research seeks to establish baseline soil data and identify key indicators of soil health. By integrating physiochemical properties with microbial diversity assessments, this study explores indicators of soil degradation, health, and ecology. We hypothesized that (i) long-term low-disturbance systems would exhibit higher soil health and microbial diversity, (ii) intensive high-input systems would show signs of biological and chemical degradation, and (iii) soil physicochemical indicators would be strongly associated with shifts in microbial community composition and functional potential. This study emphasizes microbial taxonomic composition and diversity using amplicon sequencing approaches, which enable high-resolution community profiling but do not directly measure functional gene abundance or activity. Advanced techniques such as metagenomics enable a deeper understanding of the soil microbiome’s genetic potential, including genes associated with critical ecosystem functions. These insights are essential for the transition toward ecologically sustainable and diversified farming systems.
2. Materials and Methods
2.1. Study Area, Soil Sample Collection and Analysis
This study was conducted at three sites in Western Kenya: two aggregated farms located in Agoro East (A) and Jimo East (B), each covering 25 ha in Kisumu County, and one non-aggregated smallholder farm (C) covering 23 ha in Vigulu, Vihiga County. The aggregated farm A had a history of intense land use, primarily grazing, but had not been subjected to active farming for over 30 years. In contrast, aggregated farm B had been under continuous cultivation, characterized by high input use, poor soil management, and visible signs of land degradation. The non-aggregated farm (C) featured highly fragmented landscapes dominated by conventional smallholder farms, marked by heavy reliance on chemical fertilizers and a sustained decline in productivity. All three farms fall within a tropical climate zone, experiencing bimodal rainfall patterns with an annual average ranging between 1200 and 1800 mm. Based on regional soil surveys and physicochemical characteristics, soils in the study area are predominantly classified as Oxisols and Ultisols under USDA Soil Taxonomy. A general location map of the study sites and gridline system was established across the entire study area, encompassing all three farm sites (
Supplementary Figure S2). Soil samples were collected from a depth of 10–15 cm to represent the biologically active root-zone layer while minimizing short-term surface disturbances caused by recent tillage, fertilizer placement, residue accumulation, and erosion. In smallholder farming systems, the 0–10 cm layer is often highly heterogeneous and strongly influenced by episodic management events, whereas the 10–15 cm depth better reflects longer-term soil physicochemical conditions and microbial community structure associated with sustained land-use practices. This depth has been widely used in soil microbial ecology studies aiming to assess management-induced degradation and restoration dynamics. We acknowledge that soil properties within the cultivated 0–30 cm layer can exhibit considerable vertical variability due to factors such as tillage intensity, nutrient inputs, root distribution, and leaching processes. Although stratified sampling across multiple sub-depths (e.g., 0–10, 10–20, and 20–30 cm) may provide a more detailed characterization of vertical gradients, the present study focused specifically on the 10–15 cm layer to ensure consistency across sites and to capture relatively stable soil conditions representative of sustained land-use effects. A total of 399 soil samples were collected to analyze physical and chemical properties. Specifically, 147 samples were taken from farm A, 108 from farm B, and 144 from farm C. For microbial analysis, 20 independent biological samples per farm were collected; each sample consisted of five spatially proximate soil cores pooled to reduce microscale heterogeneity. All soil samples were homogenized and stored at 4 °C until processing. Each sample was subjected to standard soil quality assessment covering physical, chemical, and microbial diversity parameters.
Physicochemical properties, including texture, pH, cation exchange capacity (CEC), soil organic carbon (SOC), total nitrogen (TN), available phosphorus (P), potassium (K), and micronutrients, were estimated using FTIR spectroscopy calibrated against reference laboratory datasets. Soil samples for physical and chemical analysis were air dried, ground and sieved to pass a 2 mm sieve and then sent for analysis at the ICRAF (International Centre for Research in Agroforestry) Soil and Plant Spectral Diagnostics Laboratory in Nairobi, Kenya. Samples were scanned in duplicates on a Bruker Invenio-S Fourier-Transform Infrared (FTIR) spectrometer using the Kennard Stone method. The samples were predicted for the requested soil parameters using the ICRAF’s global soil models. The models are fitted using Bayesian Regularization for Feed-Forward Neural Networks (BRNNs) and Random Forest (RF) algorithms. The performance of the model was based on a 30% hold-out validation set to predict soil physical and chemical properties. Although FTIR-based predictions provide rapid and reliable soil parameter estimates, model predictions inherently contain uncertainty and should be interpreted as estimates calibrated against reference datasets rather than direct laboratory measurements.
2.2. DNA Extraction
Soil samples for microbial analyses were processed using fresh, field-moist soil to preserve native microbial DNA integrity. Total bacterial DNA was extracted from 250 mg of soil using the Plant and Soil DNA Kit (Zymo Research Corp., Irvine, CA, USA), following the manufacturer’s protocol. Near full-length bacterial 16S rRNA genes were amplified using universal primers 27F (5′-AGAGTTTGATCCTGGCTCAG-3′) and 1492R (5′-GGTTACCTTGTTACGACTT-3′). For fungal analysis, the internal transcribed spacer 1 (ITS1) region was amplified using the primers ITS1-F (5′-TCCGTAGGTGAACCTGCGG-3′) and ITS4 (5′-TCCTCCGCTTATTGATATGC-3′). Amplicon sequencing of bacterial 16S rRNA and fungal ITS regions was employed to characterize microbial community composition. For DNA extraction, 1 g of soil was transferred into a 15 mL centrifuge tube containing glass beads and centrifuged at ≥10,000×
g for 1 min. Subsequently, 800 µL of Genomic Lysis Buffer was added to the filtrate to facilitate DNA isolation. The resulting pellet was retained for further processing. Samples were homogenized by vertexing; genomic DNA was finally eluted in 50 µL of elution buffer to obtain higher DNA concentrations. The eluted DNA was then filtered, and its concentration and purity were assessed using 1% agarose gel electrophoresis [
11].
2.3. Metagenomic Sequencing Library Preparation and Community Profiling
Paired-end sequencing libraries were prepared using the NEBNext® Ultra™ DNA Library Prep Kit for Illumina® (New England Biolabs, Ipswich, MA, USA), following the manufacturer’s protocol. Libraries were constructed with a read length configuration of 2 × 150 base pairs, incorporating unique index codes to enable sample multiplexing. Library quality and concentration were assessed using a combination of techniques: fluorometric quantification was performed using a Qubit™ fluorometer (Thermo Fisher Scientific, Waltham, MA, USA), quantitative real-time PCR (qPCR) provided an accurate concentration estimate, and fragment size distribution and integrity were evaluated using the Agilent 2100 Bioanalyzer system (Agilent Technologies, Santa Clara, CA, USA). Final sequencing was conducted on the Illumina MiSeq platform at BGI (Beijing Genomics Institute) Co., Ltd., Beijing, China.
Paired-end reads were demultiplexed using unique barcode sequences assigned to each sample. Barcode and primer sequences were trimmed, and the paired-end reads were merged using the FLASH tool, requiring a minimum overlap of 10 base pairs to reconstruct the V3–V4 region. Quality filtering of the raw reads was performed to remove low-quality sequences, and the resulting clean reads were assessed using QIIME [
12]. Chimeric sequences were identified and removed using UCHIME (v4.2.40) [
13]. Specifically, 16S rDNA reads were screened against the GOLD database (v20110519); ITS reads were compared to the UNITE database (v20140703). Chimeric sequences detected through these methods’ alignments were discarded, ensuring that only high-quality, non-chimeric reads were retained for downstream analysis. Operational taxonomic units (OTUs) were clustered using USEARCH (v7.0.1090) with the UPARSE algorithm, applying a 97% sequence similarity threshold to generate representative OTU sequences. All reads were subsequently mapped back to the representative OTUs using USEARCH GLOBAL. Reads with more than one sequencing error or shorter than 200 base pairs were excluded. For ITS1 sequences, forward and reverse reads were merged prior to analysis. Taxonomic classification of OTU representative sequences was conducted using the Ribosomal Database Project (RDP) Classifier v2.2, trained on the Greengenes database, with a confidence threshold of 0.6 [
14].
2.4. Statistical Analysis
Alpha diversity was used to assess species diversity within individual samples, employing a range of various indices, including observed species, Chao1, ACE, Shannon and Simpson indices. The observed species count, Chao1 and ACE values reflect the community species richness of each microbial community. A rarefaction curve was used to evaluate whether the sequencing depth was sufficient to capture the full diversity of each community. Simpson and Shannon indices were jointly used to capture complementary aspects of microbial diversity, where the Shannon index reflects richness and evenness, while the Simpson index emphasizes dominance structure within microbial communities. Diversity indices were calculated using Mothur (v1.31.2), and rarefaction curves were generated with the “vegan” package in R (v3.1.1). To visualize shared and unique OTUs among multiple samples or groups, Venn diagrams were created. OTUs for each group were identified based on abundance data, and diagrams were generated using the “VennDiagram” package in R (v3.1.1). Common and group-specific OTU IDs were then summarized. Beta diversity analysis was conducted using QIIME (v1.8.0) to evaluate differences in species composition among samples. Principal Coordinate Analysis (PCoA) was employed to visualize these differences and identify the main contributing factors based on OTU relative abundance data. PCoA plots were constructed using the “ade4” package in R (v3.1.1). Hierarchical clustering was performed using the Unweighted Pair Group Method with Arithmetic Mean (UPGMA) based on a distance matrix derived from beta diversity metrics. To assess the robustness of clustering results, a jackknife resampling analysis was conducted, 75% of sequences from the smallest sample in each group were randomly selected, and the resulting UPGMA tree was compared to the tree generated from the full dataset using QIIME. Finally, Analysis of Similarities (ANOSIM) was performed to evaluate differences in the community structure across groups with genus-level distinctions visualized using color changes.
3. Results
3.1. Soil Characteristics
Soil analysis revealed distinct variations in physical composition and fertility indicators across farms A, B and C (
Supplementary Table S1). Soil in farm A and B ranged from sandy loams to clay, with some silty soils observed near the lakeshore, while upland areas were generally loamier. In contrast, farm C soils were predominantly loamy and clayey, with localized patches of sandy soils. Soil texture showed a dominance of clay across the farms: farm A (56.79 ± 8.63%), farm B (57.25 ± 8.67%) and farm C (63.79 ± 4%). Soil pH varied across sites: farm A exhibited slightly acidic to slightly alkaline conditions (mean value of pH 6.78 ± 0.44), farm B was neutral to slightly alkaline (mean pH 7.39 ± 0.34), and farm C was acidic (mean pH 5.88 ± 0.26). Cation exchange capacity (CEC) was highest in farm B (43.37 cmolc/kg) and lowest in farm C (20.13 cmolc/kg), with farm A showing intermediate values. Farm A had low to moderate levels of soil organic carbon (SOC) and total nitrogen (TN), with values of 1.17 ± 0.39% for SOC and 0.12 ± 0.03% for TN. Farm B showed higher SOC (1.64 ± 0.66%) and a slightly higher TN level (0.13 ± 0.04%). Farm C had SOC and TN levels similar to farm A (SOC: 1.25 ± 0.22%, TN: 0.11 ± 0.02%), indicating moderate organic matter content but limited nitrogen availability. High variabilities were found in phosphorus (P) and potassium (K) levels across the farms with average in A (P—38.79 ± 6.12 mg/kg; K—548.84 ± 268.44 mg/kg), B (P—151.36 ± 260.63 mg/kg; K—943.52 ± 258.36 mg/kg) and C (P—28.02 ± 35.05 mg/kg; K—340.93 ± 177.67 mg/kg). Other micronutrients, such as copper (Cu), iron (Fe) and magnesium (Mg), were found to be adequate in all three farms. The means for Cu ranged from 1.12 mg/kg in A to 4.26 mg/kg in B, with a critical threshold of 0.2 mg/kg. The highest level of Fe was found in A (182.71 mg/kg), and the lowest level of Mg was found in C (343.71 mg/kg). Pearson correlation coefficients revealed significant positive correlations between SOC and TN (0.92). pH was negatively correlated with SOC, and positively correlated with cations such as K and Mg (
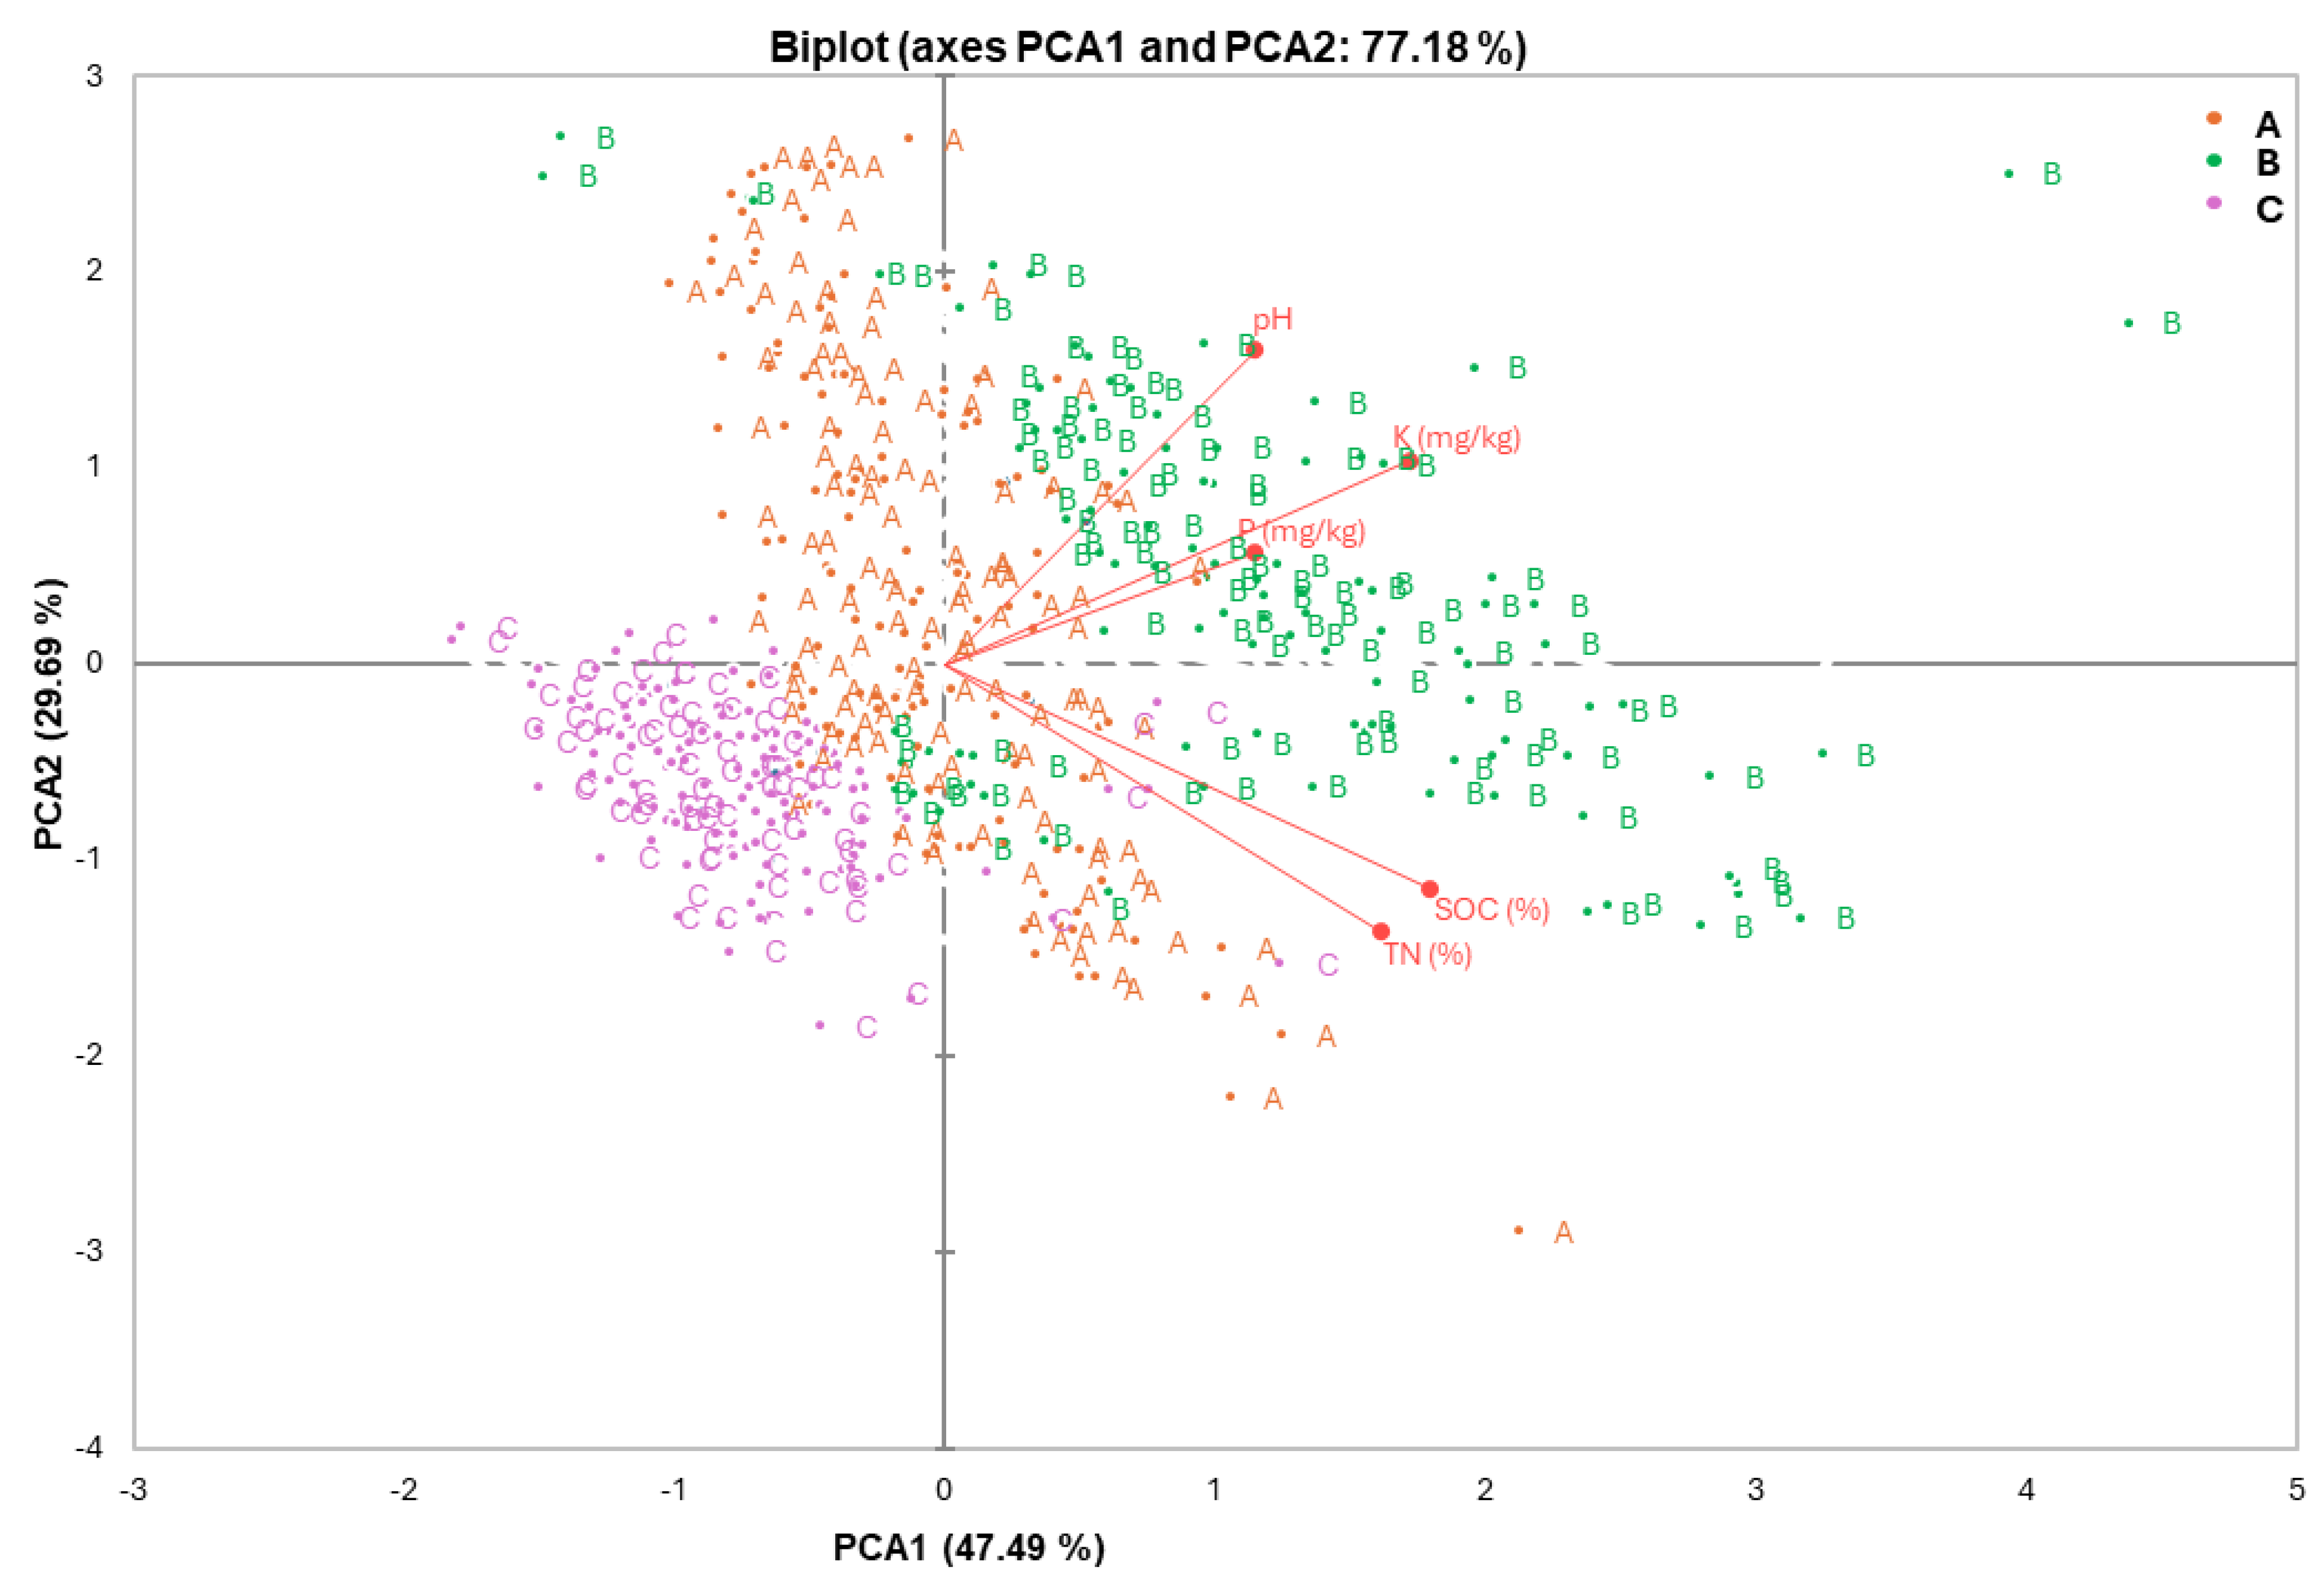
Table 1). To assess the variability across the sampling sites, principal component analysis (PCA) was performed. Both PCA1 and PCA2 accounted for a combined 77.18% of the total variance, with PCA1 explaining 47.49% and PCA2 explaining 29.69%. The PCA results revealed distinct clustering patterns among farms A, B and C, indicating notable spatial variability in soil properties. SOC and TN were strongly positively correlated with PCA1. In contrast, soil pH was primarily associated with PCA2, contributing significantly to variations along that component (
Figure 1). Interpretation of correlations between soil properties and microbial taxa should be considered associative rather than causative, as multiple environmental and management variables may jointly influence observed patterns.
3.2. Microbial Community Richness, Alpha and Beta Diversity
The number of clean reads and mapped reads for the 16S rRNA and ITS sequences are summarized in
Supplementary Tables S2 and S3, respectively. High-quality sequence tags from both bacterial and fungal communities were clustered into operational taxonomic units (OTUs) based on a 97% sequence similarity threshold. Refraction curves, plotted at a 95% confidence interval against the total number of sequences, revealed significant differences in bacterial and fungal richness among farms A, B and C. Alpha diversity varied significantly across the farms. For bacterial communities, farm A exhibited the highest species richness and evenness with Shannon and Simpson indices of 0.15 ± 0.05 (
p < 0.01). In contrast farms B and C displayed lower evenness with Simpson values of 0.45 ± 0.10 and 0.65 ± 0.08 (
p < 0.01), respectively. Similarly, fungal communities in farm A showed higher diversity and evenness, as reflected by a Simpson index of 0.20 ± 0.03 (
p < 0.05). Farm B (0.50 ± 0.07) and farm C (0.70 ± 0.05) exhibited significantly reduced fungal evenness and diversity. Beta diversity analysis revealed a distinct clustering of microbial communities by the farms, indicating significant compositional differences. The Bray–Curtis index averaged 0.28 ± 0.05 (
p < 0.01) for bacterial and 0.55 ± 0.07 (
p < 0.01) for fungal communities, reflecting farm-specific community profiles (
Supplementary Figure S3).
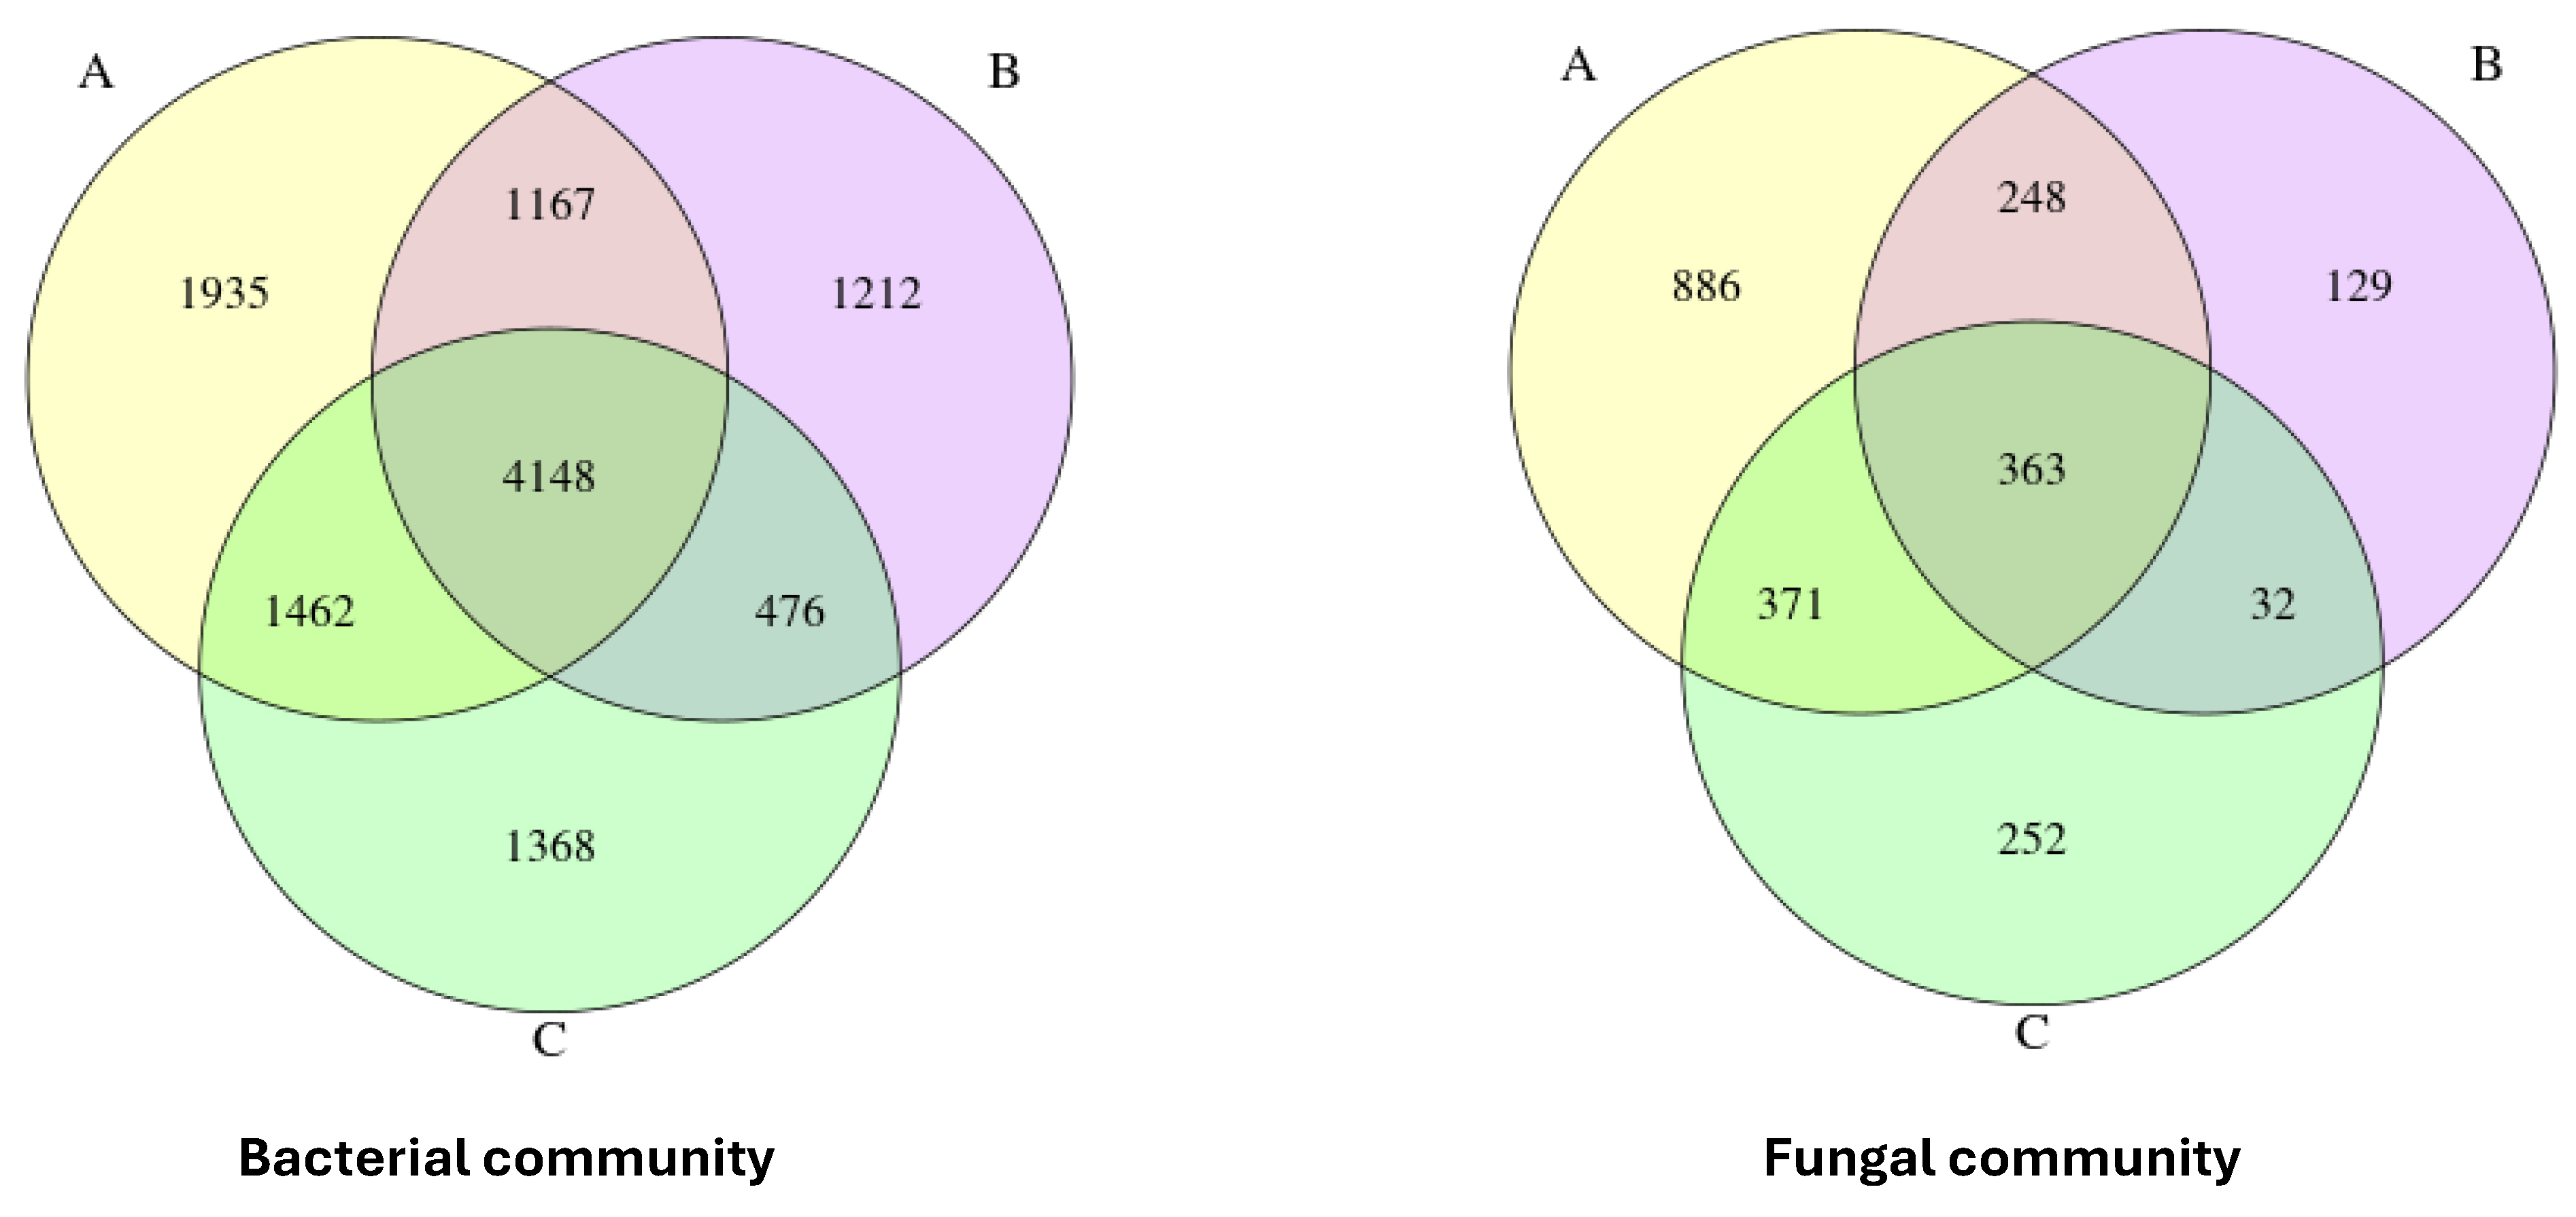
Based on observed species richness, rarefaction curves were constructed, and Venn diagrams were generated to visualize microbial community overlaps. A relatively distinct bacterial community structure was observed among the farms, with OTU counts of 1935 in farm A, 1212 in farm B, and 1368 in farm C. A total of 4148 OTUs were shared across all farms, and the Jaccard similarity index of 0.72 suggested a moderately homogeneous bacterial community structure across the sites. Furthermore, the fungal community exhibited greater heterogeneity, with unique OTUs observed in farm A (886), farm B (129) and farm C (225), while only 363 OTUs were shared across all three sites. The resulting Jaccard similarity index of 0.45 reflects a more distinct and heterogeneous structure (
Figure 2). Sequencing depth and rarefaction analyses indicated sufficient coverage to capture the majority of microbial diversity present within samples.
3.3. Microbial Community Abundance and Composition
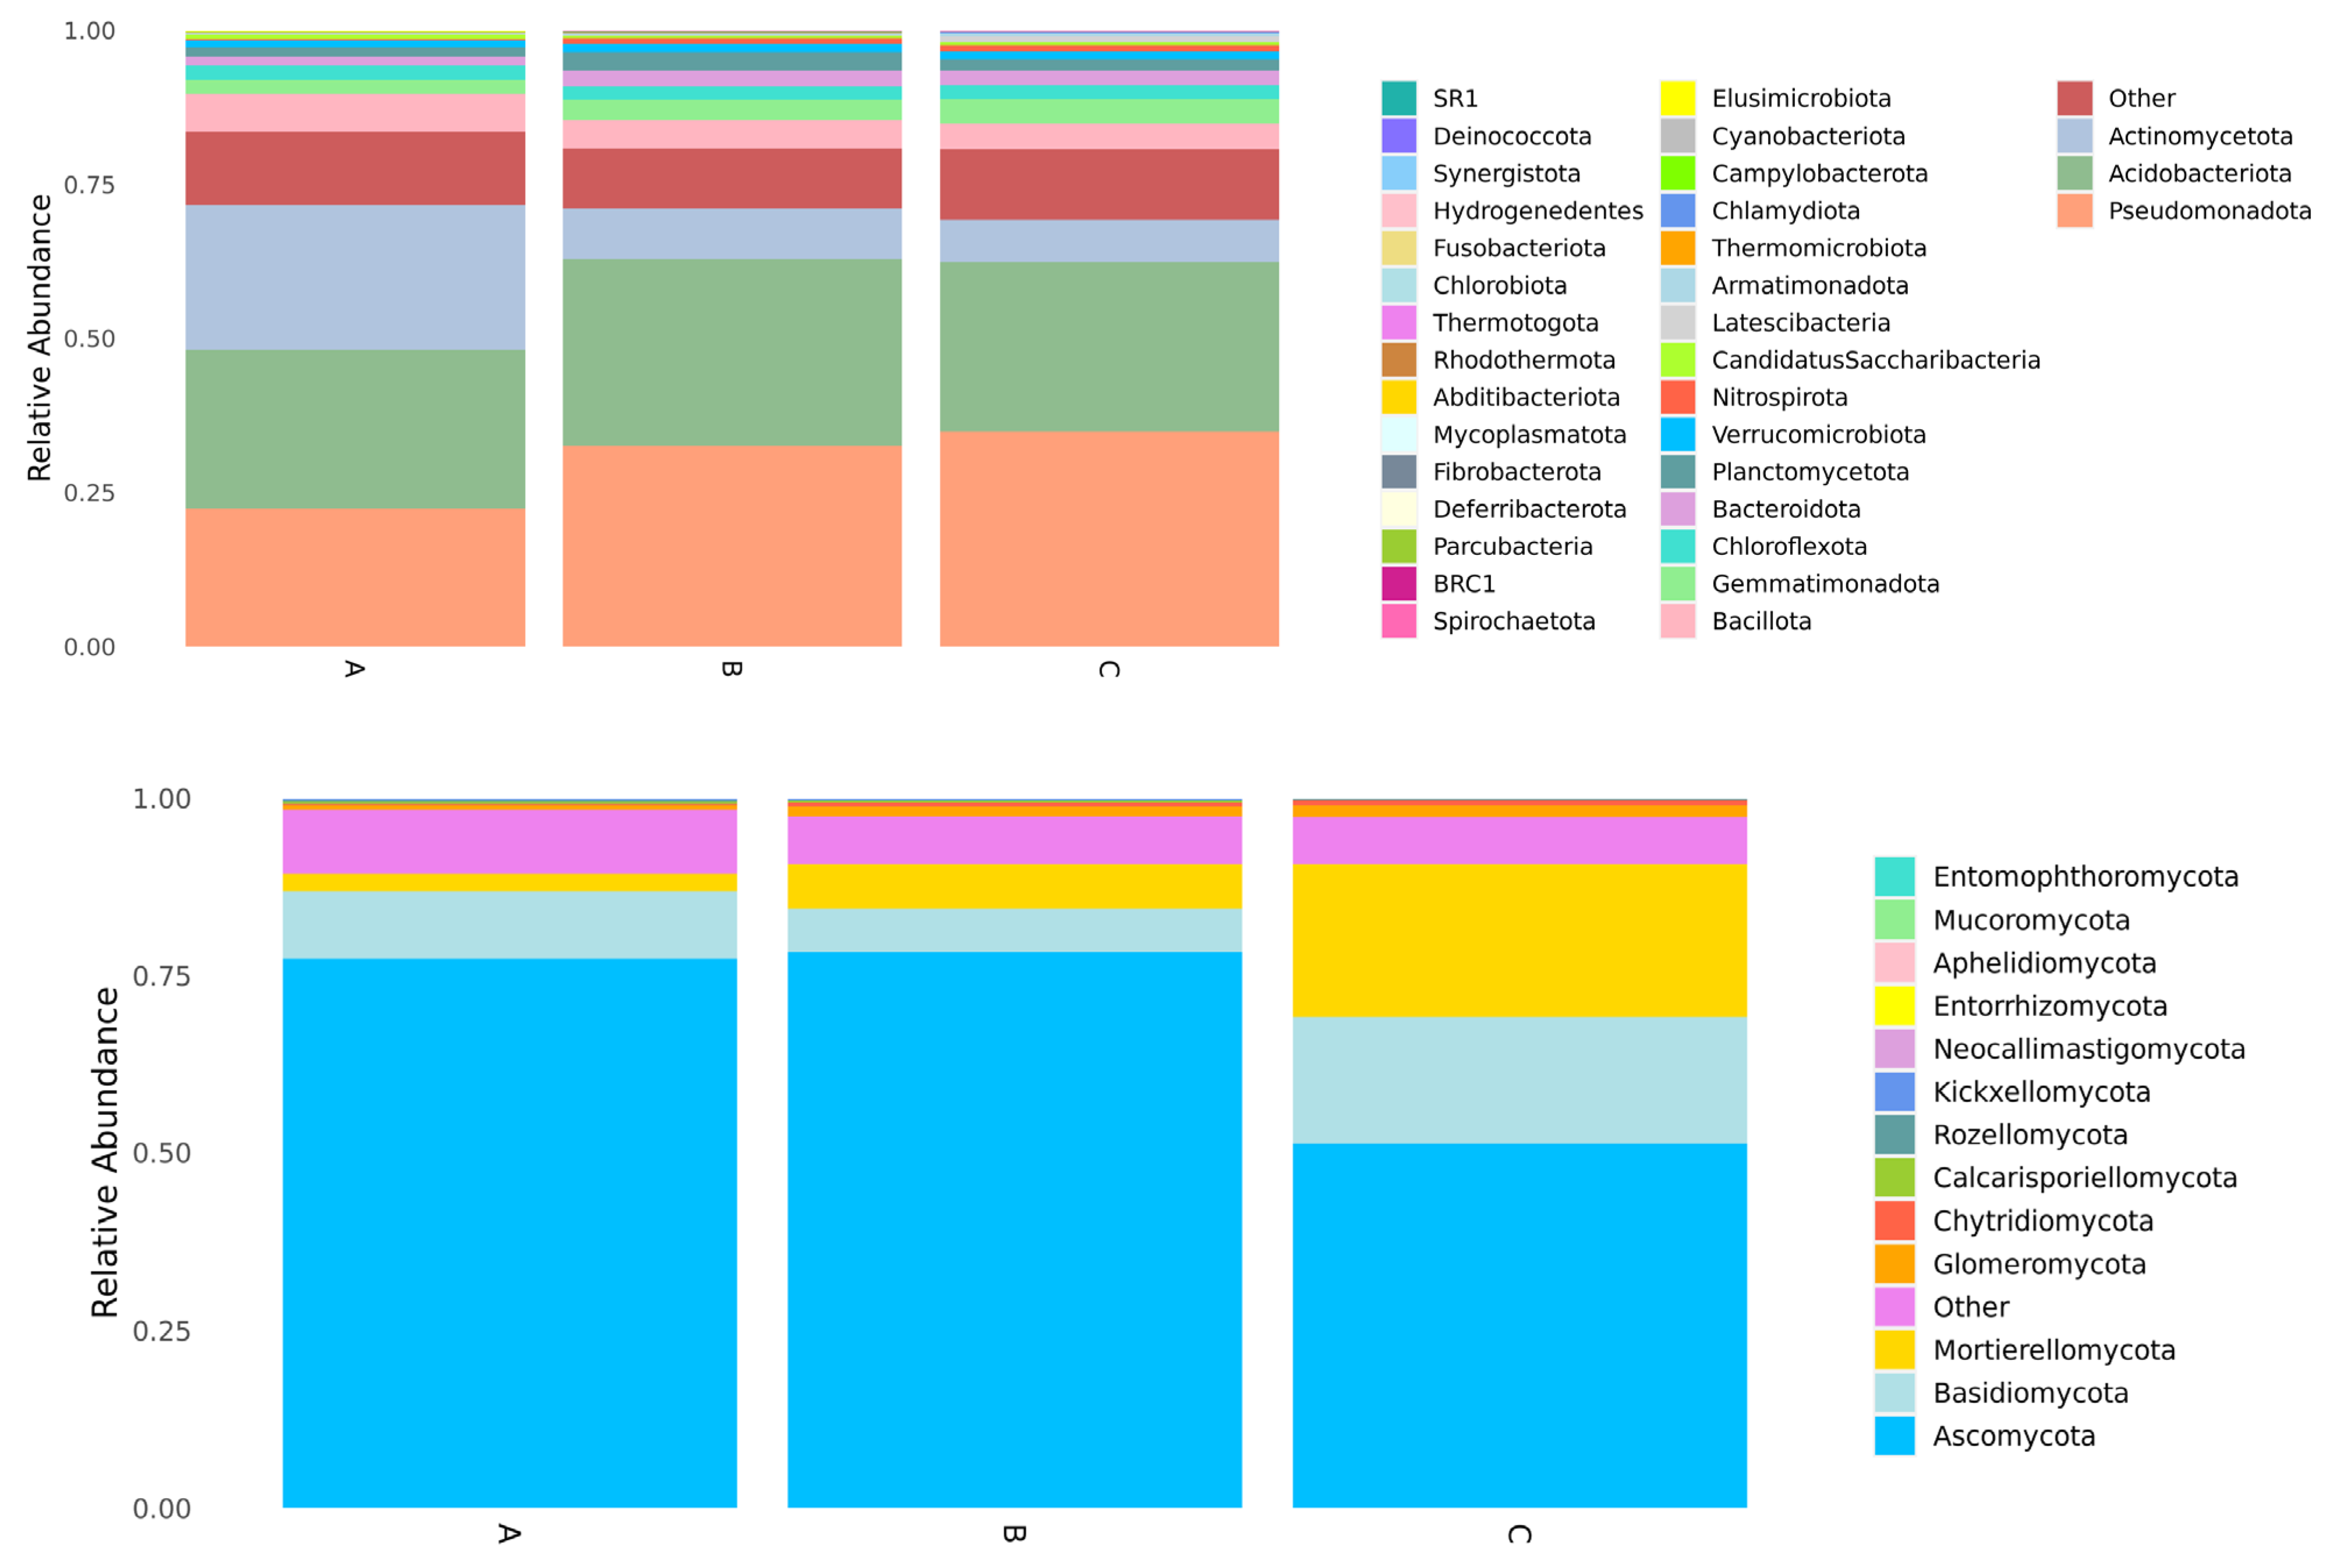
Significant variations in bacterial communities were observed across the farms. Farm A was predominantly occupied by the Phylum Actinomycetota, whereas farms B and C showed a higher abundance of Pseudomonadota and Acidobacteriota. Minor presence of Bacillota and Bacteroidota was recorded across all three farms (
Figure 3). At the order level Hypomicrobiales dominated all farms, followed by Sphingomonadales and Rhodospirillales, particularly in farms B and C. The family Sphingomonadaceae was most abundant in farm B, followed by farms A and C. Gemmatimonadaceae and Bradyrhizobiaceae were consistently dominant across all sites. At the genus level,
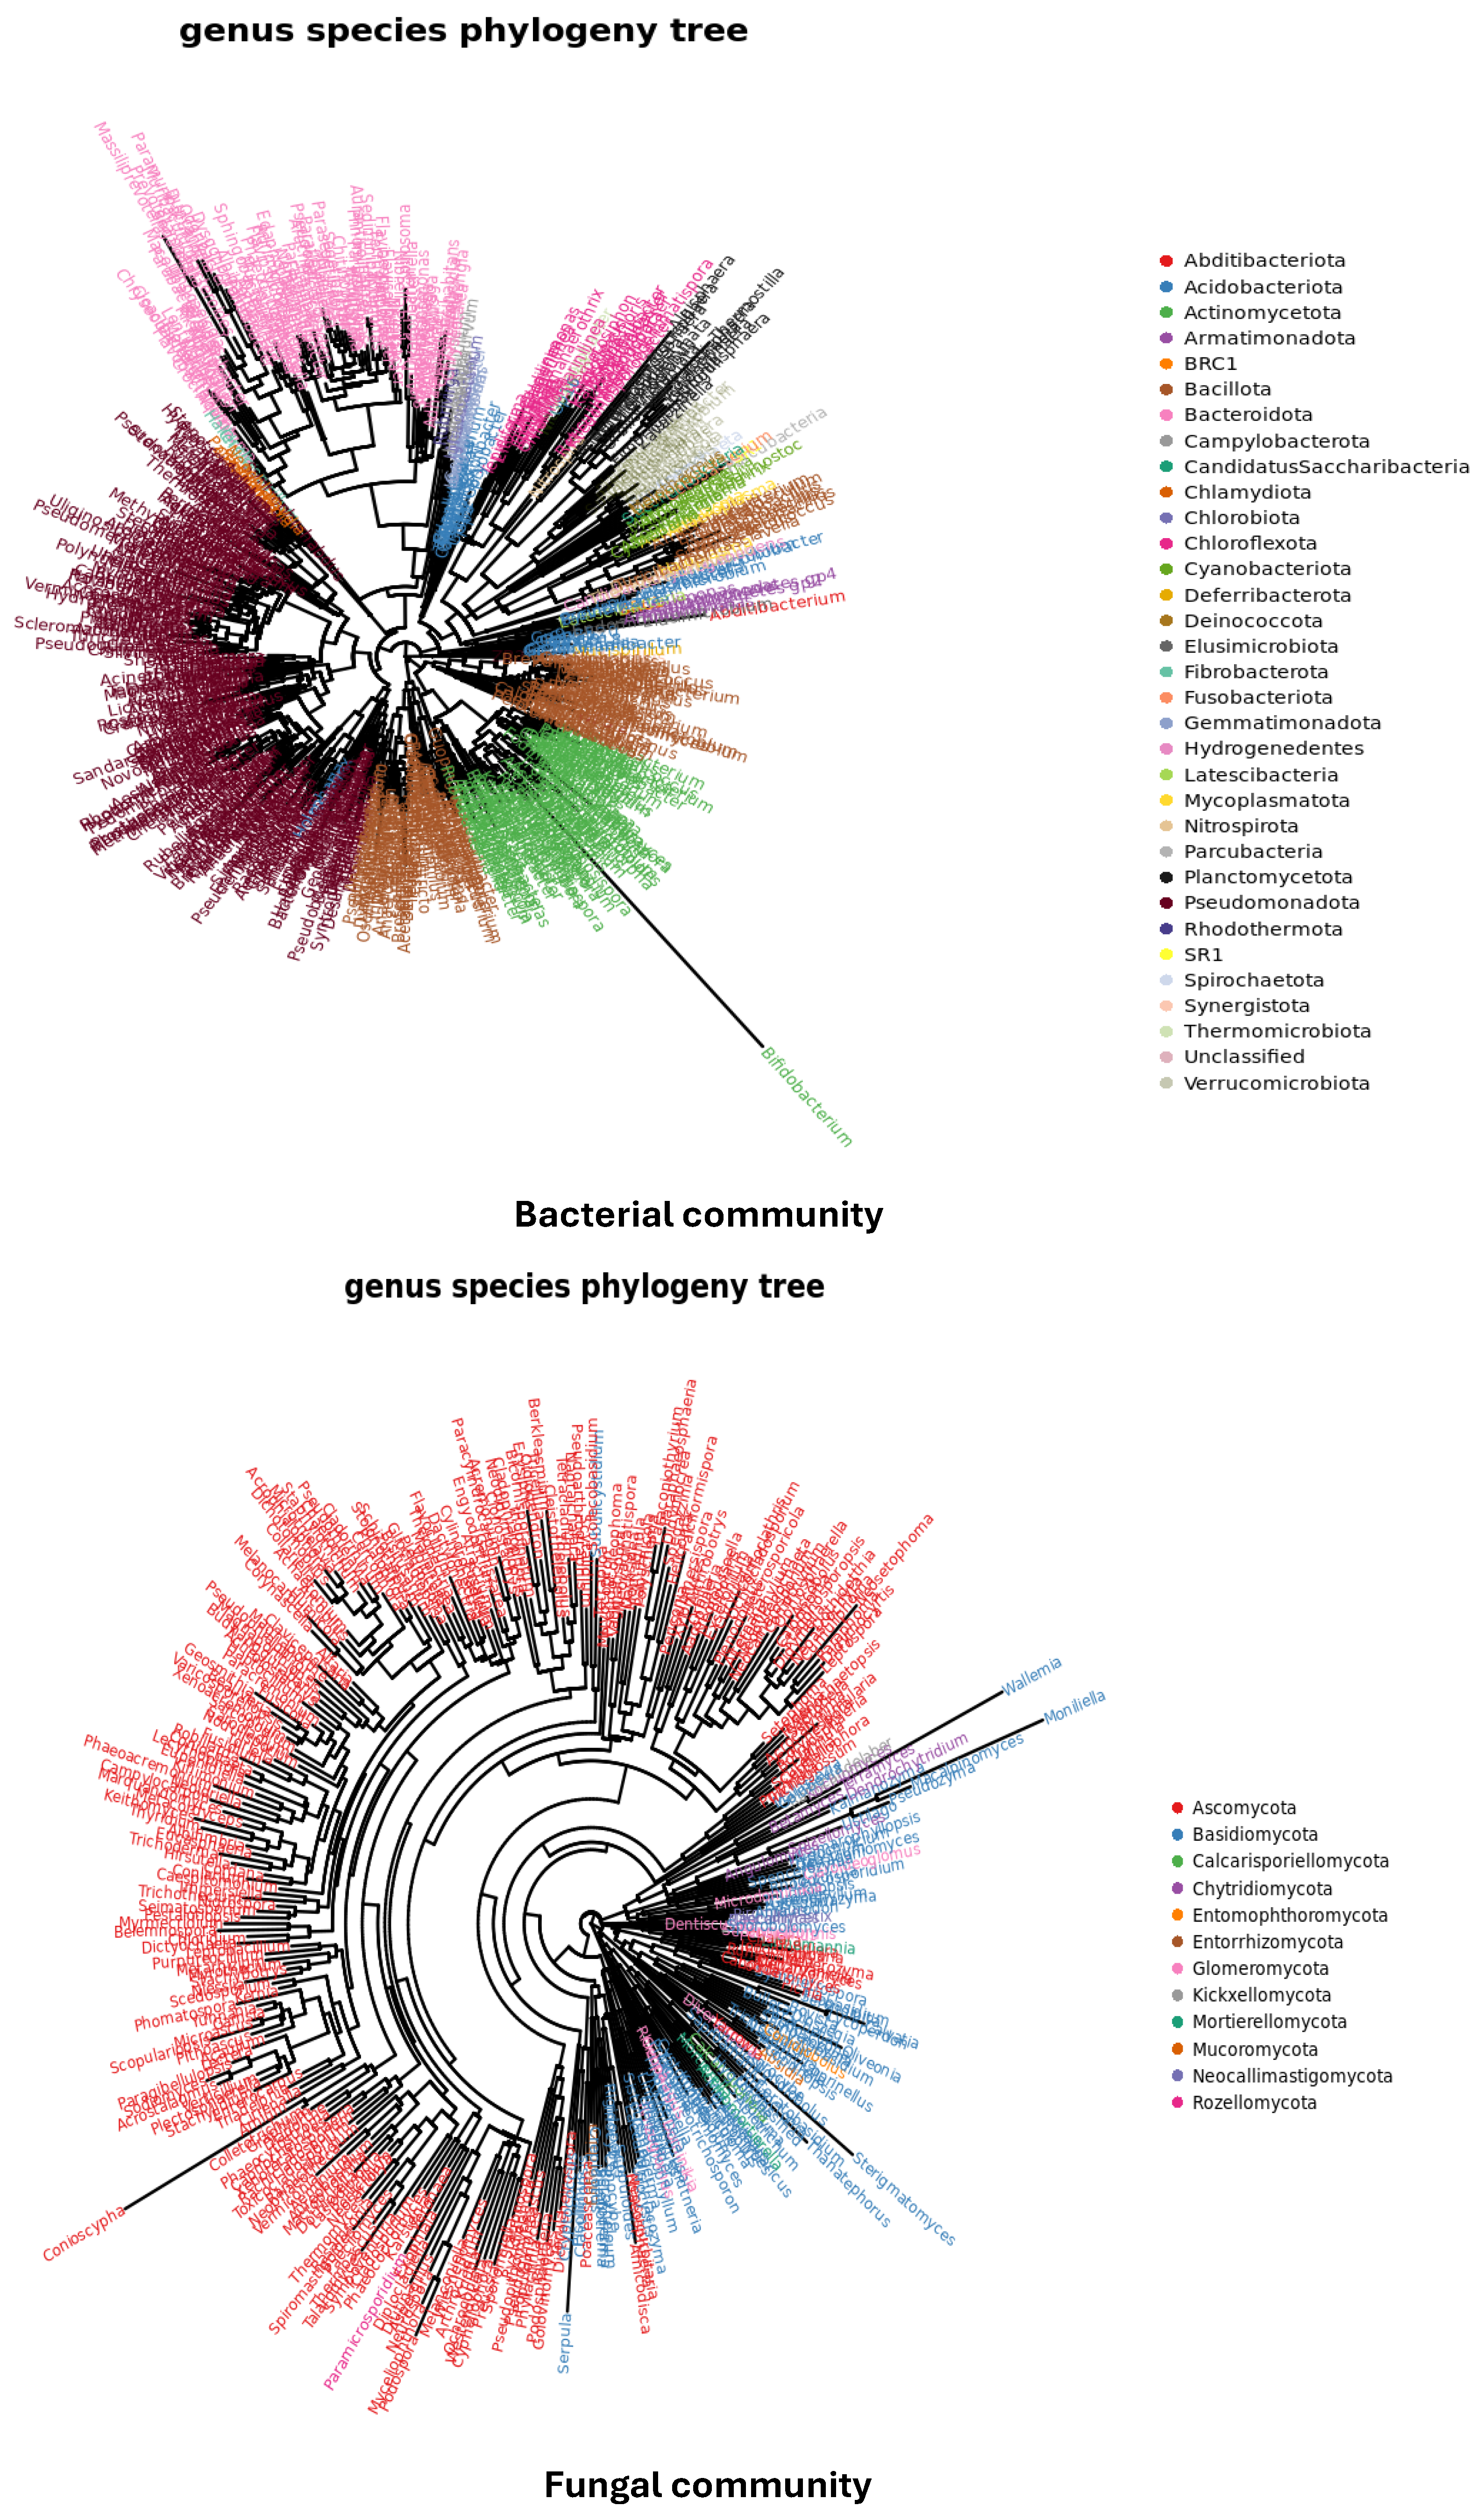
Sphingomonas (Sphingomonadaceae) was notably abundant in farm B, followed by A and C. Phylogenetic trees constructed using reference sequences from NCBI showed 30 dominant bacterial phyla, with a relative abundance ranging from 95.5 to −98.9% (
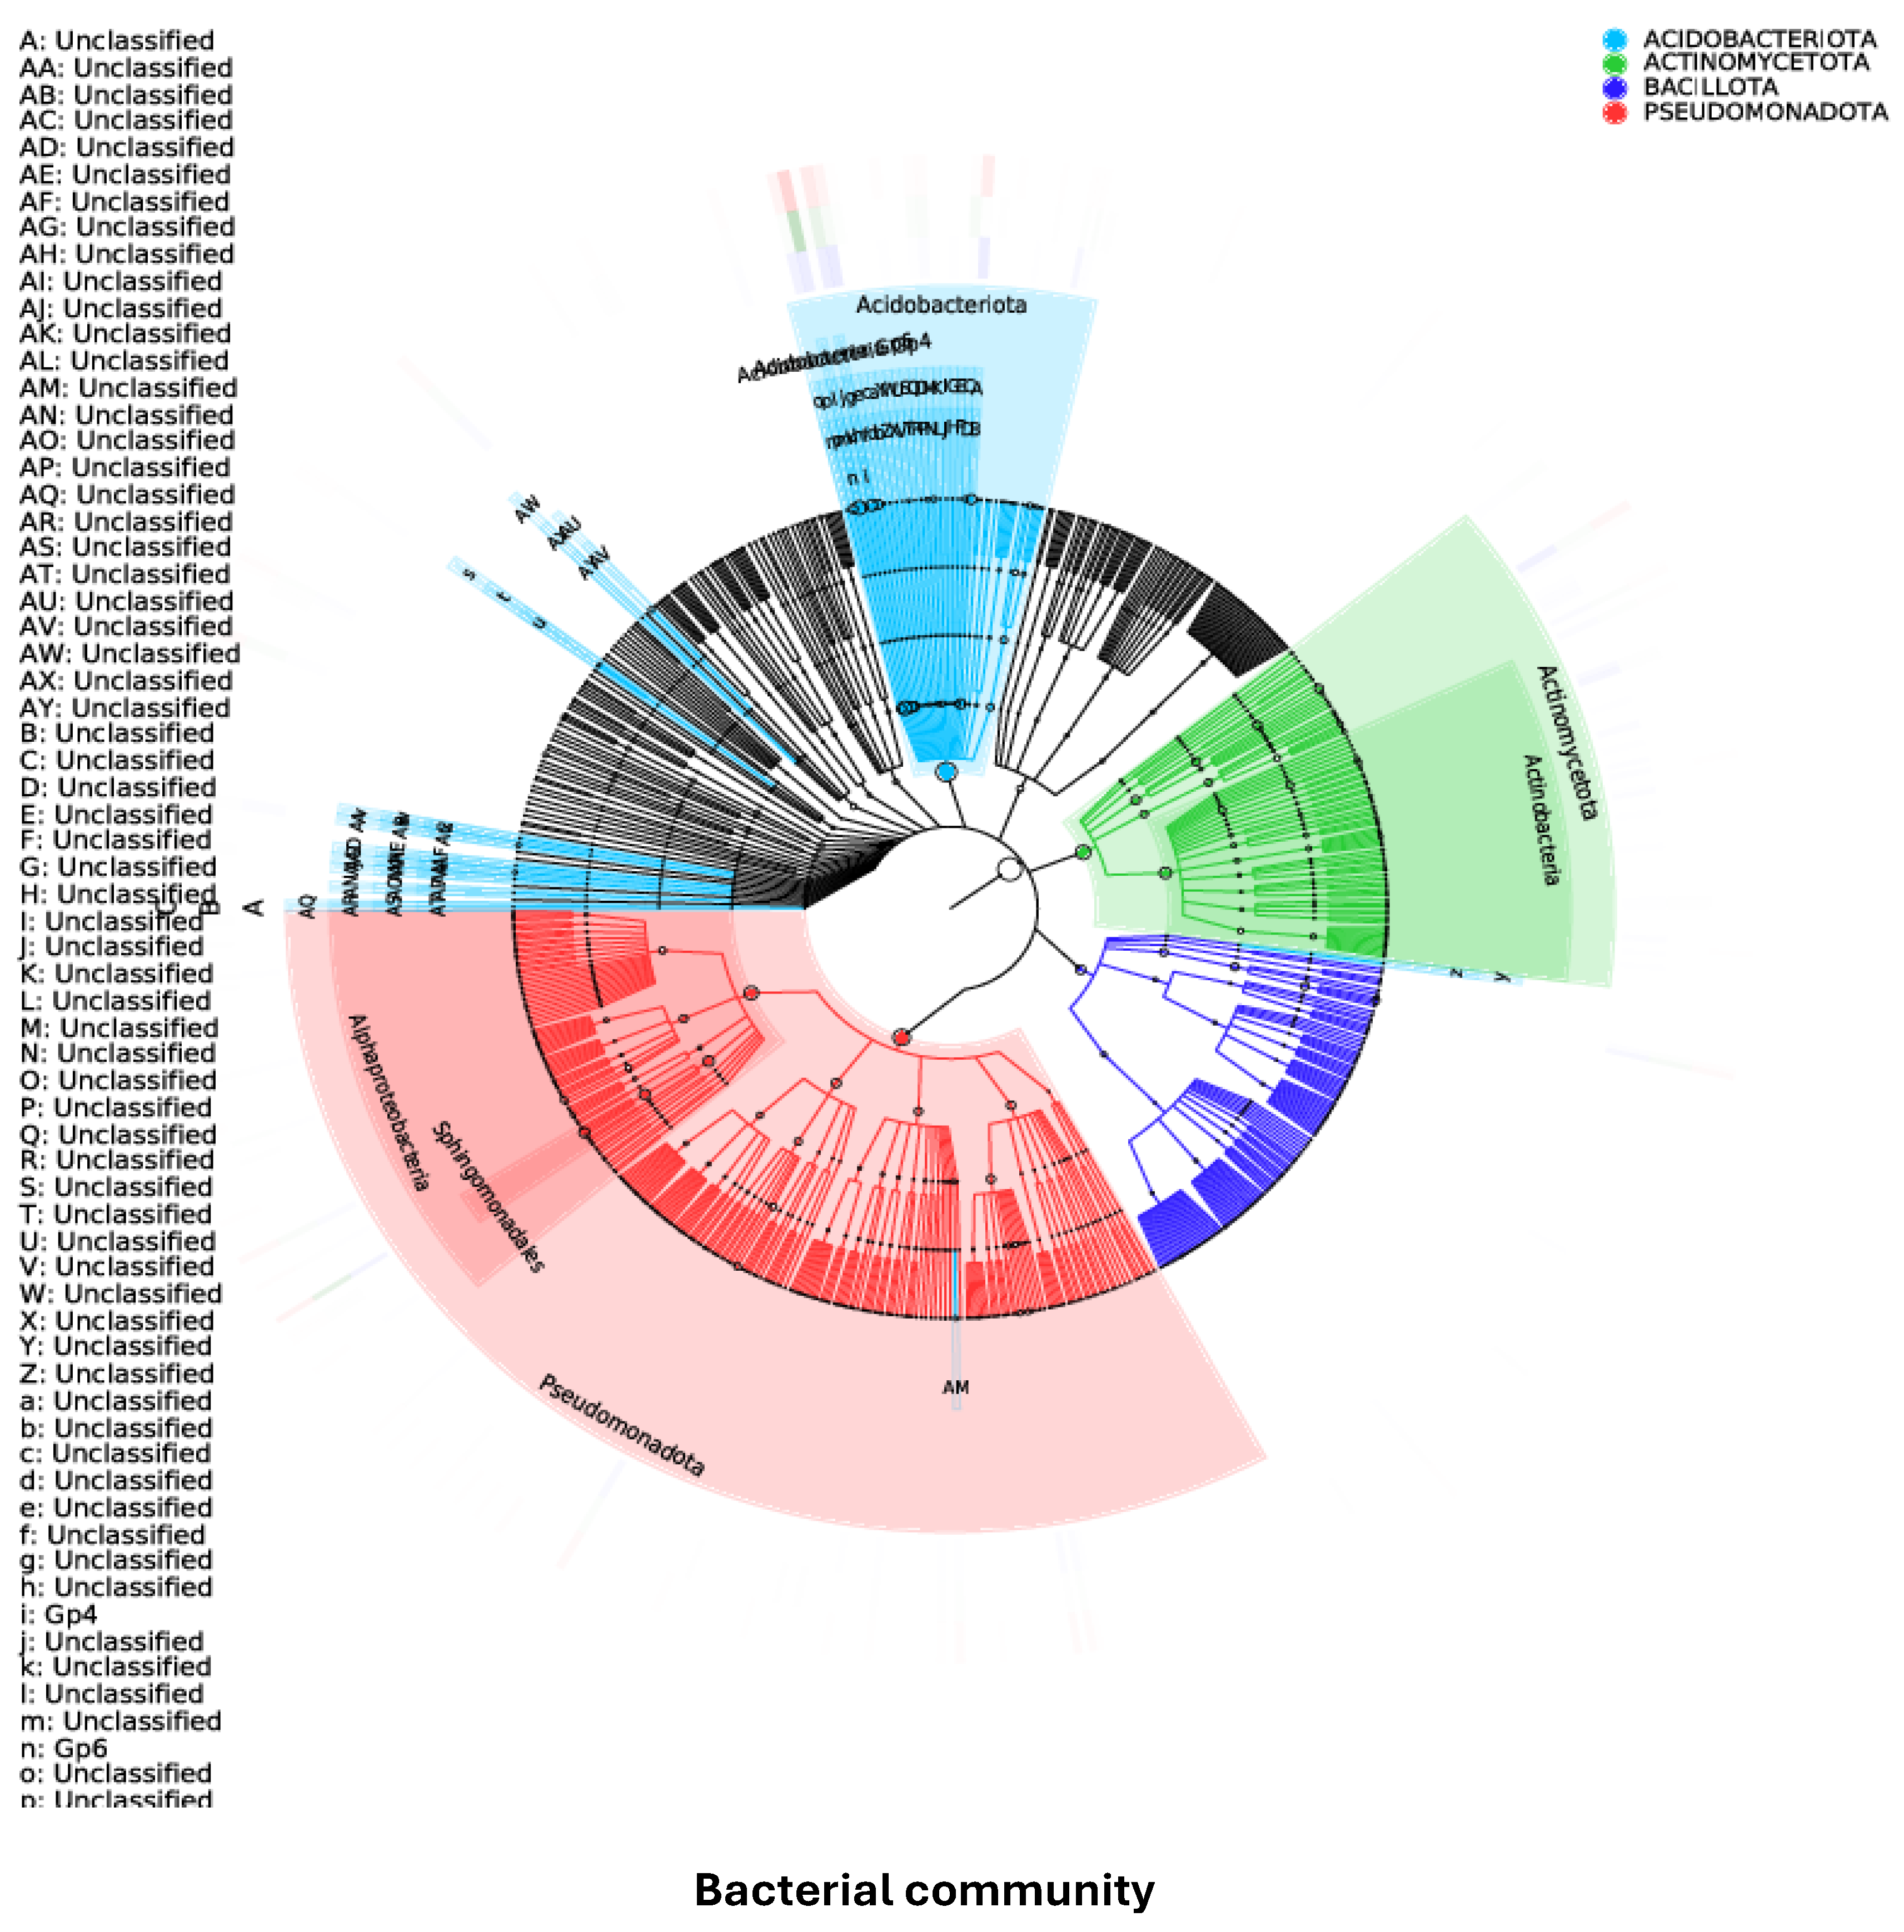
Figure 4). A cladogram based on linear discriminant analysis (LDA) effect size scores > 3.0 indicated that Acidobacteriota, Actinomycetota, Bacillota and Pseudomonadota were the most enriched phyla across the farms (
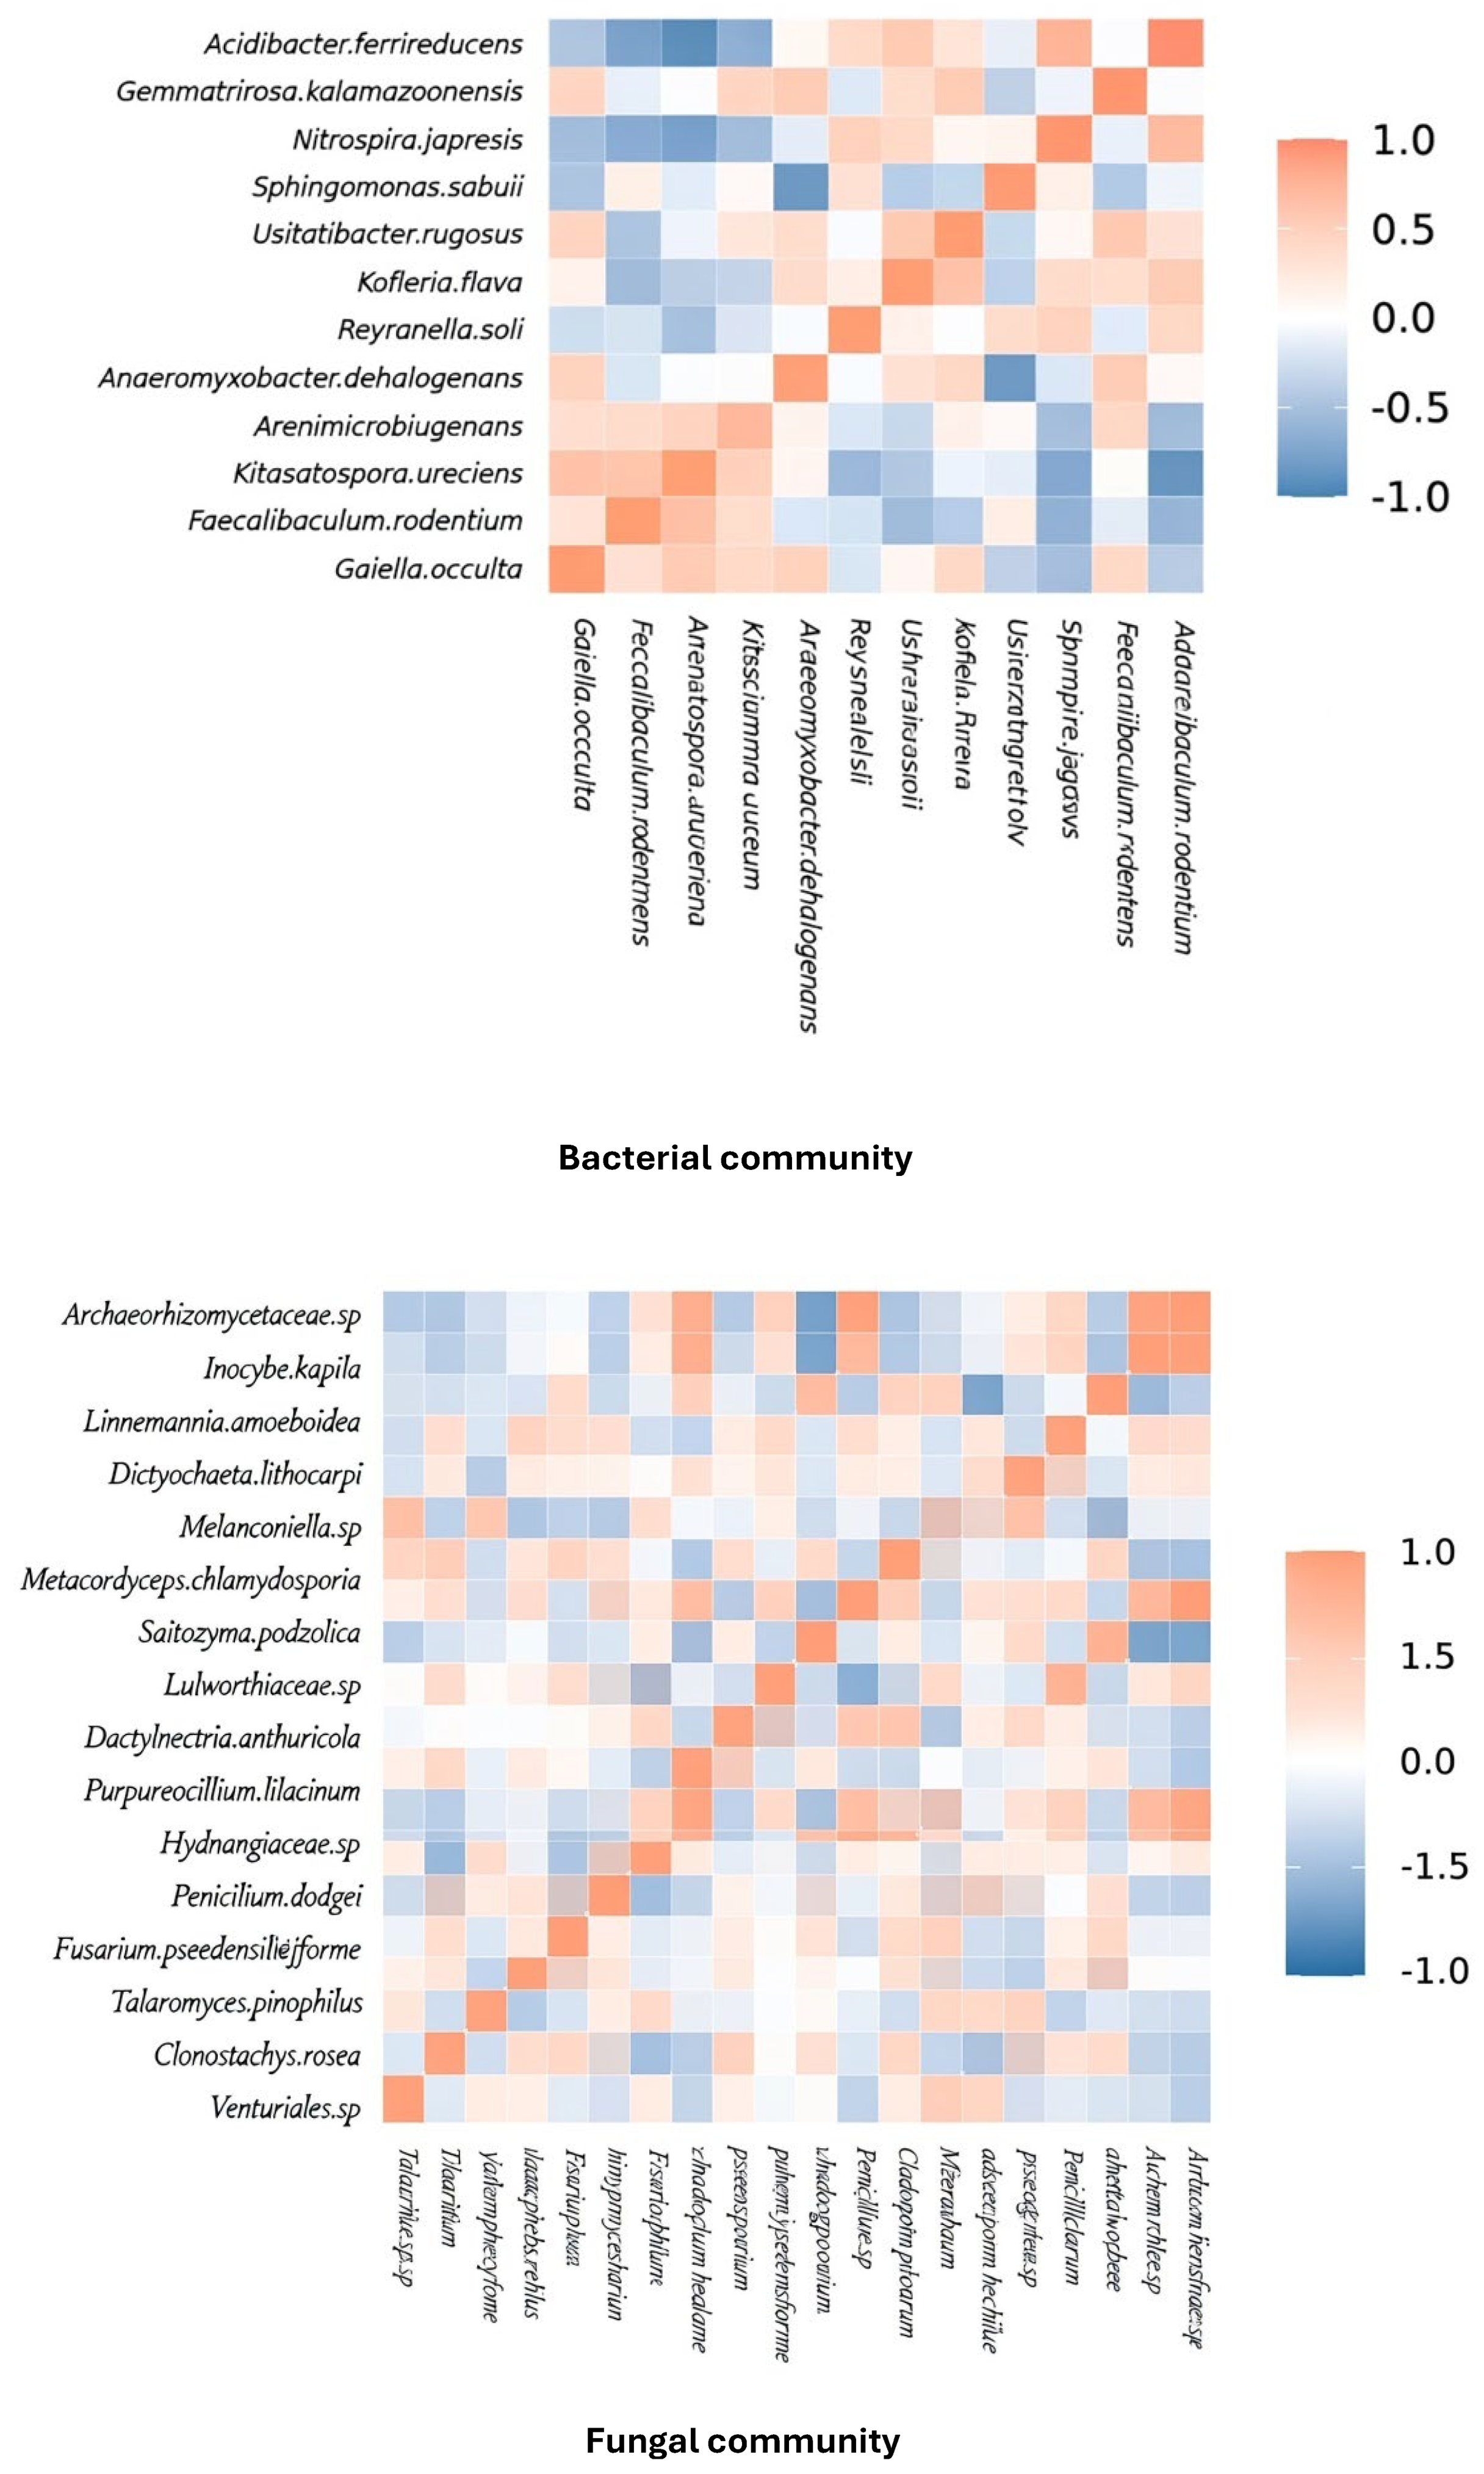
Figure 5). A correlation heatmap was generated to assess relationships among twelve bacterial genera:
Acidibacter ferrireducens,
Gemmatimonas kalamazoonensis,
Nitrospira japonica,
Sphingomonas sabuli,
Ustitabacter rugosus,
Kofleria flava,
Reyranella soli,
Anaeromyxobacter dehalogenans,
Arenimicrobium luteum,
Kitatatospora aureofaciens,
Faecalibaculum rodentium and
Gaiella occulta (
Figure 6). Notably,
Gemmatimonas kalamazoonensis exhibited a positive correlation (r = 0.5) with
Acidibacter ferrirducens, whereas
Nitrospira japonica showed a negative correlation (r = −0.5) with
Faecalibaculum rodentium.
Fungal community structures also showed clear distinctions. The phylum Ascomycota overwhelmingly dominated in farms A and B, followed by farm C. Basidiomycota was more abundant in farm C, followed by A and B. Mortierellomycota was highly represented in farm C, moderate in farm B and the least in farm A (
Figure 3). Within Ascomycota, the orders Hypocreales and Eurotiales were prominent, with Hypocreales being dominant in farm B. The order Mortierellales was highly abundant in farm C. Basidiomycota members, such as Agaricales, were also enriched in farm C. At the family level, Mortierellaceae and Nectriaceae were predominant in farm C, followed by B and A. Aspergillaceae were most abundant in farm A, followed by C and B. Dominant genera included
Fusarium in farms B and C,
Penicillium in farms A and C, and
Clonostachys in farm B. The phylogenetic tree was constructed to elucidate the evolutionary relationships, where 12 main phyla were observed for fungal communities (
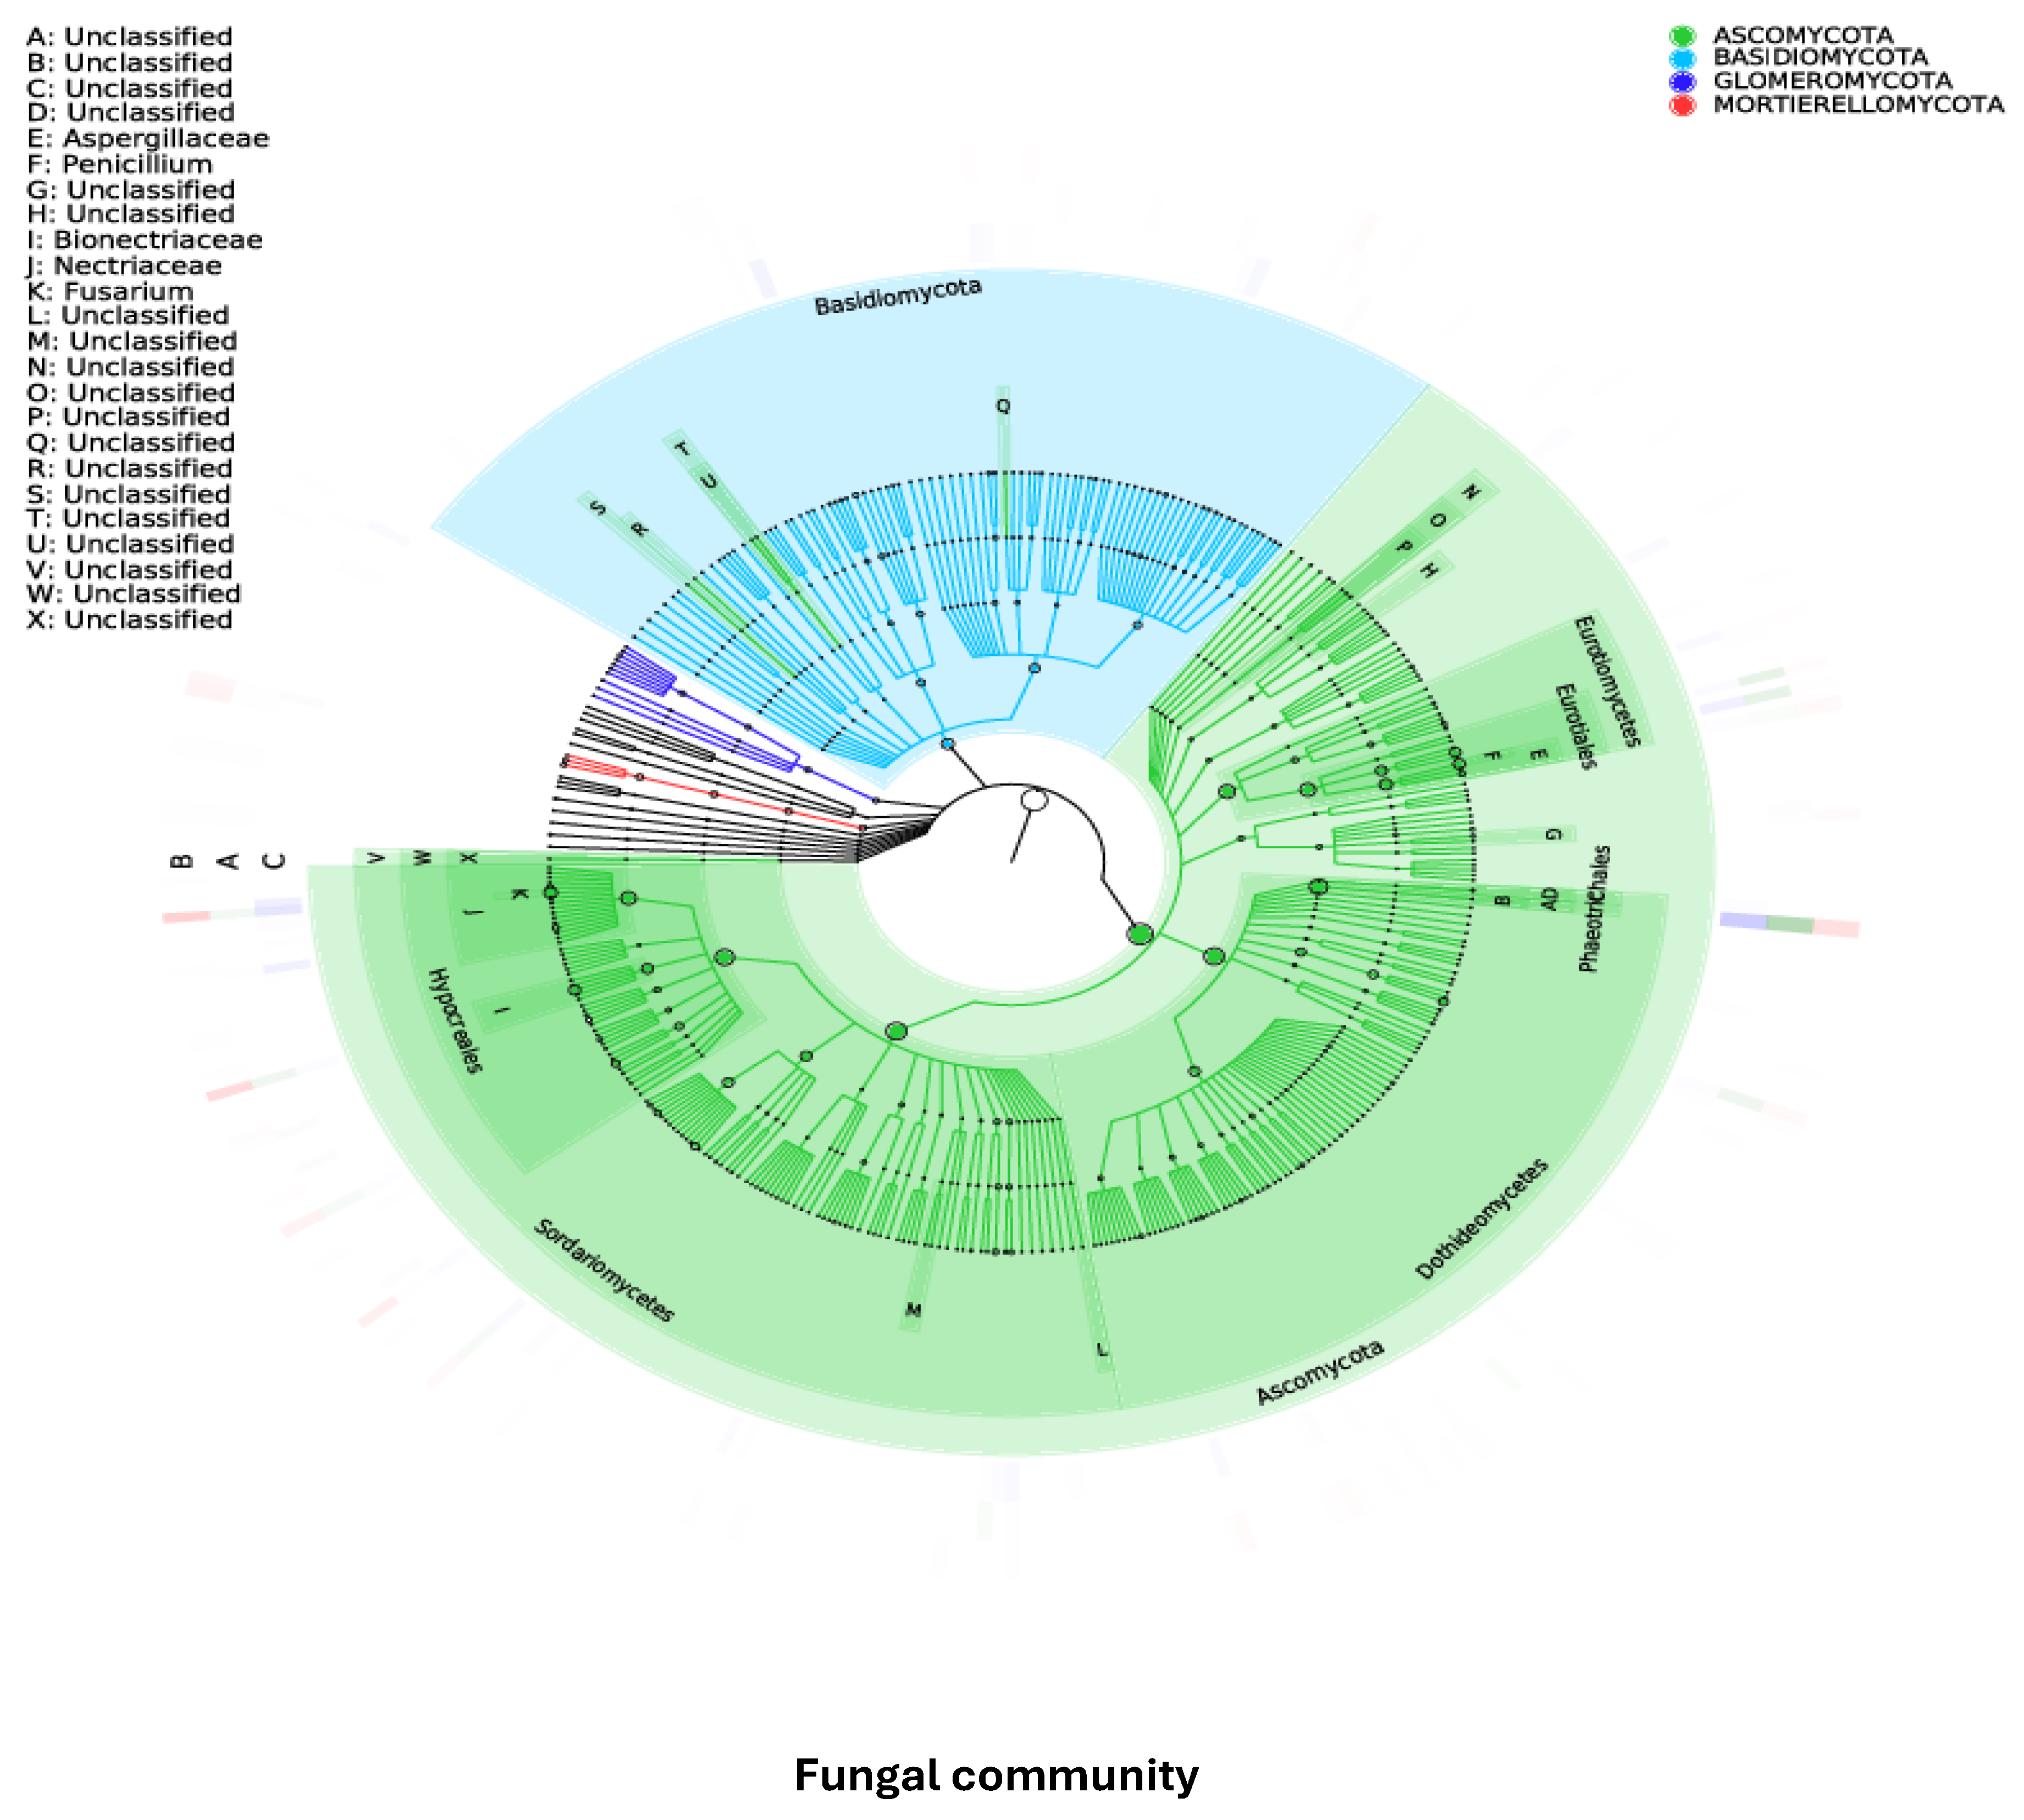
Figure 4). LDA-based cladogram analysis (LDA effect size >3.0) highlighted significant enrichment of Ascomycota, Basidiomycota, Glomeromycota, and Mortierellomycota across all farms (
Figure 5). A heatmap displayed pairwise Pearson correlation coefficients among seventeen fungal taxa:
Archaeorhizomycetaceae sp.,
Inocybe kapila,
Linnemannia amoeboidea,
Dictyochaeta lithocarpi,
Melanoconiella sp.,
Metacordyceps chlamydospora,
Saitozyma podzolica,
Lulworthiaceae sp.,
Dactylonectria anthuriicola,
Purpureocillium lilacinum,
Hyphangiacae sp.,
Penicillium dodget,
Fusarium pseudensiforme,
Cladosporium herbarum,
Talaromyces pinophilus,
Clonostachys rosea and
Venturiales sp. (
Figure 6). Quantitative analysis revealed significant insight into fungal community structure and interactions; for instance,
Penicillium spp. and
Fusarium pseudensiforme exhibit a strong positive correlation (0.8), and
Cladosporium herbarum shows a negative correlation (−0.6) with
Talaromyces pinophilus. 3.4. Microbial Community and Soil Indicator Correlation
Bacterial communities across the three farms were strongly influenced by soil physical and chemical properties, including texture, pH and nutrient content at different sampling sites. In farm A, the high clay content (56.79%), with a slightly acidic to neutral pH (6.78), and elevated Fe levels created favorable conditions for the dominance of the phylum Actinomycetota. Farm B, characterized by more alkaline soils pH (7.39) and very high CEC (43.37 cmolc/kg), had elevated levels of available P (151.36 mg/kg) and K (943.52 mg/kg), conditions that strongly favored the phylum Pseudomonadota, particularly members of the family Sphingomonadaceae and the genus Sphingomonas. In contrast, farm C exhibited highly acidic soils (pH5.88) and the lowest CEC (20.13 cmolc/kg), resulting in significantly reduced TN (0.11%) and P (28.02 mg/kg) levels, which created an environment for Acidobacteriota. Across all farms, A, B and C, clay-rich soils consistently supported Hypomicrobiales and the strong positive correlation between SOC and TN (r = 0.92, p < 0.01), the key bacterial community drivers favoring Bradyrhizobiaceae.
Fungal communities were equally organized by soil physical and chemical parameters, including pH, SOC, and availability of P, K and Mg. Farm A was observed with a slightly acidic to neutral value of pH (6.78), which elevated Fe levels that promoted the dominance of Ascomycota, particularly taxa within the order Eurotiales and the family Aspergillaceae, including genera such as Penicillium. The neutral to alkaline pH (7.39), high CEC (43.37 cmolc/kg) and the highest level of SOC (1.64%) exhibited in farm B, which substantially raised the P and K levels, supported dominance of Ascomycota, particularly the order Hypocreales (e.g., Fusarium and Clonostachys). Meanwhile, acidic soils (pH 5.88) and a moderate level of SOC (1.25%) lowered P and K content in farm C, creating a conducive environment for Mortierellomycota and Basidiomycota (e.g., Agaricales, Mortierellales). The relationships between microbial taxa and soil parameters reflect ecological associations that may be influenced by complex soil–plant–microbe interactions and environmental variability.
3.5. Functional Gene Profile
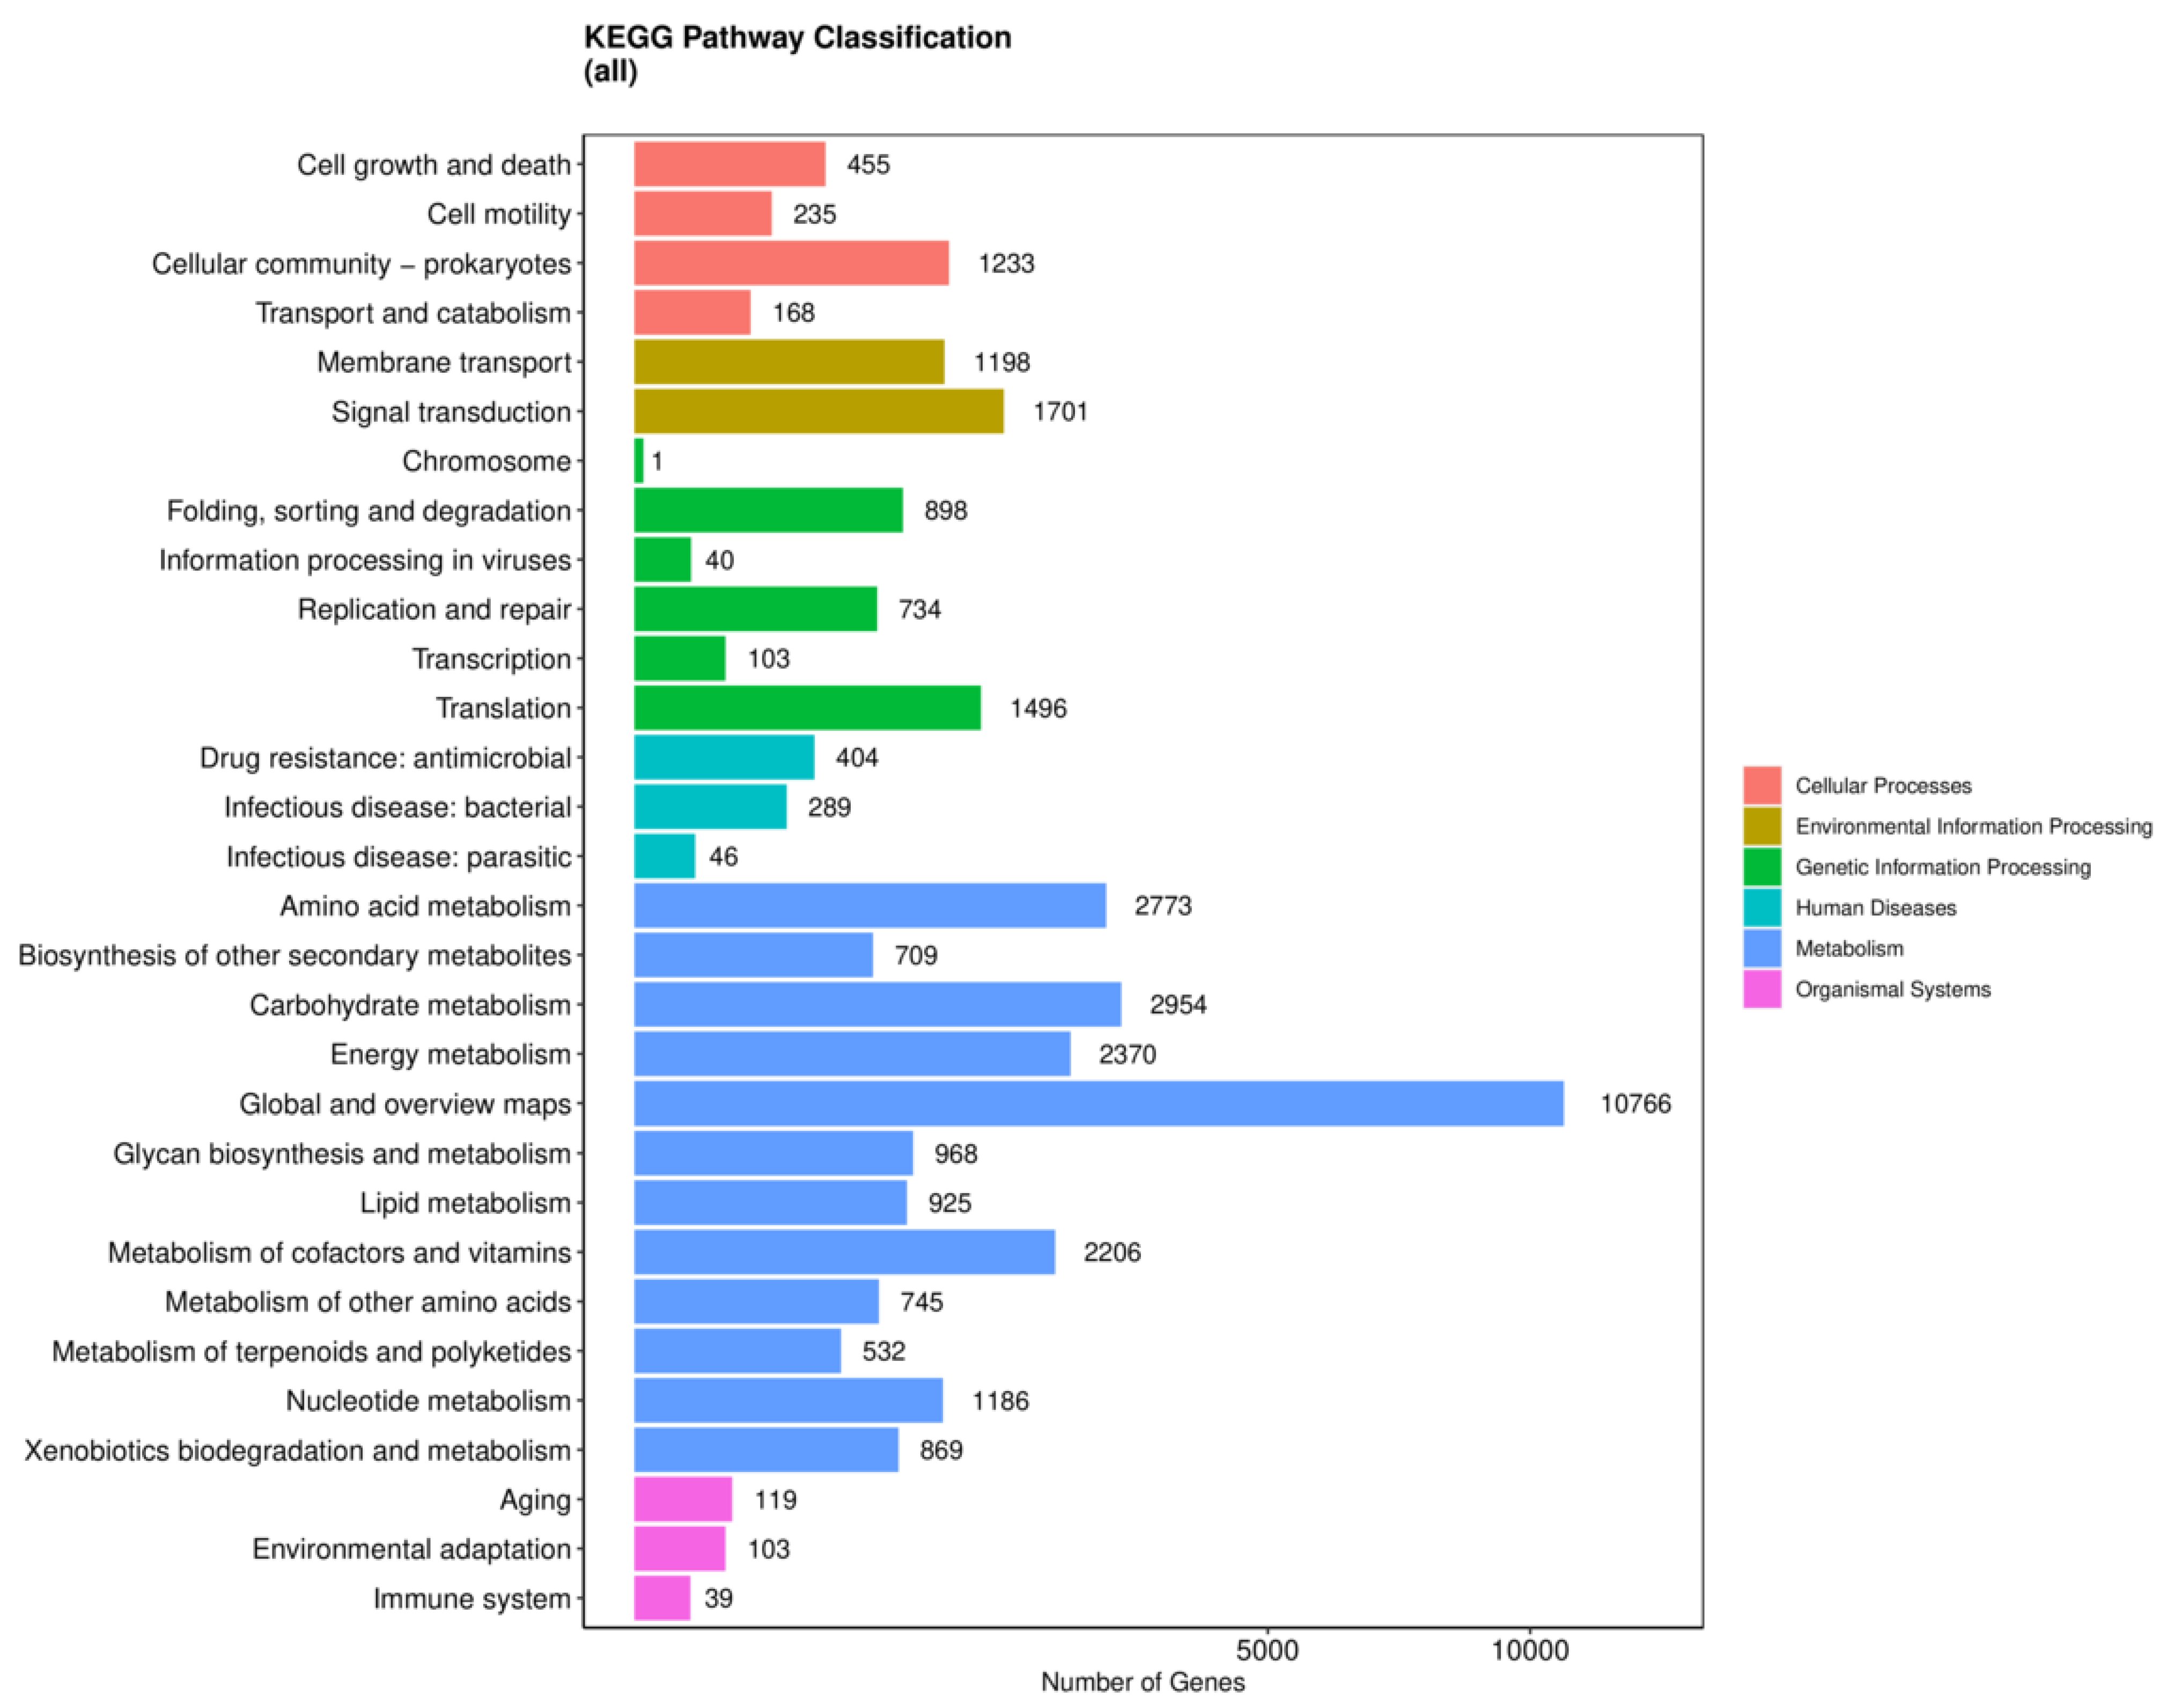
The functional categories in all the farms were analyzed to investigate the enriched functions using KEGG (Kyoto Encyclopedia of Genes and Genomes) and COG (Clusters of Orthologous Groups) that provided insight into the metabolic potential and physiological capabilities of microbial communities (
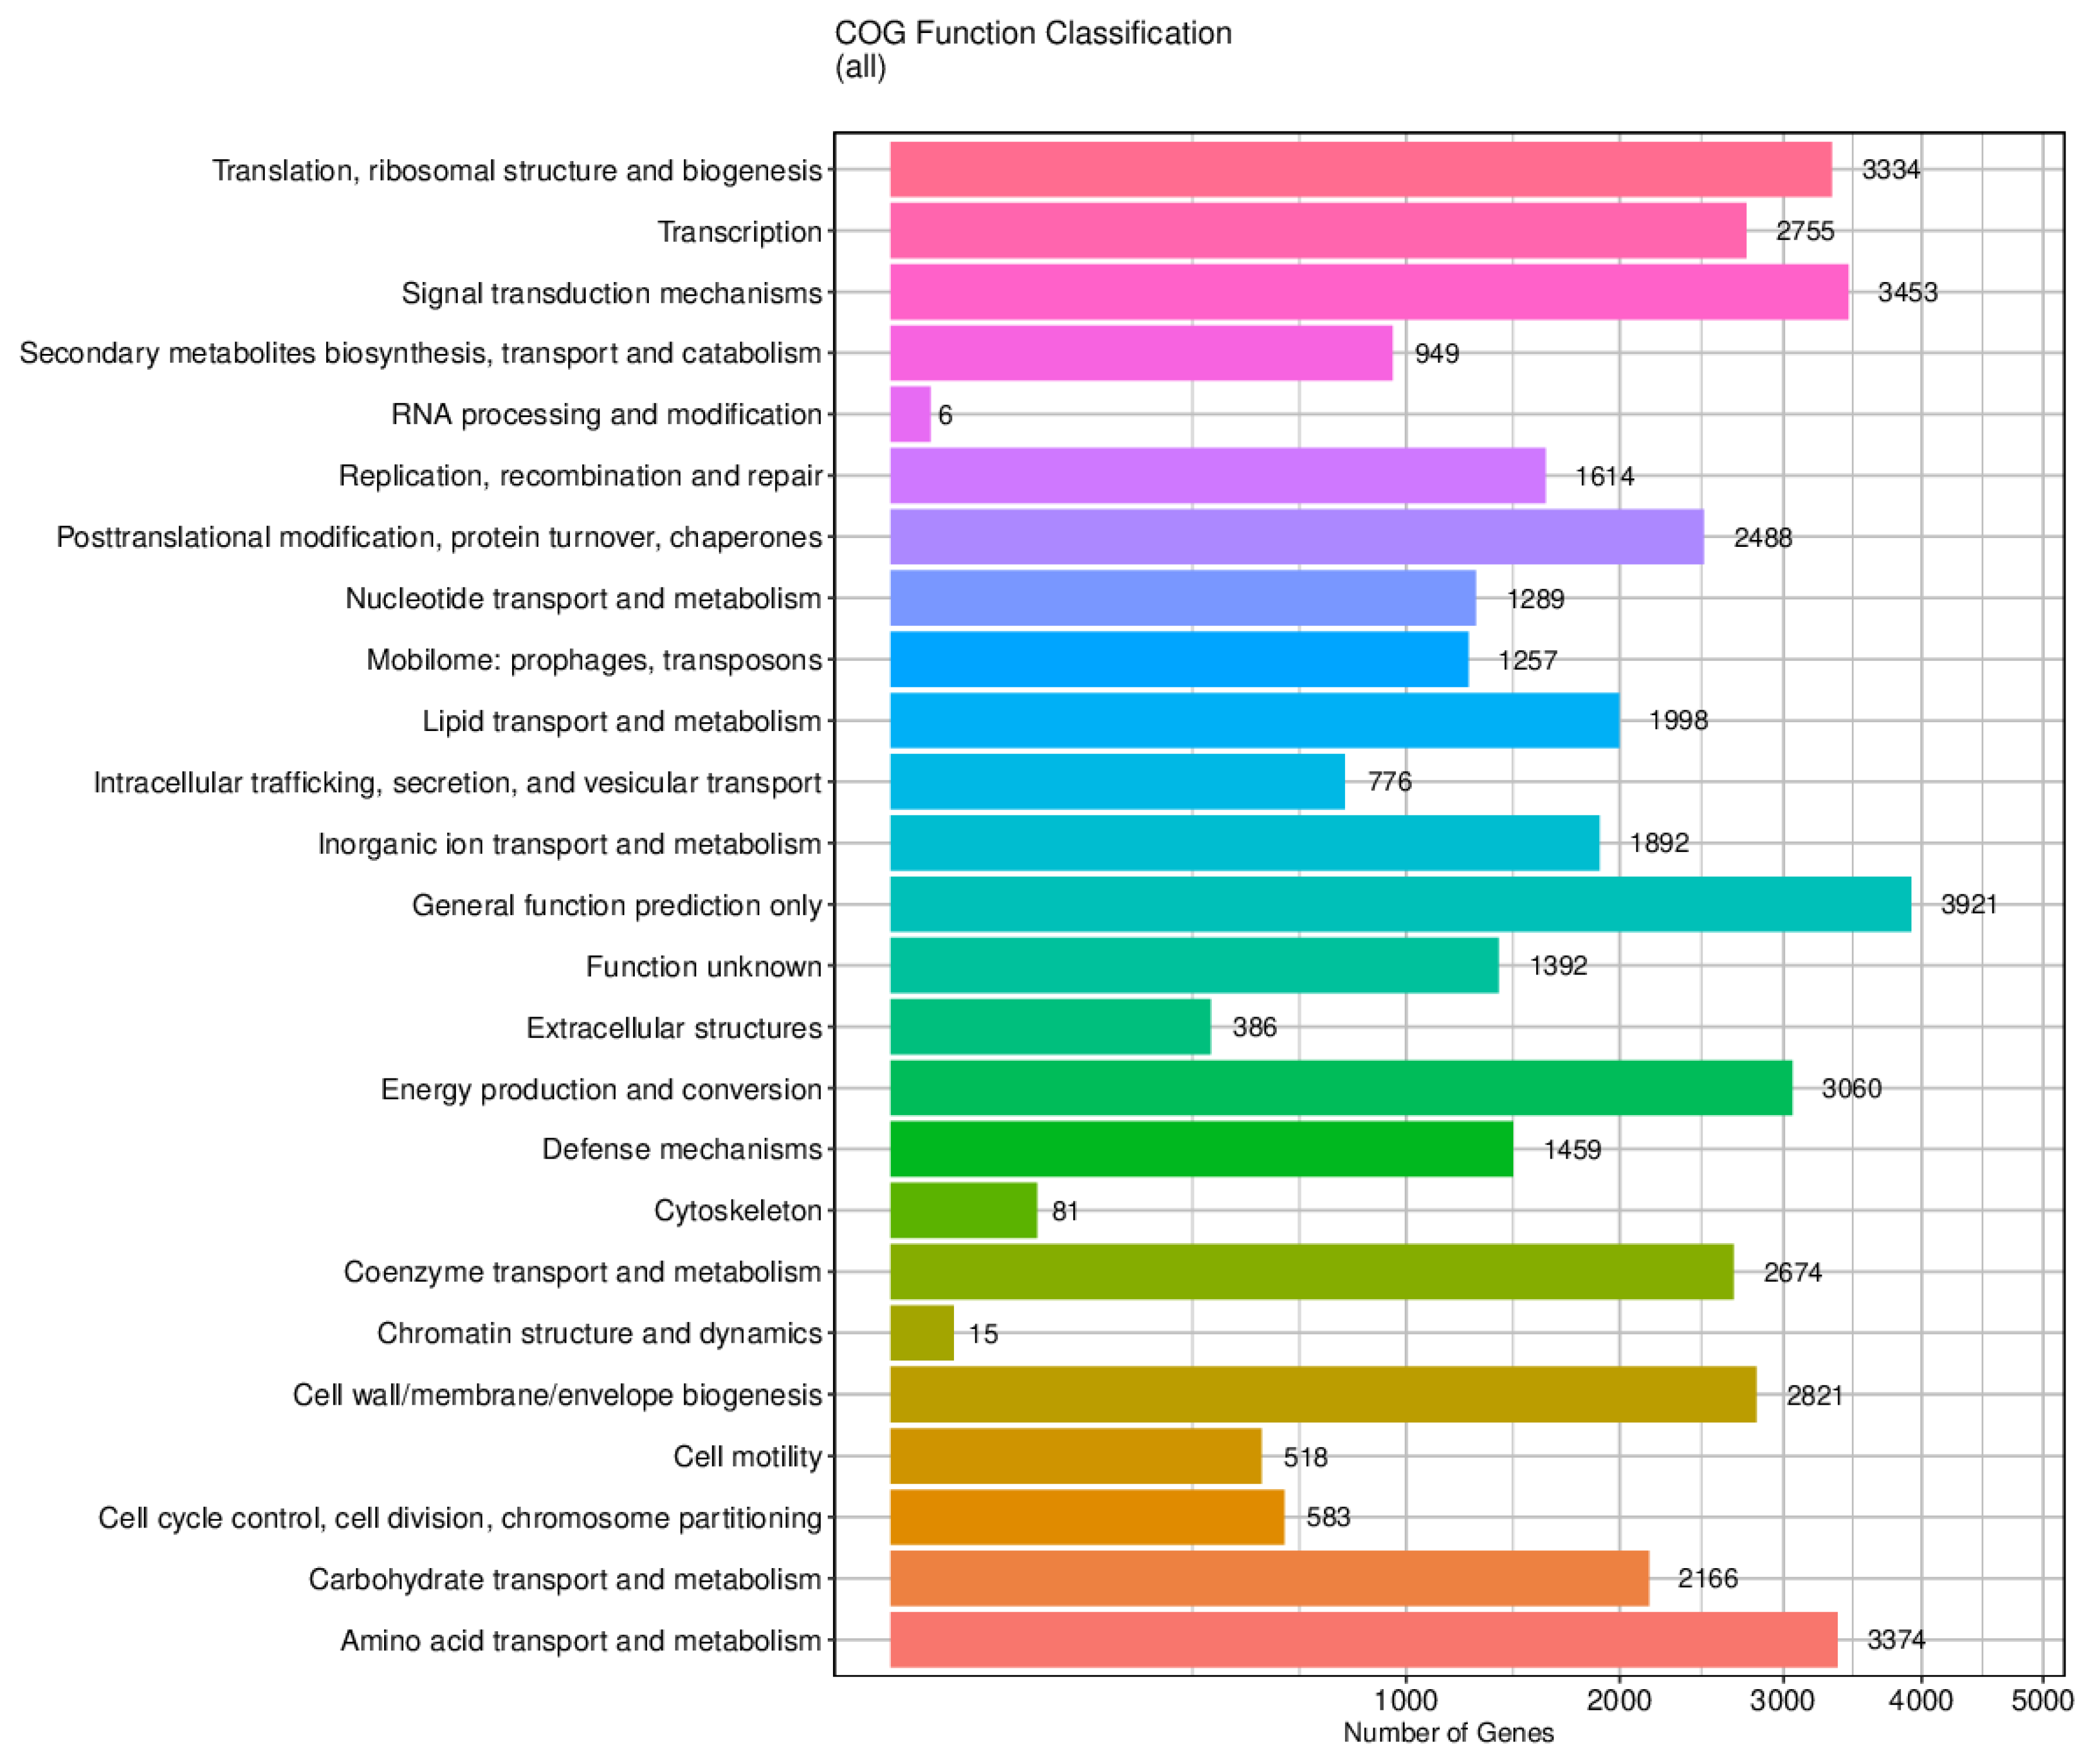
Figure 7). KEGG revealed a high abundance of genes (10,766), with significant functional enrichment associated with metabolism. Compared to farms B and C (~0.65–0.68), slightly higher relative abundance was depicted in farm A (~0.70). Other enriched functional categories included genetic and environmental information processing, particularly signal transduction (1701 genes), translation (1496 genes), folding, sorting and degradation (898 genes) and replication and repair (734 genes). Meanwhile, in farm B, a slightly higher abundance of disease-related pathways and infectious disease (~0.03) was found compared to A and C (0.01–0.02), mirroring pathogen-associated gene presence. The COGs database was identified with signal transduction mechanisms (3453 genes), amino acid transport and metabolism (3374 genes), and translation, ribosomal structure and biogenesis (3334 genes) as the most abundant function categories. Farm A exhibited an increase in genes responsible for translation (~1100) compared to B and C (~1000 each), indicating protein synthesis potential. Farm B was more abundant with the secondary metabolite biosynthesis, transport and catabolism (949 genes), and farm C was observed with the highest abundance of energy-related genes. Several categories, including energy production and conversion (3060 genes) and carbohydrate transport and metabolism (2166 genes), were also prominent across all three farms. A heatmap of relative functional abundance (log
10 scale) was constructed, which revealed significant positive correlations (1.0) with amino acid metabolism categories across all the farms, while categories with environmental relevance were observed as negatively correlated (−1.0). Functional pathway predictions derived from KEGG and COG databases were inferred from taxonomic composition using reference genome databases and therefore represent predicted metabolic potential rather than direct measurement of gene expression or enzymatic activity.
4. Discussion
This study provided the initial status of soil health and microbial diversity and abundance in aggregated (A and B) and non-aggregated (C) farms. The findings supported the hypothesis that reduced soil disturbance and high organic matter content promote highly diverse and robust microbial communities. These resilient farming systems enhance nutrient cycling and disease suppression, improve soil fertility status and withstand environmental stressors. Importantly, this baseline data on soil health and microbial composition lays the foundation for long-term data-driven scientific interventions and monitoring tools designed to enhance farm productivity and support land restoration efforts.
4.1. Land Use Impact on Microbial Diversity
Soil degradation is shaped by the intensity of land use history, and management practices highlight the intricate relationship between soil health, microbial community, and ecosystem integrity. The observed gradients in pH, CEC, SOC, and nutrient availability reflect distinct stages of soil degradation across the three farming systems. Farm A represents a relatively recovered system with moderate fertility and structural stability, farm B exhibits chemically enriched yet biologically stressed soils indicative of management-induced degradation, while farm C reflects advanced degradation characterized by acidification, nutrient depletion, and reduced buffering capacity. The diversity, community structure and abundance of microbial communities were significantly influenced by different land use practices across farms A (aggregated-fallow land), B (aggregated-high-input farming systems) and C (conventional smallholder farming systems). The distinct patterns on microbial richness and evenness across the farms were driven by variations in soil physicochemical properties, management practices and other anthropogenic disturbances, as evidenced by various diversity indices (Shannon and Simpson indices).
Aggregated farm A (Agoro East), left fallow for over 30 years, with predominantly flat terrain and no active cultivation, exhibited a balanced structure of bacterial (0.15 ± 0.05) and fungal (0.20 ± 0.03) richness and evenness with Shannon and Simpson indices. Minimal land disturbance in these fallow systems fostered stable soil parameters such as a neutral pH (6.78) and diverse vegetation from grazing on flat terrain supports and root exudates with a moderate level of SOC (1.17%) favored the taxa, including Actinomycetota and Ascomycota, well known for organic matter decomposition and nutrient cycling. The filamentous branching growth patterns, and bioactive metabolite production by Actinomycetota, enhance soil aggregation and capture and store carbon, while Ascomycota, such as
Penicillium, foster the decomposition process and thus nutrient cycling [
15,
16,
17]. Another key taxon,
Gemmatimonas kalamazoonensis, was also observed, linked with carbon sequestration, thereby contributing to SOC accumulation in the farm [
18]. Moreover, high alpha diversity and the presence of 1935 unique OTUs indicated that the fallow systems are also microbial reservoirs that aid in the restoration of these degraded systems. Beta diversity metrics, reflected by Bray–Curtis dissimilarity values (0.28 for bacteria, 0.55 for fungi), also confirmed that the distinct microbial assemblages were shaped by different land use practices. This fallow farm system also serves as a valuable baseline or reference ecosystem for degraded sites, fostering a more heterogeneous microbial diversity.
Aggregated farm B (Jimo East), located on slightly sloping terrain, was under continuous cropping of sorghum, legumes, and maize. These high-input systems with intensive practice elevated nutrient levels (P- 151.36 mg/kg and K- 943.52 mg/kg) and disrupted the microbial load while favoring Pseudomonadota and Sphingomonadaceae, including genera like
Sphingomonas that responded towards stress conditions. The alkaline pH (7.39) and high CEC (43.37) indicate soil compaction from heavy machinery. The repeated fertilizer use, particularly P, disturbs the osmotic balance in soils, which can inhibit microbial activity and nutrient acquisition, reducing the plant–microbe co-adaptation correlating with elevated disease-related pathways (KEGG: ~0.03). Moreover,
Fusarium (order Hypocreales) dominance, often associated with nutrient imbalances and monoculture stress in farm B, is potentially responsible for accelerating soil-borne disease, which compromises crop growth and production [
19,
20,
21].
In contrast, non-aggregate and conventional smallholder systems of farm C (Vigulu), situated on very steep slopes, with high fertilizer use and diverse crops (legumes, vegetables, maize, bananas, and fruit trees), showed significantly lower microbial diversity. Soil acidification (pH 5.88) and low CEC (20.13 cmolc/kg) are the classic signs of intensive land management and degradation that favored the proliferation of Acidobacteriota, a phylum adapted to acidic, nutrient-poor soils [
22,
23]. These stress conditions due to input overload and poor aeration further outcompete the beneficial microbial groups, weakening the soil systems and making them more prone to pathogen and disease outbreaks. Concurrently, the dominance of the fungal community—Mortierellomycota and Basidiomycota taxa— is also linked with such acidic and degraded soils, further undermining the ecosystem stability [
24,
25,
26]. The pronounced presence of
Fusarium and
Cladosporium in farm C signals the raised pathogenic pressure, reduced resilience, and a potential threat to soil and cropping systems.
Variations in microbial diversity across farms likely reflect the combined effects of soil physicochemical conditions, vegetation diversity, land-use history, and agricultural management intensity. These results demand revisiting the land-specific restoration strategies to enhance soil health and ecosystem services across the degraded systems [
27,
28]. For instance, a strong positive correlation between SOC and TN (r = 0.92,
p < 0.01) across the three farms emphasizes the critical role of organic matter in improving soil fertility. However, in farms B and C, this correlation is notably weakened with disrupted nutrient retention and cycling due to intensive farm practices and landscape-induced erosions.
4.2. Toward Sustainable Cropping Systems
The present study highlights several paths for reversing degradation and ensuring long-term soil health. Leveraging the beneficial microbial diversity and site-specific farm management practices is central to restoring sustainable crop productivity. Data from aggregated farm A provided a benchmark for low-input practices and minimal disturbance that supports high microbial diversity (OTUs—1935 for bacteria and 886 for fungi) involved in nutrient acquisition, pest and disease suppression and carbon sequestration. However, this also emphasizes microbial and edaphic reference for restoration practices, including the use of active microbial consortia (e.g., Bacillaceae, Pseudomonadaceae, etc.) in degraded sites. Bacillaceae, particularly the genus
Bacillus, are well known for endospore formation, allowing them to survive in harsh conditions, such as in farm A, and promote nutrient mobilization and crop growth while mitigating the effects of soil-borne diseases.
Pseudomonas species are well known plant colonizers that make essential nutrients like P, K and Fe available to plants by different modes of action, such as siderophore production [
29,
30]. KEGG and COG analyses revealed farm A had high metabolic gene richness (~0.70, 10,766 genes), signal transduction (1701 genes), and translation (1496 genes), supporting robust microbial resilience and soil biological functioning [
31].
Transitioning farm B towards sustainable cropping systems necessitates the integrated strategies of microbial data and soil properties. By adopting conservation agriculture practices, such as minimal use of heavy machinery on the farm (reduced tillage) and cereal–legume rotation, can enhance SOC and TN by 10–20% and root exudate diversity and mitigate nutrient imbalances [
32,
33,
34]. The adoption of cover crops can further enhance soil structure and reduce erosion, while simultaneously fostering diverse microbial habitats [
35]. Additionally, the use of real-time data tools, such as high-efficiency soil sensors, can optimize temperature, moisture and nutrient delivery while minimizing the environmental stress on microbial richness, especially where taxa like Bradyrhizobiaceae are beneficial [
36,
37].
Farm C with highly acidic and disturbed soil requires urgent alterations supported by KEGG and COG metabolic gene analyses with soil and microbial inputs. Various organic inputs can improve SOC and buffer pH, and enhance the crop biomass and microbial activities in degraded soils [
38,
39,
40]. Enhancing crop biomass also improves pH by 0.5–1.0 units, CEC by 10–20 cmolc/kg and plant-derived carbon inputs (root exudates) that further support varied microbial communities [
41]. Analysis of KEGG and COG for farms B and C showed reduced functional potential (0.65–0.68), particularly an elevated abundance of genes associated with disease pathways (~0.03) and diminished protein synthesis pathways (~1100 genes)—indicators of potential microbial imbalance and soil ecosystem decline.
Functional redundancy within microbial communities plays a critical role in buffering ecosystem functions against disturbance. In farm A, high taxonomic diversity likely supports redundancy in nutrient cycling and decomposition pathways, enhancing system resilience. In contrast, reduced diversity in farms B and C suggests diminished redundancy, increasing vulnerability to functional collapse under continued stress.
In addition, customized approaches are needed to achieve sustainable cropping system goals and address the specific challenges of each aggregated and non-aggregated farm. Tailored approaches include bolstering soil health in farm A by incorporating practices like cover cropping and organic amendments, and restoration of microbial balance through input rationalization and other bioaugmentation efforts, optimization of input loads to mitigate imbalances that impaired soil biological functioning in farm B, and ameliorating soil acidity and nutrient depletion in farm C. These approaches collectively improve ecosystem services with diversified systems, notably enhancing microbial resilience to environmental stress, as evidenced by meta-analyses [
42,
43,
44].
Finally, restoration trajectories often involve short-term trade-offs followed by long-term ecosystem recovery. Evidence from vegetation restoration studies demonstrates that initial degradation phases can precede substantial long-term improvements in soil structure, microbial diversity, and nutrient cycling, emphasizing the importance of long-term monitoring frameworks in degraded agricultural landscapes (e.g., Caragana-based restoration systems). Similarly, landscape-scale nutrient retention strategies, including wetland–farm interfaces and engineered substrates, have been shown to simultaneously regulate phosphorus availability and mitigate microbial clogging, offering transferable insights for managing nutrient losses in intensive farming systems adjacent to aquatic environments [
45,
46].
4.3. Microbial Indicators for Restoration
This study identified several microbial taxa as diagnostic tools for assessing soil health status, identifying causes of degradation, and informing restoration strategies (
Table 2). Thus, it is important to guide targeted interventions while also monitoring key soil physical and chemical properties (such as pH, CEC, SOC, TN, P and K) to enhance functional microbial diversity and ecosystem shifts. Many microbial communities served as the early alerts for the current soil status in farms A, B (aggregated) and C (non-aggregated). Land restoration strategies should target enhancing the abundance of beneficial microbial taxa while suppressing the pathogenic ones [
47,
48]. For example, enriching the functional taxa like Bradyrhizobiaceae and
Penicillium while reducing the prevalence of pathogenic groups like
Fusarium would signal progress towards soil health recovery [
49].
4.4. Limitations and Future Research
This study provides baseline characterization of soil physicochemical and microbial attributes across contrasting farming systems; however, several limitations should be acknowledged. First, amplicon sequencing provides taxonomic resolution but does not directly measure microbial functional activity or gene expression. Second, FTIR-based soil property predictions rely on calibration models and may introduce estimation uncertainties. Third, sampling was conducted within a defined depth and time frame and may not fully capture seasonal or temporal variability in microbial communities. Additionally, potential confounding environmental variables such as vegetation heterogeneity, microclimatic variation, and management history could influence observed microbial patterns. Future studies incorporating longitudinal sampling, direct functional metagenomics or transcriptomics, and controlled experimental designs would strengthen the mechanistic understanding of soil health dynamics.
Beyond agronomic interventions, emerging physicochemical remediation approaches provide mechanistic insights that can inform soil restoration monitoring. Technologies such as electro-Fenton oxidation and electrokinetic remediation have demonstrated effectiveness in mobilizing contaminants, altering redox conditions, and reshaping microbial functional niches. Although developed primarily for contaminated soils, the underlying principles—controlled redox manipulation, enhanced nutrient mobility, and microbe–mineral interactions—offer transferable indicators for designing integrated soil restoration and monitoring frameworks in degraded agricultural systems [
50,
51].
5. Conclusions
This study established comprehensive insights into various land use practices, including landscape type, cropping systems and degree of external inputs, and how these factors influence the soil health and microbial communities across both aggregated and non-aggregated farms. Farm A provided a robust, evidence-based framework highlighting the benefits of flat terrain and ecological stability that sustains a highly diverse microbial community and moderate soil fertility. Farm B demonstrated how intensified farming practices degrade soil properties and microbial communities, and farm C revealed that while diversification can offer benefits, excessive inputs combined with landscape instability can negatively impact soil health. The presence of various microbial indicators in farms, such as Bradyrhizobiaceae, Penicillium and Sphingomonas, and associated functional gene enrichments alongside soil parameters provided advanced tools for assessing soil health. The observed shifts in microbial community structures, from functionally rich in farm A to more pathogenic in farm C, reflect a clear degradation gradient and underscore the challenges of effective biological stewardship. The data strongly supports integrated approaches that promote microbial activity, restore soil quality and furnish sustainable farming practices. Future strategies will leverage high-throughput sequencing and metabolomics to widen the role of key microbial taxa in restoration pathways, combined with site-specific interventions. Overall, this study demonstrates the importance of integrating soil physicochemical indicators with microbial community profiling as complementary components of soil health assessment in smallholder agricultural systems. We will reassess the status of our interventions at a period of 5 and 10 years, acknowledging that soil health restoration and reversing degradation efforts are the long-term monitoring goals.




 ,
,