Article

Study on the Environmental Behavior and Ecological Effects of Exogenous Proteins from Insect-Resistant Corn in Soil


1
College of Agriculture, Northeast Agricultural University, Harbin 150030, China
2
Baoding Agricultural Development Group Co., Ltd., Baoding 071000, China
*
Authors to whom correspondence should be addressed.
Agronomy 2026, 16(5), 560; https://doi.org/10.3390/agronomy16050560
Submission received: 16 January 2026 / Revised: 26 February 2026 / Accepted: 28 February 2026 / Published: 3 March 2026
(This article belongs to the Special Issue Plant Stress Tolerance: From Genetic Mechanism to Cultivation Methods)

Abstract

Exogenous protein degradation dynamics during transgenic maize straw degradation in soil and the mechanisms underlying soil microbial community construction remain unclear. Applying null-model analysis to determine these mechanisms is important for assessing transgenic crop straw return-to-field-related impacts on dynamic soil quality and microbial ecological function changes. A laboratory leaf degradation burial simulation was conducted to establish an exogenous protein Cry1A.401 soil degradation model and clarify its behaviors. Coupled Illumina MiSeq 16S rDNA sequencing–soil physicochemical factor analysis was used to evaluate soil microbial community characteristic and diversity changes during leaf degradation and explore soil microbial community construction mechanisms and driving factors. The results revealed that exogenous protein Cry1A.401 released from transgenic insect-resistant maize leaves exhibited consistent degradation characteristics, decreasing rapidly at the initial stage but slowly at the middle/late stages. The diversity levels within/between soil microbial community groups did not significantly differ. Coexistence was the dominant interaction type among soil microbial communities. Community assembly occurred stochastically and was limited primarily by diffusion. Insights into the putative mechanistic links among Bacillus thuringiensis (Bt) proteins, soil properties, and microorganisms are provided. Our understanding of the ecological impacts of exogenous Bt proteins released into soil via leaves on soil ecosystems was enhanced.

1. Introduction

Bacillus thuringiensis (Bt) is a Gram-positive entomopathogenic bacterium that produces various parasporal crystals. The main active substance of Bt is insecticidal crystal protein (ICP), which is encoded by the cry and cyt genes; these genes exhibit high insecticidal specificity against Lepidoptera, Coleoptera, and some Hemiptera pests. Since the first Bt insecticidal protein-encoding gene was cloned and sequenced in 1981, 993 Bt toxin-coding genes (801 cry genes, 40 cyt genes, and 152 vip genes) have been cloned and classified. Among these genes, the cry protein encoded by the cry gene is widely used because of its potent biological activity [1].
In genetically modified crops, exogenously expressed proteins enter the soil ecosystem mainly through root exudates [2], pollen drift [3], and plant residues, thereby indirectly affecting soil microbiota, biodiversity, and ecological processes [4,5,6,7]. Studies have shown that after Bt maize is harvested, a large amount of Bt protein can enter the soil ecosystem through maize stubble or straw that is returned to the field [8,9,10,11,12,13,14], and the presence of this protein can be detected continuously within a certain time range. Studies have revealed that when MON810 straw is returned to the field for 10 days, the degradation rate of Cry1Ab protein reaches 88%, and trace amounts of Cry1Ab protein can still be detected after 180 days [15]; similar results have been obtained for different transgenic materials. For example, the Bt protein released from the straw of gene–transgenic maize and Cry1Ac gene–transgenic maize is rapidly degraded in the soil, and a small amount of Bt protein can still be detected after 134 days [16]. In addition, most studies of this type have involved moving logarithmic and exponential models to fit the behaviors of exogenous units in soil [10]; most scholars have reported that they exhibit rapid–slow degradation characteristics.
When Bt proteins enter the soil, they can directly or indirectly change soil physical and chemical properties, soil microbial diversity, and the abundance of dominant bacterial communities [17,18]. An important consideration is whether the release of exogenous Bt protein into the soil has a cumulative effect, thereby affecting the physical and chemical properties and the nutrient translocation processes of soil. These considerations are crucial indicators for evaluating the environmental safety levels of field-released Bt transgenic plants [19]. In the rhizosphere soil of the insect-resistant maize Mon810, the content of Cry1Ab protein can reach 165 g/hm2 [20], but as the straw decomposes, the content of this protein rapidly decreases to an extreme value; there are reports that after straw is returned to the field, most Bt proteins degrade rapidly in the early stage, but a few Bt proteins degrade stably in the later stages [21].
Microorganisms are key drivers of biogeochemical cycles and play important roles in controlling carbon, nitrogen, and phosphorus cycles in soil [22,23,24,25]. In addition, soil microbial communities fulfill crucial roles in maintaining ecosystem stability and sustainability [26], and soil microbes are sensitive indicators of environmental change. Therefore, identifying complex patterns of microbial networks to detect and study complex microbial interaction networks can aid in obtaining a more comprehensive understanding of the impacts of Bt maize crop leaf degradation on the stability and vulnerability of soil microecology. Previous studies have aimed to assess the effects of Bt toxins on soil microbial activity [27], microbial functional groups [28], and microbial community diversity [29,30].
Proteins are sources of organic carbon and nitrogen that are degraded into amino acids, from which inorganic carbon and nitrogen are ultimately released. Therefore, exogenous proteins can be released through Bt-transgenic crop residues or secretions, thereby affecting the functional groups of the microorganisms involved in these nutrient cycling pathways [31]. The expression levels of Bt toxins may strongly influence soil microbial community structure. In recent years, numerous researchers have reported the effects of Bt crops on soil microorganisms [32,33]. Studies have shown that stable isotope detection and high-throughput sequencing can be used to identify active microorganisms involved in the decomposition of Bt-containing straw. During the microbial straw decomposition process, Bt rice has a significant but transient effect on soil microorganisms [34]. However, our understanding of the overall response patterns of soil microbial populations to Bt crops remains relatively limited. Further research is needed to simulate microbial coexistence, identify interactions critical to community stability, evaluate their responses to Bt toxin degradation, and assess the resulting impacts on soil microecology.
The Cry1A.401 gene was created by fusing codon-optimized sequences of Cry1Ab, Cry1Ac, and Cry1F, forming a novel insect-resistant gene, Cry1A.401. This innovation has been granted a Chinese national invention patent (Patent No. ZL201210049212.X). Using Agrobacterium-mediated transformation, the gene was introduced into the recipient inbred line S144. Through successive selfing and trait-based selection, the insect-resistant transgenic maize lines CM8302 and CM8303, carrying the Cry1A.401 gene, were developed. In these lines, CM8302 and CM8303, the Bt toxin protein is highly expressed during the early developmental stages of maize tissues and in the primary sites targeted by pests. This high level of expression is sufficient to kill heterozygous individuals carrying resistance alleles in the corn borer population. Consequently, the frequency of resistance alleles within the pest population is maintained at a very low level, thereby achieving the goal of preventing and delaying the development of insect resistance.
The mechanisms underlying soil microbial community construction during the degradation of transgenic maize stubble remain unclear. In this study, the insect-resistant maize varieties CM8302 and CM8303, which are transgenic to the Cry1A.401 gene, and its receptor control Si-144, were chosen as research materials. Laboratory burial simulations of leaf degradation were conducted to construct a Cry1A.401 protein degradation model and clarify its behavioral characteristics. Illumina MiSeq 16S rDNA high-throughput sequencing, coupled with soil physicochemical factor analysis, was used to analyze the characteristics of soil microbial communities during the burial of different materials and to explore the construction mechanisms and driving factors of the microbial community. The rapid degradation of the Bt protein in soil suggests its low potential soil toxicity. A zero-model approach was used to quantify the construction process of straw-degrading bacterial communities and their influencing factors. The work provides key insights into the stability and dynamics of soil microbial communities following the release of exogenous proteins from transgenic maize, which is crucial for the sustainable management of soil ecological balance.

2. Materials and Methods

2.1. Soil Sample and Leaf Treatment

The tested soil was collected in April 2023 from the experimental field site of Northeast Agricultural University in Harbin, Heilongjiang Province (45°74′ N, 126°73′ E). No transgenic crops had been grown there, and the soil type was chernozem. The experimental materials were planted at the transgenic experimental base of Northeast Agricultural University, with a 2 m row length, a 25 cm plant spacing, 5 rows per plot, and 3 replicates. All leaves of the plants were collected at stage V9. Leaf powder was mixed separately with soil samples from the Northeast Agricultural University field site. For each treatment, 0.2 g of soil and 0.02 g of leaf powder were thoroughly mixed and placed in a 2.0 mL centrifuge tube with a 2 mm-diameter hole at the top. The relative moisture content was 50%. Then, 100 μL of sterile water was added to each centrifuge tube, and each centrifuge tube was weighed using a 0.01 g/mL balance and labeled. After sample preparation, the samples were placed in a 25 °C constant-temperature incubator, and sterile water was added according to the initial sample weight. For every 0.001 g difference, 1 μL of sterile water was added to maintain a constant moisture content for each sample. Each treatment was repeated three times. A total of 25 sampling time points were established: 0, 1, 2, 3, 4, 5, 6, 7, 8, 9, 10, 11, 12, 13, 14, 15, 16, 17, 18, 19, 20, 30, 45, 60, and 90 days. The samples were stored at −80 °C for later use [28].
The tested maize transgenic Cry1A.401 gene insect-resistant maize lines CM8302 and CM8303 and the recipient control maize inbred line Si-144 were obtained from the Institute of Crop Sciences, Chinese Academy of Agricultural Sciences.

2.2. Soil Physicochemical Property Determination and Exogenous Protein Detection

Forty grams of soil sample from the Northeast Agricultural University field study site was weighed and evenly mixed with 4.0 g of dried leaf powder from the V9 stage. The mixture was then placed in 50 mL centrifuge tubes with a relative moisture content of 50%. Each treatment was replicated three times. All the soil samples were incubated at 25 °C in the dark. At 0 d, 5 d, 10 d, 15 d, 20 d, 30 d, and 60 d after incubation, soil samples were collected and divided into two parts. One part was used to determine the soil pH and SOM [35], TN [36], ammonium nitrogen, nitrite nitrogen, and nitrate nitrogen contents [37]. The other part was frozen at −80 °C for soil DNA extraction and subsequent 16S rDNA sequencing.
Laboratory degradation was simulated. The total protein contents were extracted from samples on days 0, 1, 2, 3, 4, 5, 6, 7, 8, 9, 10, 11, 12, 13, 14, 15, 16, 17, 18, 19, 20, 30, 45, 60, and 90 after material burial. The residual amount of Cry1A.401 protein was detected by enzyme-linked immunosorbent assay (ELISA). The degradation equation was fitted using SigmaPlot 12.0software to obtain degradation curves, and DT50 and DT90 were calculated to clarify the laboratory degradation behavior characteristics of the Cry1A.401 protein.

2.3. Soil DNA Extraction and Bacterial 16S rDNA Gene Sequencing Using Illumina MiSeq

DNA extraction method: A total of 0.5 g of the soil sample was used for soil DNA extraction. DNA was extracted from a 0.5 g soil sample via the use of the E.Z.N.A. Soil DNA Kit (OmegaBio-tek, Inc., Norcross, GA, USA) by following the manufacturer’s instructions. The quality and concentration of the extracted DNA were detected using a Nanodrop2000 ultramicrospectrophotometer (Thermo Fisher Scientific Inc., Shanghai, China). The extracted DNA was subsequently used for microbial 16S rDNA gene amplification and sequencing. PCR products were prepared using the NEB Next Ultra II DNA Library Prep Kit (New England Biolabs, Inc., Ipswich, MA, USA) according to standard procedures, and sequencing was performed on the Illumina MiSeq (Illumina, Inc., San Diego, CA, USA) platform. The 16S rDNA gene sequence for this experiment was commissioned to a sequencing company (Beijing Aovisen Gene Technology Co., Ltd., Beijing, China). The hypervariable portion of the V3–V4 region of the microbial 16S rDNA gene was amplified using the primers 338F (5′-ACTCCTACGGGAGGCAGCAG-3′) and 806R (5′-GGACTACHVGGGTWTCTAAT-3′). Sequence quality control and feature table construction were performed using QIIME (v1.8.0). OTUs were generated at a 97% similarity threshold using the UPARSE algorithm [38]. Taxonomic assignment was conducted using the RDP database (V16) [39]. Alpha and beta diversity metrics were estimated using the R packages ‘vegan’ (v2.6-4) and ‘tidyverse’ (v1.8.2), with PCoA based on weighted UniFrac and Bray–Curtis distances. LEfSe analysis was carried out via the TUTOOL platform (December 2023 version).
Main analytical measures: Molecular ecological networks (MENs) were used to explore co-occurrence patterns among microbial genera. Pearson correlations between genera were considered statistically robust if r > 0.6 and p < 0.01. Analysis methods were used to study microbial community structures and interactions, reflecting the relationships between different treatments in different microbial communities and their co-occurrence and interaction characteristics within the ecosystem. To assess alpha diversity, the Chao1 index, Good’s coverage, Shannon diversity index, and Simpson diversity index were calculated on the basis of the OUT data. To assess beta diversity, principal coordinate analysis was employed, combined with Adonis multivariate analysis of permutations, to assess differences in beta diversity across different groupings. PCoA was conducted as an unconstrained ordination analysis based on weighted UniFrac and Bray–Curtis distances. The Kruskal–Wallis rank-sum test was used to analyze the differences among soil microbial communities within the same burial period. Linear discriminant analysis Effect Size (LEfSe) was employed to screen potential biomarkers from the phylum to genus levels, with a Linear Discriminant Analysis (LDA) score threshold greater than 3. This approach aimed to evaluate the impacts of exogenous protein residues and soil burial time on the composition of soil microbial communities. Redundancy analysis (RDA) was performed to conduct permutation tests and identify key environmental factors that significantly influenced the composition of the sample microbial community. Heatmaps were generated using R software (R 4.4.0) to identify key soil physicochemical indicators affecting the microbial community. Then, Spearman correlation analysis was conducted. A null-model analysis of community construction was performed using the nearest–nearest-species kinship index (βNTI) and the Raup–Crick index (RCbray) to assess the deterministic and stochastic processes of microbial community construction.

2.4. Statistical Analysis

One-way ANOVA was performed using SPSS software 19.0 (SPSS, Chicago, IL, USA) to analyze the effects of different soil incubation times on the soil physicochemical properties of the transgenic and nontransgenic crop straw (leaves). Statistically significant differences were defined as those for which p < 0.05. After Illumina high-throughput sequencing, the original sequences were optimized for quality control and chimera removal to obtain representative operational taxonomic unit (OTU) sequences. The phylogenetic information of the representative OTU sequences was compared with a 97% similarity threshold to obtain the OTU annotation information. To assess microbial community characteristics and construction mechanisms, alpha diversity analysis was used to assess species abundance and the evenness of individual distribution within the community; beta diversity was analyzed using principal component analysis (PCA) and PCoA to assess microbial community diversity; and permutation multivariate ANOVA was used to estimate the significance levels of differences between groups. Microbial co-occurrence network analysis was used to assess microbial community structure and interactions. Null-model analysis of community construction was conducted to assess the deterministic and stochastic processes of microbial community construction.

3. Results

3.1. Protein Degradation Kinetics

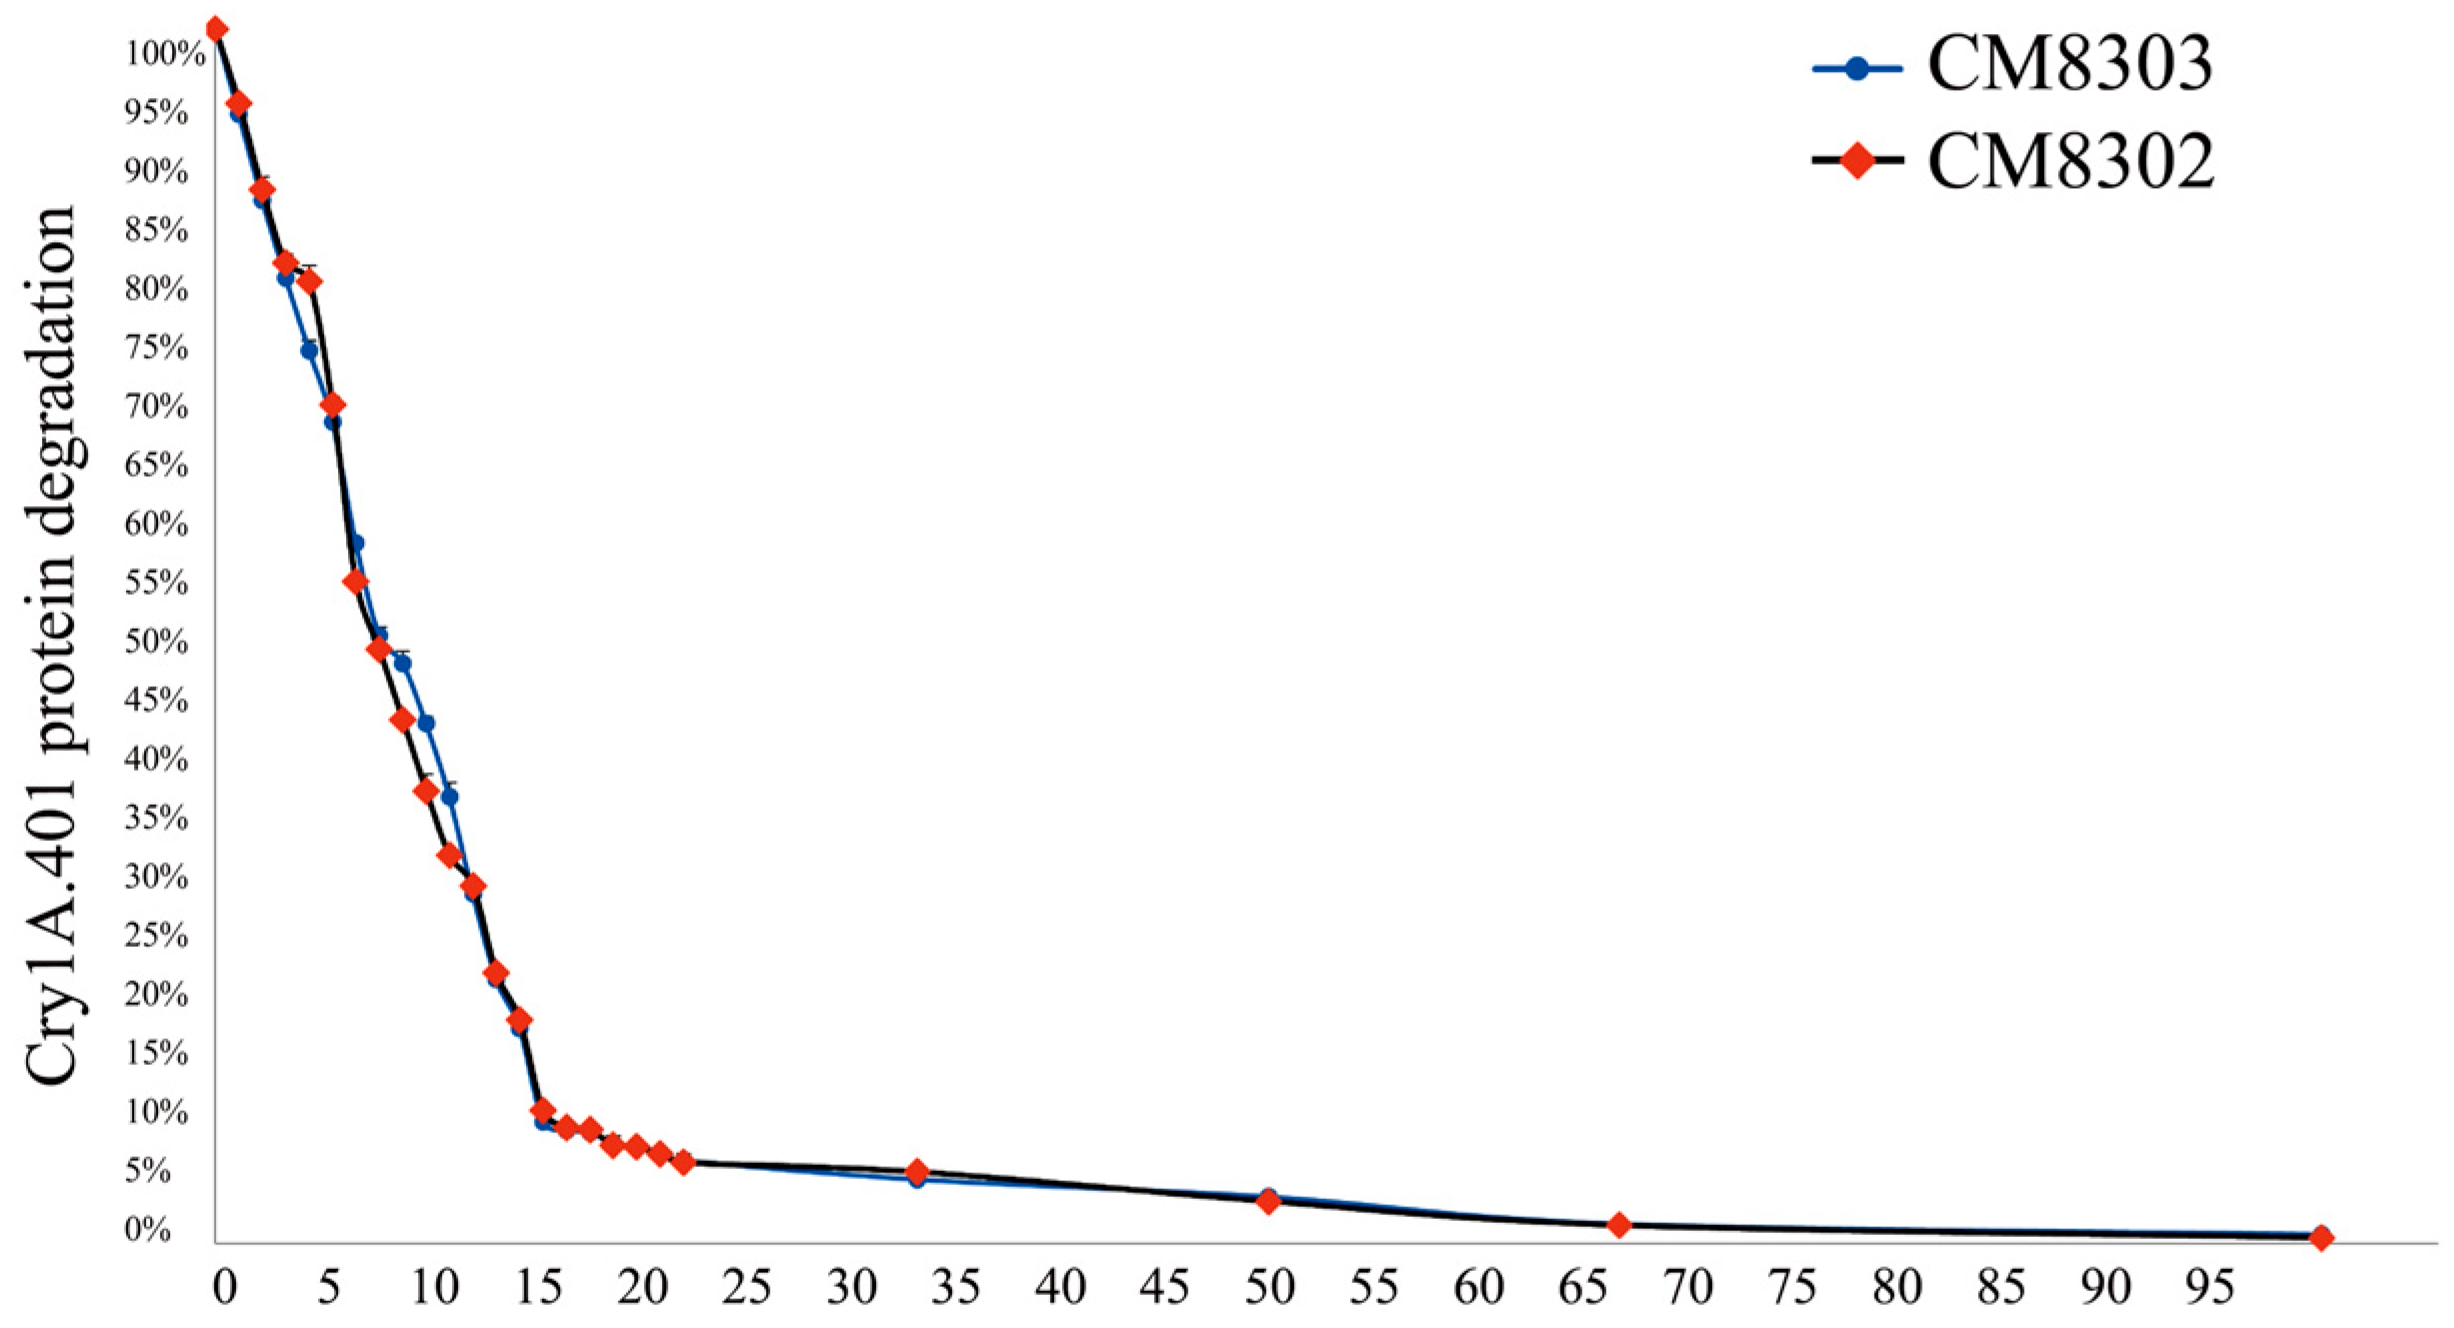
The degradation dynamics of CM8302 and CM8303 in soil are shown in Figure 1. The kinetic characteristics of the Cry1A.401 protein were similar in different materials. The degradation dynamics of CM8302 and CM8303 were essentially consistent, showing a rapid degradation trend in the early stage. This result was followed by slow degradation in the middle and later stages.
Furthermore, a degradation index model for the Cry1A.401 protein, Y(t) = Ae−kt, was established in SigmaPlot 12.0 software. On the basis of the fitted degradation model, the degradation half-life (DT50) and the number of days to 90% degradation (DT90) of the Cry1A.401 protein in soil were calculated. The DT50 for CM8302 was 6.37 d, and the DT90 was 14.30 d. The DT50 for CM8303 was 6.45 d, and the DT90 was 14.74 d. Comparison revealed that the degradation time of the Cry1A.401 protein in soil was essentially consistent across different materials, which was consistent with the aforementioned dynamic characteristics (Table A1 and Table A2).

3.2. Effects of Degradation on Soil Physicochemical Properties

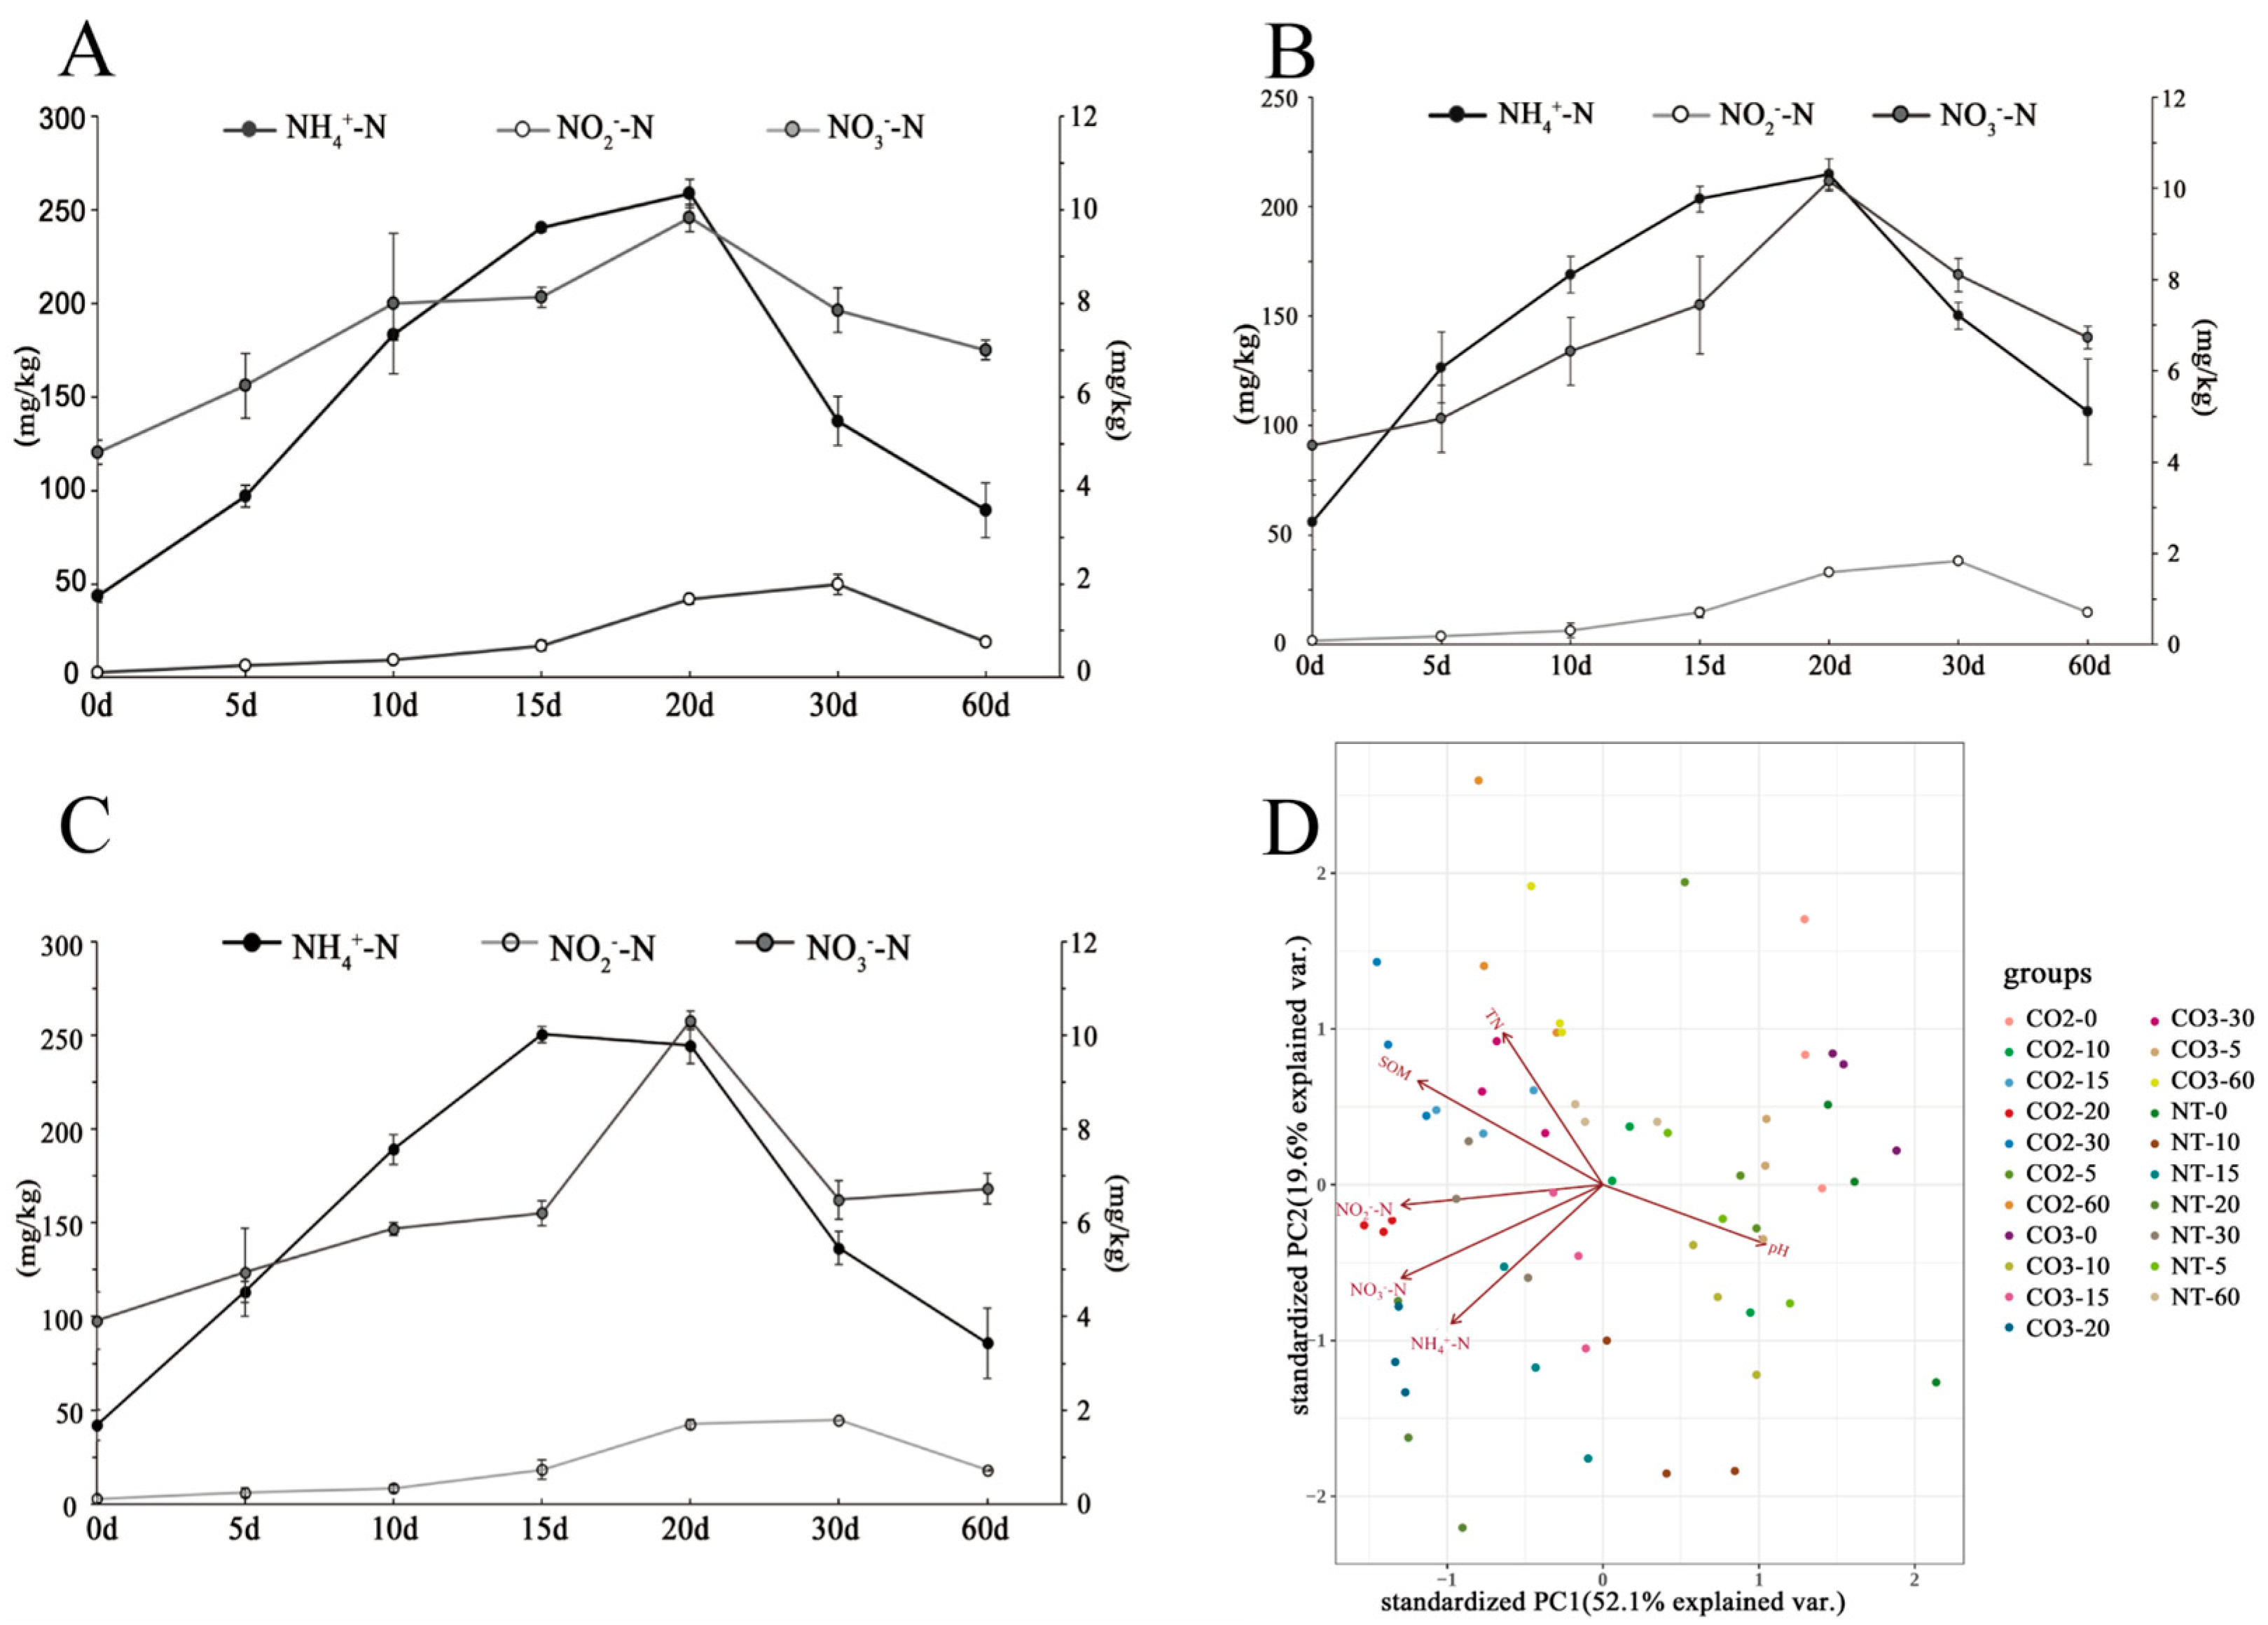
In this experiment, six indicators were measured in the soil on burial days 0, 5, 10, 15, 20, 30, and 60: soil pH, SOM, TN, NH4+-N, NO2-N, and NO3-N. The soil pH and TN content essentially remained constant during the burial of the three materials (CM8302, CM8303, and Si-144), with no significant differences among the materials sampled at the same time. The SOM content gradually increased with increasing leaf decomposition time. The concentrations of NH4+-N, NO2-N, and NO3-N all exhibited an “initial increase followed by a decrease” trend. The peak levels of soil NH4+-N, NO3-N, and NO2-N occurred at 15, 20, and 30 days of burial, respectively.
Based on the literature and our experimental data, we hypothesize that the first process involved in the soil nitrogen cycle is the mineralization of organic nitrogen from plant residues into NH4+-N by soil microorganisms, which generates intermediate products such as amino acids, amino sugars, purines, and pyrimidines. The second process is microbial assimilation. During soil nitrogen immobilization, microbial growth requires the uptake of nitrogen from the soil, incorporating NH4+-N and NO3-N into microbial biomass. Under certain conditions, this immobilized nitrogen can be remineralized, thereby replenishing inorganic nitrogen in the soil (Figure 2A–C).
One-way ANOVA revealed that 0 d, 5 d, 10 d, 15 d, 20 d, 30 d and 60 d after burial, there were no significant differences in soil pH, SOM, TN, NH4+-N, NO2–N, or NO3–N among CM8302, CM8303 and Si-144 (Table A3).
Principal component analysis (PCA) was performed for the physicochemical parameters of soil samples CM8302 and CM8303 and the receptor control 4144 (Figure 2D). The results revealed that soil pH contributed significantly to principal component 1 (PC1), while the NO3-N content was significantly negatively correlated with PC1. The TN content was significantly positively correlated with PC2, whereas the NH4+-N content was significantly negatively correlated with PC2. The scatter points corresponding to different soil samples clustered within the groups, indicating satisfactory repeatability within the groups, similar sample data, and good discrimination between different samples at the same time.

3.3. Soil Microbial Community Composition of Bt-Transgenic Maize

3.3.1. Sequencing Results and Assessment of the Soil Samples

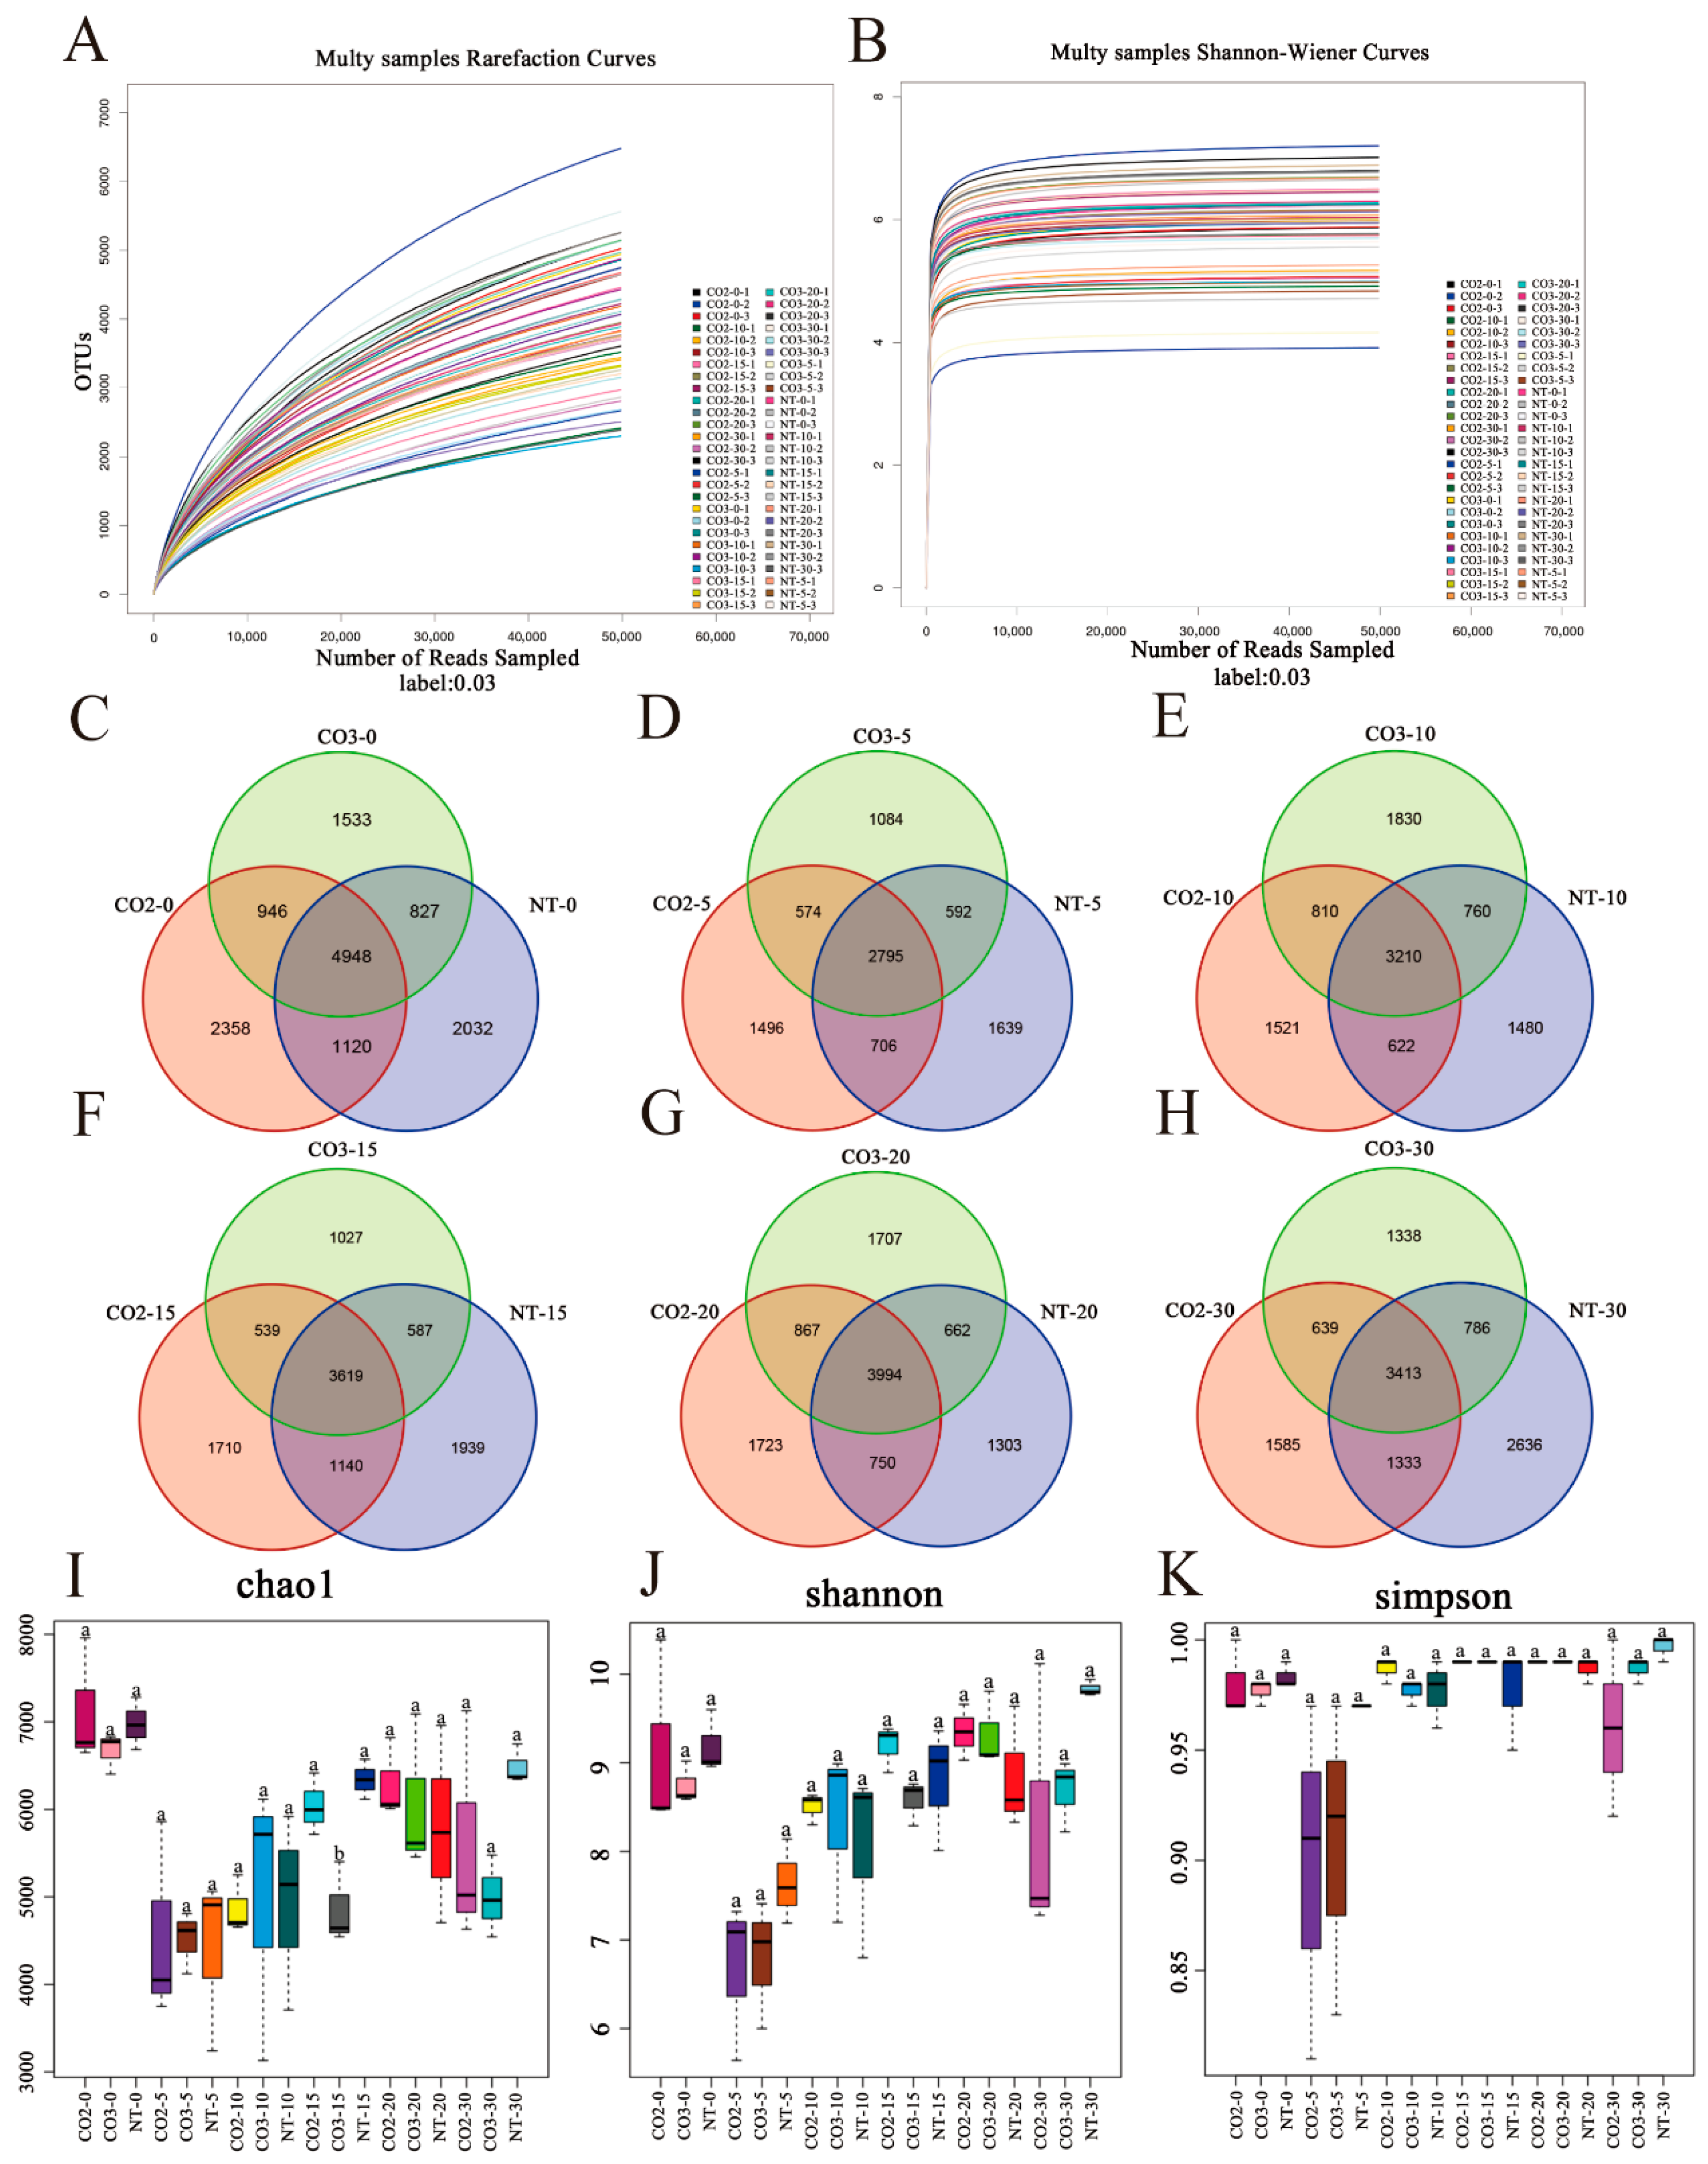
In this study, high-quality sequences (Clean_tags) from each sample were clustered during leaf degradation, yielding 23,695 OTUs based on 97% sequence similarity. The dilution curves, which are based on the observed number of OTUs and the Shannon index, showed a relatively flat trend, indicating a reasonable amount of sequencing data and sequencing depth covering almost all the species in the soil samples (Figure 3A,B).
Venn diagrams were constructed to analyze the community species composition, revealing unique OTUs that accumulated during different burial periods and showing differences in material composition and burial time (Figure 3C–H). The numbers of identical OTUs at each period were 4948, 2795, 3210, 3619, 3994, and 3413. Each stage presented a unique set of OTUs. The numbers of unique OTUs in Cry1A.401 transgenic insect-resistant maize CM8302 and CM8303 on day 0 of burial were 2358 and 1533, respectively; on day 5 of burial, the numbers of unique OTUs were 1496 and 1084, respectively; on day 10 of burial, the numbers of unique OTUs were 1521 and 1830, respectively; on day 15 of burial, the numbers of unique OTUs were 1710 and 1027, respectively; on day 20 of burial, the numbers of unique OTUs were 1723 and 1707, respectively; and on day 30 of burial, the numbers of unique OTUs were 1585 and 1338, respectively.

3.3.2. Alpha Diversity Analysis of Soil Microbial Communities

The differences between the transgenic and nontransgenic maize microbial communities were assessed using alpha diversity indices, including Good’s coverage, Chao1, Shannon, and Simpson indices. The results revealed that the sequencing libraries established in the Good’s coverage test all had coverage rates greater than 95%, indicating that the sequencing libraries in this study accurately reflected the microbial diversities of the samples. The Chao1 index showed that soil microbial community richness and diversity gradually increased with increasing burial time, and the Simpson index remained above 0.9, indicating high community diversity. In this study, there were no significant differences in these microbial community indices between the transgenic maize varieties CM8302 and CM8303 (p > 0.05), as shown in Figure 3I–K and Table A4.

3.3.3. Soil Microbial Community Beta Diversity Analysis

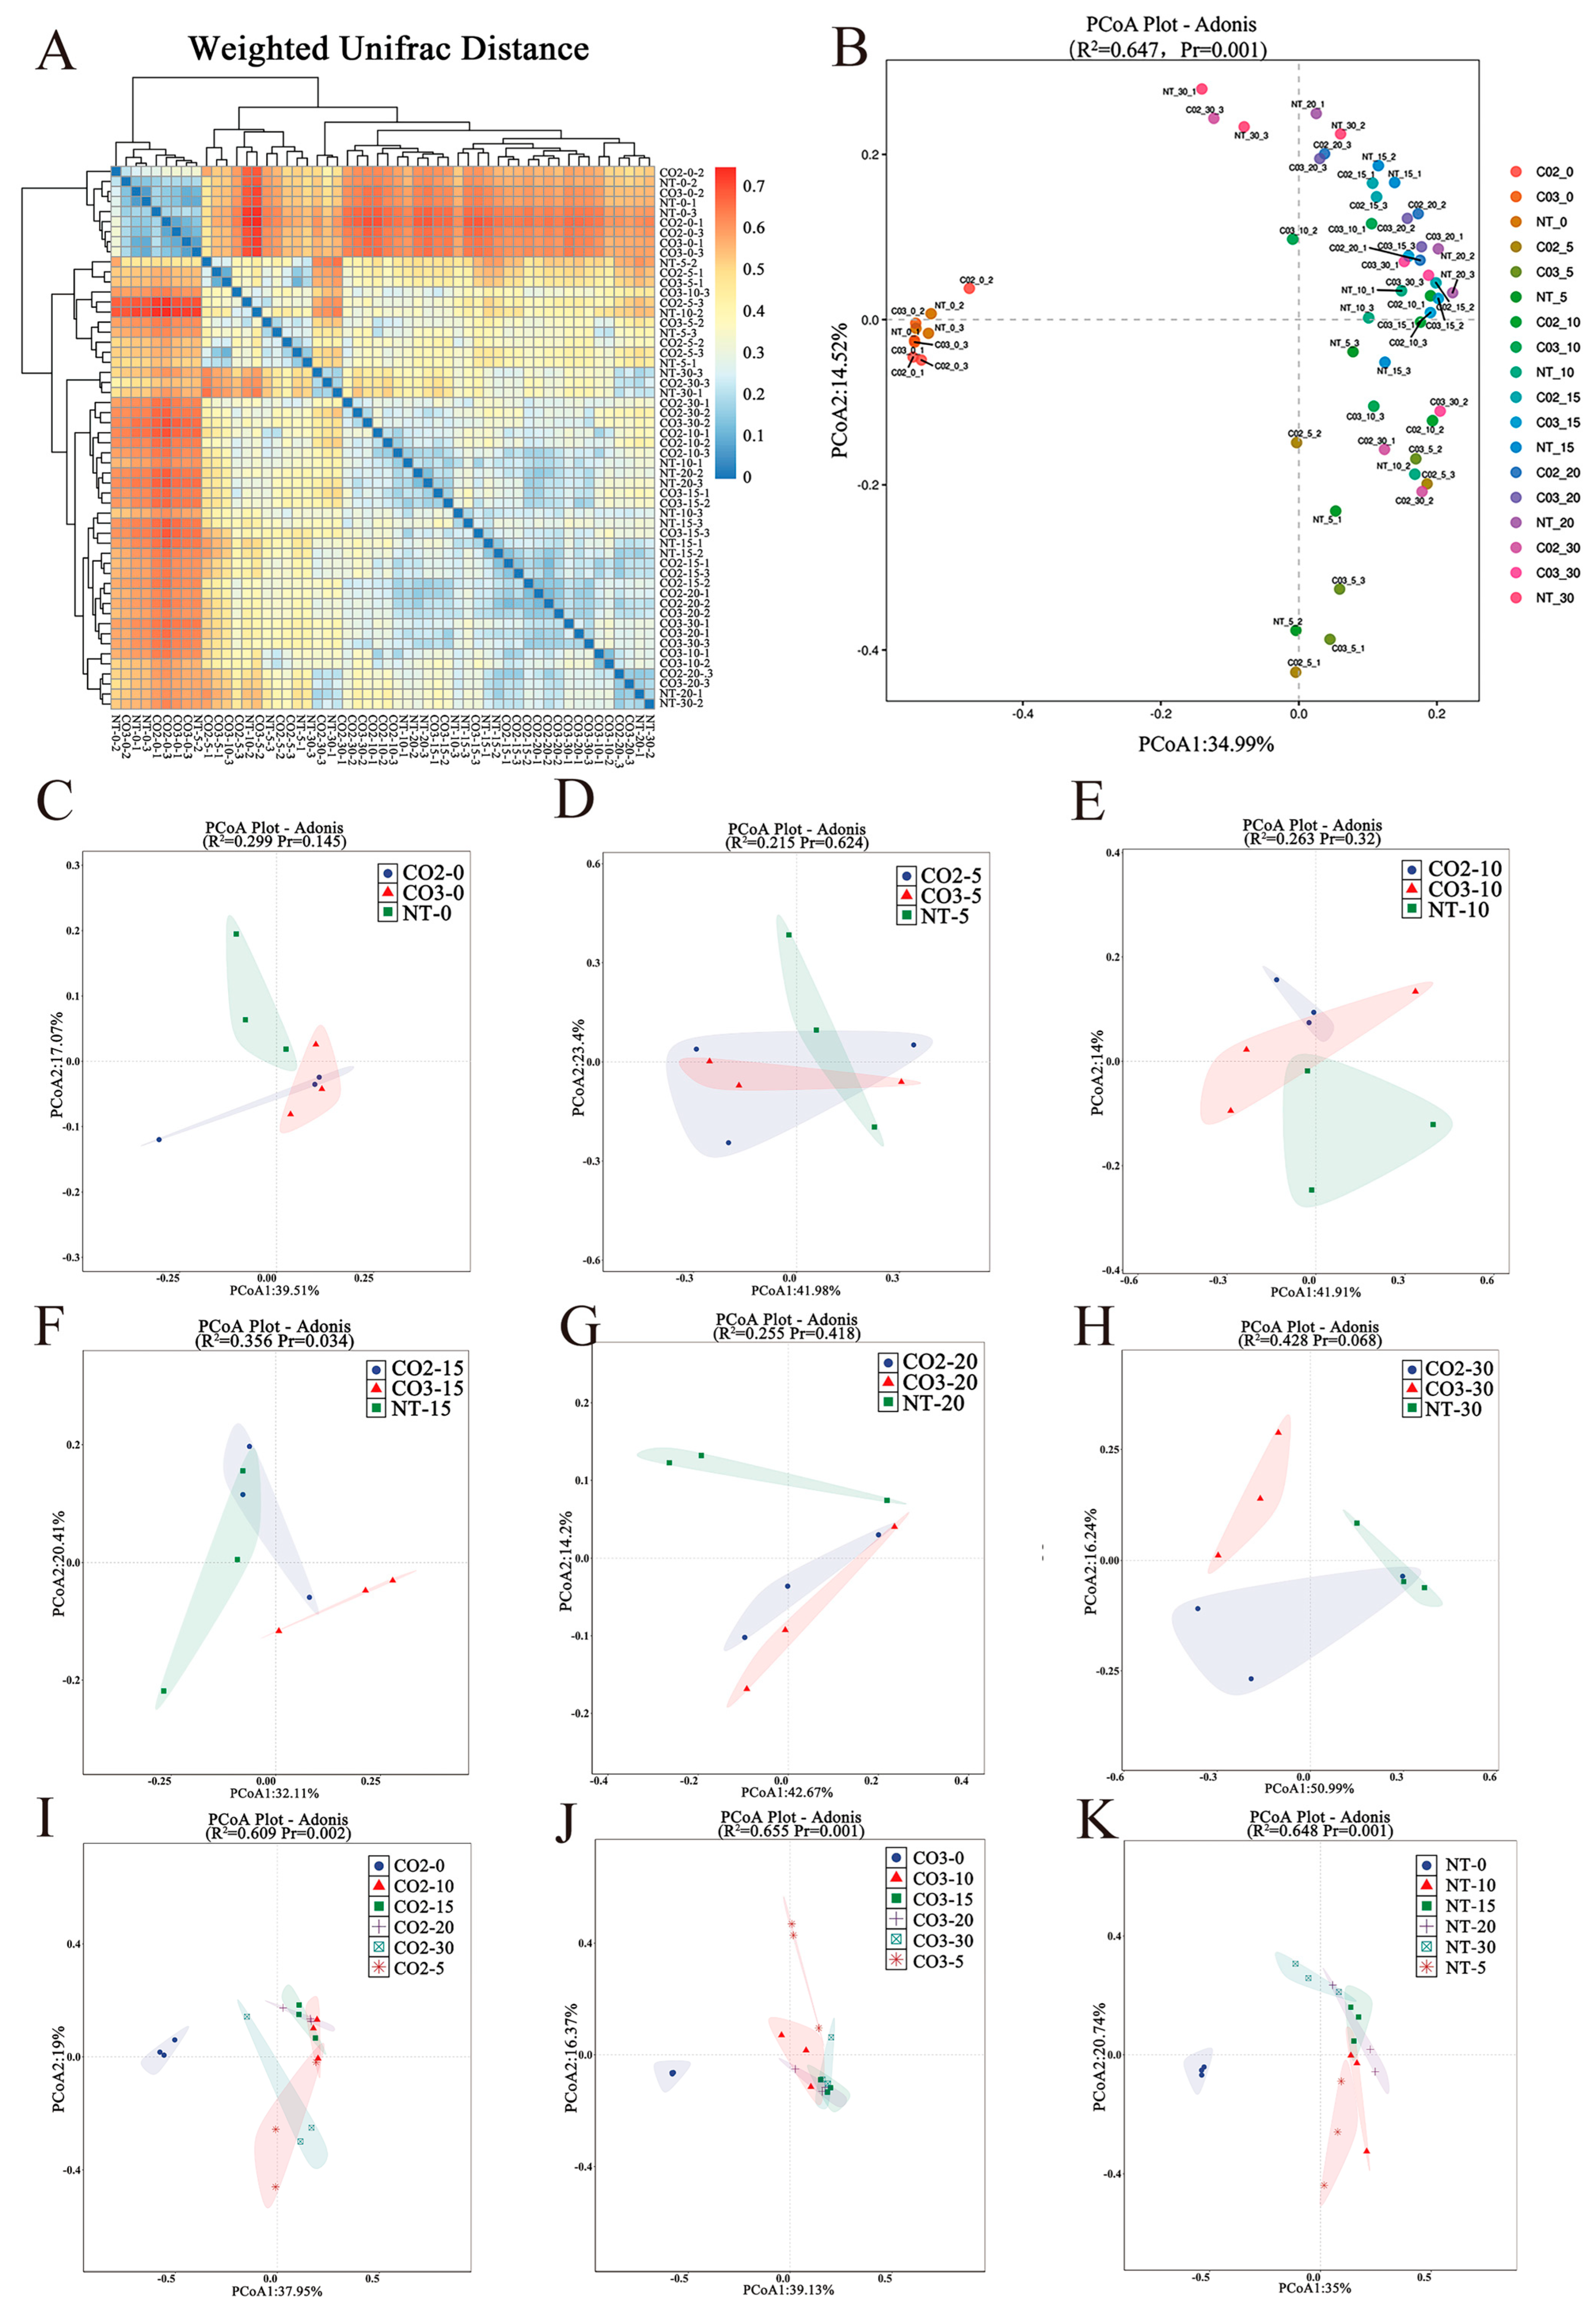
First, heatmap analysis based on the UniFrac distance matrix (Figure 4A) revealed significant intergroup differences in soil microbial community clustering at different time points during the degradation of Cry1A.401 gene-transgenic insect-resistant maize samples. This finding indicated a close relationship between the degree of community structure change and the burial process, with the soil bacterial community composition gradually changing as the straw decomposed. PCoA based on the weighted UniFrac and Bray–Curtis distance matrices revealed good intragroup repeatability and similarity of sample data after burial of insect-resistant transgenic maize and nontransgenic maize leaves at burial days 0, 5, 10, 15, 20, and 30. High similarity was observed among treatment groups within the same burial period. Combined with the results of the Adonis multivariate analysis, these results revealed significant changes in the soil microbial community structure after the burial of the leaves of the transgenic and nontransgenic maize plants at different times (p = 0.001) (Figure 4B).
Furthermore, PCoA was performed on different materials at the same burial sampling time (Figure 4C–H). The results revealed that at the same burial sampling time point, compared with the recipient control soil, Si-144, CM8302 and CM8303 showed no significant differences in the beta diversity of the microbial communities, except for a significant change in the microbial community structure on day 15 of burial (Figure 4F). An overall PCoA was performed for sequencing samples of the same material throughout the burial period (Figure 4I–K). The results indicated that the soil microbial community composition of different materials changed significantly throughout the burial period and that the diversity of the soil microbial community increased with increasing burial time.

3.3.4. Analysis of Soil Microbial Community Compositions and Their Differences

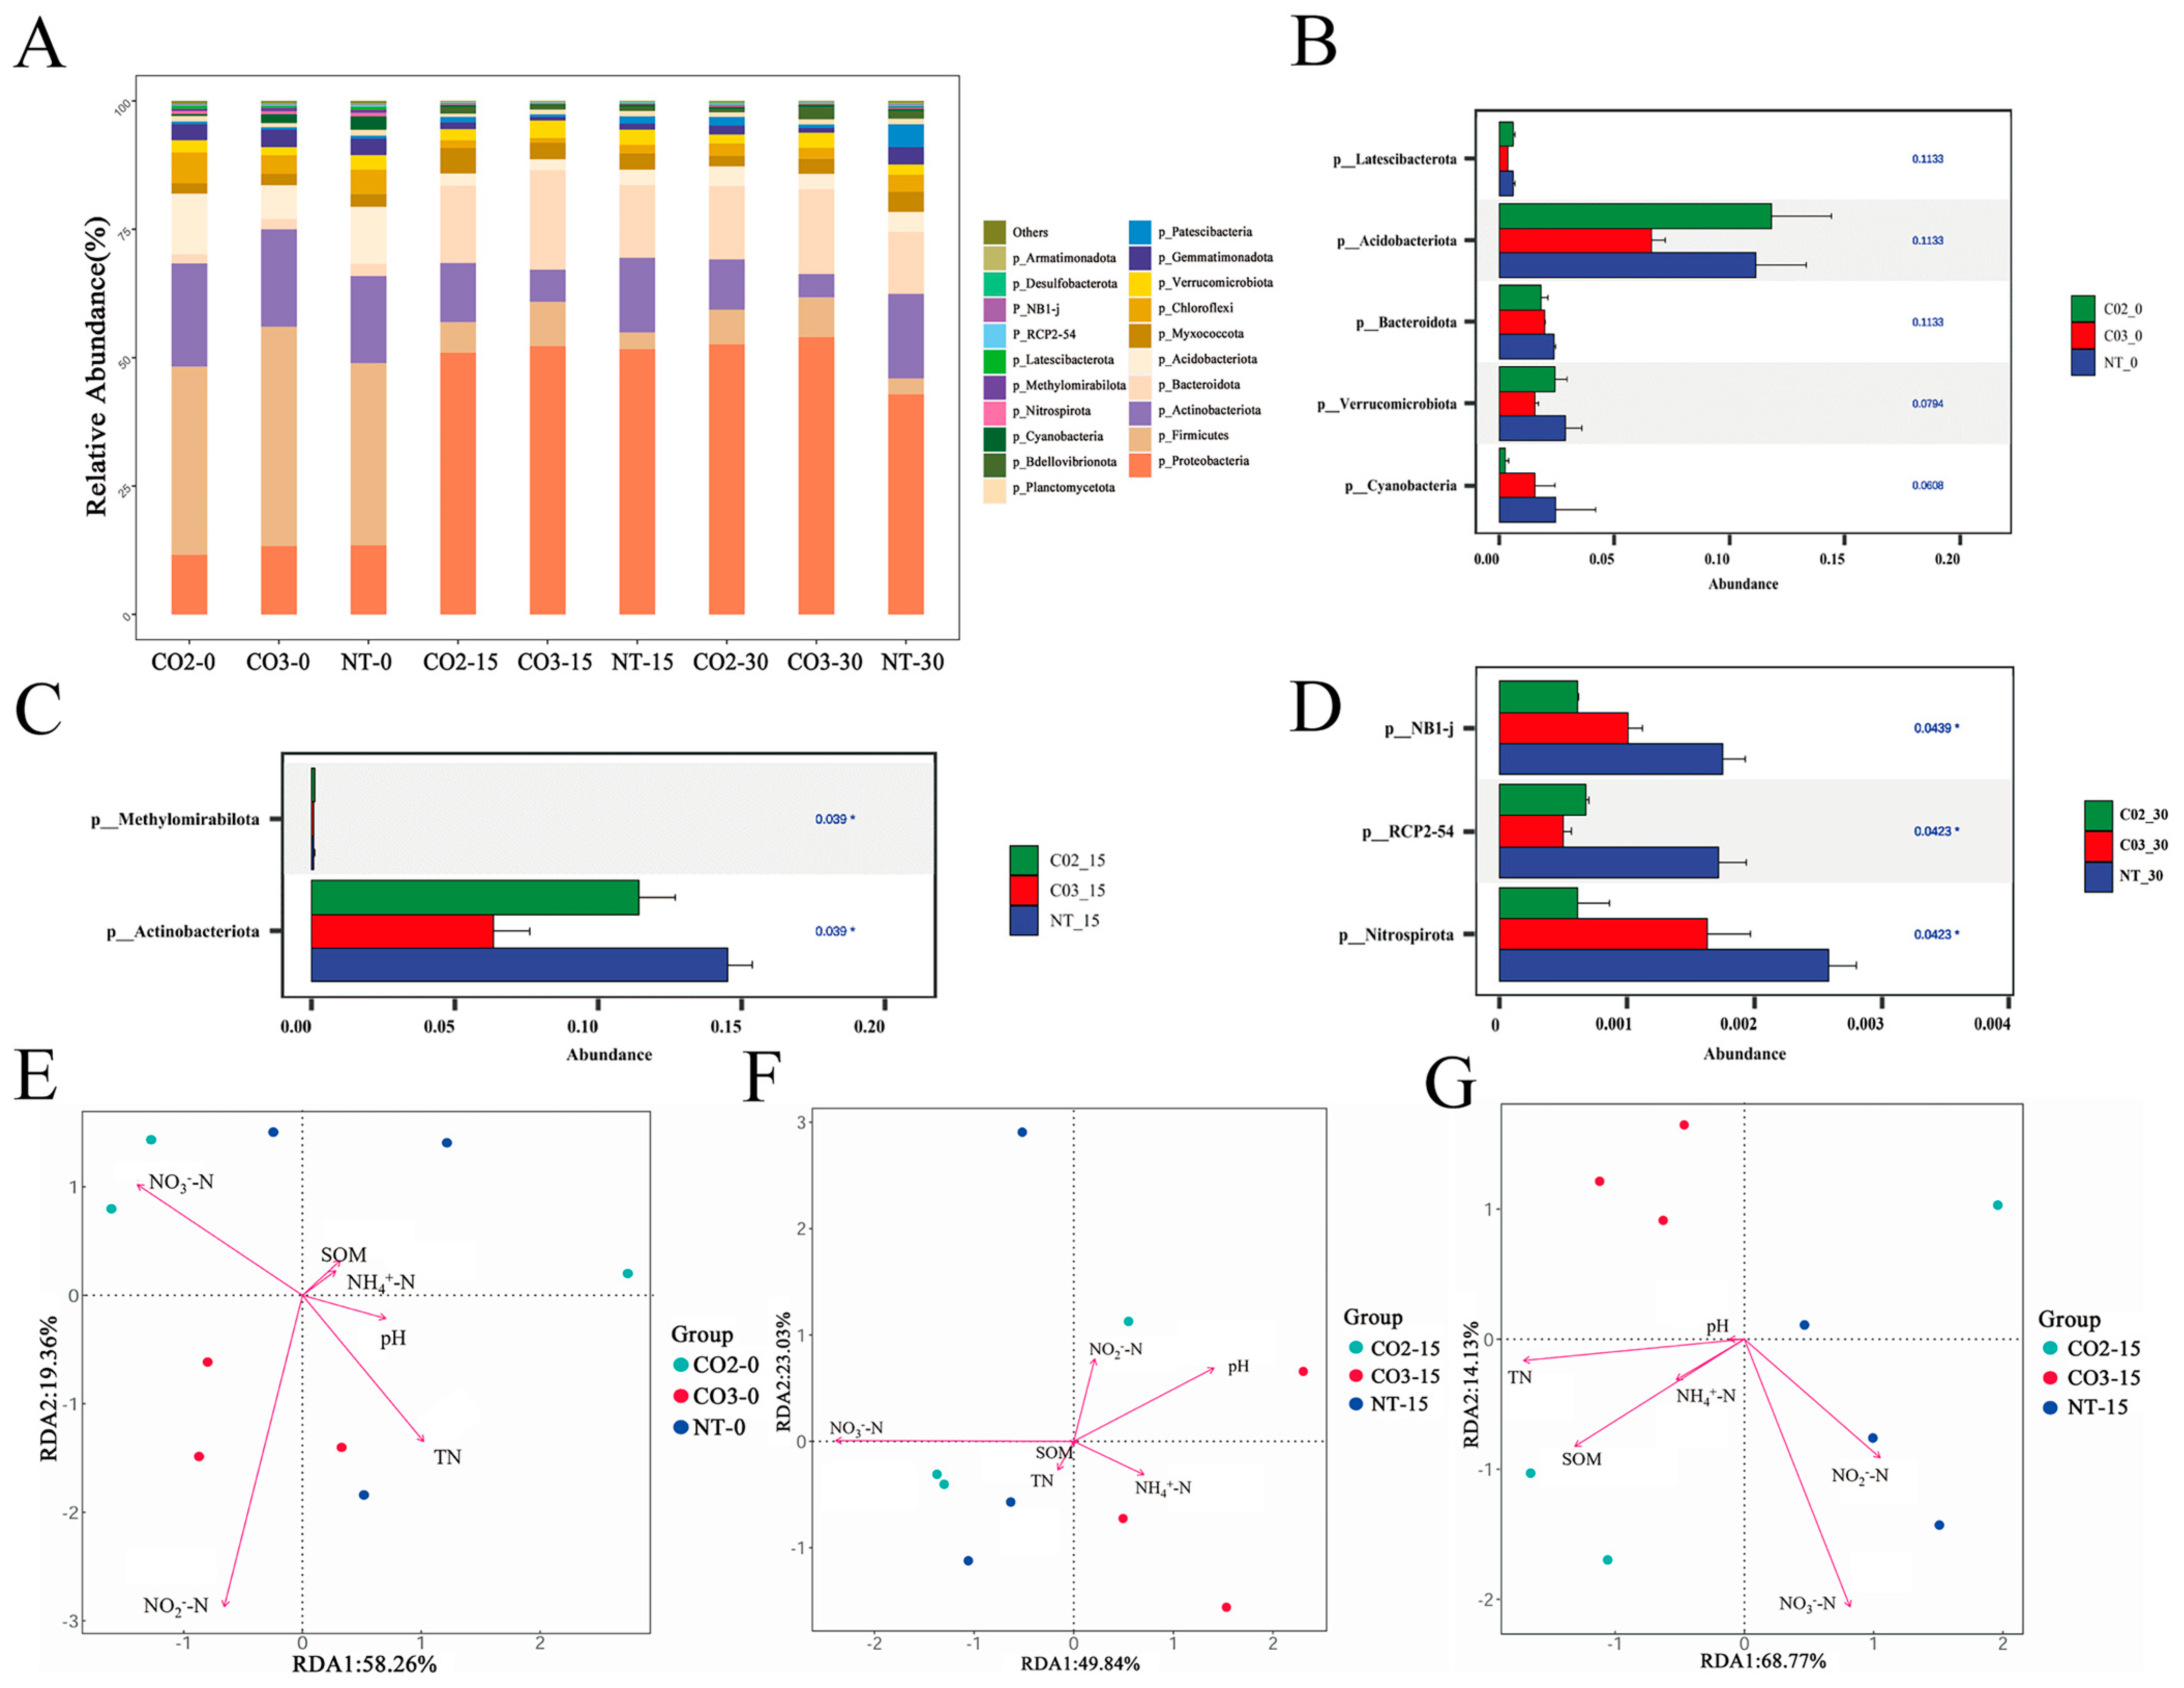
Linear discriminant analysis effect size (LEfSe) analysis was performed to identify potential biomarkers from the phylum to genus level (LDA score > 3). As both the residual amount of exogenous protein and the burial duration can influence soil microbial community composition, this study selected soil sequencing samples from the leaves of transgenic Cry1A.401 maize lines CM8302 and CM8303, along with the recipient control Si-144, collected at 0, 15, and 30 days of soil burial for subsequent analysis of soil microbial community characteristics and acquisition of OTU annotation information. In this study, 51 phyla, 140 classes, 368 orders, 572 families, 1137 genera, and 1407 species were annotated. The community composition at the phylum level for each treatment. In this experiment, the top 20 communities with relative abundances greater than 1% were identified as Proteobacteria, Firmicutes, Actinobacteria, Bacteroidetes, Acidobacteria, Myxococcota, Chloroflexi, Verrucomicrobiota, and Gemmatiformes. The phyla included Patescibacteria, Planctomycetota, Bdellovibriota, Cyanobacteria, Nitrospirota, Methylomirabilota, Latescibacterota, RCP2–54, NB1-j, Desulfobacterota, and Armatimonadota. The dominant bacterial phyla shared by the three soil samples were Proteobacteria, Firmicutes, Actinobacteria, Bacteroidetes, and Acidobacteria, whose cumulative relative abundances accounted for more than 75% of the entire community. The relative abundances of Proteobacteria and Actinobacteria first gradually increased but then stabilized with increasing burial time (Figure 5A).
The Kruskal–Wallis rank-sum test was used to analyze the differences in soil microbial communities among those buried in the same period, revealing the differences in species at the phylum and taxonomic levels (q value < 0.05). The selection criteria were a relative abundance greater than 1% and a ranking in the top 20. The results revealed no significant overall species differences among the Cry1A.401 gene-transgenic insect-resistant maize groups CM8302 and CM8303 or the recipient control group Si-144 (p > 0.05). Slight differences in the relative abundances of individual species at the phylum and taxonomic levels were observed at different burial times (Figure 5B–D).
Redundancy analysis (RDA) was used to explore the correlations between soil microbial communities and environmental factors, and the relationships between soil physicochemical properties and soil microbial community distributions at different degradation times in leaves from CM8302, CM8303, and the recipient control group Si-144 were examined (Figure 5E–G). On day 0 of burial, the results of subsequent Monte Carlo analysis (Table A4) revealed that the soil pH and TN, NH4+-N, NO2-N, NO3-N, and SOM contents had no effect on the initial soil microbial community structure after burial. On days 15 and 30 of burial, the soil NO3-N content was the main environmental factor causing changes in the soil microbial community structure.

3.3.5. Molecular Ecological Network Analysis of Soil Microbial Communities

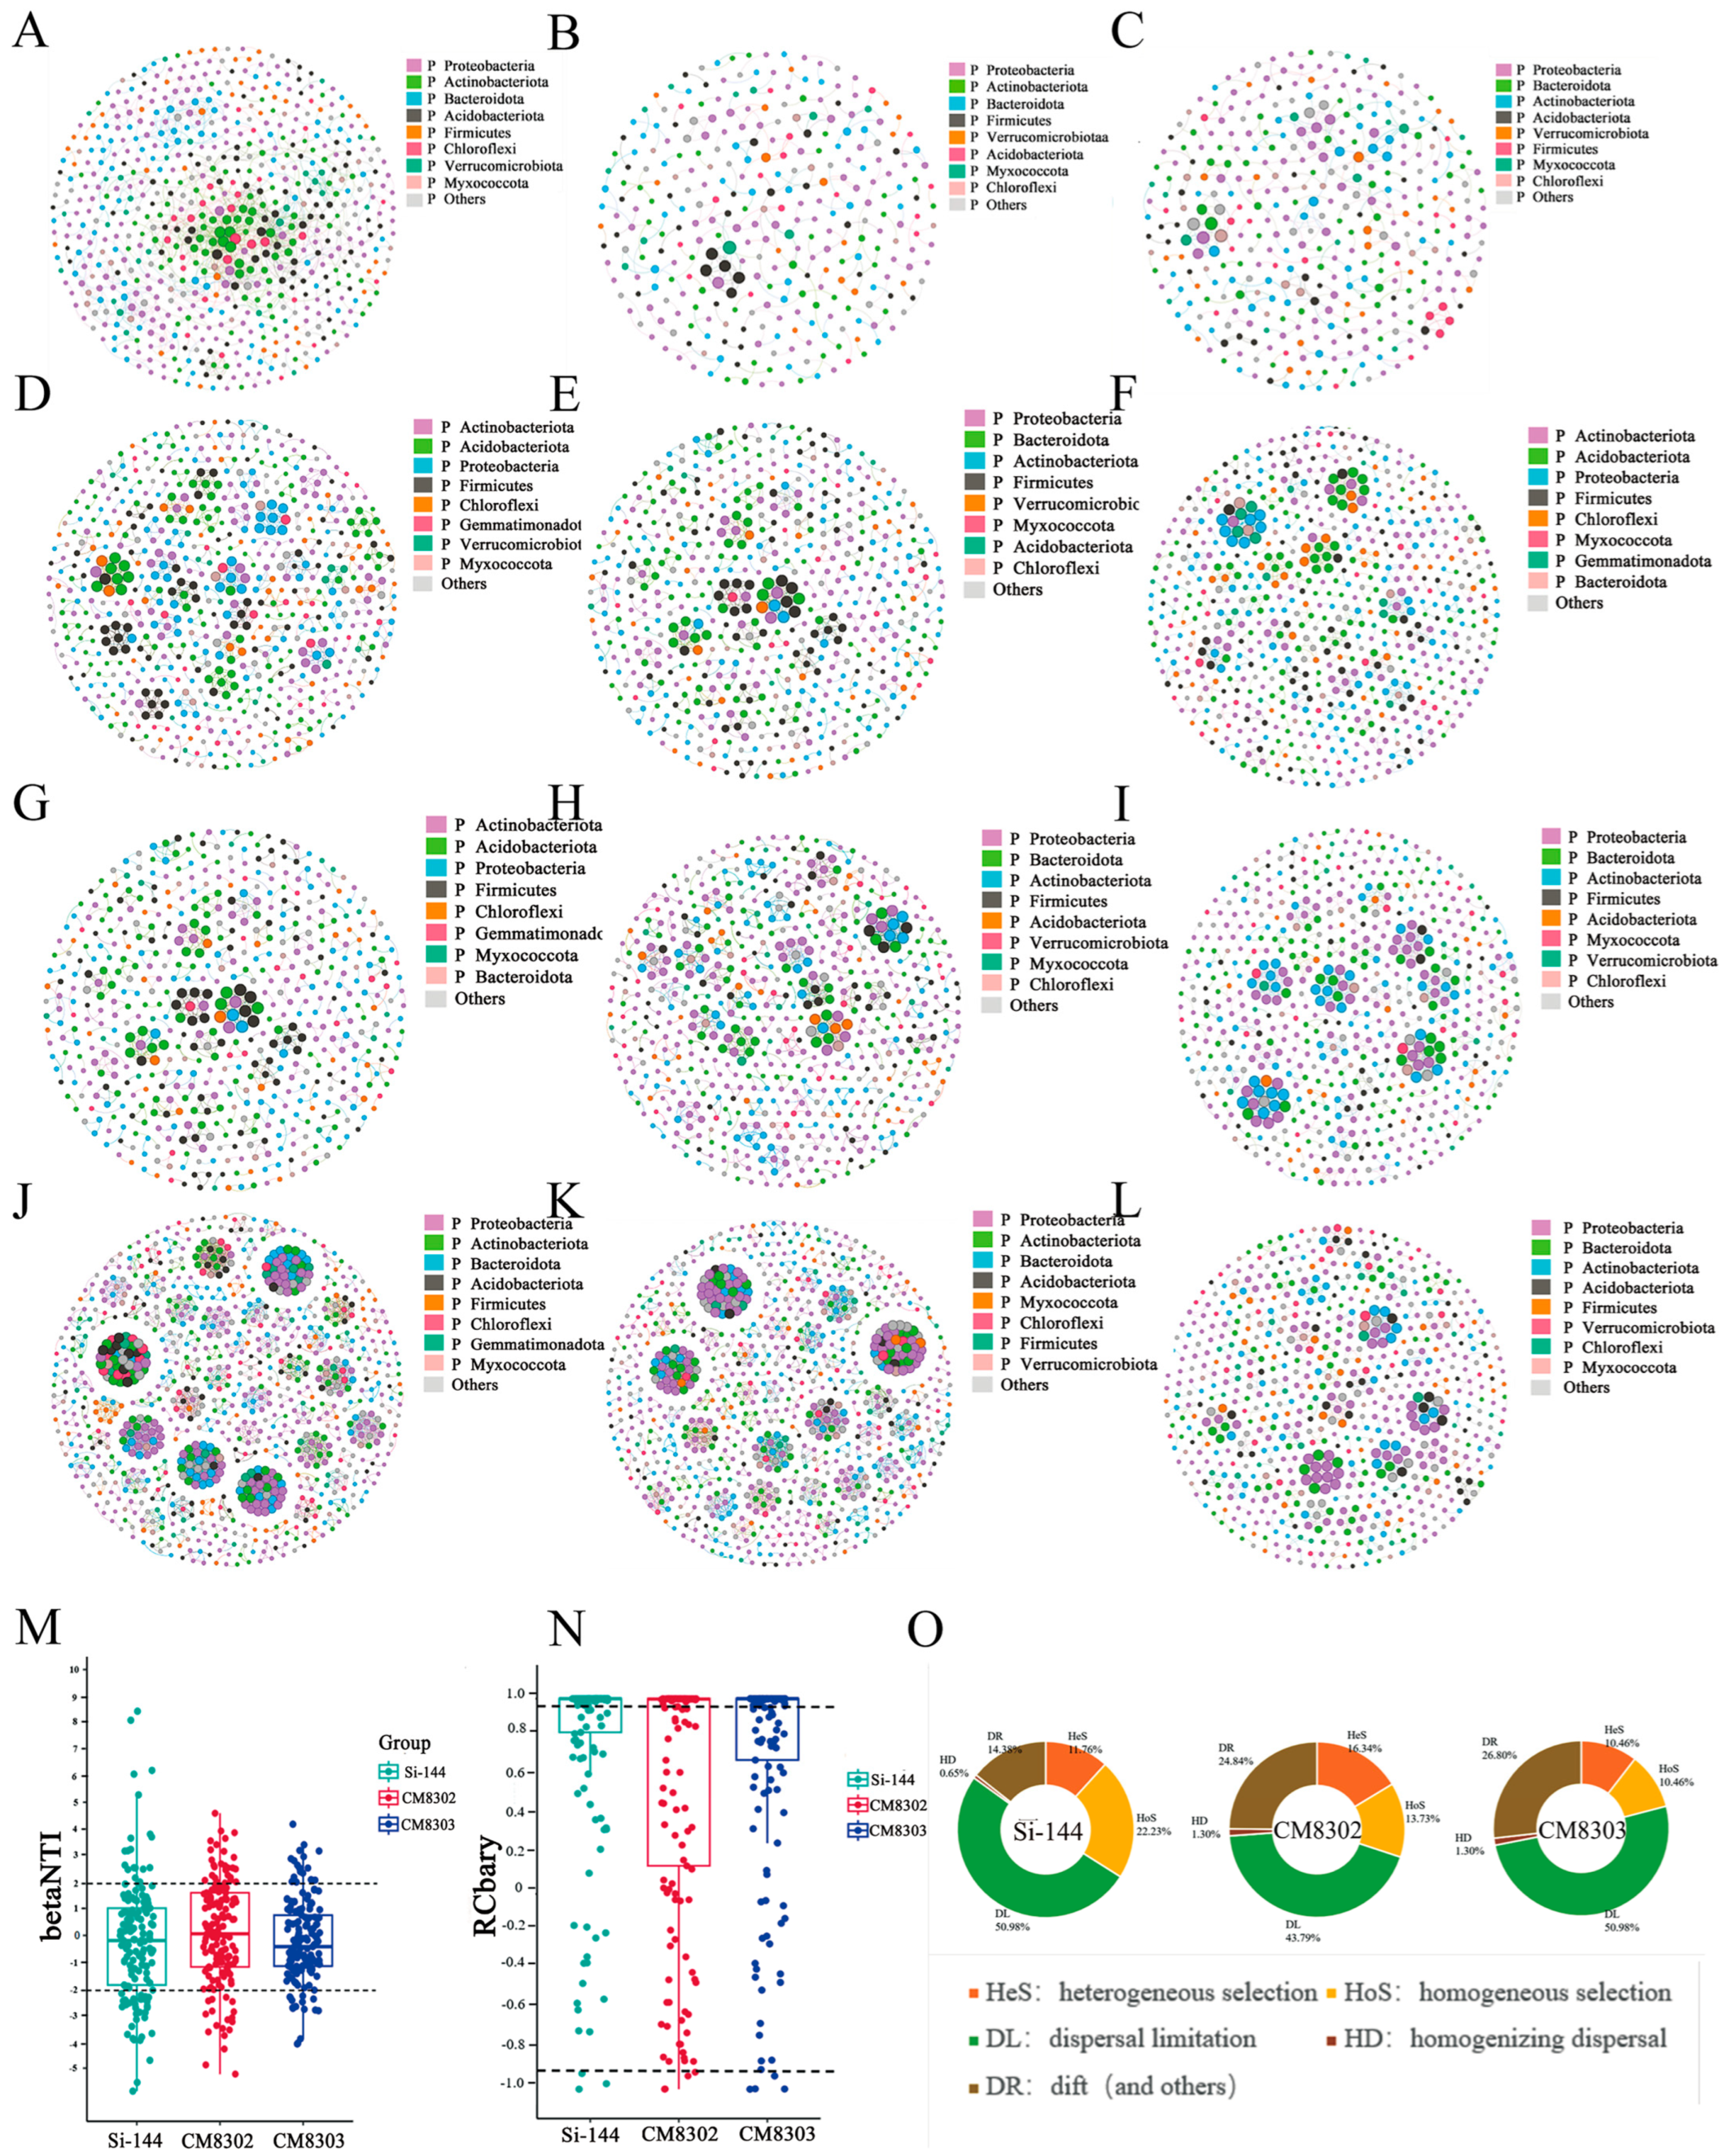
To investigate the interactions between soil microbial communities during the degradation of leaves from transgenic insect-resistant maize and nontransgenic maize, a co-occurrence network was constructed at the OTU level throughout the leaf degradation process (Figure 6). The topological properties of the soil microbial community molecular ecological network were calculated to characterize the interrelationships and network complexity, including the numbers of nodes and edges, average degree, network diameter, network density, modularity, average clustering coefficient, average path length, and positive/negative correlations.
The results revealed that the network of soil microorganisms during the degradation of leaves from the transgenic insect-resistant maize CM8302 (transgenic Cry1A.401 gene) consisted of 628 nodes and 1354 edges. The number of positively correlated edges (1272, 93.94%) was significantly greater than the number of negatively correlated edges (82, 6.06%). The average degree, network density, network diameter, and average path length of transgenic insect-resistant maize CM8302 were greater than those of the recipient control Si-144 throughout the leaf degradation process, indicating high levels of connectivity and tightness of the microbial network in the CM8302 soil samples. Conversely, compared with the recipient control, CM8303 had higher modularity and clustering coefficients throughout the leaf degradation process, indicating strong organizational order, a greater degree of functional differentiation, and stronger resistance to disturbance in all CM8303 soil samples. Furthermore, the co-occurrence networks of the CM8302, CM8303, and recipient control Si-144 leaves throughout the degradation process were predominantly positively correlated, with positive correlation coefficients of 93.94%, 78.41%, and 77.58%, respectively, indicating that coexistence was the dominant interaction among soil microbial communities during the degradation of insect-resistant maize leaves.
The molecular ecological networks of the soil microbial communities during the entire degradation processes of the CM8302, CM8303, and recipient control Si-144 leaves (Figure 6A–C) were annotated to eight bacterial phyla. Among them, Actinobacteria, Acidobacteria, Proteobacteria, Firmicutes, Chloroflexi, Verrucomicrobiota, Myxococcota, and Bacteroidota were the main nodes of the network, accounting for 92.03%, 89.8%, and 89.57% for the CM8302, CM8303, and recipient control Si-144 leaves, respectively. Proteobacteria, Bacteroidetes, Actinobacteria, Firmicutes, and Acidobacteria accounted for 79.93%, 77.56%, and 74.18% of all nodes for the CM8302, CM8303, and recipient control Si-144 leaves, respectively, which was not significantly different from the relative abundance in the phylum-level microbial community composition (Table A6).
OTU analysis of the molecular ecological network of communities among different treatment samples revealed that coexistence was the dominant mechanism among the microbial communities of different soil samples at the same burial time.

3.3.6. Soil Microbial Community Construction Mechanism

Finally, a null model was constructed to analyze the distribution patterns and underlying mechanisms of soil microbial communities during the degradation of the different tested materials. The beta nearest taxon index (βNTI) was used to assess the influences of deterministic and stochastic processes on the assembly of soil microbial communities from leaves buried with different materials. The results revealed that stochastic processes (|βNTI| < 2) dominated the microbial community degradation processes of all the samples (Figure 6M).
On the basis of the RCBray values, different ecological processes of the soil microbial community during leaf degradation were further evaluated (Figure 6N,O). The results indicated that diffusion restriction (DL) processes constituted most of the stochastic processes (50.98%), followed by ecological drift (DR) processes (14.38%), while homogeneous diffusion (HD) processes accounted for the lowest proportion (0.65%). The assembly of soil microbial communities from buried CM8302 and CM8303 leaves was dominated mainly by diffusion restriction during the stochastic process, indicating that diffusion restriction played a dominant role in shaping community assembly during such processes.
In summary, the soil microbial community construction processes of the buried leaves of insect-resistant maize (CM8302 and CM8303)-transgenic Cry1A.401 and the buried recipient control Si-144 were dominated by a random process, mainly diffusion restriction (Table A7).

4. Discussion

4.1. Degradation Patterns of the Cry1A.401 Protein in Different Transgenic Materials

Bt proteins can form binding proteins in soil ecosystems that are difficult to degrade. Once in the soil, Bt proteins undergo changes in spatial structure and activity, potentially reducing the exposure of nontarget soil organisms. Therefore, the retention and degradation kinetics of Bt insecticidal proteins released from Bt-transgenic crops in soil are key issues in environmental risk assessment [30]. In this study, the transgenic Cry1A.401 gene in insect-resistant maize from CM8302 and CM8303 was used for laboratory-simulated landfill degradation experiments. The results revealed that the degradation kinetics of this protein were essentially similar across different materials and were not affected by the material itself, which is consistent with the findings of previous laboratory studies on the degradation of Bt in rice, maize, and cotton straw. By using pure Bt protein, Bt cotton, and Bt corn as materials to study the degradation and retention of Bt protein in soil [40,41,42] and by using Bt rice as a material to study the degradation dynamics of Bt protein in water [43].
Most studies on the degradation dynamics of target proteins in transgenic crops in soil rely on the use of moving logarithmic and exponential models. In this study, the exponential model, owing to its good fit (R > 0.98), was applied to the degradation analysis of Cry1A.401 proteins in laboratory simulation soil. A fitted exponential equation model was then used to calculate the DT50 and DT90 values of Cry1A.401 protein degradation in Bt maize leaves in soil as 6.37 d and 6.45 d and 14.30 d and 14.74 d, respectively. These results indicate that under suitable soil conditions, most Bt proteins can be degraded by more than 90% within a few days.

4.2. Effects of Genetically Modified Maize Leaf Degradation on Soil Physicochemical Properties

Returning crop straw to the field can regulate the ecological balance of the soil, alleviate the metabolic stress on microorganisms and crops, and thus promote the accumulation of SOM. Numerous studies have shown that during the straw return of different transgenic crops, except for a few periods when some soil physicochemical indicators may increase or decrease, the overall soil physicochemical properties are unaffected by the transgenic material. Previous studies have shown that the return of Bt maize DK647BTY straw to the field can significantly increase soil organic matter content. However, at 90 days after the incorporation of Bt maize 34B24 straw, soil available phosphorus and available potassium were significantly reduced, whereas no marked differences were observed in soil organic matter, total nitrogen, alkali-hydrolyzable nitrogen, total phosphorus, or total potassium compared with the treatment using straw from its near-isogenic non-Bt counterpart 34B23 [44]. The results of this study indicate that the soil physicochemical properties remained essentially unchanged during each burial period and that there were no significant differences between the materials.
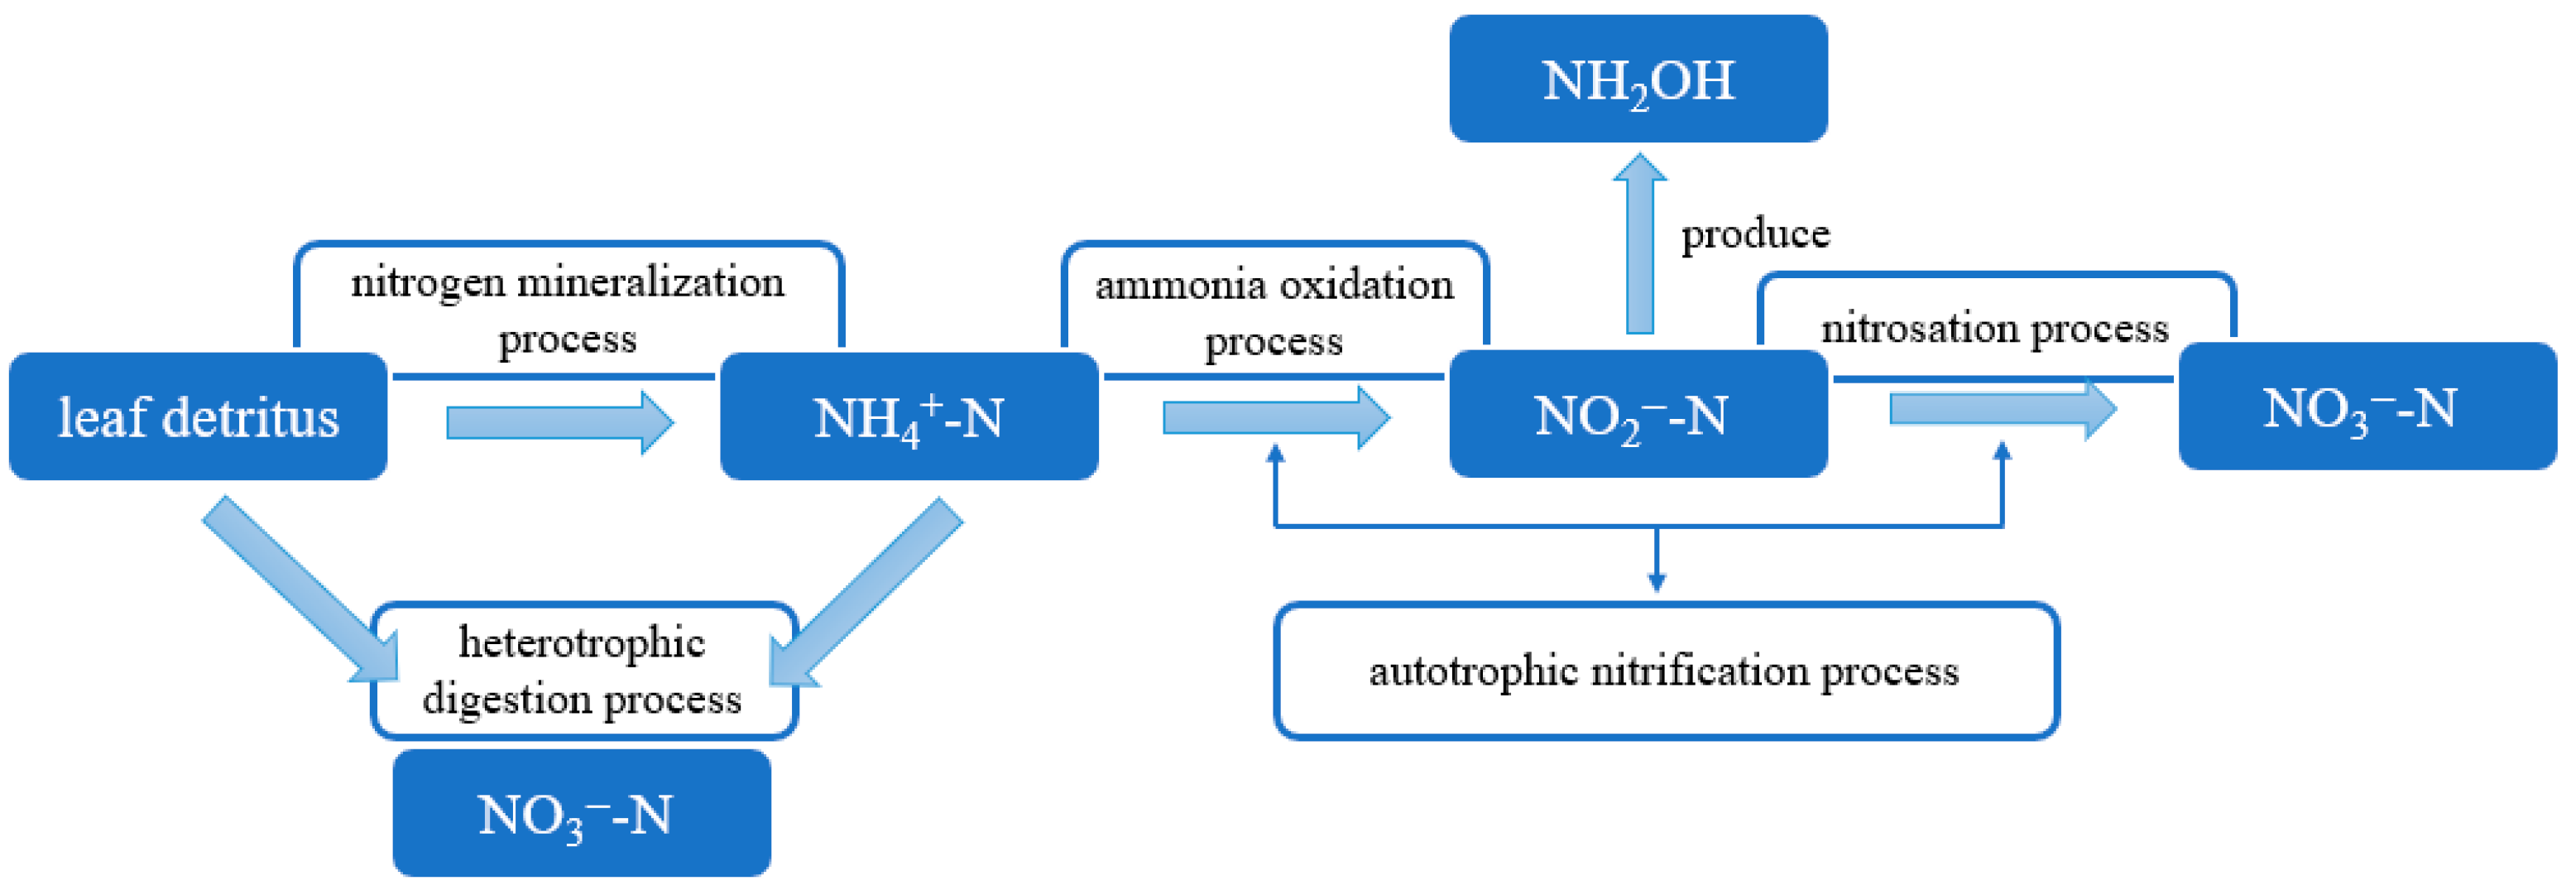
Soil nitrogen cycling includes mainly nitrogen input, soil nitrogen output, and soil nitrogen transformation processes. Soil nitrogen input includes the decomposition of plant and animal remains, biological nitrogen fixation, and atmospheric nitrogen fixation. Through processes such as organic nitrogen mineralization, nitrification and denitrification, and microbial assimilation, soil nitrogen is transformed into another form of nitrogen (NH4+-N). Soil ammonium nitrogen is first oxidized to nitrite by nitrifying bacteria and then further oxidized to nitrate by nitrifying bacteria. This process is referred to as nitrification, in which NH4+-N in the soil is consumed and in which the nitrate nitrogen content is increased. Excessive nitrate nitrogen in the soil promotes the denitrification process, causing the loss of NO3-N from soil and damaging the ecological environment [45]. On the basis of the literature [46], we speculate that the nitrogen cycle in soil mainly includes the following two processes (Figure 7). The first process involves plant residues that need to be mineralized and converted into NH4+-N by soil microorganisms, followed by the transformation of nitrogen in the soil and the autotrophic nitrification process. The second process involves microbial assimilation. In addition, by considering our experimental environmental factors, we adopted a laboratory simulation degradation experiment. A tight and airtight sealed environment reduce cumulative CO2 emissions during the decomposition of plant residues. Lignin in leaves is difficult to degrade. Therefore, lignin is considered the main component of SOM [47]. The lignin content in the soil decreases with increasing burial time, thereby increasing the content of SOM. These factors may explain the increasing trend in SOM content.
To study the effects of no-tillage and crop straw return on TN transformation and the further volatilization of NH3 in soil, 15 N tracer field monitoring and paired 15 N label culture combined experiments were conducted. The results revealed that long-term no-tillage with corn straw mulch improved the retention capacity of ammonium nitrogen and reduced NH3 loss in Mollisol soil in Northeast China [48]. In this experiment, we hypothesized that during leaf degradation, organic nitrogen would undergo mineralization and be transformed into inorganic nitrogen before entering the soil. This inorganic nitrogen would then be utilized by microorganisms to support their growth and reproduction. This phenomenon led to a gradual decrease in the TN content of the soil. However, because leaves contain some lignin that is difficult to decompose, this lignin gradually decomposes over time, especially when the plant leaves are buried in the soil, while the nitrogen content in the soil stabilizes, resulting in a dynamic equilibrium.

4.3. Impacts of Genetically Modified Insect-Resistant Maize Leaves on Soil Microbial Communities

Soil microorganisms, as the most active organic organisms in soil, play crucial regulatory roles in shaping nutrient cycling and the decomposition of organic carbon and organic nitrogen. Returning crop residues to the field can improve soil physicochemical properties, which are related to the species, abundance, and diversity of the soil microbial community. Therefore, microbial community characteristics can serve as standard ecological indicators for monitoring ecosystem health. Our results revealed that compared with those of the recipient control soil at various burial periods, the Good’s coverage index, Shannon index, and Simpson index of the soil microbial community did not significantly differ during the leaf degradation of the Cry1A.401 gene-transgenic insect-resistant maize varieties CM8302 and CM8303. These results were consistent with those of previous studies [49,50,51,52].
An analysis of the soil microbial community composition revealed that Proteobacteria, Firmicutes, Actinobacteria, Bacteroidetes, and Acidobacteria were the dominant phyla in each treatment. Furthermore, the relative abundances of Proteobacteria and Actinobacteria gradually increased with increasing burial time, while the relative abundances of Bacteroidetes, Firmicutes, and Acidobacteria showed the opposite trend. To study the effects of different straw return treatments on the rhizosphere microbial community composition of the resulting crop [53]. established three treatments, namely, straw sterilization, direct straw return to the field, and a blank control. The results revealed that Proteobacteria, Acidobacteria, Actinobacteria, Bacteroidetes, Bacillus, and Chlorconoids were the dominant phyla among the rhizosphere microorganisms of the subsequent crop. With increasing years of straw incorporation, the relative abundance of Proteobacteria and Acidobacteria increased, while that of Actinobacteria declined. The relative abundance of Bacteroidetes remained relatively stable. These findings are consistent with the results observed in the present study.
The results of environmental factor correlation analysis in this study revealed that the soil NO3-N content was the main environmental factor affecting the composition of the soil microbial community during the degradation of Cry1A.401 gene-transgenic insect-resistant maize leaves. On day 15 after burial, Actinobacteria, Acidobacteria, Chlorobacteria, Cyanobacteria, and NB1-j were significantly positively correlated with NO3-N, whereas Bacteroidetes was significantly negatively correlated. The effects of straw return on soil nitrate and ammonium nitrogen contents varied. Conversely, some studies have shown that straw return significantly reduces soil nitrate nitrogen content and decreases residual nitrate nitrogen [54]. In summary, soil physicochemical properties are key factors in shaping the microbial community.
In recent years, the coexistence and competitive relationships between related species, which may be related to niche preferences [55], have been crucial for understanding the stability of microbial ecosystems [56]. This study shows that the leaves of insect-resistant maize transgenic Cry1A.401 plants CM8302 and CM8303 and the control recipient Si-144 were predominantly positively correlated throughout the degradation process and among the soil microbial communities of different materials during the same burial period, with coexistence being the dominant factor. The possible reasons are that the degradation of maize leaves increased the accumulation of SOM, providing a carbon source for soil microorganisms, reducing competition and exclusion among soil microorganisms, and making coexistence among microbial species possible, thus leading to significant niche differentiation. Studies have shown that highly nitrogen-enriched paddy soils have more stable microbial networks and can better maintain soil ecological functions to address environmental changes such as climate and precipitation [56]. Moreover, excessive nitrogen addition intensifies competition among microbial species [57]. Dominant groups are highly important for the stability of soil microbial ecosystems. In this study, CM8302, CM8303 and the recipient control Si-144 leaves were annotated with a total of 9 bacterial phyla in the molecular ecological network of soil microbial communities throughout the burial period. Proteobacteria, Actinobacteria, Bacteroidetes, Acidobacteria and Firmicutes accounted for more than 75% of all nodes, which is not much different from the relative abundance in the composition of microbial communities at the phylum level. In addition, the relative abundance of Proteobacteria was relatively high. This phylum has a variety of species in the soil, which increases the cooperation and competition among species and further confirms that there is niche differentiation in soil microbial communities during laboratory simulations of degradation.
Elucidating community-building mechanisms helps us to better understand the causes of species composition in a given habitat and predict the direction of community composition succession after changes in environmental factors. This study revealed that the soil microbial communities in the buried leaves of the insect-resistant maize varieties CM8302 and CM8303 (transgenic with the Cry1A.401 gene) and the recipient control Si-144 were dominated by random processes and controlled by diffusion limitations. This phenomenon may be due to the different relative abundances of dominant phyla among the soil microorganisms in different materials, leading to different coexistence relationships in the molecular ecological network and differences in ecological characteristics [58,59]. Studies have shown that the ecological construction process of microbial communities is often related to the size of the study area [60], and small environmental changes may lead to random assembly, whereas large changes may trigger deterministic assembly [60,61,62]. In addition, the impacts of operational errors on the microbial community-building process cannot be ignored. Integrated microbiome and metabolome analyses, elucidating the interrelationships among soil microorganisms, metabolites, and exogenous Bt insecticidal proteins from multiple perspectives and levels, represent an important direction for future research. In future research, we should increase the number of samples, increase the sample size, and expand the research area to further explore the characteristics and construction mechanism of the microbial community of insect-resistant corn stalks transgenic with the Cry1A.401 gene in the soil.

5. Conclusions

In this study, the insect-resistant maize varieties CM8302 and CM8303, which are transgenic for the Cry1A.401 gene, along with its receptor control Si-144, was selected as experimental material. Laboratory-simulated leaf degradation was performed, and a degradation model of the Cry1A.401 protein was developed to characterize its degradation behavior. The degradation pattern exhibited an initial rapid phase, followed by a slower decline in the mid-to-late stages, eventually stabilizing. Using Illumina MiSeq 16S rDNA high-throughput sequencing combined with soil physicochemical analysis, the assembly mechanisms and driving factors of the microbial community were investigated. During degradation, soil pH, TN, SOM, NH4+-N, NO2-N, and NO3-N showed generally consistent trends, while no significant differences were observed in the α-diversity or β-diversity of the soil microbial community. NO3-N content was identified as a key factor influencing soil microbial community composition during maize leaf degradation. Interactions among soil microbial communities were primarily characterized by coexistence, and their assembly process was stochastic and dominated by dispersal. These findings provide important evidence for the environmental safety evaluation of the transgenic insect-resistant maize varieties CM8302 and CM8303.

Author Contributions

Q.Z.: Resources; writing—review and editing; writing—original draft; formal analysis. H.C.: Formal analysis. S.L.: Formal analysis. Y.L.: Formal analysis. K.X.: Formal analysis. Y.P.: Formal analysis. Y.C.: Formal analysis. H.D.: Formal analysis. L.Z.: Formal analysis. L.D.: Formal analysis. Y.Z.: Formal analysis. J.Z.: Formal analysis. J.X.: Formal analysis. C.L.: Formal analysis. Z.W.: Writing—review and editing; X.Z.: Writing—original draft; Formal analysis. All authors have read and agreed to the published version of the manuscript.

Funding

This research received no external funding.

Data Availability Statement

All the sequencing data that support the findings of this study are openly available in NCBI under submission numbers SUB15803945, BioProject accession number PRJNA1372394, https://www.ncbi.nlm.nih.gov/sra/PRJNA1372394 (accessed on 26 December 2025).

Acknowledgments

We would like to thank Xinhai Li and Jianfeng Weng at the Institute of Crop Sciences, Chinese Academy of Agricultural Sciences, for their kind gift of the BT maize CM8302 and CM8303. We are grateful to Jianfeng Weng, Chunqing Pan, and Tingting Lv for their intellectual contributions.

Conflicts of Interest

Author Yujuan Li was employed by the company Baoding Agricultural Development Group Co., Ltd. The remaining authors declare that the research was conducted in the absence of any commercial or financial relationships that could be construed as a potential conflict of interest.

Appendix A

Appendix A.1

Table A1. Index model of Cry1A.401 protein degradation in soil.
Material NameIndex ModelRpDT50 (d)DT90 (d)
CM8302y = 1.1057e−0.1245 t0.9870<0.00016.3714.30
CM8303y = 1.0922e−0.1211 t0.9862<0.00016.4514.74
Note: Y(t) is the amount of residual protein in the soil at time t, t is the decomposition time (d), and A, k, and e are constants.

Appendix A.2

Table A2. Dynamics of Cry1A.401 protein residues after degradation in soil.
Degradation Time Cry1A.401 Protein Degradation in CM8302% Cry1A.401 Protein Degradation in CM8303%
0100.00100.00
193.9193.03
286.7685.93
380.7579.53
479.2673.58
569.0567.65
654.5357.69
748.9250.07
843.1347.78
937.2742.81
1031.9736.78
1129.4228.79
1222.2821.78
1318.3917.71
1410.9310.03
159.579.31
169.389.16
178.078.30
188.007.92
197.377.31
206.676.84
305.875.26
453.473.84
601.501.59
900.560.87

Appendix A.3

Table A3. Changes in soil physical and chemical properties over time in each treatment.
Soil SampleTN/%NO2-N/(mg/kg)SOM/%NO3-N/(mg/kg)Soil pHNH4+-N/(mg/kg)
NT_00.315 ± 0.006 a0.100 ± 0.087 a1.359 ± 0.043 a4.808 ± 0.256 a7.03 ± 0.050 a43.327 ± 3.031 a
C02_00.321 ± 0.006 a0.087 ± 0.025 a1.402 ± 0.029 a4.368 ± 0.759 a6.89 ± 0.090 a55.840 ± 12.478 a
C03_00.320 ± 0.003 a0.110 ± 0.078 a1.370 ± 0.064 a3.913 ± 0.614 a6.97 ± 0.080 a42.009 ± 8.292 a
NT_50.317 ± 0.004 a0.250 ± 0.061 a1.345 ± 0.002 a6.241 ± 0.687 a6.56 ± 0.130 a96.899 ± 5.741 b
C02_50.323 ± 0.006 a0.177 ± 0.025 a1.400 ± 0.076 a4.954 ± 0.736 a6.74 ± 0.115 a126.497 ± 16.240 a
C03_50.320 ± 0.001 a0.240 ± 0.087 a1.365 ± 0.026 a4.937 ± 0.940 a6.78 ± 0.200 a113.152 ± 5.426 ab
NT_100.316 ± 0.005 a0.380 ± 0.036 a1.326 ± 0.013 b8.001 ± 1.495 a6.67 ± 0.080 a183.085 ± 2.718 a
C02_100.322 ± 0.005 a0.307 ± 0.162 a1.373 ± 0.023 a6.430 ± 0.741 ab6.64 ± 0.200 a168.850 ± 8.382 b
C03_100.320 ± 0.002 a0.327 ± 0.071 a1.344 ± 0.006 ab5.874 ± 0.143 b6.88 ± 0.120 a189.180 ± 7.946 a
NT_150.319 ± 0.003 a0.680 ± 0.110 a1.441 ± 0.010 c8.126 ± 0.221 a6.50 ± 0.180 a240.454 ± 0.073 b
C02_150.324 ± 0.001 a0.703 ± 0.095 a1.531 ± 0.013 a7.441 ± 1.067 ab6.30 ± 0.212 a203.465 ± 5.937 c
C03_150.321 ± 0.005 a0.730 ± 0.210 a1.481 ± 0.002 b6.205 ± 0.266 b6.64 ± 0.110 a250.560 ± 4.281 a
NT_200.319 ± 0.004 a1.670 ± 0.087 a1.526 ± 0.010 b9.821 ± 0.290 b6.64 ± 0.110 a258.518 ± 7.386 a
C02_200.324 ± 0.001 a1.587 ± 0.031 a1.603 ± 0.023 a10.148 ± 0.217 ab6.58 ± 0.060 a214.754 ± 6.985 b
C03_200.322 ± 0.004 a1.697 ± 0.105 a1.543 ± 0.001 b10.316 ± 0.197 a6.67 ± 0.110 a244.655 ± 9.826 a
NT_300.319 ± 0.003 a1.990 ± 0.207 a1.553 ± 0.027 b7.847 ± 0.470 a6.58 ± 0.90 a137.081 ± 13.315 a
C02_300.324 ± 0.004 a1.827 ± 0.015 a1.645 ± 0.054 a8.101 ± 0.360 a6.40 ± 0.110 a150.095 ± 6.223 a
C03_300.322 ± 0.002 a1.790 ± 0.020 a1.597 ± 0.045 ab6.486 ± 0.418 b6.64 ± 0.207 a136.453 ± 8.820 a
NT_600.318 ± 0.003 a0.760 ± 0.040 a1.584 ± 0.079 a7.001 ± 0.207 a6.62 ± 0.192 a89.347 ± 14.744 a
C02_600.324 ± 0.004 a0.710 ± 0.010 a1.668 ± 0.059 a6.729 ± 0.249 a6.33 ± 0.145 a106.514 ± 24.055 a
C03_600.321 ± 0.003 a0.720 ± 0.020 a1.629 ± 0.000 a6.726 ± 0.324 a6.40 ± 0.123 a85.941 ± 18.723 a
Note: Different letters in the same row indicate significant differences (a, b, c) between values (p < 0.05) and, conversely, no significant differences between samples (p > 0.05). Values+ standard deviation (n = 3).

Appendix A.4

Table A4. Good’s Coverage index.
Days of BurialCM8302CM8303Si-144
The 0 day0.960 ± 0.000 a0.960 ± 0.000 a0.960 ± 0.000 a
The 5 day0.977 ± 0.006 a0.973 ± 0.006 a0.973 ± 0.006 a
The 10 day0.970 ± 0.000 a0.973 ± 0.006 a0.973 ± 0.006 a
The 15 day0.967 ± 0.006 a0.970 ± 0.000 a0.960 ± 0.009 a
The 20 day0.967 ± 0.006 a0.967 ± 0.006 a0.967 ± 0.006 a
The 30 day0.967 ± 0.006 a0.970 ± 0.000 a0.963 ± 0.006 a
Note: Different letters in the same row indicate significant differences between values (p < 0.05) and, conversely, no significant differences between samples (p > 0.05). Values+ standard deviation (n = 3).

Appendix A.5

Table A5. Monte Carlo test analysis.
Soil Physicochemical Properties0 d15 d30 d
R2p-ValueR2p-ValueR2p-Value
NH4 + -N0.0600.8370.2460.4500.2040.497
SOM0.0760.7780.0130.9630.5150.118
NO2-N0.4940.1350.2560.4180.4630.117
NO3-N0.2900.3500.7610.0180.7370.020
pH0.1230.6570.5000.1220.0390.880
TN0.2840.3560.1000.7190.5710.072

Appendix A.6

Table A6. Topological properties of the soil microbial community networks in each treatment.
Topological PropertiesCM8302
(C02_0_15_30)
CM8303
(C03_0_15_30)
Si-144
(NT_0_15_30)
Nodes628312364
Edges1354227330
Average Degree4.311.4551.813
Network diameter19.7203.9669.880
Network Density0.0070.0050.005
Modularity0.7850.9790.96
Clustering Coefficient0.4730.6990.639
Average Path Length5.571.3292.827
Positive correlation1272178256
Negative correlation824974

Appendix A.7

Table A7. Topological properties of the soil microbial community networks in each treatment.
Topological PropertiesNodesEdgesAverage
Degree
Network DiameterNetwork
Density
ModularityClustering CoefficientAverage Path LengthPositive EdgesNegative Edges
C02_0 + NT_06288682.76410.0040.98211693175
C03_0 + NT_05646592.33710.0040.97511401258
C02_0 + C03_06439913.08210.0050.97111719272
C02_15 + NT_155706152.15810.0040.98411428187
C03_15 + NT_156109022.95710.0050.97411570332
C02_15 + C03_1560411813.91110.0060.95411806375
C02_30 + NT_30904468910.37010.0110.919113931758
C03_30 + NT_3084839159.23310.0110.8891127381177
C02_30 + C03_3067011893.54910.0050.97411830359

Appendix A.8

Appendix A.8.1. Method for the Cry1A.401 Protein

The Cry1A.401 protein was detected using a Bt Cry1Ab/Ac ELISA detection kit (manufactured by Shanghai Youlong Co., Ltd., Shanghai, China), and the procedure was performed strictly according to the manufacturer’s instructions.
(1)
To the 0.2 g soil and 0.02 g leaf powder contained in the aforementioned 2.0 mL centrifuge tube (with a 2 mm hole at the top), 300 μL of sample extraction buffer (at room temperature) was added. The tube was sealed with sealing film, vortexed, shaken for 30 min, and then centrifuged at 4000 rpm for 3 min.
(2)
Preparation of standards: 1000 μL of sample extraction buffer was added to the standard provided with the kit and vortexed to mix thoroughly, yielding a standard solution with a concentration of 3.2 ng/mL. Subsequently, 500 μL of this solution was aspirated and mixed with 500 μL of sample extraction buffer to achieve a concentration of 1.6 ng/mL. Standard solutions with concentrations of 0.8 ng/mL, 0.4 ng/mL, and 0.2 ng/mL were sequentially prepared using the same serial dilution method.
(3)
Sample Loading: The diluted standard solutions, prepared samples, and blank control were added to the wells of the microplate (100 μL per well). The plate was gently shaken for mixing and then incubated in the dark on a shaker for 45 min.
(4)
Washing: The liquid in the microplate was decanted by inversion, and the plate was inverted onto absorbent paper to remove residual liquid. Washing buffer (200 μL per well) was added to the wells without touching them. This washing step was repeated 4–5 times.
(5)
Enzyme Conjugate Incubation: Enzyme conjugate working solution (100 μL per well) was added. After gentle shaking for mixing, the plate was wrapped in tin foil and incubated at 25 °C for 30 min. Following incubation, the plate was washed 4 times as described in step (4).
(6)
Color Development: Substrate solution (100 μL per well) was added, and the plate was incubated at 25 °C for 15 min.
(7)
Measurement: Stop solution (100 μL per well) was added, and the plate was gently shaken to mix. The absorbance of each sample was measured at dual wavelengths of 450 nm and 630 nm using a microplate reader.

Appendix A.8.2. Method for Soil pH Measurement

(1)
10.0 g of air-dried soil passed through a 2 mm sieve was weighed using a balance with a precision of 0.01 g, placed in a 50 mL beaker, mixed with 25 mL of distilled water, and stirred for 1 min with a glass rod to fully disperse the soil particles.
(2)
After stirring, the suspension was allowed to stand for 30 min.
(3)
The electrode was inserted into the suspension, ensuring that it did not touch the bottom or walls of the beaker. The beaker was gently swirled to allow full contact between the electrode and the suspension until the reading stabilized, at which point the value was recorded.
(4)
After each measurement, the electrode was removed, rinsed with distilled water, and blotted dry with filter paper before proceeding to the next sample. After all samples were measured, the electrode was rinsed and dried again, and finally stored in a 3 mol/L potassium chloride (KCl) solution for maintenance.

Appendix A.8.3. Method for Soil Organic Matter

(1)
Precisely weigh 0.5000 g of soil sample passed through a 0.25 mm sieve into a clean, hard glass tube. Using a pipette, sequentially add 5 mL of potassium dichromate standard solution and 5 mL of concentrated sulfuric acid. Gently swirl to mix, and place a small funnel on the mouth of the tube (to condense escaping vapor and reduce evaporation).
(2)
Place the test tube in a wire rack and immerse it in an oil bath preheated to 185–190 °C. When the temperature drops to 170–180 °C and boiling is observed inside the tube, start timing and maintain boiling for 5 min. Immediately remove the wire rack, allow the tube to cool slightly, wipe off any oil from its outer surface, and transfer the digested solution into a 150 mL conical flask.
(3)
Rinse the tube and funnel thoroughly several times with distilled water, bringing the total volume of the wash solution to 60–70 mL. After cooling, add 3 drops of o-phenanthroline indicator and titrate with 0.2 mol/L ferrous sulfate (FeSO4) solution. The endpoint is indicated by a color change from orange to bluish-green, followed by a sharp transition to brick red. Record the volume of FeSO4 consumed.
(4)
For each batch of samples, run a blank determination by replacing the soil sample with pure quartz sand or ignited soil, and record the volume of FeSO4 used.

Appendix A.8.4. Method for Total Soil Nitrogen

(1)
Weigh 1.0000 g of air-dried soil sample passed through a 0.149 mm sieve and carefully transfer it to the bottom of a Kjeldahl flask. Perform two blank and two replicate determinations simultaneously. Add 2.0 g of mixed catalyst (a mixture of potassium sulfate (K2SO4), copper sulfate (CuSO4), and selenium (Se) in a ratio of 100:10:1) and 8 mL of concentrated sulfuric acid. Swirl to mix, place the flask on the digestion rack, and hang the rack on the temperature-controlled digestion unit. Align the upper funnel over the Kjeldahl flask, then gently press the descent key to lower the digestion rack. Ensure the rack is properly positioned so that the flask fits securely with the base to avoid breakage.
(2)
Set the digestion program to 200 °C for 1 h, followed by 375 °C for 2.5 h. Turn on the fume hood and drainage, then start the program. After digestion, the flask will automatically rise. Allow it to cool before removal, then turn off the instrument.
(3)
Prior to sample distillation, check the nitrogen distillation unit and run the “0” program to rinse the pipeline by performing 2–3 empty distillations. After the digest has cooled, place the Kjeldahl flask onto the distillation unit. Position the absorption chamber (a beaker) under the condenser outlet, add an appropriate amount of boric acid solution to submerge the tip of the condenser, and execute program “1”.
(4)
Once the program is complete, remove the absorption chamber, add two drops of mixed indicator for nitrogen determination, and titrate with a standard hydrochloric acid solution. The endpoint is reached when the color changes from bluish-green to purplish-red. Simultaneously, perform distillation and titration of the blank digest to correct for reagent errors. Remove the Kjeldahl flask while wearing double gloves, as the distillation generates heat and liquid may overflow. Rinse the unit with distilled water before proceeding to the next sample.
(5)
After all tests are completed, run one empty distillation to rinse the pipeline. Clean the Kjeldahl flasks and place them in the distillation unit, then turn off the unit. Rinse the internal parts of the instrument with distilled water and clean any residual solutions from the exterior.

Appendix A.8.5. Method for Ammonium Nitrogen

Ammonium nitrogen in the soil was extracted with a potassium chloride solution. Under alkaline conditions, ammonium ions in the extract react with phenol in the presence of hypochlorite to form blue indophenol dye, which exhibits maximum absorption at a wavelength of 630 nm. Within a certain concentration range, the concentration of ammonium nitrogen follows the Lambert–Beer’s law in relation to absorbance.

Appendix A.8.6. Method for Nitrite Nitrogen

Nitrite nitrogen in the soil was extracted with a potassium chloride solution. Under acidic conditions, nitrite in the extract reacts with an amine to form a diazonium salt, which then couples with N-(1-naphthyl)ethylenediamine dihydrochloride to produce a red dye with maximum absorption at 543 nm. Within a certain concentration range, the concentration of nitrite nitrogen conforms to the Lambert–Beer’s law.

Appendix A.8.7. Method for Nitrate Nitrogen

Nitrate nitrogen and nitrite nitrogen in the soil were extracted with a potassium chloride solution. The extract was passed through a reduction column to convert nitrate nitrogen to nitrite nitrogen. Under acidic conditions, the nitrite nitrogen (including the reduced nitrate) reacts with an amine to form a diazonium salt, which subsequently couples with N-(1-naphthyl)ethylenediamine dihydrochloride to generate a red dye with maximum absorption at 543 nm. This measures the total content of nitrate and nitrite nitrogen. The nitrate nitrogen content is calculated by subtracting the nitrite nitrogen content from the total nitrate plus nitrite nitrogen content.

References

  1. Farias, J.R.; Andow, D.A.; Horikoshi, R.J.; Sorgatto, R.J.; Fresia, P.; dos Santos, A.C.; Omoto, C. Field-evolved resistance to Cry1F maize by Spodoptera frugiperda (Lepidoptera: Noctuidae) in Brazil. Crop Prot. 2014, 64, 150–158. [Google Scholar] [CrossRef]
  2. Sun, L.-Y.; Li, J.; Yuan, H.-W.; Yao, J.-H.; Li, W.; Chen, X.-Y. Expression analysis of Bt-BADH-GA20ox-rolB multigenes in transgenic tobacco plants. J. Beijing For. Univ. 2011, 33, 86–90. [Google Scholar]
  3. Palm, C.; Donegan, K.; Harris, D.; Seidler, R. Quantification in soil of Bacillus thuringiensis var. kurstakiδ-endotoxin from transgenic plants. Mol. Ecol. 1994, 3, 145–151. [Google Scholar] [CrossRef]
  4. Wang, J.; Feng, Y.; Luo, S. Effects of Bt corn straw decomposition on soil enzyme activities and soil fertility. Ying Yong Sheng Tai Xue Bao = J. Appl. Ecol. 2005, 16, 524–528. [Google Scholar]
  5. Zeng, P.; Feng, Y.-j.; Zhang, W.-c.; Zhang, Y.-f.; Dong, W.-c.; Wang, J.-w. Change of Bt protein in soil after growing Bt corns and returning corn straws to soil and its effects on soil nutrients. Yingyong Shengtai Xuebao 2014, 25, 1997. [Google Scholar]
  6. Shu, Y.; Zhang, Y.; Zeng, H.; Zhang, Y.; Wang, J. Effects of Cry1Ab Bt maize straw return on bacterial community of earthworm Eisenia fetida. Chemosphere 2017, 173, 1–13. [Google Scholar] [CrossRef]
  7. Liu, T.; Chen, X.; Qi, L.; Chen, F.; Liu, M.; Whalen, J.K. Root and detritus of transgenic Bt crop did not change nematode abundance and community composition but enhanced trophic connections. Sci. Total Environ. 2018, 644, 822–829. [Google Scholar] [CrossRef]
  8. Singh, A.K.; Dubey, S.K. Current trends in Bt crops and their fate on associated microbial community dynamics: A review. Protoplasma 2016, 253, 663–681. [Google Scholar] [CrossRef]
  9. Zhang, M.-j.; Feng, M.-c.; Xiao, L.-j.; Song, X.-y.; Yang, W.-d.; Ding, G.-w. Impact of water content and temperature on the degradation of Cry1Ac protein in leaves and buds of Bt cotton in the soil. PLoS ONE 2015, 10, e115240. [Google Scholar] [CrossRef]
  10. Feng, Y.; Ling, L.; Fan, H.; Liu, Y.; Tan, F.; Shu, Y.; Wang, J. Effects of temperature, water content and pH on degradation of Cry1Ab protein released from Bt corn straw in soil. Soil Biol. Biochem. 2011, 43, 1600–1606. [Google Scholar] [CrossRef]
  11. Zaman, M.; Mirza, M.S.; Irem, S.; Zafar, Y. A Temporal Expression of Cry1Ac Protein in Cotton Plant and its Impact on Soil Health. Int. J. Agric. Biol. 2015, 17, 280–288. [Google Scholar]
  12. Fang, W.; Wang, Q.; Han, D.; Liu, P.; Huang, B.; Yan, D.; Ouyang, C.; Li, Y.; Cao, A. The effects and mode of action of biochar on the degradation of methyl isothiocyanate in soil. Sci. Total Environ. 2016, 565, 339–345. [Google Scholar] [CrossRef] [PubMed]
  13. Wang, Q.; Gao, S.; Wang, D.; Spokas, K.; Cao, A.; Yan, D. Mechanisms for 1, 3-dichloropropene dissipation in biochar-amended soils. J. Agric. Food Chem. 2016, 64, 2531–2540. [Google Scholar] [CrossRef] [PubMed]
  14. Carretta, L.; Cardinali, A.; Marotta, E.; Zanin, G.; Masin, R. Dissipation of terbuthylazine, metolachlor, and mesotrione in soils with contrasting texture. J. Environ. Sci. Health Part B 2018, 53, 661–668. [Google Scholar] [CrossRef]
  15. Baumgarte, S.; Tebbe, C.C. Field studies on the environmental fate of the Cry1Ab Bt-toxin produced by transgenic maize (MON810) and its effect on bacterial communities in the maize rhizosphere. Mol. Ecol. 2005, 14, 2539–2551. [Google Scholar] [CrossRef]
  16. Wang, J.W.; Luo, S.M.; Feng, Y.J. Environmental fate and ecological effects of Bt toxin from transgenic Bt crops in soil. Acta Ecol. Sin. 2003, 23, 797–804. [Google Scholar]
  17. Liu, Y.; Li, J.; Luo, Z.; Wang, H.; Liu, F. The fate of fusion Cry1Ab/1Ac proteins from Bt-transgenic rice in soil and water. Ecotoxicol. Environ. Saf. 2016, 124, 455–459. [Google Scholar] [CrossRef]
  18. Van Wyk, D.A.; Adeleke, R.; Rhode, O.H.; Bezuidenhout, C.C.; Mienie, C. Ecological guild and enzyme activities of rhizosphere soil microbial communities associated with Bt-maize cultivation under field conditions in North West Province of South Africa. J. Basic Microbiol. 2017, 57, 781–792. [Google Scholar] [CrossRef]
  19. Lu, H.; Wu, W.; Chen, Y.; Wang, H.; Devare, M.; Thies, J.E. Soil microbial community responses to Bt transgenic rice residue decomposition in a paddy field. J. Soils Sediments 2010, 10, 1598–1605. [Google Scholar] [CrossRef]
  20. Valldor, P.; Miethling-Graff, R.; Martens, R.; Tebbe, C.C. Fate of the insecticidal Cry1Ab protein of GM crops in two agricultural soils as revealed by 14C-tracer studies. Appl. Microbiol. Biotechnol. 2015, 99, 7333–7341. [Google Scholar] [CrossRef]
  21. Fan, L.; Min, W.; Hong-wei, S.; Shu-ke, Y.; Xing-bo, L. Dynamics of Cry1Ab protein content in the rhizosphere soil and straw debris of transgenic Bt corn. Chin. J. Appl. Ecol./Yingyong Shengtai Xuebao 2013, 24, 1907–1913. [Google Scholar]
  22. Crowther, T.W.; Van den Hoogen, J.; Wan, J.; Mayes, M.A.; Keiser, A.; Mo, L.; Averill, C.; Maynard, D.S. The global soil community and its influence on biogeochemistry. Science 2019, 365, eaav0550. [Google Scholar] [CrossRef] [PubMed]
  23. Falkowski, P.G.; Fenchel, T.; Delong, E.F. The microbial engines that drive Earth’s biogeochemical cycles. Science 2008, 320, 1034–1039. [Google Scholar] [CrossRef] [PubMed]
  24. Luo, X.; Hou, E.; Zhang, L.; Kuang, Y.; Wen, D. Altered soil microbial properties and functions after afforestation increase soil carbon and nitrogen but not phosphorus accumulation. Biol. Fertil. Soils 2023, 59, 645–658. [Google Scholar] [CrossRef]
  25. Sokol, N.W.; Slessarev, E.; Marschmann, G.L.; Nicolas, A.; Blazewicz, S.J.; Brodie, E.L.; Firestone, M.K.; Foley, M.M.; Hestrin, R.; Hungate, B.A. Life and death in the soil microbiome: How ecological processes influence biogeochemistry. Nat. Rev. Microbiol. 2022, 20, 415–430. [Google Scholar] [CrossRef]
  26. De Vries, F.T.; Griffiths, R.I.; Bailey, M.; Craig, H.; Girlanda, M.; Gweon, H.S.; Hallin, S.; Kaisermann, A.; Keith, A.M.; Kretzschmar, M. Soil bacterial networks are less stable under drought than fungal networks. Nat. Commun. 2018, 9, 3033. [Google Scholar] [CrossRef]
  27. Tapp, H.; Stotzky, G. Persistence of the insecticidal toxin from Bacillus thuringiensis subsp. kurstaki in soil. Soil Biol. Biochem. 1998, 30, 471–476. [Google Scholar] [CrossRef]
  28. Rui, Y.-K.; Yi, G.-X.; Zhao, J.; Wang, B.-M.; Li, Z.-H.; Zhai, Z.-X.; He, Z.-P.; Li, Q.X. Changes of Bt toxin in the rhizosphere of transgenic Bt cotton and its influence on soil functional bacteria. World J. Microbiol. Biotechnol. 2005, 21, 1279–1284. [Google Scholar] [CrossRef]
  29. Zhaolei, L.; Naishun, B.; Xueping, C.; Jun, C.; Manqiu, X.; Zhiping, S.; Ming, N.; Changming, F. Soil incubation studies with Cry1Ac protein indicate no adverse effect of Bt crops on soil microbial communities. Ecotoxicol. Environ. Saf. 2018, 152, 33–41. [Google Scholar] [CrossRef]
  30. Liu, J.; Liang, Y.-s.; Hu, T.; Zeng, H.; Gao, R.; Wang, L.; Xiao, Y.-h. Environmental fate of Bt proteins in soil: Transport, adsorption/desorption and degradation. Ecotoxicol. Environ. Saf. 2021, 226, 112805. [Google Scholar] [CrossRef]
  31. Li, Y.; Shi, J.; Yu, Z.; Pan, A.; Tang, X.; Ming], F. Impact of transgenic Cry1Ac + CpTI cotton on diversity and dynamics of rhizosphere bacterial community of different root environments. Sci. Total Environ. 2018, 637–638, 233–243. [Google Scholar] [CrossRef] [PubMed]
  32. Fazal, A.; Wen, Z.; Yang, M.; Liao, Y.; Fu, J.; He, C.; Wang, X.; Jie, W.; Ali, F.; Hu, D. Deciphering the rhizobacterial assemblages under the influence of genetically engineered maize carrying mcry genes. Environ. Sci. Pollut. Res. 2021, 28, 60154–60166. [Google Scholar] [CrossRef] [PubMed]
  33. Singh, R.J.; Ahlawat, I.; Singh, S. Effects of transgenic Bt cotton on soil fertility and biology under field conditions in subtropical inceptisol. Environ. Monit. Assess. 2013, 185, 485–495. [Google Scholar] [CrossRef] [PubMed]
  34. Xu, Q.; Dai, R.; Ruan, Y.; Rensing, C.; Liu, M.; Guo, S.; Ling, N.; Shen, Q. Probing active microbes involved in Bt-containing rice straw decomposition. Appl. Microbiol. Biotechnol. 2018, 102, 10273–10284. [Google Scholar] [CrossRef]
  35. Lu, Y.; Lu, T.; Cheng, M. Changes of collagenase activity in immune hepatic fibrosis following pig’s serum injection and therapeutic effect of HanDanGanLe. Chin. J. Hepatol. 2000, 8, 108–109. [Google Scholar]
  36. Bradstreet, R.B. Kjeldahl Method for Organic Nitrogen. Anal. Chem. 1954, 26, 169–234. [Google Scholar] [CrossRef]
  37. Cataldo, D.A.; Maroon, M.; Youngs, L.E.S.L. Rapid colorimetric determination of nitrate in plant tissue by nitration of salicylic acid1. Commun. Soil Sci. Plant Anal. 1975, 6, 71–80. [Google Scholar] [CrossRef]
  38. Edgar, R.C. UPARSE: Highly accurate OTU sequences from microbial amplicon reads. Nat. Methods 2013, 10, 996. [Google Scholar] [CrossRef]
  39. Wilcoxon, F. Individual Comparisons by Ranking Methods. Biom. Bull. 1945, 1, 80–83. [Google Scholar] [CrossRef]
  40. Herman, R.A.; Scherer, P.N.; Young, D.L.; Mihaliak, C.A.; Meade, T.; Woodsworth, A.T.; Stockhoff, B.A.; Narva, K.E. Binary insecticidal crystal protein from Bacillus thuringiensis, strain PS149B1: Effects of individual protein components and mixtures in laboratory bioassays. J. Econ. Entomol. 2002, 95, 635–639. [Google Scholar] [CrossRef]
  41. Head, G.; Surber, J.B.; Watson, J.A.; Martin, J.W.; Duan, J.J. No Detection of Cry1Ac Protein in Soil After Multiple Years of Transgenic Bt Cotton (Bollgard) Use. Environ. Entomol. 2002, 31, 30–36. [Google Scholar] [CrossRef]
  42. Zwahlen, C.; Hilbeck, A.; Gugerli, P.; Nentwig, W. Degradation of the Cry1Ab protein within transgenic Bacillus thuringiensis corn tissue in the field. Mol. Ecol. 2003, 12, 765–775. [Google Scholar] [CrossRef]
  43. Li, Y.; Wu, K.; Zhang, Y.; Yuan, G. Degradation of Cry1Ac Protein Within Transgenic Bacillus thuringiensis Rice Tissues Under Field and Laboratory Conditions. Environ. Entomol. 2007, 36, 1275–1282. [Google Scholar] [CrossRef]
  44. Shilei, Y.; Lei, Z.; Hongwei, S.; Xiaoyan, T.; Fan, L.I.; Xingbo, L.U. Effects of planting and straw returning of transgenic Bt maize on soil enzyme activities under field condition. Acta Ecol. Sin. 2011, 24, 1259–1270. [Google Scholar]
  45. Yao, H.; Gao, Y.; Nicol, G.W.; Campbell, C.D.; Prosser, J.I.; Zhang, L.; Han, W.; Singh, B.K. Links between ammonia oxidizer community structure, abundance, and nitrification potential in acidic soils. Appl. Environ. Microbiol. 2011, 77, 4618–4625. [Google Scholar] [CrossRef] [PubMed]
  46. Thevenot, M.; Dignac, M.-F.; Rumpel, C. Fate of lignins in soils: A review. Soil Biol. Biochem. 2010, 42, 1200–1211. [Google Scholar] [CrossRef]
  47. Yuan, L.; Li, J.; Lei, N.; Xie, H.; Lu, C.; Chen, X.; Ma, S.; Zhang, J.; Müller, C.; He, H.; et al. Stover mulching in no-tillage farming reduces ammonia volatilization in the Mollisol of Northeast China: Insights from gross N transformation dynamics. Soil Tillage Res. 2024, 240, 106068. [Google Scholar] [CrossRef]
  48. Al-Deeb, M.A.; Wilde, G.E.; Blair, J.M.; Todd, T.C. Effect of Bt Corn for Corn Rootworm Control on Nontarget Soil Microarthropods and Nematodes. Environ. Entomol. 2003, 32, 859–865. [Google Scholar] [CrossRef]
  49. Griffiths, B.S.; Caul, S.; Thompson, J.; Birch, A.N.E.; Scrimgeour, C.; Andersen, M.N.; Cortet, J.; Messéan, A.; Sausse, C.; Lacroix, B.; et al. A comparison of soil microbial community structure, protozoa and nematodes in field plots of conventional and genetically modified maize expressing the Bacillus thuringiensis CrylAb toxin. Plant Soil 2005, 275, 135–146. [Google Scholar] [CrossRef]
  50. Scheffknecht, S.; Mammerler, R.; Steinkellner, S.; Vierheilig, H. Root exudates of mycorrhizal tomato plants exhibit a different effect on microconidia germination of Fusarium oxysporum f. sp. lycopersici than root exudates from non-mycorrhizal tomato plants. Mycorrhiza 2006, 16, 365–370. [Google Scholar] [CrossRef]
  51. Isik, I.; Guenther, S. Cry3Bb1 protein from Bacillus thuringiensis in root exudates and biomass of transgenic corn does not persist in soil. Transgenic Res. 2008, 17, 609–620. [Google Scholar]
  52. Röttjers, L.; Faust, K. From hairballs to hypotheses-biological insights from microbial networks. FEMS Microbiol Rev 2018, 42, 761–780. [Google Scholar] [CrossRef] [PubMed]
  53. Xuan, Z.P.; Feng, H.Y.; Chen, M.Q.; Xu, J.; Liu, M.X.; Zhao, B.Z.; Zhang, J.B. Effects of Straw Returning Combined with Chemical Fertilizer on Soil Ecosystem Multifunctionality. Sci. Agric. Sin. 2025, 58, 2821–2837. [Google Scholar]
  54. Wang, J.; Wang, D.J.; Zhang, G. Effect of incorporated straw-nitrogen fertilizer on nutrient leaching in paddy soils. Chin. J. Eco-Agric. 2010, 18, 316–321. [Google Scholar] [CrossRef]
  55. Saavedra, S.; Stouffer, D.B.; Uzzi, B.; Bascompte, J. Strong contributors to network persistence are the most vulnerable to extinction. Nature 2011, 478, 233–235. [Google Scholar] [CrossRef]
  56. Chen, Y.; Li, Y.; Qiu, T.; He, H.; Liu, J.; Duan, C.; Cui, Y.; Huang, M.; Wu, C.; Fang, L. High nitrogen fertilizer input enhanced the microbial network complexity in the paddy soil. Soil Ecol. Lett. 2023, 6, 230205. [Google Scholar] [CrossRef]
  57. Peay, K.G.; Kennedy, P.G.; Talbot, J.M. Dimensions of biodiversity in the Earth mycobiome. Nat Rev Microbiol 2016, 14, 434–447. [Google Scholar] [CrossRef]
  58. Leibold, M.A.; Holyoak, M.; Mouquet, N.; Amarasekare, P.; Chase, J.M.; Hoopes, M.F.; Holt, R.D.; Shurin, J.B.; Law, R.; Tilman, D.; et al. The metacommunity concept: A framework for multi-scale community ecology. Ecol. Lett. 2004, 7, 601–613. [Google Scholar] [CrossRef]
  59. Hussain, S.; Liu, H.; Liu, S.; Yin, Y.; Yuan, Z.; Zhao, Y.; Cao, H. Distribution and Assembly Processes of Soil Fungal Communities along an Altitudinal Gradient in Tibetan Plateau. J Fungi 2021, 7, 1082. [Google Scholar] [CrossRef]
  60. Stegen, J.C.; Johnson, T.; Fredrickson, J.K.; Wilkins, M.J.; Konopka, A.E.; Nelson, W.C.; Arntzen, E.V.; Chrisler, W.B.; Chu, R.K.; Fansler, S.J.; et al. Influences of organic carbon speciation on hyporheic corridor biogeochemistry and microbial ecology. Nat Commun 2018, 9, 585. [Google Scholar] [CrossRef]
  61. Tripathi, B.M.; Stegen, J.C.; Kim, M.; Dong, K.; Adams, J.M.; Lee, Y.K. Soil pH mediates the balance between stochastic and deterministic assembly of bacteria. ISME J 2018, 12, 1072–1083. [Google Scholar] [CrossRef]
  62. Zhang, X.; Johnston, E.R.; Liu, W.; Li, L.; Han, X. Environmental changes affect the assembly of soil bacterial community primarily by mediating stochastic processes. Glob Chang Biol 2016, 22, 198–207. [Google Scholar] [CrossRef]
Figure 1. Dynamics of Cry1A.401 protein residues after degradation in soil. Note: C02_0, C02_5, C02_10, C02_15, C02_20 and C02_30 represent CM8302 material burial days 0, 5, 10, 15, 20 and 30, respectively; C03_0, C03_5, C03_10, C03_15, C03_20 and C03_30 represent CM8303 material burial days 0, 5, 10, 15, 20, and 30 days, respectively; and NT_0, NT_5, NT_10, NT_15, NT_20, and NT_30 represent days 0, 5, 10, 15, 20, and 30 of burial, respectively, for the Si-144 materials.
Agronomy 16 00560 g001
Figure 2. (AC) Trends in NH4+-N, NO2-N and NO3-N in the Si-144, CM8302, and CM8303 treatments. (D) Principal component analysis of soil physicochemical indicators in each treatment.
Agronomy 16 00560 g002
Figure 3. (A,B) Shannon dilution curves for each treatment based on the level of OTUs. (C): 0 days buried; (D): 5 days buried; (E): 10 days buried; (F): 15 days buried; (G): 20 days buried; (H): 30 days buried. Venn diagram analysis of the number of soil microbial OTUs at different burial times. (I): Chao1 index; (J): Shannon index; (K): Simpson index. Statistics of the alpha diversity index of soil microorganisms in each treatment. (Note: The boxplot illustrates the significant differences among the three materials—CO2-CM8302, CO3-CM8303, and NT-Si-144—at each time point (day 0, day 5, day 10, day 15, day 20, and day 30). One-way ANOVA was used to compare the differences among the three materials (p < 0.05). Statistical significance is indicated by letters above the boxplot: groups sharing the same letter are not significantly different from each other, while groups with different letters differ significantly. The 95% confidence intervals are reflected in the range of the box and whiskers.)
Agronomy 16 00560 g003
Figure 4. (A) Heatmap of soil sample distances for each treatment. (B) PCoA based on phylogenetically weighted UniFrac distances for all samples. (C): Day 0; (D): Day 5; (E): Day 10; (F): Day 15; (G): Day 20; (H): Day 30; (I): the entire burial cycle of CM8302; (J): the entire burial cycle of Si-144; (K): the entire burial cycle of Si-144. PCoA of soil microbial communities at different burial times and with different materials.
Agronomy 16 00560 g004
Figure 5. (A) Composition of the top 20 microbial communities at the phylum level: (B): 0 days, (C): 15 days, and (D): 30 days. Analysis of the intergroup variabilities in soil microbial communities on day 0 of burial: (E): 0 days, (F): 15 days, and (G): 30 days. Redundancy analysis of soil microbial communities with respect to soil physicochemical factors. * Note: Evolutionary branching diagram. Circles are in order of taxonomic level from outside to inside: phylum, order, family, and genus. The dots in each color indicate the bacterial taxa that are important in their grouping.
Agronomy 16 00560 g005
Figure 6. ((A): CM8302; (B): CM8303; and (C): Si-144) Co-occurrence network analysis of soil microbial communities throughout the burial degradation process. ((D): C02_0 + NT_0; (E): C03_0 + NT_0; (F): C02_0 + C03_0; (G): C02_15 + NT_15; (H): C03_15 + NT_15; (I): C02_15 + C03_15; (J): C02_30 + NT_30; (K): C03_30 + NT_30; and (L): C02_30 + C03_30) Co-occurrence network of soil microbial communities across treatments. ((M): BetaNTI changes; (N): RCbray changes; (O): Si-144, CM8302 and CM8303 Analysis of ecological processes in soil microbial communities) Ecological processes of soil microbial community development throughout burial time for each treatment. Note: Each node in the graph represents a bacterial OTU, and there is a significant correlation between each line connecting two nodes (r > 0.6, p < 0.001).
Agronomy 16 00560 g006
Figure 7. Soil nitrogen transformation processes.
Agronomy 16 00560 g007
Disclaimer/Publisher’s Note: The statements, opinions and data contained in all publications are solely those of the individual author(s) and contributor(s) and not of MDPI and/or the editor(s). MDPI and/or the editor(s) disclaim responsibility for any injury to people or property resulting from any ideas, methods, instructions or products referred to in the content.