Article

Yield Performance and Genotype × Environment Interaction of Elite Rye Germplasm Selected from a Greek Landrace Under Mediterranean Conditions

by
Iosif Sistanis
1,
Elissavet Ninou
2,
Ioannis Mylonas
3,*,
Eirini N. Demertzi
3,4 and
Fokion Papathanasiou
1
1
Department of Agriculture, University of Western Macedonia, 53100 Florina, Greece
2
Department of Agriculture, International Hellenic University, Sindos, 57400 Thessaloniki, Greece
3
Institute of Plant Breeding and Genetic Resources, Hellenic Agricultural Organization—“Demeter”, 57001 Thessaloniki, Greece
4
Laboratory of Genetics and Plant Breeding, School of Agriculture, Aristotle University of Thessaloniki, 54124 Thessaloniki, Greece
*
Author to whom correspondence should be addressed.
Agronomy 2026, 16(20), 2004; https://doi.org/10.3390/agronomy16202004
Submission received: 5 August 2026 / Revised: 20 September 2026 / Accepted: 5 October 2026 / Published: 9 October 2026
(This article belongs to the Special Issue Genotype × Environment Interactions in Crop Production—2nd Edition)

Abstract

Rye landraces (Secale cereale L.) are an important source of genetic diversity and continue to offer valuable opportunities for the development of productive and well-adapted cultivars. Despite their breeding potential, relatively little is known about the field performance and yield stability of elite genotypes selected from heterogeneous landraces under Mediterranean growing conditions. In this study, fifteen elite rye half-sib families selected under nil-competition from the traditional Greek landrace “Vevi” were evaluated together with the original population and the commercial cultivar ‘Dukato’ across three contrasting Mediterranean environments. The objectives were to assess their agronomic performance, investigate genotype × environment interaction, and identify promising germplasm combining high yield with broad adaptation using AMMI and GGE biplot analyses, complemented by sixteen parametric and non-parametric stability indices. Grain yield, seed protein content, plant height, and days to ear emergence were recorded. Broad-sense heritability was consistently high (H2 = 0.95–0.99), whereas environmental conditions explained most of the observed phenotypic variation. Grain yield showed a positive association with plant height (r = 0.651, p < 0.01) and a negative association with days to ear emergence (r = –0.703, p < 0.01). Among the evaluated genetic materials, G9 and G11 combined high productivity with stable performance across environments, while G6 produced the highest grain yield but was better suited to favourable environments. The close agreement among the different stability analyses increased confidence in family ranking and selection. Overall, the results highlight the considerable breeding value of the traditional Greek rye landrace “Vevi” and demonstrate that combining multi-environment testing with complementary stability analyses provides an effective framework for identifying elite rye genotypes with high yield potential and broad adaptation to Mediterranean environments.

1. Introduction

Common rye (Secale cereale L.) remains one of the most important cereal crops cultivated in Europe, which accounts for approximately 79.8% of global rye production [1,2]. The principal producing countries include Germany, Poland, the Russian Federation, Belarus, Denmark, China (mainland), Canada, the United States of America, Iraq, and Turkey [2]. Although rye cultivation has declined during recent decades, both globally and across most European countries, including Greece, production has become increasingly variable since 2011 [3]; a trend associated with increasing climatic variability and with changing consumer demand for healthier, more sustainable food products. Developing rye genotypes that combine high productivity with broad adaptation and stable performance across contrasting environments has therefore become an increasingly important breeding objective.
Rye is distinguished among cereals by its exceptional winter hardiness, tolerance of nutrient-poor, sandy, and acidic soils [4], genetic resistance to several diseases [5] and high biomass production under low fertilizer and pesticide inputs [6] with a smaller carbon footprint than wheat [7]. It is also nutritionally valuable, being rich in phenolic compounds, phytosterols, benzoxazinoids, and alkylresorcinols [8,9], as well as dietary fibre components such as arabinoxylans, β-glucans, and fructans [10], with regular consumption linked to reduced risk of type 2 diabetes, cardiovascular diseases, and several forms of cancer [11]. These combined agronomic, environmental and nutritional properties make rye well-suited to sustainable, low-input production systems.
Rye is the only major small-grain cereal that is predominantly cross-pollinated, its reproductive system regulated by a gametophytic self-incompatibility mechanism controlled by the multiallelic S and Z loci, which promotes outcrossing and maintains a high level of genetic diversity within populations [3,12]. This biology has shaped two principal breeding types: genetically heterogeneous population varieties and genetically uniform hybrid cultivars.
Population varieties, including traditional landraces and improved open-pollinated cultivars, retain substantial within-population genetic variation and locally adapted traits, often having been maintained under diverse agro-ecological conditions with limited formal selection [13]. Such genetic diversity may provide valuable variation for adaptation and yield stability under climatic fluctuation, limited water availability, or reduced external inputs. In contrast, hybrid breeding, introduced in Germany during the 1970s, has substantially increased rye’s yield potential through heterosis and has progressively replaced population cultivars in many major rye-growing regions [4]. Comparative multi-environment studies report hybrid cultivars yielding 15–20% more than population varieties under modern production systems [4,14,15], although this advantage may come with trade-offs in grain quality and yield stability [16]. For example, recent evaluations under contrasting management intensities reported approximately 25% higher grain yield in hybrid rye, but higher grain protein content and greater yield stability in population cultivars [16], while drought comparisons of traditional versus modern rye found traditional germplasm retaining greater stability of some yield components despite lower absolute yield potential [17]. A similar pattern is evident across Mediterranean and marginal European rye-growing regions more broadly. In Central Anatolia, Turkey, local rye populations produced higher grain yield than a registered variety, while retaining comparable or superior nutritional quality [18]. In the Northwest Italian Alps, local rye landraces cultivated in marginal environments showed grain yield levels statistically comparable to hybrid cultivars [19]. Rye landraces are similarly maintained under low-input, mountainous cultivation in Southern Italy, in the Calabria region above 750 m altitude [20] and in the Matese Mountains of Campania [21]. Hybrid cultivars therefore do not consistently outperform population varieties under severe climatic stress and may perform less favourably than locally adapted populations in unfavourable years [22]. As climate variability increasingly threatens yield stability [23,24,25], and as low-input cultivation and marginal-environment exploitation gain importance for sustainable rye production [19,26], population varieties and landraces remain an essential, and in many regions underexploited, reservoir of genetic variation, underscoring the need for evaluation approaches that assess yield, stability and grain quality jointly rather than yield alone.
Selection efficiency for complex low heritability traits, such as grain yield, declines when the testing environment differs substantially from the target production environment: genotype × environment interactions reduce the genetic correlation between environments, making direct selection in the target environment more effective than indirect selection under contrasting conditions [27], and genotypes intended for marginal or stress-prone environments should accordingly be selected and evaluated under comparable conditions [28,29]. These principles—echoed in breeding programmes such as Russia’s, where cultivars are developed primarily for adaptability and ecological plasticity across harsh, variable conditions rather than for maximal yield potential alone [30,31,32]—underscore the importance of environment-specific selection strategies for rye under increasingly variable climatic conditions and of multivariate tools for characterizing the crossover genotype × environment (G × E) interaction and identifying genotypes combining high yield with broad adaptation [33].
Such multivariate approaches include the Additive Main Effects and Multiplicative Interaction (AMMI) model and the Genotype plus Genotype-by-Environment (GGE) biplot methodology. The AMMI model combines analysis of variance (ANOVA) for the additive effects of genotypes and environments with principal component analysis (PCA) of the interaction, allowing the G × E component to be partitioned into interaction principal component axes (IPCAs) and improving the interpretation of genotype performance across environments [34]. In contrast, the GGE biplot integrates genotype main effects and G × E interactions while excluding the environmental main effect, thereby facilitating the identification of mega environments, the visualization of “which-won-where” patterns, and the simultaneous evaluation of genotype performance and stability [33,35,36]. Together, these complementary approaches provide an effective framework for evaluation under variable environmental conditions in various species [37,38,39,40,41].
Selection within heterogeneous populations or landraces under ultra-low plant density is one effective strategy for exploiting this diversity: reduced interplant competition allows individual plants to express their genetic potential more fully, improving phenotypic discrimination and the identification of superior genotypes [42,43]. This honeycomb-based approach has proved effective across several crop species—including “Santorini fava” (Lathyrus sp.) landrace [44], lentil (Lens culinaris Medik.) [45], Greek chamomile (Matricaria chamomilla L.) [46], and common bean (Phaseolus vulgaris L.) [47]—and specifically in rye: Kyriakou and Fasoulas (1985) [48] reported a 29.4% yield increase after two cycles of mass honeycomb selection, and Xynias and Roupakias (1996) [49] a 27% increase after one cycle, with an additional 7% gain following a second selection cycle. By reducing environmental variation associated with interplant competition and soil heterogeneity, honeycomb selection improves the efficiency of selection for complex quantitative traits, including grain yield [42,50,51,52,53,54].
Despite this precedent, no study has yet combined honeycomb-based within-population selection with multi-environment, multi-trait evaluation in a Mediterranean rye landrace, while the specific literature on rye stability under Mediterranean, rainfed, low-input conditions remains comparatively limited, leaving the breeding potential of such underexploited local germplasm largely unexplored. The Greek rye population ‘Vevi’, indigenous to Northwestern Greece and recently molecularly characterized [55], provides a representative example for addressing this gap. Rather than evaluating the population solely as a conserved genetic resource, the present study exploited its retained phenotypic diversity through selection at ultra-low plant density under low-input conditions, with selection criteria jointly spanning grain yield, stability and grain protein content jointly, and rigorous evaluation across contrasting environments—the population’s native high-altitude Florina region and the warmer typical Mediterranean conditions of Thermi-Thessaloniki. This integration of honeycomb selection with AMMI and GGE biplot models, therefore provides a methodological framework for determining whether within-landrace variation can be converted into elite genotypes combining competitive yield, environmental stability and desirable grain quality—and, more broadly, a transferable evaluation approach for the many other under-characterized rye populations still maintained across Mediterranean, Balkan and other marginal resource-limited rye-growing regions.
The specific objectives of this study were to:
  • Characterize the phenotypic variation retained within the ‘Vevi’ local rye population under ultra-low plant density and nil-competition through honeycomb selection;
  • Identify half-sib families combining high grain yield, stable performance, and acceptable grain protein content under low-input conditions;
  • Quantify genotype x environment interaction and stability across three contrasting environments using AMMI, GGE biplot, and eight parametric and eight non-parametric stability models;
  • Establish a reference evaluation framework applicable to other under-characterized, locally adapted rye populations in Mediterranean and similarly marginal, resource-limited production regions.

2. Materials and Methods

2.1. Plant Material and Environmental Conditions

The breeding procedure was conducted over three consecutive growing seasons beginning in November 2020. All experiments were carried out at the farm of the Department of Agriculture, University of Western Macedonia, Florina, Greece (40°46′43″ N, 21°22′47″ E; 702 m a.s.l.). The soil was sandy loam with pH 6.3, organic matter 14.0 g kg−1, NO3–N 100 mg kg−1, Olsen-P 50.3 mg kg−1, exchangeable K 308 mg kg−1, and water-holding capacity 21.8%. In the final experimental year 2022–2023, a second site was included to assess genotype performance across environments. For this reason, additional trials were established in Thermi-Thessaloniki at the facilities of the Hellenic Agricultural Organization Dimitra (40°32′06″ N, 22°59′47″ E; 7 m a.s.l.). The soil was also sandy loam with pH 7.8, organic matter 11.5 g kg−1, NO3–N 65.0 mg kg−1, Olsen-P 15.3 mg kg−1, exchangeable K 313 mg kg−1, and water-holding capacity 25.3%.
As far as chemical fertilization is concerned, during sowing, nitrogen and phosphorus fertilizers were applied at rates of 100 and 30 kg ha−1, respectively, followed by a supplemental nitrogen application of 80 kg ha−1 in early spring when plants reached approximately 50 cm in height. These fertilization levels correspond to approximately two-thirds of the regional recommendations for rye cultivation in Western Macedonia. No herbicides or insecticides were applied, and trials were conducted under rainfed conditions, reflecting common rye production practices in Greece.
As starting plant material, the local unimproved rye population ‘Vevi’ was used, which is well adapted to the climatic conditions of the Florina region, particularly low winter temperatures, low soil fertility, and a relatively short growth cycle. Subsequently, twelve high-yielding (HY) and three low-yielding (LY) plants were identified, by using a moving ring of 126 plants. The twelve HY plants constituted the primary selection target for improved yield performance, while the three LY plants were retained as a contrasting reference group, reflecting the well-documented inverse relationship between grain yield and protein concentration in cereals; their inclusion allowed subsequent generations to be evaluated across a broader range of yield–protein combinations. The progeny lines of these selected plants constituted the families evaluated in three environments, along with the original population ‘Vevi’ and the commercial variety ‘Dukato’, as controls (Table 1).
The three environments (Table 2) that were evaluated included:
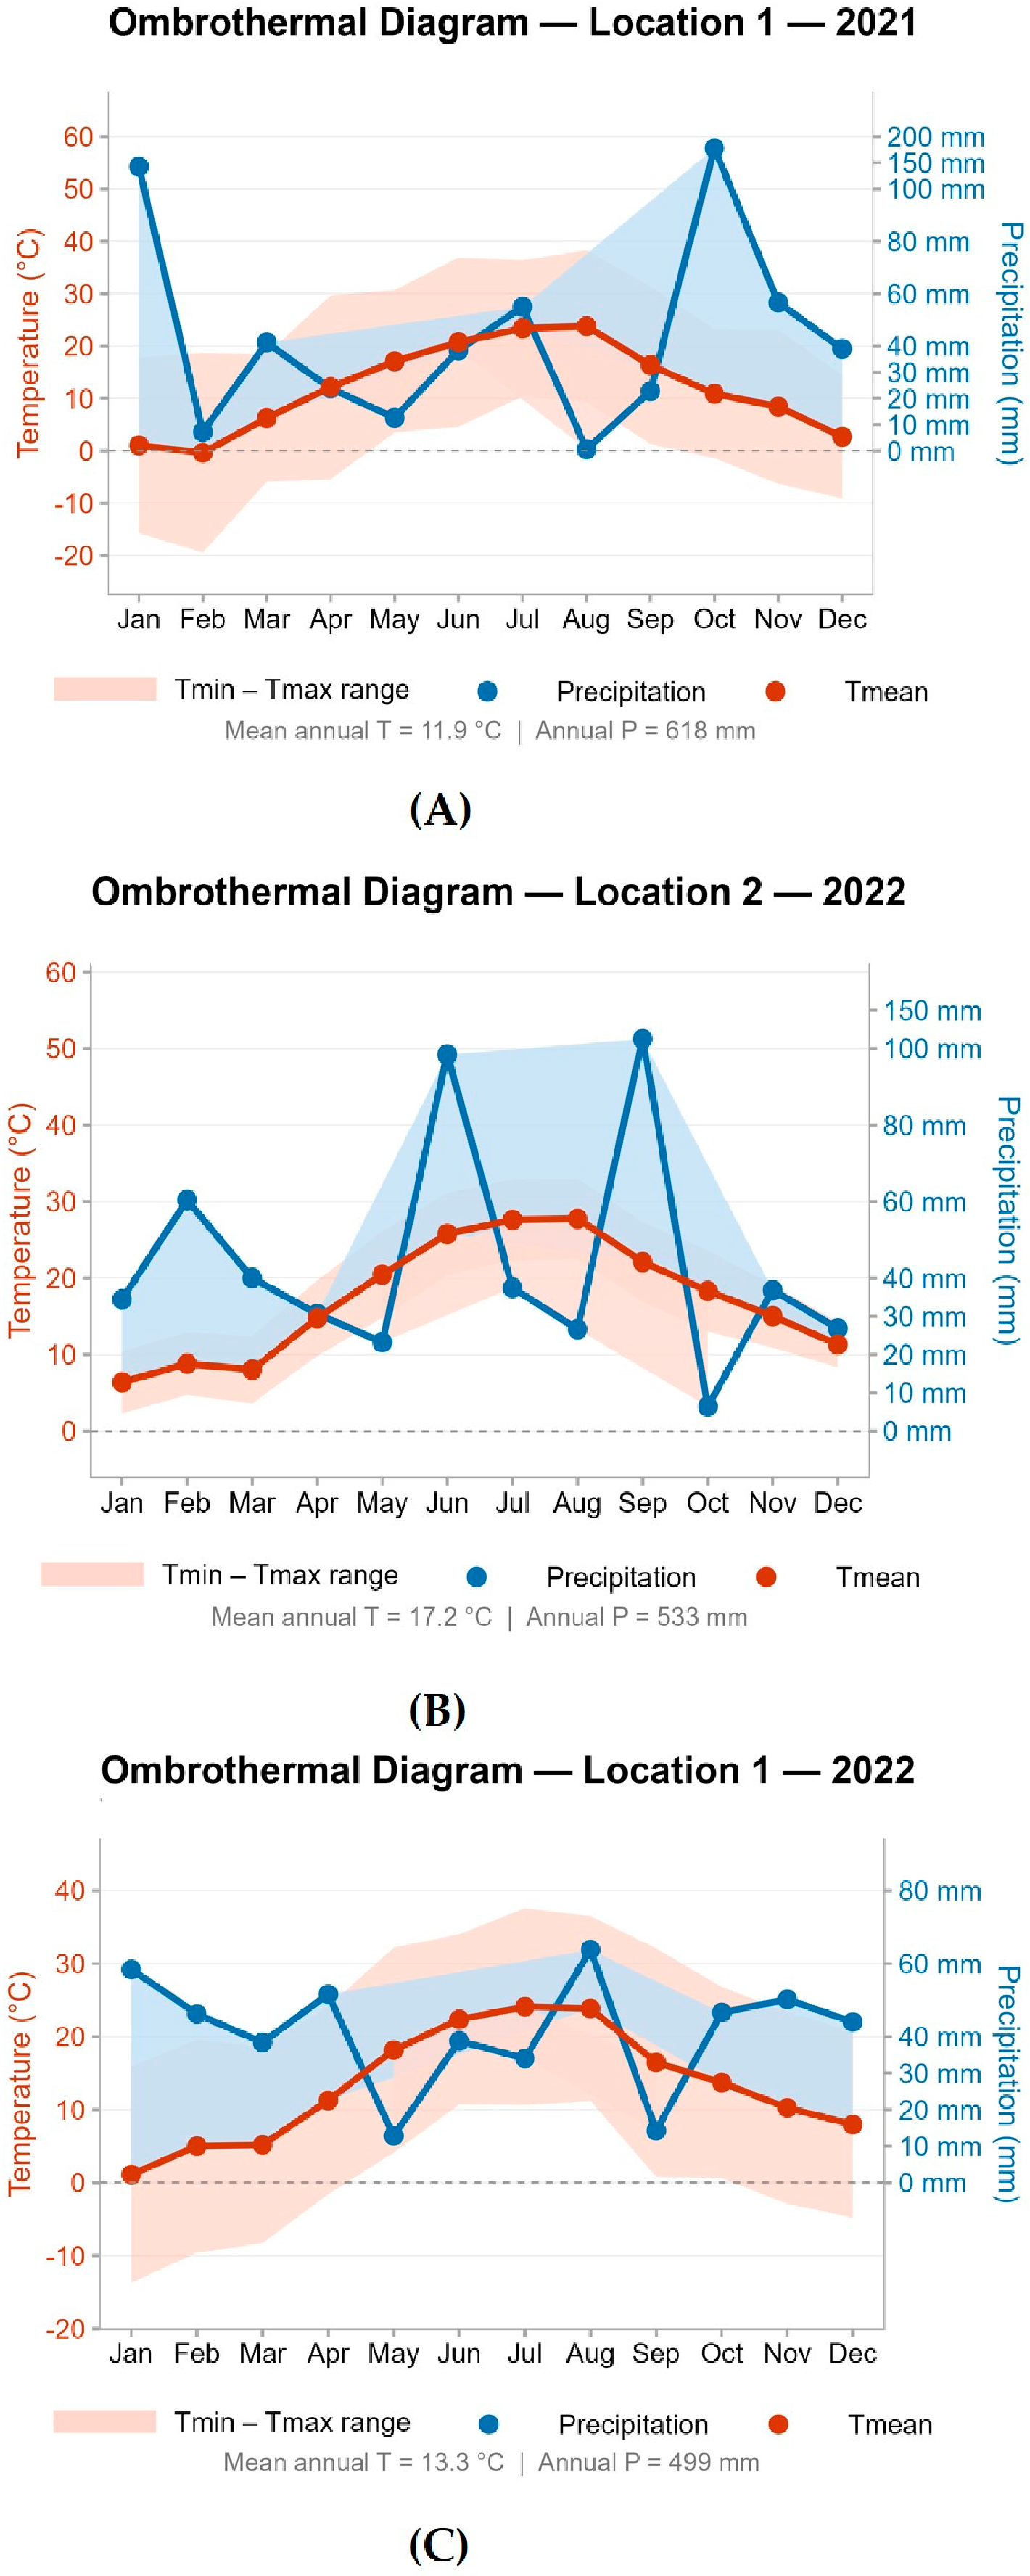
  • E1: Florina area (farm of the University of West Macedonia)—a low- to medium-productivity field—during the growing season 2021–2022. The climate is Cfa to Dfa, that is, a humid subtropical climate bordering on a humid continental climate, reflecting its inland position, elevation, and cold winters. The total precipitation during the growing period was 562.0 mm, the max average temperature was 24.2 °C and the min average temperature was −5.4 °C. The study site is located at an elevation of 702 m a.s.l.
  • E2: Florina area—a medium to high-productivity field—during the growing season 2022–2023. The climate is Cfa to Dfa, similarly to E1. The total precipitation during the growing period was 421.0 mm, the max average temperature was 25.3 °C and the min average temperature was −1.5 °C. The study site is located at an elevation of 702 m a.s.l.
  • E3: Thermi area—a low to medium-productivity field—during the growing season 2022–2023. The climate is BSk, that is, a cold semi-arid climate. The total precipitation during the growing period was 394.4 mm, the max average temperature was 20.3 °C and the min average temperature was 11.0 °C. The study site is located at an elevation of 7 m a.s.l.
To provide a comprehensive overview of the meteorological conditions across the three different environments, ombrothermal diagrams were constructed for each region and each experimental year (Figure 1).

2.2. Experimental Design

2.2.1. 1st Year of Experimentation

The local, unimproved rye population, ‘Vevi’ was evaluated in the first year of experimentation. The experiment was arranged according to a non-replicated honeycomb design (NR0), comprising 32 rows of 32 plants (1024 plants in total), with an interplant spacing of 100 cm, corresponding to an ultra-low plant density of 1.15 plants m−2. Four positions failed to germinate and were excluded from the analysis, resulting in 1020 plants evaluated for selection. The single-plants formed triangular grids, in accordance with honeycomb designs [58]. This spacing was adopted to minimize interplant competition, thereby maximizing the phenotypic expression and differentiation and facilitating the identification of superior individuals. Selection within the population was carried out using the moving-ring method, as described for honeycomb designs. Under this approach, an individual plant was selected only if its performance exceeded that of the neighbouring plants within its local ring, utilizing the relative performance criterion under comparable micro-environmental conditions and accounting for the differences attributed to soil heterogeneity. Selection at the individual-plant level was based on seed yield, seed protein content, and final plant height using a moving ring of 126 plants.
More specifically, the ring performance coefficient (CR) was calculated for each of the 1020 evaluated plants for seed yield, while the remaining traits of interest were evaluated in conjunction with yield performance. The CR evaluates the yield efficiency of the target plant compared to its neighbours, using the formula CR = Y c Y ¯ r where Yc is the yield (or phenotypic value) of the target plant and Y ¯ r is the mean yield (or phenotypic value) of the neighbouring plants within the same moving ring. Following this selection approach, twelve high-yielding (HY) plants—with the highest-ranked CR values—and three low-yielding (LY) plants were identified, and their progenies formed the families evaluated in the following years of experimentation. Each selected plant was regenerated through a single seed multiplication event under isolated cages, preventing the introduction of foreign pollen and restricting pollination to mating among siblings of the same selected plant. This procedure preserved the genetic composition of each family and prevented further recombination between generations. The resulting seed lot for each of the fifteen selected families was harvested once and subsequently divided for sowing across the three evaluation environments (E1, E2, E3), ensuring that the same family was evaluated in each environment.

2.2.2. 2nd and 3rd Year of Experimentation

The selected half-sib families, both high- and low-yielding, were evaluated in the following two growing seasons, using a Randomized Complete Block (RCB) design with three replications per entry, in order to assess progeny performance under typical crop density conditions. In addition to the selected half-sib families, the original population ‘Vevi’ and the commercial variety ‘Dukato’ were included as controls (Table 1). In total, 17 genetic materials were tested in experimental plots consisting of four rows, 1–2 m in length, with an inter-row spacing of 0.25 m, corresponding to plot areas of 0.75–1.00 m2. As mentioned above, two experimental locations—Florina and Thermi—were used during the last growing season (2022–2023). The evaluation in identical open field experiments, corresponding to three environments, aimed to estimate the temporal and spatial performance of the selected half-sib families, highlighting the importance of performance stability.

2.3. Selection Criteria

A range of agronomic and quality traits were recorded at the individual-plant level, under ultra-low plant density for the selection of superior individuals within the local rye population ‘Vevi’ (Table 3). Agronomic traits included plant height in March, final plant height at maturity, days to ear emergence (earliness) and seed yield per plant. Days to ear emergence (DAS) was recorded as the number of days after sowing required for 50% of the plants within a plot to reach ear emergence. The quality profile of the initial population was estimated by determining the seed protein content, using the InfratecTM 1241 Grain Analyzer (FOSS, Hillerød, Denmark) which operates based on near-infrared spectroscopy (NIR), a non-destructive technique widely applied in routine nutrient analysis of agricultural products [59]. NIR is commonly used as an alternative to conventional analytical methods due to its simplicity, accuracy, and rapid processing time [60]. The same set of traits was consistently evaluated in each of the three environments (combinations of location × growing season) during the experimentation for the subsequent evaluation of the half-sib families under typical crop density conditions.

2.4. Statistical Analysis

Genotype (G) and environments (E) were fixed treatment effects. Two-way ANOVA was performed for the three test environments in total to evaluate the effects of genotype, environment, and their interaction on grain yield (t ha−1), plant height in March, final plant height at maturity, days to ear emergence and seed protein content. The effect of genotype on mean grain yield (t ha−1) over the environment is summarized in Section 3. The assumptions of ANOVA were tested employing the Shapiro–Wilk test for assessing the normal distribution of variables and Levene’s test for the equality of the error variances and residual normality [61]. Differences between the half-sib families were identified using a post hoc Duncan test at a significance level of α = 0.05. Broad-sense heritability (H2) was also estimated based on the corresponding variance components using the formula given by Ward et al. (2000) [62]. Pearson’s correlation coefficients (r) were calculated and evaluated for their significance at three probability levels: 0.001 (indicating a strong correlation), 0.01 (indicating a moderate correlation), and 0.05 (indicating a weak correlation) to establish relationships between parameters. All analyses were performed using the IBM SPSS statistical software package (version 29.0; SPSS Inc., Chicago, IL, USA).

2.5. Stability Evaluation

In addition, a genotype and genotype × environment (GGE) biplot analysis [33,36] was conducted for the simultaneous determination of yield and stability across environments, with normalized data using GenStat software (13) [63]. This model measures the distance of each genotype from the “ideal genotype”, i.e., the virtual genotype that has the best combination of mean performance and stability [64]. Furthermore, the AMMI models [34] were executed utilizing the GenStat (13th edition) statistical software. The stability of genotypes across environments was then estimated using both parametric and non-parametric models [65].

2.5.1. Parametric Statistics

Wricke’s ecovalence, Wi2
The ecovalence (Wi) of the ith genotype was calculated following Ninou et al. (2023) [66], by squaring its interaction with the environments and then summing this value across all environments, as introduced by Wricke (1962) [67]. The concept of ecovalence represents the contribution of each genotype to the sum of squares of the genotype–environment (GE) interactions.
Shukla’s stability variance, σ2i
The stability variance of genotype i was proposed by Shukla (1972) [68] and was defined as its variance across environments after accounting for the main effects of environmental means. Based on this stability parameter, the ranking of genotypes was accomplished by considering genotypes with the lowest values to be the most stable.
Deviation from regression, S2di
The variance of deviations from the regression (S2di) has been suggested as one of the most prominent parameters for the selection of stable genotypes, indicating that genotypes with S2di = 0 are considered the most stable, while S2di > 0 indicates lower stability across all environments. Hence, genotypes with lower values are the most promising [69].
Coefficient of variance, CVi
The coefficient of variance CVi suggested by Francis and Kannenberg (1978) [70] combines the coefficient of variation (CV), mean yield and environmental variance (EV).
CV i = Δ i 2 x i ¯ × 100
Kang’s rank-sum KR
Kang’s rank-sum method [71] combines yield and σ2i variance as selection criteria for the identification of high-yielding and stable genotypes. According to this parameter the genotype with the highest yield and the lowest σ2i is assigned a rank of one. Finally, the yield and stability variance ranks for each genotype are combined. Genotypes with the lowest rank-sum are regarded as the most desirable.
GE variance component θ(i)
This parameter involves removing the ith genotype from the entire dataset and calculating the variance of the remaining subset’s genotype–environment interaction (GEI) and serves as the stability index for the ith genotype, associating higher values of this statistic with greater genotype stability.
AMMI’s stability value, ASVi
The AMMI models [34] accounting for the first and second principal component scores (PC1 and PC2) through GenStat (13th edition) statistical package [63] were calculated using the following equation by Purchase et al. (2000) [72],
ASV i = S S P C 1 S S P C 2 P C 1 2 + P C 2 2
where SS is the sum of squares. According to this, the genotype with the smallest ASVi is considered the most stable.
Genotype superiority Pi
This parameter was calculated determining the mean square distance between the genotype and the maximum response as follows [73]:
P i = ∑ i y ¯ ij − max j 2 / 2 e
where Ymax represents the maximum response observed among all genotypes in a given environment (j). In addition, Yij represents the yield of the ith cultivar in the jth location, while e denotes the number of locations tested. The smallest Pi value indicates the better genotype.

2.5.2. Non-Parametric Statistics

Nassar and Huhn’s statistics S(1), S(2), S(3), S(6)
Additionally, four (4) non-parametric statistics were calculated for assessing genotype stability as proposed by Huehn (1990) [74] and Nassar & Huehn (1987) [75]. These parameters were used in previous studies by Ninou et al. (2024) [66] and Melios et al. (2024) [76] accurately assessing the stability of genotypes across environments. More specifically:
  • S(1) represents the mean of the absolute rank differences in genotypes across all tested environments, using the following formula (Equation (1)).
    S i ( 1 ) = 2 ∑ J m − 1 ∑ J ¯ = J + 1 m | r ij − r i J ¯ | m m − 1
  • S(2) represents the variance among the ranks across all tested environments using the following equation (Equation (2)).
    S i 2 = ∑ J = 1 m r ij − r i . ¯ 2 m − 1
  • S(3) represents the sum of the absolute deviation for each genotype relative to the mean of ranks as given by Equation (3).
    S i 3 = ∑ J = 1 m r ij − r i . ¯ 2 r i . ¯
  • S(6) represents the sum of squares of rank for each genotype relative to the mean of ranks, using Equation (4).
    S i 6 = ∑ J = 1 m | r ij − r i . ¯ | r i . ¯
    where J represents genotypes, m represents environments, rij denotes the ranking of the ith genotype in the jth environment, and r i . ¯ represents the ith genotype rank across the environments.
These stability parameters are calculated after transforming the mean yield values into ranks for each genotype and environment. Similar ranking of a genotype across environments denotes stability, while lower values for these statistics indicate higher stability for a particular genotype.
Thennarasu’s statistics NP(1), NP(2), NP(3), NP(4)
The following four stability statistics introduced by Thennarasu (1995) [77] are derived from the ranks of adjusted means of genotypes in each environment. Lower values of these parameters indicate high stability. Accordingly:
NP 1 = 1 N ∑ j = 1 n | r ij * − M di * |
NP 2 = 1 N   ∑ j = 1 n | r ij * − M di * | / M di
NP 3 = ∑ r ij * − r ¯ i . * 2 N ri .
NP 4 = 2 N N − 1 ∑ j = 1 n − 1 ∑ j ′ = j + 1 n | r ij * − r ij ′ * | / r i ¯
where r ij * is the rank of the ith genotype in the jth environment based on adjusted data, r ij * ¯ and M di * are mean and median ranks, respectively, for adjusted values, r i ¯ and Mdi are the mean and median ranks of the ith genotype in the jth environment, respectively. r i ¯ and M di * are the mean and median ranks obtained from the unadjusted data.
Finally, the GGE biplot model is based on singular value decomposition of the first two principal components:
yij − μ − βj = λ1ξi1ηj1 + λ2ξi2ηj2 + εij
where yij is the mean of genotype i in environment j, μ is the grand mean, βj is the main effect of environment j, λ1 and λ2 are the singular values of the first and second principal components (PC1 and PC2), ξ1 and ξ2 are eigenvectors of genotype i for PC1 and PC2 respectively, η1 and η2 are eigenvectors of environment j for PC1 and PC2 and εij is the residual associated with genotype i in environment j.
The combination of ANOVA, AMMI, GGE biplot and sixteen parametric and non-parametric stability indices was selected in accordance with the study’s objective to rank and compare a finite, pre-selected set of fifteen half-sib families across three representative target environments, rather than to estimate population-level genetic parameters from a random sample of the ‘Vevi’ gene pool. Fixed-effects comparisons of a bounded panel of candidate breeding material are standard practice in applied multi-environment evaluation and cultivar advancement trials, and AMMI and GGE biplot methods are specifically adapted to this setting, prioritizing the interpretable visualization of family performance and adaptation patterns across a limited number of environments. The sixteen stability indices were included jointly because parametric and non-parametric measures rest on distinct statistical definitions of stability. However, this fixed-effects framework is not the only valid approach for material of this genetic structure: a mixed-model approach treating family as a random effect, combined with best linear unbiased prediction (BLUPs) and a half-sib relatedness coefficient for heritability estimation, would be better suited to drawing population-level inferences about the broader ‘Vevi’ gene pool, including shrinkage-adjusted family rankings that account for unequal estimation precision. Such an approach was outside the scope of the present study, whose objective was the applied identification of the best-performing pre-selected families for subsequent breeding stages, and represents a valuable direction for future evaluation of this material.

3. Results

3.1. Selection of Promising Germplasm Under Nil-Competition

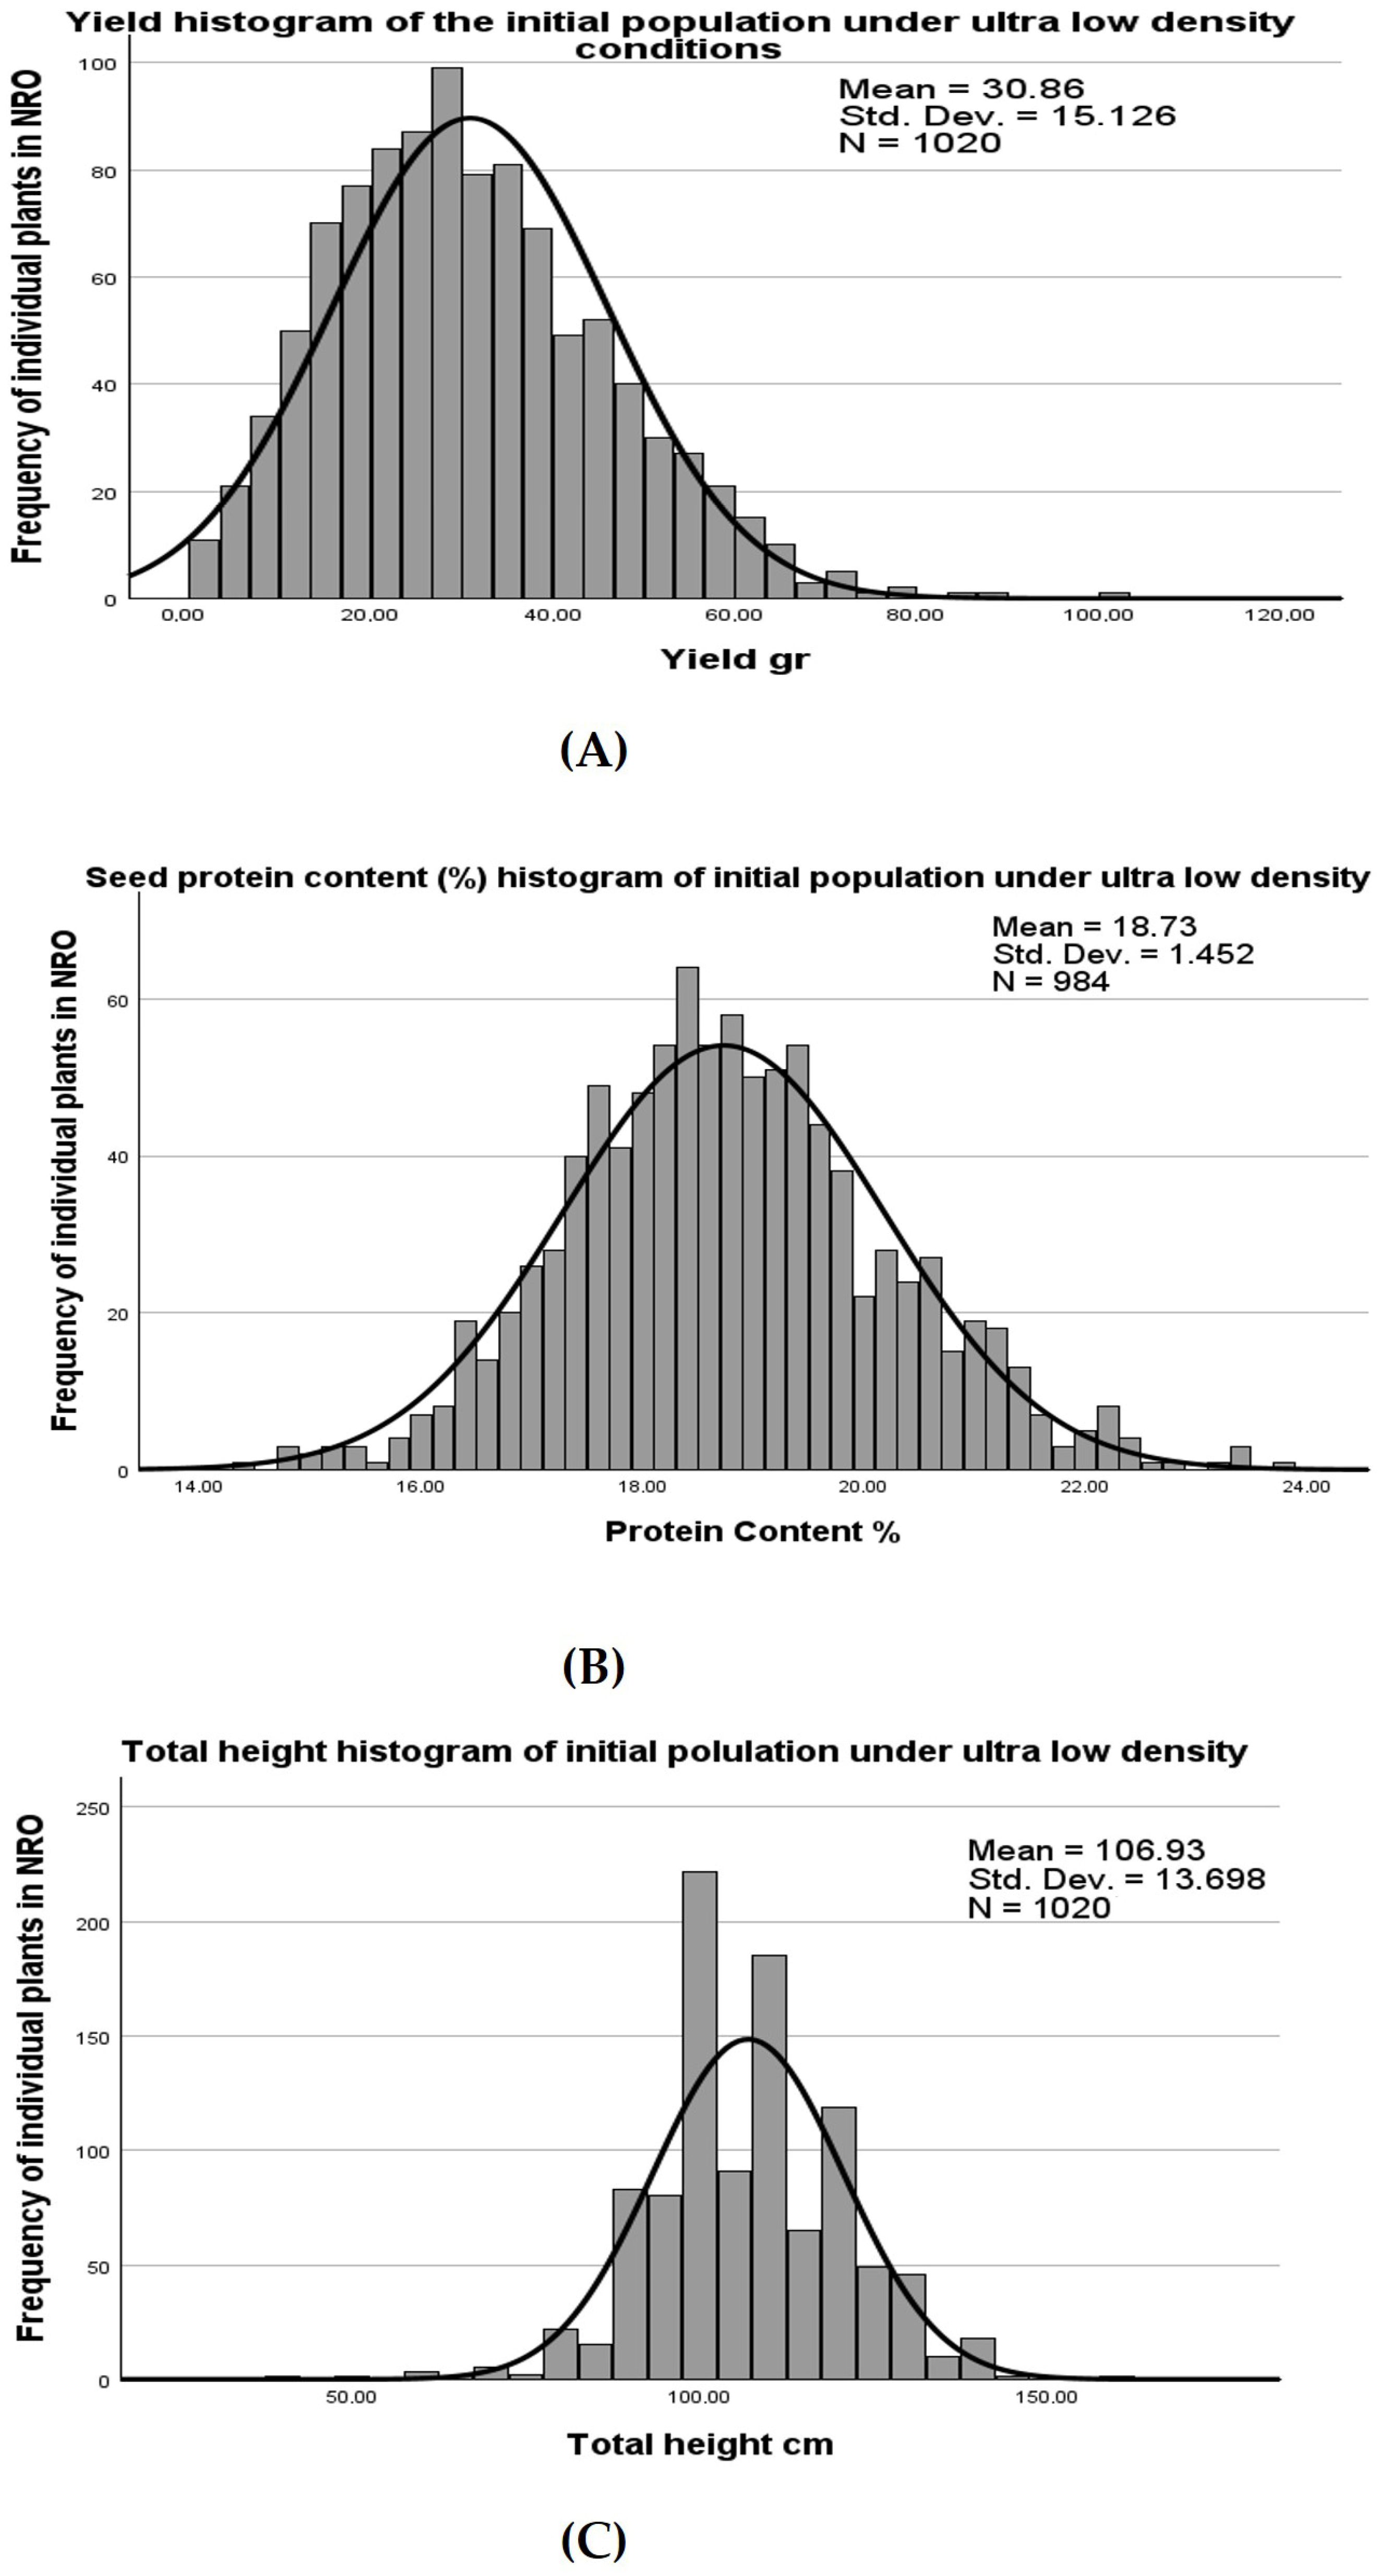
The objective of the NR0 selection design in the first year was to assess the extent of variability present in the traditional rye population ‘Vevi’ and select for superior individuals based on multiple criteria. The exploitation of genetic variability in locally adapted landraces has been shown to be effective through appropriate selection strategies [78], while genetic diversity constitutes the main driving force of selection response and population evolution [79]. As shown in Table 3, the traits were evaluated on a single-plant basis (1020 individual plants in total) and coefficients of variation for each trait were extracted.
Examination of the coefficients of variation (CV) presented in Table 3 indicates substantial phenotypic variability for most of the measured traits. The coefficient of variation ranged from 1.03 to 49.02%. Among the agronomic characteristics, the highest CV value was observed for seed yield (49.02%). In contrast, minimal variability was recorded for days to ear emergence (1.03%) and seed protein content (7.75%). This was expected, given that the experiment was conducted under nil-competition in a honeycomb design, maximizing the phenotypic differences among individual plants within the original population. These results suggest high experimental precision, as out of the five evaluated traits, two had low coefficients of variation (CVs) (less than 10%), one descriptor had a medium CV (10–20%) regarding plant height at maturity and only two traits had high CVs (>20%). Overall, these results demonstrate that the local rye population ‘Vevi’ possesses substantial within-population variability across most traits. Such variability is advantageous in plant breeding, as it provides a broad genetic base for selection and enhances the potential for genetic gain. The histograms presented in Figure 2 corroborate the CV estimates in Table 3, illustrating the normal distribution of trait values within the population. Indeed, agronomic traits governed by polygenic inheritance, such as yield, are traditionally modelled as normally distributed variables, enabling their phenotypic variation within a population to be effectively described through estimates of the mean and variance [80].
By estimating the ring performance coefficient (CR) for grain yield at the individual-plant level and simultaneously considering seed protein content and final plant height, twelve superior plants were selected, while three LY plants were retained as a contrasting reference group (Table 4). In this context, the increased selection pressure afforded by the honeycomb design resulted in effective intrapopulation single-plant selection, retaining only the superior germplasm.
As can be seen from Table 4, the yield of the selected individual plants ranged from 101.86 gr to 9.59 gr, the protein content from 21.2% to 16.6%, the total height from 142 cm to 91.8 cm and the moving ring performance coefficient (CR) for grain yield per plant−1 from 6.19 to 0.13. The highest yielding plant had a yield of 101.86 gr, a CR of 6.19, 18.2% protein content and a total height of 112 cm, whereas the lowest high-yielding plant had a yield of 53.44 gr, a CR of 2.22, 20.6% protein content and a total height of 118 cm.
The performance of the selected low-yielding groups is presented in Table 4. Grain yield ranged from 14.09 to 9.59 gr per plant, CR values from 0.22 to 0.13, seed protein content from 21.2% to 17.02%, and total plant height from 124.5 to 91.8 cm.

3.2. Subsequent Multi-Environment Evaluation of Selected Half-Sib Families

3.2.1. Analysis of Variance and Mean Performance

Analysis of variance revealed statistically significant differences among families for all five traits studied (Table 5). More specifically, the grain yield of the rye selected half-sib families was significantly affected by environment and genotype (p < 0.001) and their interaction (p < 0.01). Based on the results (Table 6), G6 had the highest grain yield (4.24 ton·ha−1), followed by G11 (3.89 ton·ha−1), G8 (3.71 ton·ha−1) and G9 (3.68 ton·ha−1). Furthermore, these four families exceeded the yield of the original population ‘Vevi’ by 25%, 14.7%, 9.4% and 8.5%, respectively. The families with the lowest overall productivity were G15 (2.80 ton·ha−1) and G17 (2.77 ton·ha−1), with no statistically significant differences between them. The distribution of grain yield values is noteworthy, as the original population ‘Vevi’ (G16) exhibited moderate performance and outperformed the commercial cultivar ‘Dukato’ (G17) which ranked last. This underscores the importance of intrapopulation selection by highlighting the future promising lines among the families that are superior to the original unimproved population.
Regarding the seed protein content, G14 ranked first (15.24%), followed by G15 (15.10%) and G13 (14.77%). Thus, the low-yielding families had an advantage in terms of seed protein content, necessitating the simultaneous selection for both criteria. Even in this case, G16 (base population) showed medium values while G17 ranked last. As a result, the low-yielding families significantly exceeded both the original population ‘Vevi’ and the commercial cultivar ‘Dukato’ in seed protein content.
The earliness was reflected in the number of days to ear emergence, as the commercial variety G17 required 176.4 DAS, while the selected line G2 needed 170.3 DAS. Other families that showed earliness were G14, G9, G6 and G12, with no statistically significant differences between them based on the Duncan test (p < 0.05).
Plant height recorded in March varied significantly among families and across environments and showed a significant G × E interaction, indicating that families responded differently to environmental conditions during the early growth period. More specifically, high-yielding families G9 (34.44 cm) and G2 (34.41 cm) presented early vigour and overwintering recovery—both desirable traits for effectively competing against weeds during the critical spring establishment period. At final maturity, plant height differed significantly among families and across environments ranging from 138.8 cm to 178.4 cm. Notably, the high-yielding germplasm G6, G11, G8 and G9 selected in the present study tended to exhibit intermediate to shorter stature compared to the low-yielding ones. This finding is consistent with the harvest index concept, where partitioning of assimilates toward the grain rather than vegetative biomass confers a yield advantage. Furthermore, this relationship between reduced height and increased grain yield reinforces the value of selecting for intermediate plant height as part of an ideotype breeding strategy in rye, where shorter genotypes are less susceptible to lodging and therefore able to express their yield potential across different environments.
Furthermore, regarding grain yield, the highest percentage of variation was explained by the environment E (49.2%), followed by genotype G (16.2%) and G × E (11.4%). The same pattern was observed for plant height both in March and at full maturity and for days to ear emergence, as E explained 86.8%, 65% and 96.8%; G explained 6.4%, 15.8%, and 2.1% and G × E explained 2.6%, 5.7% and 0.7%, respectively. However, in the case of seed protein content the highest percentage of variation was explained by G (41.5%), while no statistically significant differences were found for E and G × E, highlighting the strong influence of genotype on the intra-population variation for this trait.
High heritability estimates depicted a low error variance and a high genetic variance for all traits. Broad-sense heritability H2 ranged from 0.95 to 0.99, indicating that the observed variation among families was predominantly of genetic origin, suggesting that selection based on phenotypic performance would be effective and reliable across environments. The coefficient of variation ranged from 0.4% to 14.1%, demonstrating good consistency in the experimental data. Similarly, with the NR0 data analysis, the highest CV value was observed for seed yield (14.1%) followed by March plant height (10.9%), final plant height (5.6%), seed protein content (5.4%) and days to ear emergence (0.4%).
Pearson’s correlation analysis (Table 7) revealed several significant correlations between the traits under study, providing useful insights into the relationships that may guide simultaneous selection within the original rye population ‘Vevi’. A significant positive correlation was detected between plant height recorded in March and grain yield (r = 0.651), suggesting that families exhibiting early vigour tended to produce higher grain yields. This observation is agronomically meaningful, as early spring growth reflects the capacity of the plant to reorganize its metabolic activity after cold stress and secure resources during the critical tillering phase. Early vigour may therefore serve as an indirect selection criterion for yield potential.
The most noteworthy correlation observed was a significant negative correlation between days to ear emergence and grain yield (r = −0.703), indicating that early-heading germplasm consistently achieved higher grain yields across the evaluation environments. From a breeding perspective, days to ear emergence would serve as a particularly valuable selection criterion, given its strong correlation with yield performance and its high heritability (H2 = 0.99).
A significant negative correlation was also found between days to ear emergence and final plant height (r = −0.777), revealing that later-heading families tended to develop taller stems at maturity. This pattern likely reflects the extended vegetative growth, during which the late-heading families continue internode elongation resulting in greater final plant height. As a consequence, late-heading families combine two unfavourable agronomic characteristics: delayed maturity and elongated stems. Taken together, the correlation pattern identified in this study highlights that early ear emergence is a key integrative trait in rye improvement, simultaneously associated with higher yield and reduced lodging risk.

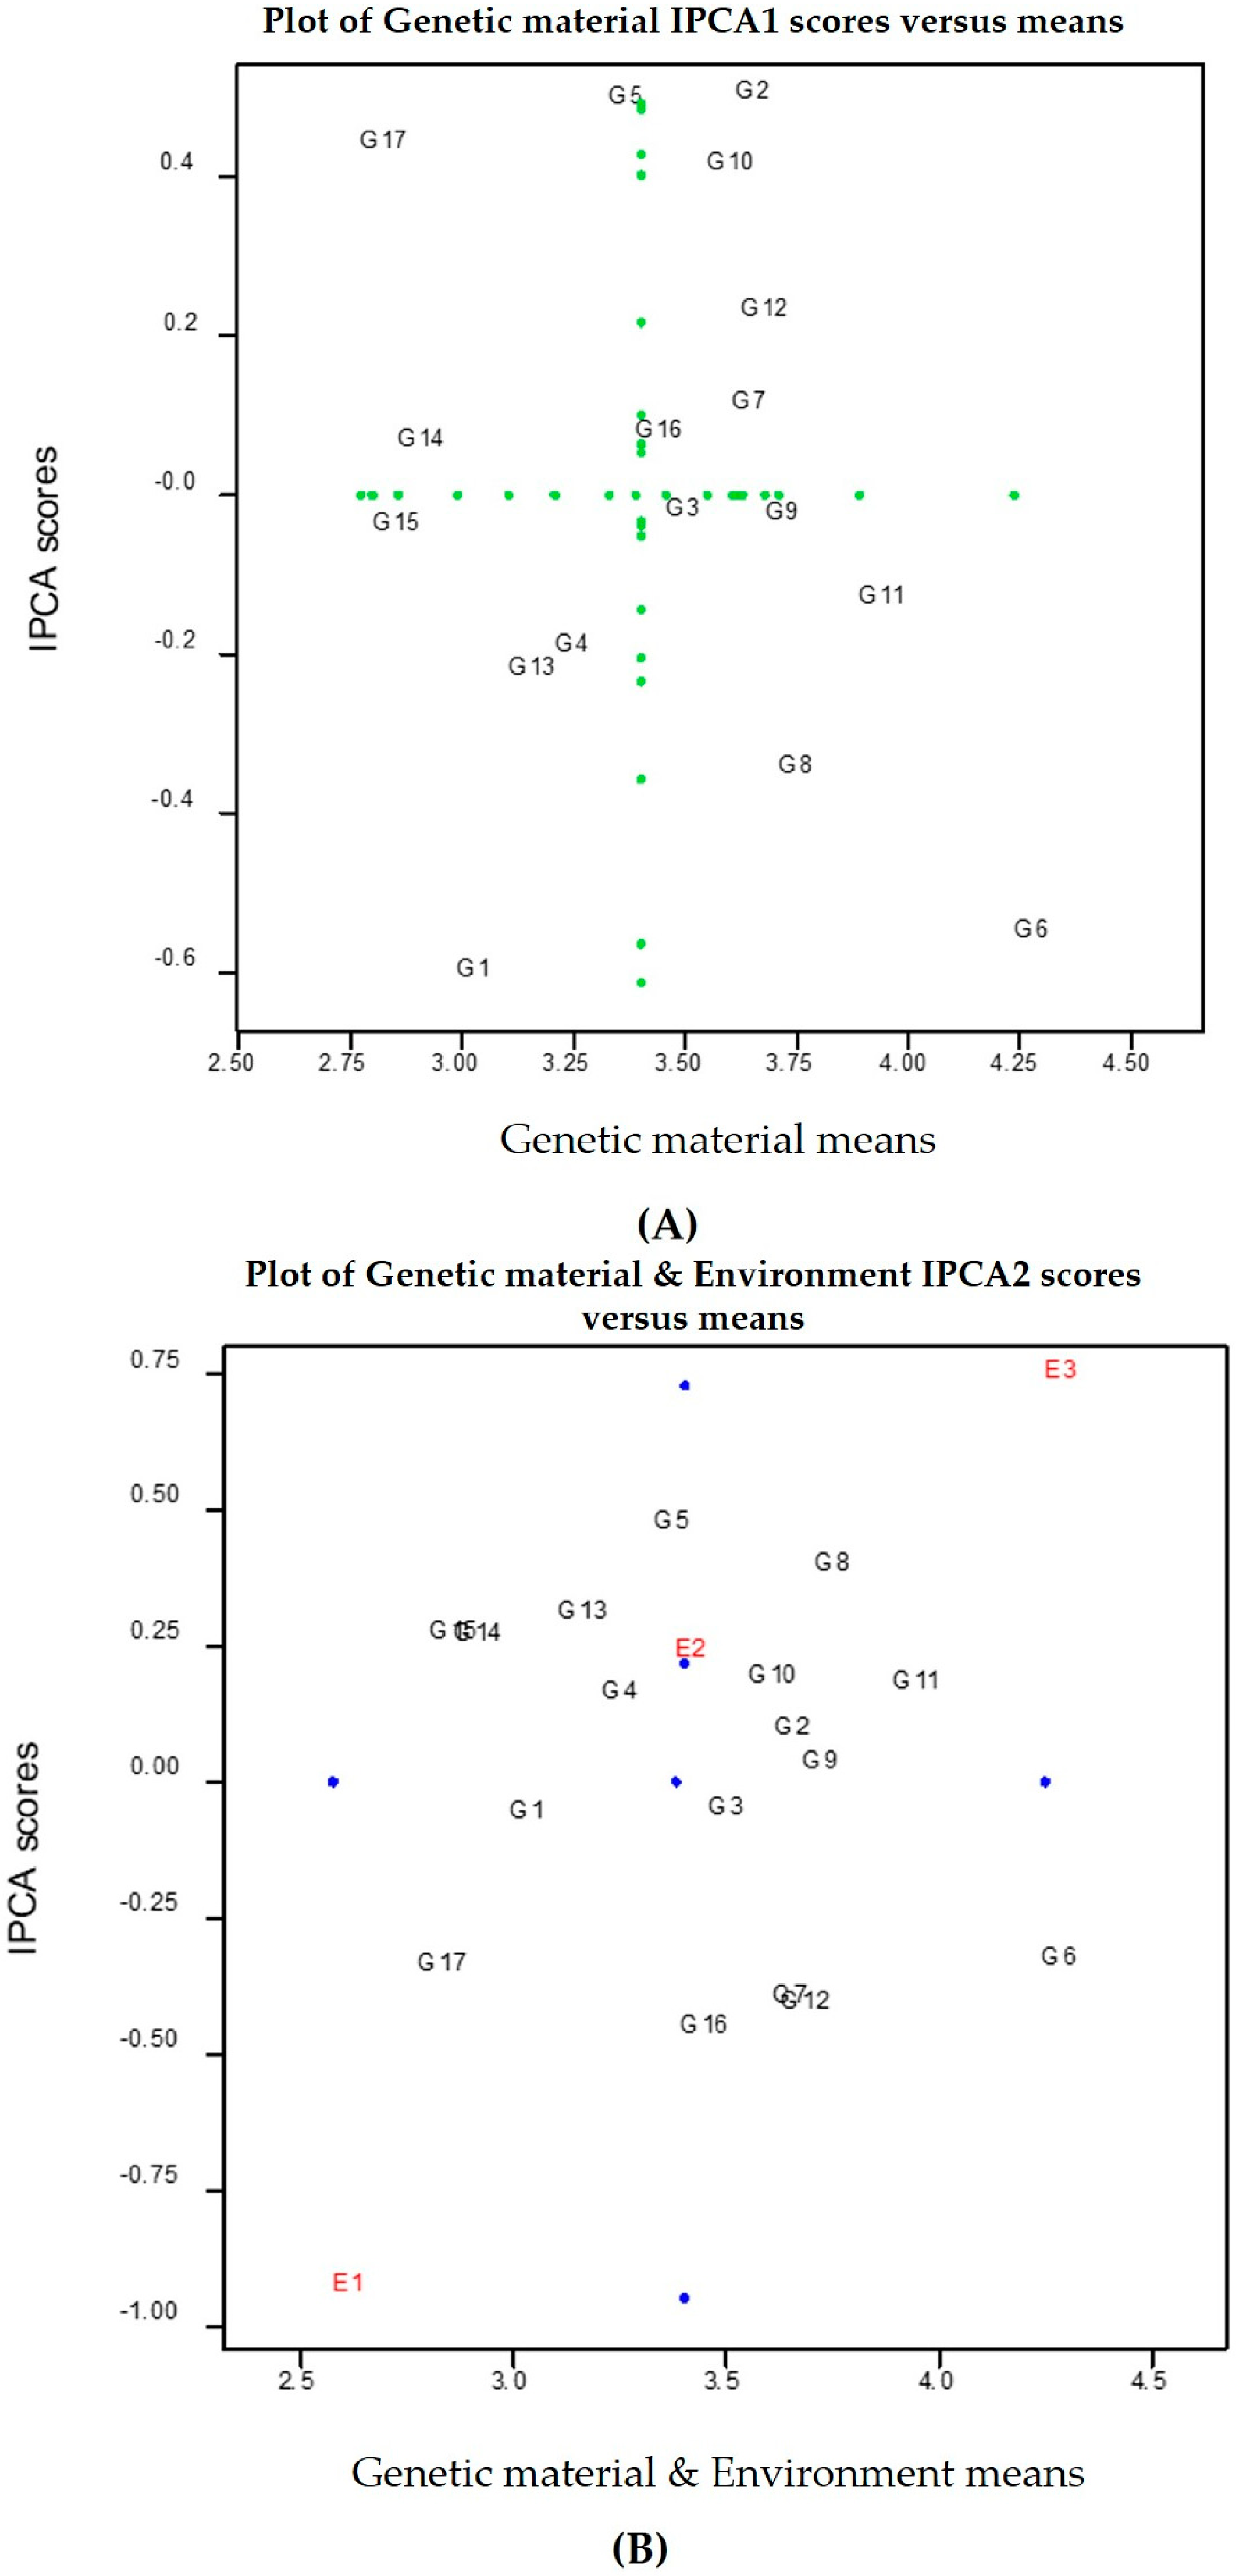
3.2.2. AMMI and GGE Biplot Analyses

As noted above, the following AMMI and GGE biplot results characterize family performance and stability specifically across the three environments evaluated in this study; broader inferences about adaptability should be confirmed through testing across additional years and locations. The AMMI analysis of variance confirmed that the environment main effect accounted for the largest proportion of the total variation in grain yield (SS = 71.53, representing 49.2% of the total sum of squares). E1 and E3 were identified as the most discriminating environments, while E2 was identified as the most representative, as depicted in the AMMI2 biplot (IPCA2 vs. means) (Figure 3B). The AMMI1 biplot, plotting genetic material IPCA1 scores against mean yields, provided a clear visual separation of the evaluated entries based on their yield potential and stability profile. In Figure 3A, half-sib families positioned close to zero on the IPCA1 axis are considered stable, as they exhibit minimal interaction with the environments, while half-sib families with large positive or negative IPCA1 scores demonstrate specific adaptation. Among the high-yielding selected families, G9 (mean yield = 3.68 ton ha−1) emerged as the most stable half-sib family (IPCA1 = −0.039 and IPCA2 = 0.011), indicating that its yield performance was highly consistent across the three evaluation environments. This was further confirmed by its ASVi value of 0.049, the lowest recorded value among all families. In addition, G11 exhibited a favourable performance combining above-average yield and relatively low IPCA scores (mean yield = 3.89 ton ha−1, IPCA1 = −0.144, IPCA2 = 0.159, ASVi = 0.239), revealing its broad adaptability across the three tested environments.
In contrast, G6, which recorded the highest mean yield across environments (4.24 ton ha−1), demonstrated the largest ASVi value, along with high negative IPCA1 and IPCA2 scores (−0.564 and −0.346, respectively), indicating strong specific adaptation to particular tested conditions rather than broad adaptability. The AMMI2 biplot (Figure 3B) further clarified the direction of this specific adaptation, as the negative IPCA2 score of G6 aligns it with E1, which exhibited the most extreme negative IPCA2 score among the three environments. Similarly, G8 (mean yield = 3.71 ton ha−1, ASVi = 0.581) displayed a large positive IPCA2 score (0.375), indicating specific adaptation to E3.
Among the low-yielding selected families, G14 and G15 displayed relatively small IPCA scores despite their low mean yields, characterizing them as stable but poor performers. Conversely, G1 and G17 (‘Dukato’) combined low yield with high IPCA scores and ASVi values, representing the least desirable agronomic profile.
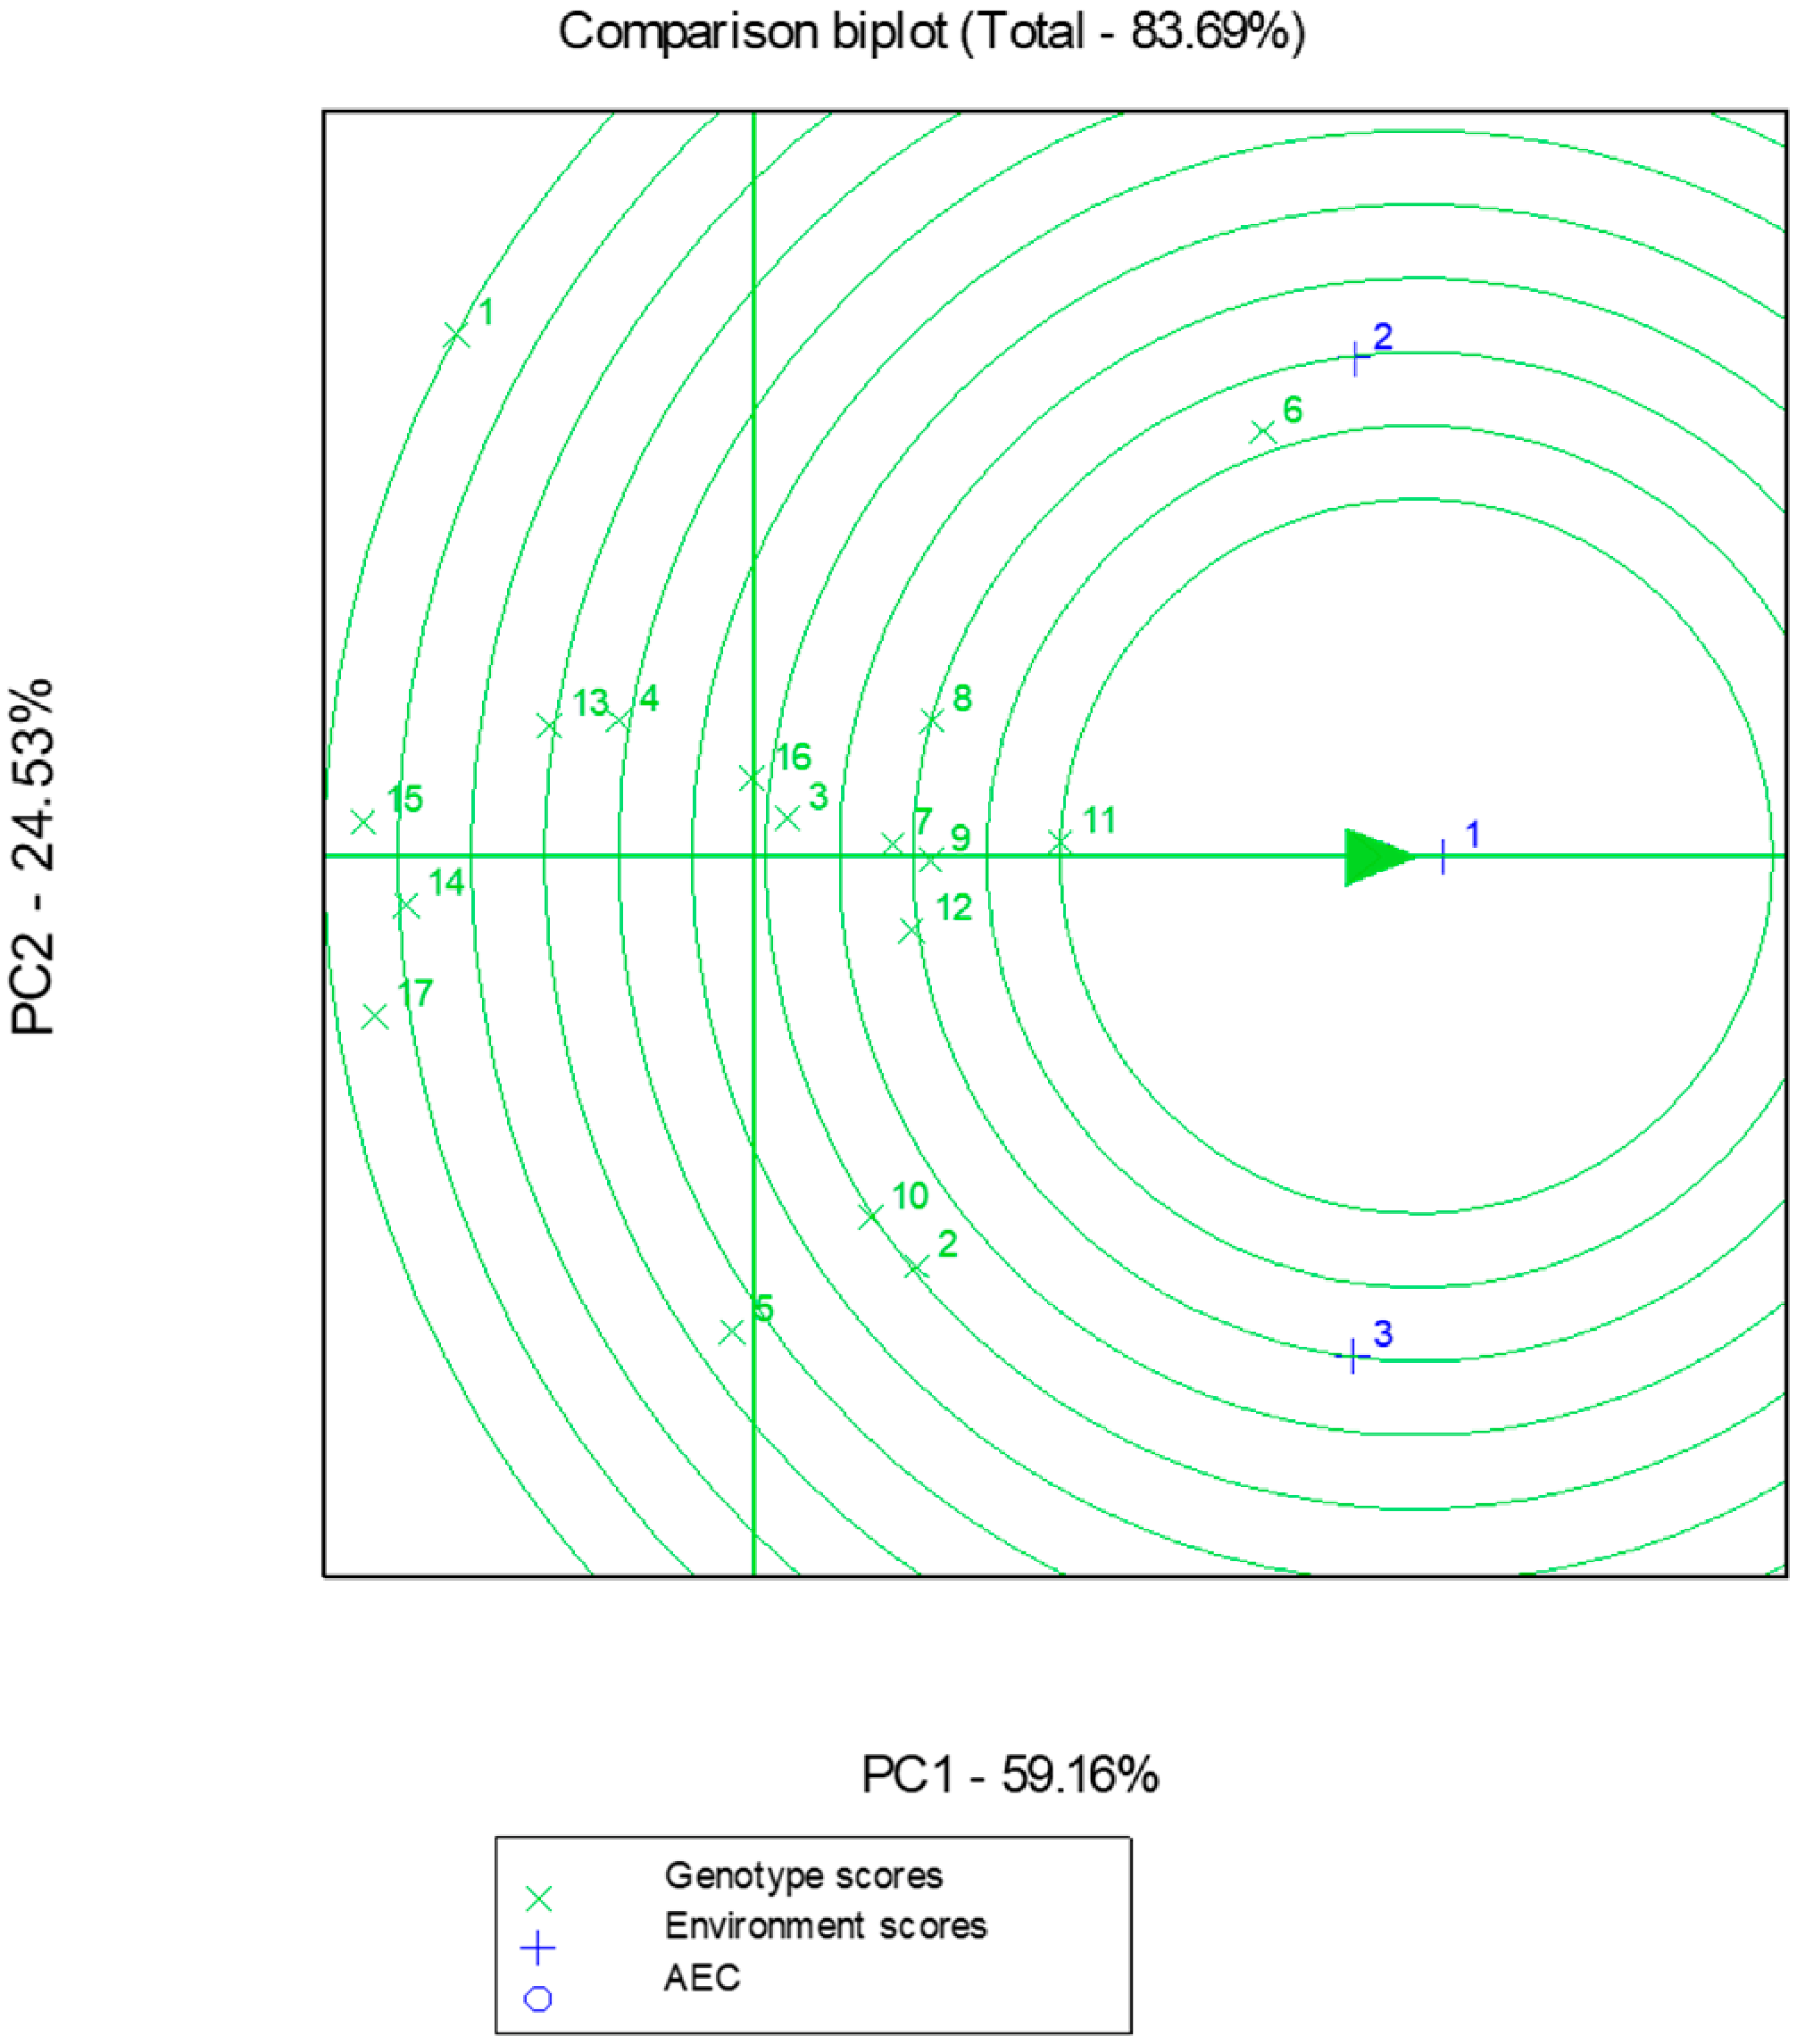
The GGE biplot analysis complemented and confirmed the AMMI findings. PC1 and PC2 of the GGE biplot explained 59.16% and 24.53% of the total GGE variation respectively, with a combined explanatory power of 83.69%. In Figure 4, the families positioned in the inner circles on the right side of the GGE comparison biplot represent the most desirable profiles, combining high yield projection onto the average environment coordinate (AEC) axis with proximity to the ideal genotype. Based on this criterion, G11 ranked as the top performer, followed by G6 and G9. G6, despite recording the highest yield, ranked second in the GGE biplot due to its greater distance from the AEC axis, reflecting its specific adaptation. G8 and G12 completed the top five performers, both positioned in the inner to mid circles on the right side of the biplot with above-average yields.

3.2.3. Superior Germplasm Unveiled by Multiple Stability Parameters

The phenotypic stability of grain yield was assessed using a comprehensive set of parametric and non-parametric indices, based on the adaptation of the evaluated families in different environments. Table 8 displays the families found in each index’s first five and last five positions based on the ranking for every stability parameter used. The results revealed a partial agreement between parametric and non-parametric measures in the ranking of families for stability. In the total evaluation of all environments, G3, G9 and G11 dominated the top five ranking with frequencies of 15/18, 17/18 and 16/18, respectively, identifying them as the most stable families within this evaluation. Considering the bottom five ranking, G1, G5 and G17 had the worst positions, with frequencies of 17/18, 12/18 and 15/18, respectively.
Among the top five ranked families for seed yield, two high-yielding selected families (G11 and G9) demonstrated consistent stability across both parametric and non-parametric statistics, ranking within the top five positions for grain yield while simultaneously appearing among the most stable families regardless of the stability index applied. This finding is of considerable breeding value, as it demonstrates that high yield potential and stability are not mutually exclusive within the traditional rye population ‘Vevi’. Such germplasm, combining above-average yield with broad adaptability, represents the most promising candidate for further advancement and evaluation across additional years and locations in the breeding programme before recommendation for diverse or marginal target environments. The remaining three high-yielding selected families (G6, G8, G12), exhibited an inconsistent stability profile, ranking within the top five positions according to certain parameters while simultaneously appearing among the bottom five according to others. This observation suggests that these half-sib families interact differentially with specific environmental conditions, resulting in specifically adapted lines with exceptional performance in targeted optimal environments.
The rank correlations between the statistical measures assessed in the three different environments are displayed in Table 9. The Spearman rank correlation analysis confirmed the partial agreement between parametric and non-parametric indices, with significant positive correlations observed within each group, highlighting their internal consistency in evaluating the stability of the seventeen genetic materials. The mean grain yield displayed a strong negative correlation with measures of GGE rank (r = −0.966 **), Pi (r = −0.980 **), KR (r = −0.763 **), S(6) (r = −0.789 **), NP(2) (r = −0.922 **), NP(3) (r = −0.752 **), and NP(4) (r = −0.750 **). This indicates that higher-yielding families tended to rank better across multiple stability indices as well. GGE analysis, Pi and KR were strongly and positively correlated, but no correlation was found with ASVi. Moreover, strong positive correlations were found for: (1) GGE with S(6), NP(2), NP(3), and NP(4), (2) ASVi with σ2i, S2di, Wi2, S(1), S(2), S(3) and NP(1), (3) σ2i with S2di, Wi2, S(1), S(2), S(3) and NP(1), (4) Pi with S(6), NP(2), NP(3) and NP(4), (5) S2di with Wi2, S(1), S(2), S(3) and NP(1), (6) Wi2 with S(1), S(2), S(3) and NP(1), (7) KR with S(3), S(6), NP(2), NP(3) and NP(4), (8) S(1) with S(2), S(3) and NP(1), (8) S(2) with S(3) and NP(1), (9) S(3) with S(6), NP(3) and NP(4), (10) S(6) with NP(2), NP(3) and NP(4), (11) NP(2) with NP(3) and NP(4) and (12) NP(3) with NP(4).

4. Discussion

The present results should be interpreted against the broader background of rye’s adaptability to marginal, low-input conditions—including its drought tolerance on sandy soils and the genetic diversity retained within its predominantly cross-pollinated landraces [12,81,82,83,84,85]—and the pronounced year-to-year climatic variability that characterizes Mediterranean cereal production [66].
The original population ‘Vevi’ (G16) surpassed the commercial cultivar ‘Dukato’ (G17), emphasizing the agronomic value of locally adapted germplasm. This observation is consistent with previous studies showing that rye landraces remain valuable reservoirs of genetic diversity for cultivar improvement [12,55,85,86]. A comparable pattern has been reported for rye landraces evaluated in a broader range outside Greece: a landrace collected in Eastern Turkey likewise displayed wide variability in grain-yield-related traits when examined by biplot-based approaches [87]. In the Italian Alps, locally adapted rye landraces differed from commercial cultivars in agronomic and quality characteristics [19]. Moreover, the broad phenotypic variation retained within the local rye population ‘Vevi’ confirms that this germplasm still possesses considerable breeding potential. The wide range of variation recorded for most agronomic traits (CV = 1.03–49.02%) provided a strong basis for effective selection, as the response of a heterogeneous population depends on the variation maintained among its individual plants [51,70,71]. Comparable variation in phenology, plant height, yield components and grain yield has also been reported in rye landraces evaluated in other European and semi-arid environments [85,88]. Therefore, the diversity observed within ‘Vevi’ is not an isolated characteristic of Greek germplasm but agrees with the variation generally retained within rye landraces. In the present study, the high-yielding families consistently outperformed the low-yielding group, confirming that substantial genetic gain can be achieved through selection within a heterogeneous rye population. Mean grain yield among the selected high-yielding families ranged from 3.21 t ha−1 for G4 to 4.24 t ha−1 for G6, while the original population ‘Vevi’ (G16) also surpassed the commercial cultivar ‘Dukato’ (G17). Although direct comparisons among studies should be made cautiously because of differences in climate, management and experimental design, these yield levels show that locally adapted landraces may provide breeding material with productivity comparable to commercial germplasm. Similar findings from other rye-growing regions support the continuing value of landraces as sources of adaptation and agronomic improvement [55,85,86,88].
The inverse relationship between grain yield and protein concentration observed in the present study agrees with the negative association commonly reported in cereals. This relationship is generally attributed to a dilution effect, whereby greater carbohydrate accumulation during grain filling reduces grain protein concentration [14,89]. However, G6, the genetic material with the best yield, maintained a grain protein concentration of 14.20%, which is within the range typically recorded for rye [90]. This result indicates that selection for increased yield within a landrace does not necessarily lead to an unacceptable reduction in grain protein concentration. However, protein concentration represents only one aspect of grain quality, and traits such as test weight, starch characteristics and processing quality would also need to be evaluated before the material could be considered for commercial use. The performance of G6 relative to both the original population ‘Vevi’ and the commercial cultivar ‘Dukato’ therefore identifies it as promising breeding material combining high productivity with acceptable protein concentration.
Several biologically meaningful and agronomically relevant associations were identified among the evaluated traits. Plant height in March was positively correlated with grain yield (r = 0.651, p < 0.01), suggesting that greater early vegetative development was associated with higher productivity. Early vigour may improve soil coverage, radiation capture and competitive ability against weeds and could therefore be useful in low-input and organic cereal production systems [91]. However, the observed correlation does not establish a direct causal relationship, and the usefulness of early plant height as a selection criterion should be confirmed in a wider range of environments and genetic backgrounds. Grain yield was also negatively correlated with days to ear emergence (r = −0.703, p < 0.01), indicating that earlier-heading genetic materials generally performed better across the tested environments. Similar responses have been reported in rye and other winter cereals grown under Mediterranean and semi-arid conditions, where earlier reproductive development may reduce exposure to terminal heat and water deficit during grain filling [92,93]. The relationship observed in the ‘Vevi’-derived material may therefore also be relevant to rye improvement in other regions affected by late-season drought and heat stress.
Environmental conditions accounted for the largest proportion of phenotypic variation for all traits except seed protein concentration, confirming that climatic and edaphic factors were the main determinants of phenotypic expression across the three test environments. Grain yield, March plant height and days to ear emergence were also significantly influenced by genotype × environment (G × E) interaction, indicating that the relative performance of the genetic materials changed among environments. In contrast, protein concentration was comparatively stable. Strong environmental effects and differences in the responses of rye genotypes have also been reported in trials conducted in central and northern Europe and in the Middle Volga region, particularly for grain yield, heading date and plant height [31,32,94]. The environmental influence observed in the present study is therefore not restricted to Greece but represents a broader feature of rye performance across contrasting production regions [95,96,97]. Similar patterns have also been reported in durum wheat [66,98,99] and barley [100,101]. These findings reinforce the need for multi-environment and, where possible, multi-year evaluation before rye breeding material is recommended for cultivation.
The pronounced crossover G × E interaction observed for grain yield justified the combined application of complementary stability analyses, since no single method can fully describe genotype responses across contrasting environments [65]. AMMI and GGE biplot analyses, together with sixteen parametric and non-parametric stability statistics, produced a largely consistent assessment of genotype performance. G9 and G11 combined competitive grain yield with stable performance across the three test environments, whereas G6 and G8 showed specific adaptation to the ‘Vevi’ environment (E1) and the representative Mediterranean environment (E3), respectively. These results distinguish material that should be tested further across Mediterranean environments from genotypes that may be useful for more narrowly defined target conditions. Differences between broad and specific adaptation have also been reported in international rye breeding and multi-environment studies, in which genotype ranking changed according to climatic, soil and management conditions [31,32,86,90]. Similar applications of AMMI and GGE biplot analyses have demonstrated their value for identifying stable and high-performing genotypes in wheat [102,103,104], barley [105,106] and maize [39,107]. More recently, GGE biplot analysis has been used to characterize the adaptation potential of Italian wheat genotypes under Mediterranean conditions [108], and to evaluate genotype x environment and genotype x year interaction in Turkish triticale breeding trials [109,110], while a recent multi-year AMMI/GGE evaluation of triticale under pronounced interannual climatic variability has similarly been reported in Bulgaria [111]. The predominant role of environmental variation observed in the present study is further consistent with recent GGE biplot analyses of rainfed durum wheat across representative dryland Mediterranean-adjacent environments [112]. These recent applications, spanning rye’s closest small-grain relatives under comparable Mediterranean and semi-arid conditions, support the continued relevance of AMMI and GGE biplot methodology for characterizing G x E interaction in small-grain cereals under variable Mediterranean and broader European climatic conditions. Nevertheless, the apparent broad adaptation of G9 and G11 refers only to their stability across the environments included in the present study and should be confirmed over additional years and locations.
Spearman rank correlation analysis further clarified the relationships among the stability statistics and showed a distinction between measures emphasizing agronomic performance and those primarily describing statistical stability. Consistent with the classifications proposed by Mohammadi et al. [113] and Vaezi et al. [114], GGE biplot results, Pi and Kang’s rank were closely associated with grain yield, reflecting the dynamic concept of stability, in which productivity and consistency are considered together. In contrast, Wi2, σ2i, S2di, ASVi, θ(i), S(1), S(2), S(3) and NP(1) showed little or no association with mean yield and therefore mainly represented the static concept of stability. The remaining measures provided different compromises between productivity and consistency. These findings confirm that a genotype may be statistically stable because it performs consistently at either a high or a low yield level. Stability statistics should therefore not be interpreted independently of mean performance. The strong correlations observed within the parametric and non-parametric groups agree with previous multi-environment cereal studies [66,115] and explain the generally consistent ranking of the most promising genotypes.
The combined evidence from AMMI, GGE biplot and the parametric and non-parametric stability statistics identified G9 and G11 as the most promising half-sib families, combining high grain yield, acceptable grain protein concentration and stable performance across the tested environments. G6 and G8 exhibited specific adaptation and may therefore provide useful material for breeding programmes targeting environmental conditions similar to E1 and E3. Although the selected half-sib families originated from a Greek landrace, the broader importance of the results lies in showing that productive and comparatively stable breeding material can be obtained from a heterogeneous, locally adapted rye population. A similar approach could be applied to rye landraces maintained in other Mediterranean, mountainous, semi-arid and low-input production regions. However, the present evaluation was limited to three environments that differed simultaneously in growing season, location, field productivity level, and in the case of E3, in climate and elevation (Table 2); year, location and productivity effects are therefore confounded within each environment. As a result, the genotype x environment interaction reported here reflects the joint effect of these factors rather than independently resolved components. Wider multi-year testing, together with molecular characterization and the evaluation of additional quality and stress-adaptation traits, will be necessary before the most promising material can be considered for cultivar development. Overall, the findings support the value of rye landraces not only as genetic resources for conservation, but also as active sources of breeding material for variable and resource-limited production environments.

5. Conclusions

The traditional rye population ‘Vevi’ retained sufficient phenotypic variation to allow effective within-population selection, resulting in elite germplasm with improved agronomic performance. The clear response to selection, together with the superior performance of several selected half-sib families over both the original population and the commercial cultivar, confirms the breeding value of this locally adapted germplasm under Mediterranean conditions. These findings indicate that rye landraces remain an actionable genetic resource for cultivar development.
Grain yield was influenced primarily by environmental conditions, while the significant genotype × environment interaction underlined the need to evaluate breeding material across contrasting environments before selection decisions are made. Among the evaluated families, G9 and G11 consistently combined high productivity with stable performance across environments, whereas G6 and G8 showed specific adaptation, offering additional opportunities for targeted cultivar development.
The close agreement among AMMI, GGE biplot and the complementary stability statistics increased confidence in half-sib families ranking and supports the combined use of these approaches for reliable evaluation of rye germplasm under the conditions evaluated here. Overall, the results show that the traditional rye population ‘Vevi’ remains a valuable source of genetic variation and that selection within locally adapted populations can contribute directly to the development of productive and stable rye cultivars. Beyond the results obtained here, the research framework used in the present study offers a transferable approach for evaluating under-characterized local rye germplasm, reinforcing its potential for breeding ideotypes tailored to specific target environments.

Author Contributions

Conceptualization, I.S., E.N., I.M. and F.P.; methodology, I.S., E.N., I.M. and F.P.; software, E.N. and I.M.; validation, I.S., E.N., I.M., E.N.D. and F.P.; formal analysis, I.S., E.N., I.M., E.N.D. and F.P.; investigation I.S., E.N., I.M. and F.P.; resources, E.N., I.M., and F.P.; data curation, I.S., E.N., I.M. and E.N.D.; writing—original draft preparation, I.S., E.N., I.M., E.N.D. and F.P.; writing—review and editing, I.S., E.N., I.M., E.N.D. and F.P.; visualization, I.S., E.N., I.M., E.N.D. and F.P.; supervision, I.S., E.N., I.M. and F.P.; project administration, E.N., I.M., E.N.D. and F.P.; funding acquisition, I.S., E.N., I.M., E.N.D. and F.P. All authors have read and agreed to the published version of the manuscript.

Funding

This research received no external funding.

Data Availability Statement

The original contributions presented in this study are included in the article. Further inquiries can be directed to the corresponding author.

Conflicts of Interest

The authors declare no conflicts of interest.

Abbreviations

The following abbreviations are used in this manuscript:
GGEGenotype plus Genotype-by-Environment interaction
AMMIAdditive Main Effects and Multiplicative Interaction
H2Broad-sense heritability
GHGgreenhouse gas emissions
ANOVAanalysis of variance
PCAprincipal component analysis
IPCAsinteraction principal component axes
a.s.lAbove soil level
HYHigh yielding
LYLow yielding
CRring performance coefficient
RCBRandomized Complete Block design
NIRnear-infrared spectroscopy
Wi2Wricke’s ecovalence
σ2iShukla’s stability variance
S2diDeviation from regression
CViCoefficient of variance
CVcoefficient of variation
EVenvironmental variance
KRKang’s rank-sum
θ(i)GE variance component
ASViAMMI’s stability value
PiGenotype superiority
SY, t ha−1grain yield
SPC %seed protein content
MPH, cmplant height in March
FPH, cmfinal plant height
DEEMdays to ear emergence
DASdays after sowing
MASmarker-assisted selection

References

  1. Wrigley, C.; Bushuk, W. Chapter 7—Rye: Grain-Quality Characteristics and Management of Quality Requirements. In Cereal Grains;Woodhead Publishing Series in Food Science, Technology and Nutrition, 2nd ed.; Wrigley, C., Batey, I., Miskelly, D., Eds.; Woodhead Publishing: Sawston, UK, 2017; pp. 153–178. [Google Scholar]
  2. FAOSTAT. Available online: https://www.fao.org/faostat/en/#data/QCL (accessed on 7 July 2026).
  3. Schlegel, R.H.J. Rye: Genetics, Breeding, and Cultivation; CRC Press: Boca Raton, FL, USA, 2013. [Google Scholar]
  4. Miedaner, T.; Laidig, F. Hybrid Breeding in Rye (Secale cereale L.). In Advances in Plant Breeding Strategies: Cereals; Al-Khayri, J.M., Jain, S.M., Johnson, D.V., Eds.; Springer International Publishing: Cham, Switzerland, 2019; Volume 5, pp. 343–372. [Google Scholar]
  5. Korzun, V.; Malyshev, S.; Voylokov, A.V.; Börner, A. A Genetic Map of Rye (Secale cereale L.) Combining RFLP, Isozyme, Protein, Microsatellite and Gene Loci. Theor. Appl. Genet. 2001, 102, 709–717. [Google Scholar] [CrossRef] [Scilit]
  6. Yeo, I.-Y.; Lee, S.; Sadeghi, A.M.; Beeson, P.C.; Hively, W.D.; McCarty, G.W.; Lang, M.W. Assessing Winter Cover Crop Nutrient Uptake Efficiency Using a Water Quality Simulation Model. Hydrol. Earth Syst. Sci. 2014, 18, 5239–5253. [Google Scholar] [CrossRef] [Scilit]
  7. Riedesel, L.; Laidig, F.; Hadasch, S.; Rentel, D.; Hackauf, B.; Piepho, H.-P.; Feike, T. Breeding Progress Reduces Carbon Footprints of Wheat and Rye. J. Clean. Prod. 2022, 377, 134326. [Google Scholar] [CrossRef] [Scilit]
  8. Andersson, A.A.M.; Dimberg, L.; Åman, P.; Landberg, R. Recent Findings on Certain Bioactive Components in Whole Grain Wheat and Rye. J. Cereal Sci. 2014, 59, 294–311. [Google Scholar] [CrossRef] [Scilit]
  9. Koistinen, V.M.; Hanhineva, K. Mass Spectrometry-Based Analysis of Whole-Grain Phytochemicals. Crit. Rev. Food Sci. Nutr. 2017, 57, 1688–1709. [Google Scholar] [CrossRef] [Scilit]
  10. Jonsson, K.; Andersson, R.; Bach Knudsen, K.E.; Hallmans, G.; Hanhineva, K.; Katina, K.; Kolehmainen, M.; Kyrø, C.; Langton, M.; Nordlund, E.; et al. Rye and Health—Where Do We Stand and Where Do We Go? Trends Food Sci. Technol. 2018, 79, 78–87. [Google Scholar] [CrossRef] [Scilit]
  11. El-Mahis, A.; Baky, M.H.; Farag, M.A. How Does Rye Compare to Other Cereals? A Comprehensive Review of Its Potential Nutritional Value and Better Opportunities for Its Processing as a Food-Based Cereal. Food Rev. Int. 2023, 39, 4288–4311. [Google Scholar] [CrossRef] [Scilit]
  12. Melonek, J.; Korzun, V.; Hackauf, B. Genomics of Self-Incompatibility and Male-Fertility Restoration in Rye. In The Rye Genome; Rabanus-Wallace, M.T., Stein, N., Eds.; Springer International Publishing: Cham, Switzerland, 2021; pp. 181–212. [Google Scholar]
  13. Villa, T.C.C.; Maxted, N.; Scholten, M.; Ford-Lloyd, B. Defining and Identifying Crop Landraces. Plant Genet. Resour. 2005, 3, 373–384. [Google Scholar] [CrossRef] [Scilit]
  14. Laidig, F.; Piepho, H.-P.; Rentel, D.; Drobek, T.; Meyer, U.; Huesken, A. Breeding Progress, Variation, and Correlation of Grain and Quality Traits in Winter Rye Hybrid and Population Varieties and National on-Farm Progress in Germany over 26 Years. Theor. Appl. Genet. 2017, 130, 981–998. [Google Scholar] [CrossRef] [Scilit]
  15. Hansen, H.B.; Møller, B.; Andersen, S.B.; Jørgensen, J.R.; Hansen, Å. Grain Characteristics, Chemical Composition, and Functional Properties of Rye (Secale cereale L.) As Influenced by Genotype and Harvest Year. J. Agric. Food Chem. 2004, 52, 2282–2291. [Google Scholar] [CrossRef] [Scilit]
  16. Ghafoor, A.Z.; Wijata, M.; Rozbicki, J.; Krysztofik, R.; Banaszak, K.; Karim, H.; Derejko, A.; Studnicki, M. Influence of Crop Management on Stability Rye Yield and Some Grain Quality Traits. Agron. J. 2024, 116, 2263–2274. [Google Scholar] [CrossRef] [Scilit]
  17. Hlaváčová, M.; Klem, K.; Pytela, J.; Urban, O.; Pernicová, N.; Balek, J.; Semerádová, D.; Fischer, M.; Rötter, R.P.; Appiah, M.; et al. Traditional Rye Varieties Exhibit Drought Tolerance Traits but Maintain Lower Yields than Modern Varieties under Drought Stress. Sci. Rep. 2026, 16, 20650. [Google Scholar] [CrossRef] [Scilit]
  18. Başaran, U.; Gülümser, E.; Kardeş, Y.M.; Doğrusöz, M.Ç.; Mut, H. Grain yield and nutritional quality of different rye genotypes. Turk. J. Field Crop. 2022, 27, 200–207. [Google Scholar] [CrossRef] [Scilit]
  19. Sardella, C.; Capo, L.; Adamo, M.; Donna, M.; Ravetto Enri, S.; Vanara, F.; Lonati, M.; Mucciarelli, M.; Blandino, M. The Cultivation of Rye in Marginal Alpine Environments: A Comparison of the Agronomic, Technological, Health and Sanitary Traits of Local Landraces and Commercial Cultivars. Front. Plant Sci. 2023, 14, 1130543. [Google Scholar] [CrossRef] [Scilit]
  20. Calvi, A.; Preiti, G.; Poiana, M.; Marconi, O.; Gastl, M.; Zarnkow, M. Multi-Response Optimization of the Malting Process of an Italian Landrace of Rye (Secale cereale L.) Using Response Surface Methodology and Desirability Function Coupled with Genetic Algorithm. Foods 2022, 11, 3561. [Google Scholar] [CrossRef] [Scilit]
  21. Landi, N.; Ragucci, S.; Campanile, M.G.; Hussain, H.Z.F.; Papa, S.; Di Maro, A. Nutritional Values and Biochemical Traits of Rye (Secale cereale L.) Seeds, a Landrace from Matese Mountains (Southern Italy). Foods 2025, 14, 1120. [Google Scholar] [CrossRef] [Scilit]
  22. Serenius, M.; Huusela-Veistola, E.; Avikainen, H.; Pahkala, K.; Laine, A. Effects of Sowing Time on Pink Snow Mould, Leaf Rust and Winter Damage in Winter Rye Varieties in Finland. Available online: https://orgprints.org/id/eprint/16824/ (accessed on 7 July 2026).
  23. Driscoll, A.W.; Leuthold, S.J.; Choi, E.; Clark, S.M.; Cleveland, D.M.; Dixon, M.; Hsieh, M.; Sitterson, J.; Mueller, N.D. Divergent Impacts of Crop Diversity on Caloric and Economic Yield Stability. Environ. Res. Lett. 2022, 17, 124015. [Google Scholar] [CrossRef] [Scilit]
  24. Ghafoor, A.Z.; Karim, H.; Studnicki, M.; Raza, A.; Javed, H.H.; Asghar, M.A. Climate Change and Rye (Secale cereale L.) Production: Challenges, Opportunities and Adaptations. J. Agron. Crop Sci. 2024, 210, e12725. [Google Scholar] [CrossRef] [Scilit]
  25. Haffke, S.; Wilde, P.; Schmiedchen, B.; Hackauf, B.; Roux, S.; Gottwald, M.; Miedaner, T. Toward a Selection of Broadly Adapted Germplasm for Yield Stability of Hybrid Rye under Normal and Managed Drought Stress Conditions. Crop Sci. 2015, 55, 1026–1034. [Google Scholar] [CrossRef] [Scilit]
  26. Stępniewska, S.; Cacak-Pietrzak, G.; Fraś, A.; Jończyk, K.; Studnicki, M.; Wiśniewska, M.; Gzowska, M.; Salamon, A. Effect of Genotype and Environment on Yield and Technological and Nutrition Traits on Winter Rye Grain from Organic Production. Agriculture 2024, 14, 2249. [Google Scholar] [CrossRef] [Scilit]
  27. Falconer, D.S. The Problem of Environment and Selection. Am. Nat. 1952, 86, 293–298. [Google Scholar] [CrossRef] [Scilit]
  28. Ceccarelli, S.; Nachit, M.M.; Ferrara, G.O.; Mekni, M.S.; Tahir, M.; Van Leur, J.; Srivastava, J.P. Chapter 8. Breeding Strategies for Improving Cereal Yield and Stability under Drought. In Drought Tolerance in Winter Cereals; John Wiley & Sons, Inc.: New York, NY, USA, 1987. [Google Scholar]
  29. Ceccarelli, S. Wide Adaptation: How Wide? Euphytica 1989, 40, 197–205. [Google Scholar] [CrossRef] [Scilit]
  30. Miedaner, T.; Hübner, M.; Korzun, V.; Schmiedchen, B.; Bauer, E.; Haseneyer, G.; Wilde, P.; Reif, J.C. Genetic Architecture of Complex Agronomic Traits Examined in Two Testcross Populations of Rye (Secale cereale L.). BMC Genom. 2012, 13, 706. [Google Scholar] [CrossRef] [Scilit]
  31. Ponomareva, M.; Ponomarev, S.; Mannapova, G.; Ilalova, L.; Sayfutdinova, D. Ecological Variability of Winter Rye Yield in the Middle Volga Region. E3S Web Conf. 2024, 480, 03027. [Google Scholar] [CrossRef] [Scilit]
  32. Goncharenko, A.A.; Makarov, A.V.; Ermakov, S.A.; Semenova, T.V.; Tochilin, V.N.; Tsygankova, N.V.; Skatova, S.E.; Krakhmaleva, O.A. Ecological Stability of Short Stemmed Winter Rye Varieties. Russ. Agric. Sci. 2019, 45, 315–322. [Google Scholar] [CrossRef] [Scilit]
  33. Yan, W. Singular-Value Partitioning in Biplot Analysis of Multienvironment Trial Data. Agron. J. 2002, 94, 990–996. [Google Scholar] [CrossRef] [Scilit]
  34. Gauch, H.G. Model Selection and Validation for Yield Trials with Interaction. Biometrics 1988, 44, 705–715. [Google Scholar] [CrossRef] [Scilit]
  35. Yan, W.; Kang, M.S.; Ma, B.; Woods, S.; Cornelius, P.L. GGE Biplot vs. AMMI Analysis of Genotype-by-Environment Data. Crop Sci. 2007, 47, 643–653. [Google Scholar] [CrossRef] [Scilit]
  36. Yan, W. GGEbiplot—A Windows Application for Graphical Analysis of Multienvironment Trial Data and Other Types of Two-Way Data. Agron. J. 2001, 93, 1111–1118. [Google Scholar] [CrossRef] [Scilit]
  37. Popoola, B.O.; Ongom, P.O.; Mohammed, S.B.; Togola, A.; Ishaya, D.J.; Bala, G.; Fatokun, C.; Boukar, O. Assessing the Impact of Genotype-by-Environment Interactions on Agronomic Traits in Elite Cowpea Lines across Agro-Ecologies in Nigeria. Agronomy 2024, 14, 263. [Google Scholar] [CrossRef] [Scilit]
  38. Tatarowska, B.E.; Plich, J.; Milczarek, D.; Boguszewska-Mańkowska, D.; Zarzyńska, K. Genotype by Environment Interaction (GEI) Effect for Potato Tuber Yield and Their Quality Traits in Organic Multi-Environment Domains in Poland. Agriculture 2024, 14, 1591. [Google Scholar] [CrossRef] [Scilit]
  39. Ma, C.; Liu, C.; Ye, Z. Influence of Genotype × Environment Interaction on Yield Stability of Maize Hybrids with AMMI Model and GGE Biplot. Agronomy 2024, 14, 1000. [Google Scholar] [CrossRef] [Scilit]
  40. Olguín, P.; Contreras, S.; Rojas, C.; Fuentes, F. Genotype-by-Environment Interaction Stability Analysis of New Quinoa (Chenopodium quinoa Willd.) Varieties in the Mediterranean Zone of Chile. Plants 2025, 14, 3007. [Google Scholar] [CrossRef] [Scilit]
  41. Gayosso Barragán, O.; Acosta Gallegos, J.A.; Alcalá Rico, J.S.G.J.; Jiménez Hernández, Y.; Chávez Aguilar, G.; Chávez Díaz, I.F.; Aranda Lara, U. Genotype × Environment Interaction and Yield Stability of “Pinto” Bean (Phaseolus vulgaris L.) Lines in a Semi-Arid Region of Mexico. Agriculture 2025, 15, 2150. [Google Scholar] [CrossRef] [Scilit]
  42. Mitchell, J.W.; Baker, R.J.; Knott, D.R. Evaluation of Honeycomb Selection for Single Plant Yield in Durum Wheat. Crop Sci. 1982, 22, 840–843. [Google Scholar] [CrossRef] [Scilit]
  43. Stratilakis, S.N.; Goulas, C.K. Yield Performance at Three Nitrogen Rates of a Set of Honeycomb vs Traditional Pedigree Selected Bread Wheat Varieties. Eur. J. Agron. 2003, 19, 65–76. [Google Scholar] [CrossRef] [Scilit]
  44. Koutsika-Sotiriou, M.; Mylonas, I.G.; Ninou, E.; Traka-Mavrona, E. The Cultivation Revival of a Landrace: Pedigree and Analytical Breeding. Euphytica 2010, 176, 15–24. [Google Scholar] [CrossRef] [Scilit]
  45. Vlachostergios, D.N.; Tzantarmas, C.; Kargiotidou, A.; Ninou, E.; Pankou, C.; Gaintatzi, C.; Mylonas, I.; Papadopoulos, I.; Foti, C.; Chatzivassiliou, E.K.; et al. Single-Plant Selection within Lentil Landraces at Ultra-Low Density: A Short-Time Tool to Breed High Yielding and Stable Varieties across Divergent Environments. Euphytica 2018, 214, 58. [Google Scholar] [CrossRef] [Scilit]
  46. Tsivelika, N.; Sarrou, E.; Gusheva, K.; Pankou, C.; Koutsos, T.; Chatzopoulou, P.; Mavromatis, A. Phenotypic Variation of Wild Chamomile (Matricaria chamomilla L.) Populations and Their Evaluation for Medicinally Important Essential Oil. Biochem. Syst. Ecol. 2018, 80, 21–28. [Google Scholar] [CrossRef] [Scilit]
  47. Demertzi, E.N.; Karapetsi, L.; Pankou, C.I.; Vasileiou, N.; Georgiadou, E.; Kargiotidou, A.; Maliogka, V.I.; Vlachostergios, D.; Madesis, P.; Mavromatis, A.G. Integrating Prognostic Breeding Approach Through Phenotypic and Marker-Assisted Selection for Yield and BCMV Resistance in Common Bean Greek Landraces. Plants 2026, 15, 963. [Google Scholar] [CrossRef] [Scilit]
  48. Kyriakou, D.T.; Fasoulas, A.C. Effects of Competition and Selection Pressure on Yield Response in Winter Rye (Secale cereale L.). Euphytica 1985, 34, 883–895. [Google Scholar] [CrossRef] [Scilit]
  49. Xynias, I.N.; Roupakias, D.G. Effectiveness of Honeycomb Selection in Successive Generations in Rye (Secale cereale L.). Vortraege Pflanzenzuechtung 1996, 35, 82–83. [Google Scholar]
  50. Fasoula, V.A.; Tokatlidis, I.S. Development of Crop Cultivars by Honeycomb Breeding. Agron. Sustain. Dev. 2012, 32, 161–180. [Google Scholar] [CrossRef] [Scilit]
  51. Fasoula, D.A.; Fasoula, V.A. Competitive Ability and Plant Breeding. In Plant Breeding Reviews; John Wiley & Sons, Inc.: Hoboken, NJ, USA, 1997; Volume 14, pp. 89–138. [Google Scholar]
  52. Tokatlidis, I.S.; Tsialtas, J.T.; Xynias, I.N.; Tamoutsidis, E.; Irakli, M. Variation within a Bread Wheat Cultivar for Grain Yield, Protein Content, Carbon Isotope Discrimination and Ash Content. Field Crops Res. 2004, 86, 33–42. [Google Scholar] [CrossRef] [Scilit]
  53. Kotzamanidis, S.T.; Lithourgidis, A.S.; Mavromatis, A.G.; Chasioti, D.I.; Roupakias, D.G. Prediction Criteria of Promising F3 Populations in Durum Wheat: A Comparative Study. Field Crops Res. 2008, 107, 257–264. [Google Scholar] [CrossRef] [Scilit]
  54. Ninou, E.; Mylonas, I.; Karagianni, I.; Michailidou, S.; Tsivelikas, A.; Sistanis, I.; Avdikos, I.; Korpetis, E.; Papathanasiou, F. Utilization of Intra-Cultivar Variation for Grain Yield and Protein Content within Durum Wheat Cultivars. Agriculture 2022, 12, 661. [Google Scholar] [CrossRef] [Scilit]
  55. Sistanis, I.; Ninou, E.; Deligiannidou, E.; Tsivelika, N.; Papathanasiou, F. Genetic Diversity of Greek Rye (Secale cereale L.) Germplasm Revealed by ISSR, SCoT and Exon-Based Molecular Markers. Agriculture 2026, 16, 333. [Google Scholar] [CrossRef] [Scilit]
  56. Peel, M.C.; Finlayson, B.L.; McMahon, T.A. Updated World Map of the Köppen-Geiger Climate Classification. Hydrol. Earth Syst. Sci. 2007, 11, 1633–1644. [Google Scholar] [CrossRef] [Scilit]
  57. Rubel, F.; Kottek, M. Observed and Projected Climate Shifts 1901-2100 Depicted by World Maps of the Köppen-Geiger Climate Classification. Meteorol. Z. 2010, 19, 135–141. [Google Scholar] [CrossRef] [Scilit]
  58. Fasoulas, A.C.; Fasoula, V.A. Honeycomb Selection Designs. In Plant Breeding Reviews; John Wiley & Sons, Inc.: New York, NY, USA, 1995; Volume 13, pp. 87–139. [Google Scholar]
  59. Font, R.; del Río-Celestino, M.; de Haro-Bailón, A. The Use of Near-Infrared Spectroscopy (NIRS) in the Study of Seed Quality Components in Plant Breeding Programs. Ind. Crops Prod. 2006, 24, 307–313. [Google Scholar] [CrossRef] [Scilit]
  60. Magwaza, L.S.; Messo Naidoo, S.I.; Laurie, S.M.; Laing, M.D.; Shimelis, H. Development of NIRS Models for Rapid Quantification of Protein Content in Sweetpotato [Ipomoea batatas (L.) LAM.]. LWT Food Sci. Technol. 2016, 72, 63–70. [Google Scholar] [CrossRef] [Scilit]
  61. Kozak, M.; Piepho, H.-P. What’s Normal Anyway? Residual Plots Are More Telling than Significance Tests When Checking ANOVA Assumptions. J. Agron. Crop Sci. 2018, 204, 86–98. [Google Scholar] [CrossRef] [Scilit]
  62. Ward, R.W. Principles of Plant Breeding, 2nd Edition. Crop Sci. 2000, 40, 562–563. [Google Scholar] [CrossRef] [Scilit]
  63. Payne, R.W. GenStat. WIREs Comput. Stat. 2009, 1, 255–258. [Google Scholar] [CrossRef] [Scilit]
  64. Korpetis, E.; Ninou, E.; Mylonas, I.; Katsantonis, D.; Tsivelika, N.; Xynias, I.N.; Polidoros, A.N.; Roupakias, D.; Mavromatis, A.G. GGE Biplot Analysis for the Assessment and Selection of Bread Wheat Genotypes Under Organic and Low-Input Stress Environments. Agriculture 2026, 16, 146. [Google Scholar] [CrossRef] [Scilit]
  65. Baker, R.J. Tests for Crossover Genotype-Environmental Interactions. Can. J. Plant Sci. 1988, 68, 405–410. [Google Scholar] [CrossRef] [Scilit]
  66. Ninou, E.; Tsivelika, N.; Sistanis, I.; Katsenios, N.; Korpetis, E.; Vazaneli, E.; Papathanasiou, F.; Didos, S.; Argiriou, A.; Mylonas, I. Assessment of Durum Wheat Cultivars’ Adaptability to Mediterranean Environments Using G × E Interaction Analysis. Agronomy 2024, 14, 102. [Google Scholar] [CrossRef] [Scilit]
  67. Wricke, G. Evaluation Method for Recording Ecological Differences in Field Trials. Z. Pflanzenzücht. 1962, 47, 92–96. [Google Scholar]
  68. Shukla, G.K. Some Statistical Aspects of Partitioning Genotype-Environmental Components of Variability. Heredity 1972, 29, 237–245. [Google Scholar] [CrossRef] [Scilit]
  69. Eberhart, S.A.; Russell, W.A. Stability Parameters for Comparing Varieties. Crop Sci. 1966, 6, 36–40. [Google Scholar] [CrossRef] [Scilit]
  70. Francis, T.R.; Kannenberg, L.W. Yield Stability Studies in Short-Season Maize. i. a Descriptive Method for Grouping Genotypes. Can. J. Plant Sci. 1978, 58, 1029–1034. [Google Scholar] [CrossRef] [Scilit]
  71. Kang, M.S. A Rank-Sum Method for Selecting High-Yielding, Stable Corn Genotypes. Cereal Res. Commun. 1988, 16, 113–115. [Google Scholar]
  72. Purchase, J.L.; Hatting, H.; van Deventer, C.S. Genotype × Environment Interaction of Winter Wheat (Triticum aestivum L.) in South Africa: II. Stability Analysis of Yield Performance. S. Afr. J. Plant Soil 2000, 17, 101–107. [Google Scholar] [CrossRef] [Scilit]
  73. Lin, C.S.; Binns, M.R. A Method of Analyzing Cultivar x Location x Year Experiments: A New Stability Parameter. Theor. Appl. Genet. 1988, 76, 425–430. [Google Scholar] [CrossRef] [Scilit]
  74. Huehn, M. Nonparametric Measures of Phenotypic Stability. Part 1: Theory. Euphytica 1990, 47, 189–194. [Google Scholar] [CrossRef] [Scilit]
  75. Nassar, R.; Hühn, M. Studies on Estimation of Phenotypic Stability: Tests of Significance for Nonparametric Measures of Phenotypic Stability. Biometrics 1987, 43, 45–53. [Google Scholar] [CrossRef] [Scilit]
  76. Melios, S.; Ninou, E.; Irakli, M.; Tsivelika, N.; Sistanis, I.; Papathanasiou, F.; Didos, S.; Zinoviadou, K.; Karantonis, H.C.; Argiriou, A.; et al. Effect of Genotype, Environment, and Their Interaction on the Antioxidant Properties of Durum Wheat: Impact of Nitrogen Fertilization and Sowing Time. Agriculture 2024, 14, 328. [Google Scholar] [CrossRef] [Scilit]
  77. Thennarasu, K. On Certain Non-Parametric Procedures for Studying Genotype-Environment Interactions and Yield Stability. Ph.D. Thesis, Division of Agricultural Statistics, Indian Agricultural Research Institute, New Delhi, India, 1995. [Google Scholar]
  78. Ninou, E.G.; Mylonas, I.G.; Tsivelikas, A.; Ralli, P.; Dordas, C.; Tokatlidis, I.S. Wheat Landraces Are Better Qualified as Potential Gene Pools at Ultraspaced Rather than Densely Grown Conditions. Sci. World J. 2014, 2014, 957472. [Google Scholar] [CrossRef] [Scilit]
  79. Salgotra, R.K.; Chauhan, B.S. Genetic Diversity, Conservation, and Utilization of Plant Genetic Resources. Genes 2023, 14, 174. [Google Scholar] [CrossRef] [Scilit]
  80. Bernardo, R. Outliers and Their Distribution in Breeding Populations. Crop Sci. 2022, 62, 1107–1114. [Google Scholar] [CrossRef] [Scilit]
  81. Ceccarelli, S. Efficiency of Plant Breeding. Crop Sci. 2015, 55, 87–97. [Google Scholar] [CrossRef] [Scilit]
  82. Deleu, L.J.; Lemmens, E.; Redant, L.; Delcour, J.A. The Major Constituents of Rye (Secale cereale L.) Flour and Their Role in the Production of Rye Bread, a Food Product to Which a Multitude of Health Aspects Are Ascribed. Cereal Chem. 2020, 97, 739–754. [Google Scholar] [CrossRef] [Scilit]
  83. Schittenhelm, S.; Kraft, M.; Wittich, K.-P. Performance of Winter Cereals Grown on Field-Stored Soil Moisture Only. Eur. J. Agron. 2014, 52, 247–258. [Google Scholar] [CrossRef] [Scilit]
  84. Siekmann, D.; Jansen, G.; Zaar, A.; Kilian, A.; Fromme, F.J.; Hackauf, B. A Genome-Wide Association Study Pinpoints Quantitative Trait Genes for Plant Height, Heading Date, Grain Quality, and Yield in Rye (Secale cereale L.). Front. Plant Sci. 2021, 12, 718081. [Google Scholar] [CrossRef] [Scilit]
  85. Sabaghnia, N.; Janmohammdi, M. Genetic Diversity in Rye (Secale cereale L.) Landraces Based on Agro-Morphological Traits under the Semi-Arid Conditions of Iran. Genet. Resour. Crop Evol. 2025, 72, 5127–5138. [Google Scholar] [CrossRef] [Scilit]
  86. Brzozowski, L.J.; Phillips, T.D.; Van Sanford, D.A. Diversity of Cereal Rye (Secale Cereale) Germplasm in the Southeast United States. Plant Genome 2025, 18, e70008. [Google Scholar] [CrossRef] [Scilit]
  87. Kabak, D.; Akçura, M. Bingöl İlinden Toplanan Yerel Çavdarlarda Tane Verimi ve Bazı Özellikler Arasındaki İlişkilerin Biplot Analizi İle İncelenmesi. Turk. J. Agric. Nat. Sci. 2017, 4, 227–235. [Google Scholar]
  88. Peratoner, G.; Seling, S.; Klotz, C.; Florian, C.; Figl, U.; Schmitt, A.O. Variation of Agronomic and Qualitative Traits and Local Adaptation of Mountain Landraces of Winter Rye (Secale cereale L.) from Val Venosta/Vinschgau (South Tyrol). Genet. Resour. Crop Evol. 2016, 63, 261–273. [Google Scholar] [CrossRef] [Scilit]
  89. Kučerová, J. Effects of Location and Year on Technological Quality and Pentosan Content in Rye. Czech J. Food Sci. 2009, 27, 418–424. [Google Scholar] [CrossRef] [Scilit]
  90. Brzozowski, L.J.; Szuleta, E.; Phillips, T.D.; Van Sanford, D.A.; Clark, A.J. Breeding Cereal Rye (Secale Cereale) for Quality Traits. Crop Sci. 2023, 63, 1964–1987. [Google Scholar] [CrossRef] [Scilit]
  91. Bertholdsson, N.-O. Use of Multivariate Statistics to Separate Allelopathic and Competitive Factors Influencing Weed Suppression Ability in Winter Wheat. Weed Res. 2011, 51, 273–283. [Google Scholar] [CrossRef] [Scilit]
  92. Shavrukov, Y.; Kurishbayev, A.; Jatayev, S.; Shvidchenko, V.; Zotova, L.; Koekemoer, F.; de Groot, S.; Soole, K.; Langridge, P. Early Flowering as a Drought Escape Mechanism in Plants: How Can It Aid Wheat Production? Front. Plant Sci. 2017, 8, 1950. [Google Scholar] [CrossRef] [Scilit]
  93. Dorrani-Nejad, M.; Kazemipour, A.; Maghsoudi-Moud, A.A.; Abdolshahi, R. Wheat Breeding for Early Heading: Does It Improve Grain Yield under Drought Stress and Well-Watered Conditions? Environ. Exp. Bot. 2022, 200, 104902. [Google Scholar] [CrossRef] [Scilit]
  94. Hilmarsson, H.S.; Rio, S.; Sánchez, J.I. y Genotype by Environment Interaction Analysis of Agronomic Spring Barley Traits in Iceland Using AMMI, Factorial Regression Model and Linear Mixed Model. Agronomy 2021, 11, 499. [Google Scholar] [CrossRef] [Scilit]
  95. Hakala, K.; Pahkala, K. Comparison of Central and Northern European Winter Rye Cultivars Grown at High Latitudes. J. Agric. Sci. 2003, 141, 169–178. [Google Scholar] [CrossRef] [Scilit]
  96. Bujak, H.; Lenartowicz, T.; Nowosad, K.; Skrzypek, A.; Przystalski, M. Breeding Progress of Winter Rye (Secale cereale) in Poland: Where Do We Stand? Plant Breed. 2026, 145, 656–670. [Google Scholar] [CrossRef] [Scilit]
  97. Ikanović, J.; Popović, D.; Popović, V.; Jaćimović, G.; Đurović, I.; Kolarić, L.; Ćosić, M.; Rakaščan, N. Analysis of Genotype-by-Year Interaction for Secale cereale L. Productive Traits and Circular Economy. Agric. For. 2022, 68, 297–319. [Google Scholar] [CrossRef] [Scilit]
  98. Al-Sayaydeh, R.; Shtaya, M.J.; Qubbaj, T.; Al-Rifaee, M.K.; Alabdallah, M.A.; Migdadi, O.; Gammoh, I.A.; Al-Abdallat, A.M. Performance and Stability Analysis of Selected Durum Wheat Genotypes Differing in Their Kernel Characteristics. Plants 2023, 12, 2664. [Google Scholar] [CrossRef] [Scilit]
  99. Pour-Aboughadareh, A.; Barati, A.; Koohkan, S.A.; Jabari, M.; Marzoghian, A.; Gholipoor, A.; Shahbazi-Homonloo, K.; Zali, H.; Poodineh, O.; Kheirgo, M. Dissection of Genotype-by-Environment Interaction and Yield Stability Analysis in Barley Using AMMI Model and Stability Statistics. Bull. Natl. Res. Cent. 2022, 46, 19. [Google Scholar] [CrossRef] [Scilit]
  100. Pour-Aboughadareh, A.; Barati, A.; Gholipoor, A.; Zali, H.; Marzooghian, A.; Koohkan, S.A.; Shahbazi-Homonloo, K.; Houseinpour, A. Deciphering Genotype-by-Environment Interaction in Barley Genotypes Using Different Adaptability and Stability Methods. J. Crop Sci. Biotechnol. 2023, 26, 547–562. [Google Scholar] [CrossRef] [Scilit]
  101. Pour-Aboughadareh, A.; Koohkan, S.; Zali, H.; Marzooghian, A.; Gholipour, A.; Kheirgo, M.; Barati, A.; Bocianowski, J.; Askari-Kelestani, A. Identification of High-Yielding Genotypes of Barley in the Warm Regions of Iran. Plants 2023, 12, 3837. [Google Scholar] [CrossRef] [Scilit]
  102. Singh, C.; Gupta, A.; Gupta, V.; Kumar, P.; Sendhil, R.; Tyagi, B.S.; Singh, G.; Chatrath, R.; Singh, G.P. Genotype x Environment Interaction Analysis of Multi-Environment Wheat Trials in India Using AMMI and GGE Biplot Models. Crop Breed. Appl. Biotechnol. 2019, 19, 309–318. [Google Scholar] [CrossRef] [Scilit]
  103. Omrani, A.; Omrani, S.; Khodarahmi, M.; Shojaei, S.H.; Illés, Á.; Bojtor, C.; Mousavi, S.M.N.; Nagy, J. Evaluation of Grain Yield Stability in Some Selected Wheat Genotypes Using AMMI and GGE Biplot Methods. Agronomy 2022, 12, 1130. [Google Scholar] [CrossRef] [Scilit]
  104. Mullualem, D.; Tsega, A.; Mengie, T.; Fentie, D.; Kassa, Z.; Fassil, A.; Wondaferew, D.; Gelaw, T.A.; Astatkie, T. Genotype-by-Environment Interaction and Stability Analysis of Grain Yield of Bread Wheat (Triticum aestivum L.) Genotypes Using AMMI and GGE Biplot Analyses. Heliyon 2024, 10, e32918. [Google Scholar] [CrossRef] [Scilit]
  105. Rahmati, S.; Azizi-Nezhad, R.; Pour-Aboughadareh, A.; Etminan, A.; Shooshtari, L. Analysis of Genotype-by-Environment Interaction Effect in Barley Genotypes Using AMMI and GGE Biplot Methods. Heliyon 2024, 10, e38131. [Google Scholar] [CrossRef] [Scilit]
  106. Derbew, S.; Mekbib, F.; Lakew, B.; Bekele, A.; Bishaw, Z. AMMI and GGE Biplot Analysis for Barley Genotype Yield Performance and Stability under Multi Environment Condition in Southern Ethiopia. Agrosystems Geosci. Environ. 2024, 7, e20565. [Google Scholar] [CrossRef] [Scilit]
  107. Ndhlela, T.; Herselman, L.; Magorokosho, C.; Setimela, P.; Mutimaamba, C.; Labuschagne, M. Genotype × Environment Interaction of Maize Grain Yield Using AMMI Biplots. Crop Sci. 2014, 54, 1992–1999. [Google Scholar] [CrossRef] [Scilit]
  108. Bosi, S.; Negri, L.; Fakaros, A.; Oliveti, G.; Whittaker, A.; Dinelli, G. GGE Biplot Analysis to Explore the Adaption Potential of Italian Common Wheat Genotypes. Sustainability 2022, 14, 897. [Google Scholar] [CrossRef] [Scilit]
  109. Güngör, H.; Çakir, M.F.; Dumlupinar, Z. Evaluation of triticale: Genotype by environment interaction and gge biplot analysis. J. Anim. Plant Sci. 2022, 32, 1637–1647. [Google Scholar] [CrossRef] [Scilit]
  110. Kendal, E. Using Biplot Analysis Technique to Selection in Tritikale Breeding Studies. Yuz. Yıl Univ. J. Agric. Sci. 2022, 32, 186–198. [Google Scholar] [CrossRef] [Scilit]
  111. Stoyanov, H.P.; Atanasov, A.I.; Atanasov, A.Z. Risk-Oriented Evaluation of Yield Stability and Genotype × Year Interaction in Triticale Under Interannual Climatic Variability. Agronomy 2026, 16, 664. [Google Scholar] [CrossRef] [Scilit]
  112. Mohammadi, R.; Jafarzadeh, J.; Poursiahbidi, M.M.; Hatamzadeh, H.; Amri, A. Genotype-by-Environment Interaction and Stability Analysis for Grain Yield in Durum Wheat Using GGE Biplot and Genotypic and Environmental Covariates. Agric. Res. 2023, 12, 364–374. [Google Scholar] [CrossRef] [Scilit]
  113. Mohammadi, R.; Amri, A. Comparison of Parametric and Non-Parametric Methods for Selecting Stable and Adapted Durum Wheat Genotypes in Variable Environments. Euphytica 2008, 159, 419–432. [Google Scholar] [CrossRef] [Scilit]
  114. Vaezi, B.; Pour-Aboughadareh, A.; Mohammadi, R.; Mehraban, A.; Hossein-Pour, T.; Koohkan, E.; Ghasemi, S.; Moradkhani, H.; Siddique, K.H.M. Integrating Different Stability Models to Investigate Genotype × Environment Interactions and Identify Stable and High-Yielding Barley Genotypes. Euphytica 2019, 215, 63. [Google Scholar] [CrossRef] [Scilit]
  115. Smutná, P.; Mylonas, I.; Tokatlidis, I.S. The Use of Stability Statistics to Analyze Genotype × Environments Interaction in Rainfed Wheat Under Diverse Agroecosystems. Int. J. Plant Prod. 2021, 15, 261–271. [Google Scholar] [CrossRef] [Scilit]
Figure 1. Ombrothermal diagrams corresponding to: (A) Florina experimental site 2021–2022 (E1), (B) Florina experimental site 2022–2023 (E2) and (C) Thermi experimental site 2022–2023 (E3) (Sector of Meteorology and Climatology of the Department of Geology of AUTH).
Agronomy 16 02004 g001
Figure 2. Histograms of the individual plant values of the initial population under ultra-low plant density regarding (A) Yield (gr plant-1), (B) protein content (%) and (C) total height (cm).
Agronomy 16 02004 g002
Figure 3. AMMI biplot analysis of E and G groupings: (A) plot of genetic material IPCA1 scores versus means, (B) plot of genetic material and environment IPCA2 scores versus means. E = Environments, G = Genetic materials.
Agronomy 16 02004 g003
Figure 4. Genotype and genotype by environment (GGE) biplot for grain yield of the seventeen genetic materials evaluated in three environments. The “×” sign corresponds to genetic materials, while “+” sign corresponds to environments.
Agronomy 16 02004 g004
Table 1. Rye selected families installed in three environments to evaluate the performance of the selected genetic materials within the original rye population ‘Vevi’.
NoRye Half-Sib Families & ControlsYield 1Material
1G1HYSelection
2G2HY“
3G3HY“
4G4HY“
5G5HY“
6G6HY“
7G7HY“
8G8HY“
9G9HY“
10G10HY“
11G11HY“
12G12HY“
13G13LY“
14G14LY“
15G15LY“
16VEVICheckLocal population
17DUKATOCheckCommercial variety
1 HY: high yielding; LY: low yielding.
Table 2. Details of the three environments used to study the G × E interactions.
EnvironmentLocationClimate Type 1Above Sea LevelAverage Max TemperatureAverage Min TemperaturePrecipitationPlanting Date
E1Florina 21–22Cfa to Dfa702 m24.2 °C−5.4 °C562 mmEarly November
E2Florina 22–23Cfa to Dfa702 m25.3 °C−1.5 °C421 mmEarly November
E3Thermi 22–23BSk7 m20.3 °C11 °C394.4 mmEarly December
1 Köppen–Geiger climate type: Cfa to Dfa = humid subtropical climate bordering on a humid continental climate (Dfa), reflecting its inland position, elevation, and cold winters; BSk = cold semi-arid climate [56,57].
Table 3. Descriptive statistics of all the agronomic and quality traits studied in the traditional rye population during the first-year experimentation under NRO honeycomb design.
TraitnMaxMinRangeMeanstdevCV %
Yield (gr plant−1)1020101.80.09101.730.8615.1349.02
Seed Protein Content (%)102023.714.49.318.731.457.75
Final plant height (cm)1020158.040.0118.0106.9313.6912.81
plant height in March (cm)102023.04.019.010.992.9426.78
Days to ear emergence1020200.0179.021.0191.461.971.03
Table 4. Mean performance of selected high-yielding, low-yielding germplasm and base population for productivity, protein content and height at maturity.
A/AGrain Yield (gr Plant−1)CR (Yield) * MR = 126Protein Content %Total Height (cm)
1101.866.1918.2112
287.454.6316.7138
384.084.4419.2120
477.655.7617.3126
576.003.4518.2108
668.583.2519.9130
766.563.4119.2142
863.775.5217.1102
963.335.2316.6102
1062.573.1816.8140
1159.312.9618.7110
1253.442.2220.6118
HY Mean72.05 18.21120.67
Percentage increase over mean of base population %133.47%
A/AGrain Yield (gr)CR(Yield) MR = 126Protein Content %Total Height (cm)
139.590.1421.291.8
1411.110.1320.51124.5
1514.090.2217.02121.2
LY Mean11.60 19.58112.5
Total Mean30.86 18.73106.93
* CR(Yield) denotes the mean grain yield plant−1 corresponding to the moving ring (MR = 126) in which every selected single plant was located within the population.
Table 5. Over environment analysis of variance (ANOVA) for grain yield (SY, t ha−1), seed protein content (SPC %), plant height in March (MPH, cm), final plant height (FPH, cm) and days to ear emergence (DEEM, days after sowing, DAS) between the seventeen evaluated genetic materials of the RCB-17 design.
All Environments
SY (t ha−1)SPC (%)MPH (cm)FPH (cm)DEEM (DAS)
SourcedfSSMSSS %SSMSSS %SSMSSS %SSMSSS %SSMSSS %
Env/ent271.635.78 **49.20.40.120.324,343.112,171.6 ***86.947,973.123,986.6 ***6511,321.35660.6 ***96.8
Genotype1623.61.48 **16.264.34.02 ***41.61794.5112.2 ***6.411,686.9730.4 ***15.8249.715.6 ***2.1
G × E3216.60.52 **11.527.70.8717.9730.522.8 **2.64213.7131.75.781.82.6 ***0.7
Blocks611.41.91 *** 6.41.07 63.410.6 1300.3216.7 * 1.50.3 ns
Error9622.10.23 55.90.58 1095.511.4 8620.589.8 37.80.4
Total152145.3 154.7 28,026.9 73,794.5 11,692.1
H2 0.95 0.95 0.97 0.96 0.99
CV (%) 14.10 5.42 10.93 5.57 0.36
* p < 0.05, ** p < 0.01, *** p < 0.001.
Table 6. Effect of genetic material on yield (t ha−1), seed protein content (SPC %), plant height in March (MPH, cm), final plant height (FPH, cm) and days to ear emergence (DEEM, days after sowing, DAS) over the three different environments.
All Environments
Genetic
Material
SY (ton ha−1)Genetic
Material
SPC %Genetic
Material
MPH (cm)Genetic
Material
FPH (cm)Genetic
Material
DEEM (DAS)
64.24 a*1415.24 a934.44 a14178.41 a17176.44 a
113.89 ab1515.10 ab234.41 a12176.76 a11174.00 b
83.71 bc1314.77 abc633.69 ab2176.41 a15173.00 c
93.68 bc514.70 abcd1233.26 abc4174.39 a16173.00 c
123.63 bcd814.51 abcde1332.70 abcd7174.19 a3172.67 cd
23.61 bcd114.38 bcde1632.20 abcde5173.61 a5172.67 cd
73.61 bcd1214.23 cdef732.15 abcde9173.50 a4172.44 cd
103.55 bcd614.20 cdef1431.69 abcde13173.46 a10172.44 cd
33.46 bcde714.19 cdef531.27 abcde3172.72 a1172.44 cd
163.39 bcde1613.91 def431.23 abcde6172.35 a7172.33 cd
53.33 cdef313.86 ef331.09 abcde8171.56 ab13172.33 cd
43.21 cdefg413.83 ef1530.17 bcde16171.31 ab8172.00 de
133.11 defg913.54 f830.13 bcde1168.54 ab12171.67 ef
12.99 efg1113.54 f1129.80 cde10167.59 ab6171.67 ef
142.86 fg1013.51 f129.47 de11167.56 ab9171.33 f
152.80 g213.47 f1028.91 e15161.85 b14171.22 f
172.77 g1712.61 g1718.84 f17138.85 c2170.33 g
Total mean3.40 14.09 30.90 170.18 172.47
* Different letters in a column indicate significant differences between genetic materials over fields based on the Duncan test (p < 0.05).
Table 7. Pearson correlation coefficients and levels of significance between agronomic traits. Data were combined over genetic materials, environments, and replications.
TraitSYSPC %MPHFPH
SPC %−0.120 ns1
MPH0.651 **0.023 ns1
FPH0.033 ns0.117 ns−0.266 ns1
DEEM−0.703 **0.013 ns−0.158 ns−0.777 **
ns: non-significant (p > 0.05); ** significant at p < 0.01 level of probability, respectively.
Table 8. Half-sib families were categorized into the top 5 and bottom 5 groups based on both mean yield and stability measures of genotype superiority using the GGE biplot. The classification considered parametric measures [ASVi, Pi, σ2i, CVi, S2di, Wi2, KR and θ(i)] as well as non-parametric measures [S(1), S(2), S(3), S(6), NP(1), NP(2), NP(3), and NP(4)].
All FieldsYieldGGEASViPiσ2iCViS2diWi2KRθ(i)S(1)S(2)S(3)S(6)NP(1)NP(2)NP(3)NP(4)
Top 5G6 8*G11G9G6G9G16G14G9G9G9G14G14G11G11G9G11G9G11
G11 16G6G3 15G11G3G6G3G3G11G3G3G9G9G9G3G6G11G9
G8G9G11G8G11G7G9G11G3G11G9G11G3G3G11G3G3G3
G9 17G8G14 8G9G14G12G15G14G7G14G11G15G14G6G15G9G4G6
G12G12G15 8G7G15G3G16G15G8G15G15G3G6G7G4G8G7G7
Bottom 5G13 7G13G2 8G13G2G10G8G2G16G2G10G8G16G16G16G13G13G13
G1 17G14G17G1G17G13G2G17G15G17G16G16G2G15G17G1G1G15
G14G17G5 12G14G1G14G6G1G5G1G1G2G17G5G12G17G14G5
G15 9G15G1G15G5G15G17G5G1G5G2G1G5G1G1G15G15G17
G17 15G1G6G17G6G5G1G6G17G6G5G5G1G17G5G14G17G1
* Denotes the frequency of the genotype in the group with ≥7.
Table 9. Spearman’s rank correlation coefficients were computed between the statistics for mean yield, cultivar superiority on the GGE biplot, parametric measures [ASVi, Pi, σ2i, CVi, S2di, Wi2, KR and θ(i)], and non-parametric measures [S(1), S(2), S(3), S(6), NP(1), NP(2), NP(3), and NP(4)].
YieldGGEASViPiσ2iCViS2diWi2KRθ(i)S(1)S(2)S(3)S(6)NP(1)NP(2)NP(3)
GGE−0.966 **
ASVi0.0100.152
Pi−0.980 **0.975 **0.092
σ2i0.0200.1300.990 **0.082
CVi−0.490 *0.525 *0.0100.571 *−0.020
S2di0.0640.0960.917 **0.0340.887 **0.027
Wi20.0200.1300.990 **0.0821.000 **−0.0200.887 **
KR−0.763 **0.840 **0.553 *0.830 **0.562 *0.4000.4360.562 *
θ(i)−0.020−0.130−0.990 **−0.082−1.000 **0.020−0.887 **−1.000 **−0.562 *
S(1)0.0270.1410.761 **0.0850.759 **0.0860.708 **0.759 **0.408−0.759 **
S(2)0.0100.1470.779 **0.0910.784 **0.0120.708 **0.784 **0.425−0.784 **0.990 **
S(3)−0.3870.522 *0.762 **0.486 *0.755 **0.2280.708 **0.755 **0.731 **−0.755 **0.892 **0.897 **
S(6)−0.789 **0.868 **0.505 *0.865 **0.505 *0.483 *0.4090.505 *0.960 **−0.505 *0.505 *0.514 *0.811 **
NP(1)−0.1450.2540.835 **0.2330.851 **0.0140.698 **0.851 **0.542 *−0.851 **0.803 **0.833 **0.824 **0.579 *
NP(2)−0.922 **0.941 **0.1400.958 **0.1350.591 *0.0470.1350.819 **−0.1350.1090.0980.4800.850 **0.313
NP(3)−0.752 **0.804 **0.4140.825 **0.4140.537 *0.2940.4140.875 **−0.4140.2720.2830.603 *0.897 **0.493 *0.858 **
NP(4)−0.750 **0.851 **0.537 *0.826 **0.527 *0.492 *0.4780.527 *0.937 **−0.527 *0.570 *0.568 *0.846 **0.985 **0.584 *0.807 **0.845 **
* significant at p < 0.05; ** significant at p < 0.01 level of probability, respectively.
Disclaimer/Publisher’s Note: The statements, opinions and data contained in all publications are solely those of the individual author(s) and contributor(s) and not of MDPI and/or the editor(s). MDPI and/or the editor(s) disclaim responsibility for any injury to people or property resulting from any ideas, methods, instructions or products referred to in the content.