Article

Organic Substitution Thresholds for Sustainable Nutrient Management in Tibetan Alpine Agroecosystems: Trade-Offs Among Phenological Synchrony, Rhizosphere Stability, and Carbon Sequestration

1
Lhasa Alpine Ecosystem Research Station, Key Laboratory of Ecosystem Network Observation and Modeling, Institute of Geographic Sciences and Natural Resources Research, Chinese Academy of Sciences, Beijing 100101, China
2
University of Chinese Academy of Sciences, Beijing 100049, China
3
School of Civil and Environmental Engineering, Hunan University of Technology, Zhuzhou 412007, China
4
College of Tourism, Henan Normal University, Xinxiang 453007, China
5
Zhongba County People’s Government, Rikaze 858800, China
*
Author to whom correspondence should be addressed.
Agronomy 2026, 16(19), 1980; https://doi.org/10.3390/agronomy16191980
Submission received: 24 August 2026 / Revised: 18 September 2026 / Accepted: 1 October 2026 / Published: 7 October 2026
(This article belongs to the Section Agroecology Innovation: Achieving System Resilience)

Abstract

Alpine agroecosystems face fertilizer-induced nutrient imbalances, including early nitrogen accumulation and late-season nitrate residue. While organic substitution is promoted as a sustainable practice, different substitution ratios may generate contrasting responses among nutrient availability, rhizosphere function, and SOC temporal stability. We established a field experiment in Tibetan highland barley with five treatments at equivalent N, P, and K rates: 100% NPK, 75% NPK + 25% cattle manure (CM), 50% NPK + 50% CM, 25% NPK + 75% CM, and 100% CM, plus an unfertilized control. Soils were sampled from 0–10 cm bulk soil, 10–20 cm bulk soil, and rhizosphere soil (0–10 cm) at booting, filling, and maturity. Stoichiometric ratios in the 0–10 cm layer changed mainly at maturity, whereas responses in the 10–20 cm layer and rhizosphere were weaker, indicating stage- and compartment-dependent treatment responses. The treatments showed three response modes: mineral fertilizer-dominated nutrient pulses, manure-dominated late-season nitrate residue and surface SOC stability, and partial substitution patterns with comparatively balanced nutrient responses. No single substitution ratio optimized all measured indicators. We therefore propose these modes as a framework for organizing treatment-specific nutrient responses and as candidates for further multi-year and multi-site testing, rather than as ready-to-apply fertilization prescriptions.

1. Introduction

Alpine agroecosystems worldwide are increasingly vulnerable to environmental risks from intensive fertilization, including nutrient imbalances, soil degradation, and nitrate leaching [1,2]. The Qinghai-Xizang Plateau represents an ideal model system to investigate these challenges, as its high-altitude barley-based agriculture exemplifies the trade-offs between sustaining crop production and minimizing environmental externalities under climate-sensitive conditions [3,4]. Highland barley (Hordeum vulgare L.) is the staple crop sustaining local livelihoods and food security in this region [5,6]. However, these trade-offs are intensified by low temperature and a short growing season [7], which slow organic matter decomposition and constrain the window for crop nutrient uptake [8,9]. Agricultural production in this region has relied mainly on synthetic fertilizers, with insufficient organic manure input [10]. This fertilizer-focused nutrient management has escalated environmental risks, including early-season nitrogen surplus and late-season nitrate leaching potential, beyond the well-recognized risk of soil degradation [11,12].
Organic manure substitution is widely promoted as a sustainable practice to mitigate environmental risks associated with synthetic fertilizer use [10,13]. However, its effectiveness depends strongly on the substitution ratio applied, and the environmental consequences of different substitution ratios remain poorly quantified in cold, short-season agroecosystems. This uncertainty limits evidence-based nutrient management in alpine cropland. Three key uncertainties hinder evidence-based nutrient management decisions. First, the phenological synchrony between nutrient release and crop demand is uncertain: low-temperature conditions may delay organic manure mineralization, potentially creating temporal mismatches between soil N availability and crop phenological demand, both of which have direct environmental implications. Whether different substitution ratios can alleviate this temporal mismatch remains unclear. Second, spatial heterogeneity in fertilization responses is poorly understood: it is unknown whether nutrient dynamics differ systematically among soil layers and between rhizosphere and bulk soil, which limits the ability to predict where nutrient losses or immobilization are most likely to occur [14,15]. Third, a potential trade-off between rhizosphere nutrient enrichment and temporal stability has not been characterized. Specifically, it remains unclear whether fertilization-induced increases in rhizosphere nutrient availability are accompanied by a decline in supply stability across the growing season, and whether a specific substitution ratio can resolve this trade-off [16,17].
To address these uncertainties, we proposed three hypotheses. First, the phenological lag hypothesis: due to cold, short-season conditions [17,18], the stoichiometric response of alpine soil to organic fertilizer inputs is temporally filtered, requiring accumulation over the entire growing season rather than immediate response. Second, the spatial decoupling hypothesis: fertilization responses differ among soil layers and between rhizosphere and bulk soil, rather than being uniform. Third, the rhizosphere trade-off hypothesis: a trade-off exists between rhizosphere enrichment intensity and temporal stability, and a specific organic–inorganic ratio can resolve this trade-off through optimized rhizosphere carbon–nutrient coupling, thereby forming a “rhizosphere homeostasis island”.
To test these hypotheses, we conducted a field experiment in a representative highland barley agroecosystem on the Tibetan Plateau with five organic substitution ratios at equivalent N, P, and K rates: 100% NPK, 75% NPK + 25% cattle manure (CM), 50% NPK + 50% CM, 25% NPK + 75% CM, and 100% CM, plus a no-fertilizer control. Soils were sampled from 0–10 cm bulk, 10–20 cm bulk, and rhizosphere (0–10 cm) at booting, filling, and maturity. We quantified the contents of soil organic carbon, total nitrogen, total phosphorus, total potassium, available phosphorus, available potassium, ammonium nitrogen, and nitrate nitrogen, as well as soil pH. From these measurements, we derived stoichiometric ratios (C:N, C:P, C:K, N:P, N:K, P:K), rhizosphere effects, and a temporal stability index reflecting nutrient supply constancy across phenological stages. Our objectives were to evaluate treatment-specific responses of soil nutrient contents to organic substitution gradients, quantify the relationships among phenological nutrient patterns, rhizosphere stability, and SOC temporal stability, and develop a multi-mode interpretive framework for identifying candidate nutrient-management strategies under alpine field conditions.

2. Materials and Methods

2.1. Site Description

The field experiment was conducted in Linzhou County, Lhasa, Xizang (29°51′ N, 91°16′ E, altitude ~3760 m). The site has a plateau temperate semi-arid monsoon climate. Mean annual temperature is ~5.5 °C. Mean annual precipitation is ~440 mm, mainly from June to September. Annual evaporation is ~2200 mm. The frost-free period is 120–140 days. The initial soil properties of the 0–20 cm were: SOC 14.60 g kg−1, TN 1.68 g kg−1, TP 0.56 g kg−1, TK 32.50 g kg−1, AP 15.50 mg kg−1, AK 159.00 mg kg−1, NH4+-N 3.35 mg kg−1, NO3−-N 6.97 mg kg−1, and soil pH 6.85.

2.2. Experimental Design

The experiment used a single-factor completely randomized design. We established five fertilization treatments and one no-fertilizer control (CK). Each treatment had three replicates, giving 18 plots. Plots were separated by ridges. All treatments were designed with equivalent rates of N, P, and K. Total N application was 150 kg ha−1. Organic fertilizer was cattle manure (CM; N 1.9%, P 0.9%, K 1.4%, organic matter 20.3%). Synthetic fertilizers were urea (N 46%), superphosphate (P2O5 12%), and potassium chloride (K2O 60%). For each treatment, we subtracted the N, P, and K supplied by CM and supplemented with synthetic fertilizers to equalize total nutrient inputs. Total N was split-applied as base: tillering: booting = 60%: 24%: 16%. Organic manure, P, and K fertilizers were applied as base fertilizers. All topdressing was urea. The barley cultivar was Zangqing 3000. Sowing rate was 225 kg ha−1, with row spacing of 15 cm. The corresponding dry cattle manure application rates were 1.97, 3.95, 5.92, and 7.89 t ha−1 for the 75% NPK + 25% CM, 50% NPK + 50% CM, 25% NPK + 75% CM, and 100% CM treatments, respectively. Before sowing, basal fertilizers and cattle manure were evenly broadcast on the plot surface and incorporated into the 0–20 cm plough layer by rotary tillage to ensure uniform mixing within the cultivated layer. Barley was sown in early May 2024. Tillering and booting fertilizers were broadcast at the corresponding growth stages. All plots received uniform irrigation according to local agronomic practices, and weeds and pests were controlled manually to avoid confounding effects. Fertilizer application rates at each application event are provided in Table S1.

2.3. Soil Sampling and Processing

Soil samples were collected at the booting, filling, and maturity stages. In each plot, samples were collected in an S-shaped pattern from the 0–10 cm and 10–20 cm soil layers. For the 0–10 cm root-associated soil sample, barley plants with surrounding soil were carefully excavated from the 0–10 cm layer. Roots extending below 10 cm were removed at the 10 cm boundary, and only the root segments and attached soil within the 0–10 cm layer were retained. Loosely attached soil was gently shaken off, and the soil firmly attached to the retained roots within approximately 1–2 mm was collected using a soft brush. Samples from the same plot and soil layer were pooled into one composite sample. Gravel and visible plant residues were removed. Each soil sample was divided into two portions. One portion was immediately passed through a 2 mm sieve and stored at 4 °C for NH4+-N and NO3−-N determination, with extraction completed within 48 h. The other portion was air-dried to constant weight, passed through a 2 mm nylon sieve, and used for the analysis of SOC, TN, TP, TK, AP, AK, and pH. Air-dried samples were stored in sealed bags until analysis.

2.4. Analytical Methods

SOC was determined by the K2Cr2O7 oxidation method. TN was determined by the Kjeldahl method (H2SO4 digestion with catalyst, Kjeldahl distillation). TP was determined by H2SO4–HClO4 digestion followed by molybdenum blue colorimetry. TK was determined by NaOH fusion followed by flame photometry. NH4+-N was determined by indophenol blue colorimetry after KCl extraction. NO3−-N was determined by UV spectrophotometry after CaCl2 extraction (dual-wavelength correction). AP was determined by the Olsen method (0.5 mol L−1 NaHCO3 extraction, molybdenum blue colorimetry). AK was determined by NH4OAc extraction followed by flame photometry. Soil pH was measured with a pH meter at a soil:water ratio of 1:2.5.

2.5. Statistical Analysis

Stoichiometric ratios (C:N, C:P, C:K, N:P, N:K, and P:K) were calculated as mass ratios based on total nutrient contents. Rhizosphere effect (RE) was defined as the ratio of a given indicator in rhizosphere soil to that in the corresponding 0–10 cm bulk soil. RE > 1 indicated a positive rhizosphere effect (enrichment), RE < 1 indicated a negative rhizosphere effect (depletion), and RE = 1 indicated no rhizosphere effect. The temporal stability index (TSI) was defined as the reciprocal of the coefficient of variation for a given indicator across three growth stages in the same treatment and soil layer. Larger TSI values indicated lower seasonal fluctuation and higher temporal stability. This temporal stability metric captures within-season variation across phenological stages, reflecting the capacity of fertilization to sustain nutrient availability throughout the short growing season. Because TSI was calculated from only three growth stages, large values can be sensitive to very small CVs; therefore, TSI results were interpreted together with the underlying means and CVs. Duncan’s multiple comparison test and paired t-tests were used for descriptive within-stage comparisons. To address repeated measurements from the same plots, linear mixed-effects models were then fitted with treatment, growth stage, soil compartment, and their interactions as fixed effects, and plot identity as a random intercept. Estimated marginal means with 95% confidence intervals were used to summarize treatment effects when interactions were detected. p values were adjusted using the false discovery rate (FDR) method, model assumptions were checked using residual diagnostics, and log-transformed sensitivity analyses were conducted for positive continuous variables. Aggregated summary statistics, estimated marginal means, treatment contrasts, model diagnostics, and log-transformed sensitivity analysis results are provided in Supplementary Dataset S1. All analyses were performed in R 4.4.3.

3. Results

3.1. Stage-Dependent Fertilization Effects and Compartment-Specific Stoichiometric Responses

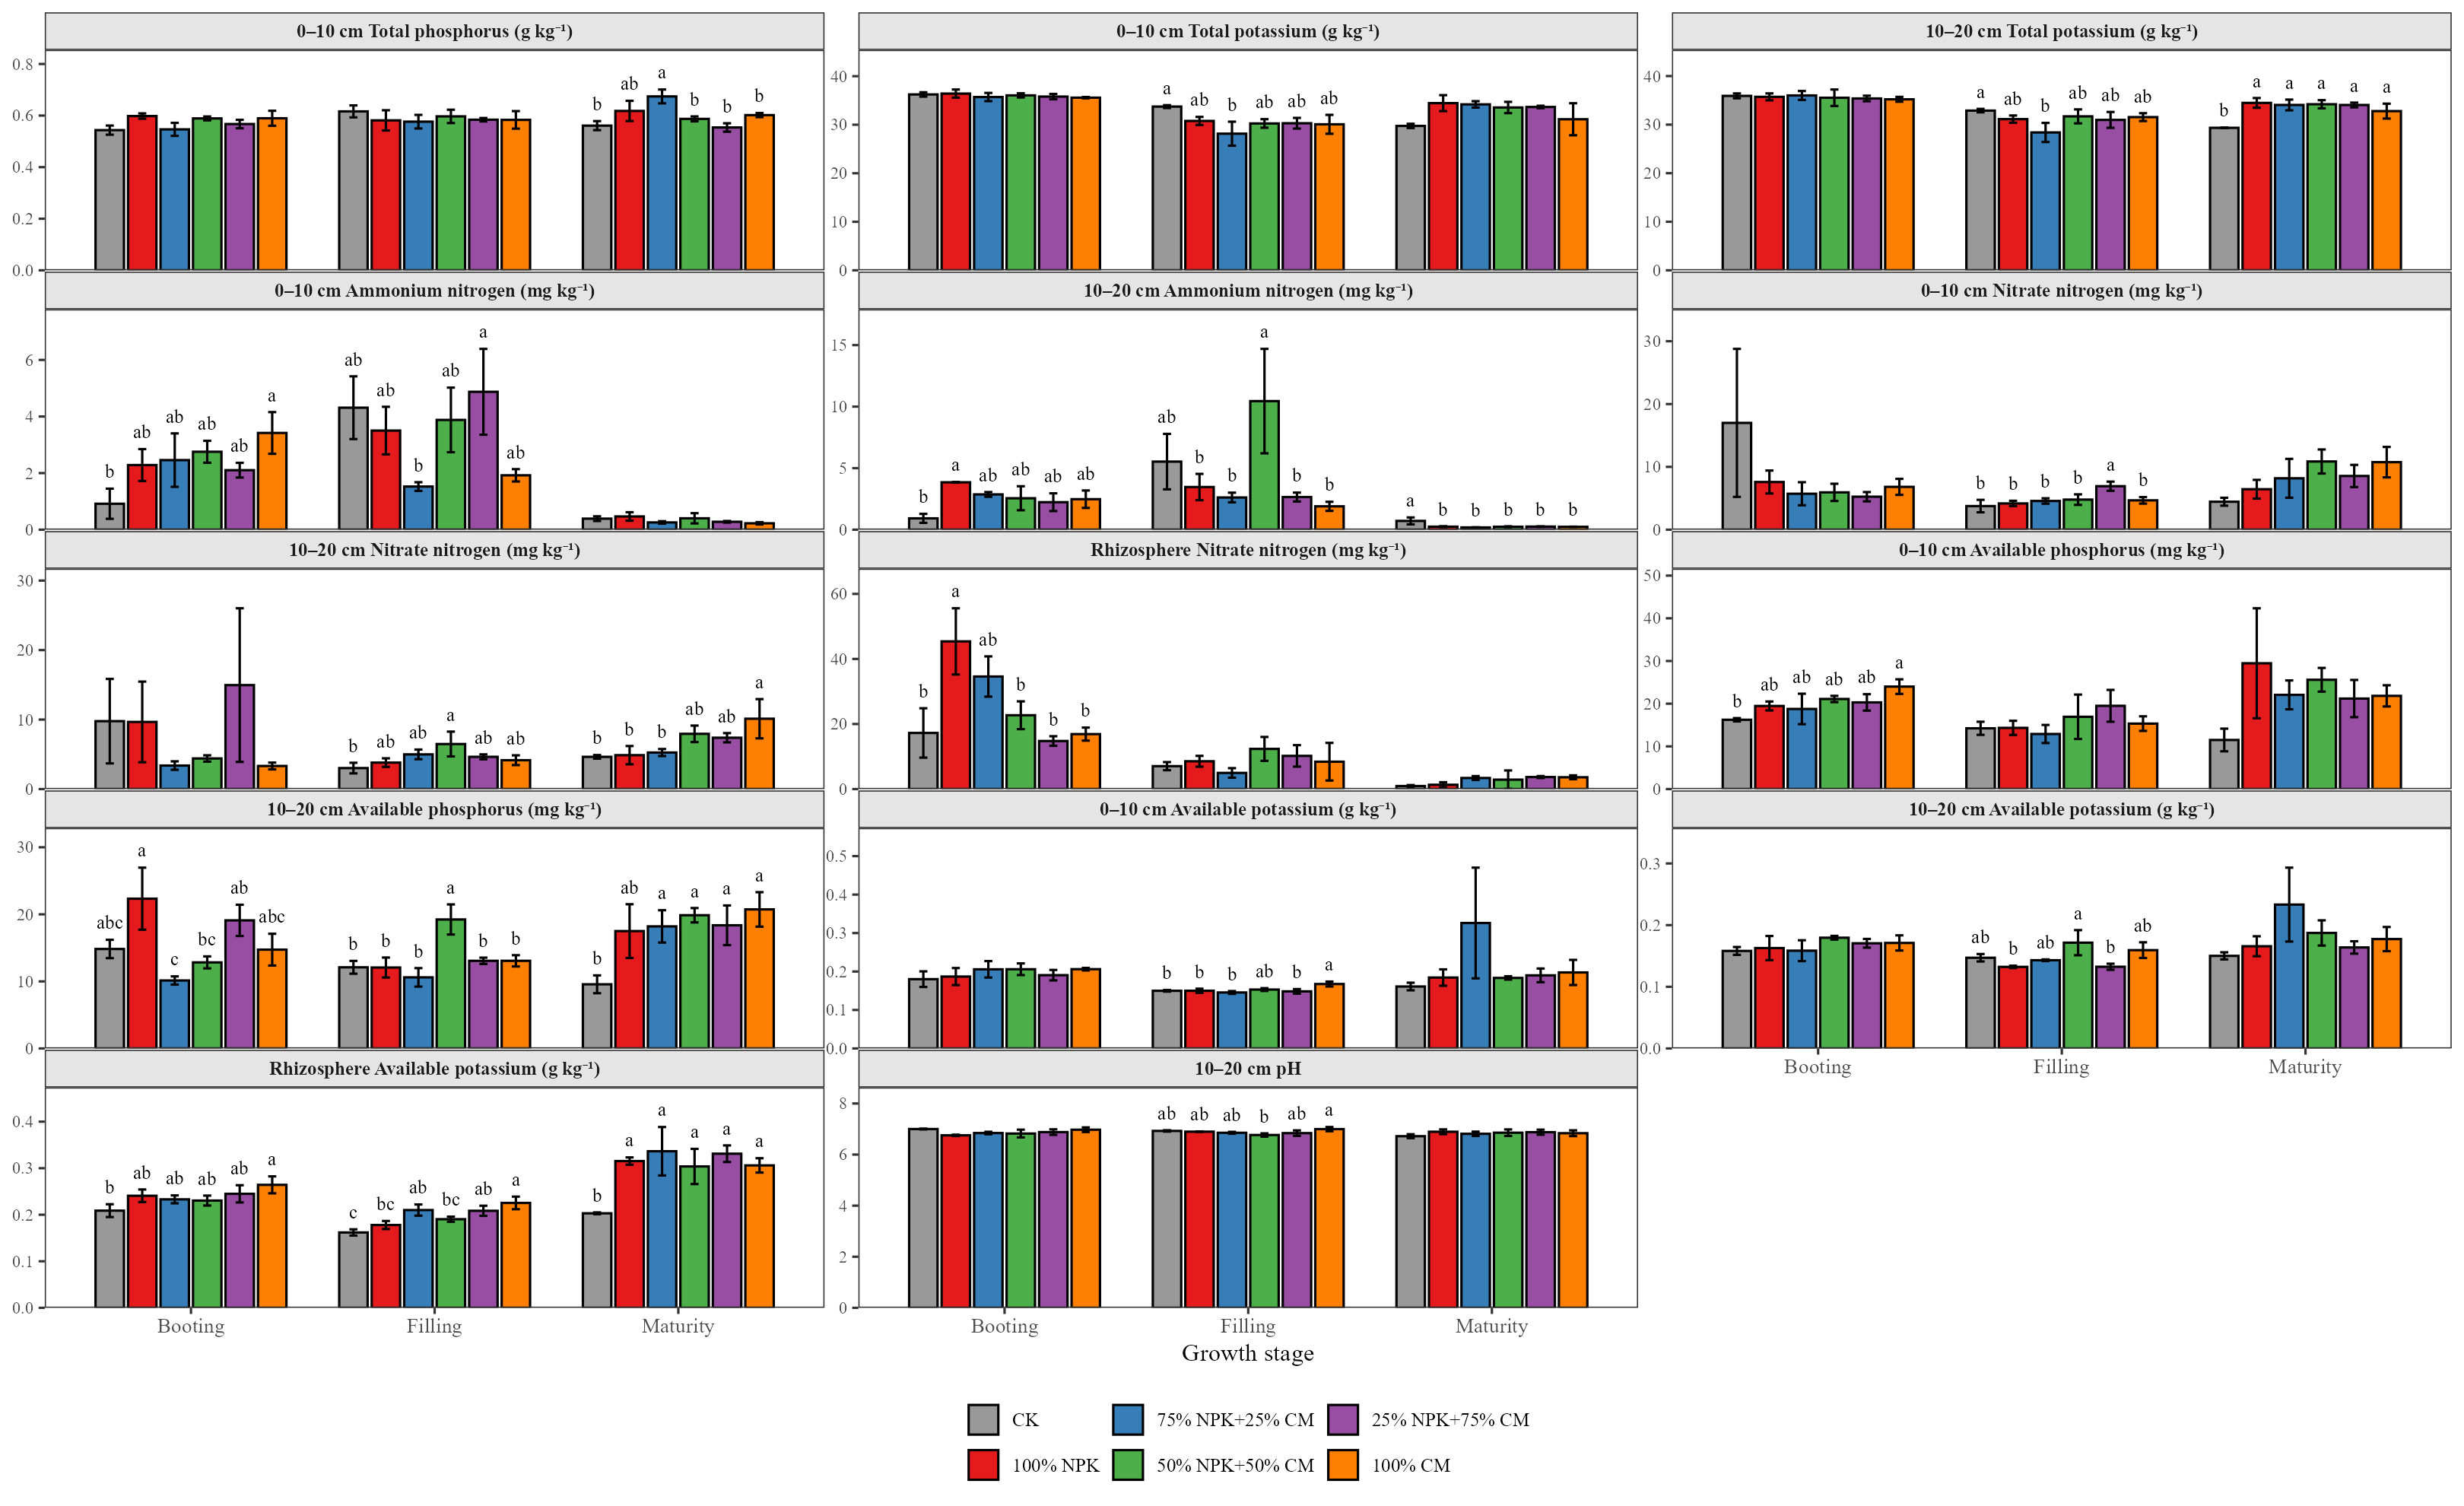
The mixed-effects models showed that fertilization responses were more consistently stage-dependent than compartment-dependent (Figures S2 and S3). After FDR correction, significant treatment × stage interactions were detected for several indicators, including C:N, NH4+-N, AK, NO3−-N, TK, C:P, pH, and C:K, indicating that treatment effects changed across growth stages. Consistently, C:N, C:P, and C:K ratios in the 0–10 cm layer showed stronger treatment differences at maturity than at earlier stages. At booting and filling, separate within-stage comparisons detected few treatment differences, whereas at maturity the stoichiometric patterns were restructured, with ratios decreasing by 23.58–38.87% relative to the control (Figure 1 and Figure S1). In contrast, treatment × compartment interactions were less consistent and were robust mainly for SOC, suggesting that compartment-dependent treatment effects were not a general pattern across all measured indicators. The 10–20 cm bulk soil and rhizosphere soil also showed weaker and less consistent treatment differentiation across growth stages (Figure 1 and Figure S1). Significant treatment × stage × compartment interactions were observed for NO3−-N, NH4+-N, C:P, and TP, indicating that selected indicators still showed compartment-specific temporal responses.

3.2. Phenological Differentiation of Nitrogen, Phosphorus, and Potassium Availability

Nitrogen availability varied with fertilization regime. At booting, high-synthetic-fertilizer treatments triggered mineral N pulses in the 10–20 cm layer. The 100% NPK treatment increased 10–20 cm NH4+-N by 318.17% relative to the control, and rhizosphere NO3−-N was higher than in the organic substitution treatments (Figure 1 and Figure S1). At maturity, 10–20 cm NH4+-N under 100% NPK decreased to approximately one-third of the control, and all fertilization treatments had lower NH4+-N than the control, with reductions of 64.77–74.32% (Figure 1 and Figure S1). At filling, the 50% NPK + 50% CM treatment showed the highest 10–20 cm NH4+-N and NO3−-N among all treatments (Figure 1 and Figure S1). At maturity, the 100% CM treatment showed marked NO3−-N accumulation in the 10–20 cm layer, 118.36% higher than the control and higher than both 100% NPK and 75% NPK + 25% CM (Figure 1 and Figure S1).
Phosphorus availability showed stage-specific responses to fertilization. At booting, the 100% NPK treatment had higher 10–20 cm AP than 75% NPK + 25% CM and 50% NPK + 50% CM (Figure 1 and Figure S1). At filling, the 50% NPK + 50% CM treatment had the highest 10–20 cm AP, 58.95% higher than the control (Figure 1 and Figure S1). At maturity, all organic-containing treatments had higher 10–20 cm AP than the control, with increases of 90.24–116.72% (Figure 1 and Figure S1). At maturity, the P:K ratio in the 10–20 cm layer was numerically lower than the control in all fertilization treatments, with larger decreases in synthetic-fertilizer-containing treatments (Figure 1 and Figure S1).
Potassium responses showed spatial layering and phenological progression. Rhizosphere AK increased with growth stage and was generally stronger under organic-containing treatments. At booting, 100% CM had rhizosphere AK 26.55% higher than the control. At filling, three organic-containing treatments showed rhizosphere AK increases of 28.76–39.20% relative to the control, whereas 50% NPK + 50% CM showed a smaller increase of 17.59% (Figure 1 and Figure S1). At maturity, all fertilization treatments had rhizosphere AK 49.55–65.65% higher than the control (Figure 1 and Figure S1). Potassium responses in the 10–20 cm bulk soil were less pronounced, with only minor fluctuations in a few treatments. At maturity, 10–20 cm TK was higher than the control in all fertilization treatments, with increases of 11.72–17.49% (Figure 1 and Figure S1).

3.3. Soil Layer and Rhizosphere Differentiation of Nutrient Temporal Stability

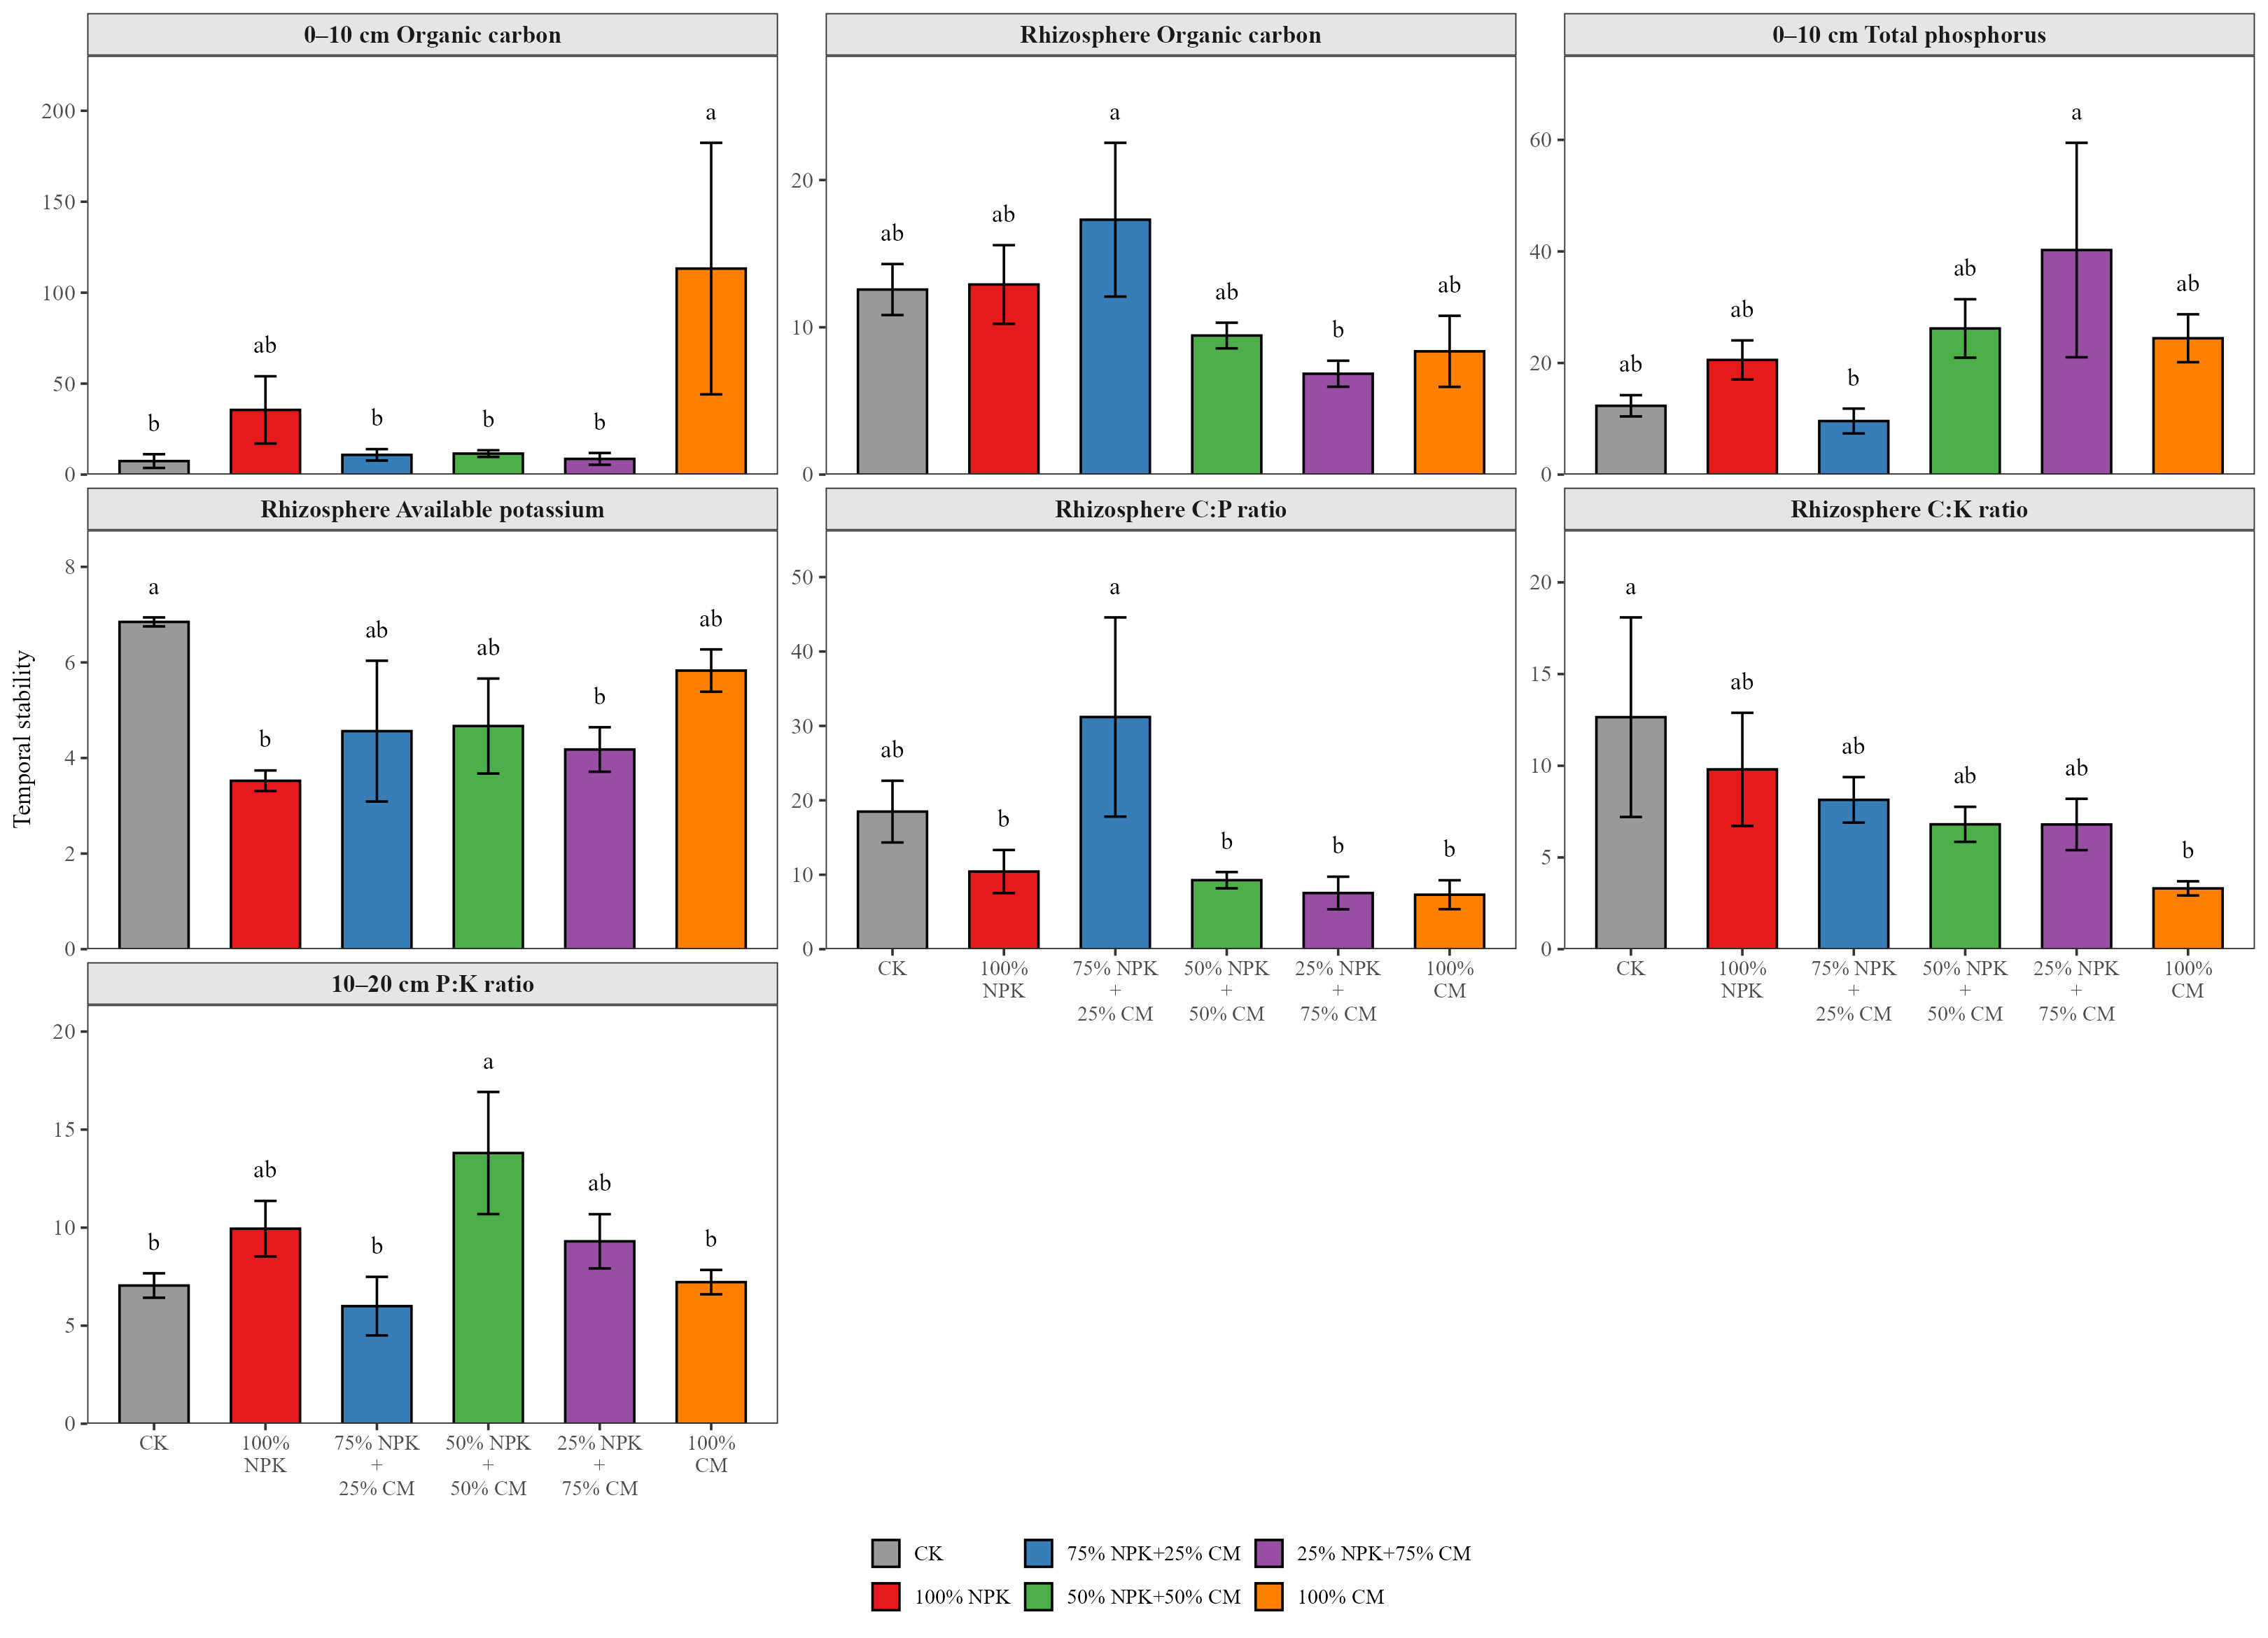
Temporal stability of soil nutrients showed soil layer differentiation and substitution-ratio-specific responses to fertilization, with distinct patterns across soil layers and microsites (Figure 2). In the 0–10 cm layer, SOC temporal stability showed its strongest response under 100% CM, more than 14 times higher than the control, whereas partial organic substitution treatments did not show a comparable increase. Mean SOC was similar between 100% CM and the control (14.36 vs. 14.82 g kg−1), whereas the mean CV decreased from 21.33% to 5.67%, indicating that the higher stability mainly reflected reduced seasonal fluctuation rather than higher SOC concentration. In contrast, the 10–20 cm P:K stability reached its highest value under 50% NPK + 50% CM, with a 95.84% increase relative to the control (Figure 2).
Rhizosphere nutrient stability showed specific responses to substitution ratios (Figure 2). The 75% NPK + 25% CM treatment increased rhizosphere C:P temporal stability by 199.08–326.31% relative to other treatments. The same treatment increased rhizosphere SOC temporal stability by 152.76% relative to 25% NPK + 75% CM. The 100% CM treatment decreased rhizosphere C:K temporal stability, while 100% NPK and 25% NPK + 75% CM decreased rhizosphere AK temporal stability relative to the control (Figure 2).

3.4. Directional Patterns of Rhizosphere Effects

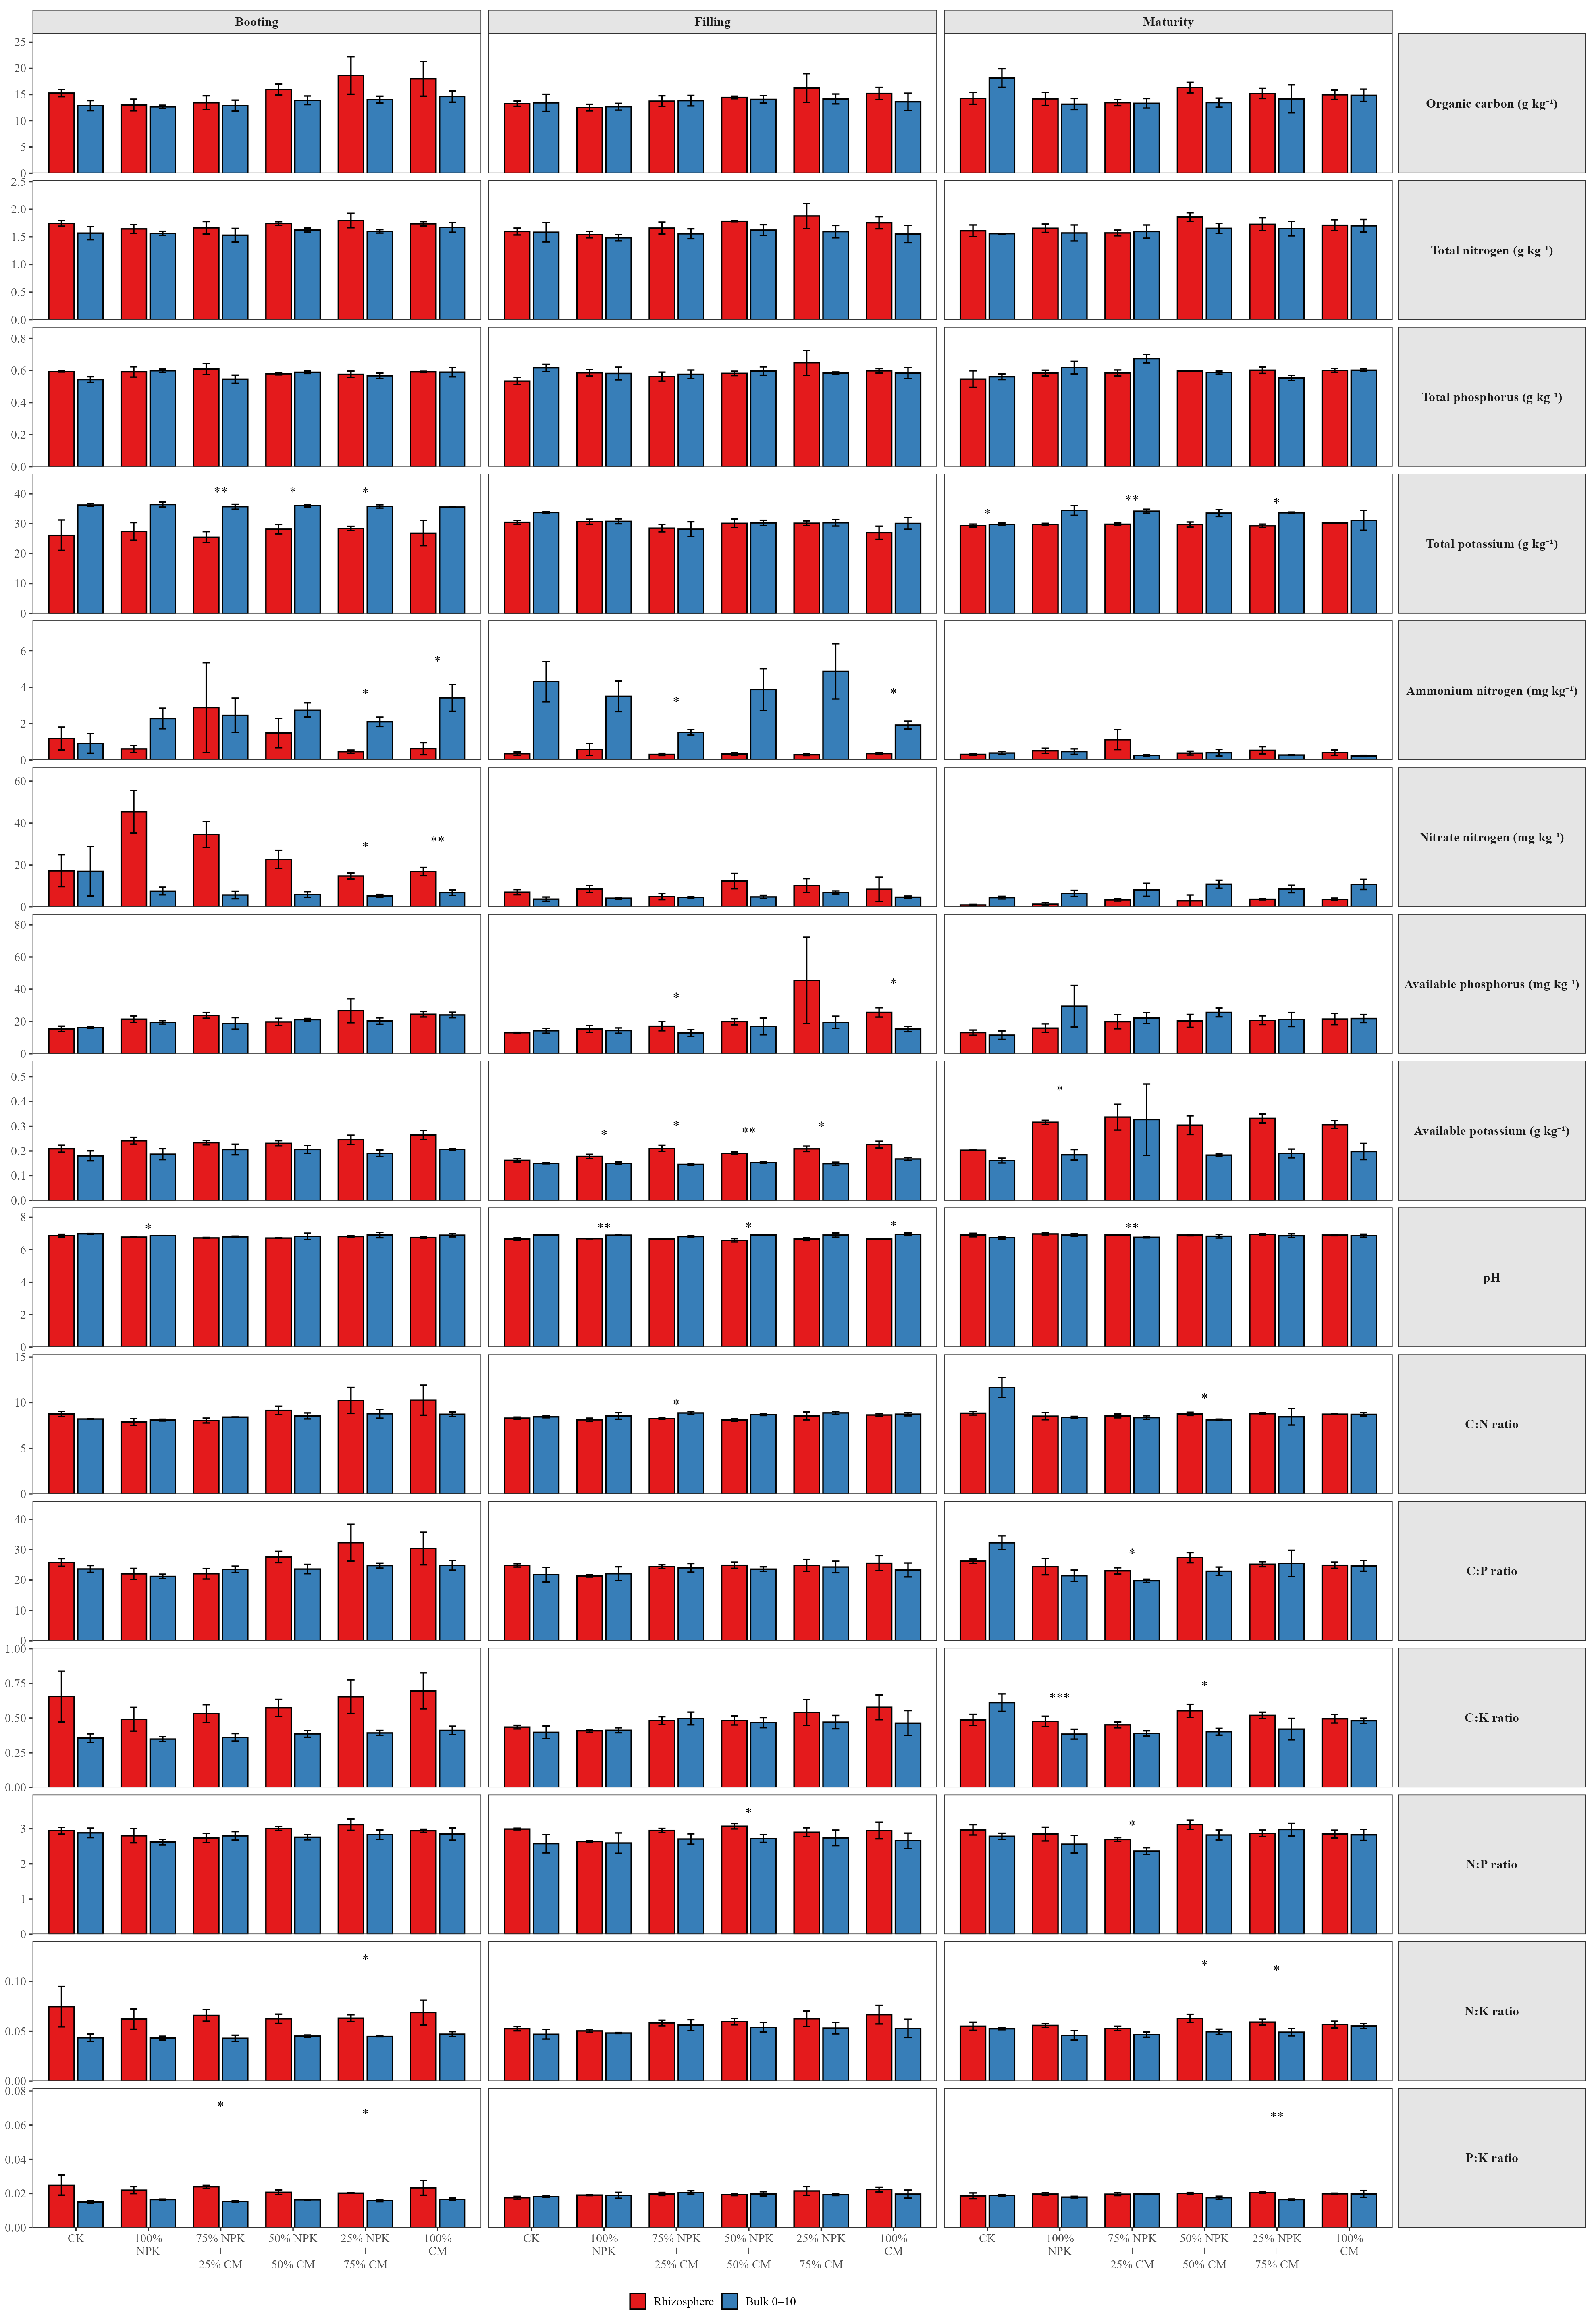
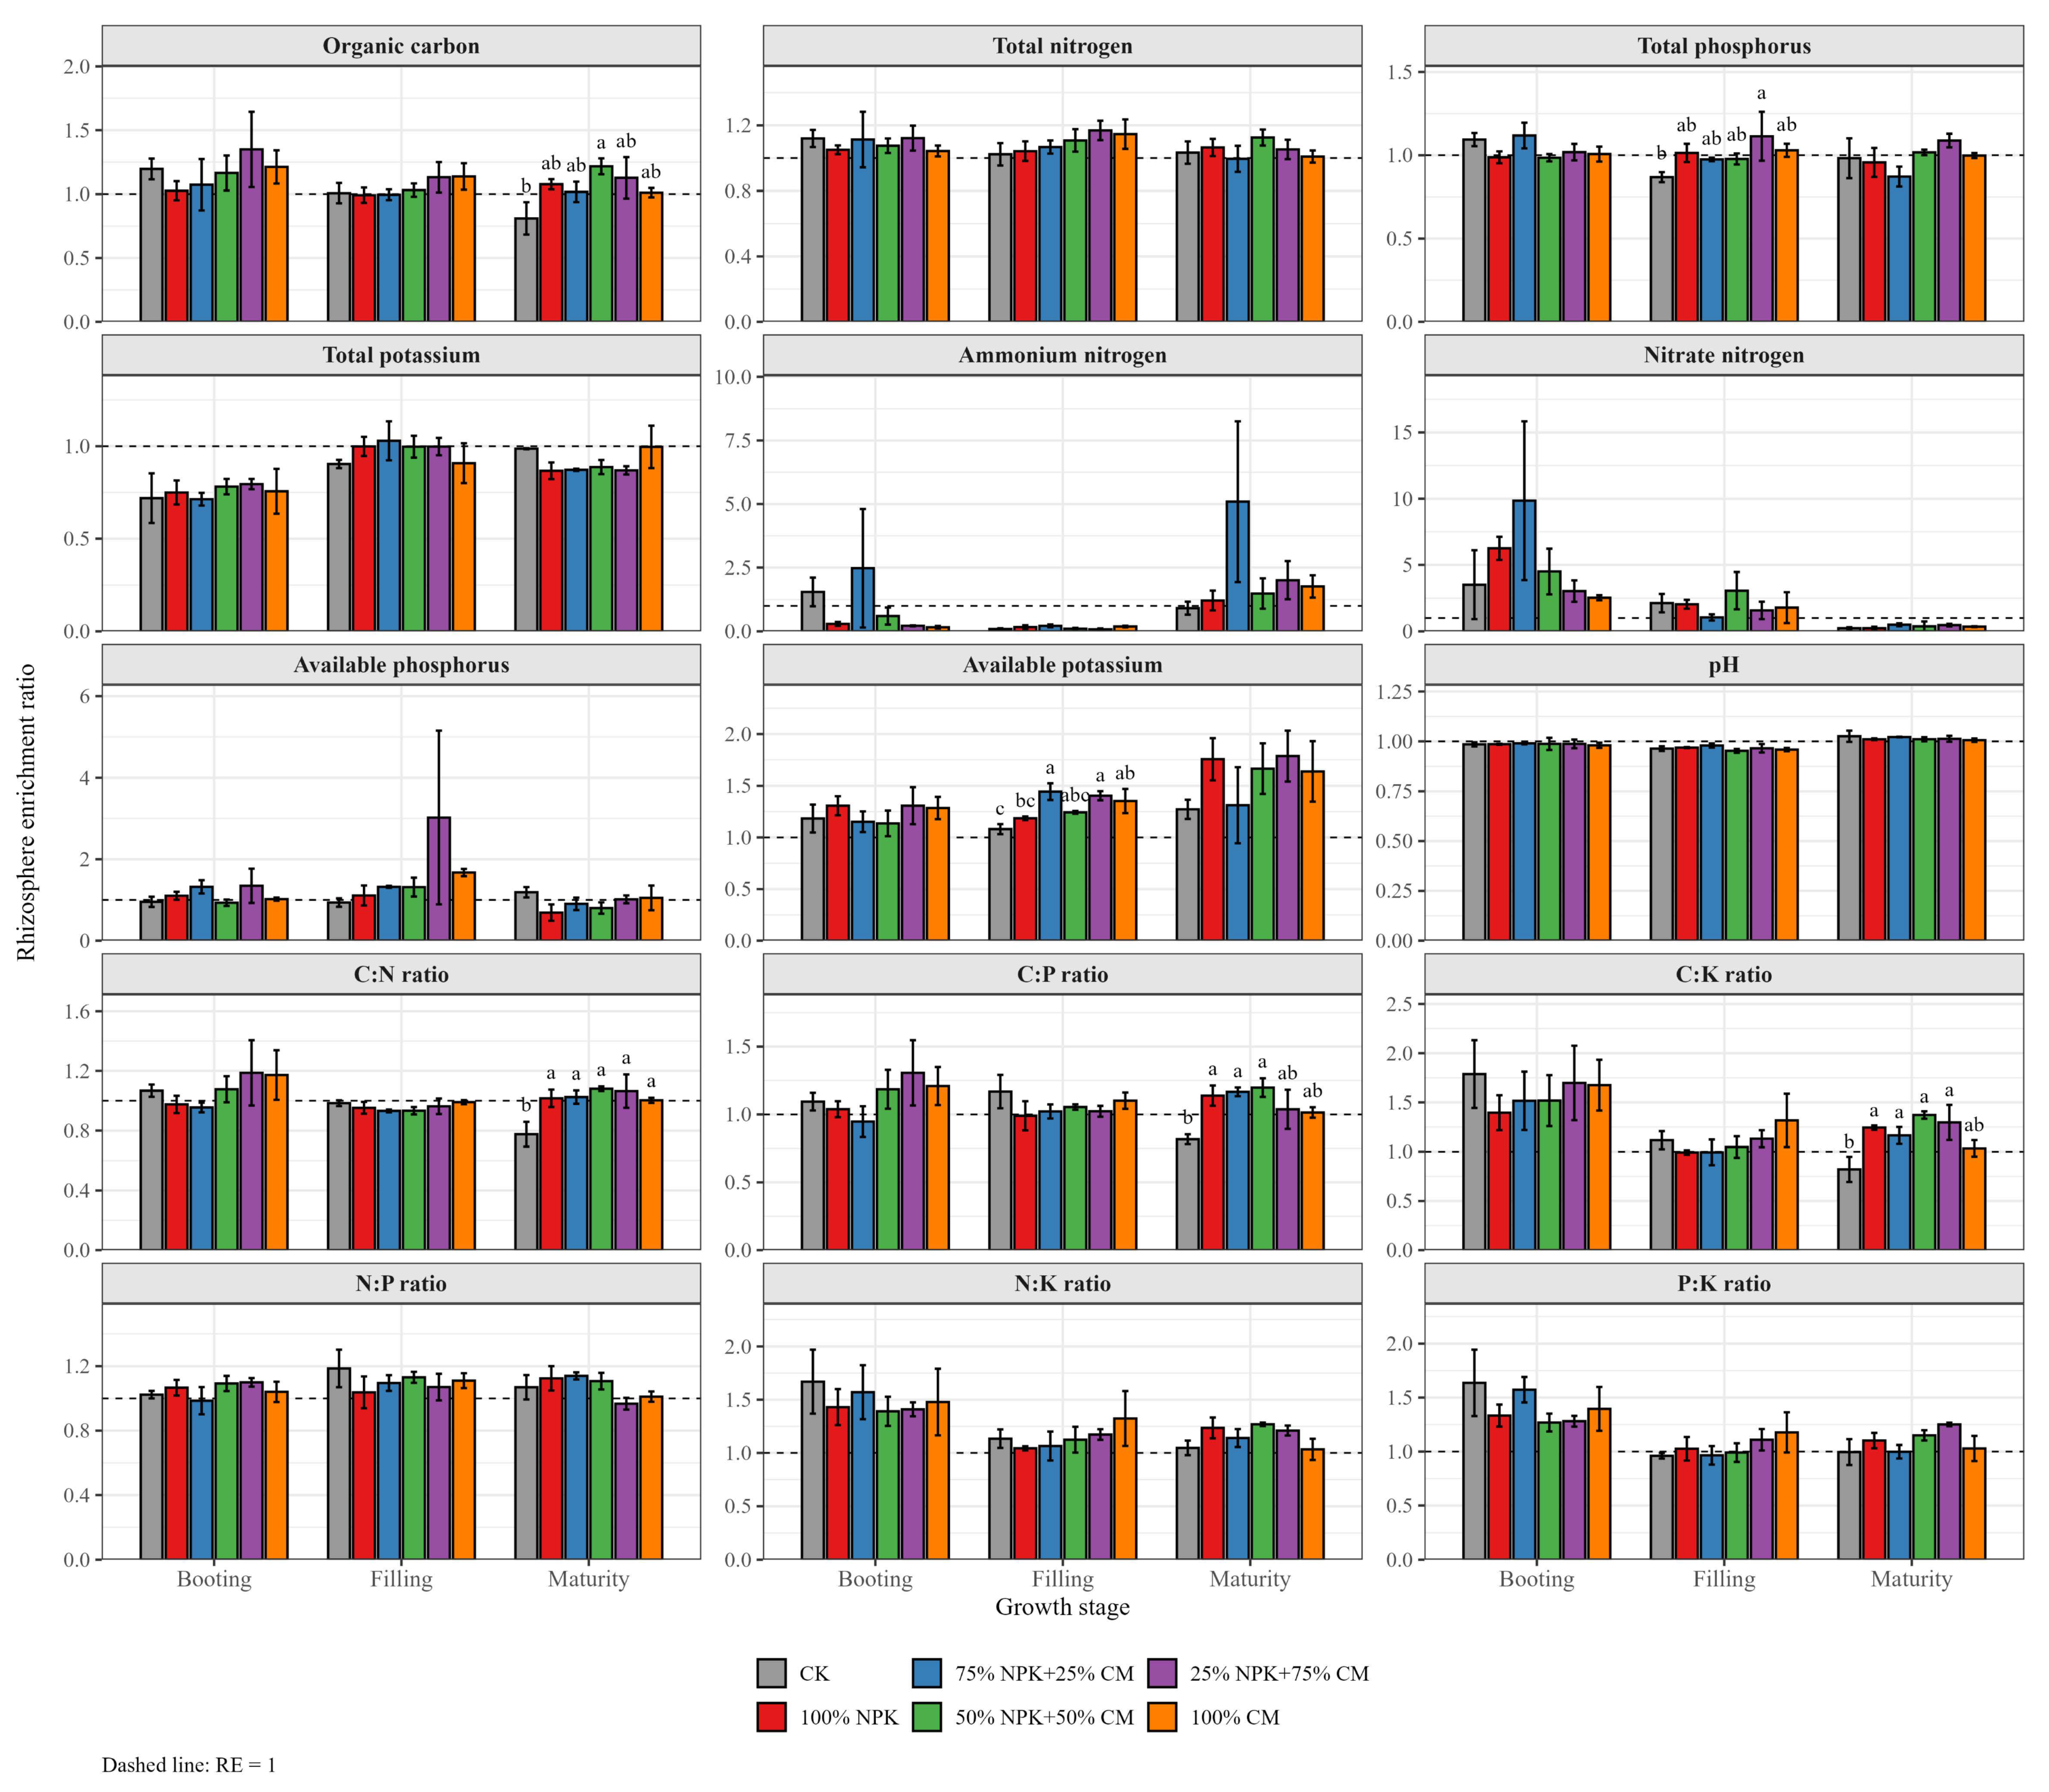
Positive rhizosphere effects shifted from single nutrients to multiple stoichiometric ratios as barley growth progressed (Figure 3). Positive effects of NO3−-N appeared only at booting (25% NPK + 75% CM, 100% CM). Positive effects of AP appeared only at filling (75% NPK + 25% CM, 100% CM). Positive effects of AK covered most fertilization treatments at filling, but only 100% NPK maintained positive effects at maturity. Positive effects of stoichiometric ratios (C:N, C:P, C:K, N:P, N:K, P:K) and soil pH were concentrated at maturity (Figure 3).
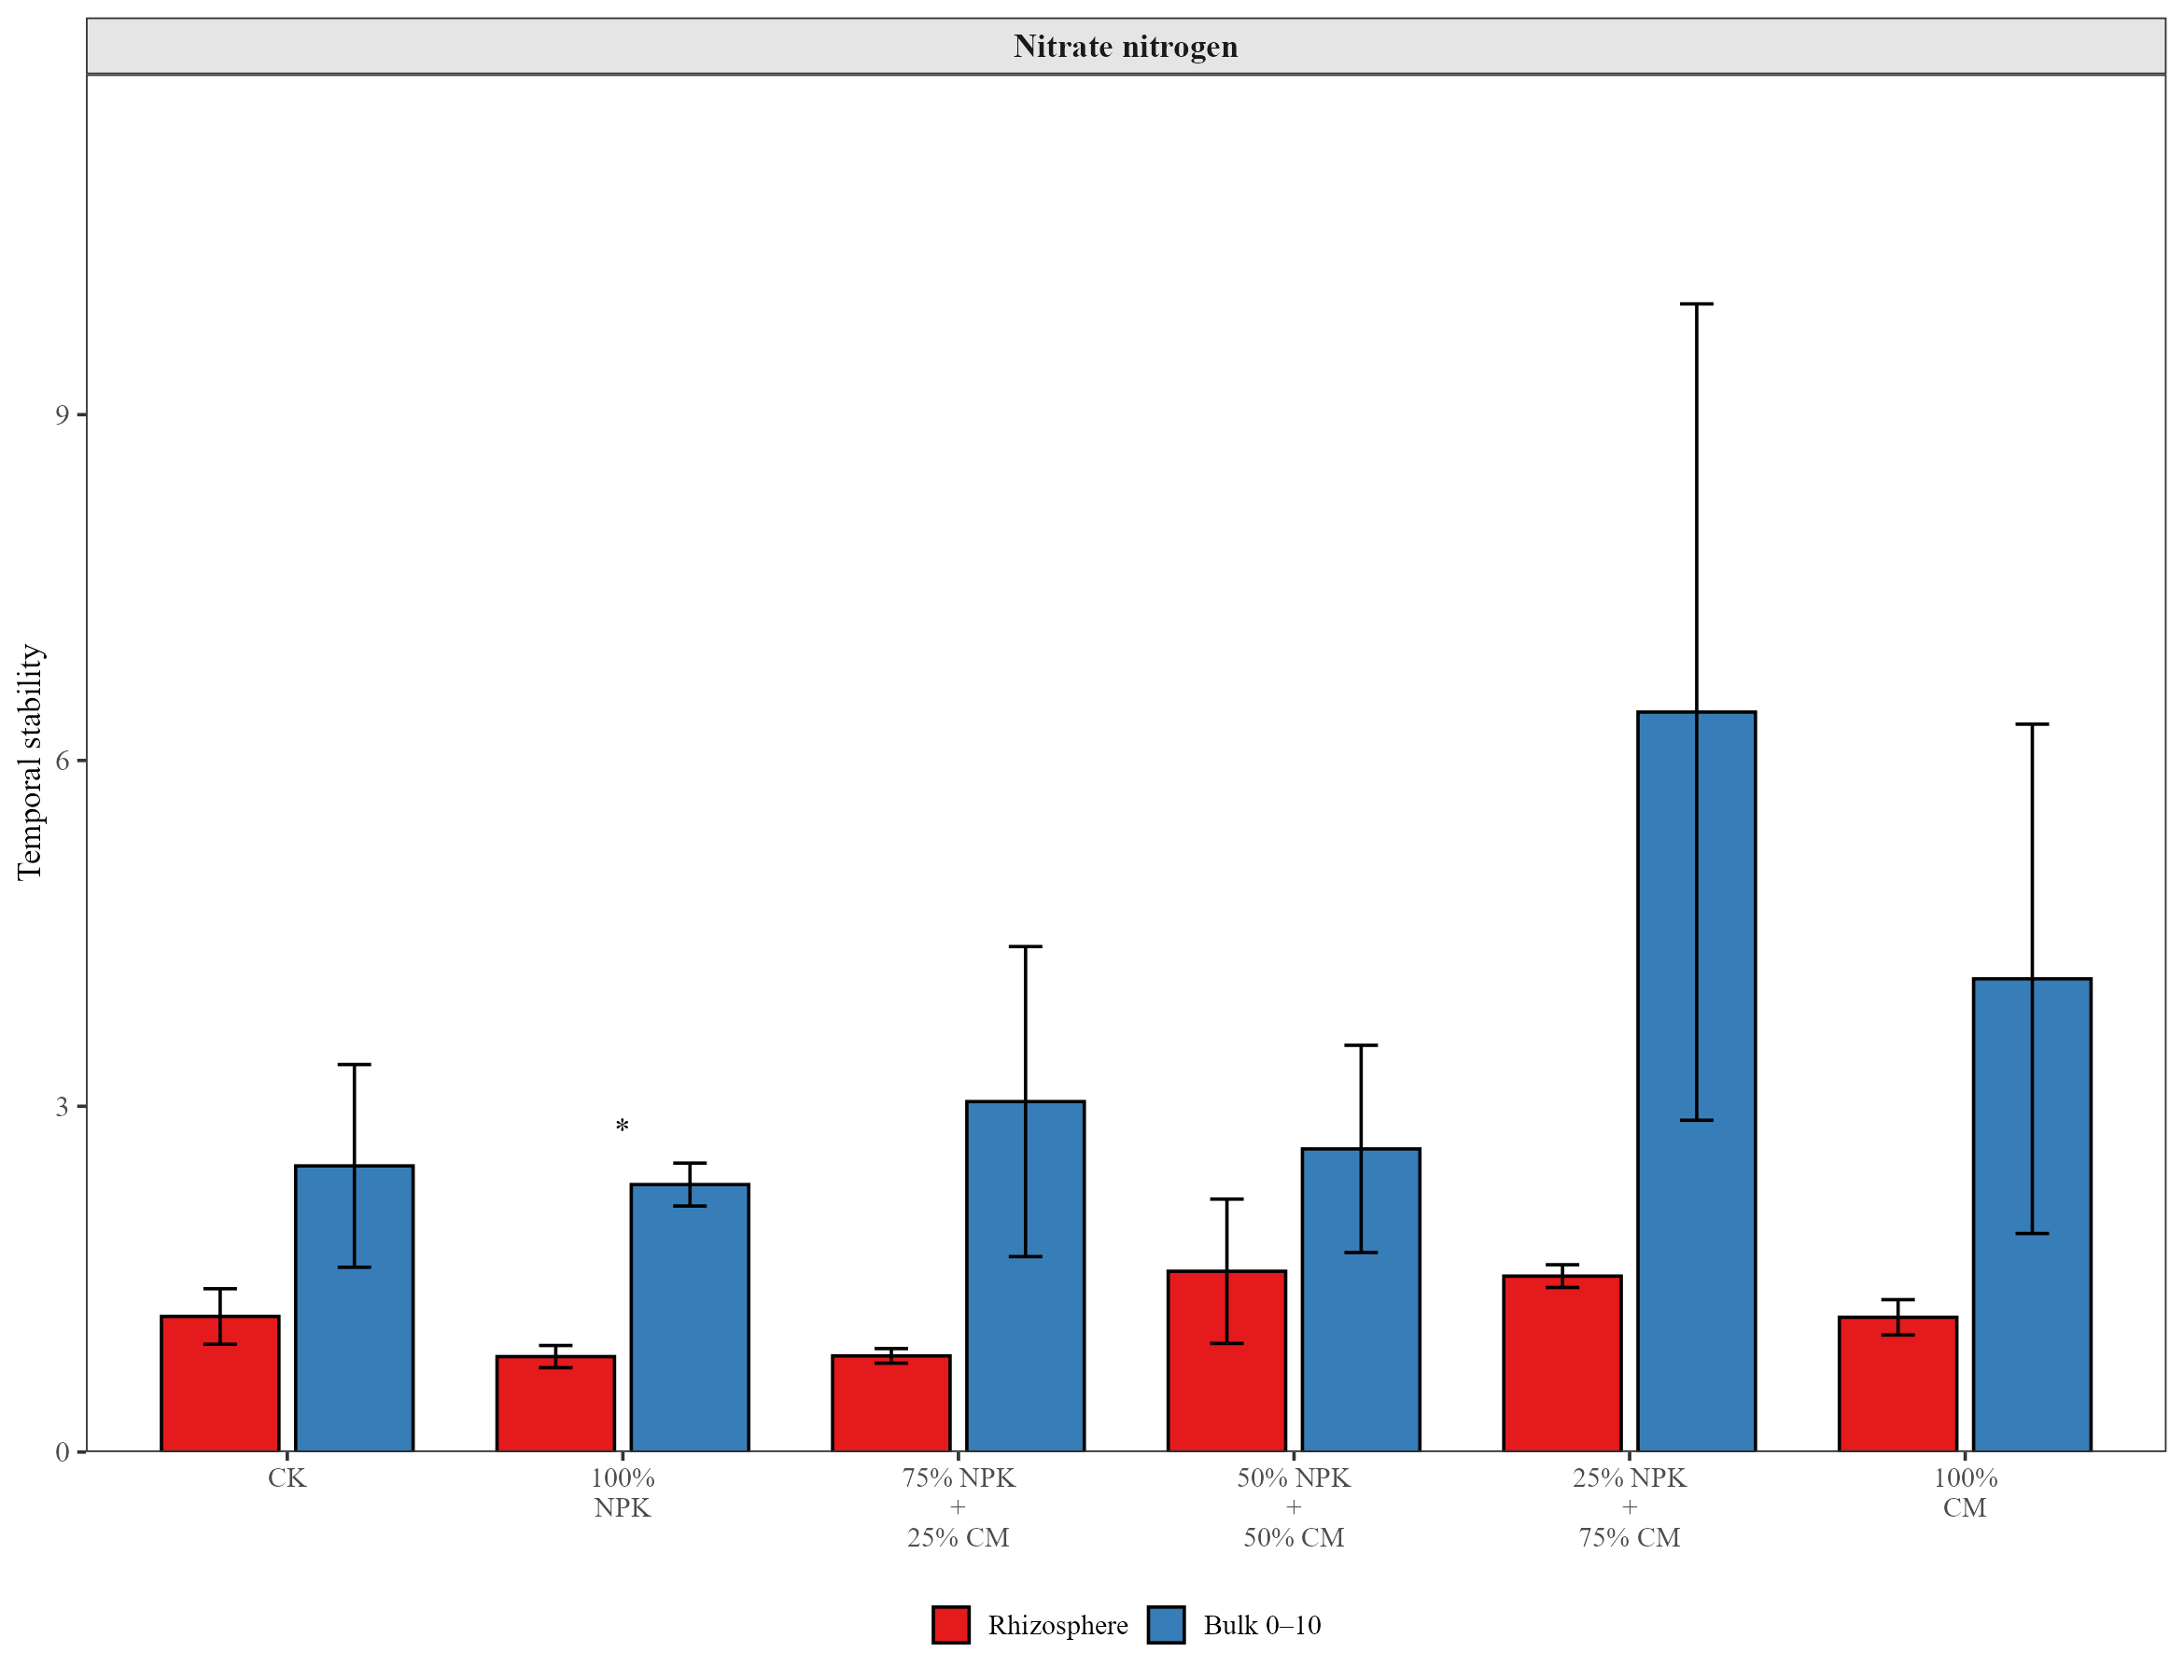
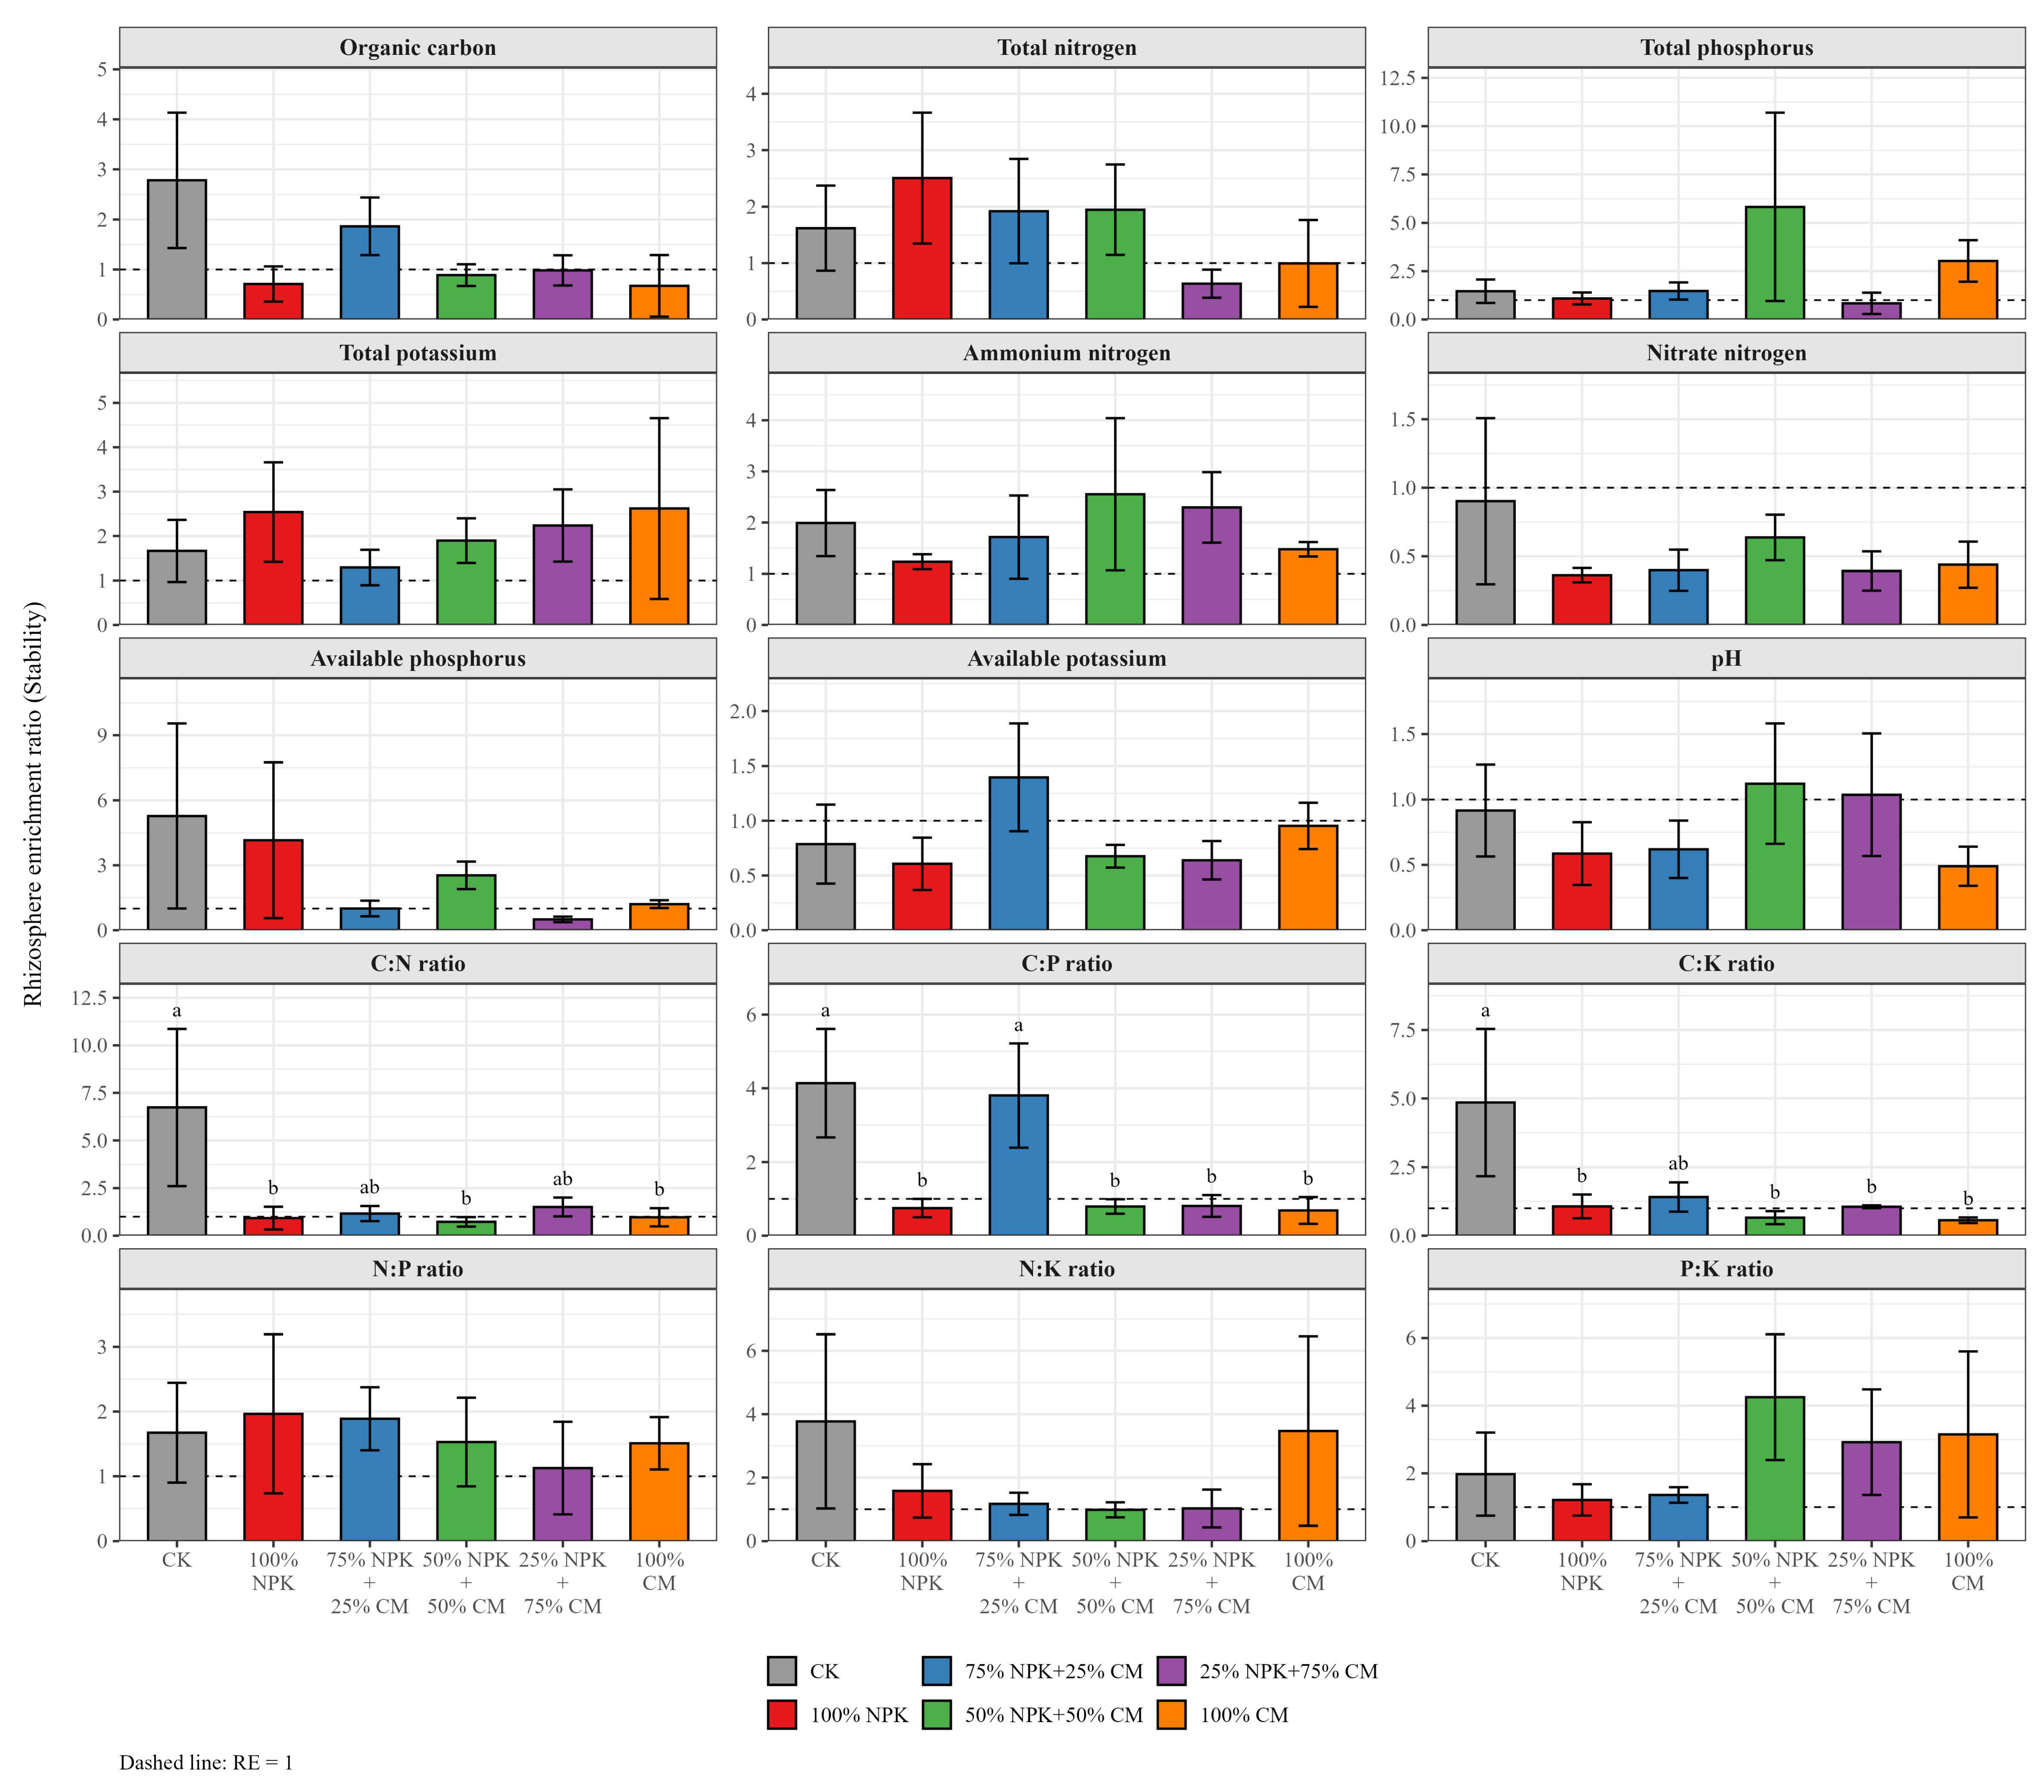
Negative rhizosphere effects also showed consistent patterns (Figure 3). TK showed negative effects across booting and maturity (75% NPK + 25% CM, 25% NPK + 75% CM, etc.). NH4+-N showed negative effects at booting and filling (100% CM, etc.). Soil pH showed negative effects at booting (100% NPK) and filling (100% NPK, etc.) (Figure 3). For temporal stability in the rhizosphere, only 100% NPK showed a negative rhizosphere effect on NO3−-N stability (Figure 4).

3.5. Treatment Comparisons of Rhizosphere Effects

Fertilization reshaped rhizosphere effects of nutrients and stoichiometric ratios, with clear phenological and substitution ratio dependence (Figure 5). At filling, AK rhizosphere effects showed a treatment-specific response: only 75% NPK + 25% CM, 25% NPK + 75% CM, and 100% CM showed increases relative to the control, with 75% NPK + 25% CM showing the largest increase and higher than 100% NPK. Meanwhile, 25% NPK + 75% CM specifically enhanced TP rhizosphere effects (Figure 5). At maturity, rhizosphere effects expanded from single nutrients to stoichiometric ratios. The 100% NPK, 75% NPK + 25% CM, and 50% NPK + 50% CM treatments had higher C:N, C:P, and C:K rhizosphere effects than the control (31.01–67.12%) (Figure 5). At maturity, 25% NPK + 75% CM increased C:N and C:K rhizosphere effects by 37.25% and 57.96%, respectively. The 100% CM treatment increased C:N rhizosphere effects by 29.25%, and 50% NPK + 50% CM increased SOC rhizosphere effects by 50.24% (Figure 5). However, this increase in rhizosphere intensity did not translate into improved temporal stability (Figure 6). The C:N, C:P, and C:K temporal stability rhizosphere effects decreased in 100% NPK, 100% CM, and 50% NPK + 50% CM (by 77.98–89.18%). The 25% NPK + 75% CM treatment also decreased C:P and C:K temporal stability rhizosphere effects (by 80.49% and 78.25%, respectively). The 75% NPK + 25% CM treatment maintained the most stable rhizosphere stoichiometric response among the tested treatments, showing no decrease in C:N, C:P, or C:K temporal stability rhizosphere effects, and its C:P temporal stability rhizosphere effect was more than four times higher than other treatments (Figure 6).

4. Discussion

4.1. Temporal Lag and Spatial Stratification of Stoichiometric Responses

Stoichiometric responses to fertilization showed stage-dependent patterns rather than an immediate response at all sampling stages. Separate within-stage comparisons detected few treatment differences in C:N, C:P, or C:K in the 0–10 cm layer at booting and filling, whereas stronger differences appeared at maturity (Figure 1 and Figure S1). Together with the significant treatment × stage interactions from the mixed-effects models, this supports Hypothesis 1 that fertilization effects were filtered by phenological stage in this cold, short-season agroecosystem (Figures S2 and S3). Most organic–inorganic treatments decreased C:N, C:P, and C:K at maturity, with C:N decreasing from 11.64 ± 1.11 in CK to 8.11–8.72 under fertilized treatments, C:P decreasing from 32.26 ± 2.29 to 19.72–25.46, and C:K decreasing from 0.611 ± 0.063 to 0.384–0.481 (mean ± SE, n = 3; Figure 1 and Figure S1). These values corresponded to decreases of 23.58–38.87%, indicating that external nutrient inputs altered the native carbon–nutrient balance in the 0–10 cm layer [19,20]. This delayed pattern is consistent with seasonally constrained microbial activity in alpine frozen soils [21,22], where biogeochemical turnover accumulates over the growing season rather than responding instantly.
Spatially, the stoichiometric rebalancing effect was most evident in the surface layer. SOC and TN in the 0–10 cm, 10–20 cm, and rhizosphere soils showed limited treatment differentiation across the three growth stages (Figure 1 and Figure S1), but these nonsignificant comparisons should not be interpreted as proof of complete homeostasis or absence of response. In contrast, TP and TK showed clearer spatiotemporal responses. At maturity, TP in the 0–10 cm layer was highest under 75% NPK + 25% CM (0.674 ± 0.027 g kg−1), compared with 0.587 ± 0.010, 0.554 ± 0.016, and 0.602 ± 0.008 g kg−1 under 50% NPK + 50% CM, 25% NPK + 75% CM, and 100% CM, respectively. TK under 75% NPK + 25% CM was 35.71 ± 0.84 and 28.16 ± 2.47 g kg−1 in the 0–10 cm layer at booting and filling, respectively, and 36.01 ± 0.92 and 28.39 ± 1.96 g kg−1 in the 10–20 cm layer. At maturity, TK in the 10–20 cm layer ranged from 32.78 ± 1.53 to 34.48 ± 1.00 g kg−1 across fertilization treatments, compared with 29.34 ± 0.05 g kg−1 in CK (Figure 1 and Figure S1). The clear differentiation between soil layers, together with the distinct rhizosphere response patterns observed in both the directionality of rhizosphere effects (Figure 3) and their temporal stability (Figure 4 and Figure 6), confirms that fertilization responses are not uniform but are spatially decoupled across the soil profile and the rhizosphere–bulk soil continuum.
Against this background of stage-dependent responses and selective spatial differentiation, the three stoichiometric ratios showed asymmetric buffering patterns. C:N decreased in all organic substitution treatments, whereas C:P remained close to the control baseline only under 25% NPK + 75% CM and C:K only under 100% CM (Figure 1 and Figure S1). These threshold-specific patterns indicate that C–P and C–K coupling depends on specific organic input ratios, rather than reflecting a general absence of fertilization response. Notably, the threshold for TP increase (25% organic) did not coincide with the threshold for C:P buffering (75% organic), suggesting that TP activation and stoichiometric regulation may be governed by different mechanisms [23,24].
Low temperature is the main driver of these differential responses. Low temperatures in alpine soils maintain the mineralization availability of active organic matter pools before the growing season [25]. Studies showing that warming promotes SOC mineralization and disrupts aggregate structure in alpine soils further support the locking effect of low temperature on C turnover and nutrient cycling [26,27]. High cattle manure input provides carbon–nutrient co-retention, offsetting stoichiometric imbalances caused by external nutrients [28,29]. External organic C improves surface soil carbon stability through physical aggregation and carbon retention, without disordered accumulation of available nutrients, ultimately achieving stoichiometric homeostasis at specific substitution ratios [30,31].
Low synthetic fertilizer with high cattle manure (25% NPK + 75% CM) can activate the carbon–phosphorus buffering mechanism, whereas carbon–potassium stoichiometric homeostasis depends entirely on 100% cattle manure without inorganic fertilizer. The asymmetric responses of different indicators to specific treatments indicate that carbon–nutrient rebalancing in alpine cropland is element-specific and substitution-ratio-dependent. These asymmetric responses imply that no single stoichiometric indicator can fully characterize elemental cycling heterogeneity, and that threshold-based management must consider element-specific responses. The complete inertness of the 10–20 cm and rhizosphere soils to fertilization further confirms that stoichiometric responses are strictly confined to the 0–10 cm active layer and do not transmit to deeper layers. This is consistent with the inherent differentiation of soil C:N:P:K stoichiometric responses to fertilization across ecosystems [1,32], and further supports the view that temporal lag and spatial stratification are general features of fertilization responses in low-temperature ecosystems.

4.2. Phenological Matching Patterns Under Different Fertilization Regimes

The short growing season of highland barley imposes strong constraints on nutrient supply [7]. In this context, not only the amount of available nutrients but also their timing and soil-compartment distribution are important for evaluating fertilization responses [33,34]. We identified three distinct soil nutrient supply patterns driven by fertilization regimes, each showing different degrees of cross-element coordination or mismatch: a mineral-fertilizer pulse pattern under 100% NPK, a manure-driven delayed-release pattern under 100% CM, and a more coordinated filling-stage pattern under 50% NPK + 50% CM.
The 100% NPK treatment showed a rapid mineral nutrient pulse at the pre-reproductive stage. At booting, urea hydrolysis drove strong NH4+-N accumulation in the 10–20 cm layer (+318.17% relative to the control), while rhizosphere NO3−-N increased by 163.13%. Rhizosphere NO3−-N was also 31.53–207.23% higher than in the organic substitution treatments. P responded synchronously to water-soluble phosphate release: 10–20 cm AP under 100% NPK was 120.40% and 74.03% higher than under 75% NPK + 25% CM and 50% NPK + 50% CM, respectively. Thus, mineral N and available P peaked together before the reproductive stage. However, this early enrichment was not maintained later in the season. At maturity, 10–20 cm NH4+-N under 100% NPK decreased to approximately one-third of the control. Unlike temperate crops with post-anthesis nutrient translocation [35,36], the short growing season in alpine regions may restrict the capacity for compensatory nutrient uptake later in the season [37,38]. Therefore, this pattern should be interpreted as a soil-based surplus–deficit mismatch rather than direct evidence of crop N deficiency. K showed a different temporal behavior, with rhizosphere AK increasing mainly at maturity (+55.25%) rather than at earlier stages. This differentiation suggests that multi-element asynchronous responses may be common under alpine fertilization conditions [2].
The 100% CM treatment showed a temperature-constrained manure mineralization pattern, with nutrient responses layered in both time and space. Seasonal warming can stimulate manure mineralization in cold soils [25]. At booting, 0–10 cm NH4+-N increased by 272.90% and AP by 47.84%, indicating early surface-layer mineralization. Rhizosphere AK also increased across the three growth stages, from 26.55% at booting to 39.20% at filling and 50.68% at maturity. In the 0–10 cm bulk soil, AK increased by 11.74% at filling, indicating that the increase in available K extended from the rhizosphere to the bulk surface soil but remained mainly within the 0–10 cm layer. In contrast, the 10–20 cm layer showed weaker mid-season K responses, with AK showing no consistent differences from the control across the three stages. At maturity, 10–20 cm NO3−-N under 100% CM was 118.36% higher than the control and 107.41% higher than 100% NPK, while 10–20 cm AP was 116.72% higher than the control. These results indicate delayed nitrate and P accumulation in the sub-surface layer. Because actual leaching was not measured, the residual NO3−-N should be interpreted as an indicator of greater potential leaching susceptibility during the subsequent snowmelt period rather than direct evidence of nitrate loss. Overall, 100% CM produced delayed and spatially uneven nutrient release, characterized by nitrate accumulation, delayed P availability, and surface-layer K retention.
It should be noted that these N patterns reflect both fertilizer source and application timing. Treatments containing mineral N received urea topdressing at tillering and booting, whereas the 100% CM treatment received all N as basal manure before sowing. Therefore, the early mineral N pulse under synthetic-fertilizer treatments and the delayed nitrate accumulation under 100% CM should be interpreted as the combined outcome of fertilizer form, mineralization dynamics, and N delivery timing.
The 50% NPK + 50% CM treatment produced the most coordinated filling-stage soil nutrient pattern. Chemical N contributed to early mineral N availability, while continued manure mineralization likely extended nutrient release to the filling stage. This combined organic–inorganic nutrient supply is consistent with previous evidence that mixed fertilizer and organic inputs can improve temporal nutrient synchrony [39]. At filling, 10–20 cm NO3−-N was 114.57% higher than the control, AP was 58.95% higher, and NH4+-N reached the highest level among all treatments. Notably, 10–20 cm NH4+-N in this treatment was 201.37–450.27% higher than in the other fertilized treatments, forming a temporary sub-surface mineral N pool during filling. This pattern likely resulted from the combination of continued organic N mineralization and fertilizer-derived NH4+, with low temperature suppressing nitrification [40,41]. P availability also remained relatively strong, with 10–20 cm AP increasing further to 107.67% above the control at maturity. This may reflect both early water-soluble phosphate input and later organic-acid-mediated P mobilization from manure decomposition [42]. K responses were coordinated with this mid-to-late nutrient pattern: rhizosphere AK was 49.55% higher than the control at maturity, and 10–20 cm TK was 16.55% higher than the control [43]. These results suggest that 50% NPK + 50% CM supported a more coordinated N-P-K soil nutrient pattern during the reproductive period, without directly demonstrating crop nutrient-demand matching.
Rhizosphere responses further supported the distinct behavior of the 50% NPK + 50% CM treatment, but these patterns were more complex than a uniformly positive response. At filling, this treatment showed positive rhizosphere effects for AK and N:P, indicating concurrent changes in K availability and N-P balance near the root zone. At maturity, positive rhizosphere effects for C:N, C:K, and N:K suggested continued rhizosphere stoichiometric differentiation. Such rhizosphere nutrient changes may reflect root-induced chemical modification, including nutrient uptake, proton release, and microbial transformation [44,45,46,47]. However, negative rhizosphere effects for TK at booting and soil pH at filling indicate that its rhizosphere processes were not completely balanced across all stages. Therefore, the advantage of this treatment lies not in uniformly increasing all rhizosphere indicators, but in producing the most coordinated soil nutrient pattern during the filling-to-maturity period.
Comparing the three strategies, synthetic fertilizer alone produced a strong early nutrient pulse but showed late-season mineral N depletion. Organic fertilizer alone, constrained by temperature-dependent mineralization, produced delayed nitrate and P accumulation and surface-layer K retention. In contrast, the 50% organic–inorganic combination produced the strongest soil-based phenological-synchrony mode, maintaining temporal N relay, complementary P availability, and coordinated K distribution during the reproductive period. Therefore, effective nutrient management in alpine cropland may depend less on maximizing total nutrient supply than on coordinating N, P, and K availability within the short phenological window, thereby reducing soil nutrient surplus–deficit mismatch.

4.3. Organic Carbon Temporal Stability: Threshold Response in Bulk Soil and Decoupling in Rhizosphere

The treatment-specific response of SOC temporal stability in the 0–10 cm bulk soil is noteworthy. The 100% CM treatment showed the highest SOC temporal stability index in the 0–10 cm bulk soil, whereas 100% NPK and partial organic substitution treatments did not differ significantly from the control. Because temporal stability was calculated as the mean divided by the standard deviation across three growth stages, this large relative increase should be interpreted as reduced seasonal fluctuation rather than a proportional increase in SOC concentration or carbon sequestration. Mean SOC was similar between 100% CM and the control (14.36 vs. 14.82 g kg−1), whereas the mean CV decreased from 21.33% under the control to 5.67% under 100% CM, producing a much higher stability index. Thus, the 100% CM treatment indicates a strong treatment-specific reduction in SOC seasonal variability in the surface bulk soil. In contrast, the 10–20 cm bulk soil showed no similar response in any treatment, indicating that SOC temporal stability responses differed with soil depth.
SOC responses to fertilization are generally non-linear, with organic carbon fractions changing in stages [48]. As external organic C input increases, new C first enters the particulate organic carbon (POC) pool, which turns over rapidly and is easily decomposed by microorganisms [49,50]. Only when C input accumulates enough to saturate the limited mineral surface adsorption sites (clay, Fe and Al oxides, etc.) can new C be converted to mineral-associated organic carbon (MAOC) [51], gaining temporal stability. Meanwhile, high organic fertilizer input may trigger soil aggregate reorganization, encasing organic C within macroaggregates and providing physical protection [52,53]. Both processes, mineral binding site saturation and aggregate reorganization, likely have threshold characteristics, requiring C input to reach a critical level before they begin [54,55].
Based on this theoretical framework, the strong SOC temporal stability response under 100% CM may indicate that high manure input promoted seasonal SOC stabilization in the 0–10 cm bulk soil. One possible explanation is that greater organic C input enhanced physical or mineral-associated C protection, whereas 100% NPK and partial substitution treatments did not produce the same degree of temporal stabilization. However, because SOC fractions, aggregate-associated C, and mineral-associated organic C were not directly measured, this POC–MAOC interpretation should be regarded as a hypothesis for future fractionation work. The lack of response in the 10–20 cm bulk soil suggests that carbon stabilization in deeper layers may be limited by mineral binding site availability or aggregate formation capacity [56,57]. Rotary tillage distributed external C relatively evenly across the 0–20 cm layer, but the lower temperature amplitude and poorer aeration in the 10–20 cm layer may have suppressed aggregate turnover, limiting carbon stabilization [58,59]. Therefore, under the alpine field conditions of this study, the organic substitution threshold for triggering SOC temporal stability was observed only in the 0–10 cm surface layer, between 75% and 100% substitution. Below this threshold, external C likely remained in the active carbon pool, not reaching the critical input needed for mineral binding and aggregate protection. Previous studies have also noted that this threshold may vary with soil type and climate, highlighting the need to define local thresholds in alpine ecosystems [60,61].
Interestingly, rhizosphere SOC temporal stability showed no significant differences from the control in any treatment, while bulk soil achieved a step-change increase under 100% CM. This indicates a clear decoupling between bulk soil and rhizosphere carbon stability responses within the 0–10 cm layer. This asymmetry suggests that continuous root activity and exudate inputs may create a persistent carbon turnover hotspot in the rhizosphere, keeping rhizosphere organic C in a dynamic state and weakening the regulatory effect of external fertilization on C temporal stability [14,62,63]. However, within the rhizosphere, treatment differences still existed: 75% NPK + 25% CM increased rhizosphere SOC temporal stability by 152.76% relative to 25% NPK + 75% CM, suggesting that even within a generally insensitive background, a high-synthetic-fertilizer treatment (75% NPK + 25% CM) may achieve relative improvement in rhizosphere C stability through modulation of root exudate composition or rhizosphere microbial community structure [64,65]. The microbial basis of this hypothesis requires further investigation with rhizosphere microbial community composition and functional dynamics.

4.4. Temporal Stability of Stoichiometric Ratios and Nutrient Availability

The temporal stability of TP in the 0–10 cm layer further confirmed the generality of multi-indicator asynchronous optimization. The 25% NPK + 75% CM treatment increased TP temporal stability by 319.25% relative to 75% NPK + 25% CM, with no other treatment differences in the 0–10 cm, 10–20 cm, or rhizosphere layers. Unlike the threshold response of C stability, the optimal ratio for P stability was on the high-organic side (25% NPK + 75% CM), but not 100% CM. This indicates that P and C temporal stability have different optimal conditions. Low organic substitution (e.g., 25% CM) may not provide enough mineral adsorption sites to stabilize P, while high organic substitution (e.g., 100% CM) may cause larger P fluctuations over time due to temperature-dependent organic matter decomposition. The 25% NPK + 75% CM treatment may represent a balance between adsorption retention and mineralization release, keeping P more stable over time. The surface-limited nature of this effect (no response in the 10–20 cm or rhizosphere) is consistent with the spatial pattern of C stability, further supporting the general pattern that fertilization-driven stability responses are mainly limited to the 0–10 cm surface layer.
In the 10–20 cm bulk soil, the 50% NPK + 50% CM treatment increased P:K temporal stability by 95.84% relative to the control, and by 91.14% and 130.18% relative to 100% CM and 75% NPK + 25% CM, respectively. This indicates that this treatment achieved better temporal synchronization of P and K in the 10–20 cm layer. No similar responses were seen in the 0–10 cm bulk soil or rhizosphere, indicating that P:K stability regulation is specific to the 10–20 cm bulk soil. This is consistent with the optimization of NH4+-N, NO3−-N, and AP in the same layer under the 50% treatment, further supporting 50% NPK + 50% CM as the optimal structure for nutrient coordination in the 10–20 cm layer.
The rhizosphere showed a more complex pattern. The 75% NPK + 25% CM treatment increased C:P temporal stability by 199–326% relative to other treatments. In contrast, the 100% CM treatment decreased C:K temporal stability by 73.80% relative to the control, and 100% NPK and 25% NPK + 75% CM decreased AK temporal stability by 48.55% and 38.99%, respectively. Unlike the P:K pattern, these responses for C:P, C:K, and AK stability were limited to the rhizosphere, with no differences in the bulk soil layers. This spatial separation suggests that different stability indicators are regulated by different spatial processes. The P:K stability response in the 10–20 cm bulk soil may be related to the balance between P and K fixation and release in deeper layers. The rhizosphere-specific responses of C:P, C:K, and AK stability may arise from root exudate effects on rhizosphere C-P-K coupling [66]. These hypotheses require further verification with soil physicochemical and microbial community data from different layers and rhizosphere compartments.

4.5. The General Trade-Off Between Nutrient Activation Intensity and Temporal Stability

Our results reveal an indicator-dependent relationship in alpine cropland: fertilization-induced increases in nutrient enrichment intensity were often accompanied by lower temporal stability. This enrichment–stability pattern was not restricted to stoichiometric ratios, but appeared across several soil layers and nutrient indicators. It likely reflects the imbalance between the pulse effect of external nutrient inputs and the buffering capacity of the ecosystem under low-temperature alpine conditions [17,67]. The following evidence addresses Hypothesis 3, which predicts that rhizosphere enrichment and temporal stability are closely linked and that specific organic–inorganic ratios can maintain a more balanced rhizosphere carbon–nutrient relationship.
In the rhizosphere, this enrichment–stability divergence was particularly evident in AK dynamics. The 25% NPK + 75% CM treatment maintained higher rhizosphere AK at both filling and maturity, and 100% NPK did so at maturity, but their AK temporal stability decreased significantly relative to the control. This indicates that relying solely on synthetic fertilizers or high organic fertilizers to increase transient rhizosphere nutrient availability can induce strong seasonal fluctuations, creating a high-enrichment, high-fluctuation pattern [17,68]. This rhizosphere K pattern highlights the limitation of pursuing only transient rhizosphere nutrient enrichment in the short growing season.
In the 10–20 cm layer, a different enrichment–stability pattern was observed. The 50% NPK + 50% CM treatment did not increase P:K, but decreased it by 13.86% relative to the control at maturity, while increasing P:K temporal stability by 95.84%. This small decrease in magnitude together with a large increase in stability indicates that, in the sub-surface layer with smaller temperature fluctuations, stability can be more important than transient abundance. The 50% organic–inorganic combination reduced seasonal fluctuations and produced a more stable P:K pattern in the 10–20 cm layer.
At the stoichiometric level, the enrichment–stability relationship was associated with differences in rhizosphere enrichment pathways. Fertilization increased rhizosphere stoichiometric ratios mainly through root exudate-related nutrient mobilization and direct external nutrient inputs [69]. These rapid enrichment processes do not depend on microbial community stabilization, and therefore may lack the long-term maintenance capacity of aggregate protection or mineral binding site saturation, while synchronously amplifying rhizosphere nutrient seasonality [70]. We observed this pattern across multiple treatments: inverse enrichment–stability responses occurred for C:N, C:P, and C:K in different treatment combinations. The consistency across indicators suggests that low temperature in alpine regions may constrain microbial necromass humification and aggregate physical protection, preventing short-term C turnover from converting to long-term stable C [71,72].
The micro-site basis of this trade-off lies in the “high turnover, low buffer” metabolic nature of rhizosphere nutrient dynamics [17,73]. Rhizosphere effects had a dual character: negative effects of TK from booting to maturity, and negative effects of NH4+-N in the pure organic system, reflecting continuous root uptake-driven depletion. Meanwhile, positive effects of NO3−-N (booting), AP (filling), AK (filling to maturity), and stoichiometric ratios (concentrated at maturity) were widespread, indicating that root activation and microbial transformation can also create transient enrichment. This alternation of positive and negative effects, differentiated by phenology and element type, means that transient rhizosphere enrichment always faces the risk of subsequent depletion [74]. Any short-term concentration increase induced by fertilization is difficult to maintain stably over time [75]. This is consistent with the view that rhizosphere effect intensity and persistence are regulated by different mechanisms [62,76]. Among the tested treatments, 75% NPK + 25% CM showed the most balanced rhizosphere response. It enhanced C:P-related rhizosphere stability, avoided significant decreases in C:N and C:K stability, and did not show the pronounced “high enrichment, low stability” pattern observed for AK. We interpret this response as a localized rhizosphere stability-maintenance pattern, or a tentative “rhizosphere homeostasis island”. Here, “island” refers to a root-affected microzone in which rhizosphere nutrient enrichment was maintained without a corresponding loss of stoichiometric temporal stability. This pattern suggests that low-level organic substitution may help maintain rhizosphere stoichiometric stability while avoiding the larger seasonal fluctuations associated with pure organic fertilization [77,78]. Mechanistically, moderate organic input may provide labile C substrates and slower-release nutrients for microbial processing, while the mineral fertilizer component supplies readily available nutrients. Together, these inputs may buffer abrupt nutrient pulses and support microbial immobilization–mineralization turnover, thereby maintaining rhizosphere stoichiometric stability. The microbial mechanisms underlying this response require further investigation using rhizosphere microbial community, root exudate, and functional data. Thus, Hypothesis 3 was supported: enrichment–stability divergence was observed across multiple treatments and indicators, and 75% NPK + 25% CM maintained the most balanced rhizosphere response among the tested fertilization regimes.

4.6. Environmental Management Implications and Research Limitations

The divergent responses of different environmental management goals to organic substitution ratios preclude a one-size-fits-all recommendation. Based on our findings, we propose a preliminary multi-mode response framework for alpine agroecosystems, with each mode corresponding to a specific set of soil nutrient and stoichiometric responses. The phenological synchrony mode (50% NPK + 50% CM) is identified when the primary management objective is reducing soil nutrient surplus–deficit mismatch. This mode achieved coordinated NH4+-N and AP availability in the 10–20 cm layer at filling (NH4+-N maintained at high levels, AP +58.93% relative to the control, further increasing to 107.68% at maturity, NO3−-N +114.53%), thereby reducing both early N loss potential and late N deficit risk.
The rhizosphere stability mode (75% NPK + 25% CM) is recommended when the primary management objective is maintaining rhizosphere functional stability and phosphorus activation efficiency. This treatment maintained the most balanced relationship between rhizosphere enrichment and temporal stability: C:P temporal stability was 199–326% higher than other treatments, rhizosphere SOC temporal stability was 152.76% higher than 25% NPK + 75% CM, and it avoided the high-enrichment, low-stability pattern observed for AK in other treatments. This mode appears to provide a low-disturbance, relatively stable regulatory regime in the rhizosphere.
The carbon sequestration mode (100% CM) is recommended when the primary management objective is enhancing soil carbon stability and long-term carbon storage. This treatment increased 0–10 cm SOC temporal stability by 1425.2% relative to the control, representing a strong treatment-specific increase in soil carbon stability rather than simple carbon accrual. However, this mode resulted in elevated residual nitrate accumulation (118% above the control at maturity), indicating greater potential leaching susceptibility that must be weighed against its carbon-related soil stability benefits.
These three modes correspond to distinct soil nutrient response patterns and should not be compared as universally better or worse. No single ratio optimized all measured indicators simultaneously. Importantly, the 75% NPK + 25% CM treatment showed a comparatively balanced response between rhizosphere stability and P-related rhizosphere effects, suggesting that partial substitution treatments may serve as candidates for further testing when multiple soil nutrient objectives are considered.
Several limitations should be acknowledged. First, our conclusions are based on single-year data, and inter-annual variability in temperature and precipitation may affect the magnitude of the treatment-specific responses identified. The applicability of these three modes across different soil types and climatic conditions therefore requires further validation. Second, because plant nutrient uptake, crop performance, leachate chemistry, runoff loss, and gaseous N loss were not measured, the soil nutrient patterns identified in this study should be interpreted as soil-based indicators of nutrient synchrony and potential environmental risk, rather than direct evidence of crop nutrient-demand matching or actual nutrient-loss reduction. Third, the proposed mechanisms underlying SOC temporal stability and rhizosphere stability require further verification. SOC fractions, aggregate-associated C, and mineral-associated organic C were not directly measured; therefore, the inferred POC–MAOC pathway and aggregate-protection mechanism remain hypotheses requiring future soil C fractionation and aggregate-level analyses. Similarly, the localized rhizosphere stability-maintenance pattern, or tentative “rhizosphere homeostasis island”, observed under 75% NPK + 25% CM was inferred from a subset of stoichiometric and nutrient-stability indicators. The microbial mechanisms underlying this pattern, particularly the roles of root exudate composition, microbial community structure, and microbial functional traits, require direct investigation in future studies. Finally, long-term monitoring is needed to assess the cumulative environmental effects of continuous organic substitution, including potential phosphorus accumulation and changes in soil organic matter quality. These limitations and uncertainties reinforce that the proposed framework should be applied with adaptation to local conditions, rather than as a prescriptive rule.

5. Conclusions

This study diagnosed substitution-ratio-specific responses of soil nutrient pools to organic substitution gradients in Tibetan alpine agroecosystems, and quantified the associated relationships among phenological synchrony, rhizosphere stability, and carbon sequestration. The main conclusions are as follows.
(1)
Alpine soil nutrient responses exhibited clear phenological lag and surface-layer limitation. Stoichiometric ratios in the 0–10 cm layer were restructured only at maturity (decreasing by 23.58–38.87%), with no treatment differences at booting or filling. The 10–20 cm bulk soil and rhizosphere maintained homeostasis throughout the growing season, confirming that fertilization responses are spatially decoupled and temporally delayed in cold, short-season agroecosystems.
(2)
Three distinct soil nutrient risk patterns emerged from the fertilization regimes. The 100% NPK treatment caused early nutrient surplus followed by late-season mineral N depletion, indicating stronger soil-based surplus–deficit mismatch. The 100% CM treatment, constrained by low-temperature mineralization, produced lagged nutrient release with high residual nitrate accumulation (118% above the control at maturity), indicating greater potential snowmelt-period leaching susceptibility. The 50% NPK + 50% CM treatment produced the most coordinated filling-stage soil nutrient pattern in the 10–20 cm layer, reducing the soil-based surplus–deficit mismatch.
(3)
Nutrient temporal stability showed substitution-ratio-specific response patterns with clear spatial differentiation. SOC temporal stability showed an apparent threshold-type response in the 0–10 cm bulk soil, with the strongest response under 100% CM rather than a gradual increase across the substitution gradient. The 10–20 cm P:K stability reached its highest value under 50% NPK + 50% CM. In the rhizosphere, an indicator-dependent inverse relationship was observed between nutrient enrichment intensity and temporal stability for C:N, C:P, and C:K, while 75% NPK + 25% CM maintained the most balanced enrichment–stability pattern among the tested treatments.
Overall, we propose a multi-mode soil nutrient response framework for alpine agroecosystems. No single substitution ratio optimized all measured indicators. The 50% NPK + 50% CM treatment represented the phenological-synchrony mode by reducing soil nutrient surplus–deficit mismatch; 75% NPK + 25% CM represented the rhizosphere stability mode; and 100% CM represented the surface soil carbon stability mode, although it also resulted in elevated residual nitrate accumulation. These three modes provide a useful framework for organizing the observed effects of organic substitution on soil nutrient dynamics and stoichiometric stability. However, because this study was conducted at a single site during one growing season with three replicate plots per treatment, these modes should be interpreted as treatment-specific soil nutrient response patterns and candidate strategies for further testing, rather than as ready-to-apply fertilization prescriptions. Future multi-year and multi-site experiments, together with crop nutrient uptake, yield performance, and nutrient-loss measurements, are needed to evaluate their broader agronomic and environmental applicability.

Supplementary Materials

The following supporting information can be downloaded at: https://www.mdpi.com/article/10.3390/agronomy16191980/s1, Figure S1: Soil nutrient contents and stoichiometric ratios in bulk soils (0–10 cm and 10–20 cm) and rhizosphere soil (0–10 cm) at booting, filling, and maturity stages under different fertilization treatments. Bars represent means ± standard error (n = 3). Different lowercase letters indicate significant differences among treatments within the same growth stage and same soil layer (Duncan's multiple comparison test, α = 0.05). CK, control; NPK, synthetic fertilizer; CM, cattle manure; Figure S2: Mixed-effects tests of treatment-dependent stage and soil-compartment responses. Heatmap showing FDR-adjusted p values for treatment × growth stage, treatment × soil compartment, and treatment × growth stage × soil compartment interactions from linear mixed-effects models. Models were fitted separately for each soil nutrient or stoichiometric indicator, with treatment, growth stage, soil compartment, and their interactions as fixed effects and plot identity as a random intercept. Asterisks indicate FDR-adjusted significance levels (* p < 0.05, ** p < 0.01, *** p < 0.001). Dagger symbols indicate singular random-effect fits and should be interpreted cautiously; Figure S3: Robustness of mixed-effects interaction tests. Heatmap comparing significant interaction terms between raw-value mixed-effects models and log-transformed sensitivity models. Blue cells indicate interaction terms that remained significant after FDR adjustment in both raw-value and log-transformed models; orange cells indicate significance only in the raw-value model; light-blue cells indicate significance only in the log-transformed model; white cells indicate nonsignificant interactions; gray cells indicate variables or models not available for comparison. Dagger symbols indicate singular random-effect fits in at least one model; Table S1: Fertilizer application rates for the 2024 field experiment; Supplementary Dataset S1: Aggregated summary statistics and mixed-effects model outputs.

Author Contributions

C.Z.: Conceptualization, Investigation, Formal analysis, Visualization, Writing—Original draft, Writing—Review & editing, Final approval, Accountability. W.S.: Conceptualization, Supervision, Funding acquisition, Writing—Review & editing, Final approval, Accountability. S.L.: Conceptualization, Methodology, Writing—Review & editing, Final approval, Accountability. Y.T.: Methodology, Supervision, Formal analysis, Writing—Review & editing, Final approval, Accountability. G.F.: Investigation, Resources, Writing—Review & editing, Final approval, Accountability. Z.Z.: Investigation, Resources, Writing—Review & editing, Final approval, Accountability. G.Z.: Investigation, Data curation, Writing—Review & editing, Final approval, Accountability. F.H.: Resources, Writing—Review & editing, Final approval, Accountability. S.H.: Methodology, Writing—Review & editing, Final approval, Accountability. D. (Dunzhuyujie): Investigation, Writing—Review & editing, Resources, Final approval, Accountability. D. (Dawaqiongda): Investigation, Writing—Review & editing, Resources, Final approval, Accountability. All authors have read and agreed to the published version of the manuscript.

Funding

This study was funded by Lhasa Science and Technology Plan Project [LSKJ202422], Xizang Autonomous Region Science and Technology Project [XZ202501ZY0056, XZ202501ZY0086, XZ202401JD0029], China National Natural Science Foundation [31600432], and Chinese Academy of Sciences Youth Innovation Promotion Association [2020054].

Data Availability Statement

The data presented in this study are available on request from the corresponding author due to ongoing research requirements.

Conflicts of Interest

The authors declare no conflicts of interest.

References

  1. Rocci, K.S.; Barker, K.S.; Seabloom, E.W.; Borer, E.T.; Hobbie, S.E.; Bakker, J.D.; MacDougall, A.S.; McCulley, R.L.; Moore, J.L.; Raynaud, X.; et al. Impacts of nutrient addition on soil carbon and nitrogen stoichiometry and stability in globally-distributed grasslands. Biogeochemistry 2022, 159, 353–370. [Google Scholar] [CrossRef] [Scilit]
  2. Tian, L.; Zhao, L.; Wu, X.; Fang, H.; Zhao, Y.; Hu, G.; Yue, G.; Sheng, Y.; Wu, J.; Chen, J.; et al. Soil moisture and texture primarily control the soil nutrient stoichiometry across the Tibetan grassland. Sci. Total Environ. 2018, 622, 192–202. [Google Scholar] [CrossRef] [Scilit]
  3. Ma, X.; Liu, C.; Li, T.; Xu, J.; Dong, J.; Li, J.; Zhao, J.; Wang, X. The development suitability analysis for the Qinghai-Xizang-Plateau: Condition, quality, and risk. J. Environ. Manag. 2025, 392, 126750. [Google Scholar] [CrossRef] [Scilit]
  4. Zhang, X.; Liu, Y.; Yin, J.; Shi, P.; Feng, H.; Shi, J. Multi-scenario simulation of land use change and its impact on ecosystem services in the northeastern edge of the Qinghai-Xizang Plateau, China. J. Arid Land 2025, 17, 145–166. [Google Scholar] [CrossRef] [Scilit]
  5. Jiang, D.; Chen, S.; Qin, Z.; Bo, L.; Niu, L.; Zhou, H.; Wang, J.; Dondup, D.; Hou, X. Deciphering drought response mechanism in Tibetan qingke through comprehensive transcriptomic and physiological analysis. Front. Plant Sci. 2025, 16, 1633561. [Google Scholar] [CrossRef] [Scilit]
  6. Xu, C.; Wang, Y.; Fei, N.; Basang, Y.; Yang, H.; Dunzhu, J.; Yuan, H.; Wang, M.; Zha, S.; Da, W.; et al. Metabolic adaptations of Qingke: A review of stress resilience and nutritional functions. Crop J. 2026, 14, 61–73. [Google Scholar] [CrossRef] [Scilit]
  7. Liu, Y.; Zhang, E.; Pan, T.; Chen, J.; Gao, Y.; Peñuelas, J. Anthropogenic adaptation measures expand suitable area for highland barley in Tibetan Plateau. Sci. Bull. 2025, 70, 1504–1512. [Google Scholar] [CrossRef] [Scilit]
  8. Hou, Y.; He, K.; Chen, Y.; Zhao, J.; Hu, H.; Zhu, B. Changes of soil organic matter stability along altitudinal gradients in Tibetan alpine grassland. Plant Soil 2021, 458, 21–40. [Google Scholar] [CrossRef] [Scilit]
  9. Song, M.H.; Jiang, J.; Xu, X.L.; Shi, P.L. Correlation Between CO2 Efflux and Net Nitrogen Mineralization and Its Response to External C or N Supply in an Alpine Meadow Soil. Pedosphere 2011, 21, 666–675. [Google Scholar] [CrossRef] [Scilit]
  10. Guan, X.; Cheng, Z.; Li, Y.; Wang, J.; Zhao, R.; Guo, Z.; Zhao, T.; Huang, L.; Qiu, C.; Shi, W.; et al. Mixed organic and inorganic amendments enhance soil microbial interactions and environmental stress resistance of Tibetan barley on plateau farmland. J. Environ. Manag. 2023, 330, 117137. [Google Scholar] [CrossRef] [Scilit]
  11. Fu, G.; He, Y. Responses of soil fungal and bacterial communities to long-term organic and inorganic nitrogenous fertilizers in an alpine agriculture. Appl. Soil Ecol. 2024, 201, 105498. [Google Scholar] [CrossRef] [Scilit]
  12. Huang, X.; Yu, C.; Sun, W.; Shi, P.; Wu, J.; Yu, J.; Wang, J.; Mu, T. Partial organic substitution for chemical fertilizer reduces N2O emissions but increases the risk of N loss through nitrification in Tibetan farmland. Sci. Rep. 2025, 15, 14503. [Google Scholar] [CrossRef] [Scilit]
  13. Cai, Z.; Shi, J.; Lv, L.; Gao, P.; Zhang, H.; Li, F.; Fu, S.; Liu, Q.; Bao, S. Construction of a Green and Sustainable Cultivation Model for Annual Forage Oat in Alpine Ecosystems: Optimization and Synergistic Mechanisms of Combined Application of Microbial Fertilizers and Organic Fertilizers. Plants 2025, 14, 1271. [Google Scholar] [CrossRef] [Scilit]
  14. Tong, R.; Kuzyakov, Y.; Yu, H.; Cao, Y.N.; Wu, T.G. Rhizosphere response and resistance to fertilization. Commun. Earth Environ. 2025, 6, 602. [Google Scholar] [CrossRef] [Scilit]
  15. Zhang, W.; Lu, Y.; Peixoto, L.; Ji, C.; Yang, H.; Wang, K.; Zhang, J.; Wang, J.; Shi, L.; Zhou, J.; et al. Microbial efficiency drives depth-dependent soil carbon storage under organic fertilization. J. Environ. Manag. 2026, 402, 129010. [Google Scholar] [CrossRef] [Scilit]
  16. Lange, M.; Azizi-Rad, M.; Dittmann, G.; Lange, D.F.; Orme, A.M.; Schroeter, S.A.; Simon, C.; Gleixner, G. Stability and carbon uptake of the soil microbial community is determined by differences between rhizosphere and bulk soil. Soil Biol. Biochem. 2024, 189, 109280. [Google Scholar] [CrossRef] [Scilit]
  17. Yang, K.; Huang, F.; Yang, W.; Lu, X.; Zhu, Z.; Zhu, J.; Wu, Q.; Xu, X. Integrated Organic-Inorganic Fertilization Enhances Microbial Stoichiometric Homeostasis but Triggers Seasonal Metabolic Trade-Offs in an Alpine Sandy Ecosystem. Microorganisms 2026, 14, 1186. [Google Scholar] [CrossRef] [Scilit]
  18. Quan, R.; Cao, J.; Zhao, H.; Zhang, J.; Ding, W.; Chang, G.; Zhao, X.; Yu, J.; Duan, M.; Zhou, J.; et al. Organic Fertilizer Substitution Regulates Nutrient Availability, Recovery, and Yield in Alpine Rapeseed (Brassica napus L.) Through Soil Enzyme Activity. Plants 2026, 15, 1302. [Google Scholar] [CrossRef] [Scilit]
  19. Chen, J.; van Groenigen, K.J.; Hungate, B.A.; Terrer, C.; van Groenigen, J.; Maestre, F.T.; Ying, S.C.; Luo, Y.; Jørgensen, U.; Sinsabaugh, R.L.; et al. Long-term nitrogen loading alleviates phosphorus limitation in terrestrial ecosystems. Glob. Change Biol. 2020, 26, 5077–5086. [Google Scholar] [CrossRef] [Scilit]
  20. Li, Y.; Niu, S.L.; Yu, G.R. Aggravated phosphorus limitation on biomass production under increasing nitrogen loading: A meta-analysis. Glob. Change Biol. 2016, 22, 934–943. [Google Scholar] [CrossRef] [Scilit]
  21. Wang, R.Z.; Hu, X. Seasonal freeze-thaw processes impact microbial communities of soil aggregates associated with soil pores on the Qinghai-Tibet Plateau. Ecol. Process. 2024, 13, 40. [Google Scholar] [CrossRef] [Scilit]
  22. Xu, B.; Wang, J.N.; Wu, N.; Wu, Y.; Shi, F.S. Seasonal and interannual dynamics of soil microbial biomass and available nitrogen in an alpine meadow in the eastern part of Qinghai-Tibet Plateau, China. Biogeoscience 2018, 15, 567–579. [Google Scholar] [CrossRef] [Scilit]
  23. Ge, X.F.; Zhang, W.J.; Wang, L.J.; Putnis, C.V. Dynamic Phosphorus Interactions at Soil Mineral-Organic Carbon Interfaces: A Critical Review. Environ. Sci. Technol. 2025, 59, 26980–26998. [Google Scholar] [CrossRef] [Scilit]
  24. Spohn, M. Preferential adsorption of nitrogen- and phosphorus-containing organic compounds to minerals in soils: A review. Soil Biol. Biochem. 2024, 194, 109428. [Google Scholar] [CrossRef] [Scilit]
  25. Bonfanti, N.; Clement, J.; Millery-Vigues, A.; Münkemüller, T.; Perrette, Y.; Poulenard, J. Seasonal Mineralisation of Organic Matter in Alpine Soils and Responses to Global Warming: An In Vitro Approach. Eur. J. Soil Sci. 2025, 76, e70050. [Google Scholar] [CrossRef] [Scilit]
  26. Abdalla, K.; Schierling, L.; Sun, Y.; Schuchardt, M.A.; Jentsch, A.; Deola, T.; Wolff, P.; Kiese, R.; Lehndorff, E.; Pausch, J.; et al. Temperature sensitivity of soil respiration declines with climate warming in subalpine and alpine grassland soils. Biogeochemistry 2024, 167, 1453–1467. [Google Scholar] [CrossRef] [Scilit]
  27. Chen, Y.; Qin, W.; Zhang, Q.; Wang, X.; Feng, J.; Han, M.; Hou, Y.; Zhao, H.; Zhang, Z.; He, J.; et al. Whole-soil warming leads to substantial soil carbon emission in an alpine grassland. Nat. Commu. 2024, 15, 4489. [Google Scholar] [CrossRef] [Scilit]
  28. Chen, W.Z.; Li, Y.L.; Peng, Y.; Wang, L.T.; Feng, G. Carbon-phosphorus stoichiometric imbalance induced by manure amendment enhances microbial phosphorus mobilization and crop phosphorus uptake. Geoderma 2026, 466, 117711. [Google Scholar] [CrossRef] [Scilit]
  29. Yu, Y.; Chen, H.; Chen, G.; Su, W.; Hua, M.; Wang, L.; Yan, X.; Wang, S.; Wang, Y. Deciphering the crop-soil-enzyme C:N:P stoichiometry nexus: A 5-year study on manure-induced changes in soil phosphorus transformation and release risk. Sci. Total Environ. 2024, 934, 173226. [Google Scholar] [CrossRef] [Scilit]
  30. Ma, S.; Cao, Y.; Lu, J.; Lu, Z.; Zhu, J.; Zhang, W.; Li, X. Organic amendment increases soil carbon sequestration by altering carbon stabilization pathways within soil aggregates. Soil Till. Res. 2026, 256, 106868. [Google Scholar] [CrossRef] [Scilit]
  31. Wang, Y.; Yao, Y.; Han, B.; Liu, B.; Wang, X.; Ma, L.; Chen, X.; Li, Z. Augmenting the stability of soil aggregate carbon with nutrient management in worldwide croplands. Agr. Ecosyst. Environ. 2024, 370, 109052. [Google Scholar] [CrossRef] [Scilit]
  32. Fetzer, J.; Moiseev, P.; Frossard, E.; Kaiser, K.; Mayer, M.; Gavazov, K.; Hagedorn, F. Plant-soil interactions alter nitrogen and phosphorus dynamics in an advancing subarctic treeline. Glob. Change Biol. 2024, 30, e17200. [Google Scholar] [CrossRef] [Scilit]
  33. Fontaine, S.; Abbadie, L.; Aubert, M.; Barot, S.; Bloor, J.M.G.; Derrien, D.; Duchene, O.; Gross, N.; Henneron, L.; Le Roux, X.; et al. Plant-soil synchrony in nutrient cycles: Learning from ecosystems to design sustainable agrosystems. Glob. Change Biol. 2023, 30, e17034. [Google Scholar] [CrossRef] [Scilit]
  34. Zhu, Y.J.; Archontoulis, S.V.; Castellano, M.J. Quantifying the timing asynchrony between soil nitrogen availability and maize nitrogen uptake. Plant Soil 2025, 513, 2939–2954. [Google Scholar] [CrossRef] [Scilit]
  35. Huang, T.; Zhang, Z.; Sun, R.; Wu, Q.; Zhao, X.; Zhong, X.; Siddique, K.H.M.; Qin, X. Wheat genetic improvement affects the fate of 15N fertilizer, improving nitrogen uptake and utilization. Field Crops Res. 2025, 333, 110078. [Google Scholar] [CrossRef] [Scilit]
  36. Kong, L.A.; Xie, Y.; Hu, L.; Feng, B.; Li, S.D. Remobilization of vegetative nitrogen to developing grain in wheat (Triticum aestivum L.). Field Crops Res. 2016, 196, 134–144. [Google Scholar] [CrossRef] [Scilit]
  37. Monson, R.K.; Rosenstiel, T.N.; Forbis, T.A.; Lipson, D.A.; Jaeger, C.H., III. Nitrogen and carbon storage in alpine plants. Integr. Comp. Biol. 2006, 46, 35–48. [Google Scholar] [CrossRef] [Scilit]
  38. Volder, A.; Bliss, L.C.; Lambers, H. The influence of temperature and nitrogen source on growth and nitrogen uptake of two polar-desert species, Saxifraga caespitosa and Cerastium alpinum. Plant Soil 2000, 227, 139–148. [Google Scholar] [CrossRef] [Scilit]
  39. Kramer, A.W.; Doane, T.A.; Horwath, W.R.; van Kessel, C. Combining fertilizer and organic inputs to synchronize N supply in alternative cropping systems in California. Agr. Ecosyst. Environ. 2002, 91, 233–243. [Google Scholar] [CrossRef] [Scilit]
  40. Freppaz, M.; Williams, B.L.; Edwards, A.C.; Scalenghe, R.; Zanini, E. Labile nitrogen, carbon, and phosphorus pools and nitrogen mineralization and immobilization rates at low temperatures in seasonally snow-covered soils. Biol. Fert. Soils 2007, 43, 519–529. [Google Scholar] [CrossRef] [Scilit]
  41. Makarov, M.I.; Glaser, B.; Zech, W.; Malysheva, T.I.; Bulatnikova, I.V.; Volkov, A.V. Nitrogen dynamics in alpine ecosystems of the northern Caucasus. Plant Soil 2003, 256, 389–402. [Google Scholar] [CrossRef] [Scilit]
  42. Hinsinger, P. Bioavailability of soil inorganic P in the rhizosphere as affected by root-induced chemical changes: A review. Plant Soil 2001, 237, 173–195. [Google Scholar] [CrossRef] [Scilit]
  43. Römheld, V.; Kirkby, E.A. Research on potassium in agriculture: Needs and prospects. Plant Soil 2010, 335, 155–180. [Google Scholar] [CrossRef] [Scilit]
  44. Garcia, K.; Chasman, D.; Roy, S.; Ané, J.M. Physiological Responses and Gene Co-Expression Network of Mycorrhizal Roots under K+ Deprivation. Plant Physiol. 2017, 173, 1811–1823. [Google Scholar] [CrossRef] [Scilit]
  45. Jing, J.; Zhang, F.; Rengel, Z.; Shen, J. Localized fertilization with P plus N elicits an ammonium-dependent enhancement of maize root growth and nutrient uptake. Field Crops Res. 2012, 133, 176–185. [Google Scholar] [CrossRef] [Scilit]
  46. Qi, M.; Cui, R.; Chen, A.; Zhao, X.; Ni, M.; Li, Z.; Yan, H.; Wang, C.; Fu, B. Contrasting mineral-microbial pathways drive phosphorus bioavailability under moderate pH shifts in agricultural soils. Appl. Soil Ecol. 2026, 225, 107186. [Google Scholar] [CrossRef] [Scilit]
  47. Xia, K.; Ouyang, S.; Mo, X.; Gao, Y.; Liu, J.; Wang, Y.; Tian, C.; Wang, X. Soil pH adjustment and the neutralizing effect reshape the rhizobial community in the legume rhizosphere. Soil Till. Res. 2026, 258, 107050. [Google Scholar] [CrossRef] [Scilit]
  48. Xian, Y.; Li, X.; Huang, R.; Liu, J.; Zeng, N.; Li, S.; Wang, C.; Li, B. Long-term organic manure substitution enhances soil carbon stability via organically complexed iron oxides: Evidence from a 12-year field experiment. Geoderma 2026, 469, 117825. [Google Scholar] [CrossRef] [Scilit]
  49. Liu, F.; Qin, S.; Fang, K.; Chen, L.; Peng, Y.; Smith, P.; Yang, Y. Divergent changes in particulate and mineral-associated organic carbon upon permafrost thaw. Nat. Commu. 2022, 13, 5073. [Google Scholar] [CrossRef] [Scilit]
  50. Zhou, Z.; Ren, C.; Wang, C.; Delgado-Baquerizo, M.; Luo, Y.; Luo, Z.; Du, Z.; Zhu, B.; Yang, Y.; Jiao, S.; et al. Global turnover of soil mineral-associated and particulate organic carbon. Nat. Commu. 2024, 15, 5329. [Google Scholar] [CrossRef] [Scilit]
  51. Chen, F.; Wu, Y.; Wang, L.; Zhu, M.; Liu, R.; Liu, X.; Li, G.; Li, M. The fate of exogenous organic matter on ferrihydrite: Critical controls of saturation on carbon and nitrogen sequestration. J. Environ. Manag. 2026, 410, 130088. [Google Scholar] [CrossRef] [Scilit]
  52. Li, Y.; Guo, X.; Xian, Y.; Li, Z.; Fu, H.; Tang, L.; Dai, Y.; Gao, W.; Li, Y.; Zhou, P.; et al. Granulated organic amendment enhances recalcitrant carbon accumulation through soil aggregation in a barren paddy field. J. Integr. Agric. 2026, 25, 1194–1208. [Google Scholar] [CrossRef] [Scilit]
  53. Shen, X.; Kang, Y.; Wang, Y.; Gao, J.; Li, X.; Liu, F.; Li, Q.; Wei, Y.; Cai, H.; Wang, Y.; et al. High-carbon bio-organic fertilizer reshapes soil carbon fractions and aggregate structure while maintaining high carbon stocks in red soil. Front. Microbiol. 2026, 17, 1775969. [Google Scholar] [CrossRef] [Scilit]
  54. Cotrufo, M.F.; Lavallee, J.M.; Six, J.; Lugato, E. The robust concept of mineral-associated organic matter saturation: A letter to Begill et al., 2023. Glob. Change Biol. 2023, 29, 5986–5987. [Google Scholar] [CrossRef] [Scilit]
  55. Gulde, S.; Chung, H.; Amelung, W.; Chang, C.; Six, J. Soil carbon saturation controls labile and stable carbon pool dynamics. Soil Sci. Soc. Am. J. 2008, 72, 605–612. [Google Scholar] [CrossRef] [Scilit]
  56. Fulton-Smith, S.; Even, R.; Cotrufo, M.F. Depth impacts on the aggregate-mediated mechanisms of root carbon stabilization in soil: Trade-off between MAOM and POM pathways. Geoderma 2024, 452, 117078. [Google Scholar] [CrossRef] [Scilit]
  57. Henneron, L.; Balesdent, J.; Alvarez, G.; Barré, P.; Baudin, F.; Basile-Doelsch, I.; Cécillon, L.; Fernandez-Martinez, A.; Hatté, C.; Fontaine, S. Bioenergetic control of soil carbon dynamics across depth. Nat. Commu. 2022, 13, 7676. [Google Scholar] [CrossRef] [Scilit]
  58. Pang, D.; Chen, J.; Jin, M.; Li, H.; Luo, Y.; Li, W.; Chang, Y.; Li, Y.; Wang, Z. Changes in soil micro- and macro-aggregate associated carbon storage following straw incorporation. CATENA 2020, 190, 104555. [Google Scholar] [CrossRef] [Scilit]
  59. Xiao, Q.; Zhang, W.; Wu, L.; Huang, Y.; Wang, J.; Cai, Z.; Li, D.; Chen, X.; Ge, T.; Xu, M.; et al. Sensitivity of Soil Organic Matter Priming to Warming Depends on Diurnal Temperature Cycle. J. Agric. Food Chem. 2025, 73, 19993–20003. [Google Scholar] [CrossRef] [Scilit]
  60. Matus, F.J.; Paz-Pellat, F.; Covaleda, S.; Etchevers, J.D.; Hidalgo, C.; Báez, A. Upper limit of mineral-associated organic carbon in temperate and sub-tropical soils: How far is it? Geoderma Reg. 2024, 37, e00811. [Google Scholar] [CrossRef] [Scilit]
  61. Wu, Y.; Peñuelas, J.; Deng, M.; Pan, S.; Zhang, X.; Zhang, Z.; Liu, L. Elevational changes in vegetation and soil geochemistry drive thresholds in bulk soil carbon and its key fractions. J. Ecol. 2025, 113, 1985–1996. [Google Scholar] [CrossRef] [Scilit]
  62. Kuzyakov, Y.; Blagodatskaya, E. Microbial hotspots and hot moments in soil: Concept & review. Soil Biol. Biochem. 2015, 83, 184–199. [Google Scholar] [CrossRef] [Scilit]
  63. Zhalnina, K.; Louie, K.B.; Hao, Z.; Mansoori, N.; da Rocha, U.N.; Shi, S.; Cho, H.; Karaoz, U.; Loqué, D.; Bowen, B.P.; et al. Dynamic root exudate chemistry and microbial substrate preferences drive patterns in rhizosphere microbial community assembly. Nat. Microbiol. 2018, 3, 470–480. [Google Scholar] [CrossRef] [Scilit]
  64. Shao, G.; Xu, Y.; Zhou, J.; Tian, P.; Ai, J.; Yang, Y.; Zamanian, K.; Zeng, Z.; Zang, H. Enhanced soil organic carbon stability in rhizosphere through manure application. Soil Till. Res. 2024, 244, 106223. [Google Scholar] [CrossRef] [Scilit]
  65. Zhu, Z.; Chen, S.; Xie, Q.; Wen, L.; Wang, K.; Li, D. Twelve-year high manure input enhances soil organic carbon stability and ecosystem multifunctionality in a karst agroecosystem. Plant Soil 2026, 521, 931–946. [Google Scholar] [CrossRef] [Scilit]
  66. Joshi, S.R.; Tfaily, M.M.; Young, R.P.; McNear, D.H., Jr. Root exudates induced coupled carbon and phosphorus cycling in a soil with low phosphorus availability. Plant Soil 2024, 498, 371–390. [Google Scholar] [CrossRef] [Scilit]
  67. Wang, J.; Zhang, J.B.; Müller, C.; Cai, Z.C. Temperature sensitivity of gross N transformation rates in an alpine meadow on the Qinghai-Tibetan Plateau. J. Soil Sediment. 2017, 17, 423–431. [Google Scholar] [CrossRef] [Scilit]
  68. Fu, X.; Ma, Y.; Wang, D.; Zhan, L.; Guo, Z.; Fan, K.; Yang, T.; Chu, H. Long-term chemical fertilization results in a loss of temporal dynamics of diazotrophic communities in the wheat rhizosphere. Sci. Total Environ. 2023, 875, 162663. [Google Scholar] [CrossRef] [Scilit]
  69. Li, S.; Wei, B.; Sun, K.; Cui, Y.; Wang, Y.; Li, H.; Zhou, C.; Wang, Z.; Zhang, Z.; Yang, H.; et al. Root-driven phosphorus mobilization in Chinese cabbage: Rhizosphere adaptations and impacts on soil phosphorus dynamics. Plant Physiol. Biochem. 2025, 229, 110445. [Google Scholar] [CrossRef] [Scilit]
  70. Shabtai, I.A.; Hafner, B.D.; Schweizer, S.A.; Höschen, C.; Possinger, A.; Lehmann, J.; Bauerle, T. Root exudates simultaneously form and disrupt soil organo-mineral associations. Commun. Earth Environ. 2024, 5, 699. [Google Scholar] [CrossRef] [Scilit]
  71. Liao, C.; Zhai, D.P.; Cheng, X.L. Warming inhibits new soil organic carbon formation with higher bacterial necromass contribution. J. Plant Ecol. 2025, 18, rtaf005. [Google Scholar] [CrossRef] [Scilit]
  72. Wang, R.Z.; Hu, X. Freeze-thaw processes correspond to the protection-loss of soil organic carbon through regulating pore structure of aggregates in alpine ecosystems. Soil 2024, 10, 859–871. [Google Scholar] [CrossRef] [Scilit]
  73. Tan, Q.; Zhang, P.; Li, N.; Wang, G.; Pang, W.; Zhang, H.; Zhang, M.; Wang, Q.; Yin, H. Conservative roots confer a larger microbial carbon pump efficacy than acquisitive roots by regulating microbial life-history strategy. Funct. Ecol. 2026, 40, 2617–2627. [Google Scholar] [CrossRef] [Scilit]
  74. Mo, C.Y.; Jiang, Z.H.; Chen, P.F.; Cui, H.; Yang, J.P. Microbial metabolic efficiency functions as a mediator to regulate rhizosphere priming effects. Sci. Total Environ. 2021, 759, 143488. [Google Scholar] [CrossRef] [Scilit]
  75. Neff, J.C.; Townsend, A.R.; Gleixner, G.; Lehman, S.J.; Turnbull, J.; Bowman, W.D. Variable effects of nitrogen additions on the stability and turnover of soil carbon. Nature 2002, 419, 915–917. [Google Scholar] [CrossRef] [Scilit]
  76. Favaro, A.; Singh, B.; Warren, C.; Dijkstra, F.A. Differences between priming and rhizosphere priming effects: Concepts and mechanisms. Soil Biol. Biochem. 2025, 205, 109769. [Google Scholar] [CrossRef] [Scilit]
  77. Mooshammer, M.; Wanek, W.; Zechmeister-Boltenstern, S.; Richter, A. Stoichiometric imbalances between terrestrial decomposer communities and their resources: Mechanisms and implications of microbial adaptations to their resources. Front. Microbiol. 2014, 5, 22. [Google Scholar] [CrossRef] [Scilit]
  78. Zechmeister-Boltenstern, S.; Keiblinger, K.M.; Mooshammer, M.; Peñuelas, J.; Richter, A.; Sardans, J.; Wanek, W. The application of ecological stoichiometry to plant-microbial-soil organic matter transformations. Ecol. Monogr. 2015, 85, 133–155. [Google Scholar] [CrossRef] [Scilit]
Figure 1. Soil nutrient contents and pH in bulk soils (0–10 cm and 10–20 cm) and rhizosphere soil (0–10 cm) at booting, filling, and maturity stages under different fertilization treatments. Bars represent means ± standard error (n = 3). Different lowercase letters indicate significant differences among treatments within the same growth stage and same soil compartment (Duncan’s multiple comparison test, α = 0.05). CK, control; NPK, synthetic fertilizer; CM, cattle manure.
Agronomy 16 01980 g001
Figure 2. Temporal stability index of soil nutrients and stoichiometric ratios across different soil layers and treatments. TSI was calculated as the reciprocal of the coefficient of variation across three growth stages. Bars represent means ± standard error (n = 3). Different lowercase letters indicate significant differences among treatments within the same indicator (Duncan’s multiple comparison test, α = 0.05). CK, control; NPK, synthetic fertilizer; CM, cattle manure. Indicators shown: 0–10 cm SOC stability, rhizosphere SOC stability, 0–10 cm TP stability, rhizosphere AK stability, rhizosphere C:P stability, rhizosphere C:K stability, and 10–20 cm P:K stability.
Agronomy 16 01980 g002
Figure 3. Paired t-test comparing nutrient contents and stoichiometric ratios between rhizosphere soil and corresponding 0–10 cm bulk soil at booting, filling, and maturity stages under different fertilization treatments. The panels show: soil organic carbon (SOC), total nitrogen (TN), total phosphorus (TP), total potassium (TK), ammonium nitrogen (NH4+-N), nitrate nitrogen (NO3−-N), available phosphorus (AP), available potassium (AK), pH, C:N ratio, C:P ratio, C:K ratio, N:P ratio, N:K ratio, and P:K ratio. Bars represent means ± standard error (n = 3). Asterisks indicate significant differences between rhizosphere soil and the corresponding 0–10 cm bulk soil within the same treatment and growth stage (paired t-test): * p < 0.05, ** p < 0.01, and *** p < 0.001.
Agronomy 16 01980 g003
Figure 4. Paired t-test comparing temporal stability of nitrate nitrogen (NO3−-N) between rhizosphere soil and corresponding 0–10 cm bulk soil under different fertilization treatments. Bars represent means ± standard error (n = 3). Asterisk indicate significant differences in temporal stability between rhizosphere soil and the corresponding 0–10 cm bulk soil within the same treatment (paired t-test): * p < 0.05.
Agronomy 16 01980 g004
Figure 5. Rhizosphere enrichment effects (RE) for soil nutrients and stoichiometric ratios at booting, filling, and maturity stages under different fertilization treatments. RE was calculated as the ratio of rhizosphere soil value to corresponding 0–10 cm bulk soil value. RE > 1 indicates positive rhizosphere effect (enrichment); RE < 1 indicates negative rhizosphere effect (depletion). Bars represent means ± standard error (n = 3). Different lowercase letters indicate significant differences among treatments within the same growth stage and same indicator (Duncan’s multiple comparison test, α = 0.05). CK, control; NPK, synthetic fertilizer; CM, cattle manure.
Agronomy 16 01980 g005
Figure 6. Rhizosphere enrichment effects (RE) for temporal stability of soil nutrients, pH, and stoichiometric ratios under different fertilization treatments. RE was calculated as the ratio of rhizosphere soil temporal stability index (TSI) to corresponding 0–10 cm bulk soil TSI. RE > 1 indicates that rhizosphere temporal stability is higher than bulk soil; RE < 1 indicates that rhizosphere temporal stability is lower than bulk soil. Bars represent means ± standard error (n = 3). Different lowercase letters indicate significant differences among treatments within the same indicator (Duncan’s multiple comparison test, α = 0.05). CK, control; NPK, synthetic fertilizer; CM, cattle manure.
Agronomy 16 01980 g006
Disclaimer/Publisher’s Note: The statements, opinions and data contained in all publications are solely those of the individual author(s) and contributor(s) and not of MDPI and/or the editor(s). MDPI and/or the editor(s) disclaim responsibility for any injury to people or property resulting from any ideas, methods, instructions or products referred to in the content.