Article

Cytological and Transcriptomic Profiling Reveals the Developmental Basis of Stem Diameter Variation in Luffa


1
Guangdong Key Laboratory for New Technology Research of Vegetables, Vegetable Research Institute, Guangdong Academy of Agricultural Sciences, Guangzhou 510640, China
2
Guangzhou Academy of Agricultural and Rural Sciences, Guangzhou 510335, China
3
Ping An Property & Casualty Insurance Company of China, Ltd., Guangdong Branch, Guangzhou 510620, China
*
Authors to whom correspondence should be addressed.
Agronomy 2026, 16(17), 1740; https://doi.org/10.3390/agronomy16171740
Submission received: 13 July 2026 / Revised: 21 August 2026 / Accepted: 28 August 2026 / Published: 7 September 2026
(This article belongs to the Section Crop Breeding and Genetics)

Abstract

Stem diameter is an important agronomic trait determining plant architecture, lodging resistance and yield formation, yet its cytological and molecular mechanisms in the major cucurbit crop Luffa remain largely unclear. Herein, two Luffa inbred lines, S1174 (Luffa acutangula, thin stem) and P93075 (Luffa cylindrica, thick stem), were analyzed. Dynamic phenotyping uncovered a sigmoidal growth pattern with three key developmental stages: initiation (0 d), rapid growth (6 d), and maturation (20 d), during which P93075 consistently exhibited a significantly larger stem diameter than S1174 from 6 d onward. Anatomical analysis showed that P93075 displayed greater parenchyma cell size and vascular bundle area than S1174, suggesting that stem diameter variation is closely associated with parenchyma cell expansion and vascular bundle enlargement. Transcriptome profiling further identified 2611 differentially expressed genes (DEGs), mainly enriched in cell wall organization, phenylpropanoid biosynthesis, and hormone signaling pathways. Through temporal expression patterns of shared DEGs across developmental phases and co-expression network analysis, LacEXT3, encoding a cell wall extensin protein, was prioritized as a promising candidate gene associated with stem radial growth. Consistent with its markedly higher expression in P93075, heterologous overexpression of LacEXT3 in Arabidopsis resulted in increased stem diameter accompanied by reduced plant height. Overall, this study provides new insights into the developmental, cytological, and transcriptomic landscape underlying stem diameter variation in Luffa and offers a valuable resource for future investigation of the molecular mechanisms of stem thickening.

1. Introduction

Luffa is a widely cultivated cucurbit with substantial nutritional and economic value, holding a prominent position in the tropical and subtropical vegetable production systems. Stem diameter, as a key architectural trait, directly determines plant mechanical strength, lodging resistance, and nutrient uptake and transport, thereby influencing overall growth and yield formation [1,2]. However, the cytological basis, core functional genes, and molecular regulatory mechanisms underlying radial stem development in Luffa remain largely unknown, which severely constrains the targeted breeding of Luffa germplasm with improved ideotype-based architecture.
The plant stem is mainly composed of the epidermis, cortex, vascular bundles, and pith. Its morphogenesis depends on continuous cell division and differentiation in the shoot apical meristem. In most dicotyledonous plants, primary growth is followed by secondary growth, which promotes radial stem thickening [3]. Substantial progress has been made in model plants and woody species. For instance, the WUSCHEL (WUS)-CLAVATA (CLV) feedback loop maintains homeostasis between cell division and differentiation in the shoot apical meristem [4,5,6,7]. Hormone signaling pathways, particularly auxin, gibberellin, and cytokinin, are also central regulators of both primary and secondary stem growth [8,9,10]. Cell-cycle genes promote cambial cell differentiation and increase xylem cell number, thus enhancing stem thickness [11,12]. Moreover, transcription factors such as AtTZF2/3 and MYB61-STRONG2 positively regulate stem diameter and yield formation [2,13]. Collectively, these studies provide a conceptual framework for understanding the molecular mechanisms underlying stem development in plants and facilitate further investigation of stem development in Luffa.
The cell wall is a dynamic structure that defines cell morphology and mechanical properties, and its biosynthesis and remodeling are tightly associated with stem thickening [14]. Extensins, members of the hydroxyproline-rich glycoprotein family, are essential components involved in cell wall assembly, cell division and expansion, and mechanical reinforcement [15,16,17]. This gene family has been extensively characterized in different plant species [15,17,18,19]. In Arabidopsis, knockout of extensin genes can be lethal, resulting in defective cell wall formation and impaired root and stem growth [20], whereas overexpression of the extensin gene AtEXT1 increases stem diameter and reduces plant height [21]. In rice, OsEXTL has been shown to suppress internode cell elongation and promote cell wall thickening, leading to increased stem diameter, reduced plant height, and enhanced lodging resistance without yield penalty [22]. In Populus tomentosa, the PtoBPC1-PtoP4H9 module, consisting of the BASIC PENTACYSTEINE transcription factor PtoBPC1 and the prolyl 4-hydroxylase PtoP4H9, has been shown to regulate stem radial growth through post-translational modification of cell wall extensins [23]. These findings highlight extensins as key regulators of plant architecture and stem development, yet their functions in Luffa stem thickening remain to be elucidated.
In this study, two high-generation Luffa inbred lines with contrasting stem diameters, S1174 (Luffa acutangula) and P93075 (Luffa cylindrica), were selected to investigate the developmental basis of stem radial growth. Specifically, we aimed to (i) characterize the dynamic changes in stem diameter and identify key developmental stages, (ii) elucidate the cytological basis underlying stem diameter variation using anatomical analysis, (iii) identify candidate genes and regulatory pathways associated with stem thickening based on transcriptomic profiling and co-expression network analysis, and (iv) evaluate the contribution of the candidate gene LacEXT3 through Arabidopsis heterologous overexpression. This study provides insights into the developmental, cytological, and molecular basis underlying stem diameter variation in Luffa and offers valuable genetic resources for future improvement of stem-related traits.

2. Materials and Methods

2.1. Materials and Field Trial

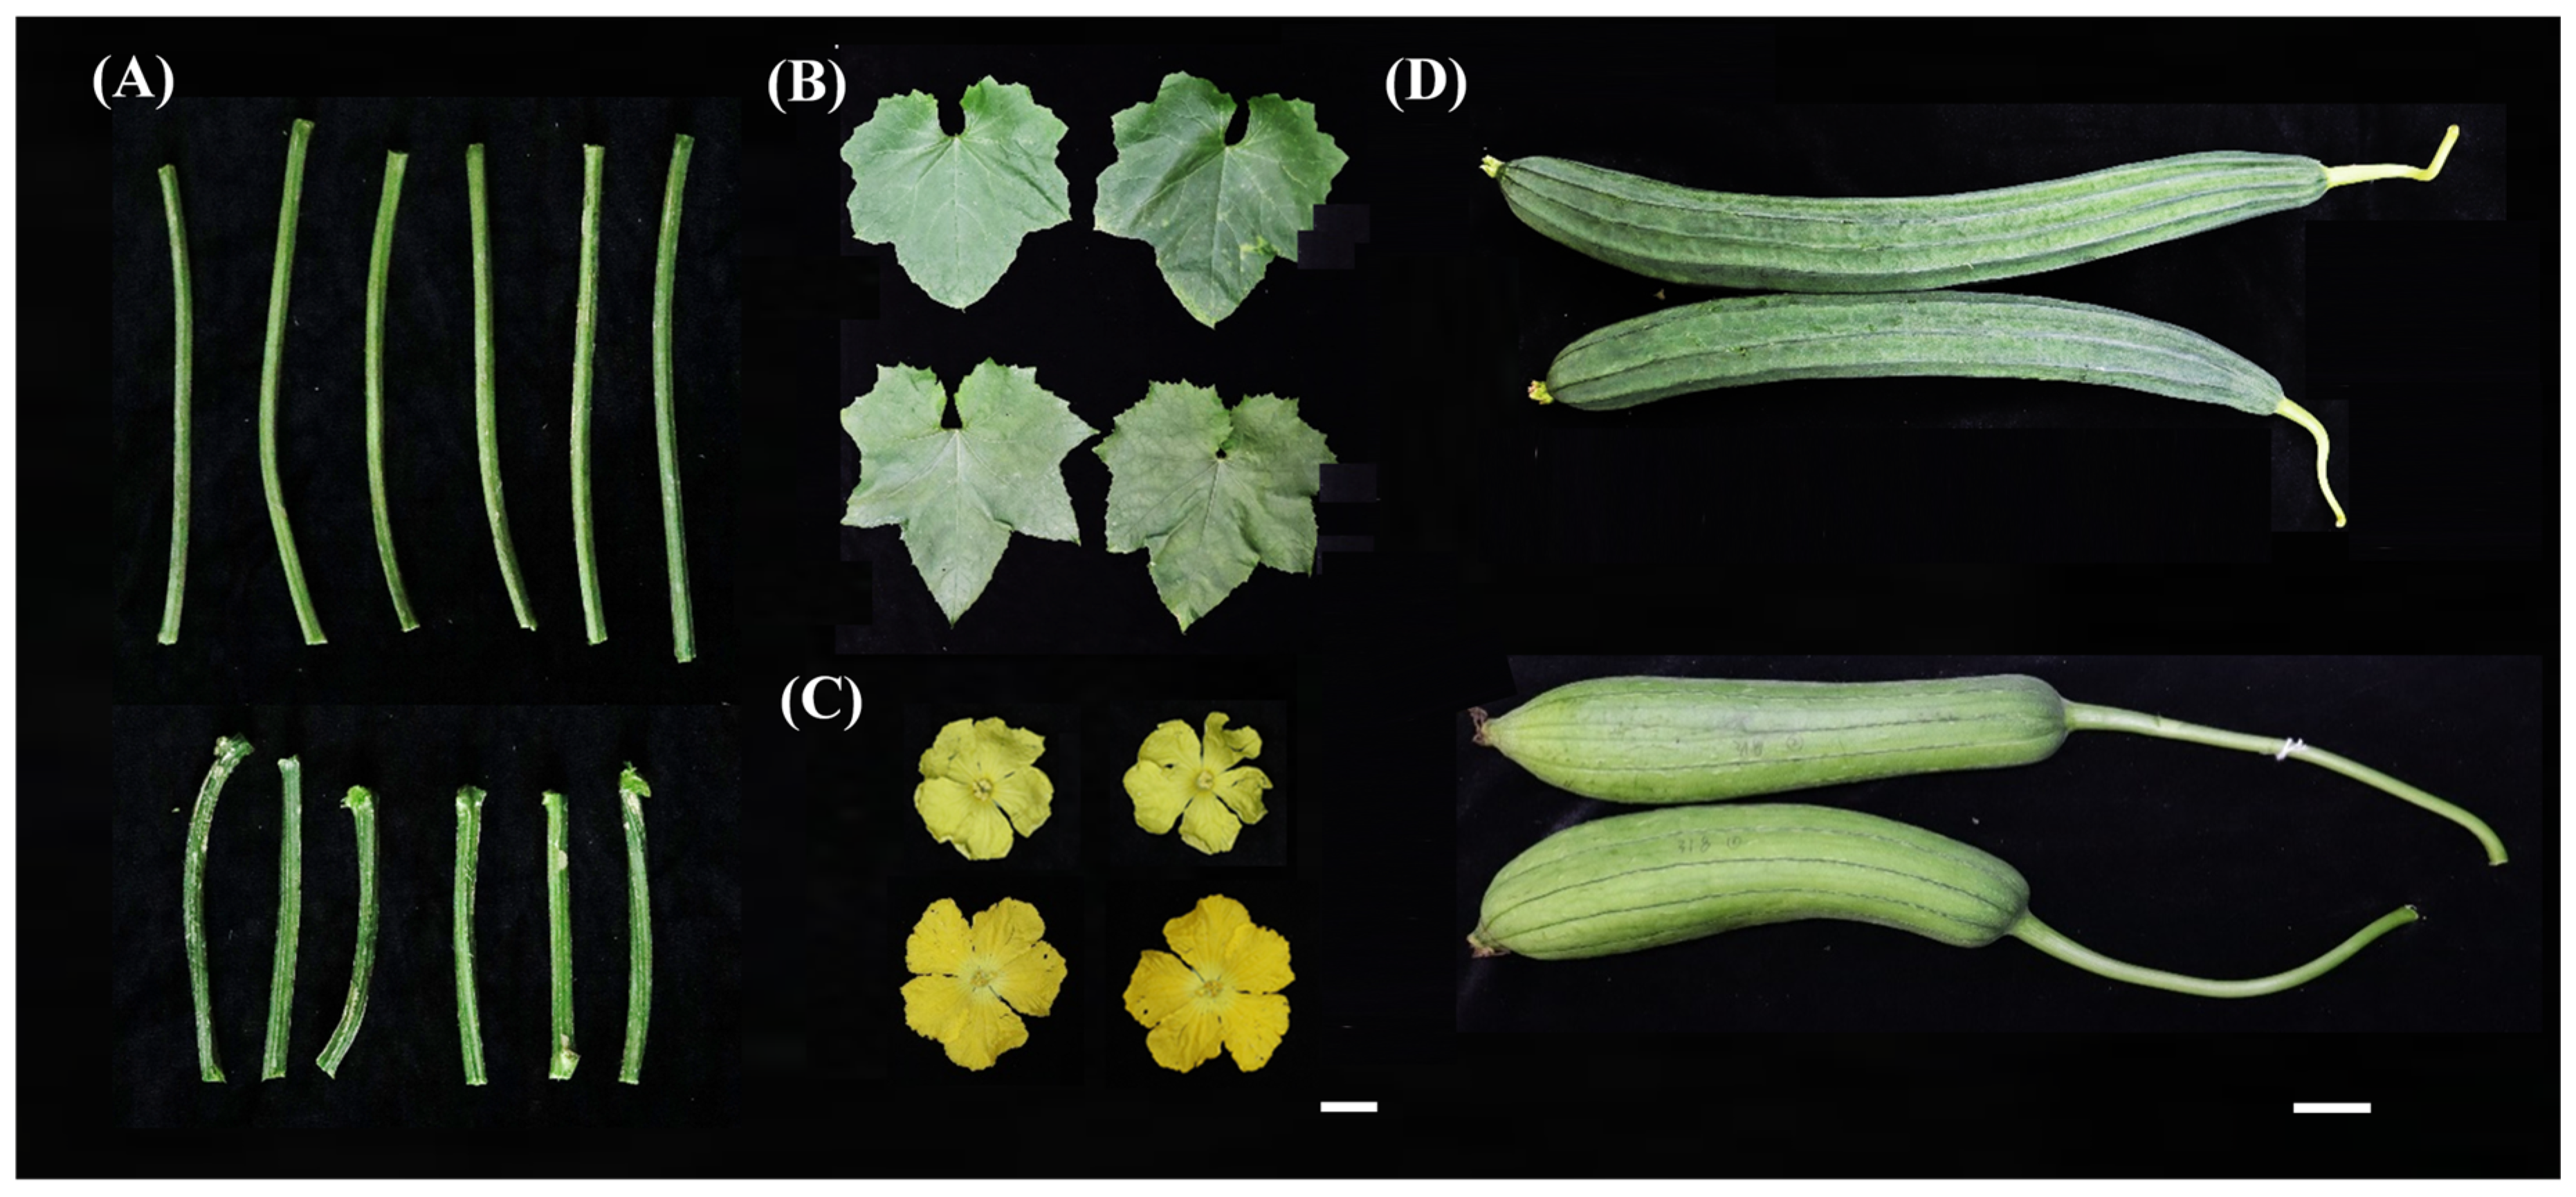
Two high-generation Luffa inbred lines, S1174 (Luffa acutangula) and P93075 (Luffa cylindrica), were used as the experimental materials. P93075 possesses thick stems, deeply incised leaves, large yellowish-dark flowers, and glabrous, cylindrical fruits. In contrast, S1174 displays slender stems, minute light-yellow flowers, and fruits with prominent ridges (Figure 1). Field experiments were conducted at Baiyun Field Trial Base of Guangdong Academy of Agricultural Sciences (23°15′ N, 113°27′ E) during the spring of 2023. The two genotypes were grown under natural field conditions using standard agronomic management. Each genotype was planted in six rows with 20 individuals per row. Rows were 8 m long with a spacing of 0.4 m.

2.2. Phenotypic Investigation and Sampling Strategy

Stem diameter measurements were initiated after full development of the seventh internode. When the eighth internode reached approximately 5 mm in length, this stage was designated as 0 d, marking the onset of stem thickening. Thereafter, stem diameter was recorded every two days in five biological replicates for each inbred line until it reached a plateau. Based on dynamic growth curves, the representative developmental stages were determined. At each key stage, the eighth internodes were collected from both genotypes with three biological replicates for subsequent anatomical, transcriptomic and quantitative real-time PCR (qRT-PCR) analyses.

2.3. Histological Analysis

All chemical reagents and solvents used in this experiment were purchased from Servicebio (Wuhan, China). Stem segments were immediately fixed in Formalin–Acetic acid–alcohol (FAA) solution (70% ethanol-based) for at least 24 h, and dehydrated through a graded ethanol series (50%, 75%, 80%, 90%, 95%, and 100%), with each step lasting 45–60 min. The tissues were then cleared in a 1:1 (v/v) xylene–ethanol solution for 15–30 min, followed by two incubations in xylene for 30 min each. Subsequently, they were infiltrated with a 1:1 (v/v) xylene–paraffin mixture for 40–60 min, repeated once. After paraffin embedding, sections (5–10 μm) were cut and mounted on slides. For histological staining, sections were deparaffinized, rehydrated through a reverse ethanol series, and stained with Safranin O and Fast Green FCF. Images were captured using a light microscope (Servicebio, Wuhan, China). For anatomical analysis, three biological replicates were examined for each genotype at each developmental stage. Parenchyma cell area and vascular bundle area were quantified using representative transverse sections, with at least 20 randomly selected parenchyma cells and 10 vascular bundles measured for each biological replicate.

2.4. Transcriptome Sequencing and Analysis

Total RNA was extracted using the TransZol Up Plus RNA Kit (TransGen Biotech, Beijing, China) and RNA quality was assessed by an Agilent 2100 Bioanalyzer (Agilent Technologies, Santa Clara, CA, USA). Sequencing libraries were constructed using the NEBNext® Ultra™ RNA Library Prep Kit for Illumina® (New England Biolabs, Ipswich, MA, USA) and sequenced on the Illumina HiSeq™ 4000 platform (Illumina, San Diego, CA, USA) with 150 bp paired-end reads. The clean reads were aligned to the S1174 reference genome (Unpublished data) using HISAT2 v2.0.5 [24]. Gene-level raw read counts were generated by featureCounts v1.5.0-p3 [25] and used for DEG analysis with DESeq2 v1.20.0 [26], with thresholds of |log2(FC)| ≥ 1 and adjusted p value (padj) ≤ 0.05. Fragments per kilobase of exon model per million mapped reads (FPKM) values were calculated using RSEM v1.3.1 [27] for gene expression quantification and visualization.
Hierarchical clustering and k-means clustering were performed in R 4.1.2 to classify genes based on their temporal expression patterns. Hierarchical clustering of the target DEGs was performed using the pheatmap package with Euclidean distance. K-means clustering was conducted using the kmeans function with k = 4 to group genes with similar expression trajectories across developmental stages.
Weighted gene co-expression network analysis (WGCNA) was performed using the WGCNA package in R 4.1.2. Genes with FPKM > 1 in at least 20% of samples were retained, and the expression matrix was normalized using the variance-stabilizing transformation function in DESeq2 v1.20.0. The most variable genes were selected for network construction. A soft-thresholding power (β) was determined using the pickSoftThreshold function based on the scale-free topology criterion (R2 > 0.80). A signed co-expression network was constructed based on Pearson correlation, and modules were identified using the blockwiseModules function. Module–trait relationships were evaluated by correlating module eigengenes with stem diameter phenotypes.

2.5. qRT-PCR Assay

To validate RNA-seq results using randomly selected genes and analyze the expression patterns of LacEXT3 in Luffa and Arabidopsis transgenic lines, qRT-PCR analysis was performed. High-quality RNA was extracted as above and reverse-transcribed into complementary DNA (cDNA) using the Transcript® One-Step gDNA Removal and cDNA Synthesis SuperMix (TransGen Biotech, Beijing, China). qRT-PCR was conducted using TB Green (Takara, Kusatsu, Japan) with three biological and technical replicates per sample. Luffa 18S rRNA was used as the internal reference gene, and relative expression levels were calculated by the 2−ΔΔct method [28]. Primers are listed in Table S1.

2.6. Phylogenetic Tree Construction of Extensin Proteins

The amino acid sequences of extensin proteins from Luffa were identified from the S1174 reference genome, whereas homologous extensin sequences from Arabidopsis thaliana, rice, and cucumber were retrieved from public databases. Multiple sequence alignment was performed using ClustalW in MEGA v7.0.26. A phylogenetic tree was constructed using the neighbor-joining method with 1000 bootstrap replicates and visualized using iTOL.

2.7. Arabidopsis Genetic Transformation

The coding sequence of the candidate gene was amplified from P93075 cDNA using specific primers (Table S1) and cloned into the BG plant-expression vector (Bioground, Chongqing, China) containing a multiple cloning site under the control of the CaMV 35S promoter via homologous recombination. After sequence verification, the recombinant vector was introduced into Agrobacterium tumefaciens strain GV3101 (Huayueyang Biotechnology, Beijing, China) and transformed into Arabidopsis ecotype Col-0 using the floral dip method. Transgenic plants were selected on medium containing kanamycin (Sangon Biotech, Shanghai, China). Following selection, three independent homozygous T3 LacEXT3-overexpression lines were obtained and confirmed by RT-PCR and qRT-PCR. qRT-PCR analysis was performed using three biological replicates for each sample. AtACT2 was used as the internal reference gene, and the primers were listed in Table S1. These three overexpression lines were subsequently used for phenotypic characterization. Stem diameter and plant height were measured using 10 independent plants for each genotype.

2.8. Data Analysis

Statistical analyses were performed using SPSS 27.0. Two-tailed Student’s t-tests were used for comparisons between two groups, whereas one-way analysis of variance (ANOVA) followed by Tukey’s multiple-comparison test was used for comparisons among multiple groups. Data are presented as mean ± SE, and differences were considered statistically significant at p < 0.05. Figures were plotted in R 4.1.2.

3. Results

3.1. Dynamic Growth Pattern and Determination of Key Developmental Stages

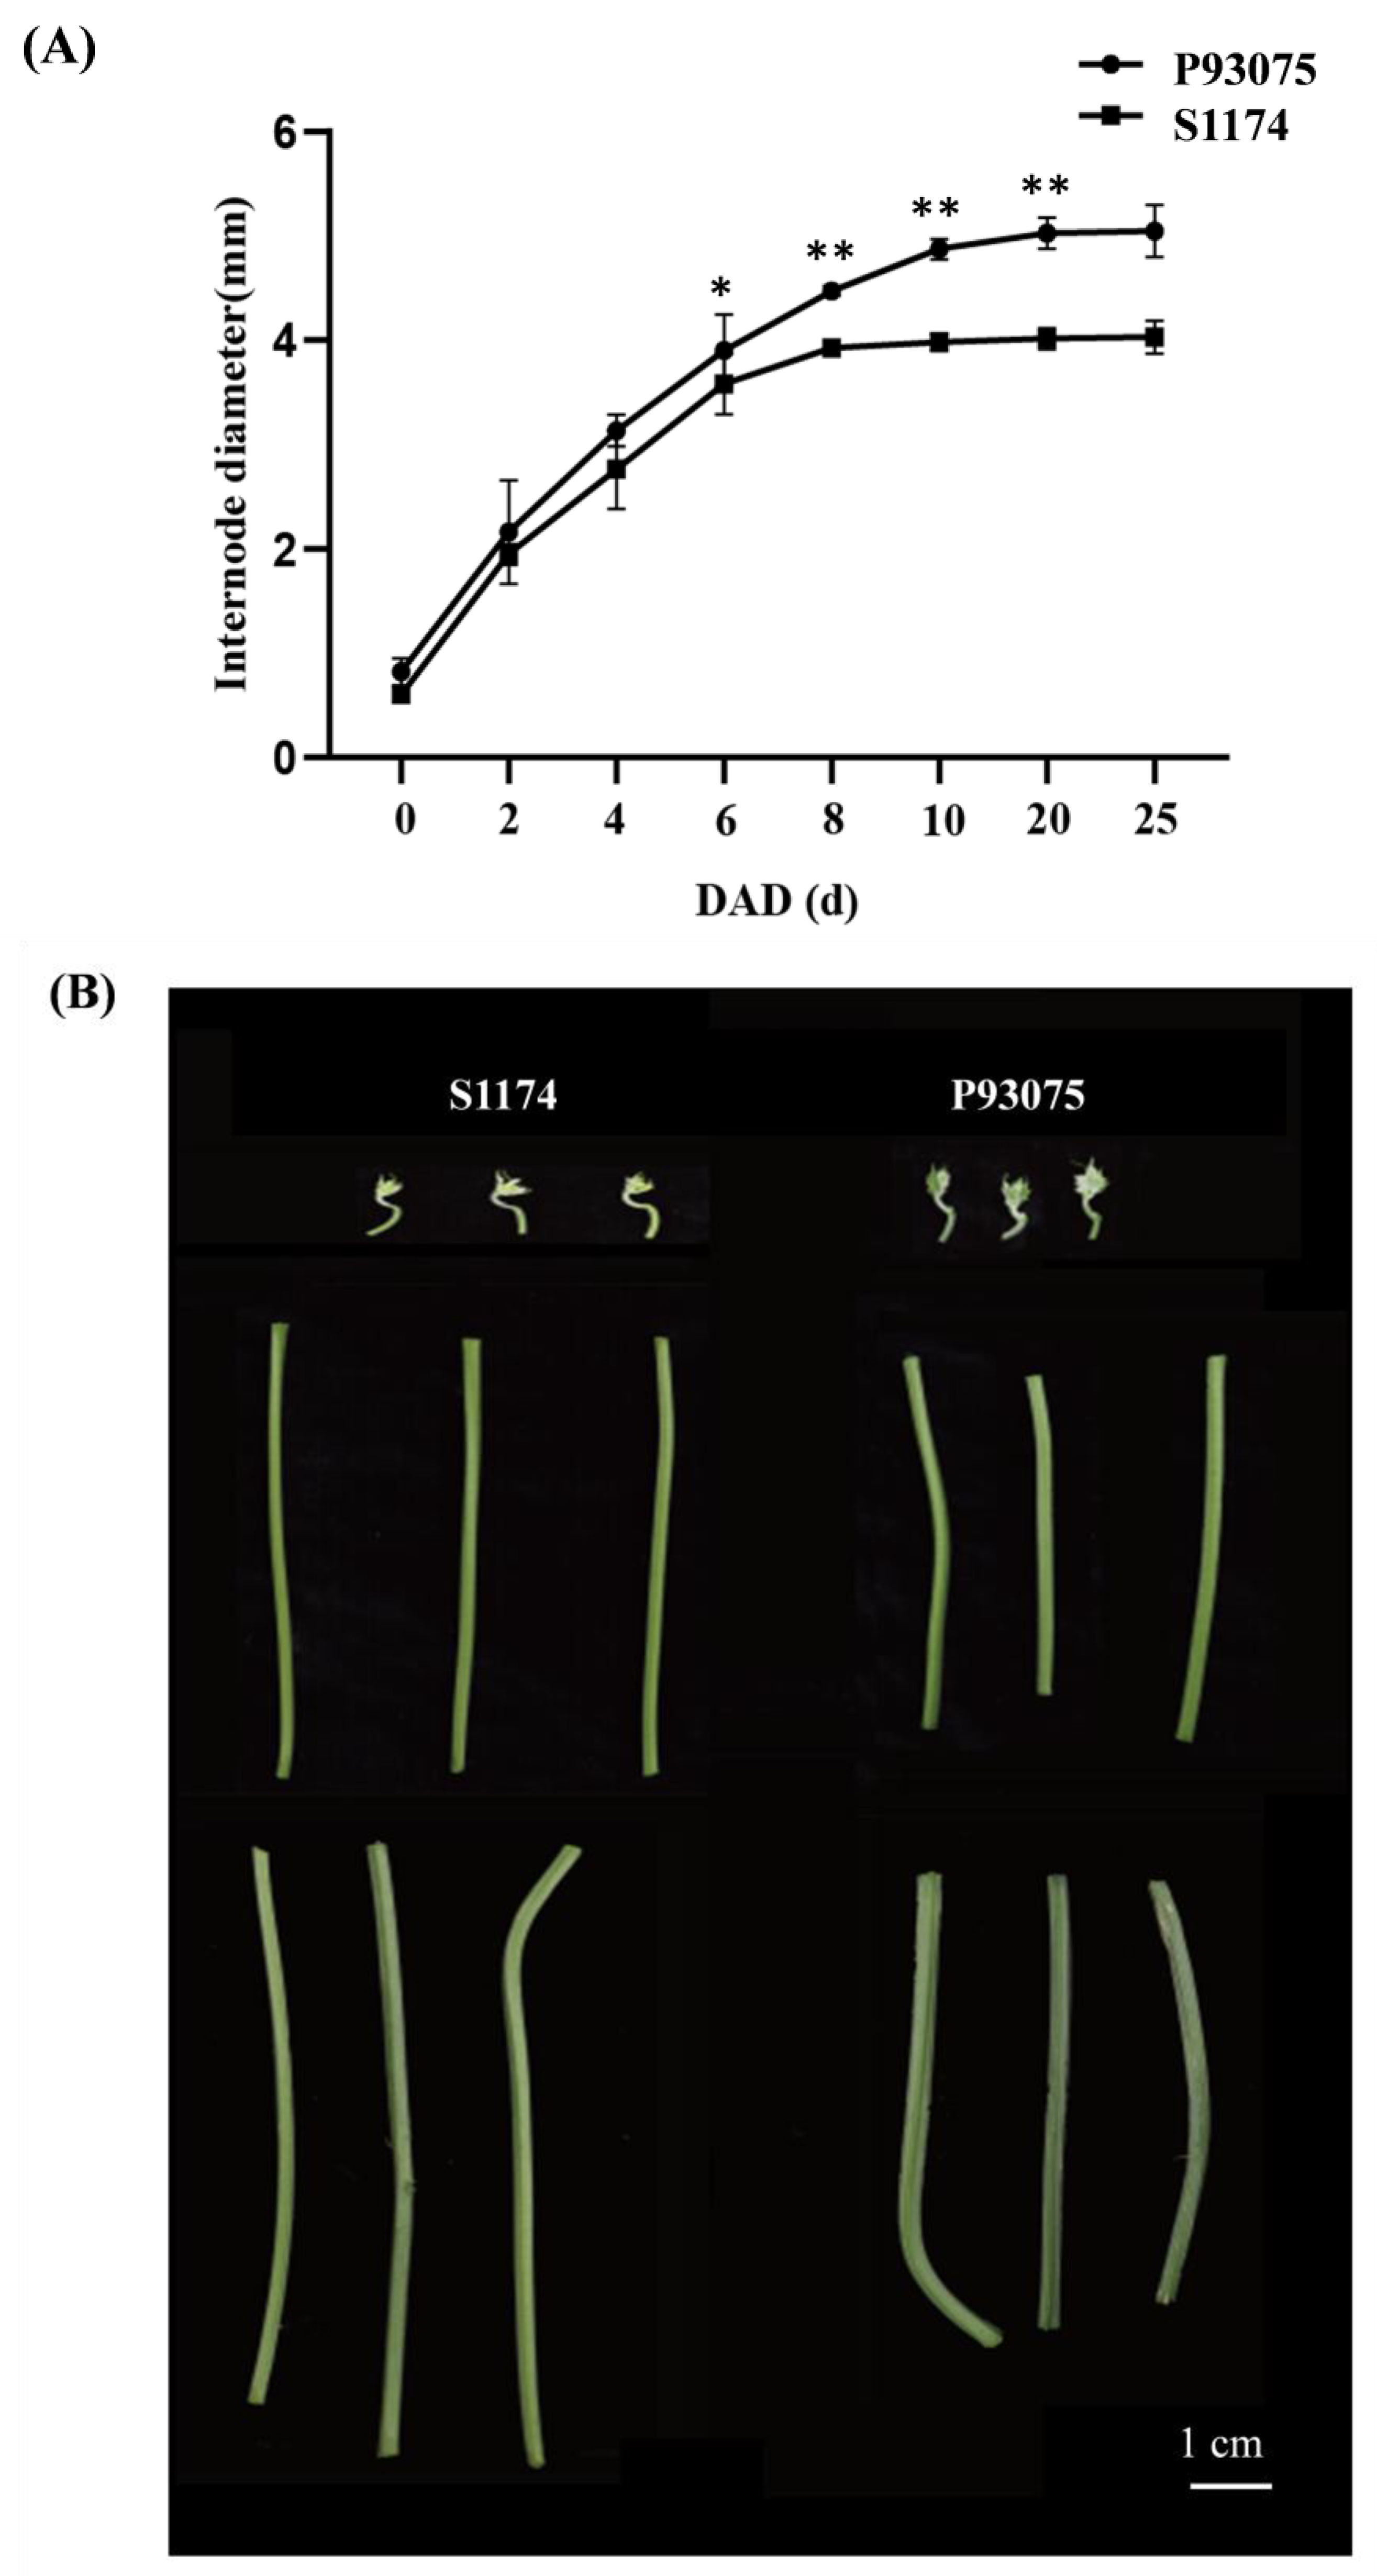
To investigate stem radial growth in Luffa, the eighth internode diameter was monitored throughout development in two inbred lines with contrasting stem thickness, S1174 and P93075 (Figure 2A). Stem diameter in both lines followed a typical S-shaped growth pattern, characterized by an initial slow phase followed by a rapid expansion phase and a plateau. The most pronounced increase occurred between 2 d and 6 d, after which growth gradually stabilized, reaching a maximum at approximately 20 d. Comparative analysis indicated that P93075 consistently had a larger stem diameter than S1174 throughout development, with the difference becoming statistically significant at 6 d (p < 0.05), and further increasing at 20 d (p < 0.01), when radial growth was fully established. Accordingly, three key developmental stages were defined: 0 d (Initiation, stage I), 6 d (Rapid growth, stage II), and 20 d (Maturation and growth plateau, stage III) (Figure 2A,B), which were used for subsequent cytological and transcriptomic analyses.

3.2. Anatomical Basis of Stem Radial Growth in Luffa

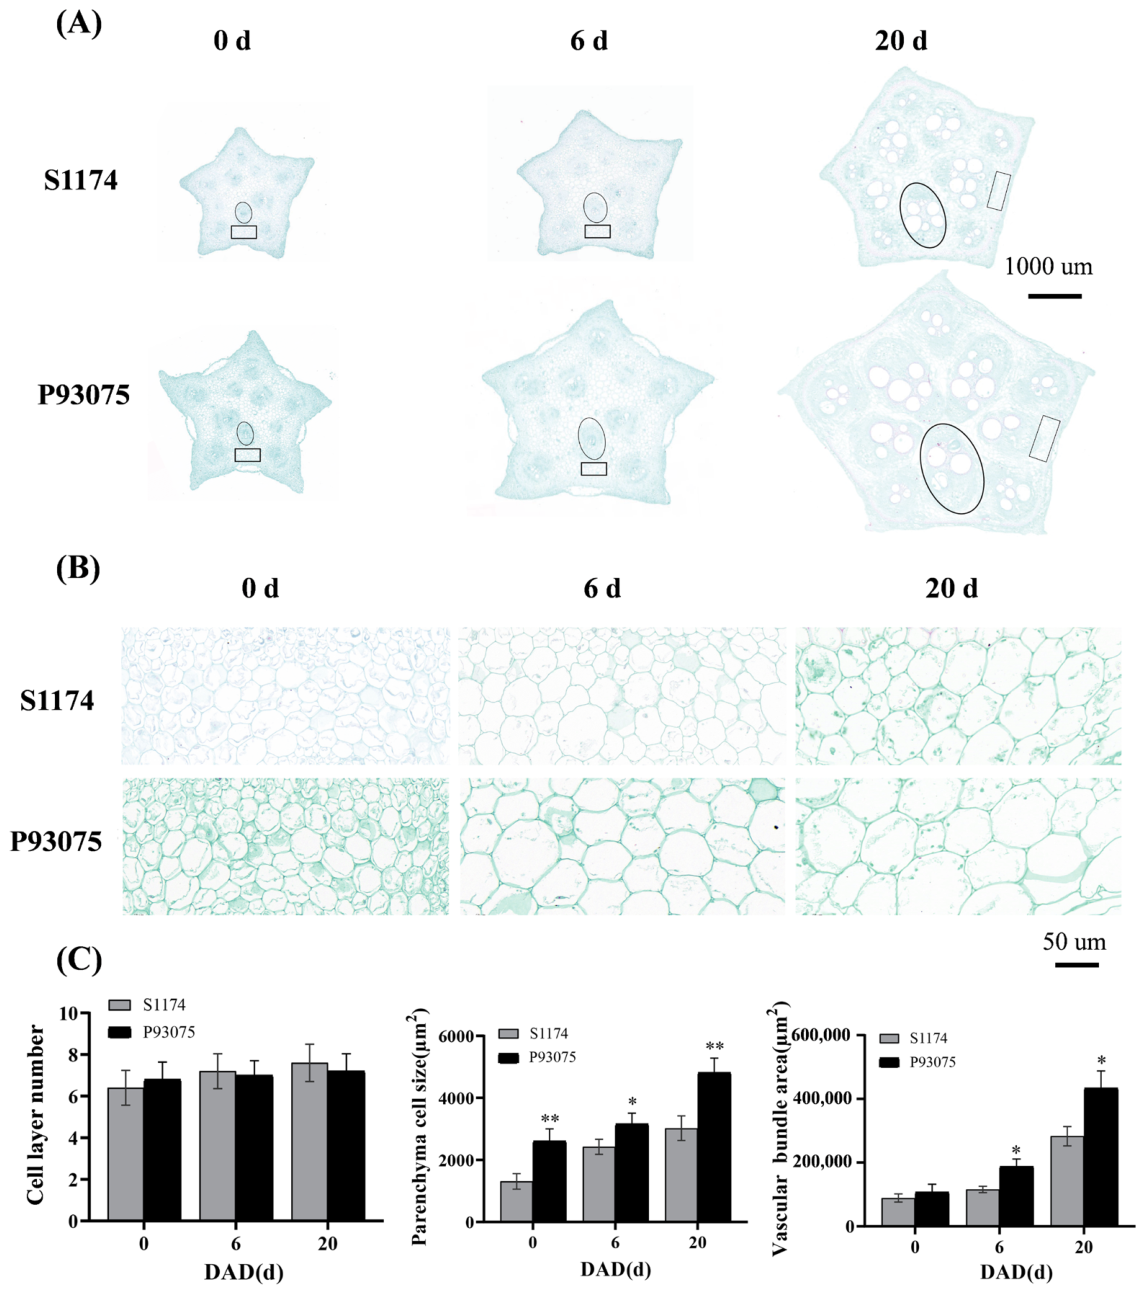
To examine cytological differences between the thin-stemmed line S1174 and the thick-stemmed line P93075, transverse paraffin sections of the eighth internode were prepared at three key developmental stages. The number of parenchyma cell layers showed no detectable difference between the two lines at all stages (Figure 3A,C). In contrast, P93075 exhibited consistently larger parenchyma cells throughout development (p < 0.05), with the most pronounced divergence occurring at 20 d (Figure 3A–C), suggesting that cell expansion, rather than cell proliferation, is the primary contributor to cortical tissue enlargement during radial growth. In addition, vascular bundle area was significantly greater in P93075 at both 6 d and 20 d (p < 0.05) (Figure 3A,C). Together, these results suggest that stem diameter variation between P93075 and S1174 is mainly associated with parenchyma cell expansion and vascular bundle enlargement, providing a cytological foundation for further understanding the molecular mechanisms underlying stem diameter development in Luffa.

3.3. Transcriptome Landscape of Stem Radial Growth in Luffa

3.3.1. RNA-Seq Quality Assessment and qRT-PCR Validation

To elucidate the molecular mechanisms of stem thickening in Luffa, RNA-seq was performed using stem samples collected from the three key developmental stages of S1174 and P93075. A total of 725,493,348 high-quality clean reads were generated. The Q30 values exceeded 91.2%, and GC content ranged from 42.51% to 45.68% (Table 1). Pearson correlation coefficients (R2) among biological replicates were all above 0.84 (Figure S1A), indicating good reproducibility across samples. Additionally, ten genes were randomly selected for qRT-PCR validation, and their expression patterns closely matched the RNA-seq expression profiles (R2 > 0.71) (Figure S1B). Overall, the dataset was of high quality and suitable for downstream transcriptomic analyses.

3.3.2. Differentially Expressed Gene Identification and Characterization

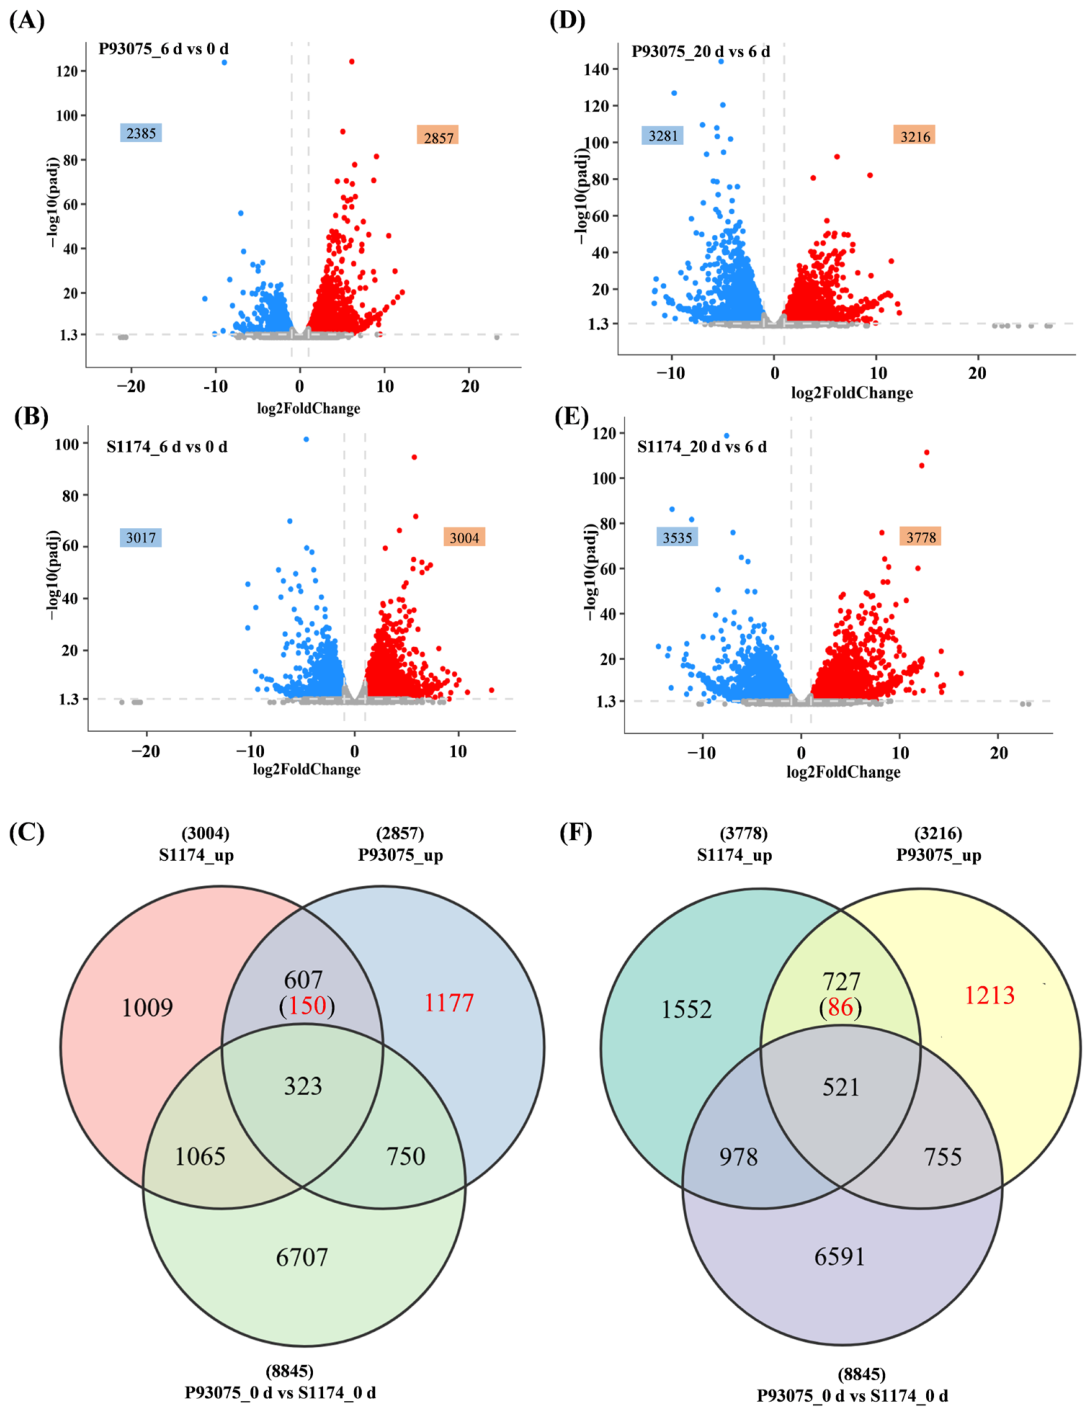
Stem thickening is controlled by complex transcriptional programs involving numerous developmentally regulated genes. To identify genes potentially associated with the greater stem diameter of P93075, a three-step filtering strategy previously established in our earlier work [29] was applied separately to phase I (6 d vs. 0 d) and phase II (20 d vs. 6 d). (i) Temporal DEGs were identified within each line to capture transcriptional changes accompanying stem development. During the rapid growth phase I, 2857 upregulated and 2385 downregulated genes were identified in P93075, whereas 3004 upregulated and 3017 downregulated genes were observed in S1174 (Figure 4A,B). During the subsequent phase II, P93075 exhibited 3216 upregulated and 3281 downregulated genes, while S1174 showed 3778 upregulated and 3535 downregulated genes (Figure 4D,E). (ii) Among the upregulated genes, genes specifically upregulated in P93075 were retained after excluding genes already differentially expressed between P93075 and S1174 at 0 d, thereby minimizing the influence of pre-existing expression differences related to genetic background between the two lines (Figure 4C,F). (iii) Genes upregulated in both lines were also included when their induction was markedly greater in P93075 (|ΔFC| ≥ 2) (Figure 4C,F). The P93075-specific upregulated genes were prioritized because their induction was unique to the thick-stem line during stem development and therefore may be relevant to the greater stem diameter of P93075. The shared genes were also considered, as they may participate in the general developmental process of stem thickening, while their stronger transcriptional response in P93075 may be associated with the greater stem diameter of this line. Using this strategy, 1327 and 1299 target genes were obtained for phases I and II, respectively. After combining the two phase-specific gene sets and removing overlapping genes, a total of 2611 genes were carried forward for subsequent analyses (Figure 4C,F).
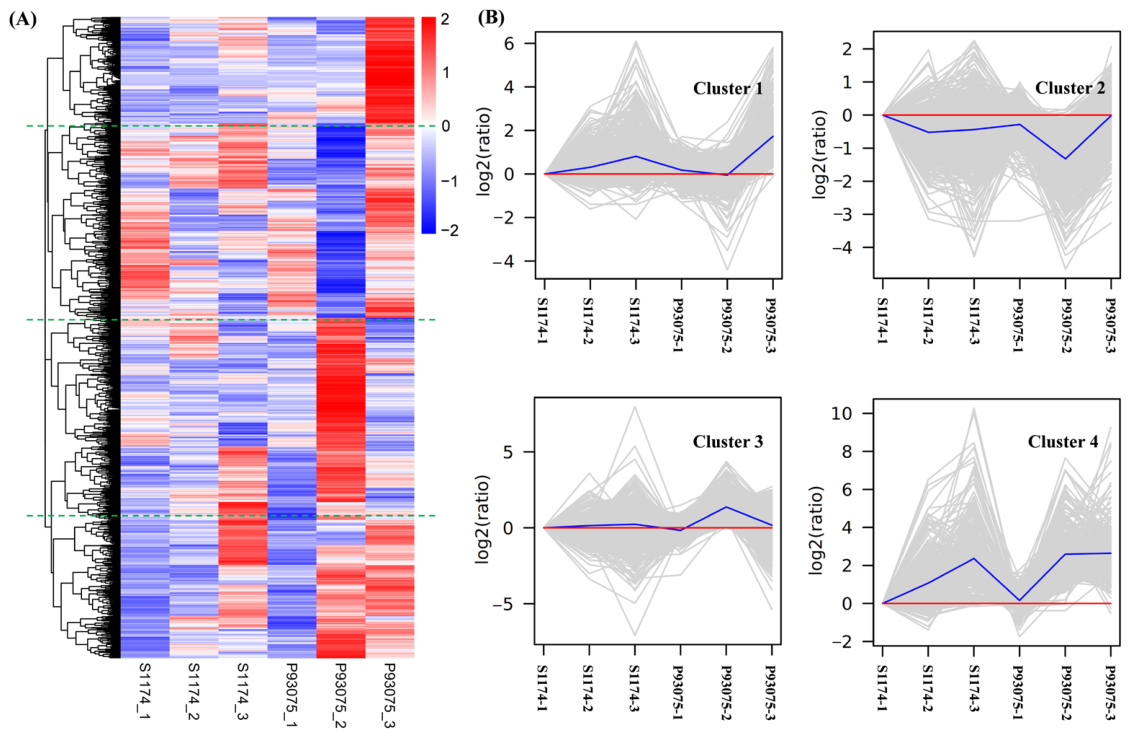
To further characterize expression heterogeneity, hierarchical clustering and k-means clustering analyses were performed on the 2611 DEGs. Hierarchical clustering grouped them into four major expression categories reflecting distinct line- and stage-specific patterns, including genes specifically upregulated in P93075 at stage III, genes preferentially downregulated at stage II, genes showing transient stage II activation, and genes exhibiting sustained upregulation across stages (Figure 5A). Notably, k-means clustering also resolved these genes into four comparable temporal expression patterns, largely consistent with the hierarchical clustering results (Figure 5B), supporting the notion that stem radial growth is governed by dynamic transcriptional reprogramming rather than static gene regulatory programs.
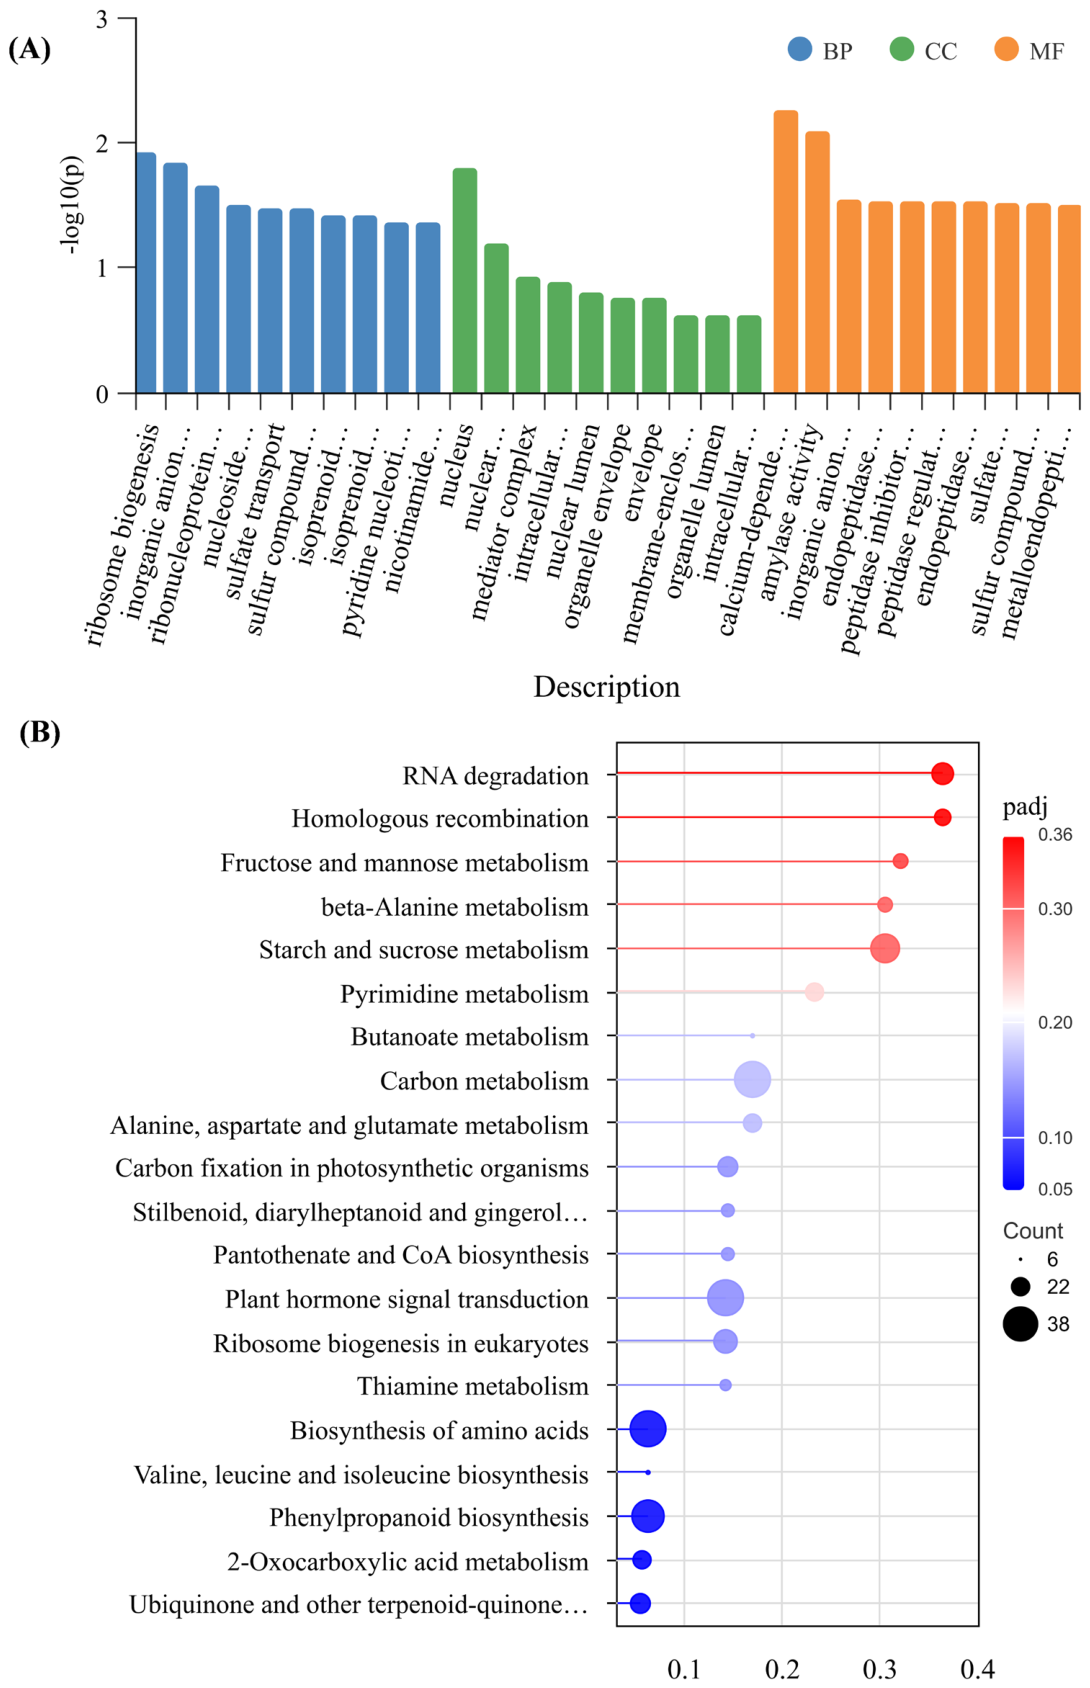
Functional enrichment analysis was performed for the 2611 target DEGs. Among the enriched GO terms, several biological processes potentially related to stem development were selected for further highlighting, including isoprenoid metabolic/biosynthetic processes, plant-type cell wall organization or biogenesis, and secondary metabolism of organic and carboxylic acids. Cellular components were enriched in the nucleus, nuclear chromosome, cell cortex, and microtubule-related structures. Molecular functions were enriched for transcription factor binding and regulatory activity, calcium-dependent phospholipid binding, amylase activity, and GTPase regulator activity. These results suggested that isoprenoid metabolism and plant cell wall assembly are likely directly involved in stem thickening, while transcriptional regulation, signal transduction, and metabolic processes cooperatively contribute to radial stem growth and morphological development (Figure 6A and Table S2). Among the enriched KEGG pathways, several pathways likely associated with stem development were identified, including plant hormone signal transduction, phenylpropanoid biosynthesis, ubiquinone and other terpenoid-quinone biosynthesis, and amino acid and starch and sucrose metabolism pathways, indicating that hormonal regulation, lignin biosynthesis, amino acids and carbohydrate metabolism may collectively facilitate stem thickening in Luffa (Figure 6B).

3.4. LacEXT3 as a Candidate Gene Associated with Stem Radial Growth in Luffa

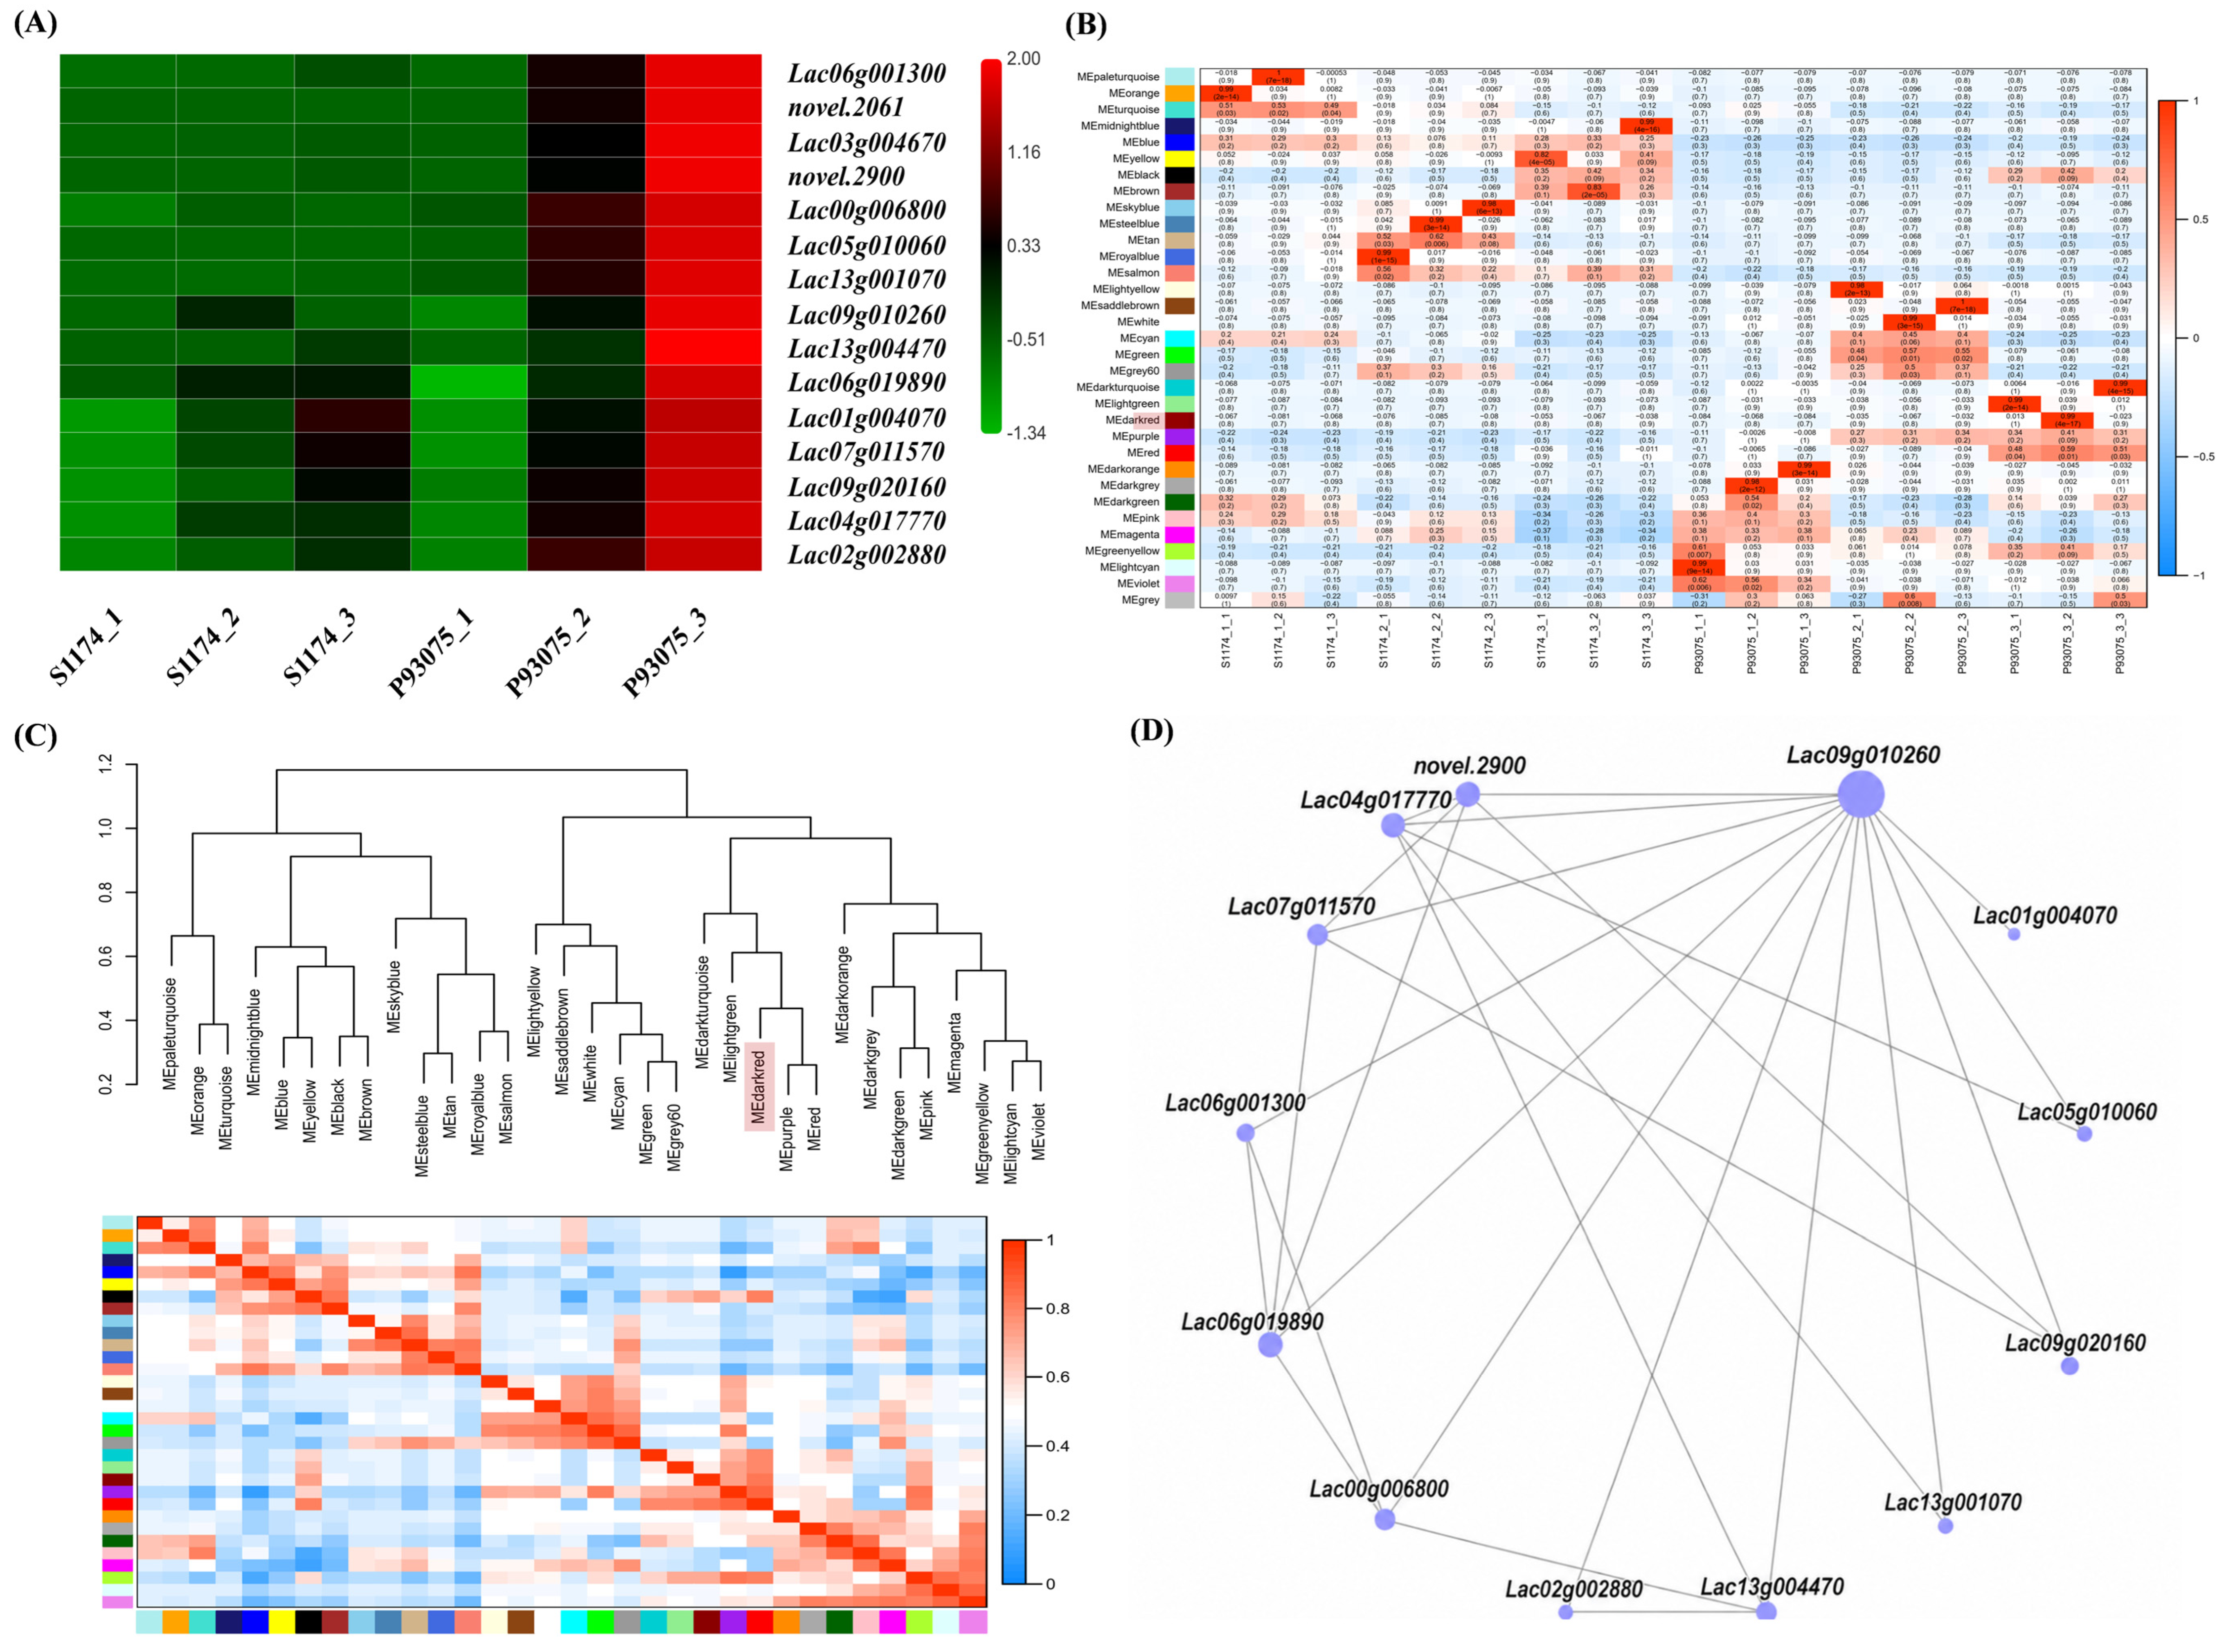
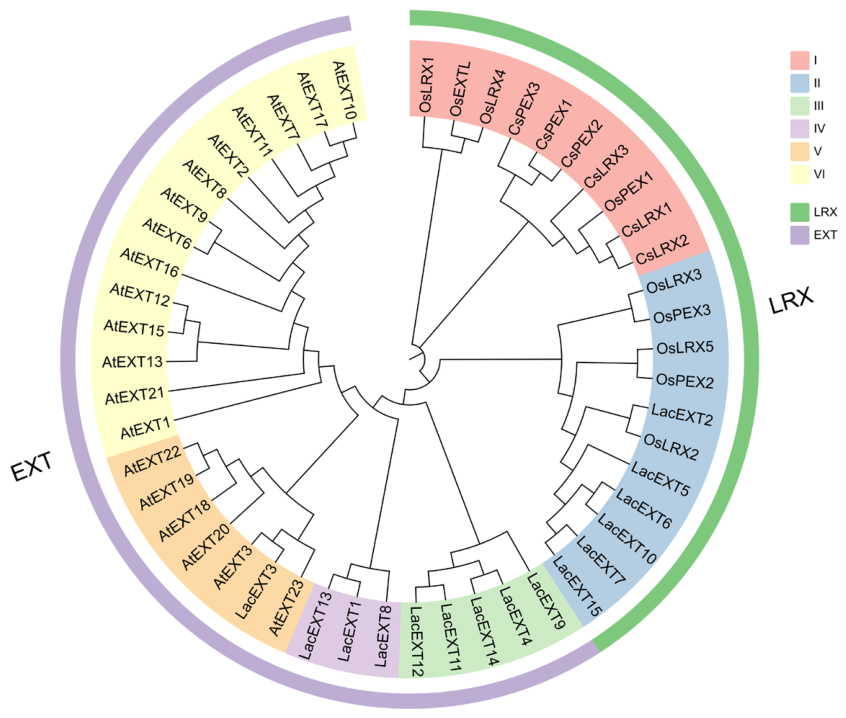
Within the target DEG set, 15 genes shared between phases I and II were of particular interest (Table 2), as they were consistently upregulated in the thick-stem line P93075 (Figure 7B). To further identify co-expression patterns among these genes, weighted gene co-expression network analysis (WGCNA) was performed to construct gene modules and explore their relationships with stem diameter variation (Figure 7B,C, Figures S2 and S3). Among the identified modules, 13 of the 15 genes were assigned to the red module (Figure 7C), in which Lac09g010260 emerged as a hub gene connected with all 12 other genes and exhibiting the highest number of edges (Figure 7D). Sequence annotation identified that Lac09g010260 encodes an extensin-3-like protein (LacEXT3), with a proline content of 41.67%, reflecting the Ser-(Hyp)4 pentapeptide repeats characteristic of dicot extensins (Figure S4). Further phylogenetic analysis revealed two major extensin subfamilies, classical EXT and LRX (Figure 8). Luffa extensins were distributed in both groups, whereas LacEXT3 clustered closely with classical EXT proteins from Arabidopsis, including AtEXT3, AtEXT23, AtEXT18, AtEXT19, AtEXT22, and AtEXT1, supporting its evolutionary conservation within this subfamily (Figure 8). As core structural proteins of the plant cell wall, extensins are broadly involved in cell wall assembly and cell expansion [16,20,21], which is consistent with the anatomical observations and the enrichment of cell-wall-related pathways in the transcriptomic analysis (Figure 3 and Figure 6). Based on its sustained expression pattern, high connectivity within the co-expression network, evolutionary conservation within the classical EXT subfamily, and functional relevance to cell wall-related processes, LacEXT3 was prioritized for further functional analysis.
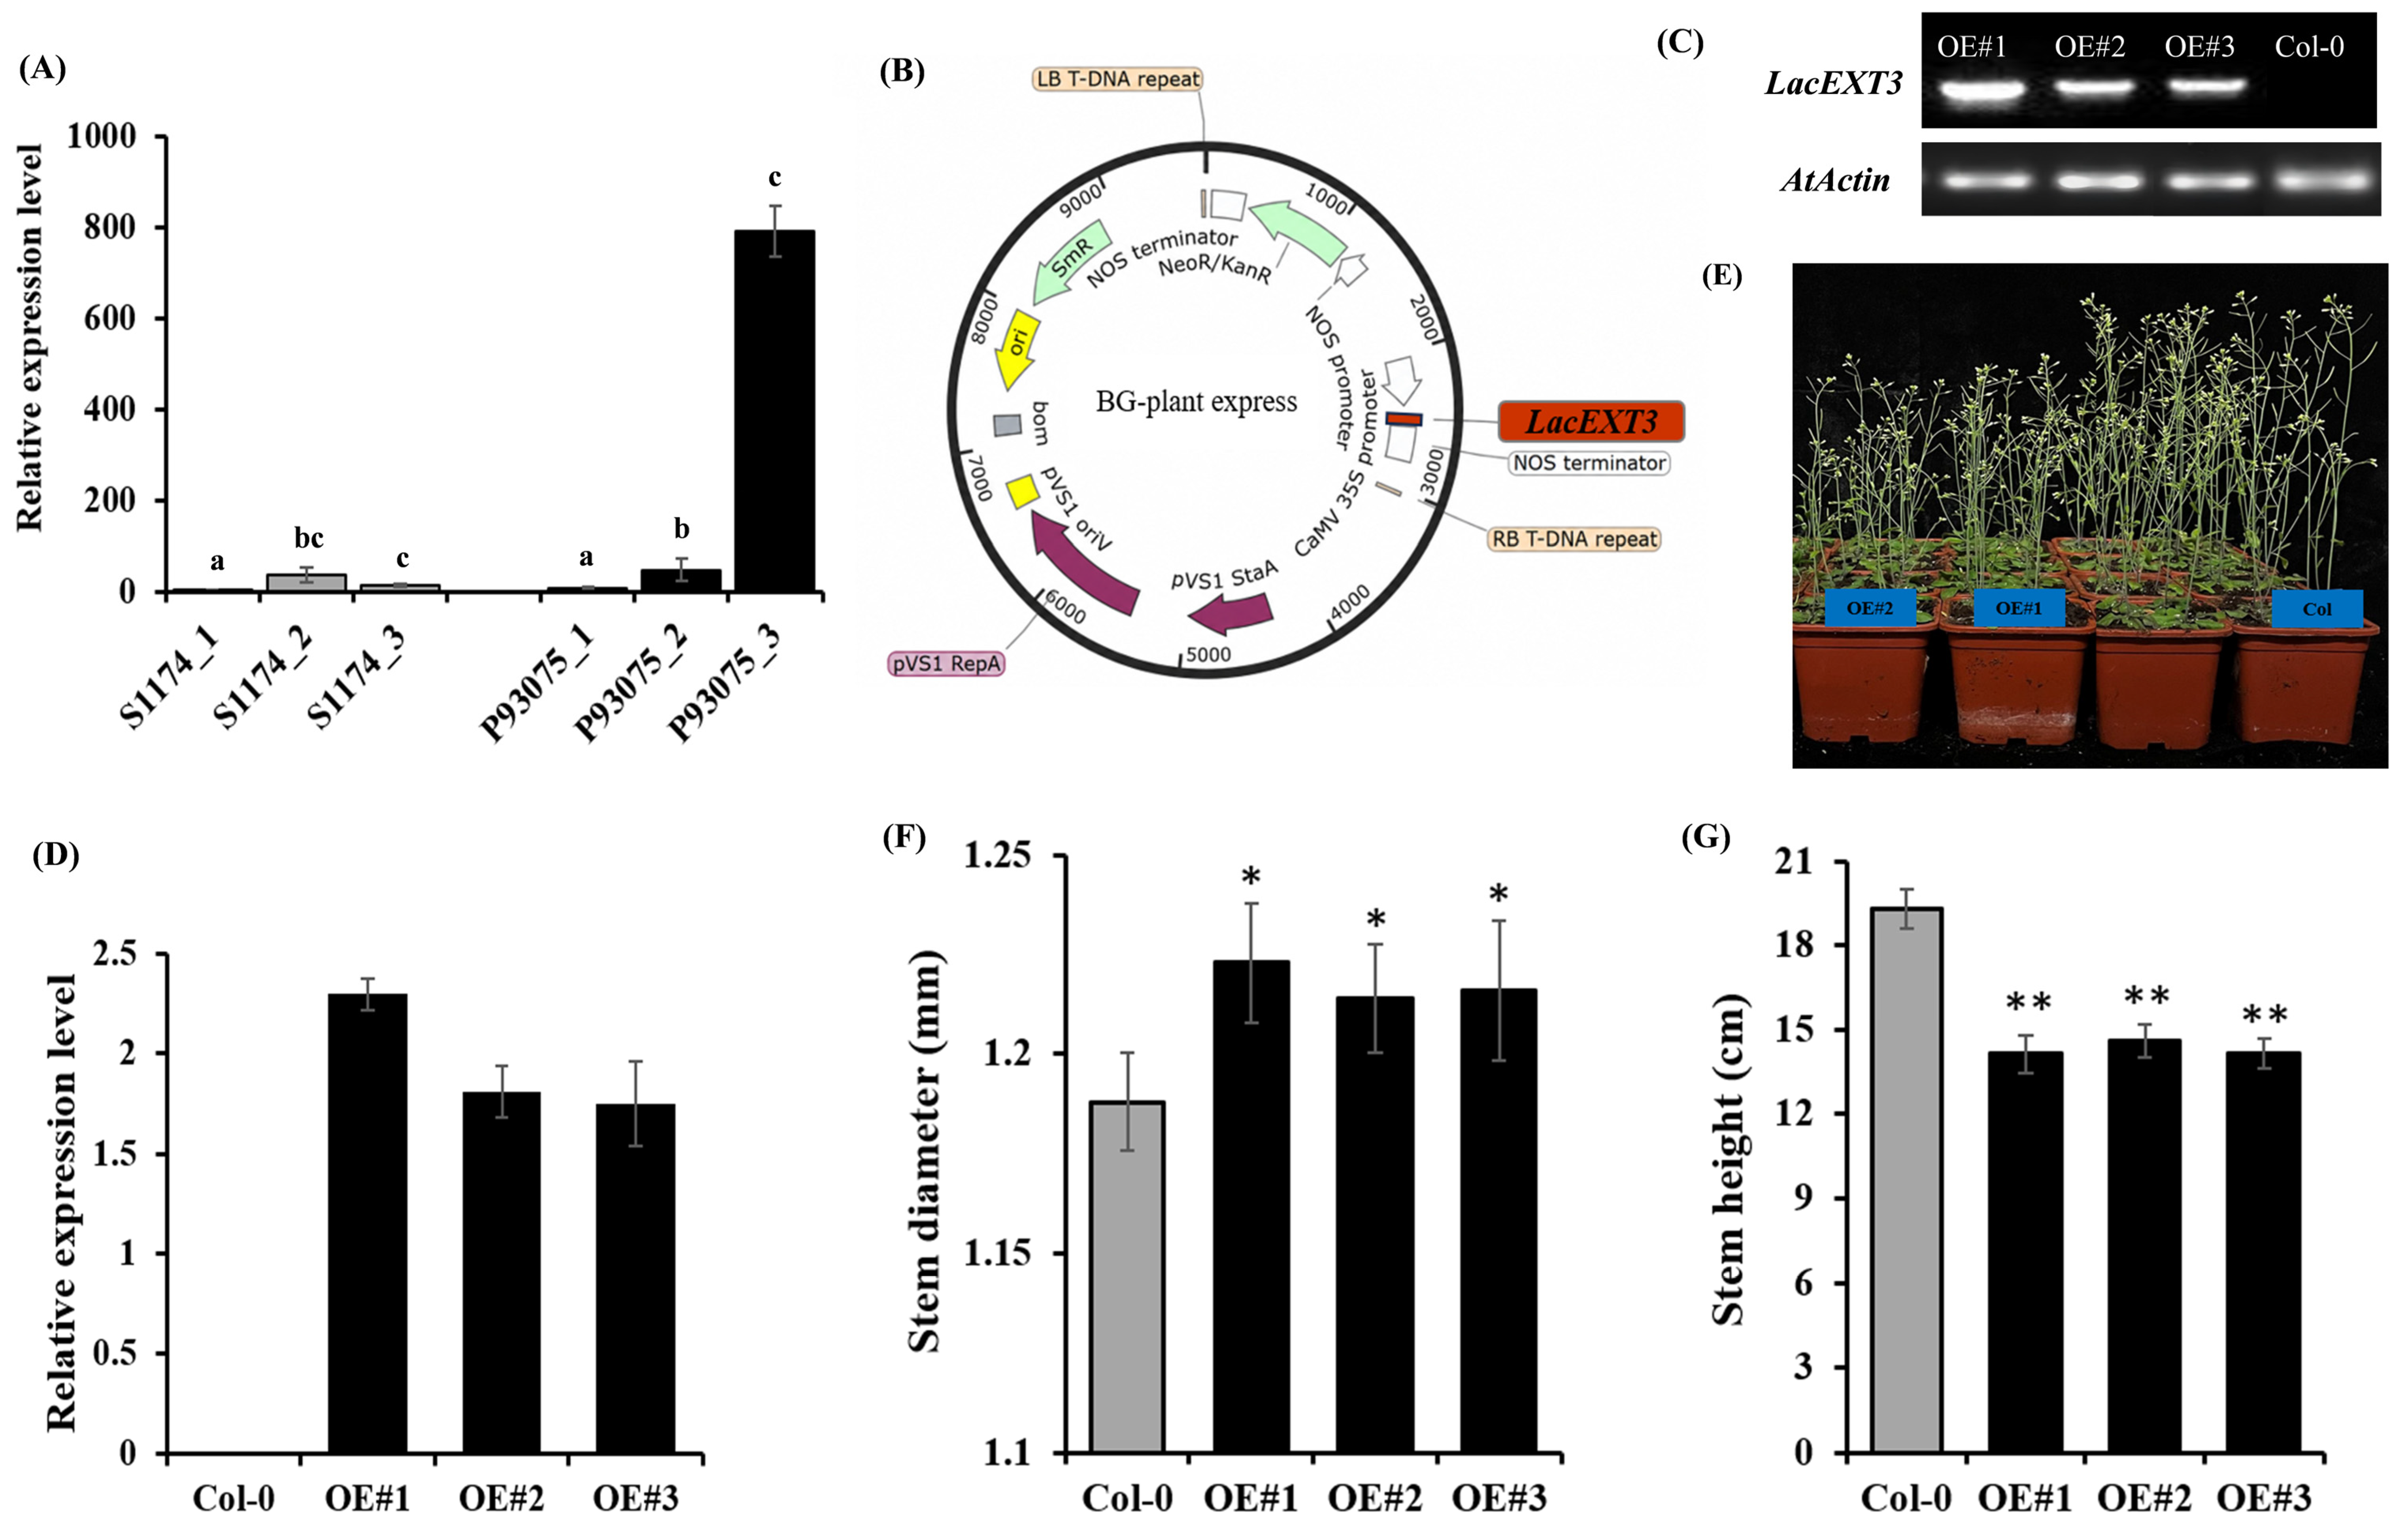
In S1174, LacEXT3 exhibited a transient increase followed by a decrease, with its overall expression remaining low. In contrast, in P93075, LacEXT3 showed sustained upregulation, with expression levels increased by more than 6-fold and 16-fold in phases I and II, respectively (Figure 9A). This expression pattern closely paralleled the progression of stem thickening. To further explore its potential role, LacEXT3 was heterologously overexpressed in Arabidopsis (Figure 9B–E). Three independent LacEXT3-overexpression lines all exhibited increased stem diameter and reduced plant height compared with wild-type plants (Figure 9F,G), consistent with previous findings reported in Arabidopsis and rice [21,22]. Taken together, these results provide supporting evidence that LacEXT3 may contribute to stem radial growth, although its precise function requires further investigation.

4. Discussion

4.1. Parenchyma Cell Expansion and Vascular Bundle Enlargement Associated with Stem Diameter Variation in Luffa

Stem diameter is a critical architectural trait in Luffa, influencing mechanical strength, lodging resistance, and nutrient transport [1,2]. Nevertheless, the developmental dynamics governing stem thickening in Luffa remain poorly understood. Herein, field-based phenotyping combined with paraffin-section analysis was conducted to decode its developmental trajectory and cellular basis. Stem diameter followed a typical S-shaped growth curve, characterized by a “slow-fast-slow” pattern. Accordingly, three pivotal developmental stages were defined: the initiation (0 d), rapid growth (6 d), and maturation (20 d). By the rapid growth stage, stem diameter already differed significantly between the thick-stem line P93075 and the thin-stem line S1174, with this divergence becoming more pronounced at maturity.
Anatomical analysis provided insights into the fact that the number of parenchyma cell layers remained unchanged between the two lines across all stages, whereas parenchyma cell area was consistently larger in P93075, with the greatest difference observed at 20 d. Similar observations in woody Aloe and cassava support the role of parenchyma cell expansion in radial stem growth [30,31]. In most dicotyledonous plants, secondary growth continues after primary elongation, largely driven by the proliferative activity of the vascular cambium, which generates secondary phloem outward and secondary xylem inward. Previous studies have demonstrated that stem thickening in tobacco, tomato, and lettuce is tightly regulated by cambial activity [10,12,32]. Consistently, in the present study, vascular bundle area in P93075 remained significantly larger than that in S1174 from the rapid growth stage onwards, corresponding to the observed phenotypic divergence. Although vascular cambium activity was not directly quantified in the present study, the greater vascular bundle area observed in P93075 suggests that vascular tissue enlargement may contribute to stem diameter variation. Overall, our results suggest that inter-line variation in Luffa stem thickness appears to involve parenchyma cell expansion throughout development and vascular bundle enlargement during late developmental phases.

4.2. Molecular Regulatory Network Underlying Luffa Stem Thickening

Stem thickening in plants is orchestrated by an intricate molecular network coupling cell wall remodeling, hormonal regulation, and transcriptional regulation [31,33]. In this study, transcriptome profiling revealed a comprehensive regulatory landscape underlying stem diameter variation in Luffa, with 2611 DEGs showing enrichment in pathways and biological processes related to cell wall metabolism, phenylpropanoid biosynthesis, and plant hormone signaling, which may contribute to stem diameter development.
The plant cell wall serves as a major determinant of organ mechanical strength, and its biosynthesis, deposition, and remodeling are integral to radial stem growth. In our data, genes involved in cellulose biosynthesis and cell wall organization were significantly enriched (Table S3), underscoring the critical role of cell wall metabolism during Luffa stem radial expansion. Specifically, cellulose, a principal component of both primary and secondary walls, is essential for wall strength and cell expansion. Several cellulose synthase genes were differentially expressed between the thick-stem line P93075 and the thin-stem line S1174, consistent with previous findings that CESA family members act as core enzymes in cellulose biosynthesis and are required for cell wall and stem development [31]. For instance, in maize, the transcription factor ZmMYB92 positively regulates ZmCesA10 and ZmCesA11, whereas loss of its function reduces cellulose accumulation, resulting in thinner cell walls and stems [33]. In addition, the orientation of cell wall deposition relative to cell expansion also influences stem diameter, with the key regulator COBRA (COB) genes also enriched among the Luffa DEGs. In Arabidopsis and rice, cob mutants typically exhibit impaired secondary wall, collapsed xylem, and brittle, dwarfed stems [34,35,36], further corroborating the function of cellulose microfibril orientation in determining stem architecture. During later developmental stages, secondary wall reinforcement becomes increasingly prominent. The phenylpropanoid pathway, a major route for lignin biosynthesis, was significantly enriched and comprised 27 key structural genes such as PAL, C4H/CYP73A, 4CL, HCT, CAD, and CCR. These genes are well documented to directly regulate lignin deposition and secondary wall strengthening [37,38], indicating that both cell wall construction and lignification provide the mechanical basis for stem radial expansion in Luffa.
Plant hormone signaling pathways act as upstream regulators of stem radial growth [9,10,39]. Multiple hormones were significantly enriched in our set of DEGs (Table S3). As a central regulator of vascular cambium activity and secondary growth, auxin promotes cambial cell division and xylem differentiation. Exogenous auxin application to apical meristems of Arabidopsis, sunflower, and poplar suppresses meristematic activity while promoting cambial cell division and secondary xylem differentiation [40,41]. Conversely, disruption of endogenous auxin signaling impedes secondary growth; for example, overexpression of IAA3m inhibits periclinal divisions of cambial cells [42]. Auxin response factors, such as ARF5/MP, upregulate the auxin polar transport gene PIN1 in cambial stem cells, increasing the number of vascular initials and establishing a structural foundation for stem thickening [39,43,44]. In Luffa, we detected 13 auxin-related DEGs, including ARF3, ARF9/ARF18-like, GH3.9, IAA28, and IAA11, highlighting transcriptional responses associated with auxin signaling during stem radial growth. Genes related to gibberellin and ABA signaling were also enriched. Evidence from cassava and lettuce shows that stem cell size correlates with GA3 levels, and early stem thickening is accompanied by elevated gibberellin and ABA [10]. These transcriptomic results suggest the potential involvement of multiple hormone-related signaling pathways in Luffa stem thickening, although their direct contribution requires further validation through hormone quantification.

4.3. LacEXT3 as a Potential Candidate for Future Stem Architecture Improvement

Stem development directly shapes plant architecture and yield potential, making it a prime target for molecular breeding. In cucurbits, studies of stem diameter have largely focused on genetic dissection and QTL mapping [45,46]. Although our previous work identified LacCRWN3, encoding a nuclear lamina protein, as a key regulator of stem diameter in Luffa [45], the complex molecular network underlying this trait remains to be further elucidated.
In the present study, time-course transcriptome profiling combined with WGCNA identified LacEXT3 as a potential candidate gene associated with stem radial growth. In the thick-stem line P93075, LacEXT3 expression was upregulated more than 6-fold and 16-fold during stages I and II, respectively, whereas in the thin-stem line S1174, the expression transiently increased but subsequently returned to a low level, with overall expression remaining relatively low. LacEXT3 encodes the extensin protein, a member of the hydroxyproline-rich glycoprotein family and an important structural component of the plant cell wall [20,23]. Heterologous overexpression of LacEXT3 in Arabidopsis increased stem diameter while reducing plant height. Similar alterations in plant architecture have also been reported for AtEXT1 and OsEXTL overexpression plants in Arabidopsis and rice, respectively [21,22]. Notably, LacEXT3 is phylogenetically closely related to AtEXT1, suggesting a potentially conserved role of extensin proteins in regulating plant growth and stem architecture. Nevertheless, the simultaneous increase in stem diameter and reduction in plant height highlights a potential architectural trade-off. From a breeding perspective, a moderate reduction in plant height may contribute to improved mechanical stability, whereas excessive dwarfing could adversely affect vine growth, canopy development, fruit positioning, and productivity in climbing Luffa plants. Therefore, although LacEXT3 represents a promising candidate for modifying stem architecture, its biological role and potential breeding value should be further evaluated directly in Luffa, particularly with respect to plant height, canopy architecture, and yield-related traits.

5. Conclusions

This study elucidates the developmental, cellular, and molecular basis of stem diameter variation in Luffa. Stem radial growth follows a sigmoidal pattern, and inter-line variation is closely associated with parenchyma cell expansion and increased vascular bundle area. Transcriptome profiling identified 2611 differentially expressed genes associated with stem development, among which LacEXT3, encoding an extensin protein, was identified as a promising candidate gene associated with stem radial growth. Unlike its transient and low expression in the thin stem line S1174, LacEXT3 showed sustained upregulation in the thick stem line P93075. Heterologous overexpression of LacEXT3 in Arabidopsis resulted in increased stem diameter accompanied by reduced plant height, providing supporting evidence for its potential involvement in stem development. Further functional studies are required to clarify the precise molecular role of LacEXT3 and its contribution to stem radial growth. Together, these findings establish a developmental framework for dissecting stem diameter formation in Luffa and provide a foundation for exploring the regulatory mechanism underlying stem architecture.

Supplementary Materials

The following supporting information can be downloaded at: https://www.mdpi.com/article/10.3390/agronomy16171740/s1, Figure S1: The assessment of the RNA-seq data quality; Figure S2: Weighted gene co-expression network analysis of genes associated with stem thickening in Luffa; Figure S3: Hierarchical clustering and module eigengene correlation heatmap in WGCNA; Figure S4: Amino acid sequence of LacEXT3; Table S1: Primer sequences used in this study; Table S2: GO enrichment items; Table S3: Major gene sets significantly enriched among differentially expressed genes.

Author Contributions

H.W. and J.L. conceived and designed the experiments; J.Z. supervised the research; S.H., L.L., J.L., J.C., G.Z. and Y.W. provided support for field phenotyping and material collection. L.L. and C.L. performed the experiments and support for bioinformatics analysis; L.L. analyzed the data and wrote the manuscript; S.H. and H.W. revised the manuscript. All authors have read and agreed to the published version of the manuscript.

Funding

This research was funded by Guangdong Basic and Applied Basic Research Fund—the Natural Science Foundation of Guangdong Province (2023A1515010648), the National Natural Science Foundation of China (32372707), the Science and Technology Program of Guangzhou of China (2024B03J1387, 2025A04J5344), and International Agricultural Science and Technology Cooperation Network Construction Project, Guangdong Academy of Agricultural Sciences (GHZX2026-XZ04).

Data Availability Statement

The original contributions presented in this study are included in the Supplementary Materials. Further inquiries can be directed to the corresponding authors. The raw RNA-seq data have been deposited in the CNGB Sequence Archive (CNSA) of China National GeneBank DataBase (CNGBdb) repository under accession number CNP0009748.

Conflicts of Interest

Author Yun Wang was employed by the company Ping An Property & Casualty Insurance Company of China, Ltd., Guangdong Branch, Guangzhou 510620, China. The remaining authors declare that the research was conducted in the absence of any commercial or financial relationships that could be construed as a potential conflict of interest.

References

  1. Zhou, J.; Cui, M.; Wu, Y.; Gao, Y.; Tang, Y.; Jiang, B.; Wu, M.; Zhang, J.; Hou, L. Detection of maize stem diameter by using RGB-D cameras’ depth information under selected field condition. Front. Plant Sci. 2024, 15, 1371252. [Google Scholar] [CrossRef] [Scilit]
  2. Zhao, Y.; Wang, X.; Gao, J.; Rehman Rashid, M.A.; Wu, H.; Hu, Q.; Sun, X.; Li, J.; Zhang, H.; Xu, P.; et al. The MYB61-STRONG2 module regulates culm diameter and lodging resistance in rice. J. Integr. Plant Biol. 2025, 67, 243–257. [Google Scholar] [CrossRef] [Scilit]
  3. Wang, H.; Avci, U.; Nakashima, J.; Hahn, M.G.; Chen, F.; Dixon, R.A. Mutation of WRKY transcription factors initiates pith secondary wall formation and increases stem biomass in dicotyledonous plants. Proc. Natl. Acad. Sci. USA 2010, 107, 22338–22343. [Google Scholar] [CrossRef] [Scilit]
  4. Somssich, M.; Je, B.I.; Simon, R.; Jackson, D. CLAVATA-WUSCHEL signaling in the shoot meristem. Development 2016, 143, 3238–3248. [Google Scholar] [CrossRef] [Scilit]
  5. Hu, C.; Zhu, Y.; Cui, Y.; Cheng, K.; Liang, W.; Wei, Z.; Zhu, M.; Yin, H.; Zeng, L.; Xiao, Y.; et al. A group of receptor kinases are essential for CLAVATA signalling to maintain stem cell homeostasis. Nat. Plants 2018, 4, 205–211. [Google Scholar] [CrossRef] [Scilit]
  6. Rodriguez, K.; Do, A.; Senay-Aras, B.; Perales, M.; Alber, M.; Chen, W.; Reddy, G.V. Concentration-dependent transcriptional switching through a collective action of cis-elements. Sci. Adv. 2022, 8, eabo6157. [Google Scholar] [CrossRef] [Scilit]
  7. Hong, L.; Fletcher, J.C. Stem cells: Engines of plant growth and development. Int. J. Mol. Sci. 2023, 24, 14889. [Google Scholar] [CrossRef] [Scilit]
  8. Mitsuda, N.; Iwase, A.; Yamamoto, H.; Yoshida, M.; Seki, M.; Shinozaki, K.; Ohme-Takagi, M. NAC transcription factors, NST1 and NST3, are key regulators of the formation of secondary walls in woody tissues of Arabidopsis. Plant Cell 2007, 19, 270–280. [Google Scholar] [CrossRef] [Scilit]
  9. Hu, J.; Su, H.; Cao, H.; Wei, H.; Fu, X.; Jiang, X.; Song, Q.; He, X.; Xu, C.; Luo, K. AUXIN RESPONSE FACTOR7 integrates gibberellin and auxin signaling via interactions between DELLA and AUX/IAA proteins to regulate cambial activity in poplar. Plant Cell 2022, 34, 2688–2707. [Google Scholar] [CrossRef] [Scilit]
  10. Huang, Y.; Li, Y.; Liu, Z.; Chen, W.; Wang, Y.; Wang, X.; Liu, Y.; Zheng, Y. Combined analysis of the transcriptome and metabolome provides insights into the fleshy stem expansion mechanism in stem lettuce. Front. Plant Sci. 2022, 13, 1101199. [Google Scholar] [CrossRef] [Scilit]
  11. Qi, R.; John, P.C. Expression of genomic AtCYCD2;1 in Arabidopsis induces cell division at smaller cell sizes: Implications for the control of plant growth. Plant Physiol. 2007, 144, 1587–1597. [Google Scholar] [CrossRef] [Scilit]
  12. Fujii, T.; Sato, K.; Matsui, N.; Furuichi, T.; Takenouchi, S.; Nishikubo, N.; Suzuki, Y.; Kawai, S.; Demura, T.; Kajita, S.; et al. Enhancement of secondary xylem cell proliferation by Arabidopsis cyclin D overexpression in tobacco plants. Plant Cell Rep. 2012, 31, 1573–1580. [Google Scholar] [CrossRef] [Scilit]
  13. Lee, S.J.; Jung, H.J.; Kang, H.; Kim, S.Y. Arabidopsis zinc finger proteins AtC3H49/AtTZF3 and AtC3H20/AtTZF2 are involved in ABA and JA responses. Plant Cell Physiol. 2012, 53, 673–686. [Google Scholar] [CrossRef] [Scilit]
  14. Delmer, D.; Dixon, R.A.; Keegstra, K.; Mohnen, D. The plant cell wall-dynamic, strong, and adaptable-is a natural shapeshifter. Plant Cell 2024, 36, 1257–1311. [Google Scholar] [CrossRef] [Scilit]
  15. Kesawat, M.S.; Kherawat, B.S.; Katara, J.L.; Parameswaran, C.; Misra, N.; Kumar, M.; Chung, S.M.; Alamri, S.; Siddiqui, M.H. Genome-wide analysis of proline-rich extensin-like receptor kinases (PERKs) gene family reveals their roles in plant development and stress conditions in Oryza sativa L. Plant Sci. 2023, 334, 111749. [Google Scholar] [CrossRef] [Scilit]
  16. Li, J.; Zhang, Y.; Li, Z.; Dai, H.; Luan, X.; Zhong, T.; Chen, S.; Xie, X.M.; Qin, G.; Zhang, X.Q.; et al. OsPEX1, an extensin-like protein, negatively regulates root growth in a gibberellin-mediated manner in rice. Plant Mol. Biol. 2023, 112, 47–59. [Google Scholar] [CrossRef] [Scilit]
  17. Cheng, S.Y.; Chu, P.K.; Chen, Y.J.; Wu, Y.H.; Huang, M.D. Exploring the extensin gene family: An updated genome-wide survey in plants and algae. J. Exp. Bot. 2024, 75, 152–167. [Google Scholar] [CrossRef] [Scilit]
  18. Showalter, A.M.; Keppler, B.; Lichtenberg, J.; Gu, D.; Welch, L.R. A bioinformatics approach to the identification, classification, and analysis of hydroxyproline-rich glycoproteins. Plant Physiol. 2010, 153, 485–513. [Google Scholar] [CrossRef] [Scilit]
  19. Ding, Q.; Yang, X.; Pi, Y.; Li, Z.; Xue, J.; Chen, H.; Li, Y.; Wu, H. Genome-wide identification and expression analysis of extensin genes in tomato. Genomics 2020, 112, 4348–4360. [Google Scholar] [CrossRef] [Scilit]
  20. Cannon, M.C.; Terneus, K.; Hall, Q.; Tan, L.; Wang, Y.; Wegenhart, B.L.; Chen, L.; Lamport, D.T.; Chen, Y.; Kieliszewski, M.J. Self-assembly of the plant cell wall requires an extensin scaffold. Proc. Natl. Acad. Sci. USA 2008, 105, 2226–2231. [Google Scholar] [CrossRef] [Scilit]
  21. Roberts, K.; Shirsat, A.H. Increased extensin levels in Arabidopsis affect inflorescence stem thickening and height. J. Exp. Bot. 2006, 57, 537–545. [Google Scholar] [CrossRef] [Scilit]
  22. Fan, C.; Li, Y.; Hu, Z.; Hu, H.; Wang, G.; Li, A.; Wang, Y.; Tu, Y.; Xia, T.; Peng, L.; et al. Ectopic expression of a novel OsExtensin-like gene consistently enhances plant lodging resistance by regulating cell elongation and cell wall thickening in rice. Plant Biotechnol. J. 2018, 16, 254–263. [Google Scholar] [CrossRef] [Scilit]
  23. Xiao, L.; Fang, Y.; Zhang, H.; Quan, M.; Zhou, J.; Li, P.; Wang, D.; Ji, L.; Ingvarsson, P.K.; Wu, H.X.; et al. Natural variation in the prolyl 4-hydroxylase gene PtoP4H9 contributes to perennial stem growth in Populus. Plant Cell 2023, 35, 4046–4065. [Google Scholar] [CrossRef] [Scilit]
  24. Kim, D.; Langmead, B.; Salzberg, S.L. HISAT: A fast spliced aligner with low memory requirements. Nat. Methods 2015, 12, 357–360. [Google Scholar] [CrossRef] [Scilit]
  25. Liao, Y.; Smyth, G.K.; Shi, W. featureCounts: An efficient general purpose program for assigning sequence reads to genomic features. Bioinformatics 2014, 30, 923–930. [Google Scholar] [CrossRef] [Scilit]
  26. Love, M.I.; Huber, W.; Anders, S. Moderated estimation of fold change and dispersion for RNA-seq data with DESeq2. Genome Biol. 2014, 15, 550. [Google Scholar] [CrossRef] [Scilit]
  27. Li, B.; Dewey, C.N. RSEM: Accurate transcript quantification from RNA-Seq data with or without a reference genome. BMC Bioinform. 2011, 12, 323. [Google Scholar] [CrossRef] [Scilit]
  28. Livak, K.J.; Schmittgen, T.D. Analysis of relative gene expression data using real-time quantitative PCR and the 2(-Delta Delta C(T)) Method. Methods 2001, 25, 402–408. [Google Scholar] [CrossRef] [Scilit]
  29. Feng, X.; Liu, L.; Li, Z.; Sun, F.; Wu, X.; Hao, D.; Hao, H.; Jing, H.C. Potential interaction between autophagy and auxin during maize leaf senescence. J. Exp. Bot. 2021, 72, 3554–3568. [Google Scholar] [CrossRef] [Scilit]
  30. Li, J.Y.; Wang, T.X.; Hu, Z.H. Developmental anatomy and the anomalous structure of the stem in Aloe arborescens. Acta Bot. Boreali-Occident. Sin. 2003, 23, 5. [Google Scholar]
  31. Bao, R.; Zeng, C.; Li, K.; Li, M.; Li, Y.; Zhou, X.; Wang, H.; Wang, Y.; Huang, D.; Wang, W.; et al. MeGT2.6 increases cellulose synthesis and active gibberellin content to promote cell enlargement in cassava. Plant J. 2024, 119, 1014–1029. [Google Scholar] [CrossRef] [Scilit]
  32. Ye, J.; Tian, R.; Meng, X.; Tao, P.; Li, C.; Liu, G.; Chen, W.; Wang, Y.; Li, H.; Ye, Z.; et al. Tomato SD1, encoding a kinase-interacting protein, is a major locus controlling stem development. J. Exp. Bot. 2020, 71, 3575–3587. [Google Scholar] [CrossRef] [Scilit]
  33. Zhang, X.; Li, H.; Zhao, C.; Wu, Y.; Lu, X. ZmMYB92 modulates secondary wall cellulose synthesis in maize. Plant J. 2025, 122, e70296. [Google Scholar] [CrossRef] [Scilit]
  34. Roudier, F.; Fernandez, A.G.; Fujita, M.; Himmelspach, R.; Borner, G.H.; Schindelman, G.; Song, S.; Baskin, T.I.; Dupree, P.; Wasteneys, G.O.; et al. COBRA, an Arabidopsis extracellular glycosyl-phosphatidyl inositol-anchored protein, specifically controls highly anisotropic expansion through its involvement in cellulose microfibril orientation. Plant Cell 2005, 17, 1749–1763. [Google Scholar] [CrossRef] [Scilit]
  35. Dai, X.; You, C.; Wang, L.; Chen, G.; Zhang, Q.; Wu, C. Molecular characterization, expression pattern, and function analysis of the OsBC1L family in rice. Plant Mol. Biol. 2009, 71, 469–481. [Google Scholar] [CrossRef] [Scilit]
  36. Xue, J.Y.; McNair, G.; Watanabe, Y.; Kaplen, M.V.; Guevara-Rozo, S.; Schuetz, M.; Schneider, R.; Mansfield, S.D.; Samuels, A.L. COBRA-LIKE4 modulates cellulose synthase velocity and facilitates cellulose deposition in the secondary cell wall. Plant Physiol. 2024, 196, 2531–2548. [Google Scholar] [CrossRef] [Scilit]
  37. Dong, N.Q.; Lin, H.X. Contribution of phenylpropanoid metabolism to plant development and plant-environment interactions. J. Integr. Plant Biol. 2021, 63, 180–209. [Google Scholar] [CrossRef] [Scilit]
  38. Ye, Y.; Cheng, Z.; Yang, X.; Yang, S.; Tang, K.; Yu, H.; Gao, J.; Zhang, Y.; Leng, J.; Zhang, W.; et al. LRM3 positively regulates stem lodging resistance by degradating MYB6 transcriptional repressor in soybean. Plant Biotechnol. J. 2025, 23, 2978–2993. [Google Scholar] [CrossRef] [Scilit]
  39. Smetana, O.; Mäkilä, R.; Lyu, M.; Amiryousefi, A.; Sánchez Rodríguez, F.; Wu, M.F.; Solé-Gil, A.; Leal Gavarrón, M.; Siligato, R.; Miyashima, S.; et al. High levels of auxin signalling define the stem-cell organizer of the vascular cambium. Nature 2019, 565, 485–489. [Google Scholar] [CrossRef] [Scilit]
  40. Sundberg, B.; Uggla, C.; Tuominen, H. Cambial growth and auxin gradients. In Cell and Molecular Biology of Wood Formation; Savidge, R.A., Barnett, J.R., Napier, R., Eds.; BIOS Scientific Publishers: Oxford, UK, 2000; pp. 169–188. [Google Scholar]
  41. Little, C.H.A.; MacDonald, J.E.; Olsson, O. Involvement of indole-3-acetic acid in fascicular and interfascicular cambial growth and interfascicular extraxylary fiber differentiation in Arabidopsis thaliana inflorescence stems. Int. J. Plant Sci. 2002, 163, 519–529. [Google Scholar] [CrossRef] [Scilit]
  42. Nilsson, J.; Karlberg, A.; Antti, H.; Lopez-Vernaza, M.; Mellerowicz, E.; Perrot-Rechenmann, C.; Sandberg, G.; Bhalerao, R.P. Dissecting the molecular basis of the regulation of wood formation by auxin in hybrid aspen. Plant Cell 2008, 20, 843–855. [Google Scholar] [CrossRef] [Scilit]
  43. Wenzel, C.L.; Schuetz, M.; Yu, Q.; Mattsson, J. Dynamics of MONOPTEROS and PIN-FORMED1 expression during leaf vein pattern formation in Arabidopsis thaliana. Plant J. 2007, 49, 387–398. [Google Scholar] [CrossRef] [Scilit]
  44. Zhang, J.; Eswaran, G.; Alonso-Serra, J.; Kucukoglu, M.; Xiang, J.; Yang, W.; Elo, A.; Nieminen, K.; Damén, T.; Joung, J.G.; et al. Transcriptional regulatory framework for vascular cambium development in Arabidopsis roots. Nat. Plants 2019, 5, 1033–1042. [Google Scholar] [CrossRef] [Scilit]
  45. Liu, L.; Gan, Y.; Luo, J.; Li, J.; Zheng, X.; Gong, H.; Liu, X.; Deng, L.; Zhao, G.; Wu, H. QTL mapping reveals candidate genes for main agronomic traits in Luffa based on a high-resolution genetic map. Front. Plant Sci. 2022, 13, 1069618. [Google Scholar] [CrossRef] [Scilit]
  46. Yang, Y.; Dong, S.; Miao, H.; Liu, X.; Dai, Z.; Li, X.; Gu, X.; Zhang, S. Genome-wide association studies reveal candidate genes related to stem diameter in cucumber (Cucumis sativus L.). Genes 2022, 13, 1095. [Google Scholar] [CrossRef] [Scilit]
Figure 1. Phenotypes of the Luffa inbred lines S1174 and P93075. The stems of the eighth internode (A), leaves (B), male flowers (C), and fruits (D) of lines S1174 and P93075. The parts of S1174 were shown above, while those of P93075 were below. The bar for the stems, leaves, and flowers represents 2 cm, and 4 cm for the fruits.
Agronomy 16 01740 g001
Figure 2. Developmental dynamics of stem diameter variation in Luffa inbred lines S1174 and P93075. (A) Changes in the eighth internode stem diameter during development in S1174 and P93075. Data are presented as mean ± SE, with five biological replicates used for each time point and inbred line. Data significance was determined using two-tailed Student’s t-tests, * p < 0.05, ** p < 0.01. DAD, day after development. (B) The eighth internode stem at three key developmental stages.
Agronomy 16 01740 g002
Figure 3. Anatomical analysis of stems in Luffa inbred lines S1174 and P93075. (A) Transverse sections of the eighth internode at three key developmental stages, with circles representing vascular bundles and rectangles representing parenchyma cells. (B) Magnified views of parenchyma tissues. (C) Quantitative analysis of parenchyma cell layer number and area, and vascular bundle area. Data are presented as mean ± SE from three biological replicates. Statistical significance was determined using two-tailed Student’s t-tests, * p < 0.05, ** p < 0.01.
Agronomy 16 01740 g003
Figure 4. Screening of differentially expressed genes (DEGs) during stem diameter development in Luffa. Volcano plots of DEGs in inbred lines P93075 (A,D) and S1174 (B,E) at phase I (6 d vs. 0 d) and phase II (20 d vs. 6 d), with red and blue dots representing upregulated and downregulated genes, respectively. Screening of target gene sets during phase I (C) and phase II (F). Numbers in red indicate genes specifically upregulated in P93075 (1177 and 1213 genes in phases I and II, respectively) and genes commonly upregulated in both P93075 and S1174 but showing stronger induction in P93075 under the criterion of |ΔFC| ≥ 2 (150 and 86 genes, respectively). Combining these two groups yielded 1327 and 1299 target genes in phases I and II, respectively.
Agronomy 16 01740 g004
Figure 5. Clustering of the target differentially expressed gene (DEG) set. (A) Heatmap showing hierarchical clustering of the DEGs across samples from the thin-stem line (S1174) and thick-stem line (P93075). (B) Time-course expression patterns of DEGs clustered into four subclusters based on k-means clustering analysis. Grey lines represent individual gene expression profiles, the blue line indicates the mean expression trend within each cluster, and the red line represents the baseline.
Agronomy 16 01740 g005
Figure 6. Functional enrichment of the target differentially expressed gene set. (A) Gene Ontology (GO) analysis. (B) Kyoto Encyclopedia of Genes and Genomes (KEGG) analysis. Only representative enriched GO terms and KEGG pathways are shown.
Agronomy 16 01740 g006
Figure 7. Identification of the candidate gene LacEXT3. (A) Module–sample relationship patterns by weighted gene co-expression network analysis (WGCNA). (B) Hierarchical clustering and module eigengene correlation heatmap in WGCNA. An enlarged version is provided in Figure S3 for better readability. (C) Expression profiles of the 15 shared genes during phases I and II. (D) Co-expression network of the 13 genes assigned to the red module. Node size indicates connectivity degree, with Lac09g010260 showing the highest connectivity in the module.
Agronomy 16 01740 g007
Figure 8. Phylogenetic analysis of extensin proteins from Luffa and other plant species. The phylogenetic tree was constructed using extensin proteins from Luffa, Arabidopsis thaliana, rice, and cucumber using the neighbor-joining method with 1000 bootstrap replicates. The tree revealed two major extensin subfamilies, including the classical EXT and LRX groups. Different colors of the outer rings indicate different extensin subfamilies, while branch colors represent different phylogenetic clusters.
Agronomy 16 01740 g008
Figure 9. Preliminary characterization of the candidate gene LacEXT3. (A) Expression levels of LacEXT3 in S1174 and P93075 at the three key development stages of stem radial growth. (B) Schematic diagram of the LacEXT3 recombination vector. RT-PCR (C) and qRT-PCR (D) analyses confirmed the overexpression of LacEXT3 in three independent T3 transgenic lines. Lanes 1–3 represent independent LacEXT3-overexpression lines (OE#1, OE#2, and OE#3), and lane 4 represents wild-type Col-0 plants. (E) Representative phenotypes of LacEXT3-overexpression lines and wild-type Col-0 plants. Statistical analysis of stem diameter (F) and plant height (G) in three overexpression lines compared with wild-type Col-0 plants. Data are presented as mean ± SE, with three biological replicates for expression analysis and 10 independent plants for phenotypic measurements. Significant differences were determined by one-way ANOVA followed by Tukey’s multiple-comparison test, * p < 0.05, ** p < 0.01. Different lowercase letters indicate significant differences at p < 0.05.
Agronomy 16 01740 g009
Table 1. Statistics of stem transcriptome sequencing data.
SampleRaw ReadsClean ReadsQ20Q30GC (%)
S1174_1_140,397,50239,235,62896.5991.2543.94
S1174_1_245,678,54044,047,54696.7891.6643.90
S1174_1_342,938,69841,684,35696.6491.3943.13
S1174_2_140,154,50238,097,25297.2292.4843.88
S1174_2_240,670,71439,155,23497.2892.6645.38
S1174_2_341,897,71639,998,86897.2392.6245.00
S1174_3_144,515,55243,023,37497.4192.8843.18
S1174_3_240,299,74238,439,38296.9792.0342.51
S1174_3_343,483,36841,011,69097.1792.5043.03
P93075_1_143,401,93239,298,65897.5693.2143.99
P93075_1_242,986,54240,992,69697.5293.1245.68
P93075_1_342,156,79640,157,75697.3492.7444.85
P93075_2_141,407,18439,124,53497.2892.6244.42
P93075_2_242,922,63841,782,44697.4192.8944.58
P93075_2_343,924,39442,692,45097.1392.3044.13
P93075_3_141,662,23440,029,75897.3492.8144.51
P93075_3_239,985,38038,202,20297.3292.6844.64
P93075_3_339,495,38838,519,51897.5493.1645.33
Total757,978,822725,493,34897.2192.5044.23
Table 2. The 15 shared DEGs by phase I and phase II.
Gene NameGene Description
Lac09g010260Extensin-3
Lac09g020160WEB family protein
Lac01g004070Cytochrome b561 and DOMON domain-containing protein
Lac05g010060Ribosome-inactivating protein bryodin II-like
Lac04g017770AP2-like ethylene-responsive transcription factor ANT isoform X2
Lac13g001070MLP-like protein 328
Lac13g004470MLP-like protein 328
Lac02g002880beta-glucosidase 11 isoform X1
Lac00g006800CASP-like protein 2B1
Lac06g019890Uncharacterized protein
Lac06g001300Cytochrome P450 78A5-like
Lac07g011570zinc finger CCCH domain-containing protein 18 isoform X2
Lac03g004670Uncharacterized protein
novel.2061Uncharacterized protein
novel.2900Probable linoleate 9S-lipoxygenase 5
Note: The last three genes fall outside the red module.
Disclaimer/Publisher’s Note: The statements, opinions and data contained in all publications are solely those of the individual author(s) and contributor(s) and not of MDPI and/or the editor(s). MDPI and/or the editor(s) disclaim responsibility for any injury to people or property resulting from any ideas, methods, instructions or products referred to in the content.