Article

Water Availability Modulates Leaf Functional Trait Responses of Robinia pseudoacacia L. Seedlings to Nitrogen–Phosphorus Supply


1
School of Plant Protection and Environment, Henan Institute of Science and Technology, Xinxiang 453003, China
2
State Key Laboratory of Soil and Water Conservation and Desertification Control, Northwest A&F University, Yangling 712100, China
3
Department of Soil and Water Conservation, College of Forestry, Shanxi Agricultural University, Jinzhong 030801, China
*
Author to whom correspondence should be addressed.
Agronomy 2026, 16(15), 1479; https://doi.org/10.3390/agronomy16151479
Submission received: 10 June 2026 / Revised: 28 July 2026 / Accepted: 29 July 2026 / Published: 2 August 2026
(This article belongs to the Section Soil and Plant Nutrition)

Abstract

Water availability strongly influences nutrient utilization and plant adaptive strategies, yet how nitrogen (N) and phosphorus (P) supply interact with water conditions to regulate leaf functional traits remains insufficiently understood. In this study, Robinia pseudoacacia L. seedlings were subjected to contrasting water regimes combined with N and P additions to examine leaf morphological, structural, physiological, and stoichiometric traits. The results showed that water availability significantly modulated seedling responses to N and P supply. Under well-watered conditions, nutrient addition promoted leaf growth and biomass accumulation, whereas under water deficit, seedlings enhanced osmotic adjustment and altered resource allocation. Significant interactions among water, N, and P were observed for leaf morphological, physiological, and stoichiometric traits. Soil organic carbon (SOC), total nitrogen (TN), and available phosphorus (AP) in rhizosphere soil were the soil factors most strongly associated with the variation in leaf functional traits, among which SOC exhibited the highest explanatory power. Functional trait network analysis revealed that specific leaf area (SLA) and leaf nitrogen-to-phosphorus ratio (N:P) were identified as central hubs of the leaf trait network. Overall, drought shifted R. pseudoacacia seedlings from a resource-acquisitive strategy toward a resource-conservative and stress-tolerant strategy. This study elucidates the short-term response patterns of R. pseudoacacia seedlings to combined water and nutrient stress, providing preliminary insights for water and fertilizer management during seedling establishment in arid regions.

1. Introduction

Global climate change has become one of the most critical environmental challenges affecting terrestrial ecosystems, particularly in arid and semi-arid regions where resource limitation is increasingly intensified. Among various climate-related stressors, reduced water availability caused by the increasing frequency and severity of drought substantially constrains plant growth, physiological activity, and ecosystem functioning [1,2]. Concurrently, accelerated industrialization and agricultural activities have markedly increased atmospheric nitrogen deposition, thereby altering soil nutrient availability and plant nutrient acquisition patterns in many ecosystems [3,4]. In contrast, phosphorus availability remains strongly limited in many nutrient-poor soils because of its low mobility and restricted bioavailability, further constraining plant productivity and ecosystem stability [5]. As water and nutrient availability jointly regulate plant carbon assimilation, nutrient allocation, and stress resistance, plants frequently exhibit complex adaptive responses under simultaneous drought and nutrient fluctuations [6]. Previous studies have demonstrated that drought can reduce leaf nitrogen and phosphorus concentrations while promoting the accumulation of soluble sugars and starch, reflecting shifts in plant resource allocation and osmotic regulation strategies under resource limitation [7]. Moreover, nitrogen and phosphorus supply often exert strong interactive effects on plant growth and functional trait expression [6]. However, when drought occurs simultaneously with changes in nutrient availability, the responses of plant functional traits become highly context dependent and are strongly influenced by environmental conditions and species-specific resource-use strategies [8]. Although increasing evidence suggests that water and nutrient interactions play a fundamental role in shaping plant adaptation to environmental stress, the mechanisms through which water availability modulates plant responses to nitrogen and phosphorus supply remain insufficiently understood.
Leaf functional traits constitute a critical interface between plants and the external environment and provide important insights into plant ecological strategies and adaptive responses to environmental change [9]. Morphological, physiological, and stoichiometric leaf traits collectively reflect plant resource acquisition, nutrient utilization, photosynthetic performance, and stress tolerance [10,11]. In particular, leaf nitrogen and phosphorus contents are widely recognized as key indicators of plant nutritional status and ecological strategy, whereas leaf C:N:P stoichiometry provides important information on nutrient limitation and adaptive responses to environmental stress [12,13]. Owing to their high plasticity, leaf functional traits enable plants to optimize water use and maintain physiological stability under changing environmental conditions [14,15]. Under drought stress, plants commonly adopt conservative resource-use strategies characterized by increased leaf thickness, altered osmotic adjustment, and reduced transpiration water loss in order to maintain water balance and photosynthetic function [16,17]. In addition, nutrient availability can substantially modify leaf functional traits and thereby influence plant adaptation to environmental stress [18] Nitrogen addition generally promotes leaf nitrogen accumulation and photosynthetic capacity, whereas phosphorus supplementation may enhance nutrient utilization efficiency and stress tolerance under nutrient-deficient conditions [19]. Previous field studies have shown that nitrogen addition can significantly alter leaf nutrient concentrations and morphological traits, while the combined regulation of nitrogen and phosphorus jointly influences plant trait coordination and adaptive strategies [18]. Nevertheless, most previous studies have primarily focused on the independent effects of drought or nutrient addition, whereas the coordinated responses of leaf functional traits to coupled water and nutrient regulation remain poorly characterized.
Robinia pseudoacacia L. is an important afforestation and ecological restoration tree species widely distributed in warm temperate and semi-arid regions because of its rapid growth, strong environmental adaptability, and nitrogen-fixing capacity. Owing to these characteristics, R. pseudoacacia has been extensively used for vegetation restoration and soil and water conservation on the Loess Plateau and other drought-prone regions. Previous studies have shown that drought stress substantially constrains photosynthetic performance, reduces non-structural carbohydrate reserves, and aggravates hydraulic and gas exchange limitations in R. pseudoacacia, indicating a shift toward conservative survival strategies under water deficit conditions [20,21]. Considerable clonal variation in growth and ecophysiological performance has also been observed in R. pseudoacacia under dry environmental conditions, with coordinated variation among assimilation rate, transpiration rate, and growth traits [22,23]. At the species level, prolonged water limitation can induce reductions in transpiration and leaf area and substantially decrease above-ground biomass, whereas whole-plant water-use efficiency may remain relatively stable across different water regimes [24]. In addition, phosphorus limitation can alter biomass allocation and functional trait expression, and the combined effects of drought and phosphorus stress may further intensify leaf functional adjustments [5]. Despite increasing attention to the ecological adaptation of R. pseudoacacia, existing studies have mainly examined the effects of water or nutrient availability separately, whereas the interactive effects of water, nitrogen, and phosphorus on leaf functional trait coordination remain unclear. Therefore, this study established different soil moisture conditions combined with nitrogen and phosphorus supply treatments to investigate the coordinated responses of leaf functional traits in R. pseudoacacia seedlings. Specifically, this study aimed to: (1) evaluate the interactive effects of water availability and nitrogen–phosphorus supply on leaf morphological, structural, physiological, and stoichiometric traits; (2) determine the relationships between leaf functional traits and rhizosphere soil physicochemical properties; and (3) investigate the coordination patterns among leaf functional traits and identify key traits associated with trait network structure under contrasting water and nutrient conditions. We hypothesized that: (1) water availability significantly modulates the effects of nitrogen and phosphorus supply on leaf functional traits; (2) variations in leaf functional traits are closely associated with rhizosphere soil nutrient status and physicochemical properties; and (3) coordinated and trade-off relationships among leaf functional traits jointly reflect adaptive strategies of R. pseudoacacia seedlings under multiple resource stresses. This study provides new insights into the adaptive mechanisms of R. pseudoacacia under coupled water–nutrient stress and offers a theoretical basis for vegetation restoration and nutrient management in drought-prone and nutrient-limited ecosystems.

2. Materials and Methods

2.1. Experimental Design

The controlled pot experiment was conducted from March to September 2019 at the Institute of Soil and Water Conservation, Northwest A&F University, China. The experimental setup was placed under a retractable rain shelter to avoid natural rainfall interference and to maintain the target soil moisture conditions through manual watering based on daily weighing. The study site was located in Yangling, Shaanxi Province, on the southern margin of the Loess Plateau (34°17′ N, 108°04′ E). The region has a warm temperate semi-humid climate, with a mean annual precipitation of 632 mm, approximately 70% of which occurs from June to September, and a mean annual temperature of 13 °C.
In late March 2019, one-year-old R. pseudoacacia seedlings with an average height of approximately 20 cm were selected for the experiment. Each seedling was individually planted in a cylindrical plastic pot measuring 30 cm in diameter and 30 cm in height. A gravel layer (2–3 cm in diameter) was placed at the bottom of each pot, and a polyvinyl chloride (PVC) pipe with an inner diameter of 2 cm was installed along the inner wall of the pot. Irrigation through the PVC pipe reduced water loss caused by evaporation and prevented soil surface hardening resulting from direct surface irrigation. Nitrogen fertilizer (urea, 46% N) and phosphorus fertilizer (superphosphate, 16% P2O5) were applied once as basal fertilizers. Each pot was filled with 15 kg of soil or soil–fertilizer mixture. The soil was collected from the 0–20 cm topsoil layer of a local abandoned field. Before fertilizer application, the soil had a bulk density of 1.27 g cm−3, a pH of 8.29, a soil organic carbon content of 6.74 g kg−1, a total nitrogen content of 0.72 g kg−1, and a total phosphorus content of 0.72 g kg−1.
The experiment followed a completely randomized design with 16 water-fertilization treatment combinations, six replicates per treatment, and a total of 96 pots. Two soil moisture levels were established: 55% of field capacity (W1, drought treatment) and 75% of field capacity (W2, well-watered treatment). Nitrogen was applied at four levels: N0, no urea; N1, 0.2 g kg−1; N2, 0.4 g kg−1; and N3, 0.8 g kg−1. Phosphorus was applied at two levels: P0, no superphosphate; and P1, 0.6 g kg−1. Before drought treatment initiation, soil moisture was maintained at approximately 80% of field capacity to ensure seedling establishment and early growth. After drought treatment began, soil moisture was adjusted daily to the designated treatment level at 18:00 using the weighing method. A schematic diagram of the experimental procedure is shown in Figure 1.

2.2. Sample Collection and Measurements

After three months of drought treatment, three pots were randomly selected from the six biological replicates in each treatment group for leaf collection. Fully expanded and healthy leaves were collected from each seedling for leaf trait measurements. Leaf area (LA) was measured using a scanner (Epson Perfection V700 Photo, Seiko Epson Corporation, Suwa, Nagano, Japan), and leaf thickness (LT) was measured using a digital caliper (CD-6″ASX, Mitutoyo Corporation, Kawasaki, Japan). Fresh weight (FW) was determined immediately after sampling using an electronic balance (ME204, Mettler-Toledo GmbH, Greifensee, Switzerland). The leaf samples were then washed, air-dried, and rehydrated to full turgor before turgid weight (TW) was measured. Subsequently, the samples were heated at 105 °C for 30 min to inactivate enzymes, followed by oven-drying at 75 °C to constant weight using an electric thermostatic drying oven (Model 101-2, Shanghai Yiheng Scientific Instrument Co., Ltd., Shanghai, China). Dry weight (DW) was then determined using an electronic balance [25].
The leaf samples were ground into powder for the determination of soluble sugar, soluble protein, proline, carbon (C), nitrogen (N), and phosphorus (P) contents. Soluble sugar content was determined by the anthrone method; soluble protein content by the Coomassie brilliant blue method; proline content by the ninhydrin method; C content by the potassium dichromate volumetric method; N content by the Kjeldahl method; and P content by the vanadomolybdate yellow colorimetric method [25].
The calculated leaf traits included specific leaf area (SLA), leaf mass per area (LMA), leaf dry matter content (LDMC), leaf water content (LWC), relative water content (RWC), and leaf tissue density (LTD), which were calculated as follows [26].
Specific   leaf   area   SLA , cm 2 / g = leaf   area   cm 2 dry   weight   g
Leaf   mass   per   area   ( LMA , g / cm 2 ) = dry   weight   g leaf   area   cm 2
Leaf   dry   matter   content   LDMC ,   g / g = dry   weight   g saturated   fresh   weight   g
Leaf   total   water   content   LWC , % = fresh   weight dry   weight fresh   weight × 100 %
Leaf   relative   water   content   RWC , % = fresh   weight dry   weight saturated   fresh   weight dry   weight × 100 %  
Leaf   tissue   density   LTD , g / cm 3 = dry   weight   g leaf   area   cm 2 leaf   thickness   cm
Rhizosphere soil adhering to the surfaces of fine roots was collected using the shaking method and stored in sterile self-sealing bags. These rhizosphere soil samples were used for the determination of soil physicochemical properties. Soil pH was measured using the glass electrode method at a soil-to-water ratio of 1:2.5. Soil organic carbon (SOC) was determined by the potassium dichromate oxidation-external heating method, total nitrogen (TN) by the Kjeldahl method using a Kjeltec 8400 analyzer (FOSS Analytical A/S, Hillerød, Denmark), total phosphorus (TP) by the perchloric acid-sulfuric acid digestion colorimetric method using a visible spectrophotometer (Model 722S, Shanghai Precision Scientific Instrument Co., Ltd., Shanghai, China), available phosphorus (AP) by the sodium bicarbonate extraction-molybdenum-antimony spectrophotometric method, and ammonium nitrogen (NH4+-N) and nitrate nitrogen (NO3-N) using an AA3 continuous flow analyzer (Bran+Luebbe GmbH, Norderstedt, Germany) [25].

2.3. Data Analysis

To facilitate interpretation, the measured leaf traits were classified into four categories: morphological traits, including leaf area (LA), fresh weight (FW), turgid weight (TW), and dry weight (DW); structural traits, including leaf thickness (LT), specific leaf area (SLA), leaf mass per area (LMA), leaf dry matter content (LDMC), and leaf tissue density (LTD); physiological traits, including leaf water content (LWC), relative water content (RWC), soluble sugar (SS), soluble protein (SP), and proline (Pro); and stoichiometric traits, including carbon (C), nitrogen (N), phosphorus (P), carbon-to-nitrogen ratio (C:N), carbon-to-phosphorus ratio (C:P), and nitrogen-to-phosphorus ratio (N:P).
The plasticity index (PI) was used to quantify the responsiveness of leaf traits to environmental stress and thereby reflect the degree of trait plasticity [27]. For each trait, PI was calculated as the difference between the maximum and minimum values divided by the maximum value. PI values range from 0 to 1, with higher values indicating stronger plastic responses to environmental variation. PI values were calculated for all measured leaf traits, and representative traits were compared across treatments.
Raw data were initially organized in Microsoft Excel 2019, and all results were presented as mean ± standard deviation (SD, n = 3). Three-way analysis of variance (ANOVA) was used to test the main effects of water, nitrogen, and phosphorus, as well as their interactions (W × N, W × P, N × P, and W × N × P). The coefficient of determination (R2) of the three-way ANOVA model was used to quantify the proportion of total variation in each response variable explained collectively by the three experimental factors and their interactions. Prior to the three-way ANOVA, the Shapiro–Wilk test and Levene’s test were performed to assess the normality of model residuals and homogeneity of variance, respectively. For several response variables, one or both assumptions were violated. Therefore, bootstrap resampling with 1000 iterations was adopted as a supplementary approach to test the robustness of treatment effects. The bias-corrected and accelerated (BCa) bootstrap method was used to construct the 95% confidence intervals (CIs) for the estimated treatment effects; a treatment effect was considered supported by the bootstrap analysis when its 95% CI did not contain zero. Since the bootstrap results were consistent with the significance patterns obtained from the three-way ANOVA, the F-values and p-values from the ANOVA were retained as the primary basis for reporting treatment effects. Duncan’s multiple range test was used for multiple comparisons among treatments at a significance level of α = 0.05. Descriptive statistical analyses were conducted using IBM SPSS Statistics (version 27.0.1.0). Data visualization was performed using Canoco (version 5.02), Origin 2021 (version 9.8.0.200), and R (version 4.4.3; https://www.r-project.org/). Specifically, Canoco was used to generate redundancy analysis (RDA) plots, Origin 2021 was used to produce bar charts and Pearson correlation heatmaps, and R 4.4.3 was used for network analysis and Mantel test visualizations.
For the functional trait network analysis, all raw data were first standardized to eliminate differences in measurement scales and improve comparability among traits. A Pearson correlation matrix was then constructed based on the standardized data. To build a robust trait network, a dual filtering criterion was applied, and only significant correlations meeting both false discovery rate (FDR)-adjusted p < 0.05 and absolute correlation coefficient |r| ≥ 0.2 were retained. The filtered correlations were used to construct an adjacency matrix, from which an undirected weighted network was generated. Edge weights were defined as the absolute values of the correlation coefficients, whereas edge attributes retained the original correlation coefficients. Network topological properties were calculated using the igraph package in R, and the network was visualized using the qgraph and igraph packages.
Mantel tests were performed to evaluate the overall associations between leaf trait categories and rhizosphere soil physicochemical properties as a complementary analysis to the Pearson correlation analysis. The measured leaf traits were classified into four groups: morphological, structural, physiological, and stoichiometric traits. Gower distance was used to construct the distance matrix for each leaf trait group, whereas Euclidean distance was used to construct the distance matrix for the soil environmental variables. For graphical presentation, the absolute Mantel correlation coefficients were classified into three levels (<0.20, 0.20–0.40, and ≥0.40), and the corresponding p values were classified as <0.01, 0.01–0.05, and ≥0.05.
To examine the associations between leaf functional traits and rhizosphere soil physicochemical properties, DCA was first conducted to determine whether a linear or unimodal constrained ordination method was appropriate. The maximum gradient length obtained from the DCA was 0.14 standard deviation units, which was below the threshold of 3 adopted in this study. This result indicated that a linear response model was more appropriate for the present dataset than a unimodal response model. Therefore, RDA, rather than canonical correspondence analysis, was used for the subsequent constrained ordination. In the RDA, leaf functional traits were treated as response variables, whereas rhizosphere soil physicochemical properties were treated as explanatory variables. Variance inflation factors were calculated to evaluate multicollinearity among the explanatory variables. All retained soil variables had VIF values below 2.0, indicating no substantial multicollinearity.

3. Results

3.1. Plasticity and Network Characteristics of Leaf Traits in R. pseudoacacia Seedlings

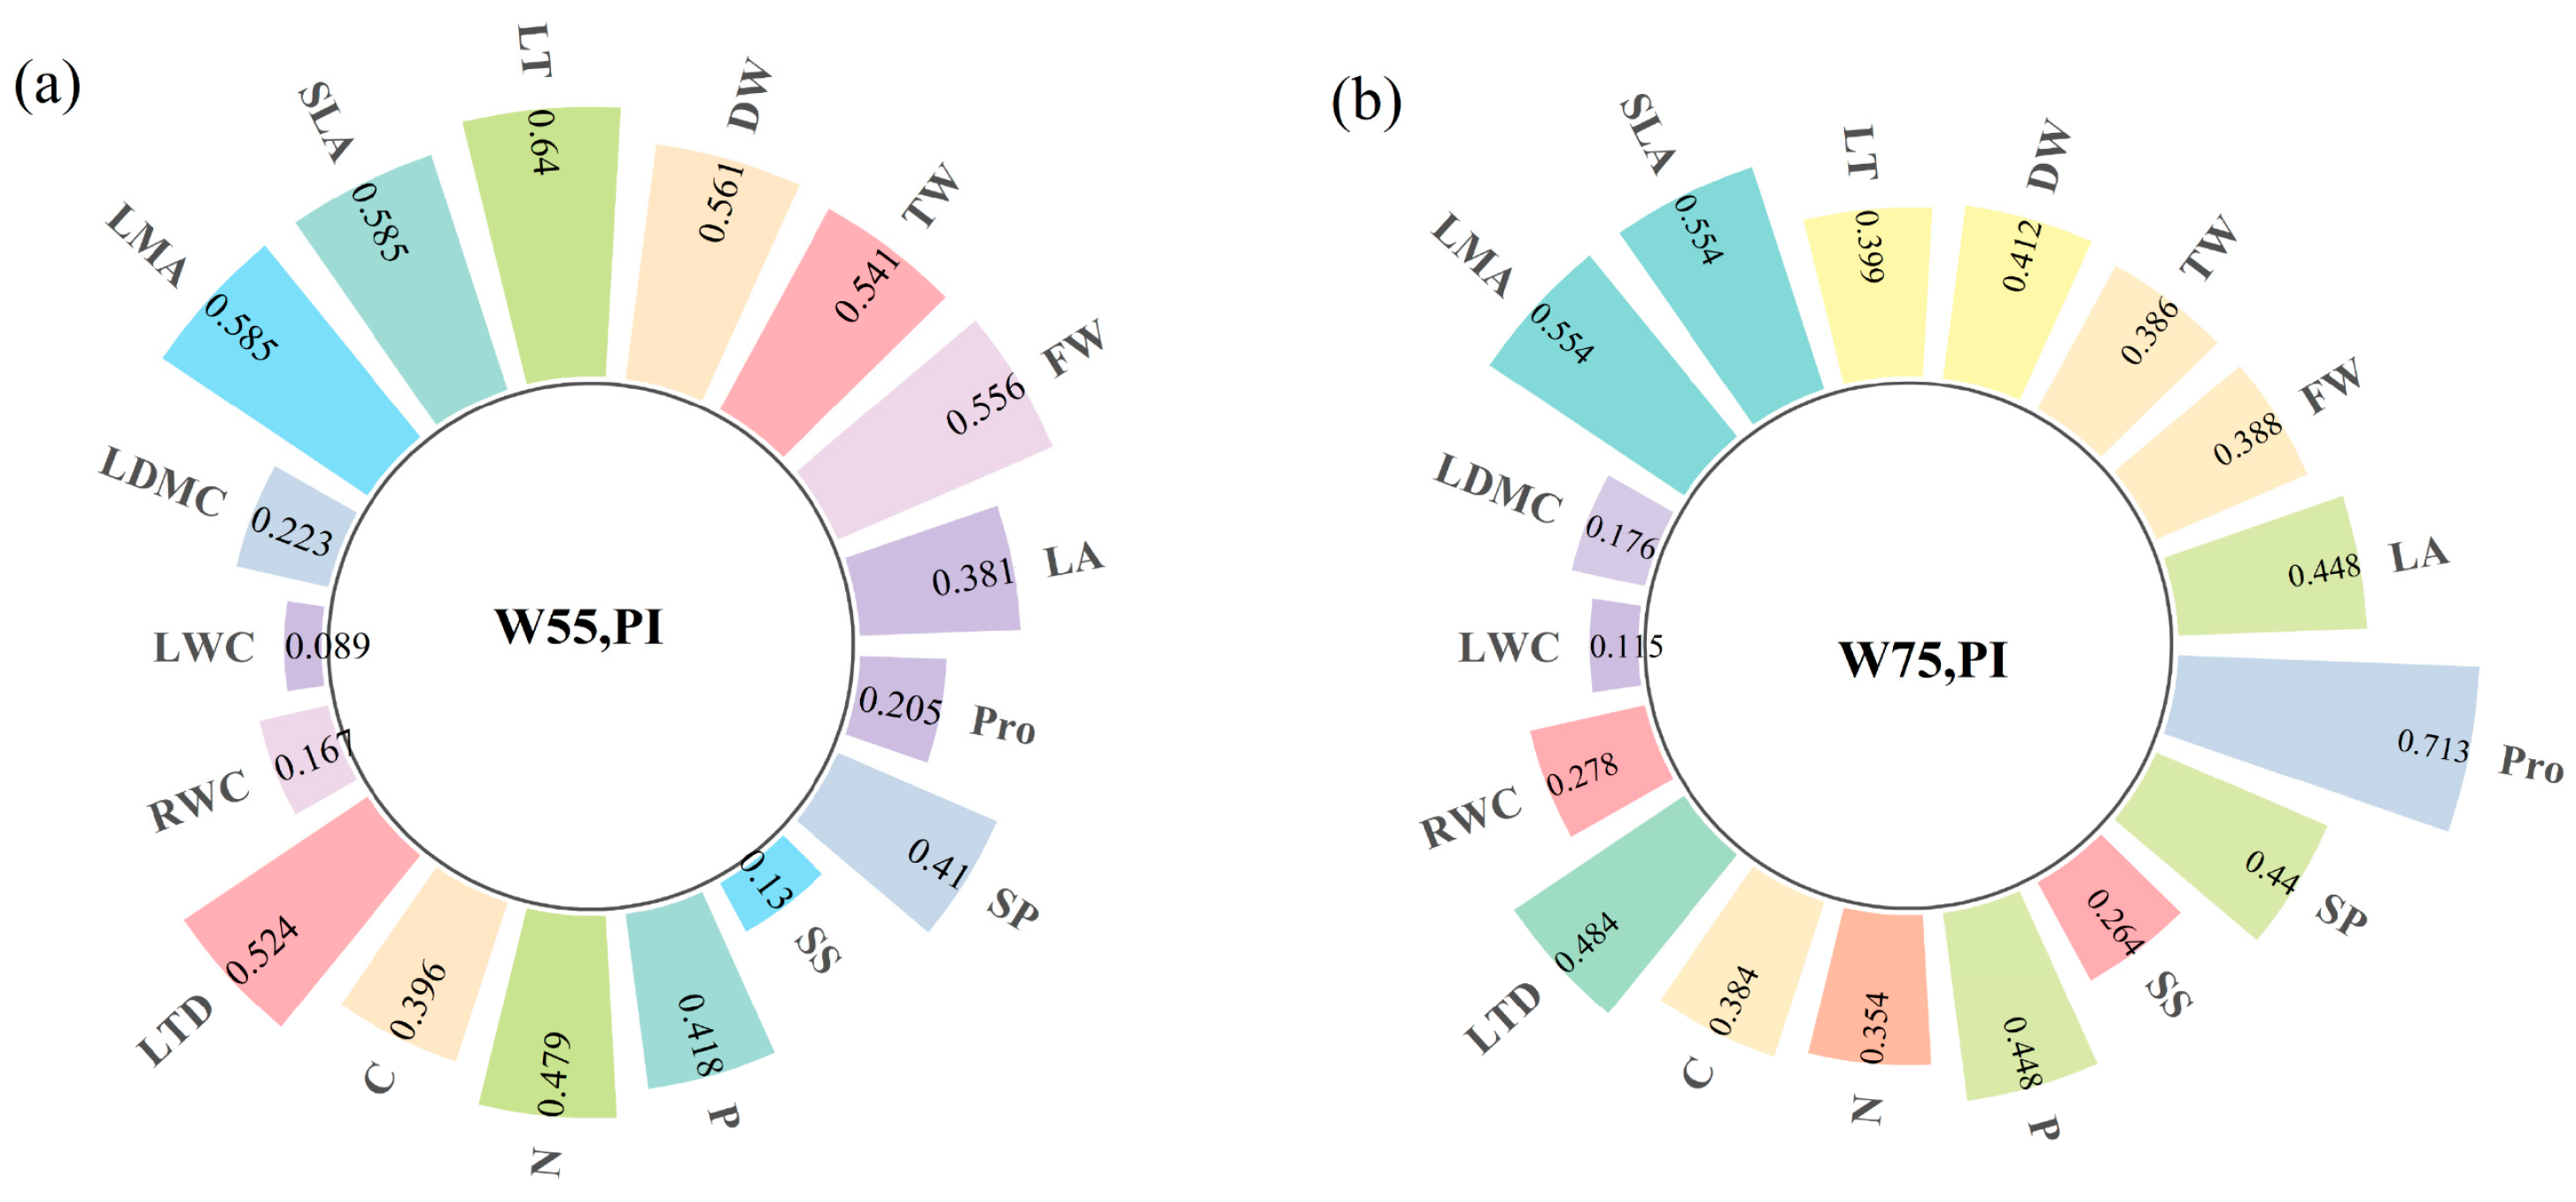
As shown in Figure 2, the plasticity of leaf structural and physiological traits in R. pseudoacacia seedlings differed under different water supply conditions. The calculated plasticity index (PI) values showed that, under drought conditions, LT, LMA, SLA, DW, TW, and FW exhibited markedly higher PI values than LWC, RWC, SS, and Pro (Figure 2a). Under well-watered conditions, Pro showed the highest PI value, followed by SLA and LMA, whereas LTD also exhibited relatively high plasticity (Figure 2b).
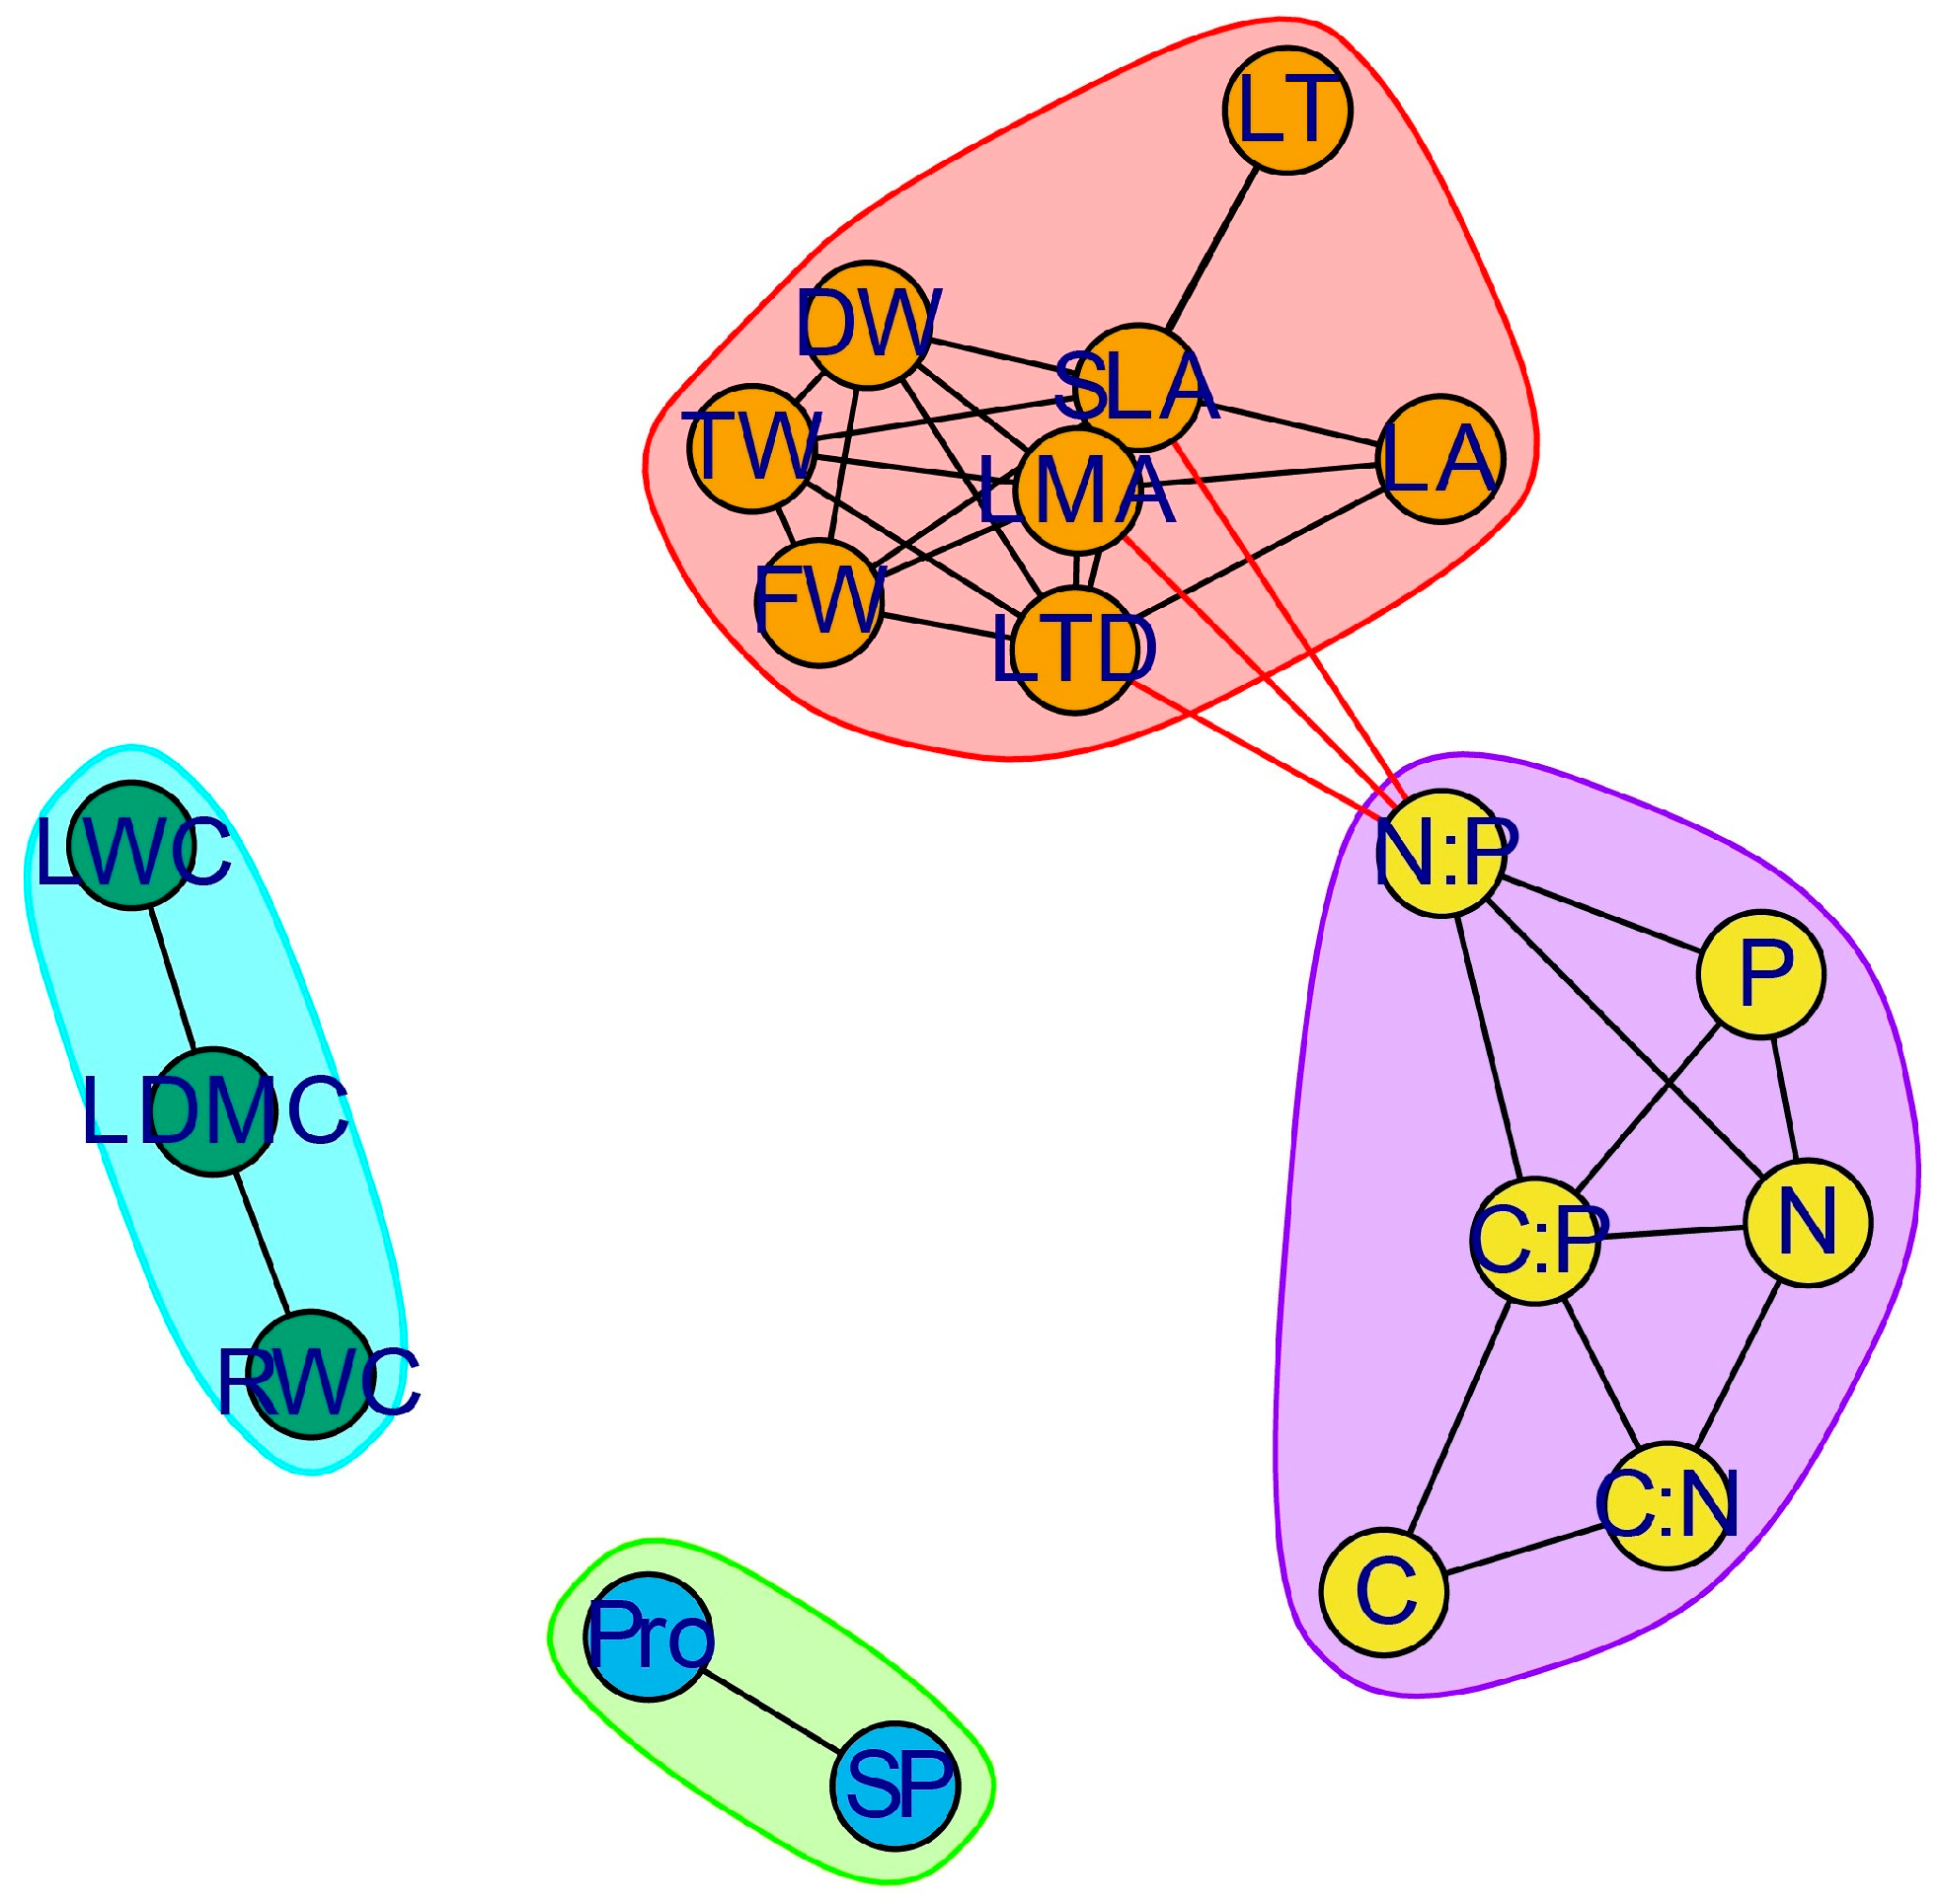
As shown in Figure 3, the constructed leaf trait network was an undirected network in which nodes represented leaf traits and edges represented significant correlations among traits. Pro and SP in the green cluster, as well as RWC, LDMC, and LWC in the blue cluster, showed no direct connections with traits in the other colored clusters, indicating that these traits had no significant direct correlations with those traits. Within the purple cluster, C:P was directly connected with C, C:N, N, P, and N:P, while N was directly connected with C:N, C:P, P, and N:P, indicating that these traits were significantly correlated with multiple chemical traits. In the red cluster, SLA showed the highest centrality and was closely associated with all other nodes in the cluster, indicating that it played a key role in the structural trait network of R. pseudoacacia seedlings. In addition, N:P was connected with SLA, LMA, and LTD, suggesting that this node acted as a bridge linking chemical traits with structural traits. Overall, the results indicated that SLA and N:P were the key nodes in the leaf trait network of R. pseudoacacia seedlings, jointly forming the core endpoints of the resource allocation trade-off axis and exerting an important influence on the overall coordination of leaf traits.

3.2. Differential Responses of Leaf Trait Categories to Water, Nitrogen, and Phosphorus Treatments in R. pseudoacacia Seedlings

3.2.1. Responses of Leaf Morphological Traits to Water, Nitrogen, and Phosphorus Treatments

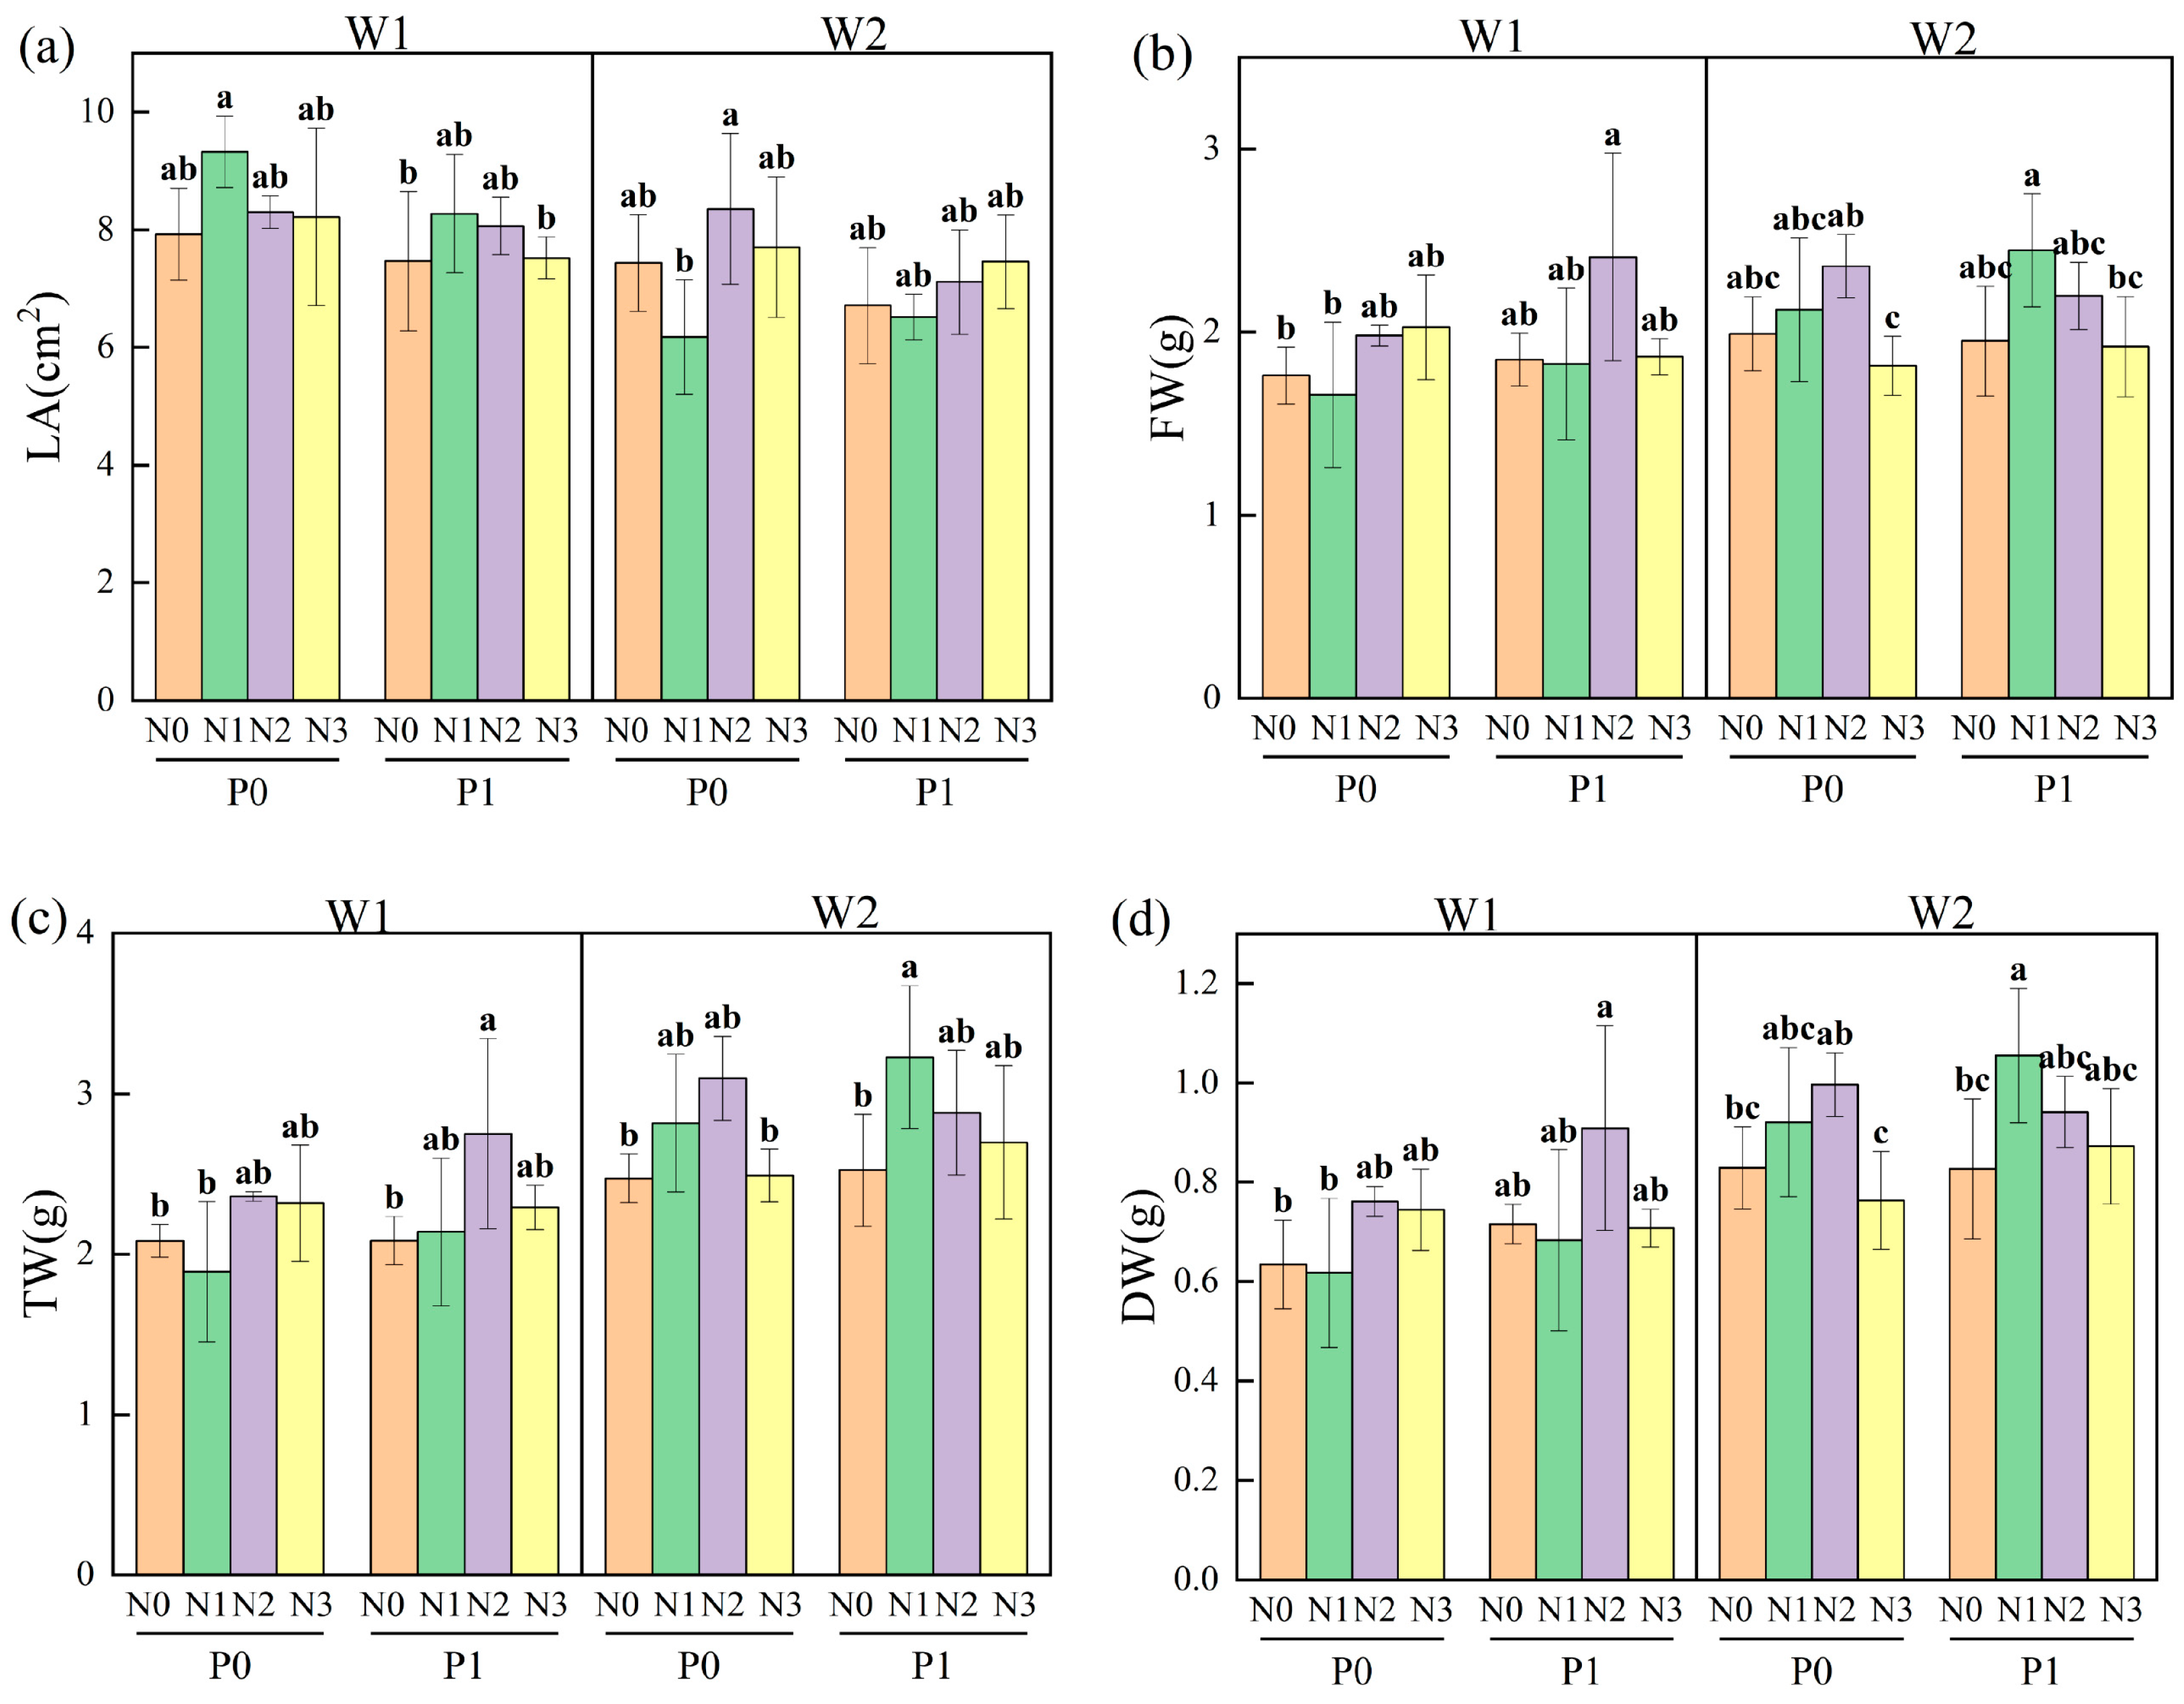
Three-way analysis of variance (ANOVA) (Table 1) revealed that water availability (W, F = 26.882, p < 0.001) and the water × nitrogen interaction (W × N, F = 3.674, p = 0.022) had significant effects on leaf area (LA), whereas nitrogen addition, phosphorus addition, and all other interaction terms showed no significant effects on LA. Nitrogen addition significantly affected fresh weight (FW, F = 3.556, p = 0.025), turgid weight (TW, F = 3.904, p = 0.017) and dry weight (DW, F = 3.795, p = 0.019), whereas water availability, phosphorus addition, and all interaction terms had no significant effects on FW, TW, or DW. To further characterize differences among specific nitrogen–phosphorus treatment combinations, treatment means were compared separately within each water regime (Figure 4). Under drought conditions, combined nitrogen and phosphorus treatments significantly affected leaf morphological traits, including LA, FW, TW, and DW (Figure 4). Specifically, compared with the control treatment (N0P0), the N2P1 treatment significantly increased FW, TW, and DW by 36.71%, 32.14%, and 43.37%, respectively (Figure 4b–d). Under well-watered conditions, combined nitrogen and phosphorus treatments also significantly affected leaf morphological traits, including LA, FW, TW, and DW (Figure 4). Specifically, compared with the control treatment (N0P0), the N1P1 treatment significantly increased TW and DW by 30.66% and 27.31%, respectively (Figure 4c,d).
Overall, the morphological traits of R. pseudoacacia seedlings were not uniformly affected by water, nitrogen, phosphorus, or their interactions. The full three-way ANOVA model explained 60.2% of the variation in leaf area (LA; R2= 0.602), with water availability and the W × N interaction showing significant effects. In contrast, fresh weight (FW), turgid weight (TW), and dry weight (DW) were primarily affected by nitrogen addition. Under drought conditions, the N2P1 treatment significantly increased FW, TW, and DW relative to the N0P0 control. Under well-watered conditions, the N1P1 treatment significantly increased TW and DW relative to the control.

3.2.2. Responses of Leaf Structural Traits to Water, Nitrogen, and Phosphorus Treatments

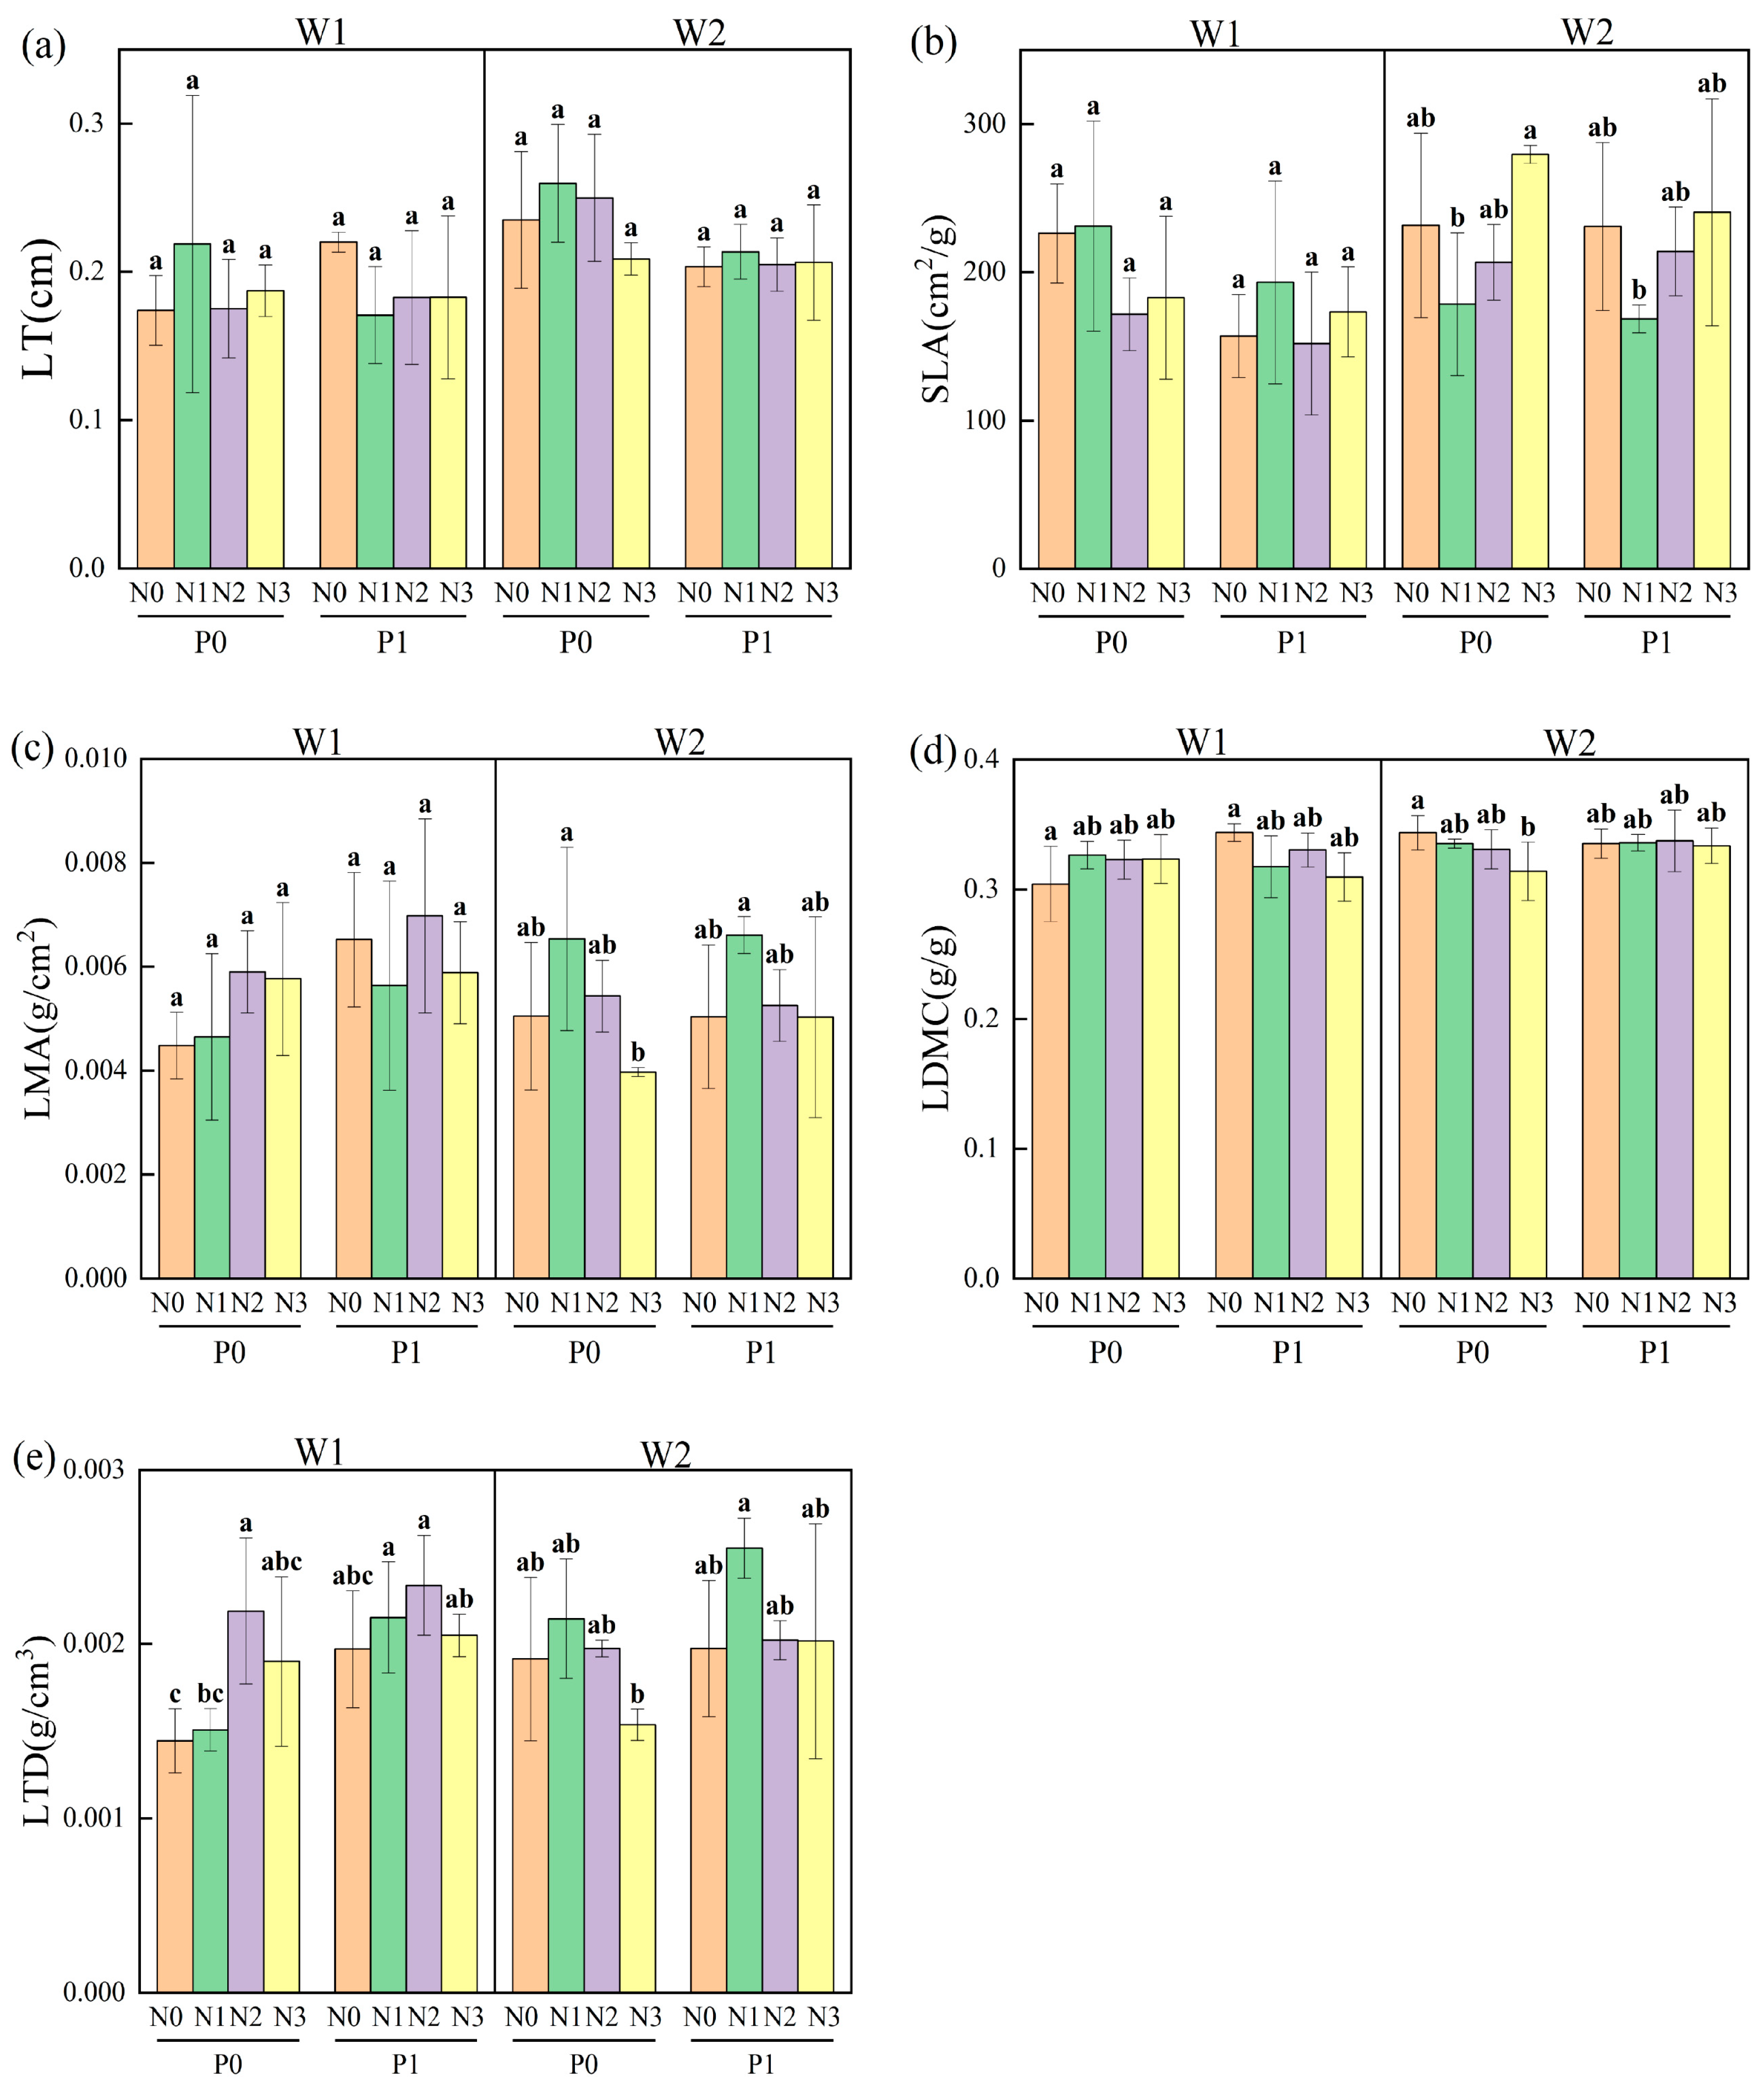
The three-way ANOVA results (Table 2) showed that water availability significantly affected specific leaf area (SLA, F = 5.861, p = 0.021), leaf mass per area (LMA, F = 6.083, p = 0.019), leaf dry matter content (LDMC, F = 5.159, p = 0.029), and leaf tissue density (LTD, F = 9.051, p = 0.005); phosphorus addition significantly affected LTD (F = 10.778, p = 0.002); the water × nitrogen interaction significantly affected SLA (F = 3.536, p = 0.025) and LTD (F = 3.810, p = 0.019); and the water × nitrogen × phosphorus interaction significantly affected LDMC (F = 3.136, p = 0.038). In contrast, phosphorus addition had no significant effects on the other structural traits, and neither the water × phosphorus interaction nor the nitrogen × phosphorus interaction significantly affected the measured structural traits. To further examine the effects of water, nitrogen, phosphorus, and their interactions on leaf structural traits, treatment comparisons were conducted separately under the two water regimes (Figure 5). Multiple comparisons revealed that under drought conditions, compared with the control treatment (N0P0), the N2P0, N1P1, N2P1, and N3P1 treatments significantly increased LTD by 52.08%, 49.30%, 61.80%, and 43.26%, respectively (Figure 5e). Under well-watered conditions, compared with the control treatment (N0P0), the N3P0 treatment significantly decreased LDMC by 8.74% (Figure 5d).
Overall, among the leaf structural traits, specific leaf area (SLA) and leaf tissue density (LTD) were significantly affected by both water availability and the water × nitrogen interaction, and LTD was additionally affected by phosphorus addition. Leaf mass per area (LMA) was primarily affected by water availability, whereas leaf dry matter content (LDMC) was mainly affected by water availability and the three-way water × nitrogen × phosphorus interaction. Leaf thickness (LT) showed no significant response to any individual factor or interaction, indicating that not all leaf structural traits were jointly affected by water, nitrogen, and phosphorus. Under drought conditions, combined nitrogen and phosphorus application generally increased LTD, thereby enhancing structural characteristics associated with drought resistance. Under well-watered conditions, the high-nitrogen, low-phosphorus treatment (N3P0) significantly reduced LDMC, indicating plasticity in leaf structural responses. These results suggest that R. pseudoacacia may adjust its resource-use and adaptive strategies by modifying leaf structural traits under different water–nutrient combinations.

3.2.3. Responses of Leaf Physiological Traits to Water, Nitrogen, and Phosphorus Treatments

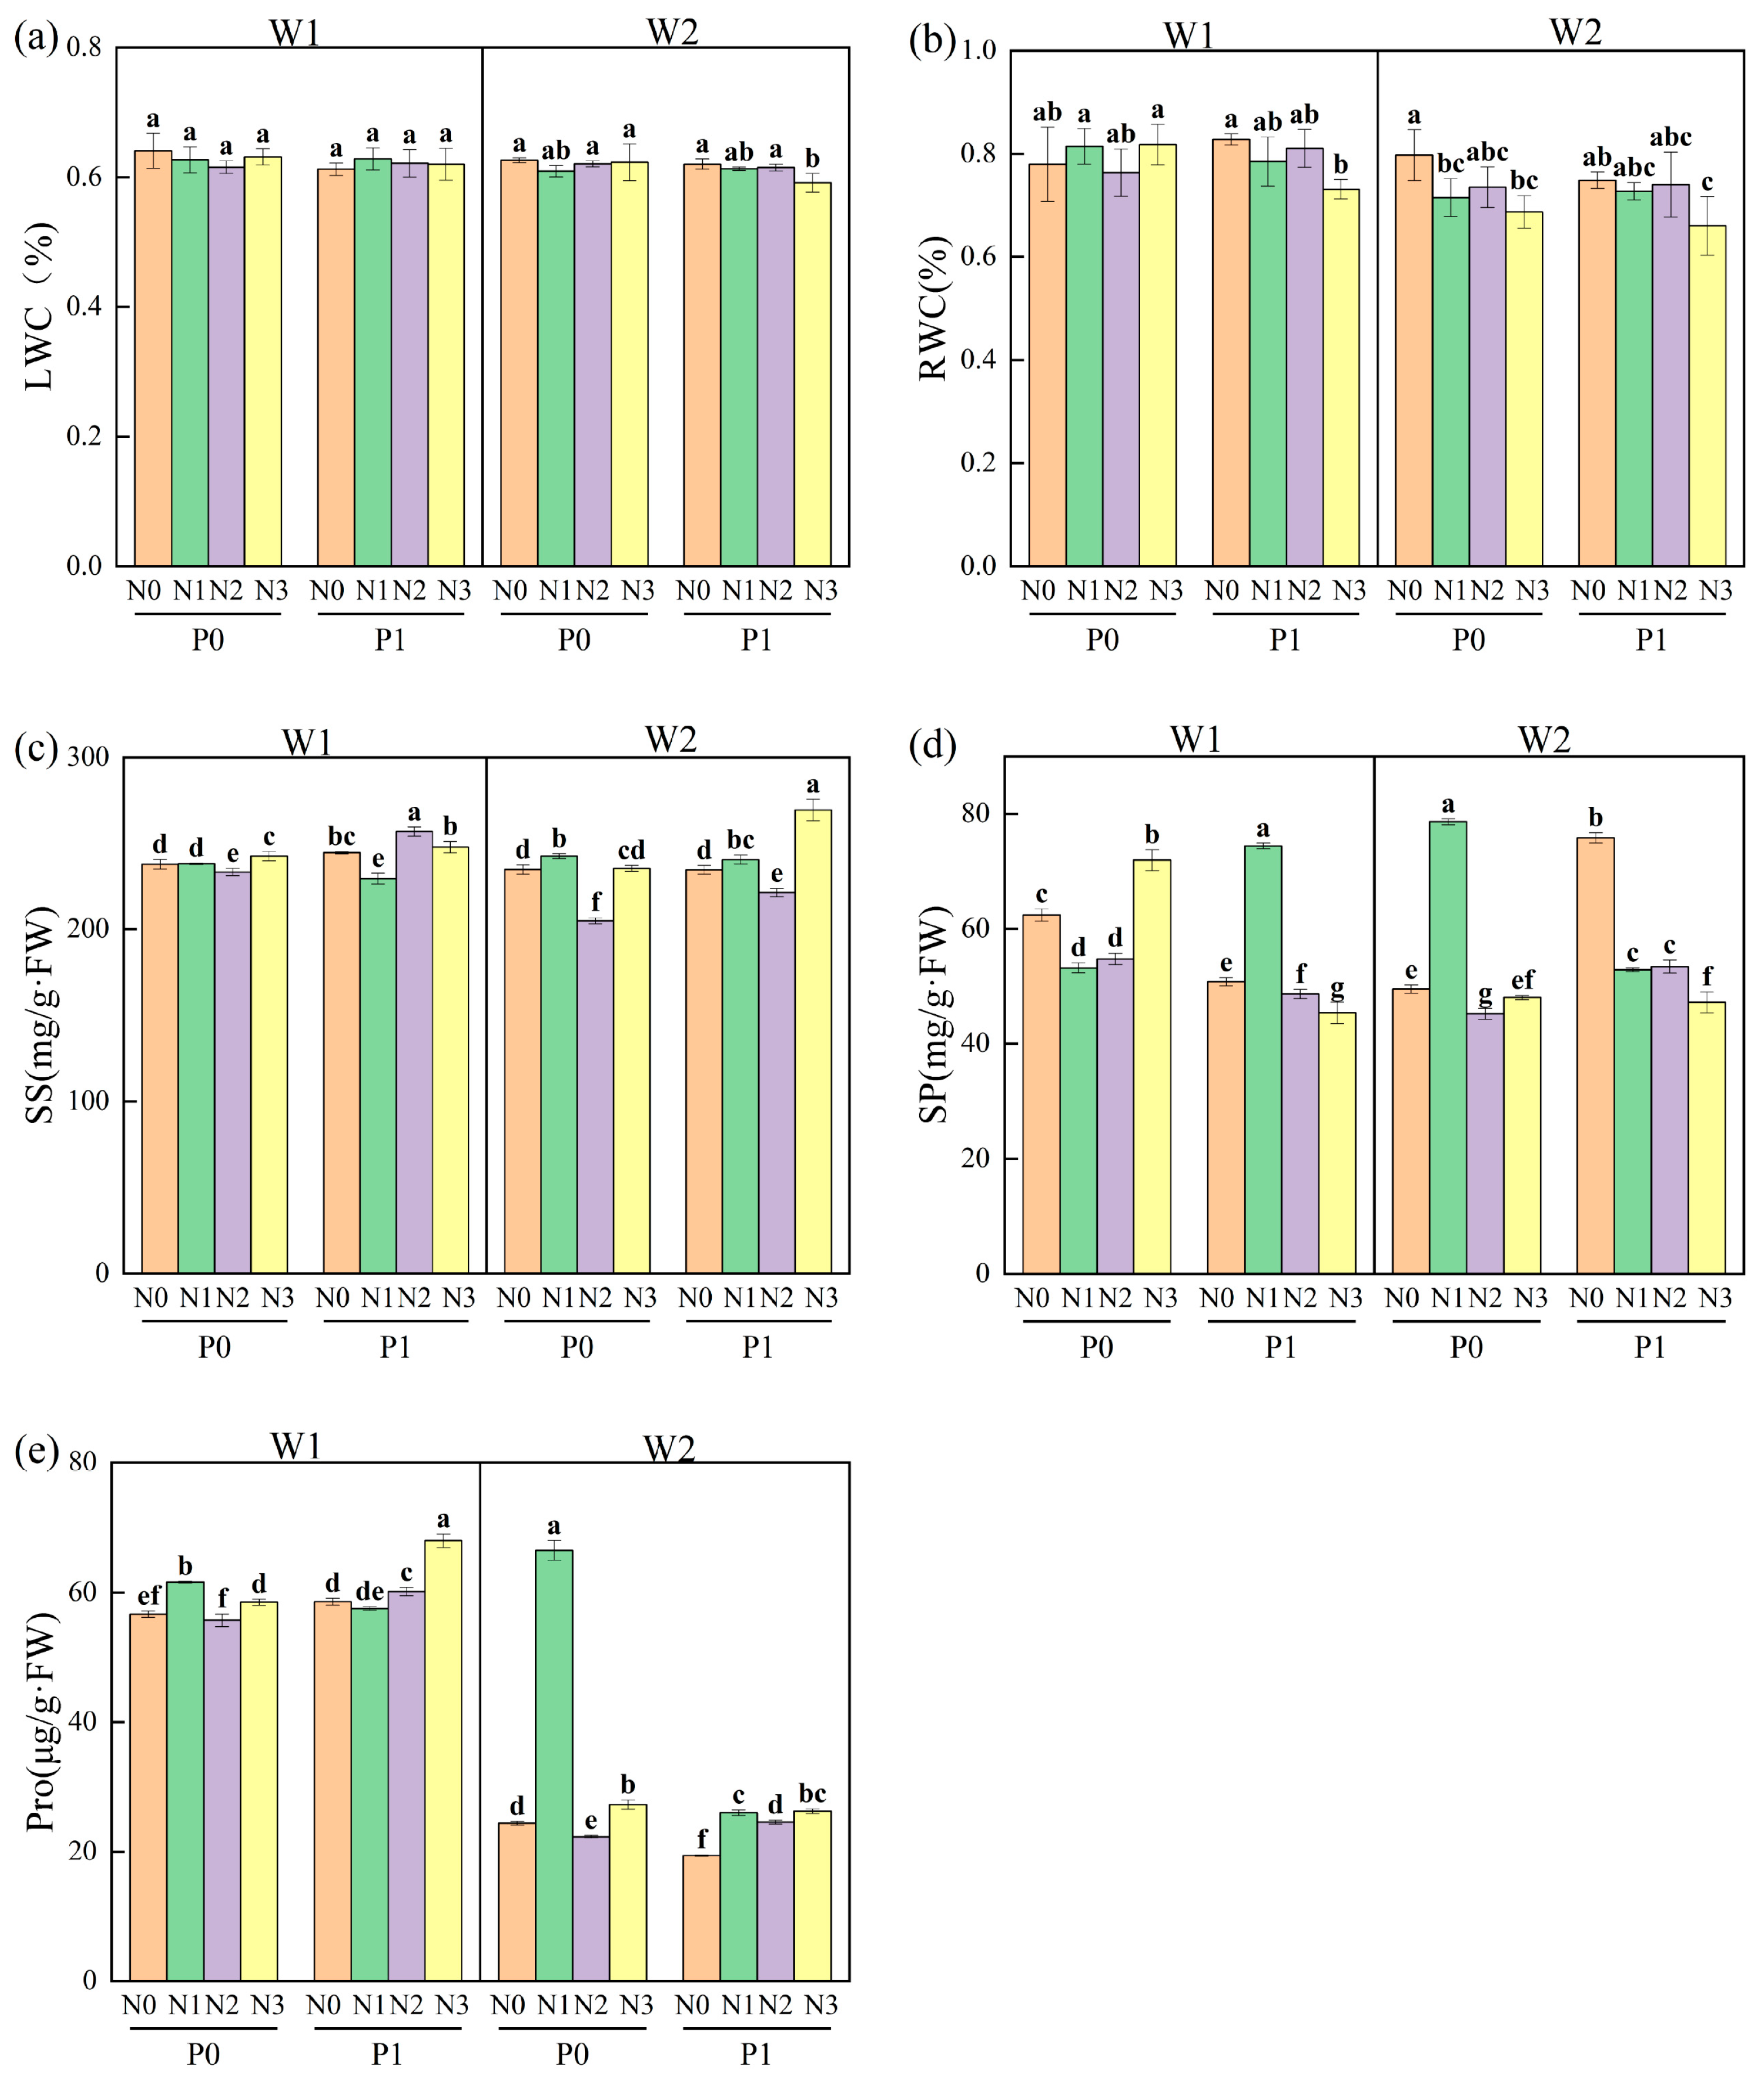
Three-way ANOVA results (Table 3) revealed that water availability significantly affected leaf water content (LWC, F = 4.531, p = 0.041), while nitrogen addition significantly affected relative water content (RWC, F = 4.987, p= 0.005). Soluble sugar (SS), soluble protein (SP), and proline (Pro) were each significantly affected by water, nitrogen, phosphorus, and their interactions. Notably, the three-way water × nitrogen × phosphorus interaction significantly affected SS, SP, and Pro (p < 0.001 for all), indicating that the physiological responses to N and P supply depended strongly on water availability. To further elucidate the specific effects of water, nitrogen, phosphorus, and their interactions on physiological traits, treatment comparisons were conducted separately under the two water regimes (Figure 6). Multiple comparisons revealed that, under drought conditions, combined nitrogen and phosphorus applications significantly altered the contents of SS, SP, and Pro (Figure 6): relative to the N0P0 control, some treatments increased SS, SP, or Pro, whereas others reduced SS or SP. Under well-watered conditions, N and P treatments significantly affected all physiological traits (Figure 6): the N3P1 treatment significantly decreased LWC by 16.96% compared with N0P0; RWC was significantly reduced under multiple treatments relative to the control; and SS, SP, and Pro exhibited either increases or decreases depending on the specific N-P combination.
Overall, the physiological traits of R. pseudoacacia seedlings displayed divergent response patterns to water and nutrient treatments. LWC was primarily affected by water availability, RWC was primarily affected by nitrogen addition, whereas SS, SP, and Pro showed significant W × N × P interaction effects, suggesting that the effects of N and P on the accumulation of osmotic adjustment compounds were modulated by the specific combination of water and nutrient conditions.

3.2.4. Responses of Leaf Chemical Traits to Water, Nitrogen, and Phosphorus Treatments

Three-way ANOVA results (Table 4) showed that water availability had no significant effects on leaf carbon (C), nitrogen (N), phosphorus (P), or their stoichiometric ratios (C:N, C:P, and N:P). Nitrogen addition significantly affected C (F = 4.837, p = 0.006), N (F = 5.480, p = 0.003), and the N:P ratio (F = 5.928, p = 0.002). Phosphorus addition significantly affected the C:N ratio (F = 6.187, p = 0.018) and the N:P ratio (F = 7.940, p = 0.008). Regarding interaction effects, the water × nitrogen interaction (W × N) significantly affected C (F = 4.661, p = 0.008) and N (F = 3.907, p = 0.017); the water × phosphorus interaction (W × P) significantly affected the N:P ratio (F = 7.735, p = 0.009); the nitrogen × phosphorus interaction (N × P) significantly affected N (F = 2.947, p = 0.047), P (F = 4.947, p = 0.006), the C:P ratio (F = 2.898, p = 0.050), and the N:P ratio (F = 4.140, p = 0.013); and the three-way water × nitrogen × phosphorus interaction (W × N × P) significantly affected N (F = 4.129, p = 0.013), the C:N ratio (F = 3.043, p = 0.042), and the N:P ratio (F = 3.799, p = 0.019).
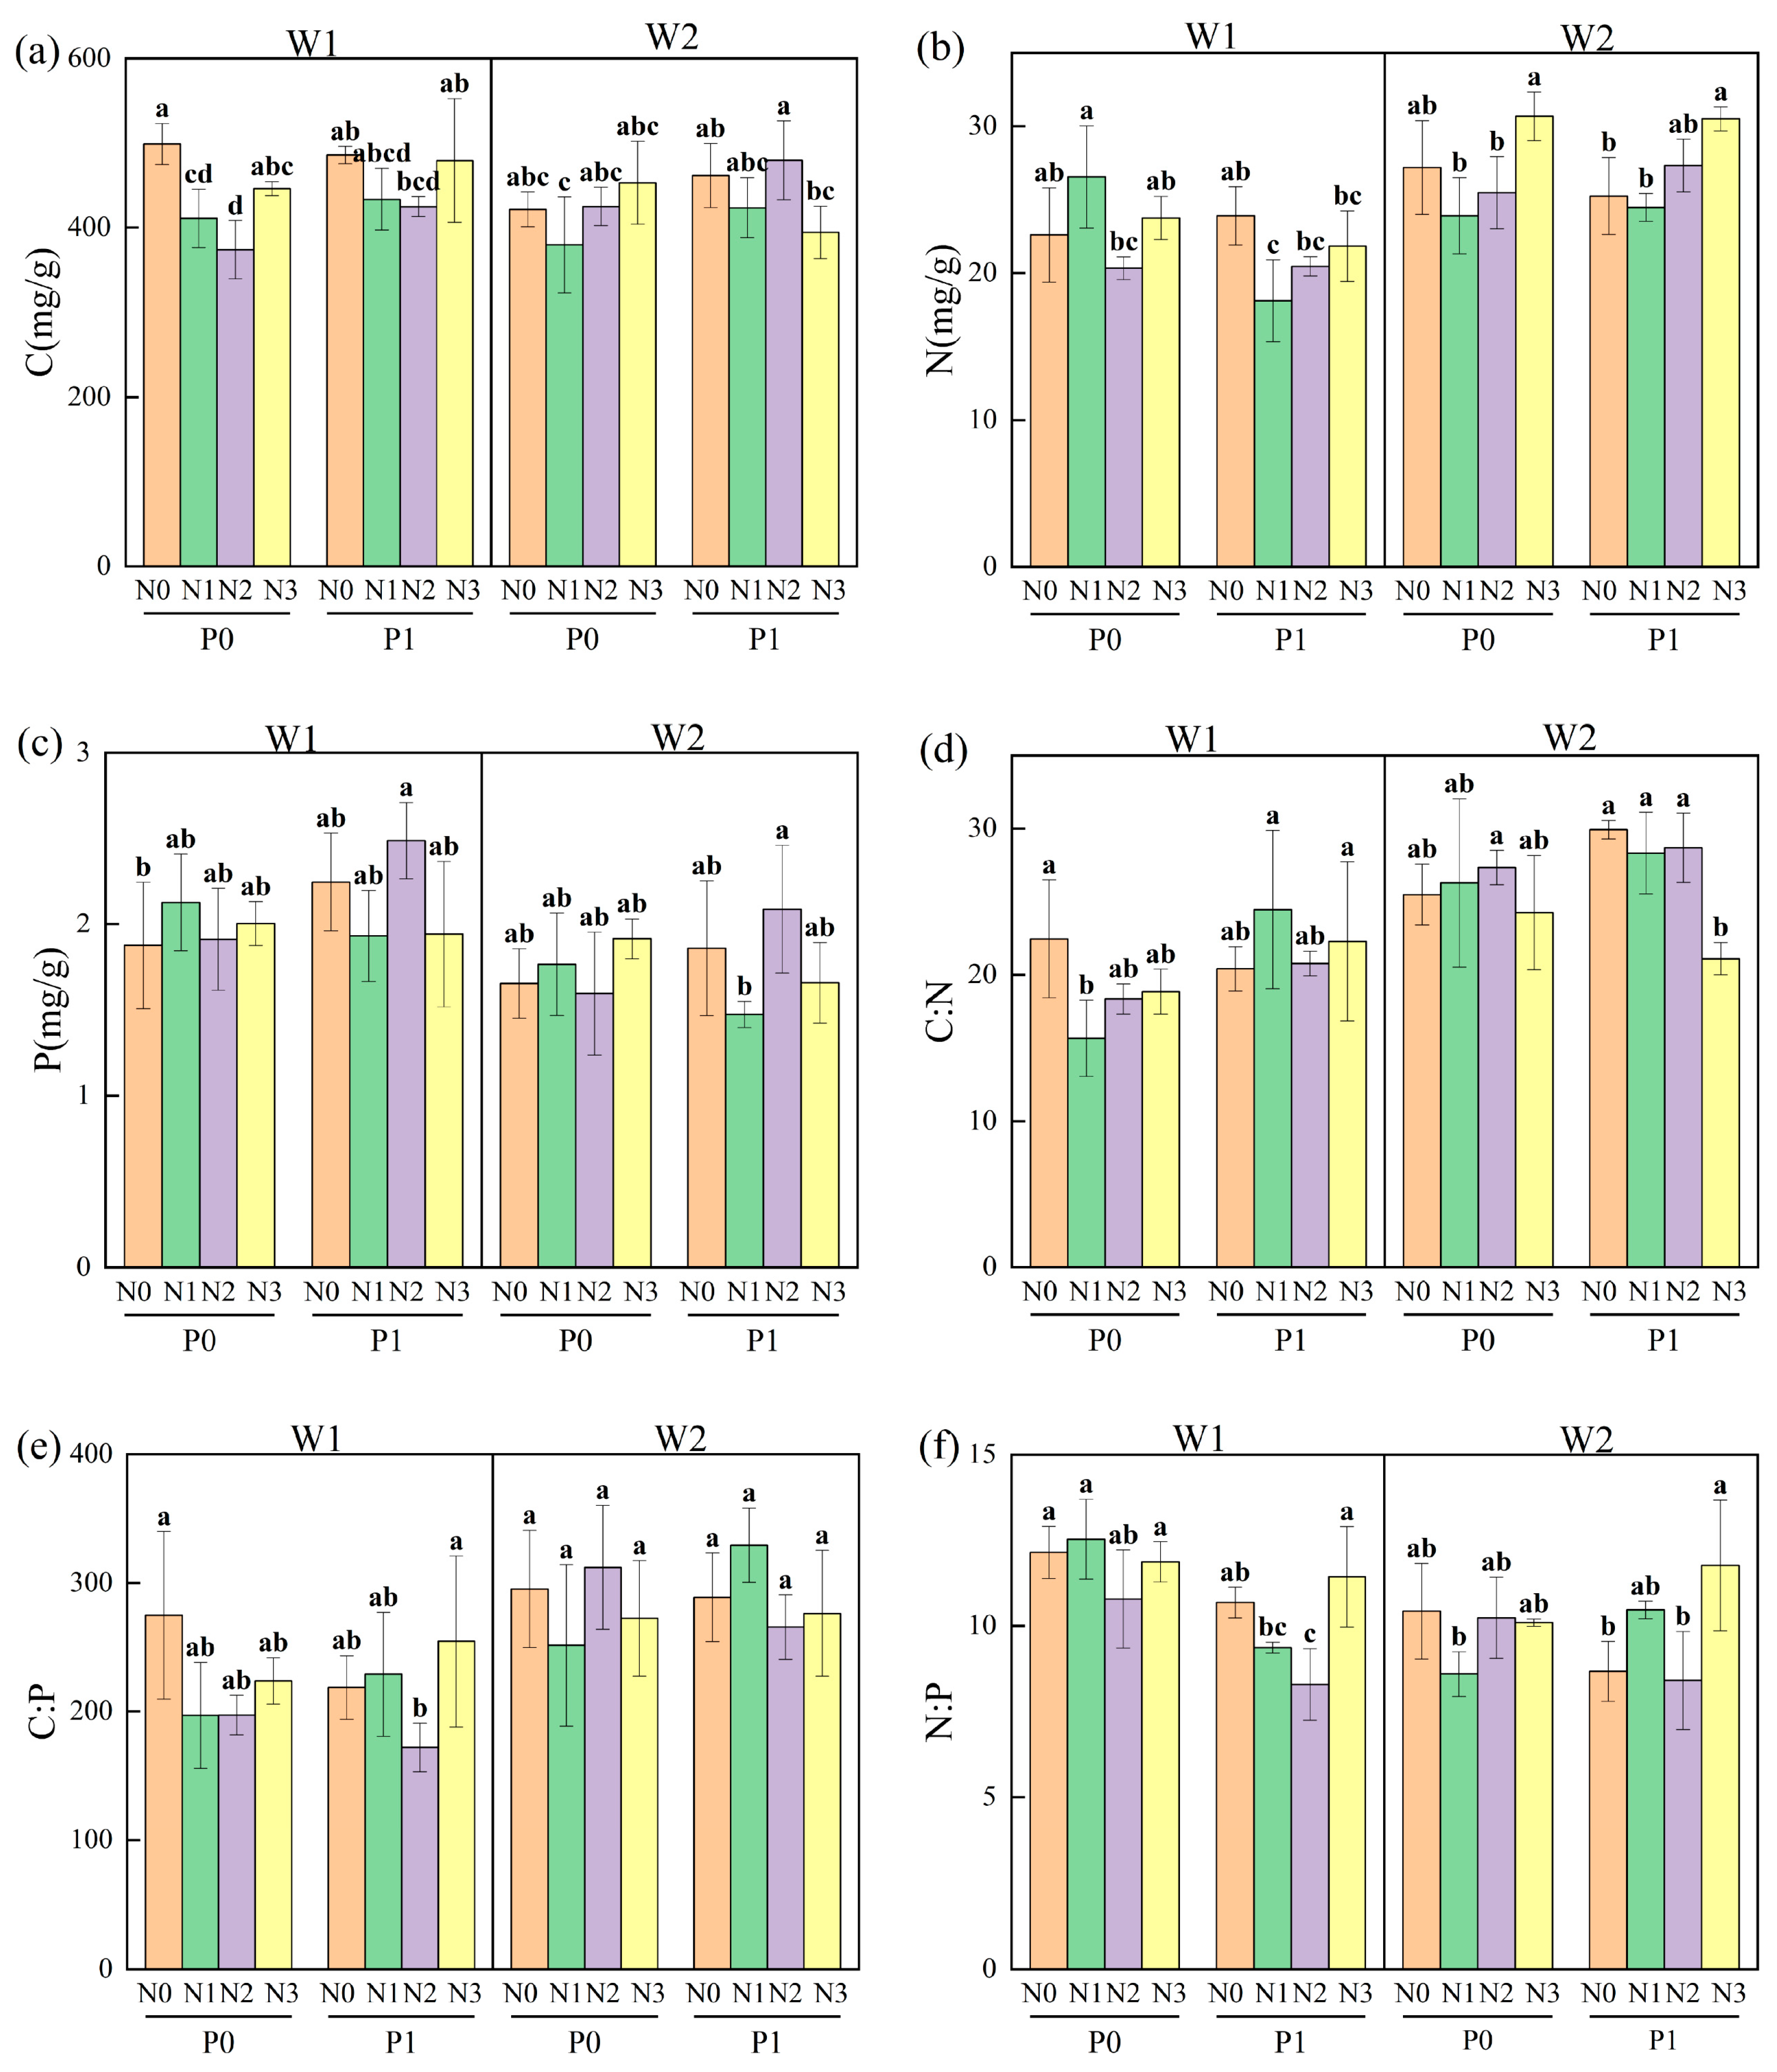
To further characterize the specific effects of water, nitrogen, phosphorus, and their interactions on leaf chemical traits, treatment comparisons were conducted separately under the two water regimes (Figure 7). Multiple comparisons revealed that under drought conditions, combined nitrogen and phosphorus treatments significantly affected leaf chemical traits of R. pseudoacacia seedlings, including C, N, P, C:N, C:P, and N:P (Figure 7). Compared with the control treatment (N0P0), the N1P0, N2P0, and N2P1 treatments significantly decreased C content by 17.63%, 25.11%, and 14.83%, respectively (Figure 7a). Relative to the control, the N1P1 treatment significantly decreased N content by 19.86% (Figure 7b), whereas the N2P1 treatment significantly increased P content by 32.56% (Figure 7c). In addition, the N1P0 treatment significantly decreased C:N by 30.23% (Figure 7d), the N2P1 treatment significantly decreased C:P by 37.36% (Figure 7e), and the N1P1 and N2P1 treatments significantly decreased N:P by 22.86% and 31.73%, respectively (Figure 7f). Under well-watered conditions, compared with the N0P0 control, combined nitrogen and phosphorus treatments did not show significant effects on leaf chemical traits of R. pseudoacacia seedlings (Figure 7).
Overall, water availability had no significant main effects on leaf stoichiometric traits; however, it affected the responses of certain traits through its interactions with nitrogen and phosphorus, including the three-way water × nitrogen × phosphorus interaction. Moreover, different stoichiometric traits exhibited distinct response patterns to water and nutrient supply. These results indicated that the responses of leaf stoichiometric traits to water and nutrient treatments were trait-specific and depended on the treatment combination.

3.3. Differences in Rhizosphere Soil Physicochemical Properties Under Different Treatments

Three-way ANOVA results (Table 5) revealed that water availability significantly affected soil pH (F = 4.310, p = 0.046) and soil organic carbon (SOC, F = 21.899, p < 0.001). Nitrogen addition significantly affected SOC (F = 4.630, p = 0.008), total nitrogen (TN, F = 13.694, p = 0.001), and ammonium nitrogen (NH4+-N, F = 10.375, p < 0.001). Phosphorus addition significantly affected total phosphorus (TP, F = 22.630, p < 0.001), available phosphorus (AP, F = 30.46, p < 0.001), and nitrate nitrogen (NO3-N, F = 4.361, p = 0.044). The water × nitrogen interaction significantly affected TN (F = 4.898, p = 0.006), NO3-N (F = 5.970, p = 0.002), and NH4+-N (F = 7.023, p < 0.001). The water × phosphorus interaction significantly affected TN and NO3-N. The nitrogen × phosphorus interaction significantly affected SOC, AP, NO3-N, and NH4+-N. The three-way water × nitrogen × phosphorus interaction significantly affected only NO3-N (p < 0.001).
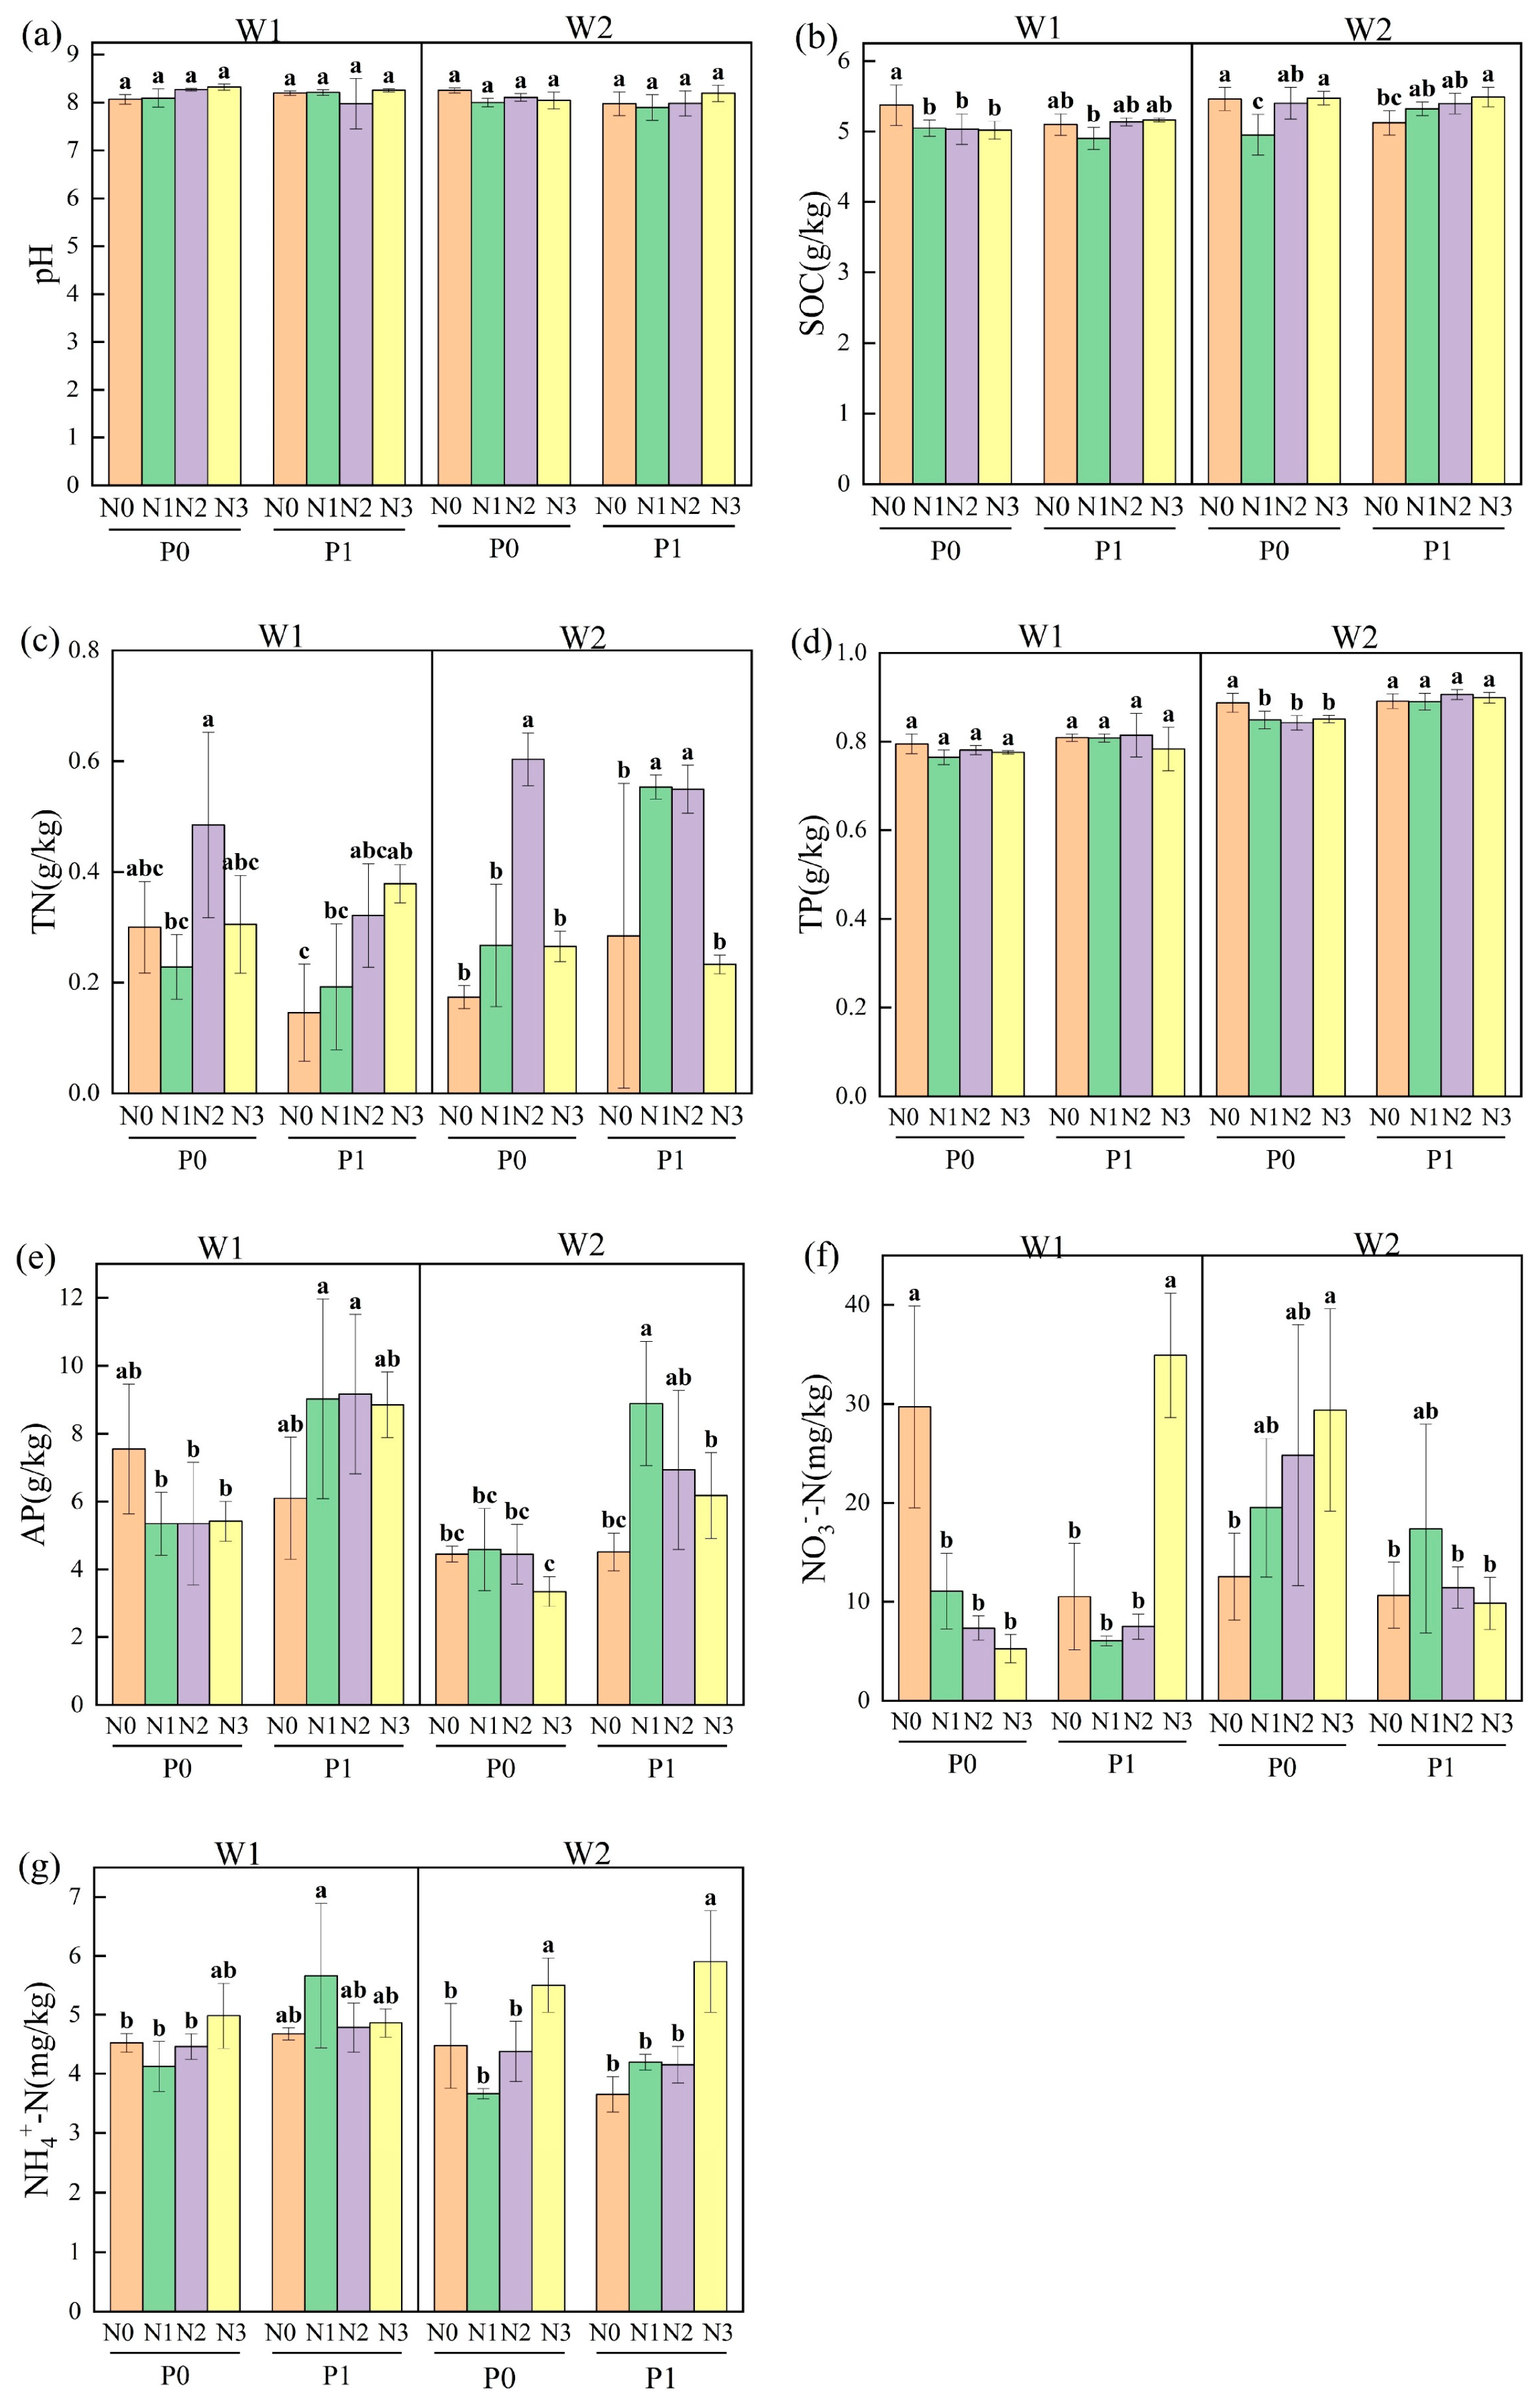
To further characterize the specific effects of water, nitrogen, phosphorus, and their interactions on soil physicochemical properties, treatment comparisons were conducted separately under the two water regimes (Figure 8). Multiple comparisons revealed that under drought conditions, combined nitrogen and phosphorus treatments significantly affected rhizosphere soil physicochemical properties, including soil SOC, TN, AP, NO3-N, and NH4+-N (Figure 8). Compared with the control treatment (N0P0), the N1P0, N2P0, N3P0, and N1P1 treatments significantly decreased SOC by 6.06%, 6.30%, 6.56%, and 8.27%, respectively (Figure 8b). In addition, compared with the control, the N1P0, N2P0, N3P0, N0P1, N1P1, and N2P1 treatments significantly decreased NO3-N by 62.63%, 75.27%, 82.29%, 64.50%, 79.59%, and 74.72%, respectively (Figure 8f). Relative to the control, the N1P1 treatment significantly increased NH4+-N by 25.13% (Figure 8g).
Under well-watered conditions, combined nitrogen and phosphorus treatments also significantly affected rhizosphere soil physicochemical properties, including soil SOC, TN, TP, AP, NO3-N, and NH4+-N (Figure 8). Compared with the control treatment (N0P0), the N1P0 and N0P1 treatments significantly decreased SOC by 9.30% and 6.17%, respectively (Figure 8b). TN was significantly increased by 246.71%, 218.42%, and 215.78% under the N2P0, N1P1, and N2P1 treatments, respectively, relative to the control (Figure 8c). In contrast, TP was significantly decreased by 4.26%, 5.01%, and 4.13% under the N1P0, N2P0, and N3P0 treatments, respectively (Figure 8d). The N1P1 treatment significantly increased AP by 99.43% compared with the control (Figure 8e). In addition, the N3P0 treatment significantly increased NO3-N by 134.11% (Figure 8f), whereas NH4+-N was significantly increased by 23.03% and 31.95% under the N3P0 and N3P1 treatments, respectively (Figure 8g).
Overall, the responses of rhizosphere soil properties to water and nutrient treatments varied considerably. Soil pH and soil organic carbon (SOC) were primarily affected by water availability, whereas total nitrogen (TN), total phosphorus (TP), available phosphorus (AP), nitrate nitrogen (NO3-N), and ammonium nitrogen (NH4+-N) were affected by the main effects of nitrogen or phosphorus, two-way interactions (W × N, W × P, and N × P), or the three-way interaction (W × N × P), indicating that the response patterns were property-specific. Under drought conditions, several soil nutrient indicators tended to decrease, whereas well-watered conditions were generally associated with greater nutrient availability. Combined nitrogen and phosphorus application produced greater changes in soil nutrient properties than single-nutrient additions, with some combined treatments producing particularly pronounced increases in AP. These results suggest that selecting appropriate nitrogen–phosphorus combinations under different water regimes may help improve soil nutrient availability and balance.

3.4. Relationships Between Leaf Traits and Rhizosphere Soil Physicochemical Factors in R. pseudoacacia Seedlings

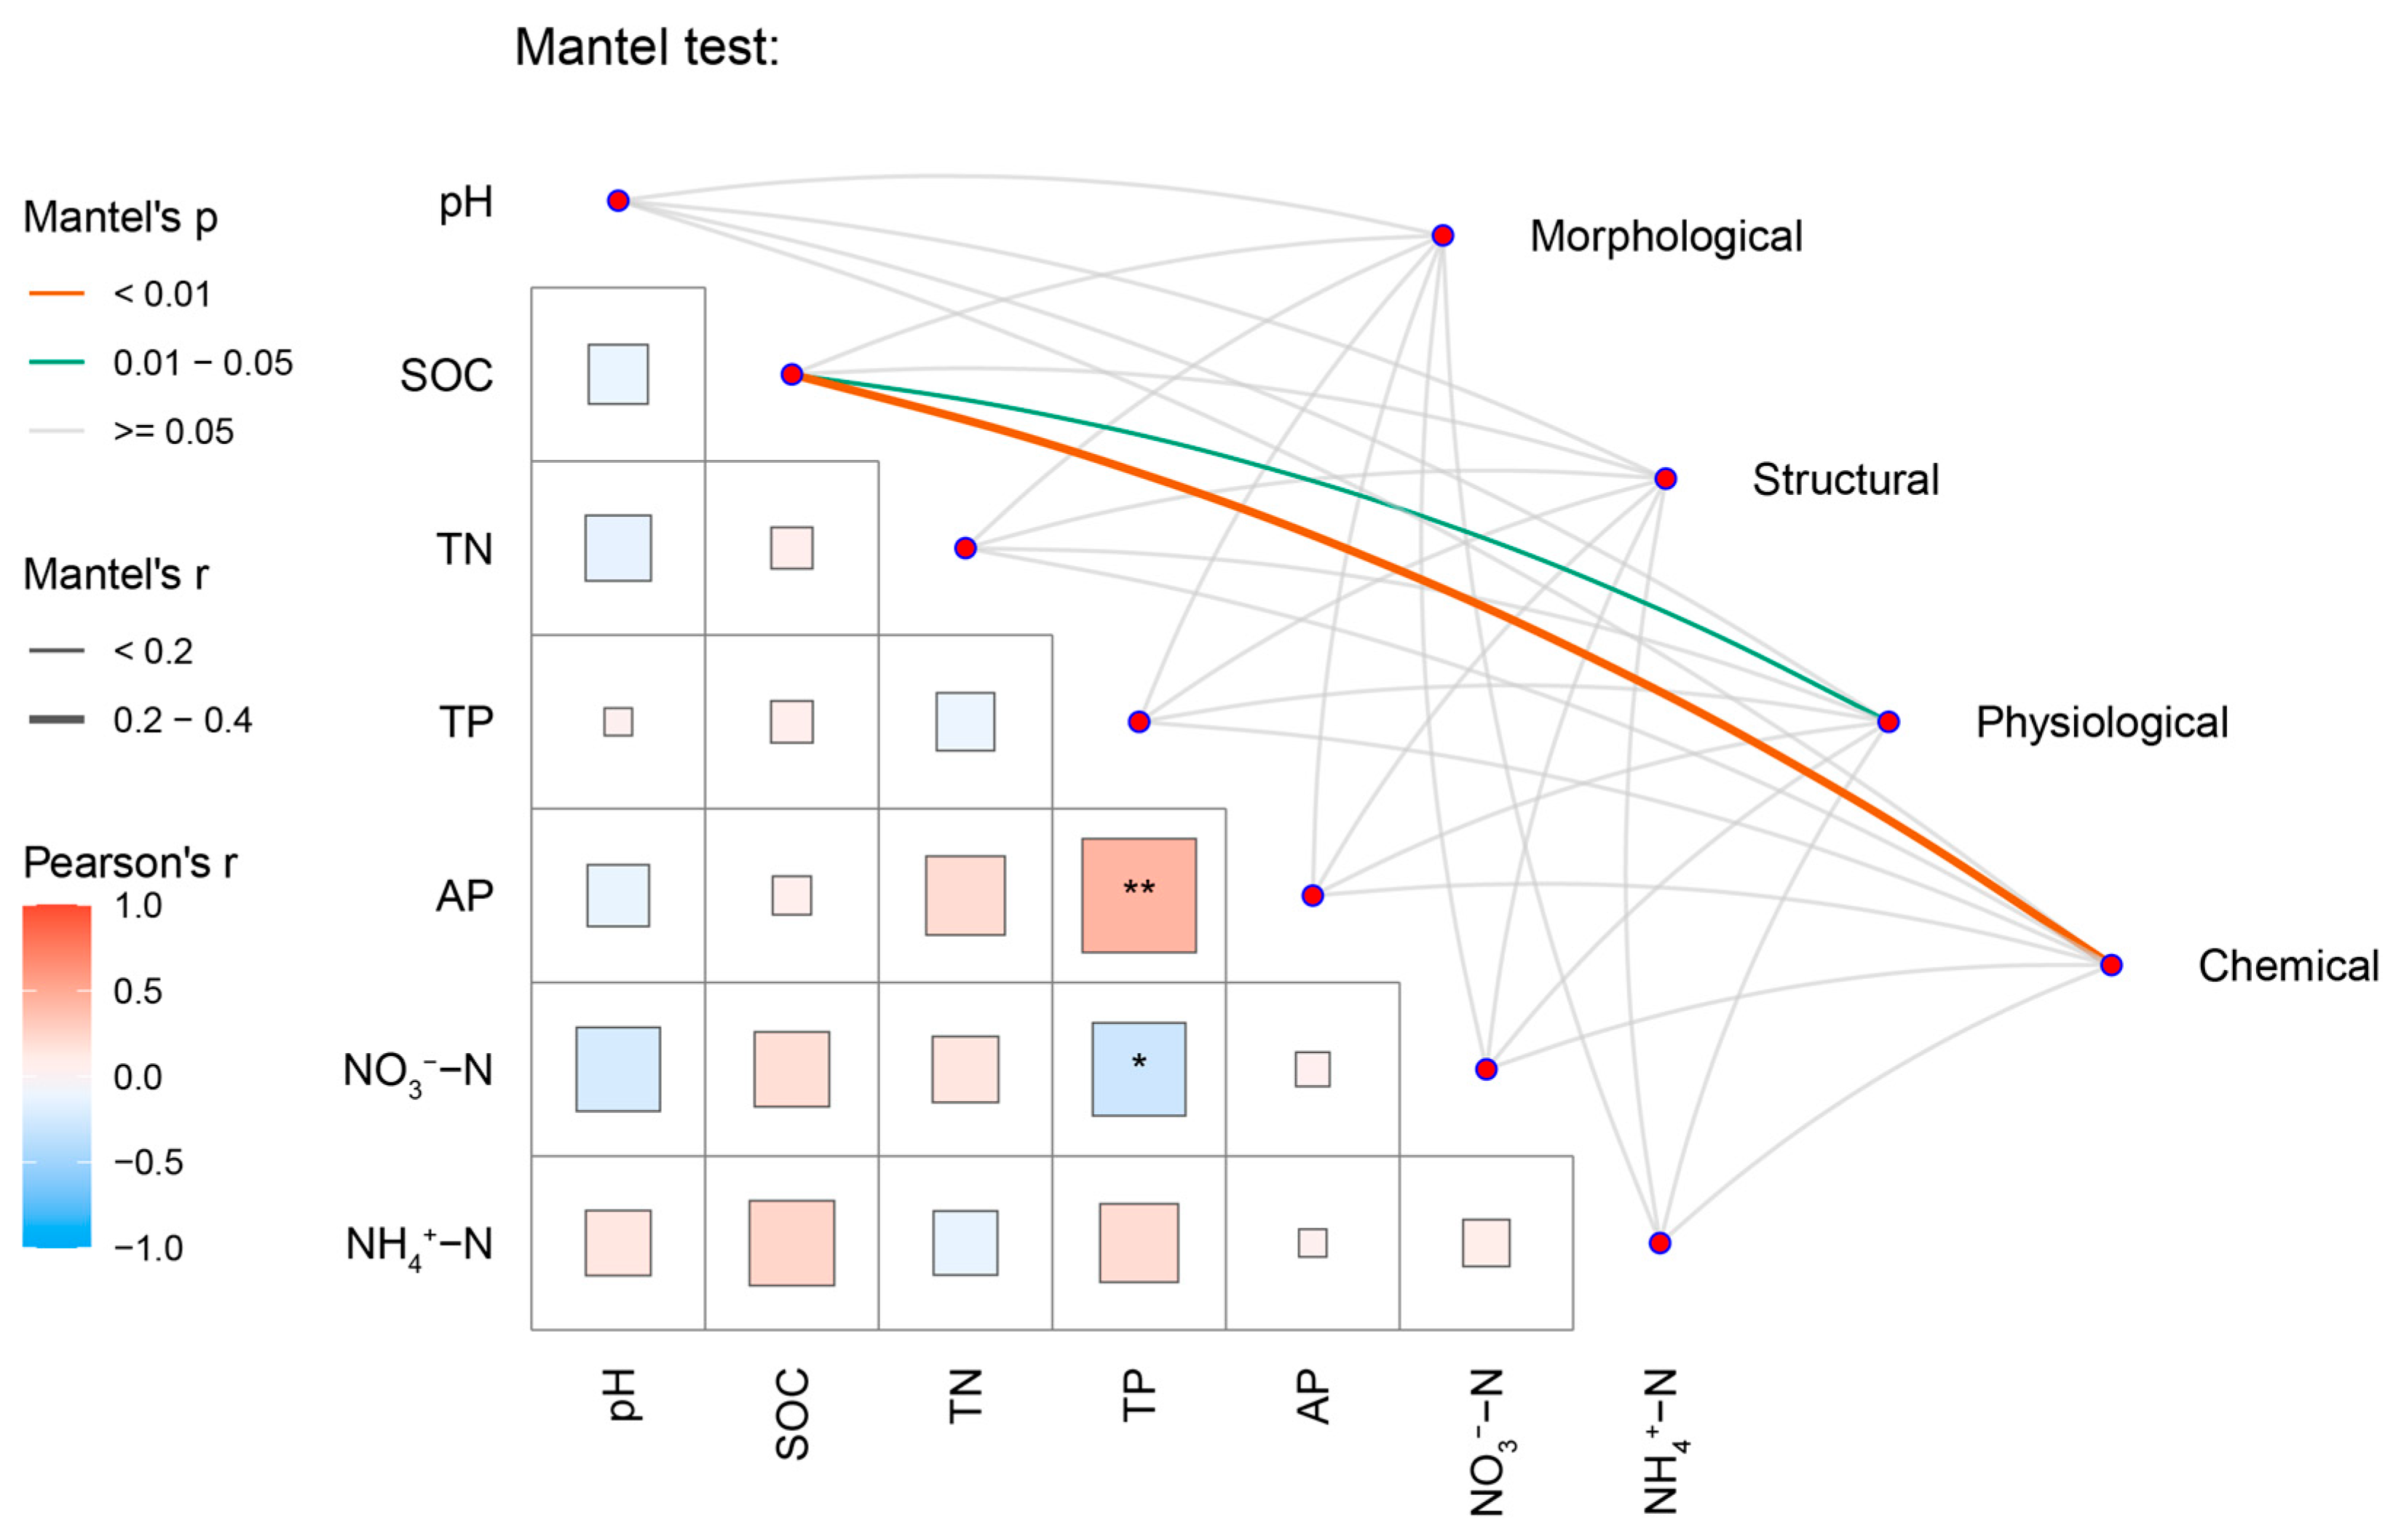
Mantel test analysis showed that total phosphorus (TP) was extremely significantly positively correlated with available phosphorus (AP, p < 0.01), but significantly negatively correlated with nitrate nitrogen (NO3-N, p < 0.05) (Figure 9). Among the measured soil physicochemical properties, soil organic carbon (SOC) showed significant correlations with the physiological traits of R. pseudoacacia seedlings, including leaf water content (LWC), relative water content (RWC), soluble sugar (SS), soluble protein (SP), and proline (Pro), as well as with the chemical traits, including carbon (C), nitrogen (N), phosphorus (P), carbon-to-nitrogen ratio (C:N), carbon-to-phosphorus ratio (C:P), and nitrogen-to-phosphorus ratio (N:P). In contrast, no significant correlations were detected between the remaining leaf trait categories and rhizosphere soil physicochemical properties (p > 0.05).
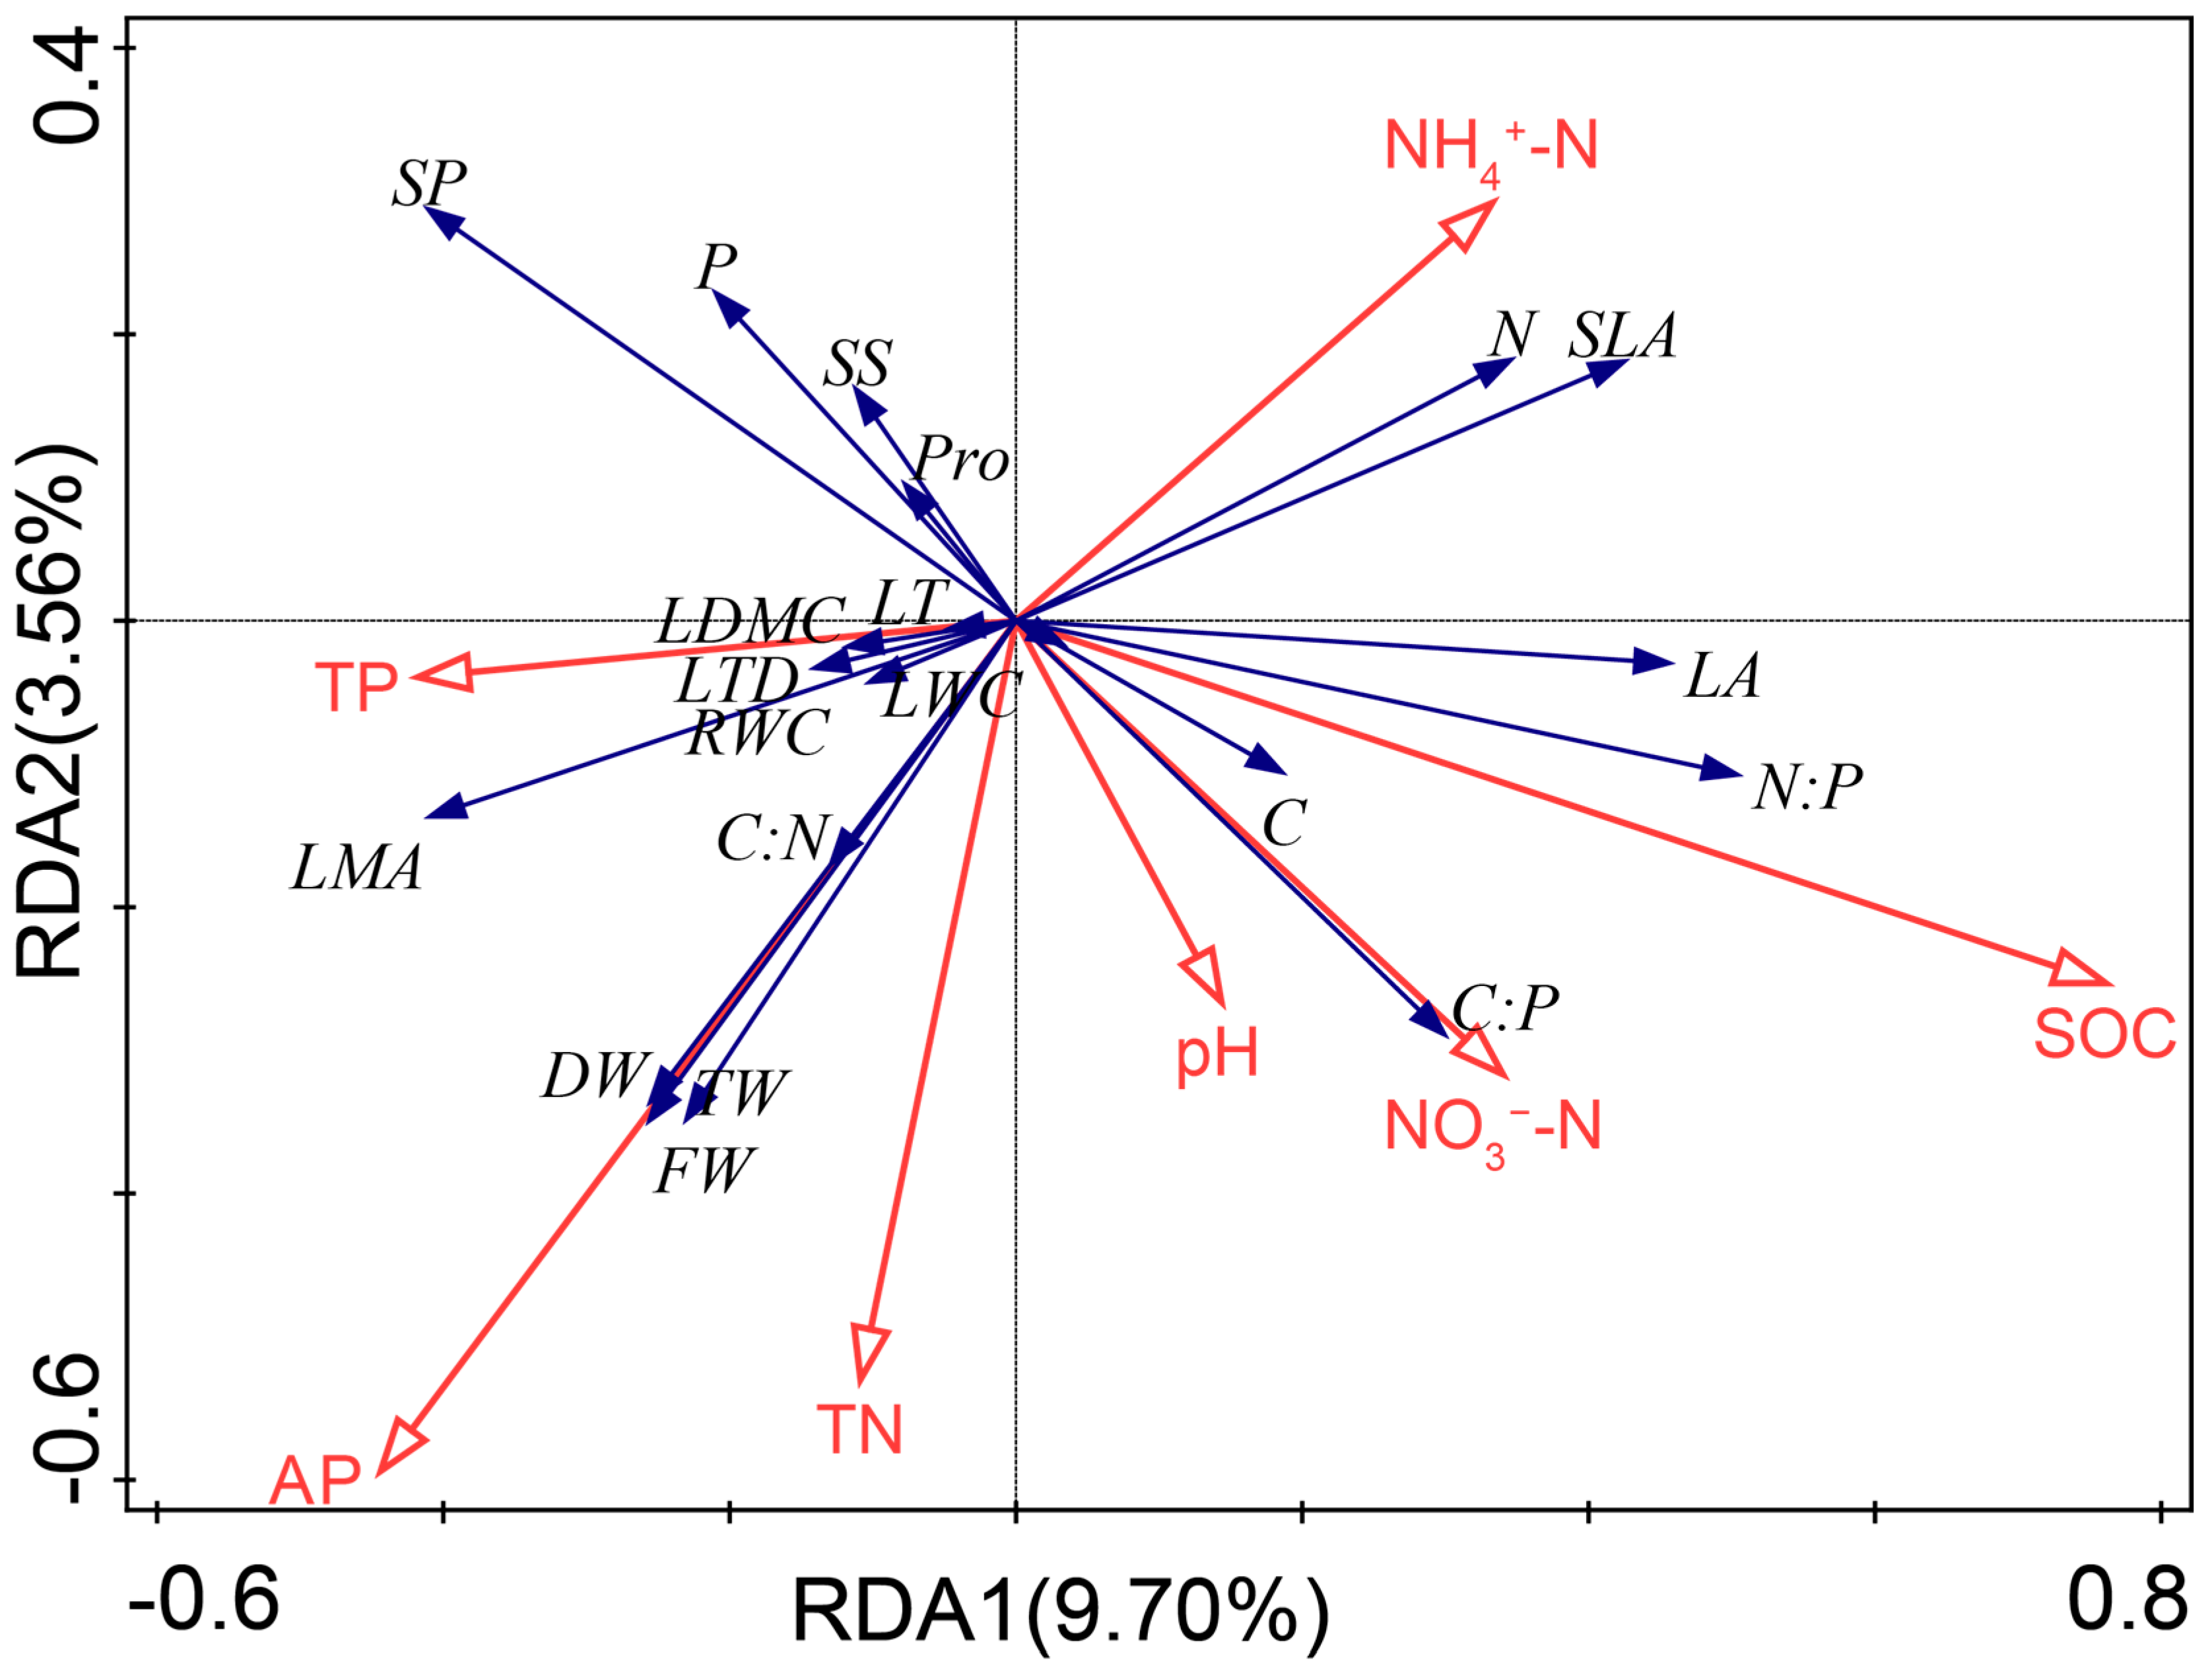
As shown in Figure 10, the RDA ordination plot illustrates the multivariate associations between leaf functional traits of R. pseudoacacia and rhizosphere soil physicochemical properties. Redundancy analysis (RDA), a constrained ordination method, was used in this study, with rhizosphere soil properties treated as explanatory variables and leaf traits as response variables. The first RDA axis explained 9.70% of the total variance, and the second axis explained 3.56%, with the first two axes jointly explaining 13.26% of the total variance. These results indicated that rhizosphere soil physicochemical properties explained a limited proportion of the variation in leaf functional traits of R. pseudoacacia. Permutation tests indicated that soil organic carbon (SOC) was significantly associated with variation in leaf traits (p < 0.05), whereas total nitrogen (TN), total phosphorus (TP), available phosphorus (AP), ammonium nitrogen (NH4+-N), nitrate nitrogen (NO3-N), and pH were not statistically significant (p > 0.05). Further analysis of the independent explanatory power and contribution of each variable showed that SOC had the highest independent explanatory power, explaining 3.00% of the variation with a contribution of 34.7%. Accordingly, rhizosphere SOC was the soil variable most strongly associated with variation in the leaf traits of R. pseudoacacia seedlings. Specifically, SOC was positively correlated with resource-acquisitive traits, including leaf N, SLA, LA, and LWC, and negatively correlated with conservative structural traits, including LMA, LTD, LDMC, and LT, suggesting that seedlings tended to exhibit a more resource-acquisitive strategy under higher rhizosphere SOC conditions.
Overall, SOC was the soil factor most strongly associated with variation in the leaf functional traits of R. pseudoacacia. Higher SOC conditions were associated with a more resource-acquisitive trait pattern, whereas the associations of the other measured soil variables with leaf trait variation were not statistically significant.
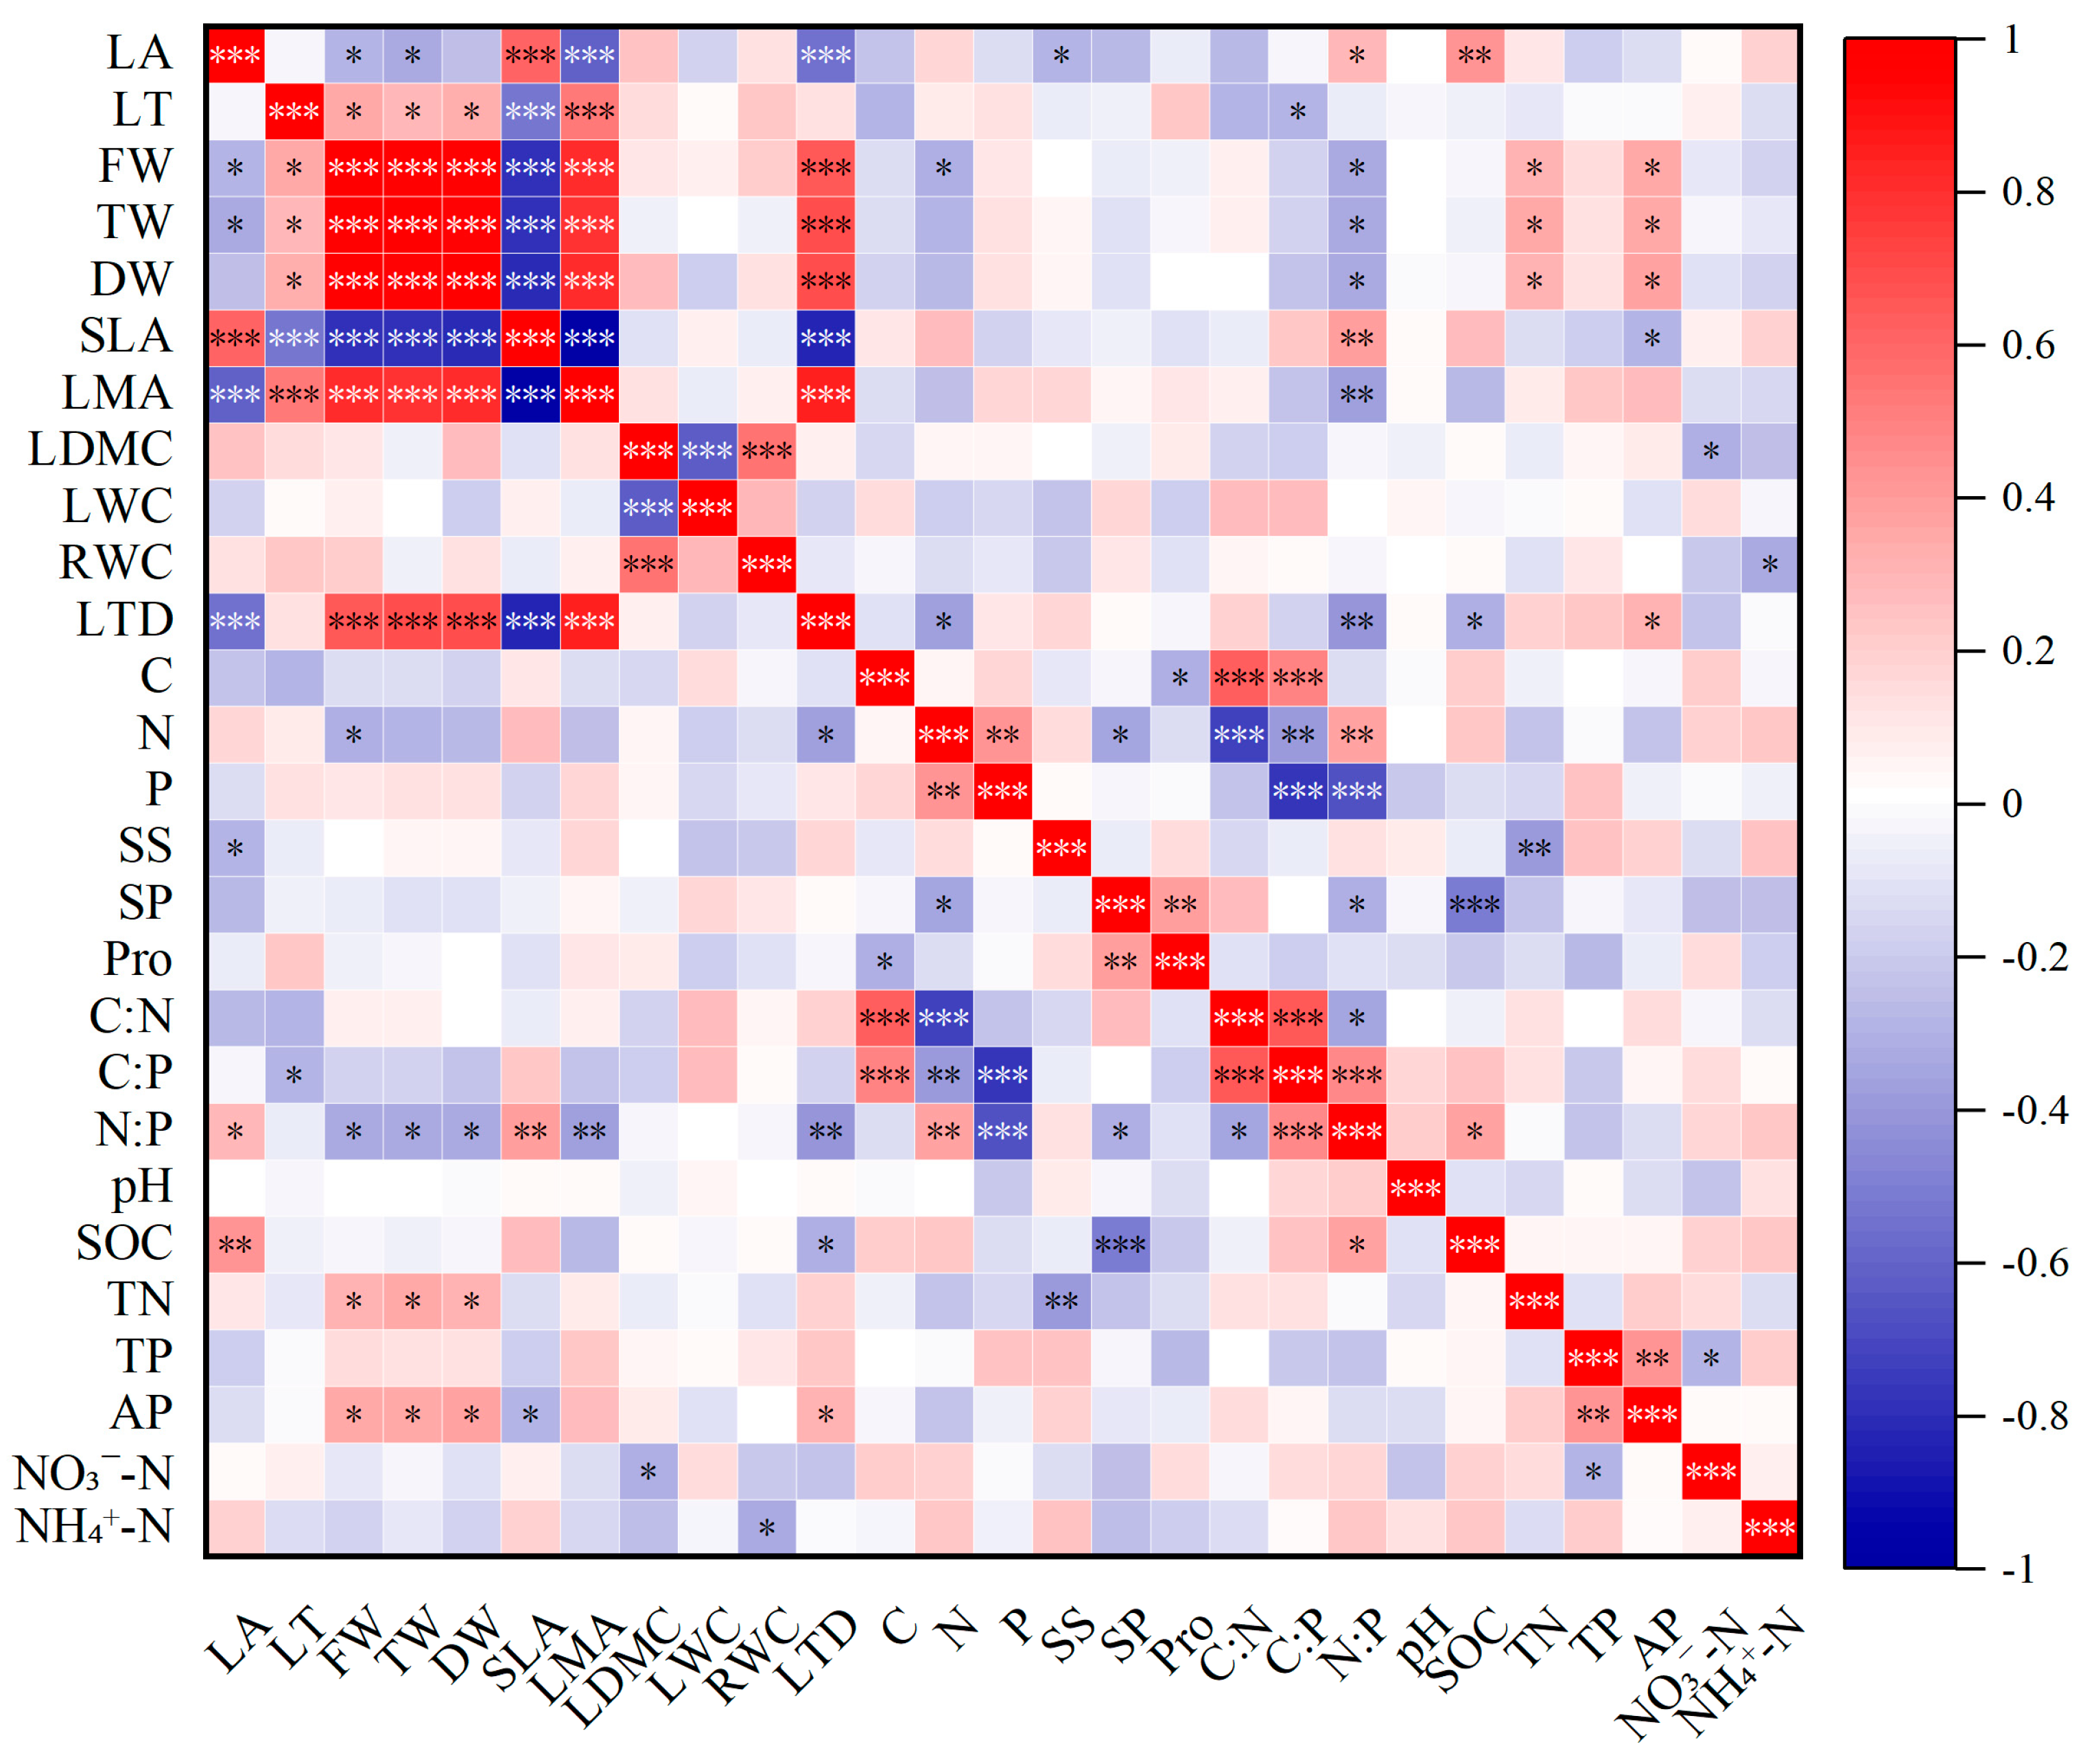
Pearson correlation analysis (Figure 11) revealed significant pairwise correlations among leaf traits of R. pseudoacacia seedlings, as well as between leaf traits and rhizosphere soil variables. For morphological and structural traits, fresh weight (FW), turgid weight (TW), and dry weight (DW) were positively correlated with leaf mass per area (LMA; r = 0.800, 0.794, and 0.805, respectively; all p < 0.001) and leaf tissue density (LTD; r = 0.652, 0.690, and 0.693, respectively; all p < 0.001), but negatively correlated with specific leaf area (SLA; r = −0.793, −0.795, and −0.801, respectively; all p < 0.001). This covariation pattern indicated that higher leaf mass values co-occurred with higher tissue density and leaf mass per area, whereas higher SLA co-occurred with lower leaf mass values. For physiological and stoichiometric traits, significant correlations were detected among leaf carbon (C), nitrogen (N), phosphorus (P), and their stoichiometric ratios. Leaf N was positively correlated with N:P (r = 0.373, p < 0.01) but negatively correlated with C:N (r = −0.726, p < 0.01) and C:P (r = −0.383, p < 0.01), reflecting coordinated variation between leaf N and stoichiometric ratios. Soluble protein (SP) was positively correlated with proline (Pro; r = 0.380, p < 0.01), indicating coordinated variation in these osmotic-adjustment-related compounds. Regarding trait–soil covariation, soil organic carbon (SOC) was positively correlated with leaf area (LA; r = 0.425, p < 0.01) and N:P (r = 0.365, p < 0.05), but negatively correlated with LTD (r = −0.314, p < 0.05) and SP (r = −0.501, p < 0.001). Total nitrogen (TN) was positively correlated with FW, TW, and DW (r = 0.303, 0.341, and 0.308, respectively; all p < 0.05). Similarly, available phosphorus (AP) was positively correlated with FW, TW, and DW (r = 0.344, 0.346, and 0.361, respectively; all p < 0.05). These relationships reflected statistical covariation between soil nutrient status and leaf mass-related traits rather than direct evidence of nutrient-induced growth stimulation. Total phosphorus (TP) was positively correlated with AP (r = 0.427, p < 0.01) and negatively correlated with nitrate nitrogen (NO3-N; r = −0.286, p < 0.05), demonstrating significant statistical covariation among these soil nutrient indices.
Overall, the morphological, structural, physiological, and stoichiometric leaf traits of R. pseudoacacia seedlings displayed coordinated patterns of variation. SOC, TN, and AP were significantly associated with multiple leaf functional traits and leaf mass-related traits.

4. Discussion

4.1. Plasticity and Ecological Adaptability of Leaf Traits

Leaves are important nutrient-acquiring organs in plants, and their functional traits generally exhibit substantial plasticity and variation. The plasticity index can, to some extent, reflect the responsiveness of plant morphological and physiological characteristics to resource availability, thereby providing insight into plant adaptive capacity under changing environments [28]. In the present study, the plasticity indices of leaf traits in R. pseudoacacia seedlings differed markedly between drought and well-watered conditions, reflecting dynamic adaptive strategies under contrasting resource regimes. Under drought stress, leaf thickness (LT) showed a much higher plasticity index (PI = 0.640) than the other traits, which may be associated with the rapid adjustment of leaf structure (Figure 2a). As a structural trait, LT may respond quickly under stress to reduce transpiration water loss and maintain water balance, which is consistent with previous studies [1]. Under well-watered conditions, proline (Pro) showed the highest plasticity index (PI = 0.713, Figure 2b), indicating that under non-stressful conditions, plants may preferentially regulate osmoprotective substances to buffer potential environmental fluctuations. As a key osmotic regulator, the high plasticity of proline suggests that plants may prioritize biochemical defense mechanisms when resources are sufficient, thereby enhancing their capacity to cope with environmental variability [29], consistent with previous findings [30]. In contrast, LDMC, LWC, RWC, and SS showed relatively low plasticity indices under both drought and well-watered conditions. This pattern may reflect the relatively stable regulation of plant water status, together with the conservative nature of certain physiological and biochemical traits. In addition, R. pseudoacacia seedlings may adopt a strategy of reducing leaf investment under stress by decreasing leaf number and photosynthetic activity, which could further contribute to the relatively low plasticity of these traits [21,31,32].
Environmental variation may strengthen coordination among leaf traits to alleviate resource limitation. Specific leaf area (SLA), as a core trait in the leaf economics spectrum, is closely associated with photosynthetic performance, growth rate, and nutrient use efficiency [33]. In the present study, SLA, LMA, LTD, and leaf N:P were closely linked in the trait network, suggesting coordinated regulation of nutrient use and allocation. In particular, structural and chemical traits appeared to be connected through key nodes, thereby balancing short-term growth and long-term stress resistance [34]. Among all leaf traits, SLA showed high centrality in the network, linking morphological, structural, and chemical traits and therefore functioning as a hub trait. This central role also reflects its importance for resource acquisition efficiency, as higher SLA is generally associated with thinner leaves, larger leaf area, and faster growth rates, allowing plants to acquire light and carbon more rapidly [35]. Leaf N:P also emerged as a key node in the trait network and was directly connected with multiple other traits, suggesting an important role in regulating resource allocation between nutrient conservation and metabolic activity across the network [14]. The emergence of SLA and leaf N:P as core nodes in the leaf trait network of R. pseudoacacia seedlings may reflect a trade-off between acquisitive and conservative strategies. Specifically, SLA is more closely associated with resource acquisition, whereas leaf N:P is more closely associated with conservative nutrient-use strategies. Under resource-limited conditions, this trade-off may be particularly important during the seedling stage, enabling these traits to exert relatively strong integrative effects on the overall trait network [36]. This interpretation is consistent with previous studies [37,38].

4.2. Regulatory Effects of Water, Nitrogen, and Phosphorus Interactions on Leaf Traits

Water availability and the water × nitrogen interaction significantly affected leaf area, indicating that R. pseudoacacia seedlings adapt to environmental conditions by adjusting leaf morphology to reduce transpiration water loss and maintain water balance [20]. Nitrogen addition exerted significant effects on fresh weight (FW, F = 3.556, p = 0.025), turgid weight (TW, F = 3.904, p = 0.017) and dry weight (DW, F = 3.795, p = 0.019). Under drought stress, FW, TW and DW were significantly lower than those under well-watered conditions. Nitrogen addition markedly increased FW, TW and DW. These results indicate that drought stress restricts plant growth, while nitrogen fertilization promotes cell expansion and biomass accumulation in plants [39]. In contrast, under drought stress, combined nitrogen and phosphorus application resulted in higher LMA, LDMC, and LTD than nitrogen application alone, indicating a pronounced pattern of resource reallocation. The coordinated supply of nitrogen and phosphorus may promote the allocation of a greater proportion of biomass and nutrients to leaves, thereby enhancing structural investment under stress [40]. Previous studies have shown that high nitrogen treatment (N3) can significantly inhibit leaf photosynthetic efficiency, particularly when nitrogen is present in ammonium form; under such conditions, leaves may accumulate more nitrogen while exhibiting reduced photosynthetic capacity [41]. In the present study, under well-watered conditions, the N3P0 treatment significantly reduced LDMC by 8.74%, the N3P1 treatment significantly reduced LWC by 16.96% and the N3P0 and N3P1 treatments significantly reduced RWC by 13.79% and 17.21%, respectively. These responses may indicate that excessive nitrogen supply impairs leaf structural stability, thus reducing leaf dry matter content [28]. In addition, excessive nitrogen under drought may reduce net photosynthetic rate, stomatal conductance, and water-use efficiency, which could further weaken cellular water retention capacity and ultimately lower leaf water content [42].
In our study, water, nitrogen and phosphorus significantly affected the contents of soluble sugar (SS), soluble protein (SP) and proline (Pro) (p < 0.001). Under drought conditions, compared with the control treatment (N0P0), the soluble sugar content under N2P1 treatment increased significantly by 7.97%, the soluble protein content under N3P1 treatment increased significantly by 19.19%, and the proline content under N3P1 treatment increased significantly by 19.94% (Figure 6c–e), indicating that under drought stress, nutrient regulation promoted the accumulation of osmotic adjustment substances that help maintain cellular osmotic balance, reduce water loss, and stabilize cell structure [43,44]. At the same time, under drought stress, leaf nitrogen content, C:N and C:P ratios changed significantly. Compared with the control (N0P0), leaf N under the N1P1 treatment decreased by 19.86% (Figure 7b); the C:N ratio under the N1P0 treatment dropped by 30.23%; and the C:P ratio under the N2P1 treatment declined by 37.36% (Figure 7d,e). This indicates that plants maintain functional stability under resource limitation by adjusting nutrient stoichiometry and leaf nutrient allocation [45]. Phosphorus is an essential element for plant growth, and drought generally reduces phosphorus mobility and availability in soil. Previous studies have shown that phosphorus addition under drought can significantly increase leaf P content [5]. Consistent with previous findings, our study showed that leaf phosphorus concentration was significantly higher in the P1 treatment than in the P0 treatment under drought conditions. Specifically, the N2P1 treatment significantly increased leaf P content by 32.56% relative to the N0P0 control (Figure 7c). This pattern may be associated with increased soil phosphorus availability and potentially enhanced phosphorus uptake following phosphorus addition, which may have partially alleviated phosphorus limitation under drought stress [46].
Under well-watered conditions, nutrient addition may have altered metabolic processes and plant nutritional status. Notably, the contents of soluble protein (SP) and proline (Pro) under the N1P0 treatment were significantly higher than those under all other treatments. Compared with the N0P0 control, N1P0 significantly increased SP by 58.87% and Pro by 172.67%, respectively (Figure 6d,e), suggesting that moderate nitrogen addition without phosphorus supplementation was associated with greater SP and Pro accumulation under well-watered conditions. Moreover, high-nitrogen treatments (N3) under well-watered conditions yielded higher leaf nitrogen and soluble sugar (SS) concentrations. Specifically, the N3P1 treatment significantly increased SS by 14.76% relative to N0P0 (Figure 6c). This may be associated with nitrogen fertilization enhancing photosynthesis and carbon assimilation, consequently boosting carbohydrate accumulation [47]. Adequate nitrogen supply may also support enzymatic activity and metabolic function, which in turn contributes to higher nitrogen content and soluble sugar accumulation [48]. Together, these results indicate that the effects of nitrogen and phosphorus addition on leaf traits are strongly dependent on water availability, and that the balance between nutrient supply and water status plays a key role in determining whether nutrient inputs promote growth and metabolic adjustment or induce physiological imbalance.

4.3. Regulatory Effects of Water, Nitrogen, and Phosphorus Interactions on Rhizosphere Soil Properties

Drought stress can reduce biomass accumulation and photosynthetic capacity in R. pseudoacacia seedlings, thereby limiting the input of root exudates and litter into the soil. Reduced vegetation cover and biomass may further contribute to declines in soil organic carbon (SOC) [49]. Previous studies have also shown that under drought conditions, nitrogen addition alone or low-level combined nitrogen and phosphorus application may further stimulate microbial activity and enhance SOC mineralization. Nitrogen input provides an important nitrogen source for microorganisms and may promote photosynthesis and carbon metabolism, while at the same time accelerating SOC decomposition, ultimately leading to lower SOC content [39]. The present study yielded similar results: SOC significantly declined under the N1P0, N2P0, N3P0, and N1P1 treatments, suggesting that this pattern may result from the combined effects of drought-induced limitation and nitrogen-enhanced decomposition. Under drought stress, nitrogen addition alone also reduced SOC, AP, and NO3-N. This may be because, although nitrogen fertilization can stimulate plant photosynthesis, plants under drought may not be able to effectively utilize the added nitrogen, resulting in rapid transformation, immobilization, or uptake of available nitrogen forms and consequently lower measured contents in soil [50].
Under well-watered conditions, compared with the control (N0P0), total phosphorus (TP) and available phosphorus (AP) under the N3P0 treatment decreased by 5.01% and 25.00%, respectively (Figure 8d,e), suggesting that high nitrogen supply without phosphorus addition may have disrupted the soil nitrogen–phosphorus balance and intensified relative phosphorus limitation. Excessive nitrogen input may indirectly affect phosphorus availability by altering soil physicochemical conditions [51], which is consistent with previous findings [52]. In contrast, under well-watered conditions, the N3P0 treatment significantly increased nitrate nitrogen (NO3-N) by 134.11%. Meanwhile, the N3P0 and N3P1 treatments significantly elevated ammonium nitrogen (NH4+-N) by 23.03% and 31.95%, respectively (Figure 8f,g). This pattern may be attributable to the greater nitrogen availability resulting from the high-nitrogen treatment. In addition, nitrogen addition may alter microbial community composition and enzyme activity, which may influence nitrogen cycling and contribute to increased nitrate and ammonium concentrations in soil [53].

4.4. Coupling Relationships Between Leaf Traits and Rhizosphere Soil Properties

Mantel test analysis showed that the responses of leaf traits in R. pseudoacacia seedlings to soil physicochemical properties were selective rather than uniform. TP was significantly positively correlated with AP (p < 0.01), indicating that soil available phosphorus was strongly influenced by the total phosphorus pool, which is consistent with the regulatory role of soil phosphorus in plant nutrient uptake [54]. TP was significantly negatively correlated with NO3N (p < 0.05), possibly because under environmentally constrained nitrogen conditions, phosphorus enrichment may reduce nitrification rates and thus decrease nitrate production [55]. In addition, SOC was significantly correlated with multiple physiological traits (LWC, RWC, SS, SP, and Pro) and chemical traits (C, N, P, C:N, C:P, and N:P), indicating that SOC is a key indicator of soil fertility and serves as both a source and reservoir of nutrients for plants [56]. As such, SOC may strongly influence physiological metabolism and nutrient balance in R. pseudoacacia, which is consistent with previous studies [57]. As a nitrogen-fixing leguminous tree species, R. pseudoacacia can release substantial amounts of organic acids and carbohydrates through its roots, thereby not only promoting soil carbon accumulation [58], but also enhancing nutrient availability by regulating rhizosphere pH and enzyme activity [59]. The correlations observed between SOC and leaf C:N:P stoichiometry further support the existence of tight soil-plant nutrient coupling.
Redundancy analysis (RDA) results (Figure 10) showed that the first axis explained 9.70% of the total variation in leaf traits and the second axis explained 3.56%, with the cumulative explanatory rate of the first two axes reaching 13.26%. This indicated that rhizosphere soil physicochemical properties explained a limited proportion of the variation in leaf functional traits of R. pseudoacacia seedlings. Further variance analysis showed that among all soil factors, only soil organic carbon (SOC) was significantly associated with leaf trait variation (p < 0.05), whereas the other soil factors were not statistically significant (p > 0.05). The results indicated that SOC was the soil factor with the strongest statistical association with variation in leaf functional traits. This interpretation is consistent with previous studies [60]. Specifically, SOC was positively correlated with leaf N, LWC, SLA and LA, and negatively correlated with LMA, LTD, LDMC and LT. This indicates that under higher soil organic carbon levels, plants tend to adopt a more resource-acquisitive strategy, featuring larger leaf area, higher specific leaf area and greater leaf water content [61]. By contrast, AP and TN were positively associated with several morphological and structural traits, suggesting that higher AP and TN levels were associated with greater leaf mass-related traits. This pattern is broadly consistent with previous findings [62] and suggests that R. pseudoacacia seedlings adopt different adaptive strategies under different soil nutrient conditions.
Pearson correlation analysis further revealed coordinated variations among leaf traits (Figure 11). Leaf area (LA) showed significant negative correlations with FW (r = −0.290, p < 0.05), TW (r = −0.335, p < 0.05), SS (r = −0.297, p < 0.05), LMA (r = −0.619, p < 0.001) and LTD (r = −0.554, p < 0.001), while it was significantly positively correlated with SLA (r = 0.610, p < 0.001), N:P (r = 0.284, p < 0.05) and SOC (r = 0.425, p < 0.01), indicating that leaf area covaried with leaf structural traits, stoichiometric traits, and rhizosphere SOC. Seedlings with larger leaf area tended to have lower LMA and LTD but higher SLA, a trait combination consistent with a resource-acquisitive strategy [63]. In contrast, seedlings with smaller leaves tended to have higher FW, TW, LMA, and LTD, indicating greater mass investment per unit leaf area and a more conservative trait pattern [35]. In addition, SLA was significantly positively correlated with N:P (r = 0.390, p < 0.01), while it showed significant negative correlations with LMA (r = −0.970, p < 0.001), LTD (r = −0.837, p < 0.001) and AP (r = −0.297, p < 0.05). LMA had a significant positive correlation with LTD (r = 0.841, p < 0.001). These relationships support a resource-use trade-off consistent with the leaf economics spectrum, in which high SLA is associated with a more acquisitive strategy, whereas high LMA and LTD are associated with a more conservative strategy; the positive correlation between SLA and N:P further suggests that leaf stoichiometric balance may be linked to this trade-off [64].
Significant correlations among leaf C, N, P, and their stoichiometric ratios indicate that leaf C:N:P stoichiometry reflects plant nutrient uptake, utilization efficiency, and nutrient limitation status. Leaf N and P contents are determined not only by species-specific genetic characteristics, but also by external soil conditions [65]. In particular, N:P was significantly positively correlated with SOC (r = 0.365, p < 0.05), possibly because organic carbon influences nitrogen mineralization, microbial activity, and nutrient cycling efficiency, thereby increasing the relative availability of nitrogen to plants and ultimately elevating leaf N:P [66]. SS was significantly negatively correlated with TN, reflecting the role of nitrogen supply in regulating plant carbon metabolism. Previous studies have shown that under nitrogen-limited conditions, reduced nitrogen assimilation may hinder the conversion of carbon into nitrogen-containing organic compounds, leading to the accumulation of soluble sugars in plant tissues [67]. TP was significantly negatively correlated with NO3-N, possibly because under nitrogen-rich conditions, plants may reduce phosphorus acquisition, thereby weakening organic phosphorus mineralization and affecting TP dynamics [68]. Taken together, these results indicate that leaf trait trade-offs are a direct outcome of adaptation to soil nutrient environments, while stoichiometric balance and osmotic adjustment substances act as key links between plant traits and environmental conditions. Their coordinated interactions jointly shape the adaptive strategies of R. pseudoacacia seedlings in the study area.

4.5. Limitations and Future Perspectives

This study was based on a short-term pot experiment using one-year-old R. pseudoacacia seedlings. Therefore, the observed responses may not fully represent those occurring under long-term field conditions or at later developmental stages, including sapling and mature tree stages. In addition, data on initial soil texture and mineral nitrogen were unavailable, which limited the characterization of the initial soil environment and the interpretation of nutrient availability in the potting system. Future studies should incorporate more complete baseline soil measurements and combine controlled experiments with long-term field observations across different developmental stages. Further investigation of plant functional traits, physiological responses, soil nutrient dynamics, and plant–soil interactions would improve understanding of how R. pseudoacacia responds to changes in water and nutrient availability under conditions relevant to ecological restoration on the Loess Plateau.

5. Conclusions

This study investigated the responses of leaf functional traits in R. pseudoacacia seedlings to water availability and nitrogen–phosphorus supply. Water and nutrient treatments showed significant interactive effects on several leaf physiological, stoichiometric, and rhizosphere soil properties. Under drought conditions, some N-P combinations increased soluble sugar, soluble protein, and proline contents, indicating enhanced osmotic adjustment. Under well-watered conditions, responses varied among nutrient treatments, and high nitrogen input altered several physiological and soil nutrient indicators. Soil organic carbon showed the greatest explanatory power for variation in leaf traits, while total nitrogen and available phosphorus were also associated with several leaf mass-related traits. In addition, specific leaf area and the leaf N:P ratio occupied central positions in the trait correlation network. Overall, the responses of R. pseudoacacia seedlings to nutrient supply depended strongly on water availability, highlighting the importance of considering water–nutrient interactions when evaluating seedling responses on the Loess Plateau.

Author Contributions

B.S.: Conceptualization, Data curation, Funding acquisition, Investigation, Methodology, Project administration, Writing—original draft, Writing—review and editing. Y.Z.: Conceptualization, Data curation, Methodology, Visualization, Writing—original draft. W.X.: Investigation, Validation, Resources, Writing—review and editing. Y.W.: Investigation, Resources, Writing—review and editing. Z.S.: Investigation, Methodology, Writing—review and editing. All authors have read and agreed to the published version of the manuscript.

Funding

This work was supported by the National Natural Science Foundation of China (42307579) and the Key Scientific and Technological Research Project of Henan Province (262102320230, 252102320215).

Data Availability Statement

The original contributions presented in this study are included in the article. Further inquiries can be directed to the corresponding author.

Conflicts of Interest

The authors declare no conflicts of interest.

Abbreviations

The following abbreviations are used in this manuscript:
R. pseudoacaciaRobinia pseudoacacia
LAleaf area
FWfresh weight
TWturgid weight
DWdry weight
LTleaf thickness
SLAspecific leaf area
LMAleaf mass per area
LDMCleaf dry matter content
LWCleaf water content
RWCrelative water content
LTDleaf tissue density
Ccarbon content
Nnitrogen content
Pphosphorus content
SSsoluble sugar
SPsoluble protein
Proproline
SOCsoil organic carbon
TNsoil total nitrogen
TPsoil total phosphorus
APsoil available phosphorus
NO3-Nsoil nitrate nitrogen
NH4+-Nsoil ammonium nitrogen

References

  1. Khan, R.; Ma, X.; Hussain, Q.; Chen, K.; Farooq, S.; Asim, M.; Ren, X.; Shah, S.; Shi, Y. Transcriptome and anatomical studies reveal alterations in leaf thickness under long-term drought stress in tobacco. J. Plant Physiol. 2023, 281, 153920. [Google Scholar] [CrossRef] [PubMed]
  2. Wang, S.; Zhou, H.; He, Z.; Ma, D.; Sun, W.; Xu, X.; Tian, Q. Effects of Drought Stress on Leaf Functional Traits and Biomass Characteristics of Atriplex canescens. Plants 2024, 13, 2006. [Google Scholar] [CrossRef] [PubMed]
  3. He, Y.; Zhang, R.; Li, P.; Men, L.; Xu, M.; Wang, J.; Niu, S.; Tian, D. Nitrogen enrichment delays the drought threshold responses of leaf photosynthesis in alpine grassland plants. Sci. Total Environ. 2024, 913, 169560. [Google Scholar] [CrossRef] [PubMed]
  4. Li, M.; Sun, R.; He, Y.; Zhou, T.; Mao, J.; Li, W.; Liu, C.; Ma, L.; Fu, S. Different responses of canopy and shrub leaves to canopy nitrogen and water addition in warm temperate forest. Front. Plant Sci. 2025, 16, 1530588. [Google Scholar] [CrossRef] [PubMed]
  5. Jiang, S.; Tang, Y.; Fan, R.; Bai, S.; Wang, X.; Huang, Y.; Li, W.; Ji, W. Response of Carex breviculmis to phosphorus deficiency and drought stress. Front. Plant Sci. 2023, 14, 1203924. [Google Scholar] [CrossRef] [PubMed]
  6. Sun, Y.; Wang, C.; Chen, X.; Liu, S.; Lu, X.; Chen, H.Y.H.; Ruan, H. Phosphorus additions imbalance terrestrial ecosystem C:N:P stoichiometry. Glob. Change Biol. 2022, 28, 7353–7365. [Google Scholar] [CrossRef] [PubMed]
  7. He, W.; Liu, H.; Li, W.; Dai, J.; Li, Z.; Qi, Y. Synergetic Responses of Nonstructural Carbohydrates and Nutrients in Different Tree Organs to Drought. Glob. Change Biol. 2026, 32, e70680. [Google Scholar] [CrossRef] [PubMed]
  8. Bondaruk, V.F.; Xu, C.; Wilfahrt, P.; Yahdjian, L.; Yu, Q.; Borer, E.T.; Jentsch, A.; Seabloom, E.W.; Smith, M.D.; Alberti, J.; et al. Aridity modulates grassland biomass responses to combined drought and nutrient addition. Nat. Ecol. Evol. 2025, 9, 937–946. [Google Scholar] [CrossRef] [PubMed]
  9. Šiler, B.T.; Peng, C.; Yao, S.; Huang, W.; Wang, J.; Song, S.; Zhang, P.; Jiao, P. Climate: The dominant factor influencing the spatial distribution pattern of the leaf trait network of Populus euphratica along the main stream of the Tarim River. PLoS ONE 2025, 20, e0323305. [Google Scholar] [CrossRef] [PubMed]
  10. Wang, Z.; Huang, H.; Wang, H.; Peñuelas, J.; Sardans, J.; Niinemets, Ü.; Niklas, K.J.; Li, Y.; Xie, J.; Wright, I.J. Leaf water content contributes to global leaf trait relationships. Nat. Commun. 2022, 13, 5525. [Google Scholar] [CrossRef] [PubMed]
  11. Xing, Y.; Deng, S.; Bai, Y.; Wu, Z.; Luo, J. Leaf Functional Traits and Their Influencing Factors in Six Typical Vegetation Communities. Plants 2024, 13, 2423. [Google Scholar] [CrossRef] [PubMed]
  12. Zhang, X.; Yu, M.; Su, J.; Xu, J.; Zhang, X.; Shang, J.; Gao, J. Leaf nutrient traits of planted forests demonstrate a heightened sensitivity to environmental changes compared to natural forests. Front. Plant Sci. 2024, 15, 1372530. [Google Scholar] [CrossRef] [PubMed]
  13. Jing, M.; Shi, Z.; Zhang, M.; Zhang, M.; Wang, X. Nitrogen and Phosphorus of Plants Associated with Arbuscular and Ectomycorrhizas Are Differentially Influenced by Drought. Plants 2022, 11, 249. [Google Scholar] [CrossRef] [PubMed]
  14. Wang, L.; Guan, J.; Li, Z.; Chen, Z.; Yu, Z.; Xia, Z. Leaf Phosphorus Fractions Are Coordinated with Leaf Functional Traits in Four Juvenile Tree Species from the Chinese Subtropics. Plants 2024, 14, 4. [Google Scholar] [CrossRef] [PubMed]
  15. Fernández-de-Simón, M.B.; García-Cervigón, A.I.; Gea-Izquierdo, G.; Martin-Benito, D.; Conde, M.; Férriz, M.; Aranda, I. Functional phenotypic plasticity mediated by water stress and [CO2] explains differences in drought-tolerance of two phylogenetically close conifers. J. Tree Physiol. 2023, 43, 909–924. [Google Scholar] [CrossRef] [PubMed]
  16. Liu, S.; Zheng, J. Adaptive strategies based on shrub leaf-stem anatomy and their environmental interpretations in the eastern Qaidam Basin. BMC Plant Biol. 2024, 24, 323. [Google Scholar] [CrossRef] [PubMed]
  17. Ilektra, S.; Georgia, O.; Michael, M. Hormesis Responses of Photosystem II in Arabidopsis thaliana under Water Deficit Stress. Int. J. Mol. Sci. 2023, 24, 9573. [Google Scholar] [CrossRef] [PubMed]
  18. Liu, L.; Xia, Y.; Sun, K.; Sun, R.; Xu, Z.; Zhang, F. Coordination of plant functional traits under nitrogen deposition with phosphorus addition in a desert steppe ecosystem. Plant Physiol. Biochem. PPB 2025, 223, 109813. [Google Scholar] [CrossRef] [PubMed]
  19. Yawen, L.; Wanting, C.; Qiang, Y.; Yajing, Z.; Xiangqing, M.; Ming, L. Genome-Wide Characterization and Gene Expression Analyses of Malate Dehydrogenase (MDH) Genes in Low-Phosphorus Stress Tolerance of Chinese Fir (Cunninghamia lanceolata). J. Int. J. Mol. Sci. 2023, 24, 4414. [Google Scholar] [CrossRef] [PubMed]
  20. Liu, Q.; Xu, X.; Liang, J.; Zhang, S.; Wang, G.; Liu, Y. Physiological mechanisms and drought resistance assessment of four dominant species on the Loess Plateau under drought stress. Physiol. Plant. 2025, 177, e70261. [Google Scholar] [CrossRef] [PubMed]
  21. Lin, X.; Wu, C.; Zhang, K.; Dong, H.; Xiao, L.; Li, F.; Huang, Y.; Li, Q. Hydraulic strategy defines contrasting responses to an abrupt precipitation during a successive lethal drought. BMC Plant Biol. 2024, 24, 1143. [Google Scholar] [CrossRef] [PubMed]
  22. Ábri, T.; Keserű, Z.; Borovics, A.; Rédei, K.; Csajbók, J. Comparison of Juvenile, Drought Tolerant Black Locust (Robinia pseudoacacia L.) Clones with Regard to Plant Physiology and Growth Characteristics in Eastern Hungary: Early Evaluation. Forests 2022, 13, 292. [Google Scholar] [CrossRef]
  23. Ábri, T.; Borovics, A.; Csajbók, J.; Kovács, E.; Koltay, A.; Keserű, Z.; Rédei, K. Differences in the Growth and the Ecophysiology of Newly Bred, Drought-Tolerant Black Locust Clones. Forests 2023, 14, 1802. [Google Scholar] [CrossRef]
  24. Mantovani, D.; Veste, M.; Freese, D. Black locust (Robinia pseudoacacia L.) ecophysiological and morphological adaptations to drought and their consequence on biomass production and water-use efficiency. N. Z. J. For. Sci. 2014, 44, 29. [Google Scholar] [CrossRef]
  25. Bao, S.D. Soil Agricultural Chemistry Analysis, 3rd ed.; China Agriculture Press: Beijing, China, 2000. [Google Scholar]
  26. Pérez-Harguindeguy, N.; Díaz, S.; Garnier, E.; Lavorel, S.; Poorter, H.; Jaureguiberry, P.; Bret-Harte, M.S.; Cornwell, W.K.; Craine, J.M.; Gurvich, D.E.; et al. New handbook for standardised measurement of plant functional traits worldwide. Aust. J. Bot. 2013, 61, 167–234. [Google Scholar] [CrossRef]
  27. Bingqian, S.; Lifang, W.; Zhouping, S. Morphological and physiological responses and plasticity in Robinia pseudoacacia to the coupling of water, nitrogen and phosphorus. J. Plant Nutr. Soil Sci. 2021, 184, 271–281. [Google Scholar] [CrossRef]
  28. Shi, X.M.; Qi, J.H.; Liu, A.X.; Zakari, S.; Song, L. Leaf phenotypic plasticity coupled with integration facilitates the adaptation of plants to enhanced N deposition. Environ. Pollut. 2023, 327, 121570. [Google Scholar] [CrossRef] [PubMed]
  29. Xiaoting, X.; Yujie, G.; Weili, W.; Farhat, A.; Sini, Q.; Siyi, F.; Jiaqi, M.; Jiayan, W.; Dexuan, M.; Guangchao, W.; et al. Exogenous spermidine improved drought tolerance in Ilex verticillata seedlings. Front. Plant Sci. 2023, 14, 1065208. [Google Scholar] [CrossRef] [PubMed]
  30. Minxia, L.; Chunliang, Y.; Ruolan, M. Effect of soil water-phosphorus coupling on the photosynthetic capacity of Robinia pseudoacacia L. seedlings in semi-arid areas of the Loess Plateau, China. Environ. Monit. Assess. 2023, 195, 932. [Google Scholar] [CrossRef] [PubMed]
  31. Salvi, A.M.; Gosetti, S.; Smith, D.D.; Adams, M.A.; Givnish, T.J.; McCulloh, K.A. Hydroscapes, hydroscape plasticity, and relationships to functional traits and mesophyll photosynthetic sensitivity to leaf water potential in Eucalyptus species. Plant Cell Environ. 2022, 45, 2573–2588. [Google Scholar] [CrossRef] [PubMed]
  32. Liu, Y.; Sun, J.; Dai, C.; Du, G.; Shi, R.; Wu, J. Physiological and Biochemical Adaptations to Repeated Drought-Rehydration Cycles in Ochroma lagopus Swartz: Implications for Growth and Stress Resilience. Plants 2025, 14, 1636. [Google Scholar] [CrossRef] [PubMed]
  33. Wang, J.; Wang, X.; Ji, Y.; Gao, J. Climate factors determine the utilization strategy of forest plant resources at large scales. Front. Plant Sci. 2022, 13, 990441. [Google Scholar] [CrossRef] [PubMed]
  34. Fan, A.; Wang, X.; Yan, X.; Chen, T.; Jiang, Q.; Jia, L.; Wang, W.; Xiong, D.; Huang, J.; Chen, G. Does a whole plant conservation gradient exist within a subtropical broadleaved evergreen forest? Front. Plant Sci. 2024, 15, 1481323. [Google Scholar] [CrossRef] [PubMed]
  35. Zhang, X.; Li, B.; Peñuelas, J.; Sardans, J.; Cheng, D.; Yu, H.; Zhong, Q. Resource-acquisitive species have greater plasticity in leaf functional traits than resource-conservative species in response to nitrogen addition in subtropical China. Sci. Total Environ. 2023, 903, 166177. [Google Scholar] [CrossRef] [PubMed]
  36. Ren, Y.; Li, J.; Zhang, S.; Shao, J.; Li, X.; Zhong, Q.; Hu, D.; Cheng, D. Leaf trait networks of subtropical woody plants weaken along an elevation gradient. Plant Sci. 2025, 352, 112340. [Google Scholar] [CrossRef] [PubMed]
  37. Cheng, Z.; Nuo, H.; Fengyu, Z.; Ting, W.; Xianjin, H.; Jianan, W.; Yiyong, L. Intraspecific variations of leaf hydraulic, economic, and anatomical traits in Cinnamomum camphora along an urban-rural gradient. Sci. Total Environ. 2023, 904, 166741. [Google Scholar] [CrossRef] [PubMed]
  38. Shi, J.; Tan, J.; Li, S.; Tao, L.; Jiang, X.; Zhang, Q.; Zhang, F.; Liao, Y.; Zhang, Y.; Chen, Q. Leaf adaptation strategy of non-tree plants altered by community structure implies vegetation degradation risk in alpine rocky desertification areas. Sci. Rep. 2025, 15, 8561. [Google Scholar] [CrossRef] [PubMed]
  39. Zhang, Y.; Liu, R.; Liu, Z.; Hu, Y.; Xia, Z.; Hu, B.; Rennenberg, H. Consequences of excess urea application on photosynthetic characteristics and nitrogen metabolism of Robinia pseudoacacia seedlings. Chemosphere 2024, 346, 140619. [Google Scholar] [CrossRef] [PubMed]
  40. Zhang, Z.; Tariq, A.; Zeng, F.; Graciano, C.; Zhang, B. Nitrogen application mitigates drought-induced metabolic changes in Alhagi sparsifolia seedlings by regulating nutrient and biomass allocation patterns. Plant Physiol. Biochem. 2020, 155, 828–841. [Google Scholar] [CrossRef] [PubMed]
  41. Cao, Y.; Pan, Y.; Yang, Y.; Liu, T.; Wang, M.; Li, Y.; Guo, S. Variation of mesophyll conductance mediated by nitrogen form is related to changes in cell wall property and chloroplast number. Hortic. Res. 2024, 11, uhae112. [Google Scholar] [CrossRef] [PubMed]
  42. Xing, H.; Zhou, W.; Wang, C.; Li, L.; Li, X.; Cui, N.; Hao, W.; Liu, F.; Wang, Y. Excessive nitrogen application under moderate soil water deficit decreases photosynthesis, respiration, carbon gain and water use efficiency of maize. Plant Physiol. Biochem. 2021, 166, 1065–1075. [Google Scholar] [CrossRef] [PubMed]
  43. Roy, R.; Mahboob, M.G.; Arena, C.; Kader, M.A.; Sultana, S.; Hasan, A.K.; Wang, J.; Sarker, T.; Zhang, R.; Barmon, M. The Modulation of Water, Nitrogen, and Phosphorous Supply for Growth Optimization of the Evergreen Shrubs Ammopiptanthus mongolicus for Revegetation Purpose. Front. Plant Sci. 2021, 12, 766523. [Google Scholar] [CrossRef] [PubMed]
  44. Tariq, A.; Pan, K.; Olatunji, O.A.; Graciano, C.; Li, Z.; Sun, F.; Zhang, L.; Wu, X.; Chen, W.; Song, D.; et al. Phosphorous fertilization alleviates drought effects on Alnus cremastogyne by regulating its antioxidant and osmotic potential. Sci. Rep. 2018, 8, 5644. [Google Scholar] [CrossRef] [PubMed]
  45. Chen, X.-Z.; Hogan, J.A.; Wang, C.-P.; Wang, P.-L.; Lin, T.-C.; Buckley, T. Responses of a common tropical epiphyte, Asplenium nidus, to changes in water and nutrient availability. AoB PLANTS 2023, 15, plad076. [Google Scholar] [CrossRef] [PubMed]
  46. Ullah, A.; Tariq, A.; Zeng, F.; Sardans, J.; Graciano, C.; Ullah, S.; Chai, X.; Zhang, Z.; Keyimu, M.; Asghar, M.A.; et al. Phosphorous Supplementation Alleviates Drought-Induced Physio-Biochemical Damages in Calligonum mongolicum. Plants 2022, 11, 3054. [Google Scholar] [CrossRef] [PubMed]
  47. Zhu, H.; Nie, L.; He, X.; Wang, X.; Long, P.; Chen, H. Water and Fertilizer Management Is an Important Way to Synergistically Enhance the Yield, Rice Quality and Lodging Resistance of Hybrid Rice. Plants 2024, 13, 2518. [Google Scholar] [CrossRef] [PubMed]
  48. Xinyue, Z.; Peiyun, H.; Rongyu, G.; Kaifeng, H.; Xiaoyan, H. Effects of salt stress on root morphology, carbon and nitrogen metabolism, and yield of Tartary buckwheat. Sci. Rep. 2023, 13, 12483. [Google Scholar] [CrossRef] [PubMed]
  49. Liu, M.; Shi, J.; Zhang, X. Responses of Ecological Stoichiometry of Plants and Soils to Degradation Levels in Alpine Wetlands of the Qinghai-Tibet Plateau. Environ. Manag. 2025, 75, 2258–2271. [Google Scholar] [CrossRef] [PubMed]
  50. Coker, H.R.; Lin, H.-A.; Shackelford, C.E.B.; Tfaily, M.M.; Smith, A.P.; Howe, J.A. Drought stimulates root exudation of organic nitrogen in cotton (Gossypium hirsutem). Front. Plant Sci. 2024, 15, 1431004. [Google Scholar] [CrossRef] [PubMed]
  51. Wang, X.; Li, S.; Zhu, B.; Homyak, P.M.; Chen, G.; Yao, X.; Wu, D.; Yang, Z.; Lyu, M.; Yang, Y. Long-term nitrogen deposition inhibits soil priming effects by enhancing phosphorus limitation in a subtropical forest. Glob. Change Biol. 2023, 29, 4081–4093. [Google Scholar] [CrossRef] [PubMed]
  52. Yang, K.; Li, S.; Sun, Y.; Cartmill, A.D.; López, I.F.; Ma, C.; Zhang, Q. Effects of combined nitrogen and phosphorus application on soil phosphorus fractions in alfalfa (Medicago sativa L.) production in China. Front. Plant Sci. 2024, 15, 13708. [Google Scholar] [CrossRef] [PubMed]
  53. Wang, N.; Zhan, J.; Feng, K.; Qi, J.; Nan, H. Higher yield sustainability and soil quality by reducing chemical fertilizer with organic fertilizer application under a single-cotton cropping system. Front. Plant Sci. 2024, 15, 1494667. [Google Scholar] [CrossRef] [PubMed]
  54. Tong, S.; Zhang, J.; Qiao, X.; Li, B.; Yang, Q.; Hu, P.; Yu, S. Does local soil factor drive functional leaf trait variation? A test on Neilingding Island, South China. BMC Ecol. Evol. 2024, 24, 43. [Google Scholar] [CrossRef] [PubMed]
  55. Li, C.; Li, X.; Yang, Y.; Shi, Y.; Li, H. Degradation reduces the diversity of nitrogen-fixing bacteria in the alpine wetland on the Qinghai-Tibet Plateau. Front. Plant Sci. 2022, 13, 939762. [Google Scholar] [CrossRef] [PubMed]
  56. Uddin, M.J.; Hooda, P.S.; Mohiuddin, A.S.M.; Haque, M.E.; Smith, M.; Waller, M.; Biswas, J.K. Soil organic carbon dynamics in the agricultural soils of Bangladesh following more than 20 years of land use intensification. J. Environ. Manag. 2022, 305, 114427. [Google Scholar] [CrossRef] [PubMed]
  57. Zhou, Y.; Ma, J.; Ma, J.; Lu, Q.; Wang, G.; Shen, Y.; Ma, H. Extending grazing time during the warm season can reduce P limitation and increase the N cycling rate in arid desert steppes. Sci. Total Environ. 2024, 941, 173664. [Google Scholar] [CrossRef] [PubMed]
  58. Liu, J.; Zhang, W.; Wang, R.; Wu, S.; Bai, X.; Wang, X.; Zhu, W.; Ding, C. Functional decoupling between plant remediation efficacy and microbial metal resistance in iron tailings: A Robinia pseudoacacia-driven paradox. Ecotoxicol. Environ. Saf. 2026, 310, 119760. [Google Scholar] [CrossRef] [PubMed]
  59. Xu, M.; Li, W.; Wang, J.; Zhu, Y.; Feng, Y.; Yang, G.; Zhang, W.; Han, X. Soil ecoenzymatic stoichiometry reveals microbial phosphorus limitation after vegetation restoration on the Loess Plateau, China. Sci. Total Environ. 2022, 815, 152918. [Google Scholar] [CrossRef] [PubMed]
  60. Zhang, Z.; Wang, X.; Guo, S.; Li, Z.; He, M.; Zhang, Y.; Li, G.; Han, X.; Yang, G. Divergent patterns and drivers of leaf functional traits of Robinia pseudoacacia and Pinus tabulaeformis plantations along a precipitation gradient in the Loess plateau, China. J. Environ. Manag. 2023, 348, 119318. [Google Scholar] [CrossRef] [PubMed]
  61. Singh, R.; Pandey, R. Underlying plant trait strategies for understanding the carbon sequestration in Banj oak Forest of Himalaya. Sci. Total Environ. 2024, 919, 170681. [Google Scholar] [CrossRef] [PubMed]
  62. Dong, T.; Wu, F.; Tsujii, Y.; Townsend, P.A.; Yang, N.; Xu, W.; Liu, S.; Swenson, N.G.; Lamour, J.; Han, W.; et al. Deciphering the variability of leaf phosphorus-allocation strategies using leaf economic traits and reflectance spectroscopy across diverse forest types. New Phytol. 2025, 247, 1129–1144. [Google Scholar] [CrossRef] [PubMed]
  63. Heckman, R.W.; John, G.P.; Bonnette, J.E.; Campitelli, B.E.; Fritschi, F.B.; Lowry, D.B.; Fay, P.A.; Juenger, T.E. Correlational selection and genetic architecture shape the evolution of the leaf economics spectrum in a perennial grass. Proc. Natl. Acad. Sci. USA 2026, 123, e2515134123. [Google Scholar] [CrossRef] [PubMed]
  64. Li, S.; Moller, C.A.; Mitchell, N.G.; Martin, D.G.; Sacks, E.J.; Saikia, S.; Labonte, N.R.; Baldwin, B.S.; Morrison, J.I.; Ferguson, J.N.; et al. The leaf economics spectrum of triploid and tetraploid C4 grass Miscanthus x giganteus. Plant Cell Environ. 2022, 45, 3462–3475. [Google Scholar] [CrossRef] [PubMed]
  65. Tian, D.; Yan, Z.; Schmid, B.; Kattge, J.; Fang, J.; Stocker, B.D. Environmental versus phylogenetic controls on leaf nitrogen and phosphorous concentrations in vascular plants. Nat. Commun. 2024, 15, 5346. [Google Scholar] [CrossRef] [PubMed]
  66. Zhang, C.; Li, Q.; Feng, R.; Zhang, Z.; Yang, Y.; Liu, J. C:N:P stoichiometry of plant-soil-microbe in the secondary succession of zokor-made mounds on Qinghai-Tibet Plateau. Environ. Res. 2023, 222, 115333. [Google Scholar] [CrossRef] [PubMed]
  67. Ancín, M.; Larraya, L.; Florez-Sarasa, I.; Bénard, C.; Fernández-San Millán, A.; Veramendi, J.; Gibon, Y.; Fernie, A.R.; Aranjuelo, I.; Farran, I. Overexpression of thioredoxin m in chloroplasts alters carbon and nitrogen partitioning in tobacco. J. Exp. Bot. 2021, 72, 4949–4964. [Google Scholar] [CrossRef] [PubMed]
  68. Peng, Z.; Wu, Y.; Guo, L.; Yang, L.; Wang, B.; Wang, X.; Liu, W.; Su, Y.; Wu, J.; Liu, L. Foliar nutrient resorption stoichiometry and microbial phosphatase catalytic efficiency together alleviate the relative phosphorus limitation in forest ecosystems. New Phytol. 2023, 238, 1033–1044. [Google Scholar] [CrossRef] [PubMed]
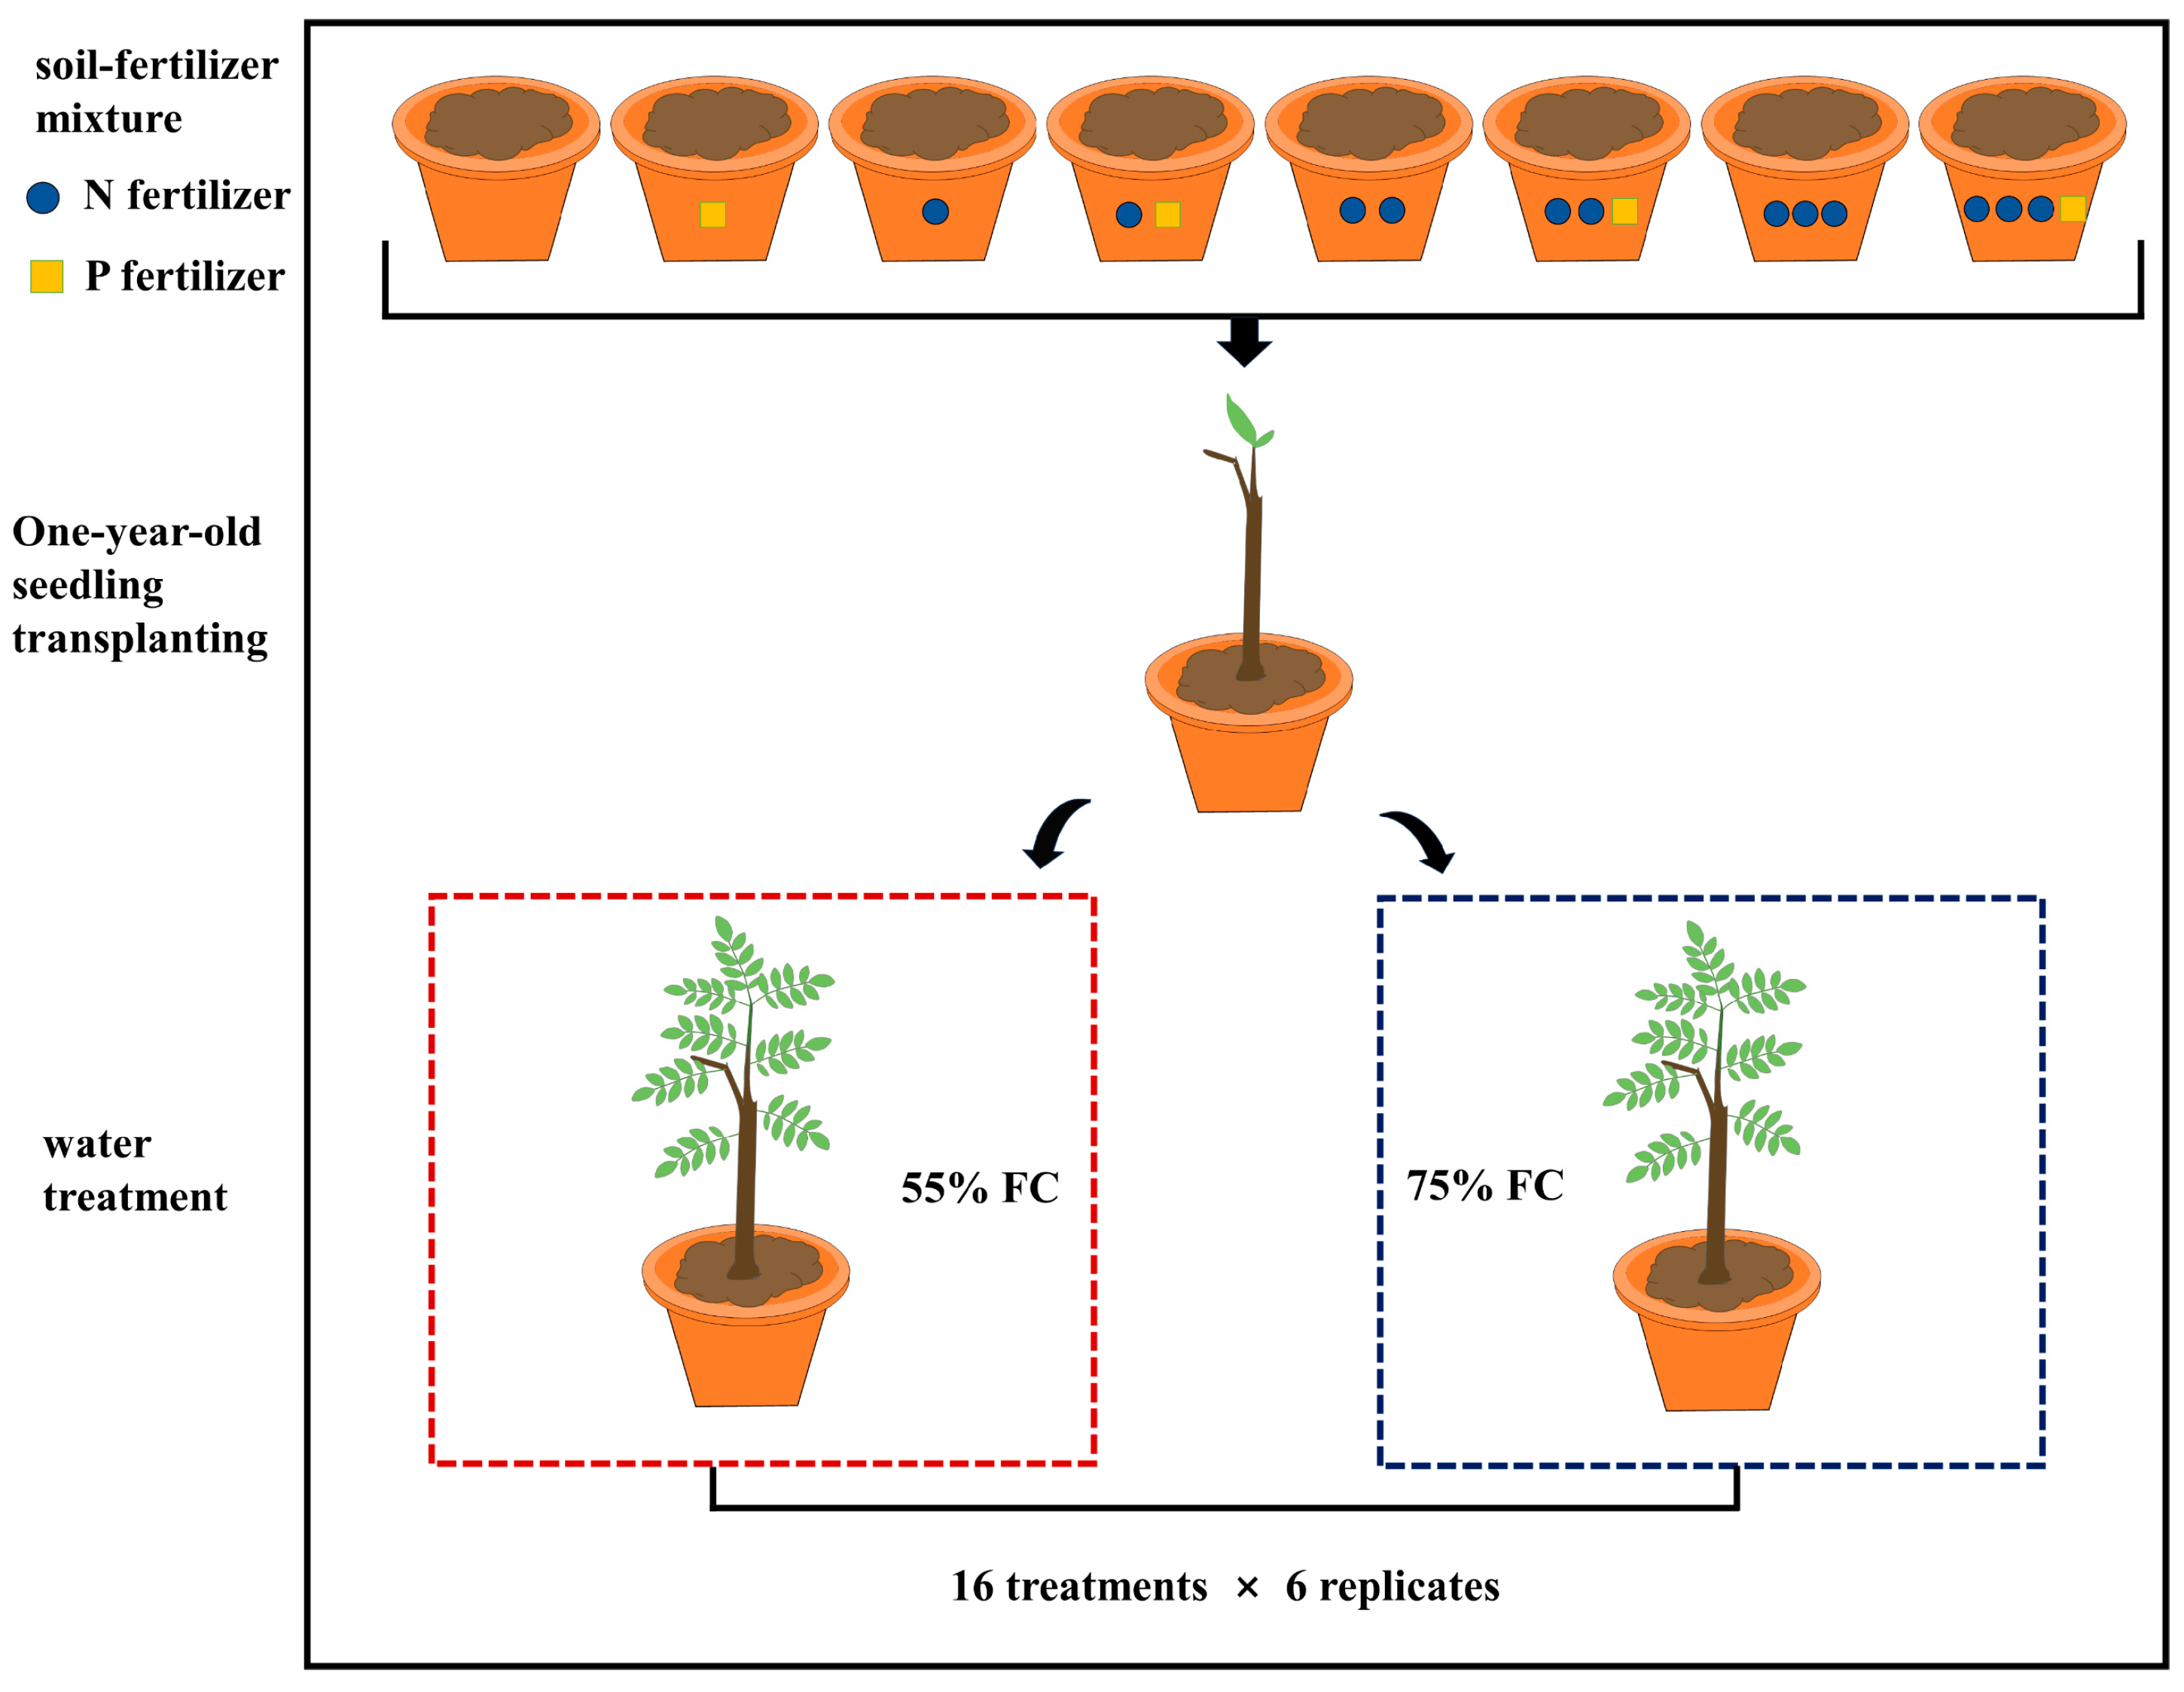
Figure 1. Schematic diagram of the experimental design and treatment setup.
Agronomy 16 01479 g001
Figure 2. Ranking of the plasticity index (PI) of leaf traits in R. pseudoacacia seedlings under different water conditions: (a) drought treatment (W1, 55% of field capacity); (b) well-watered treatment (W2, 75% of field capacity). LA, leaf area; FW, fresh weight; TW, turgid weight; DW, dry weight; LT, leaf thickness; SLA, specific leaf area; LMA, leaf mass per area; LDMC, leaf dry matter content; LWC, leaf water content; RWC, relative water content; LTD, leaf tissue density; C, carbon content; N, nitrogen content; P, phosphorus content; SS, soluble sugar; SP, soluble protein; Pro, proline.
Agronomy 16 01479 g002
Figure 3. Network analysis of leaf traits in R. pseudoacacia seedlings. Red cluster: LT, leaf thickness; LA, leaf area; SLA, specific leaf area; LMA, leaf mass per area; DW, dry weight; FW, fresh weight; TW, turgid weight; LTD, leaf tissue density. Blue cluster: RWC, relative water content; LDMC, leaf dry matter content; LWC, leaf water content. Green cluster: Pro, proline; SP, soluble protein. Purple cluster: C, carbon content; N, nitrogen content; P, phosphorus content; C:N, carbon-to-nitrogen ratio; C:P, carbon-to-phosphorus ratio; N:P, nitrogen-to-phosphorus ratio.
Agronomy 16 01479 g003
Figure 4. Effects of different water regimes and nitrogen–phosphorus addition treatments on leaf morphological traits of R. pseudoacacia seedlings. Under the same water condition, different lowercase letters indicate significant differences among nitrogen and phosphorus treatments at p < 0.05. Lowercase letters in the upper-left corner of each panel are panel labels only and do not indicate statistical significance. Lowercase letters in the upper-left corner of each panel are panel labels only and do not indicate statistical significance. LA, leaf area (a); FW, fresh weight (b); TW, turgid weight (c); DW, dry weight (d).
Agronomy 16 01479 g004
Figure 5. Effects of different water regimes and nitrogen–phosphorus addition treatments on leaf structural traits of R. pseudoacacia seedlings. Under the same water condition, different lowercase letters indicate significant differences among nitrogen and phosphorus treatments at p < 0.05. Lowercase letters in the upper-left corner of each panel are panel labels only and do not indicate statistical significance. LT, leaf thickness (a); SLA, specific leaf area (b); LMA, leaf mass per area (c); LDMC, leaf dry matter content (d); LTD, leaf tissue density (e).
Agronomy 16 01479 g005
Figure 6. Effects of different water regimes and nitrogen–phosphorus addition treatments on leaf physiological traits of R. pseudoacacia seedlings. Under the same water condition, different lowercase letters indicate significant differences among nitrogen and phosphorus treatments at p < 0.05. Lowercase letters in the upper-left corner of each panel are panel labels only and do not indicate statistical significance. LWC, leaf water content (a); RWC, relative water content (b); SS, soluble sugar (c); SP, soluble protein (d); Pro, proline (e).
Agronomy 16 01479 g006
Figure 7. Effects of different water regimes and nitrogen–phosphorus addition treatments on leaf chemical traits of R. pseudoacacia seedlings. Under the same water condition, different lowercase letters indicate significant differences among nitrogen and phosphorus treatments at p < 0.05. Lowercase letters in the upper-left corner of each panel are panel labels only and do not indicate statistical significance. C, carbon content (a); N, nitrogen content (b); P, phosphorus content (c); C:N, carbon-to-nitrogen ratio (d); C:P, carbon-to-phosphorus ratio (e); N:P, nitrogen-to-phosphorus ratio (f).
Agronomy 16 01479 g007
Figure 8. Effects of different water regimes and nitrogen–phosphorus addition treatments on rhizosphere soil physicochemical properties of R. pseudoacacia seedlings. Under the same water condition, different lowercase letters indicate significant differences among nitrogen and phosphorus treatments at p < 0.05. Lowercase letters in the upper-left corner of each panel are panel labels only and do not indicate statistical significance. pH, soil pH (a); SOC, soil organic carbon (b); TN, total nitrogen (c); TP, total phosphorus (d); AP, available phosphorus (e); NO3-N, nitrate nitrogen (f); NH4+-N, ammonium nitrogen (g).
Agronomy 16 01479 g008
Figure 9. Mantel test correlations between leaf trait categories and rhizosphere soil physicochemical properties in R. pseudoacacia seedlings. ** p < 0.01, * p < 0.05. Morphological traits include LA, FW, TW, and DW; structural traits include LT, SLA, LMA, LDMC, and LTD; physiological traits include LWC, RWC, SS, SP, and Pro; chemical traits include C, N, P, C:N, C:P, and N:P.
Agronomy 16 01479 g009
Figure 10. Redundancy analysis (RDA) ordination plot showing the relationships between leaf traits and rhizosphere soil physicochemical factors in R. pseudoacacia seedlings. SOC, soil organic carbon; TN, total nitrogen; TP, total phosphorus; AP, available phosphorus; NO3-N, nitrate nitrogen; NH4+-N, ammonium nitrogen; LA, leaf area; FW, fresh weight; TW, turgid weight; DW, dry weight; LT, leaf thickness; SLA, specific leaf area; LMA, leaf mass per area; LDMC, leaf dry matter content; LWC, leaf water content; RWC, relative water content; LTD, leaf tissue density; C, carbon content; N, nitrogen content; P, phosphorus content; SS, soluble sugar; SP, soluble protein; Pro, proline.
Agronomy 16 01479 g010
Figure 11. Pearson correlation matrix of leaf traits and rhizosphere soil variables in R. pseudoacacia seedlings. * p < 0.05; ** p < 0.01; *** p < 0.001. LA, leaf area; LT, leaf thickness; FW, fresh weight; TW, turgid weight; DW, dry weight; SLA, specific leaf area; LMA, leaf mass per area; LDMC, leaf dry matter content; LWC, leaf water content; RWC, relative water content; LTD, leaf tissue density; C, carbon content; N, nitrogen content; P, phosphorus content; SS, soluble sugar; SP, soluble protein; Pro, proline; SOC, soil organic carbon; TN, total nitrogen; TP, total phosphorus; AP, available phosphorus; NO3-N, nitrate nitrogen; NH4+-N, ammonium nitrogen.
Agronomy 16 01479 g011
Table 1. Effects of different water regimes and nitrogen–phosphorus addition treatments on leaf morphological traits of R. pseudoacacia seedlings.
FactorLAFWTWDW
F-Valuep-ValueF-Valuep-ValueF-Valuep-ValueF-Valuep-Value
W26.882<0.001 ***2.3870.132 ns3.1640.084 ns0.8990.350 ns
N1.0530.382 ns3.5560.025 *3.9040.017 *3.7950.019 *
P3.8190.059 ns1.3010.262 ns1.8240.186 ns2.7430.107 ns
W × N3.6740.022 *2.4040.085 ns2.5080.076 ns2.5110.076 ns
W × P0.0020.969 ns0.2720.605 ns0.1480.702 ns0.2240.639 ns
N × P0.1990.896 ns0.5450.654 ns0.4030.752 ns0.1820.907 ns
W × N × P0.9770.415 ns1.3010.291 ns0.8680.467 ns1.2710.301 ns
R20.6020.4610.4680.459
Note: Values represent F-values and significance levels of morphological trait parameters under different treatments. R2 indicates the proportion of variance explained by the model. W, N, and P represent water, nitrogen, and phosphorus, respectively, and × indicates interaction effects. *** p < 0.001, * p < 0.05, and ns indicates no significant difference. LA, leaf area; FW, fresh weight; TW, turgid weight; DW, dry weight.
Table 2. Effects of different water regimes and nitrogen–phosphorus addition treatments on leaf structural traits of R. pseudoacacia seedlings.
FactorLTSLALMALDMCLTD
F-Valuep-ValueF-Valuep-ValueF-Valuep-ValueF-Valuep-ValueF-Valuep-Value
W0.030.863 ns5.8610.021 *6.0830.019 *5.1590.029 *9.0510.005 **
N0.4430.723 ns1.2940.293 ns0.9140.445 ns1.1710.336 ns2.5720.07 ns
P1.4110.243 ns2.7080.109 ns3.0160.092 ns1.2250.276 ns10.7780.002 **
W × N0.2920.830 ns3.5360.025 *2.5610.072 ns0.1870.904 ns3.8100.019 *
W × P1.4630.235 ns0.7500.392 ns1.3500.253 ns0.2400.878 ns0.8400.366 ns
N × P1.0400.388 ns0.1940.899 ns0.1240.945 ns0.7270.543 ns0.8660.468 ns
W × N × P0.7700.519 ns0.5490.652 ns0.6900.564 ns3.1360.038 *0.7980.504 ns
R20.2710.4490.4210.4080.583
Note: Values represent F-values and significance levels of structural trait parameters under different treatments. R2 indicates the proportion of variance explained by the model. W, N, and P represent water, nitrogen, and phosphorus, respectively, and × indicates interaction effects. ** p < 0.01, * p < 0.05, and ns indicates no significant difference. LT, leaf thickness; SLA, specific leaf area; LMA, leaf mass per area; LDMC, leaf dry matter content; LTD, leaf tissue density.
Table 3. Effects of different water regimes and nitrogen–phosphorus addition treatments on leaf physiological traits of R. pseudoacacia seedlings.
FactorLWCRWCSSSPPro
F-Valuep-ValueF-Valuep-ValueF-Valuep-ValueF-Valuep-ValueF-Valuep-Value
W4.5310.041 *0.3800.542 ns54.153 <0.001 ***19.033 <0.001 ***1633.200<0.001 ***
N0.6310.600 ns4.9870.005 **103.167<0.001 ***431.132<0.001 ***1637.984<0.001 ***
P3.8200.059 ns0.7040.407 ns140.414<0.001 ***37.391<0.001 ***1204.871<0.001 ***
W × N0.9720.417 ns1.8920.150 ns136.831<0.001 ***139.276<0.001 ***1541.738<0.001 ***
W × P0.0390.845 ns0.1880.667 ns11.5550.002 **156.305<0.001 ***1845.967<0.001 ***
N × P1.7350.179 ns1.8990.149 ns62.198<0.001 ***202.238<0.001 ***1461.346<0.001 ***
W × N × P1.0480.384 ns2.1340.115 ns28.105<0.001 ***925.571<0.001 ***996.212<0.001 ***
R20.4020.5150.9740.9940.999
Note: Values represent F-values and significance levels of physiological trait parameters under different treatments. R2 indicates the proportion of variance explained by the model. W, N, and P represent water, nitrogen, and phosphorus, respectively, and × indicates interaction effects. *** p < 0.001, ** p < 0.01, * p < 0.05, and ns indicates no significant difference. LWC, leaf water content; RWC, relative water content; SS, soluble sugar; SP, soluble protein; Pro, proline.
Table 4. Effects of different water regimes and nitrogen–phosphorus addition treatments on leaf chemical traits of R. pseudoacacia seedlings.
FactorCNPC:NC:PN:P
F-Valuep-ValueF-Valuep-ValueF-Valuep-ValueF-Valuep-ValueF-Valuep-ValueF-Valuep-Value
W1.7590.194 ns1.8320.185 ns0.0650.800 ns3.6630.064 ns0.3000.587 ns3.0230.091 ns
N4.8370.006 **5.4800.003 **0.9850.411 ns1.3280.282 ns1.5310.225 ns5.9280.002 **
P4.0550.052 ns3.2130.082 ns1.4270.240 ns6.1870.018 *0.0020.968 ns7.9400.008 **
W × N4.6610.008 **3.9070.017 *0.3340.801 ns1.6650.194 ns1.9370.143 ns1.2740.300 ns
W × P0.0260.872 ns3.5840.067 ns0.5100.480 ns2.0820.158 ns0.2120.648 ns7.7350.009 **
N × P1.6860.189 ns2.9470.047 *4.9470.006 **1.8070.165 ns2.8980.050 *4.1400.013 *
W × N × P2.0770.122 ns4.1290.013 *0.0730.973 ns3.0430.042 *0.6620.581 ns3.7990.019 *
R20.5880.6450.3960.5260.4030.667
Note: Values represent F-values and significance levels of chemical trait parameters under different treatments. R2 indicates the proportion of variance explained by the model. W, N, and P represent water, nitrogen, and phosphorus, respectively, and × indicates interaction effects. ** p < 0.01, * p < 0.05, and ns indicates no significant difference. C, carbon content; N, nitrogen content; P, phosphorus content; C:N, carbon-to-nitrogen ratio; C:P, carbon-to-phosphorus ratio; N:P, nitrogen-to-phosphorus ratio.
Table 5. Effects of different water regimes and nitrogen–phosphorus addition treatments on rhizosphere soil physicochemical properties of R. pseudoacacia seedlings.
FactorpHSOCTNTPAPNO3-NNH4+-N
F-Valuep-ValueF-Valuep-ValueF-Valuep-ValueF-Valuep-ValueF-Valuep-ValueF-Valuep-ValueF-Valuep-Value
W4.3100.046 *21.899<0.001 ***0.8680.358 ns0.1050.748 ns0.1440.706 ns2.4190.129 ns1.3430.254 ns
N1.3790.267 ns4.6300.008 **13.694<0.001 ***1.7000.186 ns2.1530.112 ns2.8880.051 ns10.375<0.001 ***
P1.0930.303 ns0.1080.744 ns0.0010.970 ns22.630<0.001 ***30.046<0.001 ***4.3610.044 *2.0150.165 ns
W × N0.5830.630 ns2.3290.093 ns4.8980.006 **0.3630.780 ns1.4880.236 ns5.9700.002 **7.023<0.001 ***
W × P0.2890.594 ns0.2910.593 ns,6.1540.018 *0.6670.420 ns0.7520.392 ns8.0660.007 **2.6310.114 ns
N × P0.9760.416 ns3.9360.016 *2.5730.071 ns 1.7190.182 ns 5.4310.003 **3.1260.039 *3.8030.019 *
W × N × P1.7780.171 ns2.4660.080 ns2.4980.077 ns0.8210.492 ns0.3200.810 ns14.592<0.001 ***1.4120.257 ns
R20.3830.6610.7090.5380.6490.7470.698
Note: Values represent F-values and significance levels of rhizosphere soil physicochemical parameters under different treatments. R2 indicates the proportion of variance explained by the model. W, N, and P represent water, nitrogen, and phosphorus, respectively, and × indicates interaction effects. *** p < 0.001, ** p < 0.01, * p < 0.05, and ns indicates no significant difference. SOC, soil organic carbon; TN, total nitrogen; TP, total phosphorus; AP, available phosphorus; NO3-N, nitrate nitrogen; NH4+-N, ammonium nitrogen.
Disclaimer/Publisher’s Note: The statements, opinions and data contained in all publications are solely those of the individual author(s) and contributor(s) and not of MDPI and/or the editor(s). MDPI and/or the editor(s) disclaim responsibility for any injury to people or property resulting from any ideas, methods, instructions or products referred to in the content.