Article

Adaptability of Rice–Ratoon Rice Cropping System with High Yield Mode in the Northern Area of Guangdong Province


1
College of Agriculture, South China Agricultural University, Guangzhou 510642, China
2
Guangdong Agricultural Technology Extension Center, Guangzhou 510520, China
*
Authors to whom correspondence should be addressed.
Agronomy 2026, 16(15), 1456; https://doi.org/10.3390/agronomy16151456
Submission received: 30 June 2026 / Revised: 26 July 2026 / Accepted: 30 July 2026 / Published: 31 July 2026
(This article belongs to the Section Innovative Cropping Systems)

Abstract

To evaluate the yield and grain quality performance of rice varieties under rice-ratoon rice cultivation in northern Guangdong, a four-site field experiment was conducted from March to November of 2025 in Liannan and Lianshan counties of Qingyuan City and in Liucheng and Shangguan townships of Dongyuan County, Heyuan City, respectively. Seven rice varieties were evaluated: Qingxiangyou 19xiang (QXY), Nanjingxiangzhan (NJXZ), Jiangliangyouhuazhan (JLYHZ), Guiliangyou 6177 (GLY), Weiliangyouyuzhan (WLYYZ), Guiyouxinzhan (GYXZ), and Jiulixiang (JLX). The results showed clear differences in grain yield and grain quality among varieties and ecological sites. QXY generally showed the highest grain yield, especially in the ratoon crop, and ranked first in annual grain yield among the four sites, with values ranging from 10.26 to 11.63 t ha−1. However, the quality advantage differed among sites and varieties. JLYHZ showed the best quality performance in Lianshan County and Dongyuan County (Shangguan Township), GLY showed the best quality performance in Liannan County, and JLX showed the best quality performance in Dongyuan County (Liucheng Township). These results indicated a yield–quality trade-off among the tested varieties. Therefore, QXY may be considered a promising yield-oriented variety for the tested sites in northern Guangdong, whereas JLYHZ, GLY, and JLX may be more suitable where grain quality is prioritized.

1. Introduction

Food security is a fundamental pillar of national security, and rice, as the leading staple crop in China, plays a critical role in ensuring stable food supply [1,2]. In Guangdong Province, rice accounts for over 76% of the province’s total grain output, with the northern region (Northern Guangdong) serving as a key production area [3]. However, this region is characterized by a typical pattern of photo-thermal resources described as “insufficient for double cropping but surplus for single cropping” [4]. The traditional double-season rice system faces multiple constraints, including limited photo-thermal resources and labor shortages [5,6], while the single-season rice system fails to fully utilize the residual photo-thermal resources during the growing season, thereby limiting its yield potential [7]. The ratoon rice system—whereby a second crop is harvested from the axillary buds of the stubble after the main crop harvest—offers distinct advantages in enhancing the multiple cropping index, conserving resources, and reducing labor inputs, serving as a critical pathway to overcome the bottleneck of grain production in northern Guangdong [8,9].
Variety selection is the foremost factor in ensuring high yield and superior quality in ratoon rice production [10]. Significant differences in grain yield and quality exist among rice varieties [11], and selecting varieties well-adapted to local ecological conditions is therefore a critical step in optimizing ratoon rice performance [12]. Systematic variety screening has been conducted in multiple rice-growing regions worldwide. For instance, Xie et al. [13] evaluated 16 ultrashort-duration cultivars in a rice-ratoon-rice system in central Japan and identified two japonica cultivars with high tiller regeneration rates. In West Africa, Dossou-Yovo et al. [14] identified three perennial rice varieties with cumulative grain yield comparable to local checks. In Pakistan, hybrid cultivars significantly outperformed non-hybrid types under optimized nitrogen management [15]. Collectively, these studies demonstrate that comparing grain yield and quality among varieties across different ecological regions is a well-established approach for identifying suitable ratoon rice varieties for local cultivation [16].
However, previous studies on ratoon rice variety screening in North Guangdong have primarily concentrated on a single ecological site or a single variety, with systematic comparisons across multiple sites remaining scarce. To address this gap, the present study established variety comparison trials at four representative ecological sites in North Guangdong—Yonghe Town in Lianshan County, Sanjiang Town in Liannan County, Shangguan Town in Dongyuan County, and Liucheng Town in Dongyuan County—with three promising varieties selected at each site. Growth duration, grain yield and its component traits, and rice quality parameters were systematically evaluated for each variety at each site to identify the most suitable ratoon rice varieties for each location. The findings are expected to provide a theoretical basis for the large-scale adoption of ratoon rice systems in the major rice-producing areas of Qingyuan and Heyuan cities in North Guangdong.

2. Materials and Methods

2.1. Experimental Site and Plant Materials

The field experiments were conducted from March to November of 2025 at four ecological sites in northern Guangdong (Qingyuan and Heyuan city): Yonghe Township, Lianshan County, Qingyuan (24°39′ N, 112°05′ E); Sanjiang Township, Liannan County, Qingyuan (24°43′ N, 112°17′ E); Shangguan Township, Dongyuan County, Heyuan (24°06′ N, 115°00′ E); and Liucheng Township, Dongyuan County, Heyuan (24°01′ N, 115°07′ E). The study region has a subtropical monsoon climate, with a mean annual temperature of 18–21 °C and mean annual sunshine duration of 1400–1900 h. The meteorological data during the whole growth stage at four sites in 2025 are shown in Figure 1. Seven rice varieties with potential for popularization were used in this study: Qingxiangyou 19xiang (QXY), Nanjingxiangzhan (NJXZ), Jiangliangyouhuazhan (JLYHZ), Guiliangyou 6177 (GLY), Weiliangyouyuzhan (WLYYZ), Guiyouxinzhan (GYXZ), and Jiulixiang (JLX). The seven rice varieties used in this experiment are all commercially available cultivars that have been officially released at the national or provincial level, with seeds provided directly by the respective suppliers. QXY was supplied by Guangdong Xianmei Seedling Co., Ltd. (Guangzhou, China); NJXZ, GLY, GYXZ, and JLX were supplied by Guangdong Jindao Seed Industry Co., Ltd. (Guangzhou, China); and JLYHZ and WLYYZ were supplied by Yuan Longping High-Tech Agriculture Co., Ltd. (Changsha, China). No single standard commercial check variety was included.

2.2. Experimental Design and Field Management

The field experiments were conducted at four ecological sites in northern Guangdong in 2025. At Yonghe Township, Lianshan County, the varieties tested were QXY, NJXZ, and JLYHZ; at Sanjiang Township, Liannan County, the varieties were QXY, GLY, and WLYYZ; at Shangguan Township, Dongyuan County, the varieties were QXY, GYXZ, and JLYHZ; and at Liucheng Township, Dongyuan County, the varieties were QXY, JLX, and WLYYZ. Seedlings were transplanted mechanically at a density of 16,000 hills per 667 m2, with 3–4 seedlings per hill for hybrid varieties and 5–6 seedlings per hill for conventional varieties. The planting spacing was 30 × 14 cm. A large-plot design was adopted, with each plot covering an area of approximately 6667 m2 (10 mu), and each treatment was replicated three times. Thus, each variety occupied approximately 2.0 ha (30 mu) at each site (3 plots × 10 mu), and the total planting area was approximately 6.0 ha (90 mu) at each ecological site. The experimental unit was the field plot. The plots were arranged in a sequential large-plot layout rather than a randomized complete block design, as this was a large-scale demonstration trial.
For the main crop season, 75% of a special rice compound fertilizer (N:P2O5:K2O = 22%:8%:12%) was applied as basal fertilizer, and the remaining 25% was applied at 10 days after transplanting to promote tillering. The main crop was harvested with a stubble height of 15.0 cm. A sprout-promoting fertilizer (46% urea at 10 kg per 667 m2 and potassium chloride at 10 kg per 667 m2) was applied 7 days before the main crop harvest. At 3 days after harvest, a light flood irrigation was applied to moisten the field, followed by an application of urea at 5 kg per 667 m2. At 20 days after the main crop harvest, the special rice compound fertilizer was applied at 20 kg per 667 m2 to promote panicle development in the ratoon crop. Alternate wetting and drying irrigation was practiced thereafter, and pests and diseases were controlled according to the local agricultural bureau’s advice.

2.3. Measurements and Methods

2.3.1. Grain Yield and Yield Components

Grain yield and yield components were determined according to the method of Pan et al. [17] with minor modifications. At maturity, an area of approximately 1000 m2 was randomly selected from each large plot and harvested using a combine harvester. The total fresh weight was recorded, and a subsample of grains was collected to determine moisture content. Grain yield was adjusted to 14% moisture content and expressed as kilograms per hectare (kg·ha−1). Additionally, fifteen representative hills were randomly sampled from each plot. After air-drying, the samples were manually threshed to determine the number of spikelets per panicle, filled-grain rate, and 1000-grain weight.

2.3.2. Rice Quality

Rice quality parameters were determined following the method of Mo et al. [18] with minor modifications. Briefly, paddy rice samples were dehulled using a huller (FC2K, Otake, Tokyo, Japan), and the brown rice was weighed to calculate the brown rice rate. The brown rice was then milled using a rice polisher (BLH-3120, Zhejiang Bolihang Instrument Equipment Co., Ltd., Zhejiang, China) to remove the bran layer, and the milled rice was weighed to calculate the milled rice rate. Head rice was separated from broken kernels using sieves with mesh sizes of 1.8 mm and 2.0 mm combined with manual selection, and the head rice was weighed to calculate the head rice rate. Chalky grain rate and chalkiness degree were determined using a rice appearance quality analyzer (SC-E, Hangzhou Wansen Precision Instruments Co., Ltd., Hangzhou, China). Protein and amylose contents were measured using a near-infrared grain analyzer (Infratec-1241, FOSS Corporation, Hilleroed, Denmark).

2.3.3. Leaf Area Index and Aboveground Biomass

Leaf area index (LAI) and aboveground biomass were determined at heading and maturity stages. At each stage, 10 hills were randomly selected from each large plot, and the total leaf area was measured using a handheld leaf area meter to calculate LAI. Subsequently, 6 hills were randomly sampled from each plot and transported to the laboratory. The plants were separated into stems, leaves, and panicles. The separated plant parts were placed in paper bags, oven-dried at 105 °C for 30 min to deactivate enzymes, and then dried at 8 °C to constant weight. The dry weights of stems, leaves, and panicles were summed to calculate total aboveground biomass. Roots were not included in the aboveground biomass calculation.

2.3.4. Chlorophyll Content

Photosynthetic pigment contents were determined according to the method of Zhang et al. [19]. Leaf samples were extracted with 95% ethanol in the dark for 24 h. After centrifugation at 5000 rpm for 5 min, the supernatant was collected, and the absorbance was measured at 665, 649 and 470 nm using a UV-Vis spectrophotometer. The contents of chlorophyll a, chlorophyll b and carotenoids were calculated using the corresponding formulas, and then converted to mg per g fresh weight. Total chlorophyll was calculated as the sum of chlorophyll a and b.

2.3.5. Nitrogen Metabolism Enzyme Activities

Nitrate reductase (NR) activity in rice leaves was determined following the method of Chen et al. [20]. Glutamine synthetase (GS) and glutamate synthase (GOGAT) activities in leaves were assayed according to the method described by Zhang et al. [21].

2.4. Statistical Analysis

All data were collated and statistically analyzed using Microsoft Excel 2017 and Statistik 9.0 software. Differences among treatment means were compared using Fisher’s least significant difference (LSD) test at the 0.05 probability level. All figures were created using Origin 2021 (OriginLab Corporation, Northampton, MA, USA). Because the set of tested varieties differed among ecological sites, the current design was not a complete factorial location×variety design for all seven varieties. Therefore, variety comparisons were conducted within each site, and cross-site interpretation was made cautiously as site-specific evidence.

3. Results

3.1. Grain Yield and Yield Components at Different Ecological Sites

3.1.1. Grain Yield and Yield Components of the Main Crop at Different Ecological Sites

As shown in Table 1, significant differences in main-crop grain yield were observed among three rice varieties in Liannan and Dongyuan County. QXY produced the highest grain yield, which was significantly higher than that of GLY and JLX, respectively. With respect to yield components, the superior grain yield of QXY was mainly attributed to its higher number of productive panicles and spikelets per panicle.

3.1.2. Grain Yield and Yield Components of the Ratoon Crop at Different Ecological Sites

Significant differences in ratoon-crop grain yield were observed in different varieties among all four ecological sites, with the yield of QXY ranking first at each site (Table 2). With respect to yield components, the superior ratoon-crop yield of QXY was primarily attributed to the number of productive panicles per ha and spikelets per panicle.

3.1.3. Annual Grain Yield and Yield Components at Different Ecological Sites

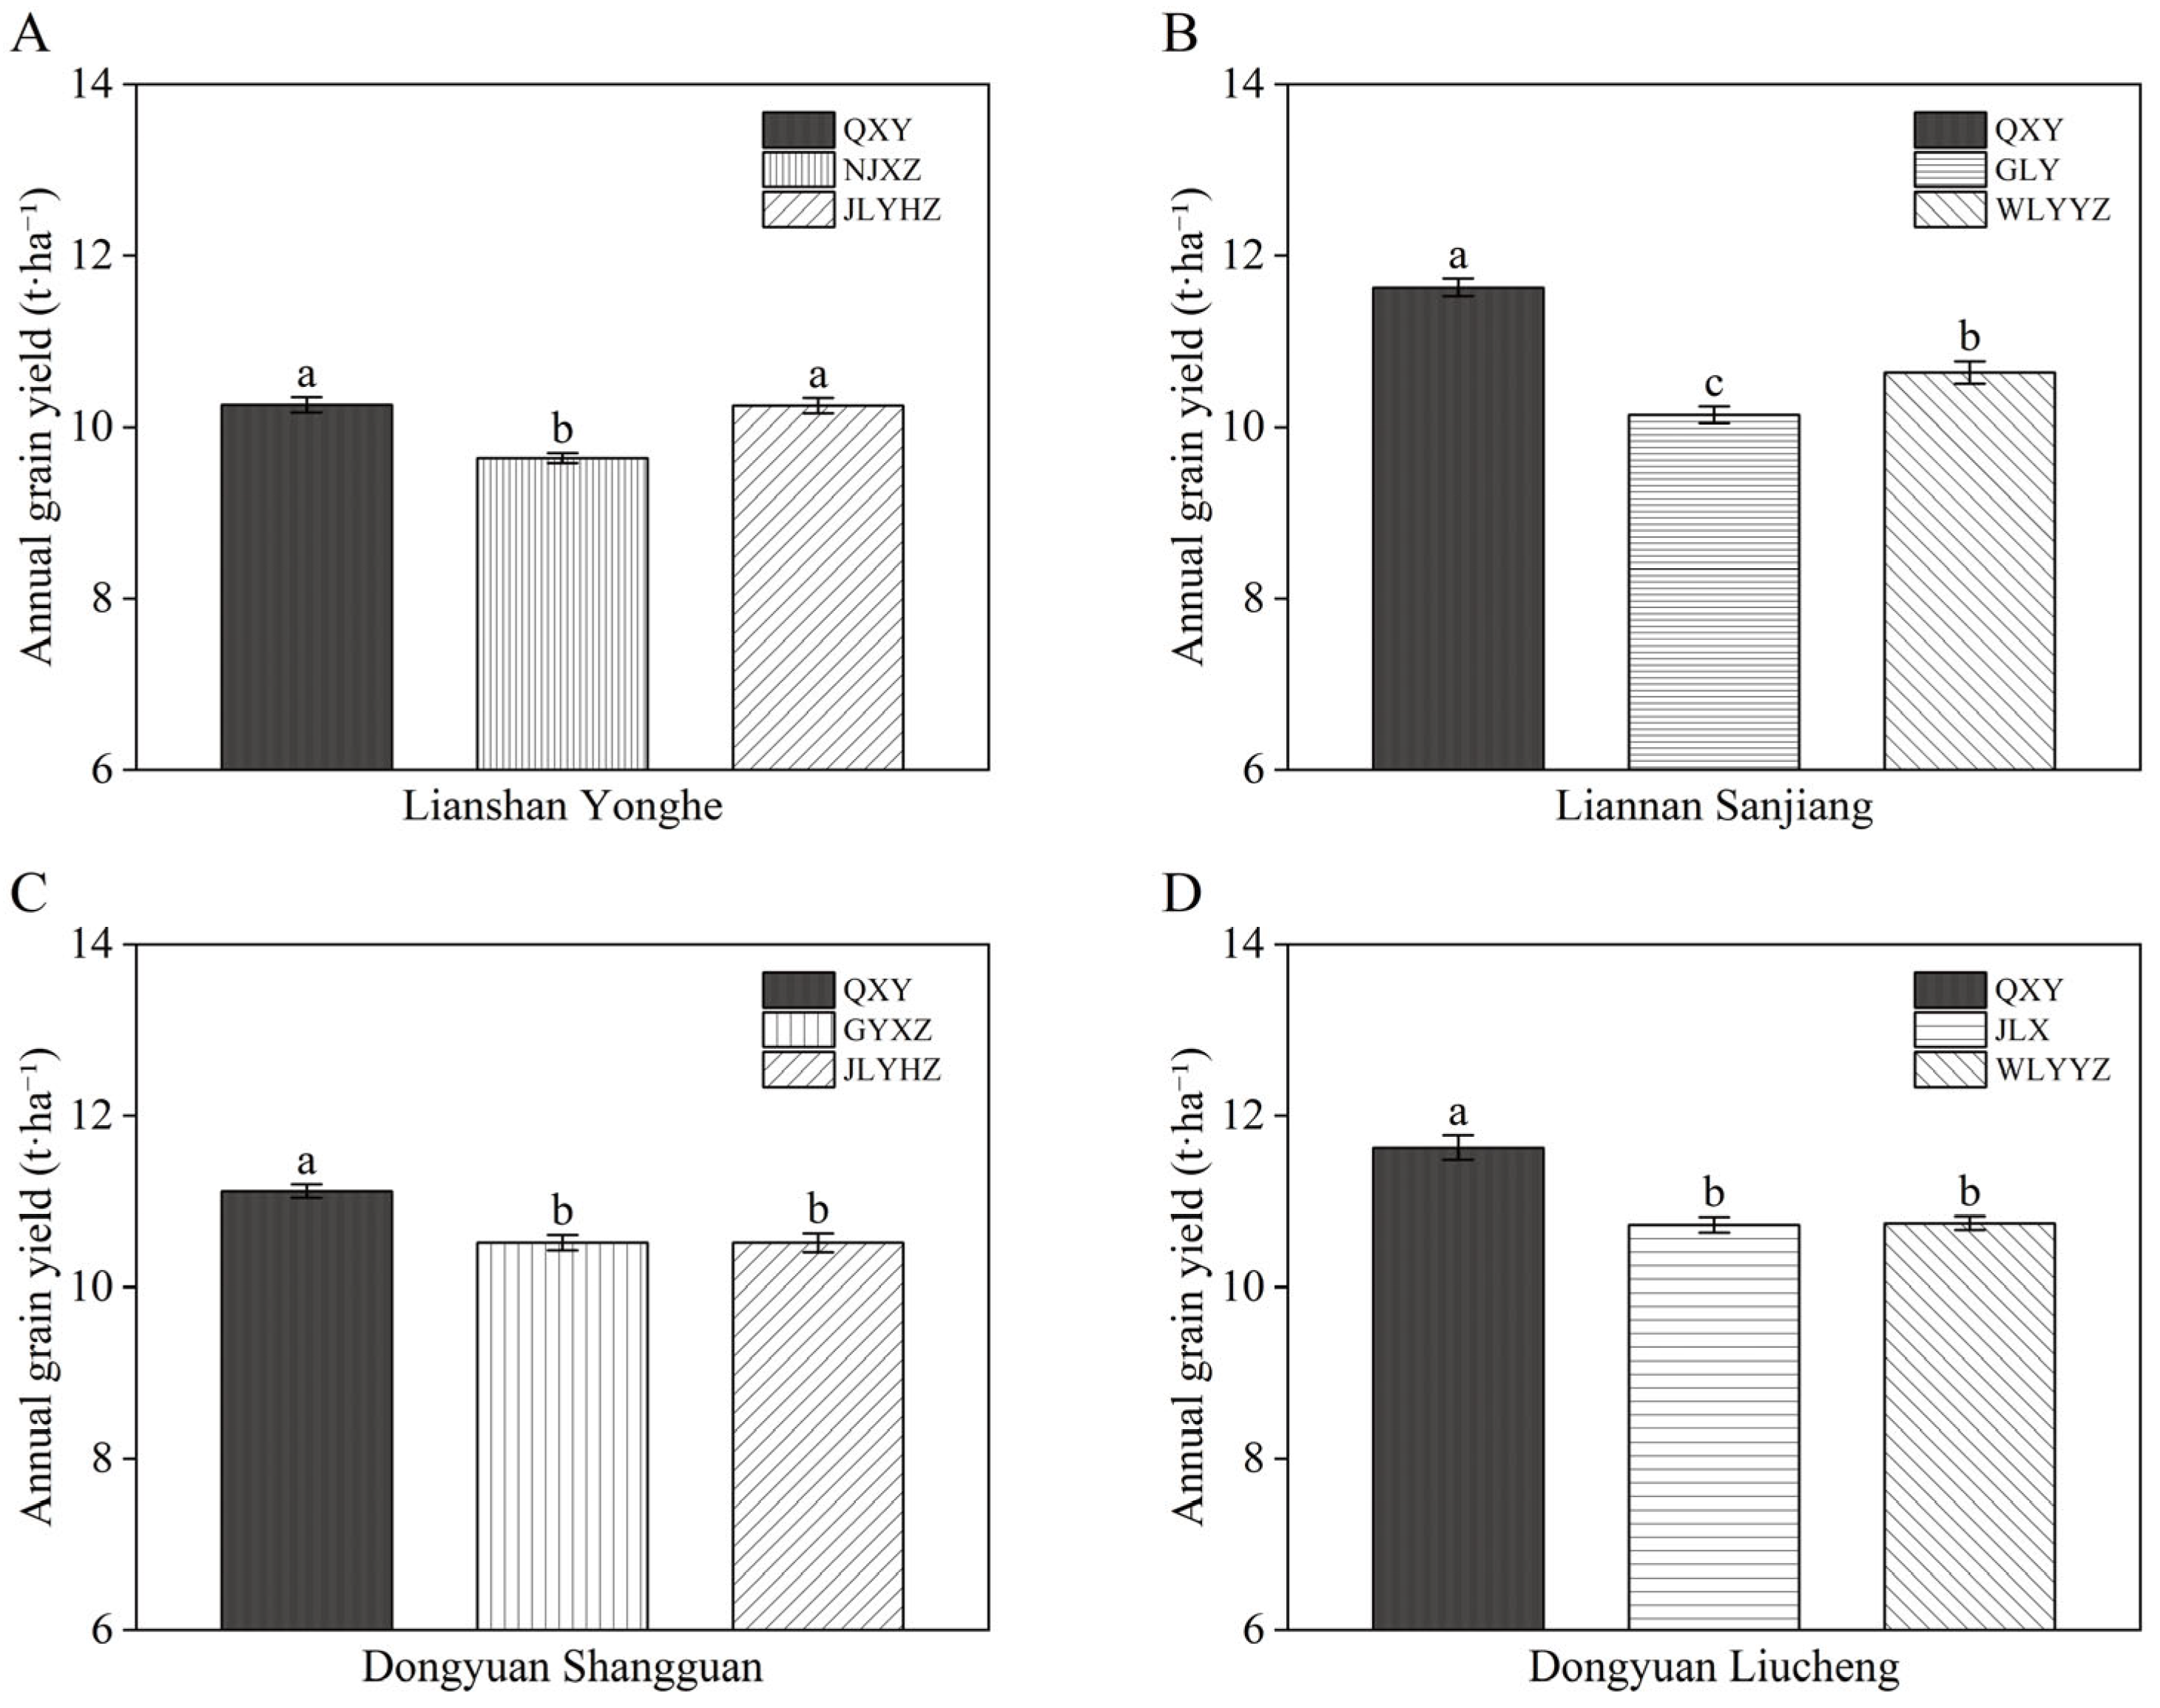
Figure 2 showed that there were significant differences in annual grain yield among varieties within each ecological site. At Yonghe Town, Lianshan County, the annual grain yield of JLYHZ was comparable to that of QXY, but both were significantly higher than that of NJXZ (Figure 2A). At Sanjiang Town, Liannan County, the annual grain yield of QXY was 14.7% higher than that of GLY and 9.3% higher than that of WLYYZ, respectively (Figure 2B). At Shangguan and Liucheng Town, Dongyuan County, the yield of QXY was higher than that of the two other varieties in Liucheng and Shangguan Town, Dongyuan County (Figure 2D).

3.2. Rice Quality at Different Ecological Sites

3.2.1. Rice Quality of the Main Crop at Different Ecological Sites

As depicted in Table 3, JLYHZ exhibited better milling quality at Yonghe Town, Lianshan County, and Shangguan Town, Dongyuan County, including higher brown rice rate, milled rice rate, and head rice rate. Furthermore, JLYHZ had significantly higher protein content and lower amylose content than the other varieties, which was favorable for maintaining better eating quality and conferring nutritional advantages. GLY showed significantly higher brown rice rate, milled rice rate, and head rice rate than QXY and WLYYZ at Sanjiang Town, Liannan County. Its chalky grain rate and chalkiness degree were significantly lower than those of the other two varieties. However, JLX had the better milling quality at Liucheng Town, Dongyuan County. It also exhibited the lowest chalky grain rate and chalkiness degree. In addition, JLX had significantly higher protein content and significantly lower amylose content than the other varieties.

3.2.2. Rice Quality of the Ratoon Crop at Different Ecological Sites

As displayed in Table 4, similar trends in rice quality parameters were observed in the ratoon crop across the four ecological sites, consistent with those recorded in the main crop. JLYHZ showed higher brown rice rate, milled rice rate, and head rice rate than the other varieties and lower chalky grain rate and chalkiness degree than the other varieties, at Yonghe Town, Lianshan County and Shangguan Town, Dongguan County.
However, GLY showed better milling qualities and appearance qualities in Sanjiang Town, Liannan County. Overall, the patterns of rice quality in the ratoon crop were generally consistent with those observed in the main crop, demonstrating stable quality advantages of the identified varieties across seasons.

3.3. Leaf Area Index at Different Ecological Sites

3.3.1. Leaf Area Index of the Main Crop at Different Ecological Sites

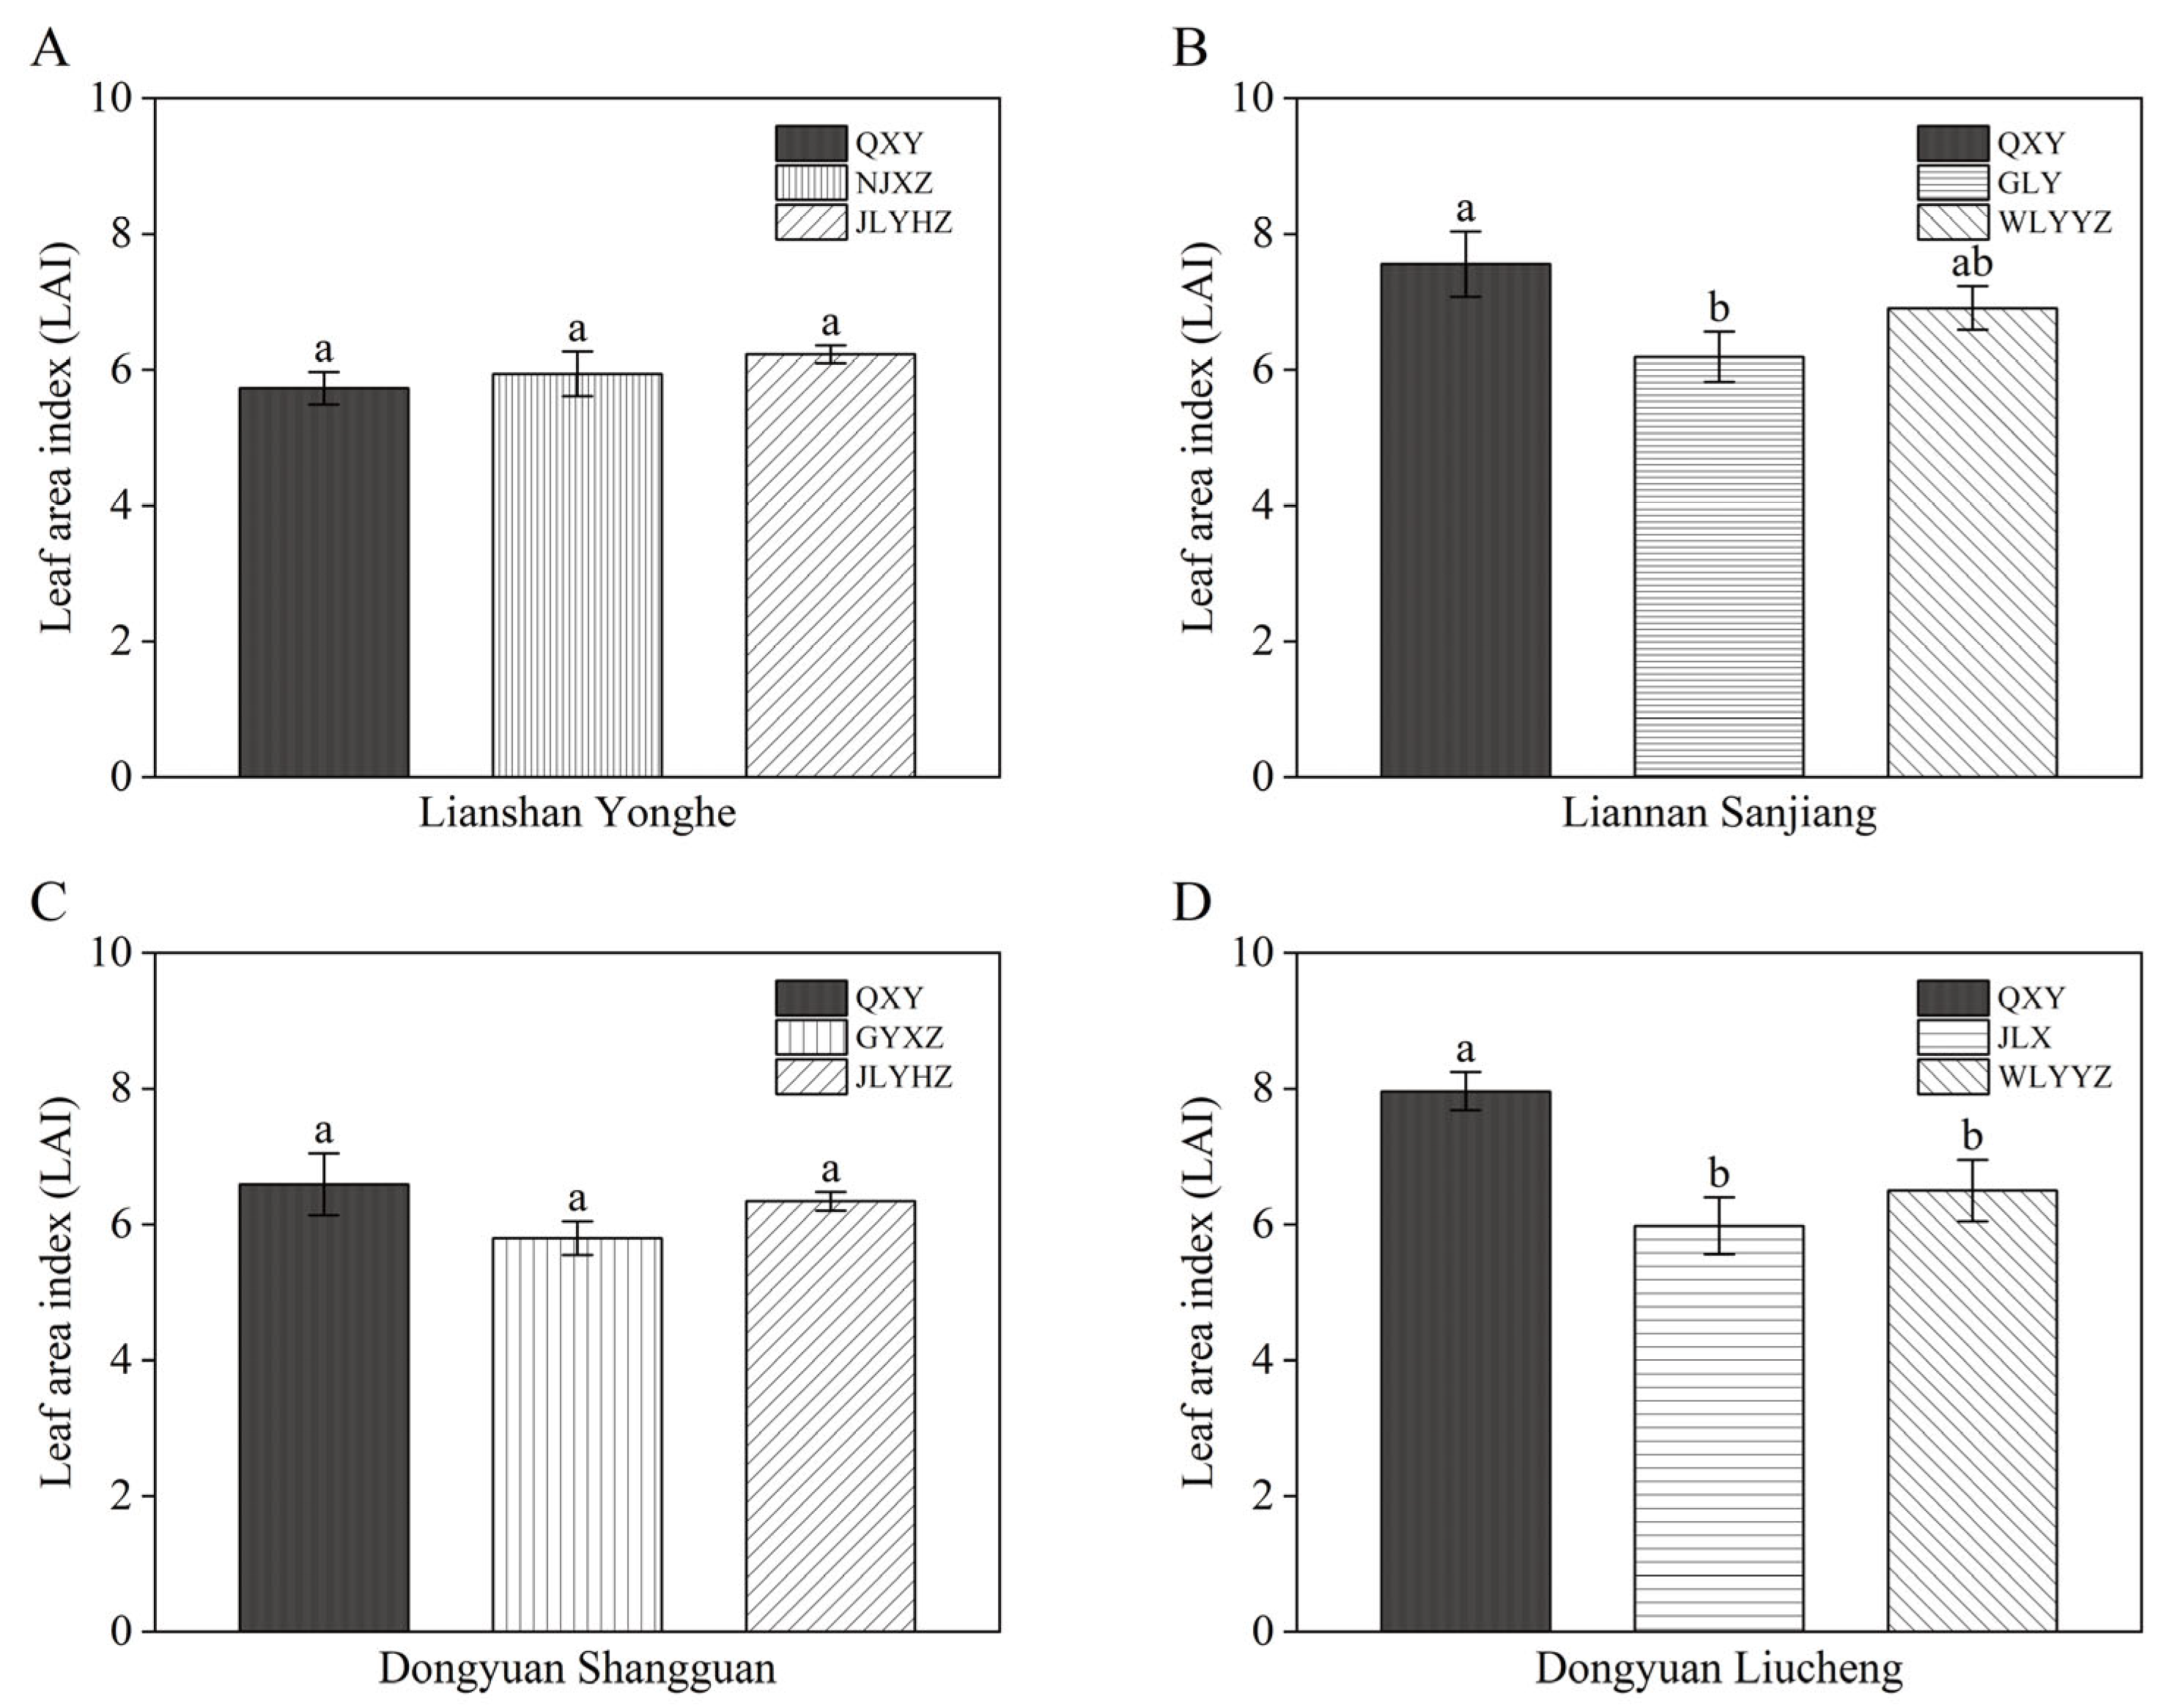
Figure 3B,D showed that QXY had a significantly higher LAI in both Liannan and Dongguan (Liucheng) County. The largest LAI was found in QXY, which was significantly higher than GLY, in Sanjiang Town, Liannan County. In Liucheng Town, Dongguan County, the LAI of QXY was significantly higher than JLX and WLYYZ.

3.3.2. Leaf Area Index of the Ratoon Crop at Different Ecological Sites

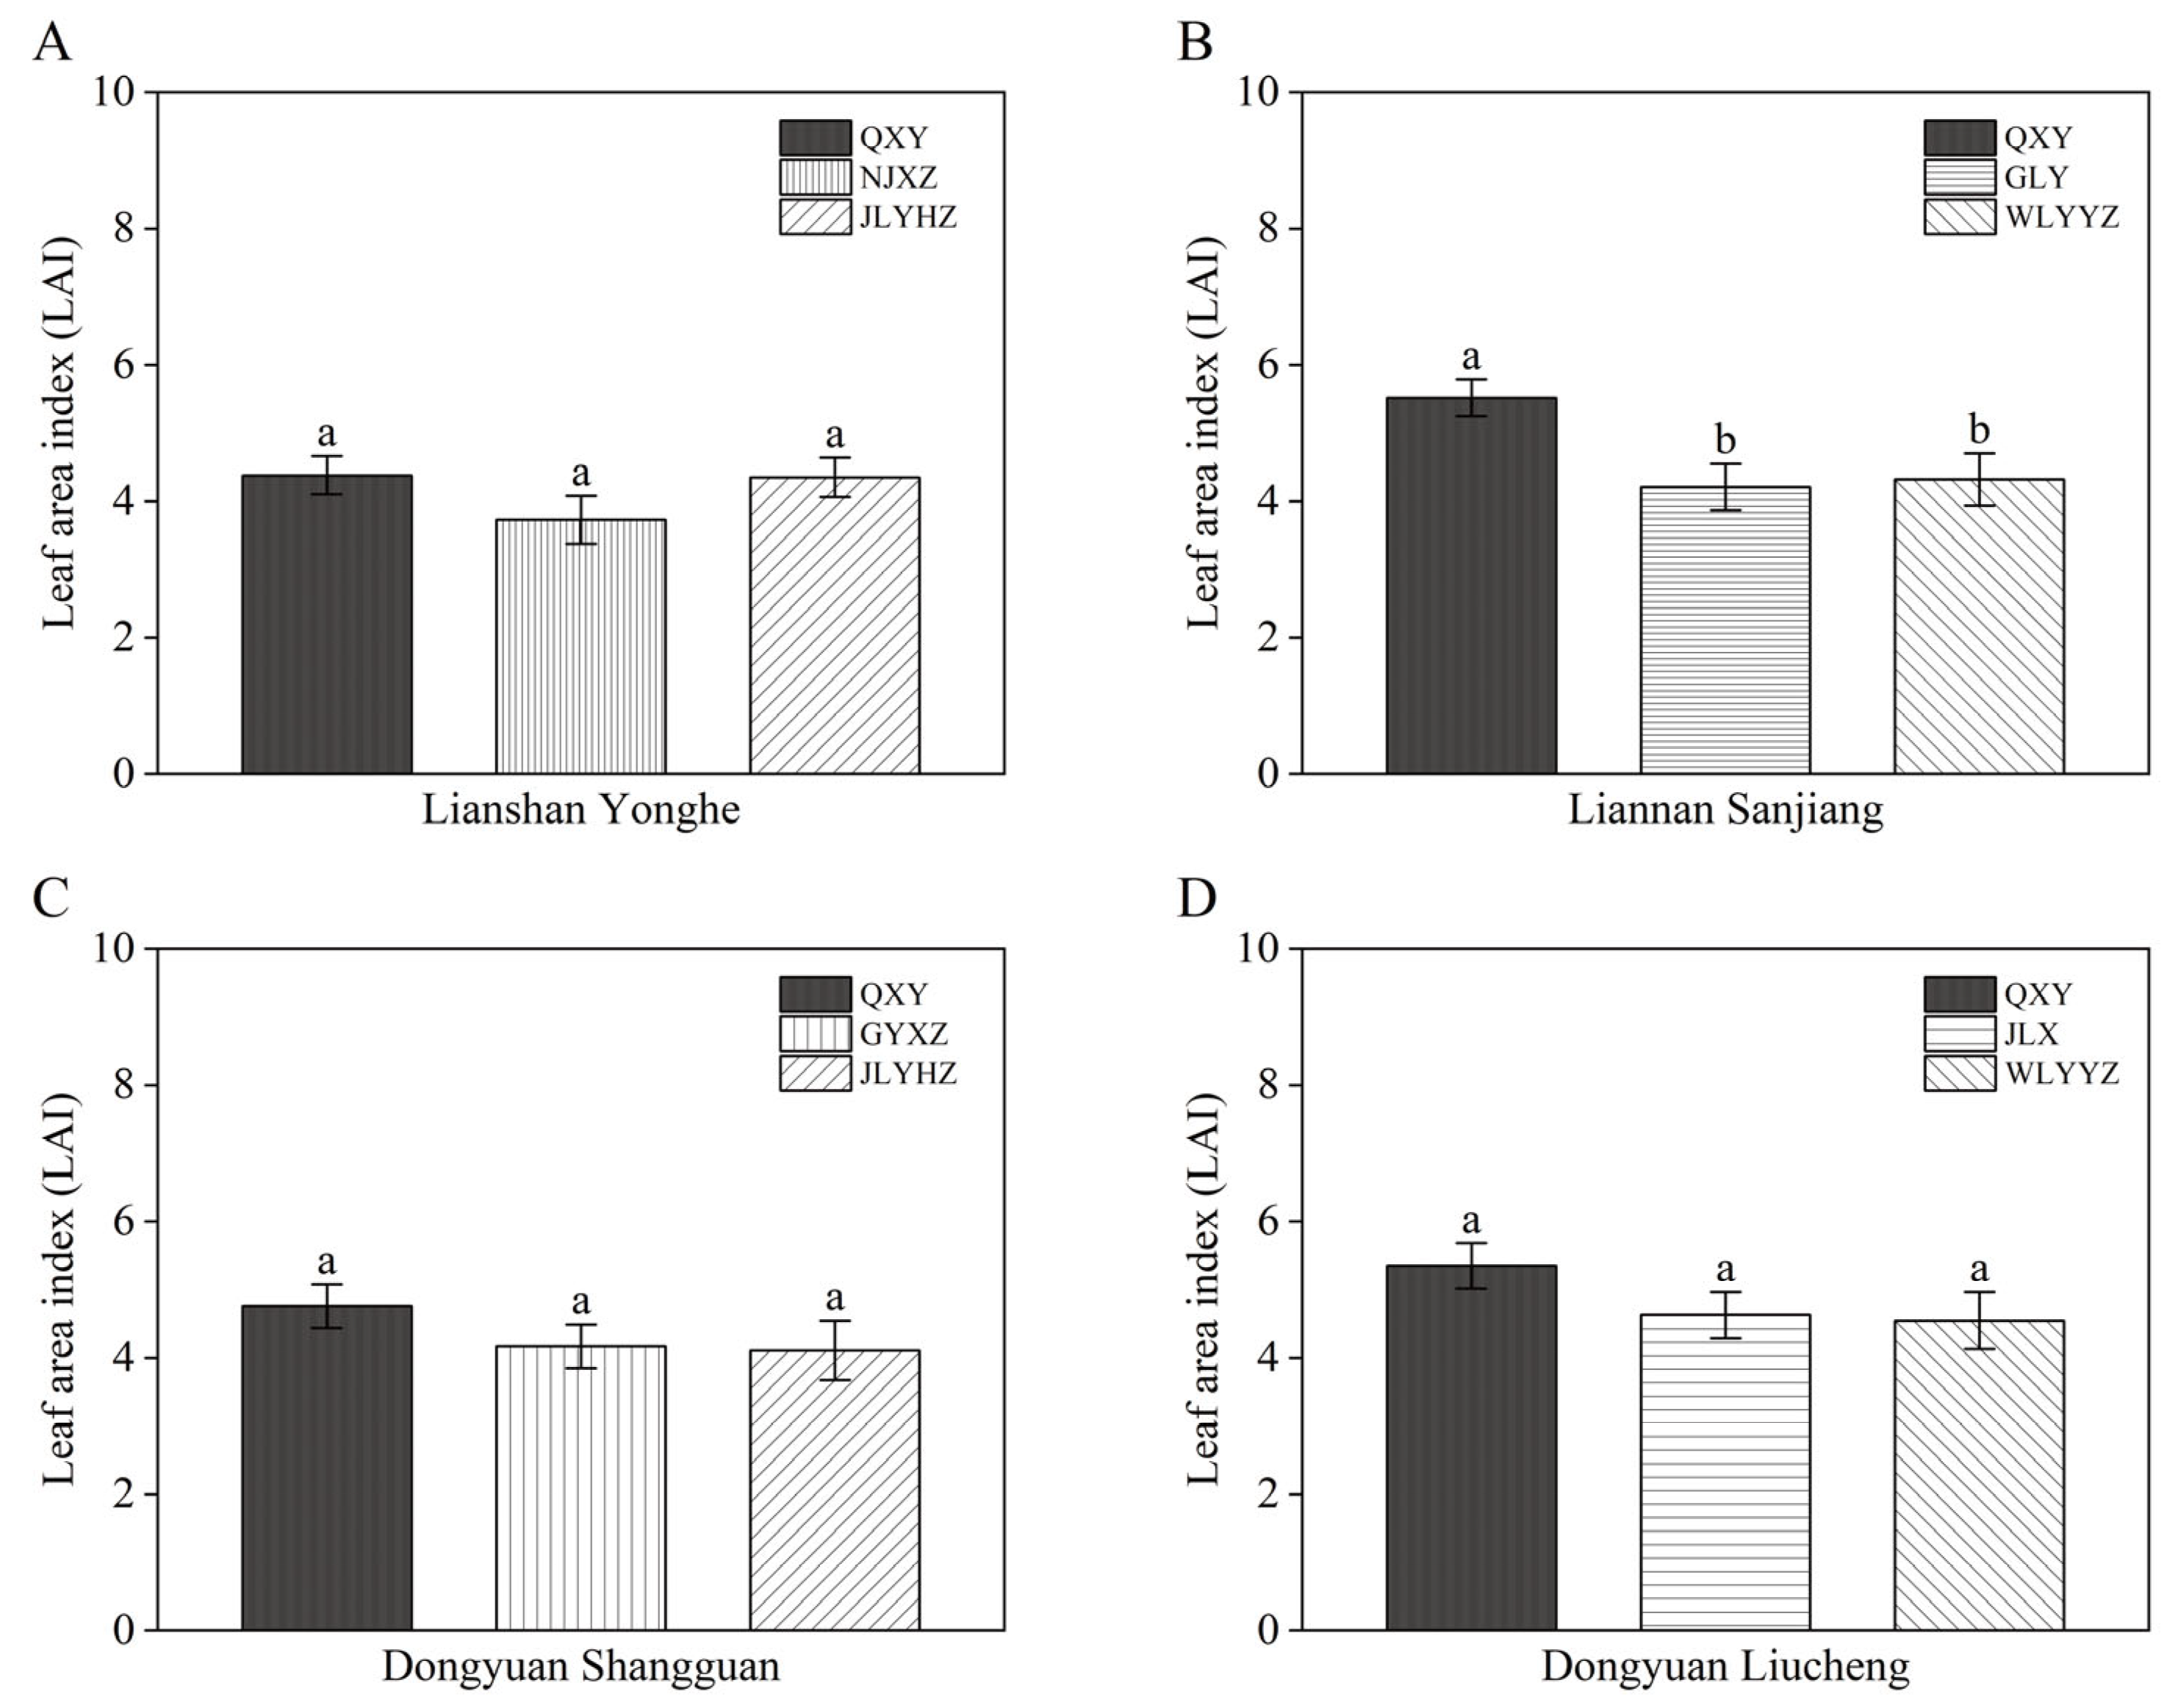
As shown in Figure 4, at the heading stage of the ratoon crop, no significant differences in leaf area index (LAI) were observed among varieties at Yonghe Town in Lianshan County, Shangguan Town in Dongyuan County, or Liucheng Town in Dongyuan County. However, QXY consistently exhibited a higher LAI than the other varieties at these three sites. At Sanjiang Town in Liannan County, QXY had a significantly higher LAI than GLY and WLYYZ, indicating that it maintained a relatively high photosynthetic leaf area during the ratoon season (Figure 4C).

3.4. Total Aboveground Biomass at Different Ecological Sites

3.4.1. Total Aboveground Biomass of the Main Crop at Different Ecological Sites

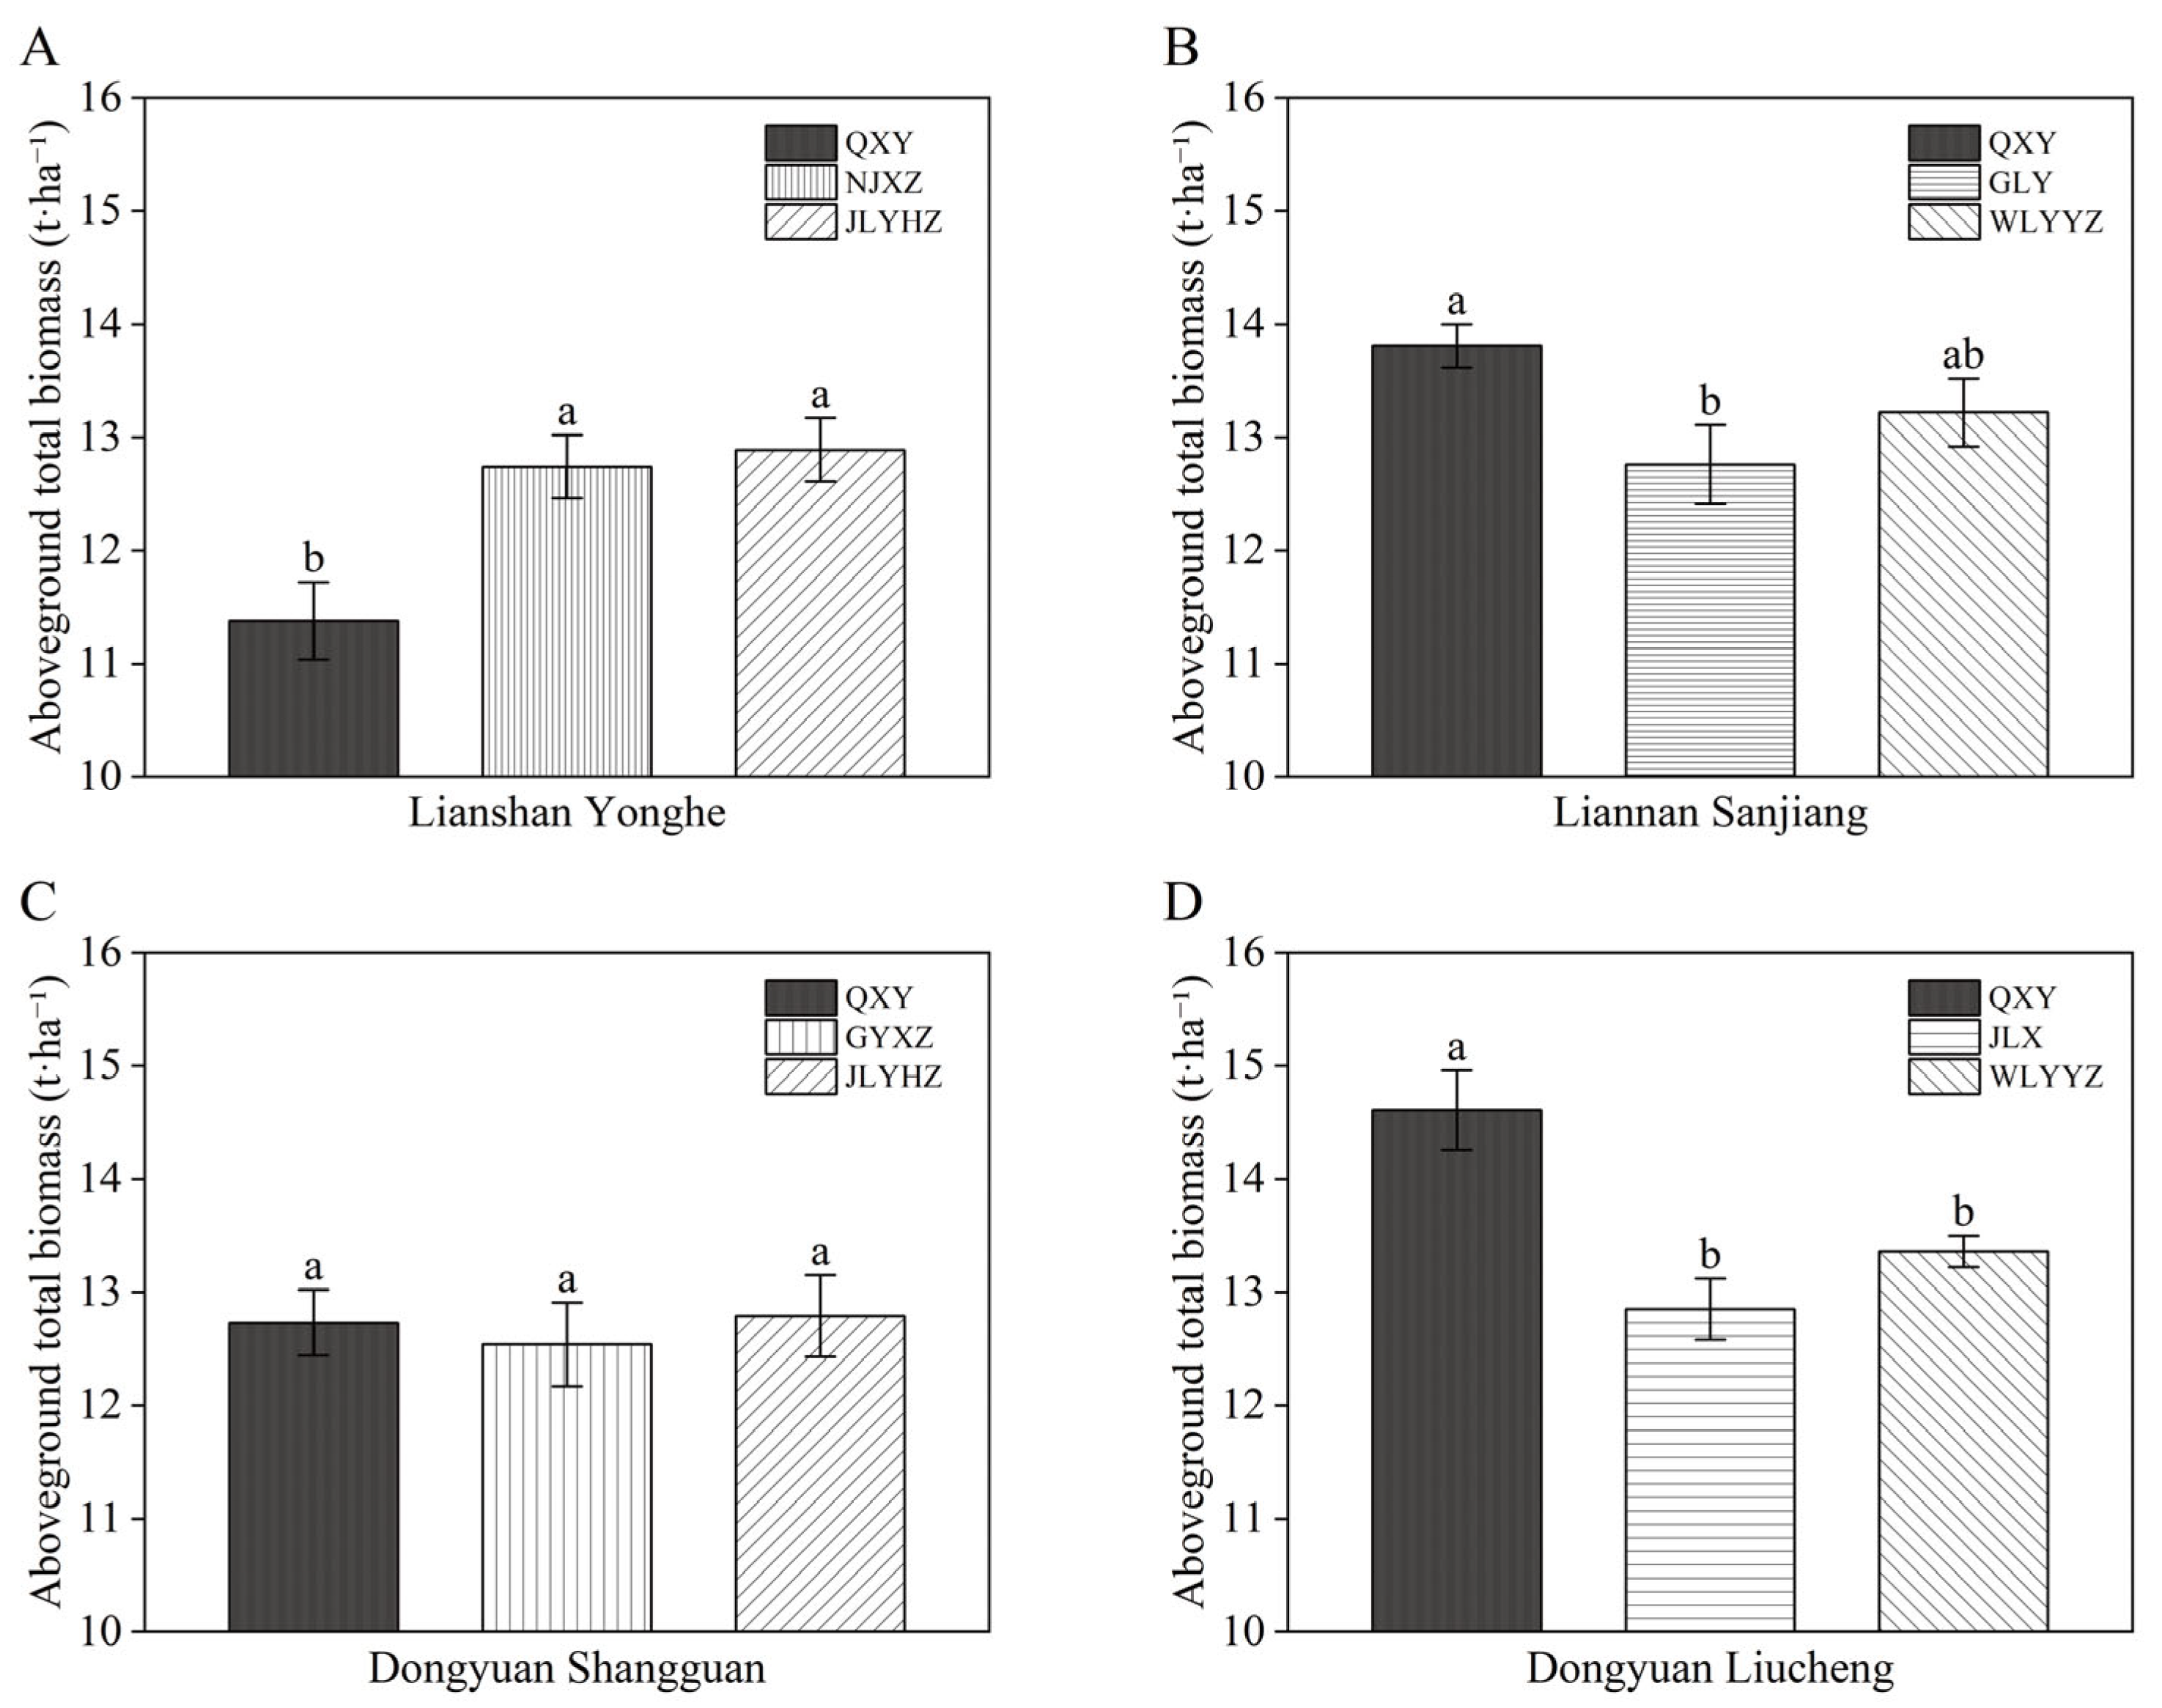
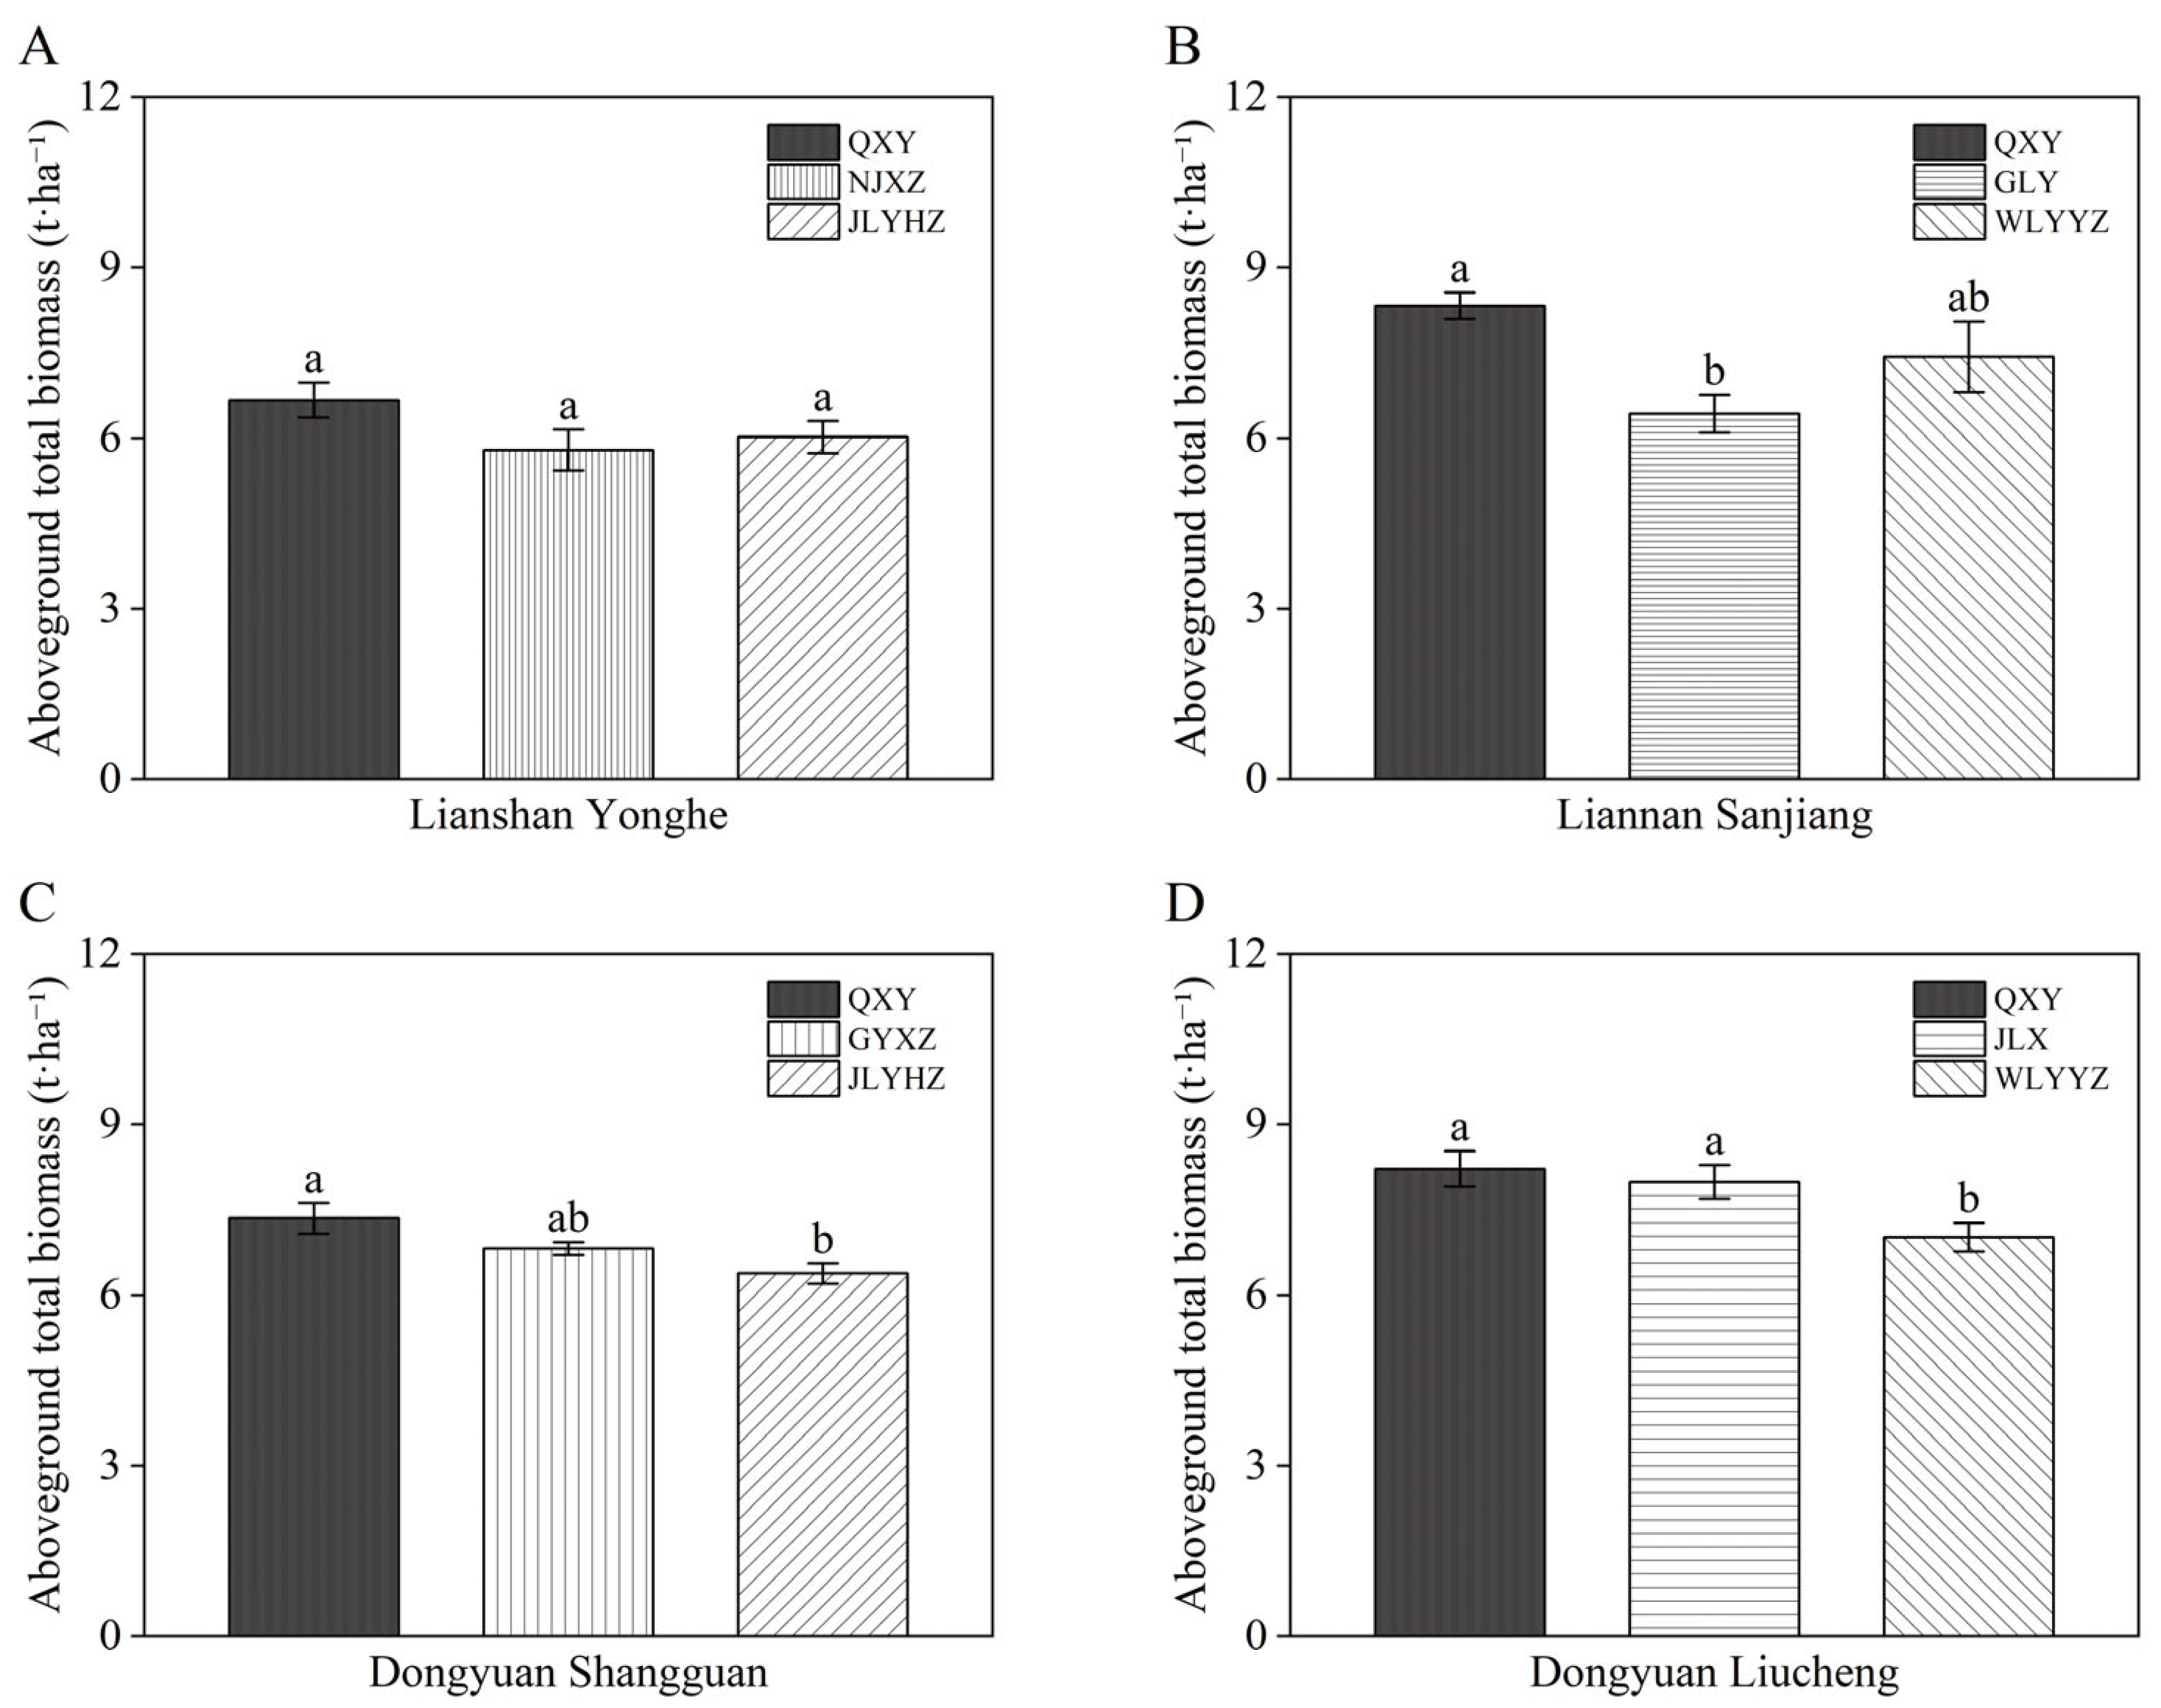
As shown in Figure 5, significant differences in total aboveground biomass at maturity of the main crop were observed among varieties across the ecological sites. At Yonghe Town, Lianshan County, QXY produced significantly lower total aboveground biomass than the other two varieties, while NJXZ and JLYHZ did not differ significantly from each other (Figure 5A). At Sanjiang Town, Liannan County, QXY exhibited the highest total aboveground biomass, which was significantly higher than that of GLY by 8.2%, but was comparable to that of WLYYZ (Figure 5B). At Shangguan Town, Dongyuan County, no significant differences in total aboveground biomass were observed among the three varieties (Figure 5C). At Liucheng Town, Dongyuan County, QXY achieved the highest total aboveground biomass, which was significantly higher than those of JLX and WLYYZ by 13.7% and 9.4%, respectively (Figure 5D).

3.4.2. Total Aboveground Biomass of the Ratoon Crop at Different Ecological Sites

As shown in Figure 6, significant differences in total aboveground biomass at maturity of the ratoon crop were observed among varieties at some ecological sites. At Yonghe Town, Lianshan County, no significant differences were detected among the three varieties (Figure 6A); therefore, the numerical differences at this site were not interpreted as a cultivar advantage. At Sanjiang Town, Liannan County, QXY had the highest total aboveground biomass, which was significantly higher than that of GLY but comparable to that of WLYYZ (Figure 6B). At Shangguan Town, Dongyuan County, the total aboveground biomass of the three varieties followed the order of QXY > GYXZ > JLYHZ (Figure 6C). At Liucheng Town, Dongyuan County, QXY exhibited comparable total aboveground biomass to JLX but significantly higher biomass than WLYYZ (Figure 6D).

3.5. Chlorophyll Content at Different Ecological Sites

3.5.1. Chlorophyll Content of the Main Crop at Different Ecological Sites

As shown in Table 5, chlorophyll responses differed among varieties and ecological sites in the main crop. At Yonghe Town, Lianshan County, no significant differences were observed among varieties in chlorophyll a content; however, significant differences were detected in chlorophyll b, carotenoid, and total chlorophyll contents, with significant advantages associated with NJXZ or JLYHZ rather than QXY. At Sanjiang Town, Liannan County, QXY exhibited significantly higher total chlorophyll content than GLY and WLYYZ, with increases of 28.6% and 20.5%, respectively; its chlorophyll a, chlorophyll b, and carotenoid contents were also significantly higher than those of the other two varieties. At Shangguan Town, Dongyuan County, significant differences among varieties were observed in all chlorophyll parameters. QXY had significantly higher total chlorophyll content than JLYHZ and GYXZ, with increases of 11.3% and 51.3%, respectively, while GYXZ recorded the lowest values for all chlorophyll parameters. At Liucheng Town, Dongyuan County, QXY achieved the highest total chlorophyll content, which was significantly higher than those of JLX and WLYYZ, with increases of 41.1% and 9.4%, respectively; its chlorophyll a, chlorophyll b, and carotenoid contents were also the highest among the three varieties.

3.5.2. Chlorophyll Content of the Ratoon Crop at Different Ecological Sites

Table 6 shows that chlorophyll content parameters at the ratoon stage differed among varieties across the ecological sites. Overall, QXY generally showed higher chlorophyll content in the ratoon crop, especially at Sanjiang Town, Shangguan Town, and Liucheng Town, although the magnitude and significance of the differences varied by site and pigment parameter. At Yonghe Town, Lianshan County, QXY had the highest total chlorophyll content, followed by JLYHZ and NJXZ. These results suggest that the chlorophyll advantage of QXY was more consistent in the ratoon crop than in the main crop, but the site-specific pattern in Lianshan County should still be interpreted cautiously.

3.6. Nitrogen Metabolism Enzyme Activities at Different Ecological Sites

3.6.1. Nitrogen Metabolism Enzyme Activities of the Main Crop at Different Ecological Sites

Table 7 displayed that no significant differences were observed among varieties in NR and GOGAT activities, at Yonghe Town, Lianshan County, while JLYHZ and NJXZ exhibited comparable GS activity, both significantly higher than that of QXY. At Sanjiang Town, Liannan County, QXY consistently showed higher NR, GS, and GOGAT activities than the other varieties. At Shangguan Town, Dongyuan County, QXY had the highest NR activity, which was significantly higher than those of GYXZ and JLYHZ. The differences in GS activity were even more pronounced, with QXY exceeding GYXZ by 84.8% and JLYHZ by 33.4%. The GOGAT activity was also highest in QXY. At Liucheng Town, Dongyuan County, the NR activity of QXY was comparable to that of WLYYZ, but both were higher than that of JLX by 33.3% and 19.6%, respectively. The GS activity was highest in QXY, exceeding JLX and WLYYZ by 24.8% and 12.6%, respectively. Similarly, the GOGAT activity was also highest in QXY.

3.6.2. Nitrogen Metabolism Enzyme Activities of the Ratoon Crop at Different Ecological Sites

As shown in Table 8, nitrogen metabolism enzyme activities in the ratoon crop followed broadly similar patterns to those observed in the main crop, but with site-specific variation in the magnitude and significance of varietal differences. QXY generally showed relatively high NR, GS, and GOGAT activities across the four ecological sites, supporting its stronger nitrogen assimilation capacity under the tested conditions.

3.7. Correlation Analysis

3.7.1. Correlation Analysis of Various Traits

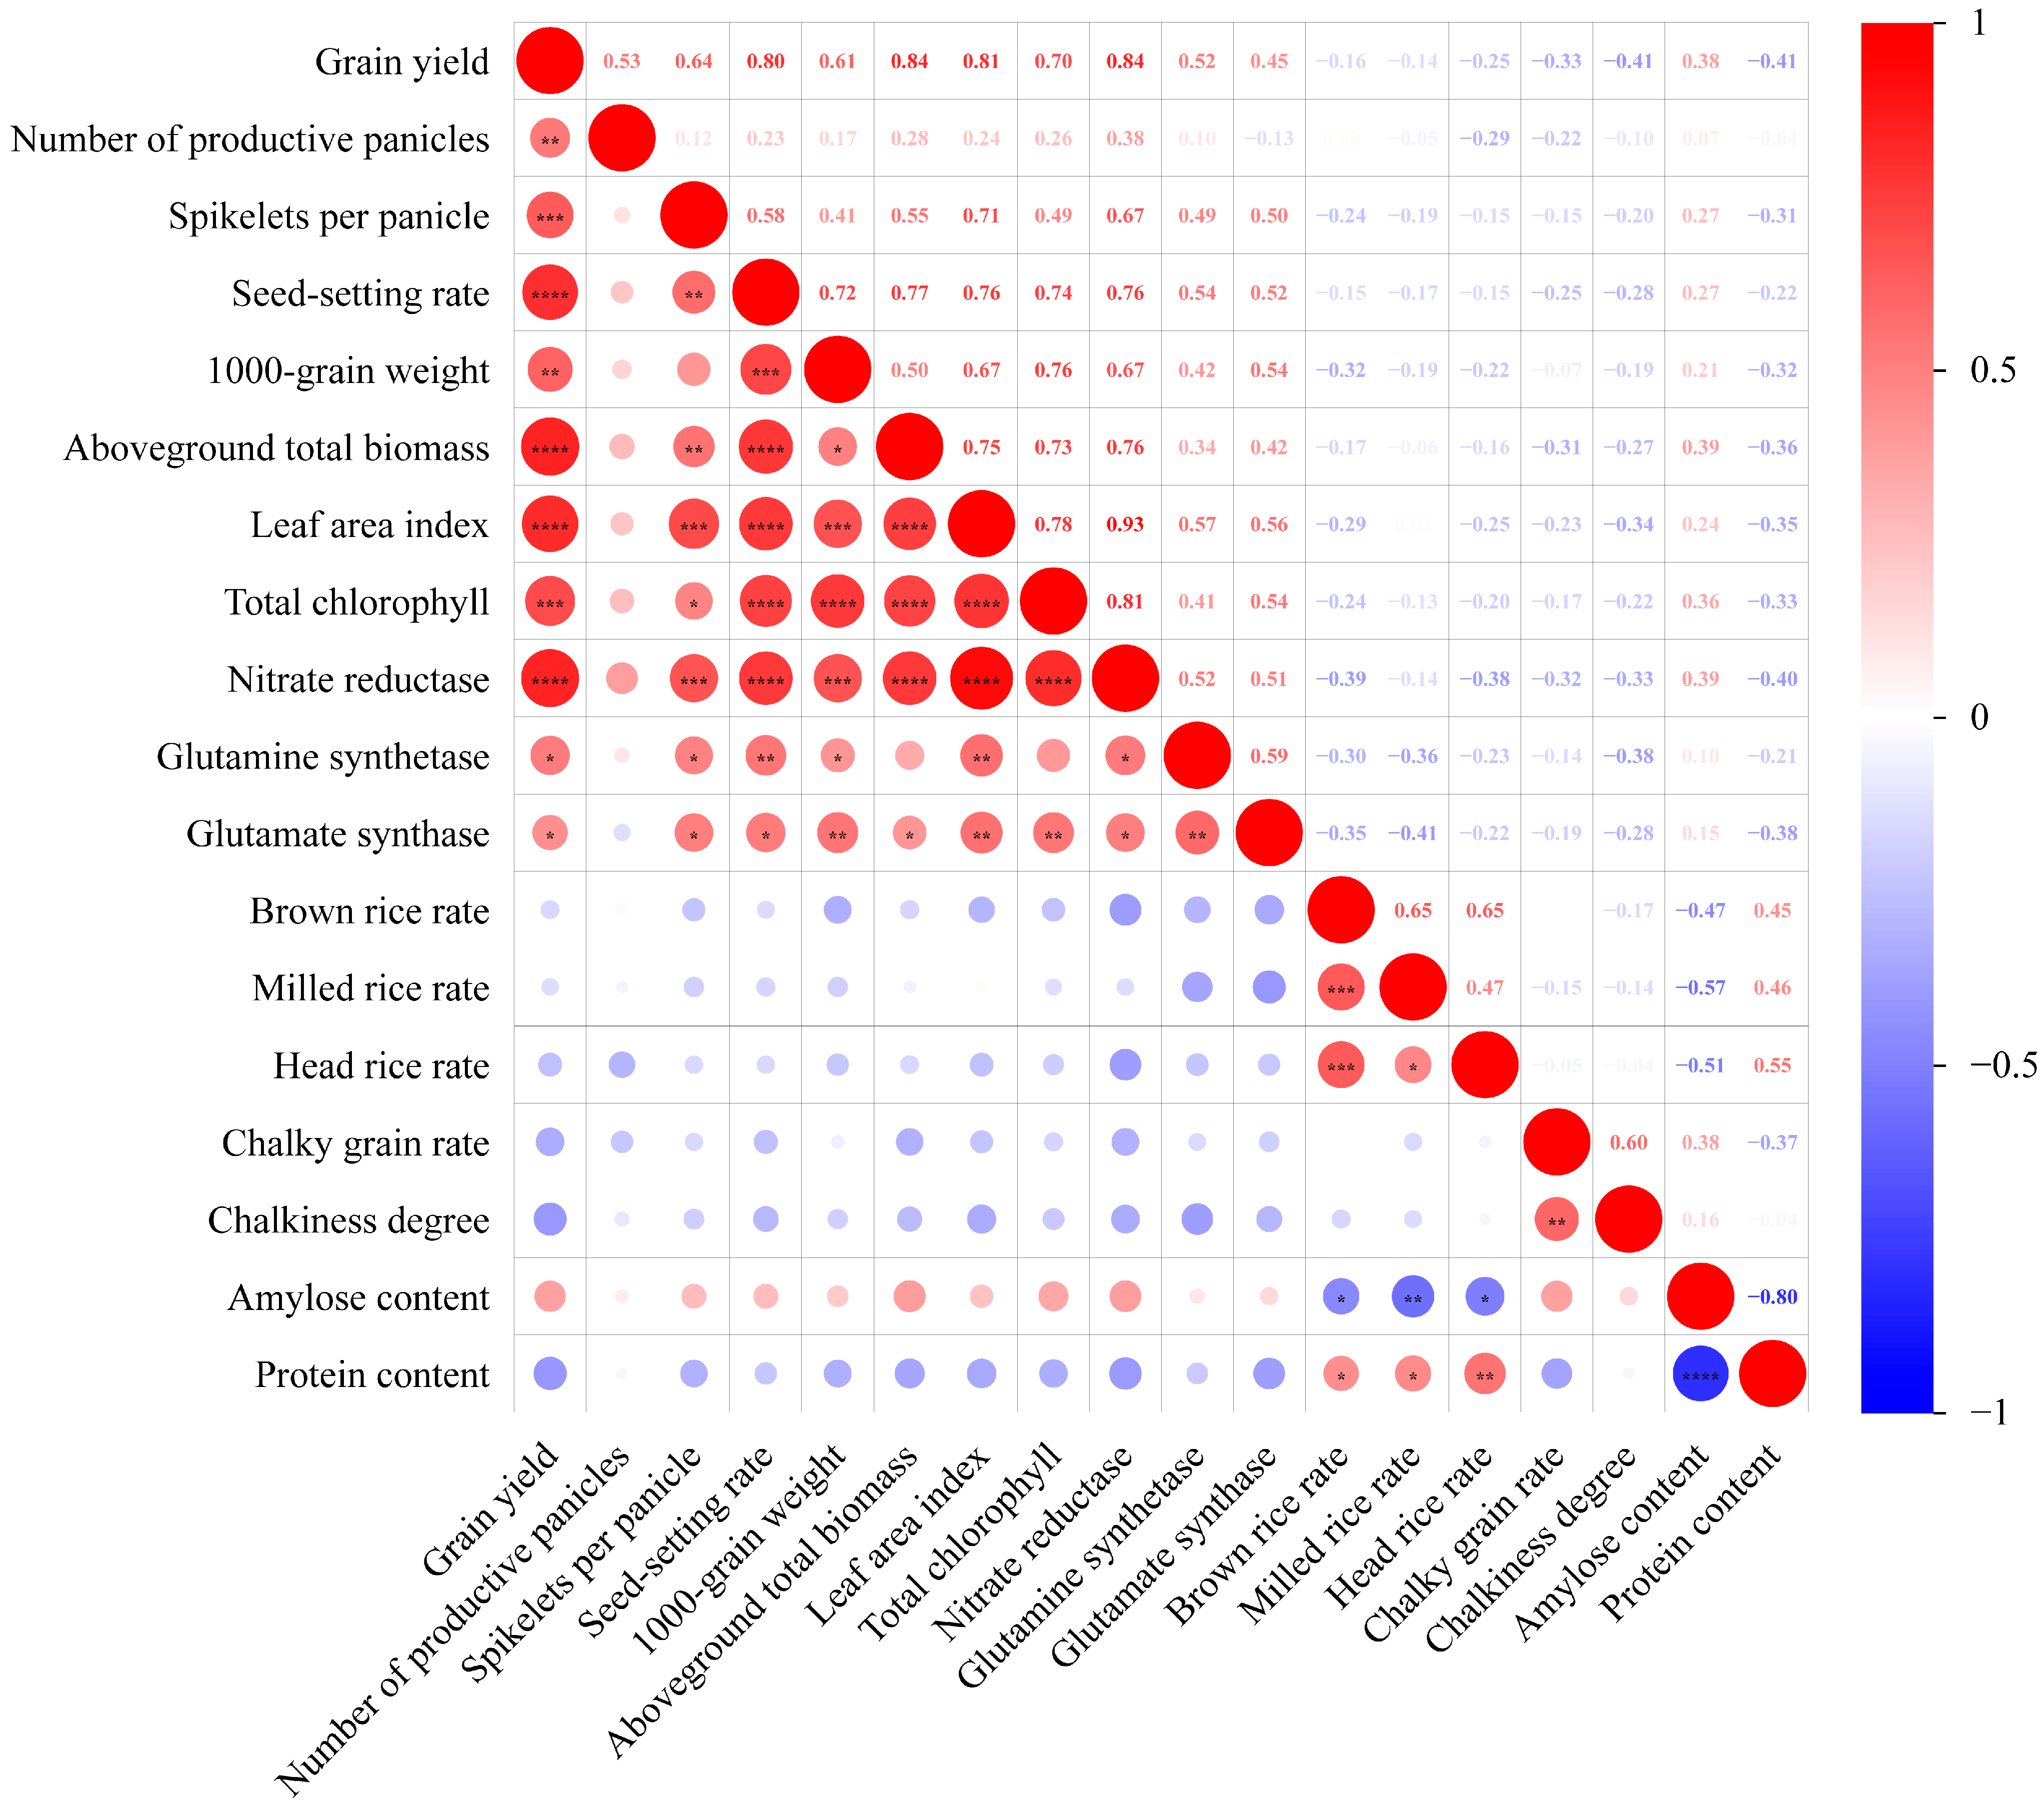
Based on the correlation heatmap analysis (Figure 7), grain yield was significantly and positively correlated with number of productive panicles, spikelets per panicle, seed-setting rate, 1000-grain weight, aboveground total biomass, leaf area index, total chlorophyll content, nitrate reductase (NR), glutamine synthetase (GS), and glutamate synthase (GOGAT), indicating that the increase in grain yield was primarily attributable to the improvement of sink capacity, dry matter accumulation, photosynthetic capacity, and nitrogen metabolism. For yield components, the number of productive panicles was positively correlated with spikelets per panicle and seed-setting rate. Spikelets per panicle were strongly positively correlated with seed-setting rate. Seed-setting rate showed strong positive correlations with 1000-grain weight and aboveground biomass. For physiological traits, leaf area index and total chlorophyll content were positively correlated with each other, and were also significantly and positively correlated with aboveground biomass, indicating that canopy development and photosynthetic capacity jointly contributed to dry matter accumulation. Nitrate reductase (NR), glutamine synthetase (GS), and glutamate synthase (GOGAT) activities were significantly and positively correlated with each other, and were also significantly and positively correlated with grain yield, leaf area index, total chlorophyll content, and aboveground total biomass, suggesting that nitrogen metabolism enzyme activities were closely associated with photosynthetic capacity and dry matter accumulation. For grain quality traits, grain yield was negatively correlated with chalkiness degree and protein content, but positively correlated with amylose content. Brown rice rate, milled rice rate, and head rice rate were significantly and positively correlated with each other. Chalky grain rate was significantly and positively correlated with chalkiness degree, while both traits were significantly and negatively correlated with milling quality traits. Amylose content was significantly and negatively correlated with brown rice rate, milled rice rate, head rice rate, and protein content, but significantly and positively correlated with chalky grain rate and chalkiness degree.

3.7.2. Correlation Analysis of Yield with Meteorological Factors

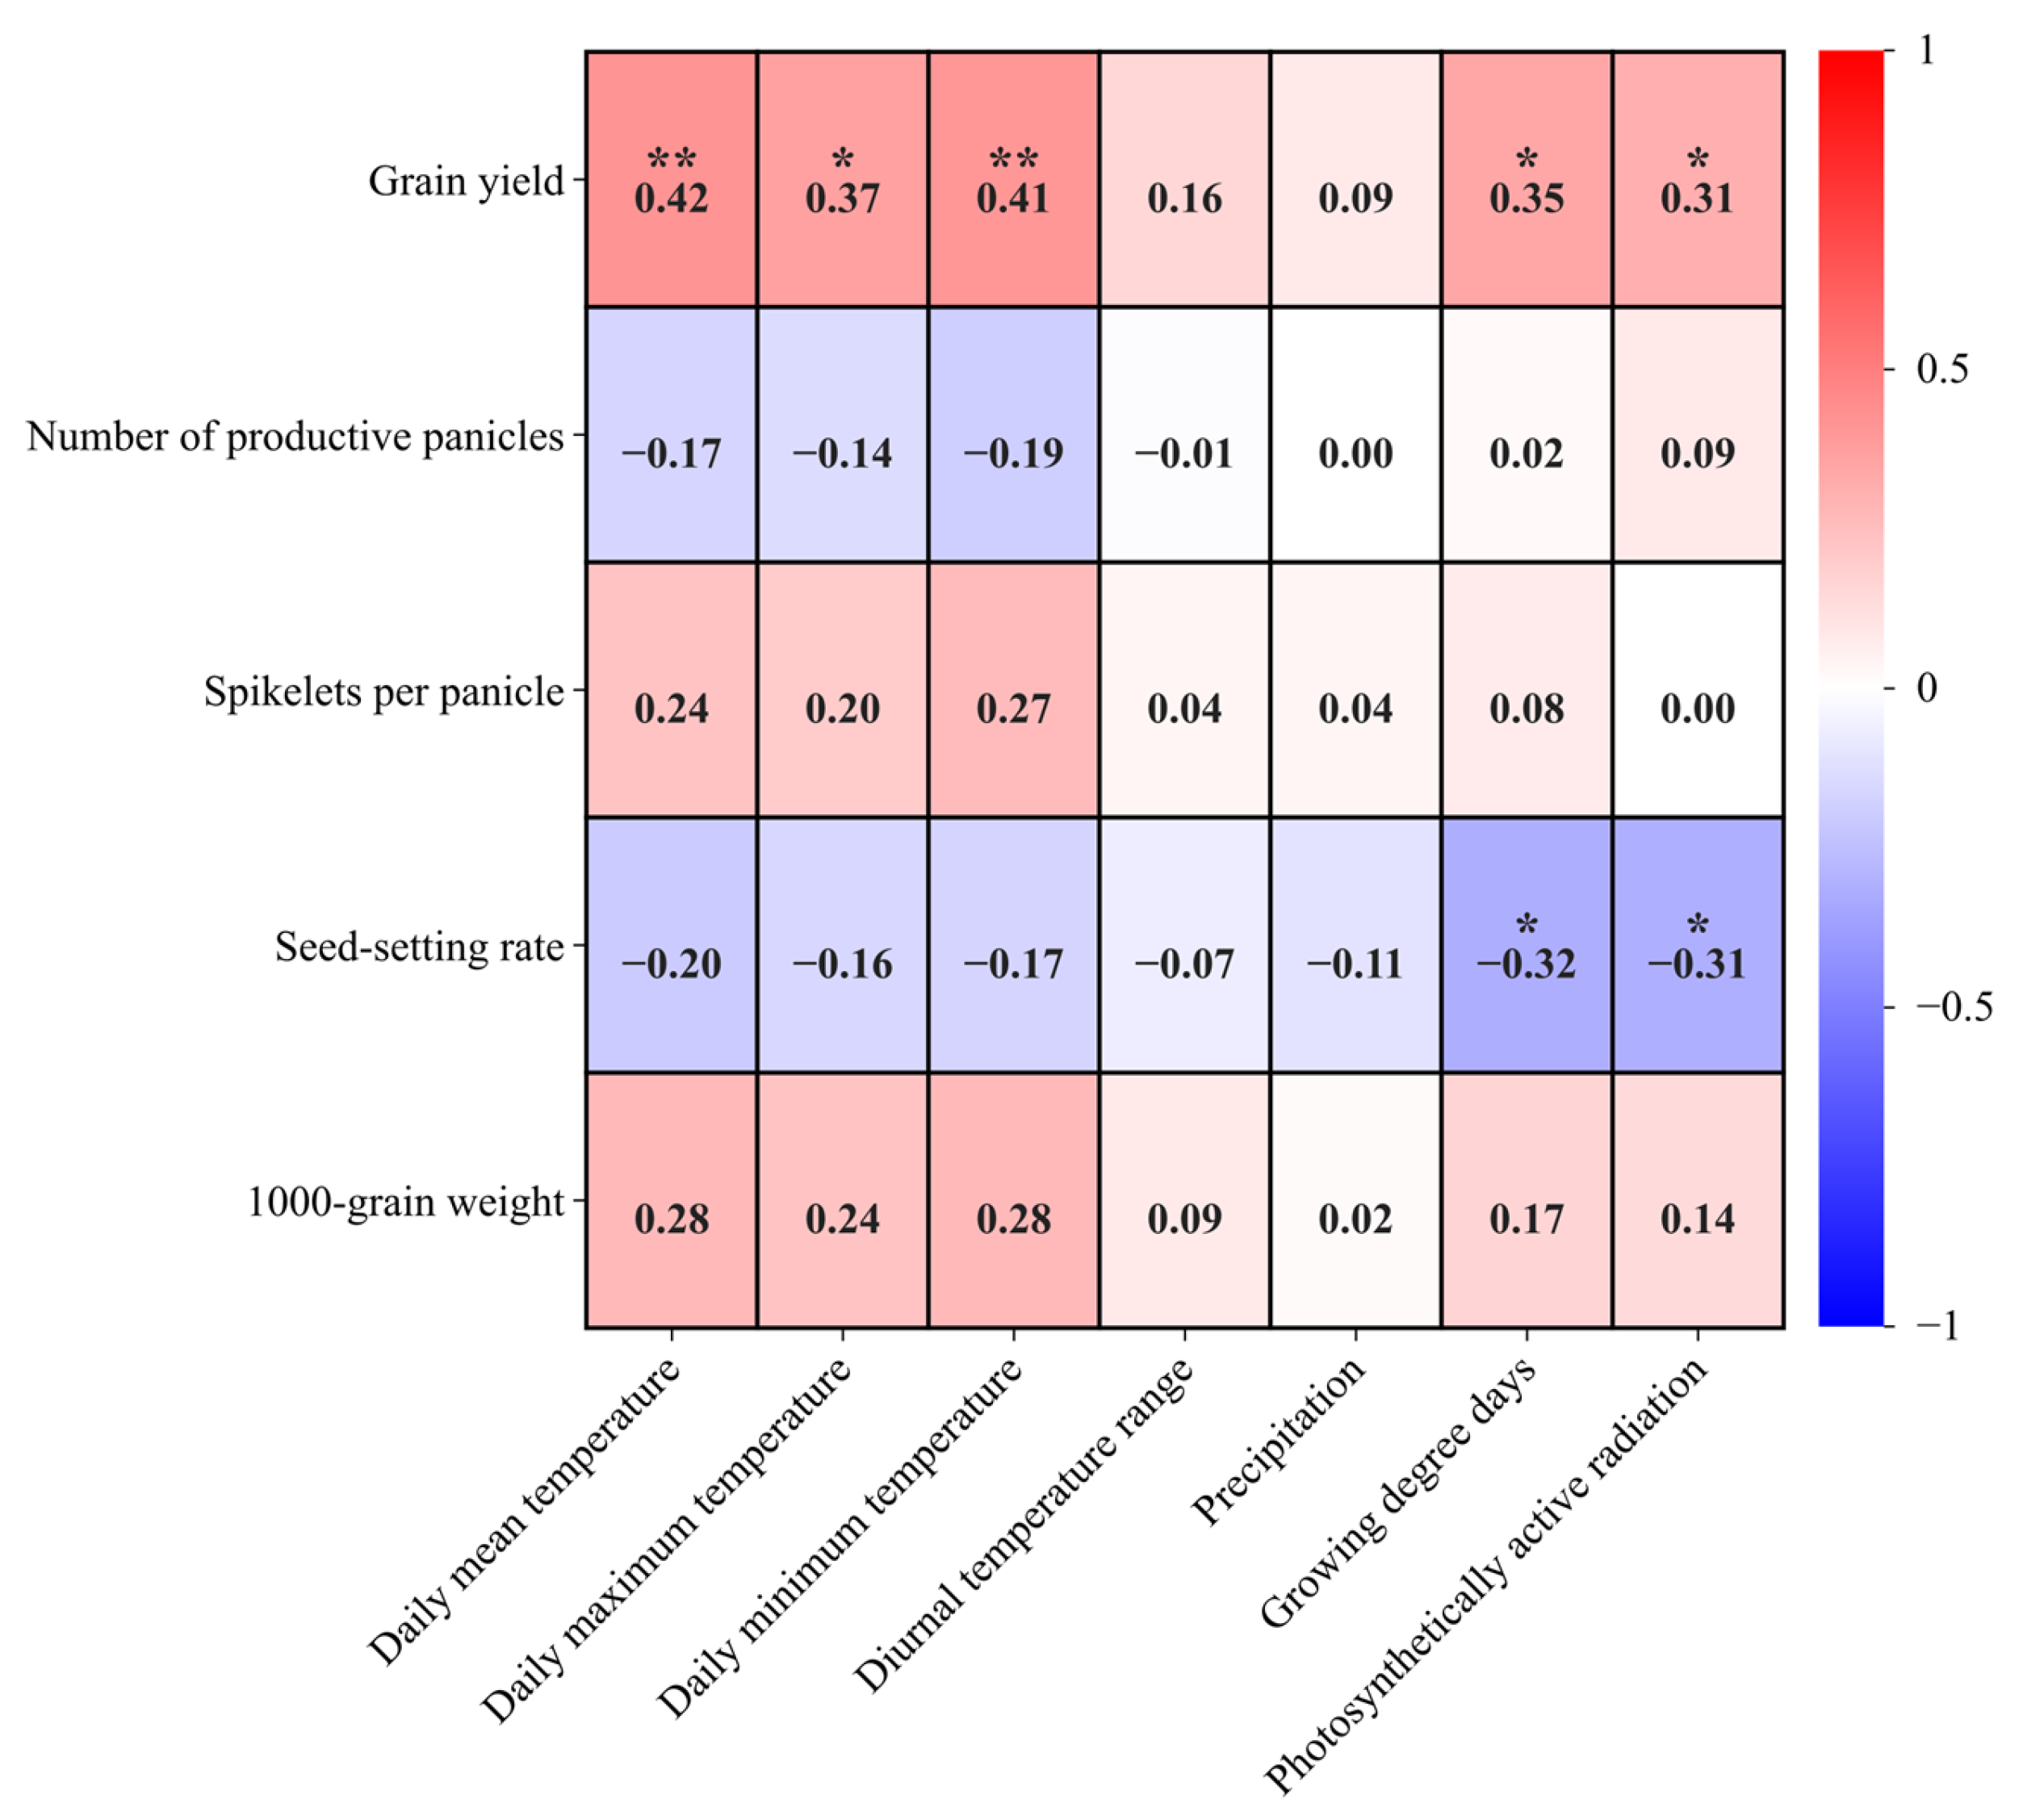
As shown in Figure 8, grain yield exhibited significant positive correlations with daily mean temperature (r = 0.42, p < 0.01), daily maximum temperature (r = 0.37, p < 0.05), daily minimum temperature (r = 0.41, p < 0.01), growing degree days (r = 0.35, p < 0.05), and photosynthetically active radiation (r = 0.31, p < 0.05).
Among the yield components, the seed-setting rate was negatively associated with daily mean temperature, daily maximum temperature, and daily minimum temperature. Moreover, the seed-setting rate showed significant negative correlations with growing degree days (r = −0.32, p < 0.05) and photosynthetically active radiation (r = −0.31, p < 0.05), indicating that higher heat accumulation and radiation during grain filling significantly reduced seed setting. In contrast, 1000-grain weight was positively correlated with daily mean temperature, daily maximum temperature, and daily minimum temperature, suggesting that warmer conditions during grain filling promoted grain filling and increased grain weight.

4. Discussion

4.1. Yield Performance of Rice—Ratoon Rice Cropping System at Different Ecological Sites

The ratoon rice cropping system is characterized by its short growth duration, reduced production costs, labor savings, and efficient use of water and nutrients [22,23]. With the increasing adoption of mechanical harvesting, coupled with the growing shortage of rural labor and the substantial rise in labor costs [24], mechanically harvested ratoon rice has increasingly become a major trend in the future development of rice production [25]. In this study, the agronomic performance of different ratoon rice varieties was evaluated across various ecological sites in northern Guangdong. The results demonstrated that QXY achieved the highest annual grain yield at all four ecological sites, primarily due to its significantly higher ratoon-crop yield compared with the other varieties. Further analysis of yield components revealed that the superior ratoon-crop yield of QXY was mainly attributed to its higher number of spikelets per panicle. This finding was supported by the correlation analysis, which showed a significant positive correlation between spikelets per panicle and grain yield. Spikelets per panicle is a key agronomic trait determining rice productivity [26], and its value is influenced by panicle differentiation capacity, nutritional status, and environmental conditions during the growth period [27,28]. The results of this study indicated that QXY exhibited stronger panicle differentiation ability during the ratoon season than the other varieties in northern Guangdong, which is the fundamental reason for its high annual grain yield. Previous studies have also shown that QXY, a newly developed fragrant indica rice variety, is characterized by well-developed root systems, strong tillering ability, vigorous growth, uniform panicle emergence, high seed-setting rate, broad adaptability, and strong stress tolerance, all of which contribute to its high yield and high efficiency [29,30].
However, the superior performance of QXY was not uniform across all traits or sites. At Yonghe Town, Lianshan County, QXY produced significantly lower aboveground biomass in the main crop than NJXZ and JLYHZ, which we attribute primarily to its significantly lower number of productive panicles. Lianshan County had the lowest temperatures among the four sites throughout the growing season. As a temperature-sensitive variety, QXY likely experienced inhibited tillering and panicle initiation under the relatively cool conditions during the tillering and panicle differentiation stages, resulting in reduced panicle number and aboveground biomass accumulation [31,32]. In contrast, NJXZ and JLYHZ may possess greater low-temperature tolerance or tillering capacity, enabling them to maintain higher panicle numbers and biomass under the same conditions. By contrast, at the other three sites (Liannan, Shangguan, and Liucheng), where temperatures were higher and more favorable for the expression of its temperature-sensitive characteristics, QXY performed well. Our results further showed that grain yield was significantly and positively correlated with daily mean temperature and growing degree days during grain filling, indicating that higher temperatures and greater heat accumulation promoted yield formation [33]. However, seed-setting rate was negatively correlated with growing degree days and photosynthetically active radiation, suggesting that excessive heat and radiation during grain filling can reduce seed setting, which is consistent with previous findings that high temperature during grain filling significantly reduces seed-setting rate and grain yield [34,35]. These opposing patterns indicate the existence of an optimal temperature window for yield formation—temperatures that are too low may suppress tillering and panicle formation, while temperatures that are too high may reduce seed-setting rate. Previous studies have established that the optimum temperature for grain filling in indica hybrid rice ranges from 24.2 to 26.5 °C [36], and that suitable temperatures during early grain filling are conducive to starch accumulation, while temperatures outside this range are detrimental to yield formation [37]. The contrasting performance of QXY across sites underscores the importance of matching variety characteristics with local thermal conditions in ratoon rice production.
The physiological and biochemical measurements in this study further indicated that the yield performance of different rice varieties under the ratoon rice system across various ecological sites in northern Guangdong was primarily attributable to differences in nitrogen metabolism and photosynthetic capacity. Photosynthesis serves as the physiological basis of grain yield formation [38], determining the production and accumulation of yield-related assimilates, and is jointly influenced by chlorophyll content and leaf area index [39]. In the present study, with the exception of the main crop at Yonghe Town, Lianshan County, QXY consistently exhibited the highest chlorophyll content and leaf area index among all varieties across both the main and ratoon crops at the different ecological sites, indicating that its high yield performance was associated with its superior photosynthetic capacity. Correlation analysis further revealed that leaf area index and total chlorophyll content were significantly and positively correlated with aboveground biomass, indicating that enhanced canopy development and photosynthetic capacity promoted dry matter accumulation. Furthermore, chlorophyll synthesis and leaf development in rice are closely linked to nitrogen metabolism [40]. This was corroborated by the correlation analysis in the present study, which revealed significant positive correlations among nitrate reductase, glutamine synthetase, and glutamate synthase activities with leaf area index and total chlorophyll content. The results of this study further revealed that, with the exception of the main crop at Yonghe Town, Lianshan County, the activities of key nitrogen metabolism enzymes (NR, GS, and GOGAT) in both the main and ratoon crops were consistently highest in QXY across the different ecological sites in northern Guangdong. This indicates that QXY possesses stronger nitrogen metabolic capacity than the other varieties, which in turn promotes chlorophyll biosynthesis and leaf development, ultimately leading to greater productivity. These findings are generally consistent with those reported by Deng et al. [41].

4.2. Quality Performance of Rice—Ratoon Rice Cropping System at Different Ecological Sites

In recent years, with socioeconomic development, consumer demand for better eating quality, nutritional value, and processing quality of rice has been steadily increasing [42,43]. The results of this study revealed significant differences in grain quality traits among rice varieties across the different ecological sites in northern Guangdong. At Yonghe Town, Lianshan County, and Shangguan Town, Dongyuan County, JLYHZ exhibited the best grain quality, primarily due to its highest head rice rate and protein content, along with the lowest chalkiness degree and amylose content in both the main and ratoon crops. At Sanjiang Town, Liannan County, GLY demonstrated the best grain quality, mainly because its head rice rate was significantly higher than those of the other varieties, while its chalky grain rate and chalkiness degree were significantly lower in both seasons. At Liucheng Town, Dongyuan County, JLX showed the best grain quality, attributed to its highest head rice rate and protein content, and the lowest chalky grain rate, chalkiness degree, and amylose content in both the main and ratoon crops. These findings show that the highest-yielding variety was not necessarily the best-quality variety.
The results of this study also revealed that, under the ratoon rice system in northern Guangdong, grain quality varied significantly across ecological sites, and the most suitable varieties for producing high-quality rice differed by location. Therefore, variety selection should consider both yield and quality objectives. QXY may be prioritized when annual grain yield is the main target, whereas JLYHZ, GLY, and JLX may be more suitable at specific sites when grain quality is prioritized. Because the experiment was conducted in a single year, these recommendations should be regarded as preliminary and site-specific. Further multi-year field validation is required to confirm varietal adaptation before broad regional promotion.

5. Conclusions

The results of this study demonstrated that QXY could be recommended for ratoon rice production in northern Guangdong (Qingyuan and Heyuan cities) based on its superior grain yield performance. From the perspective of grain quality, JLYHZ is recommended for Yonghe Town in Lianshan County and Shangguan Town in Dongyuan County, GLY for Sanjiang Town in Liannan County, and JLX for Liucheng Town in Dongyuan County. These findings provide a theoretical basis for the large-scale promotion of ratoon rice cultivation in northern Guangdong (Qingyuan and Heyuan cities).

Author Contributions

S.P. and Z.M. initiated and designed the research. L.X., M.J., S.Y., H.G. and Q.M. performed the experiments. L.X., M.J. and H.T. analyzed the data and wrote the manuscript. S.P., Z.M. and J.Q. revised and edited the manuscript, and also provided advice on the experiments. All authors have read and agreed to the published version of the manuscript.

Funding

This work was supported by the National Key Research and Development Program Project (Grant No. 2024YFD2300500) and the Special Project for Promoting the Coordinated Development of Urban and Rural Areas and Regions by Introducing Scientific and Technological Achievements of Guangdong Province into Counties and Towns (Grant No. 2025B0202010031).

Data Availability Statement

Data available from the authors.

Conflicts of Interest

The authors declare that they have no conflicts of interest.

References

  1. Basset, C. Soil Security: The Cornerstone of National Security in an Era of Global Disruptions. Soil Secur. 2024, 16, 100154. [Google Scholar] [CrossRef]
  2. Zhao, Y.; Li, T.; Zhao, J.; Zhang, Z.; Liu, R.; Shi, Y.; Ma, H.; Zhao, C.; Liu, Z.; Yang, X. Rice Water Requirement Exacerbates Groundwater Depletion in Northeast China under a Changing Climate. Agric. For. Meteorol. 2025, 371, 110624. [Google Scholar] [CrossRef]
  3. Xiao, Y.; Zhao, J.; Zhang, Y.; Wang, S. Grain Self-Sufficiency in Guangdong, China: Current Trends and Future Perspectives. Foods 2025, 14, 1126. [Google Scholar] [CrossRef] [PubMed]
  4. Yu, X.; Tao, X.; Liao, J.; Liu, S.; Xu, L.; Yuan, S.; Zhang, Z.; Wang, F.; Deng, N.; Huang, J.; et al. Predicting Potential Cultivation Region and Paddy Area for Ratoon Rice Production in China Using Maxent Model. Field Crops Res. 2022, 275, 108372. [Google Scholar] [CrossRef]
  5. Zhang, Z.; Li, Y.; Chen, X.; Wang, Y.; Niu, B.; Liu, D.L.; He, J.; Pulatov, B.; Hassan, I.; Meng, Q. Impact of Climate Change and Planting Date Shifts on Growth and Yields of Double Cropping Rice in Southeastern China in Future. Agric. Syst. 2023, 205, 103581. [Google Scholar] [CrossRef]
  6. Zhu, W.; Peng, X.; Ding, M.; Li, L.; Liu, Y.; Liu, W.; Yang, M.; Chen, X.; Cai, J.; Huang, H.; et al. Decline in Planting Areas of Double-Season Rice by Half in Southern China over the Last Two Decades. Remote Sens. 2024, 16, 440. [Google Scholar] [CrossRef]
  7. Tang, H.; Meng, G.; Jiang, W.; Liu, Y.; Mahmood, A.; Shah, A.N.; Nawaz, M.; Hassan, M.U.; Huang, G. Effects of Winter Cropping on Rice Yield, Economic Benefit, and Resource Utilization Efficiency on Different Cropping Systems of Paddy Field in the Middle Reaches of the Yangtze River. Int. J. Plant Prod. 2023, 17, 353–363. [Google Scholar] [CrossRef]
  8. Wu, W.; Li, Z.; Xi, M.; Tu, D.; Xu, Y.; Zhou, Y.; Zhang, Z. Ratoon Rice System of Production: A Rapid Growth Pattern of Multiple Cropping in China: A Review. Plants 2023, 12, 3446. [Google Scholar] [CrossRef] [PubMed]
  9. Shiraki, S.; Ni, N.; Cho, T.M.; Thu, A.K.; Horikawa, N. Ratoon Rice Strategy for Enhanced Water Resource Management: A Simulation-Based Study in Tropical Monsoon Climates. Agric. Water Manag. 2025, 307, 109251. [Google Scholar] [CrossRef]
  10. He, H.; Song, L.; Wang, W.; Zheng, H.; Tang, Q. Critical Yield Components for Achieving High Annual Grain Yield in Ratoon Rice. Sci. Rep. 2024, 14, 23190. [Google Scholar] [CrossRef] [PubMed]
  11. Yuan, S.; Jiang, Y.; Chen, P.; Tu, N.; Zhou, W.; Yi, Z. Effects of Cultivar Type and Node Position on Cadmium Accumulation Characteristics of Ratoon Rice. Agronomy 2024, 14, 1401. [Google Scholar] [CrossRef]
  12. Li, Z.; Yang, L.; Cheng, S.; Ji, Y.; Xu, Y.; Zhou, Y. High Ratoon Season Rice Yield Is Achieved Through Optimized Variety, Nitrogen Management and Temperature-Solar Radiation Resources. Rice 2025, 18, 103. [Google Scholar] [CrossRef] [PubMed]
  13. Xie, W.; Furusawa, C.; Miyata, H.; Ata-Ul-Karim, S.T.; Yamasaki, Y.; Shiotsu, F.; Kato, Y. Genotypic Differences in the Agronomic Performance of Ratoon Rice in a Cool-Temperate Environment in Central Japan. Field Crops Res. 2024, 317, 109487. [Google Scholar] [CrossRef]
  14. Dossou-Yovo, E.R.; Ibrahim, A.; Akpoffo, M.A.Y.; Belko, N.; Ndindeng, S.A.; Saito, K.; Futakuchi, K. Agronomic and Economic Evaluation of Ratoon Rice Cropping Systems with Perennial Rice Varieties in West Africa. Field Crops Res. 2024, 308, 109294. [Google Scholar] [CrossRef]
  15. Wahab, A.A.; Hussain, M.; Fatima, Z.; Ahmed, M.; Ahmad, S. Evaluating the Interactive Impact of Nitrogen Levels and Cultivars on Yield Traits, Nitrogen Use Efficiency, Water Use Efficiency and Benefit Cost Ratio of Ratoon Rice in Punjab, Pakistan. Int. J. Plant Prod. 2024, 18, 97–107. [Google Scholar] [CrossRef]
  16. Lixiao, N.; Xiayu, G.; Weiqin, W.; Yucheng, Q.; Zhiyong, A.; Aibin, H. Regulation of Regeneration Rate to Enhance Ratoon Rice Production. Rice Sci. 2025, 32, 177–192. [Google Scholar] [CrossRef]
  17. Pan, S.; Wen, X.; Wang, Z.; Ashraf, U.; Tian, H.; Duan, M.; Mo, Z.; Fan, P.; Tang, X. Benefits of Mechanized Deep Placement of Nitrogen Fertilizer in Direct-Seeded Rice in South China. Field Crops Res. 2017, 203, 139–149. [Google Scholar] [CrossRef]
  18. Mo, Z.; Li, W.; Pan, S.; Fitzgerald, T.L.; Xiao, F.; Tang, Y.; Wang, Y.; Duan, M.; Tian, H.; Tang, X. Shading during the Grain Filling Period Increases 2-Acetyl-1-Pyrroline Content in Fragrant Rice. Rice 2015, 8, 9. [Google Scholar] [CrossRef] [PubMed]
  19. Zhang, Y.; He, Z.; Xing, P.; Luo, H.; Yan, Z.; Tang, X. Effects of Paclobutrazol Seed Priming on Seedling Quality, Photosynthesis, and Physiological Characteristics of Fragrant Rice. BMC Plant Biol. 2024, 24, 53. [Google Scholar] [CrossRef] [PubMed]
  20. Chen, X.; Liang, X.; Yu, J.; Mo, Z.; Fang, P.; Li, H.; Li, Y.; Sun, Z.; Liu, Z.; Liu, M. Mechanical Stubble Righting after the Mechanical Harvest of Primary Rice Improves the Grain Yield of Ratooning Rice. Agronomy 2023, 13, 2419. [Google Scholar] [CrossRef]
  21. Zhang, Z.; Wang, Y.; Chen, Y.; Ashraf, U.; Li, L.; Zhang, M.; Mo, Z.; Duan, M.; Wang, Z.; Tang, X.; et al. Effects of Different Fertilization Methods on Grain Yield, Photosynthetic Characteristics and Nitrogen Synthetase Enzymatic Activities of Direct-Seeded Rice in South China. J. Plant Growth Regul. 2022, 41, 1642–1653. [Google Scholar] [CrossRef]
  22. Yang, D.; Wang, Y.; Wu, Q. Impact of Tillage and Straw Management on Soil Properties and Rice Yield in a Rice-Ratoon Rice System. Agronomy 2023, 13, 1762. [Google Scholar] [CrossRef]
  23. Liu, B.; Yuan, S.; Peng, S. A Synthesis Analysis of the Relationship between Main and Ratoon Crop Grain Yields in Ratoon Rice. Agronomy 2024, 14, 2170. [Google Scholar] [CrossRef]
  24. Zhang, W.; Ke, X.; Zuo, C.; He, L.; Huang, V.W. Does Rural Out-Migration Contribute to Cropland-Use Intensification Transition? Evidence from Cropping Farms in China. J. Rural Stud. 2026, 123, 104005. [Google Scholar] [CrossRef]
  25. Peng, S.; Zheng, C.; Yu, X. Progress and Challenges of Rice Ratooning Technology in China. Crop Environ. 2023, 2, 5–11. [Google Scholar] [CrossRef]
  26. Ma, Z.; Ming, Y.; Li, J.; Li, H.; Wang, H.; Zhu, X.; Xu, Y.; Zhao, Y.; Hu, Q.; Liu, R.; et al. Natural Variation in GNP3 Determines Grain Number and Grain Yield in Rice. Nat. Commun. 2025, 16, 5892. [Google Scholar] [CrossRef] [PubMed]
  27. Liu, K.; Li, T.; Chen, Y.; Huang, J.; Qiu, Y.; Li, S.; Wang, H.; Zhu, A.; Zhuo, X.; Yu, F.; et al. Effects of Root Morphology and Physiology on the Formation and Regulation of Large Panicles in Rice. Field Crops Res. 2020, 258, 107946. [Google Scholar] [CrossRef]
  28. Lu, Y.; Chuan, M.; Wang, H.; Chen, R.; Tao, T.; Zhou, Y.; Xu, Y.; Li, P.; Yao, Y.; Xu, C.; et al. Genetic and Molecular Factors in Determining Grain Number per Panicle of Rice. Front. Plant Sci. 2022, 13, 964246. [Google Scholar] [CrossRef] [PubMed]
  29. Liu, M.; He, Z.; Xing, P.; Wu, Y.; Pu, X.; Liu, H.; Li, Y.; Tian, H.; Mo, Z.; Duan, M.; et al. Deep Placement of Fertilizer and Straw Incorporation Improved Grain Yield and 2-Acetyl-1-Pyrroline (2-AP) of Fragrant Rice. J. Soil Sci. Plant Nutr. 2025, 25, 4616–4628. [Google Scholar] [CrossRef]
  30. Okpala, N.E.; Du, B.; Bimpong, D.; Amenyogbe, M.K.; Aloryi, K.D.; Liu, Y.; Yan, P.; Chen, L.; Liu, W.; Wang, G.; et al. The Effect of Alternate Wetting and Drying (AWD) on Spikelet Fertility, Grain Traits and the Biosynthesis of 2-Acetyl-1-Pyrroline (2-AP) in Rice Grown under High Temperature. BMC Plant Biol. 2025, 25, 1725. [Google Scholar] [CrossRef] [PubMed]
  31. Bala, T.; Pradhan, S.; Jena, T.; Patta, S.; Mohanty, S.; Kaushal, K.; Kumari, M.; Mallik, S.K.; Rout, M.K. Cold Stress Resilience in Rice: Genotypic Variation, Yield Traits, and GGE Biplot Insights. Sci. Rep. 2025, 15, 37674. [Google Scholar] [CrossRef] [PubMed]
  32. Liu, Z.; Meng, J.; Sun, Z.; Su, J.; Luo, X.; Song, J.; Li, P.; Sun, Y.; Yu, C.; Peng, X. Zinc Application after Low Temperature Stress Promoted Rice Tillers Recovery: Aspects of Nutrient Absorption and Plant Hormone Regulation. Plant Sci. 2022, 314, 111104. [Google Scholar] [CrossRef] [PubMed]
  33. Sindhu, L.; Sivasankar, A.; Reddy, M.D. Evaluation of Thermal Indices and Their Relationship with Crop Growth and Yield as Influenced by Transplanting Dates and Seedling Age in Rice Variety RNR 15048 Grown in South Odisha. Crop Res. 2022, 57, 113–121. [Google Scholar] [CrossRef]
  34. Dou, Z.; Zhou, Y.; Zhang, Y.; Guo, W.; Xu, Q.; Gao, H. Influence of Nitrogen Applications during Grain-Filling Stage on Rice (Oryza sativa L.) Yield and Grain Quality under High Temperature. Agronomy 2024, 14, 216. [Google Scholar] [CrossRef]
  35. Yang, Y.; Luo, J.; Xian, Q.; Hu, H.; Liu, J.; Zou, T.; Nangia, V.; Li, Y.; Liu, Y. Meta-Analysis of Rice Yield and Grain Quality under High Temperature: Effects of Intensity, Magnitude, Timing, Environment, and Growth Stage. Field Crops Res. 2026, 346, 110606. [Google Scholar] [CrossRef]
  36. Lu, B.; Xu, C.; Li, Z.; Tang, X.; Yang, F.; Xu, D.; Zhu, G.; Zhang, J.; Jiang, Y.; Li, W.; et al. Influence of the Temperature during Grain Filling Stage and Nitrogen Application Rate on Yield and Quality of Indica Hybrid Rice. Field Crops Res. 2024, 309, 109333. [Google Scholar] [CrossRef]
  37. Shi, W.; Yin, X.; Struik, P.C.; Solis, C.; Xie, F.; Schmidt, R.C.; Huang, M.; Zou, Y.; Ye, C.; Jagadish, S.V.K. High Day- and Night-Time Temperatures Affect Grain Growth Dynamics in Contrasting Rice Genotypes. J. Exp. Bot. 2017, 68, 5233–5245. [Google Scholar] [CrossRef] [PubMed]
  38. Vishwakarma, C.; Krishna, G.K.; Kapoor, R.T.; Mathur, K.; Lal, S.K.; Saini, R.P.; Yadava, P.; Chinnusamy, V. Bioengineering of Canopy Photosynthesis in Rice for Securing Global Food Security: A Critical Review. Agronomy 2023, 13, 489. [Google Scholar] [CrossRef]
  39. Huanhe, W.; Xiaoyu, G.; Xiang, Z.; Wang, Z.; Xubin, Z.; Yinglong, C.; Zhongyang, H.; Guisheng, Z.; Tianyao, M.; Qigen, D. Grain Yield, Biomass Accumulation, and Leaf Photosynthetic Characteristics of Rice under Combined Salinity-Drought Stress. Rice Sci. 2024, 31, 118–128. [Google Scholar] [CrossRef]
  40. Xie, S.; Liu, H.; Ma, T.; Shen, S.; Zheng, H.; Yang, L.; Liu, L.; Wei, Z.; Xin, W.; Zou, D.; et al. Global Phosphoproteomic Analysis Reveals the Defense and Response Mechanisms of Japonica Rice under Low Nitrogen Stress. Int. J. Mol. Sci. 2023, 24, 7699. [Google Scholar] [CrossRef] [PubMed]
  41. Deng, S.; Zhang, T.; Pu, X.; Mai, Y.; Zheng, J.; Pan, S.; Mo, Z. Optimization of Nitrogen Application and Root Biomass Modulates 2-Acetyl-1-Pyrroline Biosynthesis in Fragrant Rice. Physiol. Plant. 2025, 177, e70504. [Google Scholar] [CrossRef] [PubMed]
  42. Li, X.; Wu, L.; Geng, X.; Xia, X.; Wang, X.; Xu, Z.; Xu, Q. Deciphering the Environmental Impacts on Rice Quality for Different Rice Cultivated Areas. Rice 2018, 11, 7. [Google Scholar] [CrossRef] [PubMed]
  43. Miao, Y.; Sun, J.; Liu, R.; Huang, J.; Sheng, J. Bridging the Quality-Price Gap: Unlocking Consumer Premiums for High-Quality Rice in China. Foods 2025, 14, 1184. [Google Scholar] [CrossRef] [PubMed]
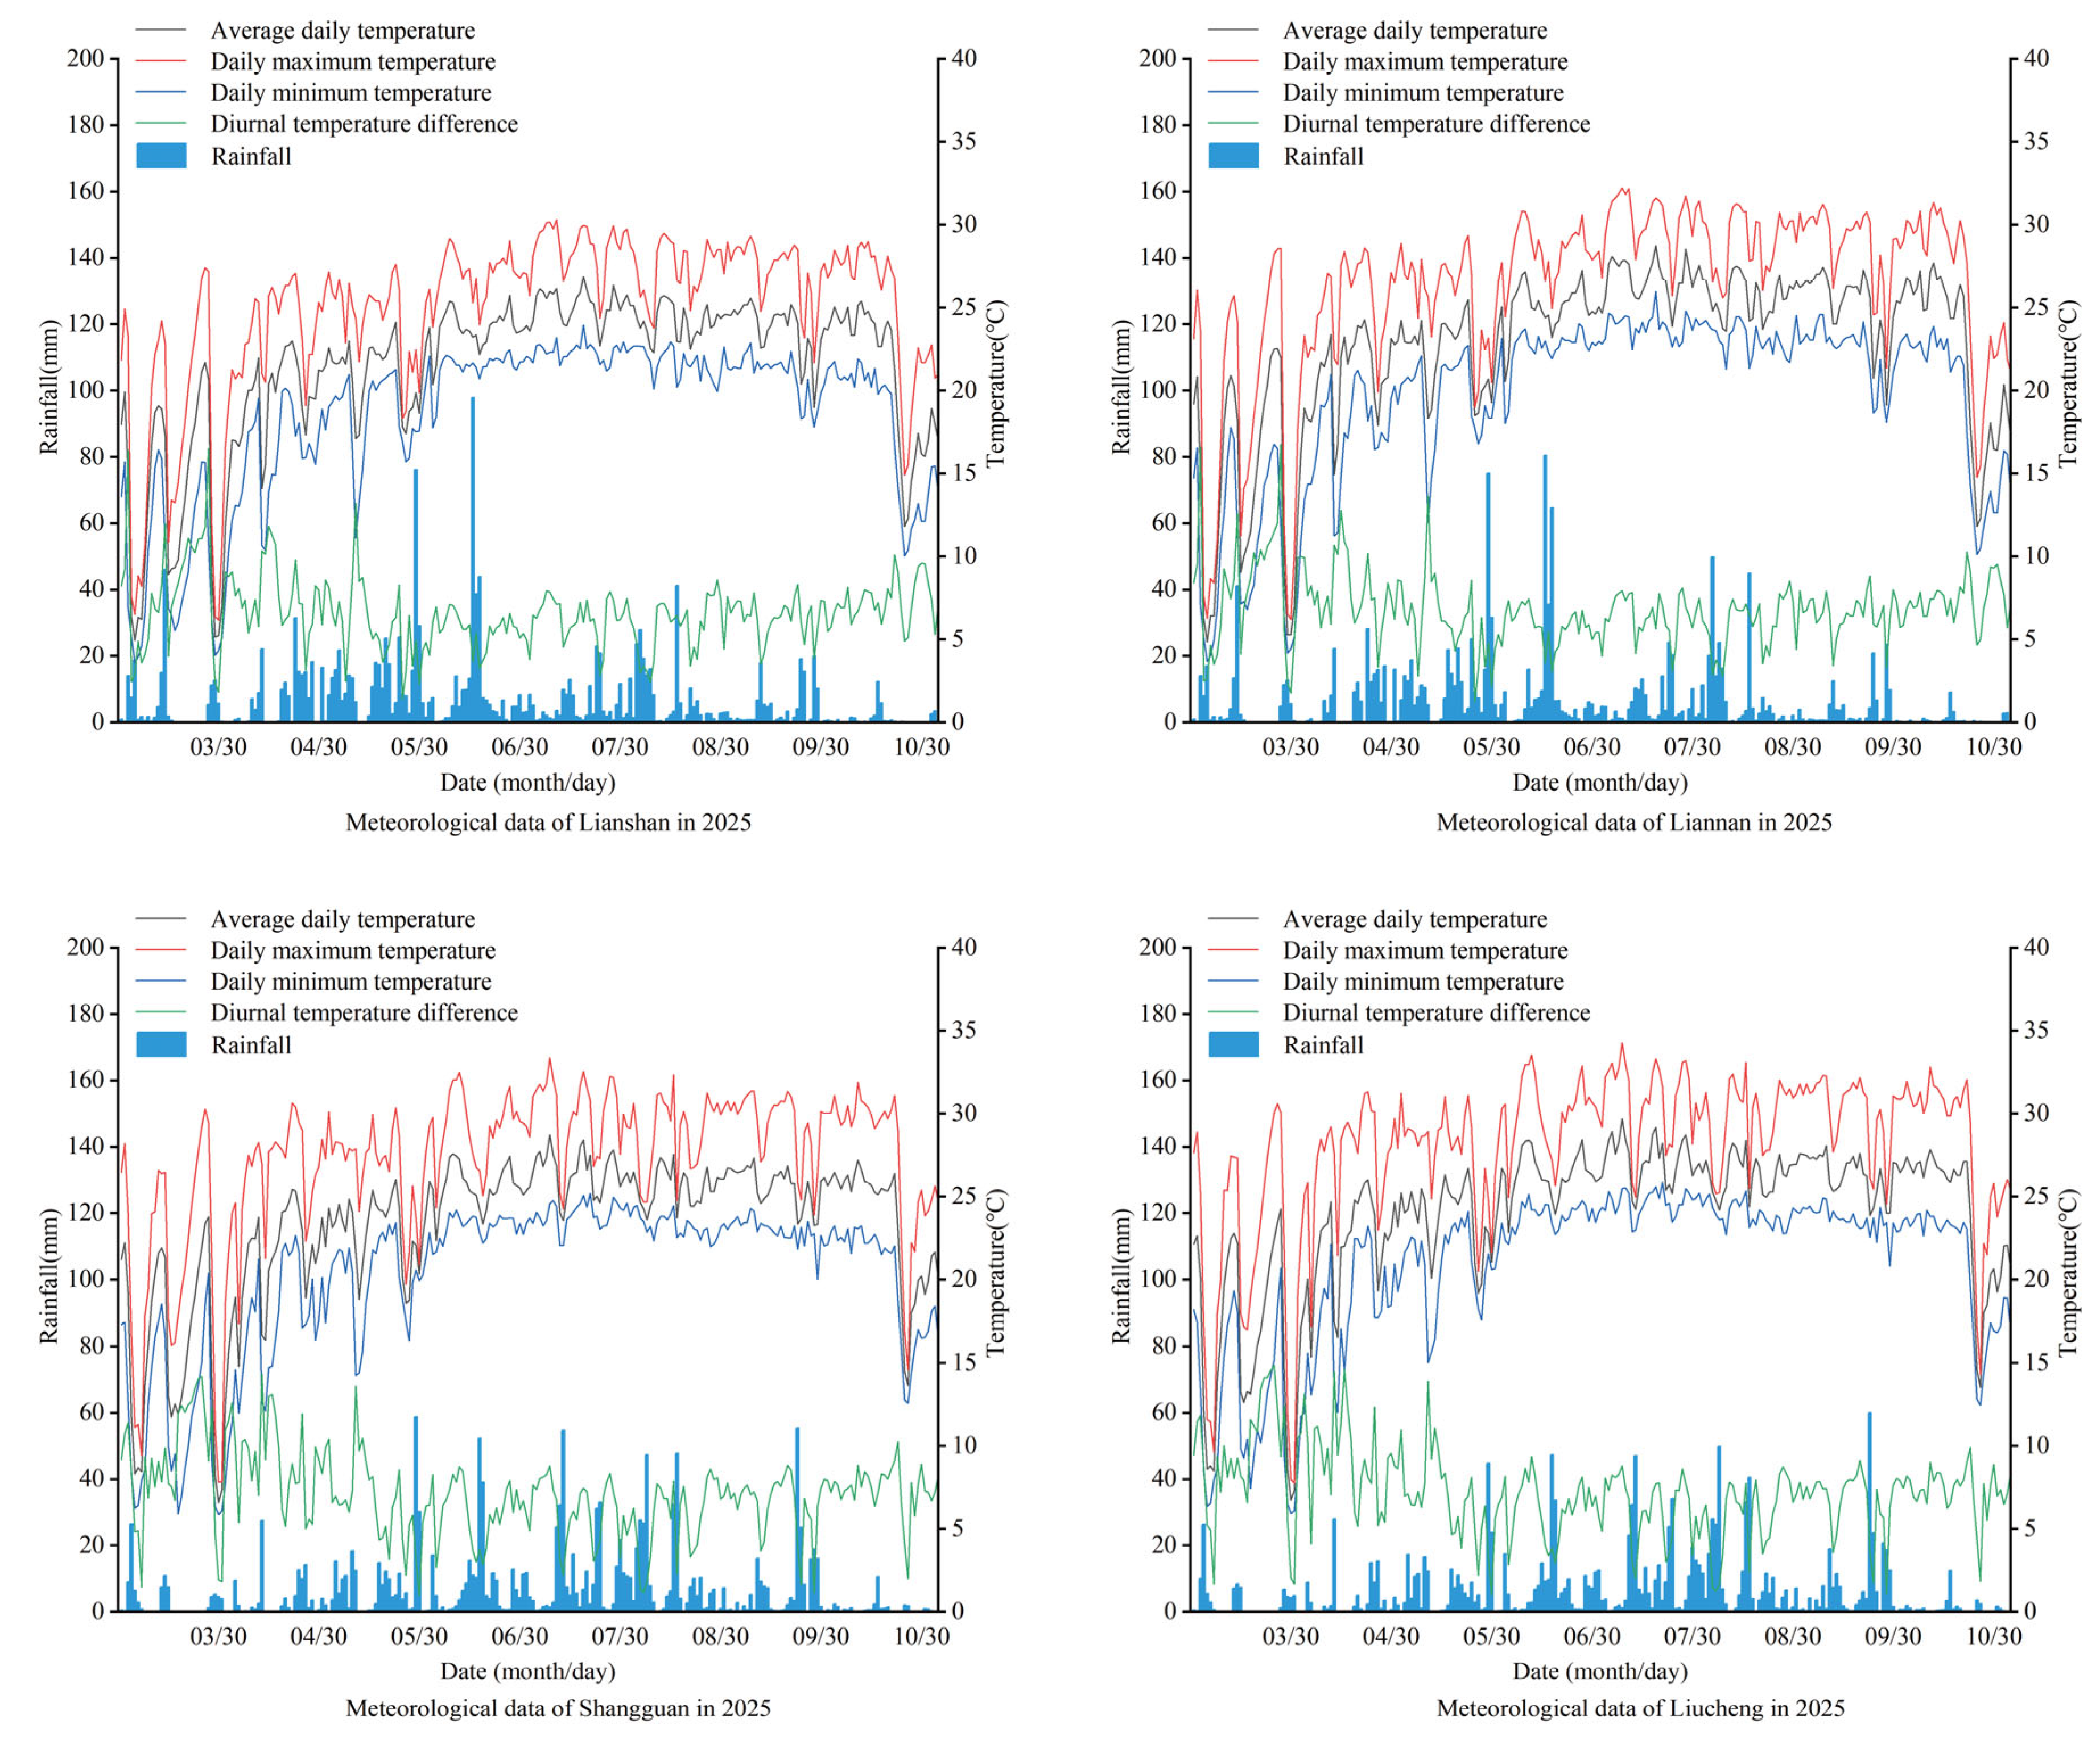
Figure 1. Meteorological data of the four ecological sites in 2025.
Agronomy 16 01456 g001
Figure 2. Annual grain yield of different rice varieties at different ecological sites. Note: (A) Yonghe Town, Lianshan County; (B) Sanjiang Town, Liannan County; (C) Shangguan Town, Dongyuan County; (D) Liucheng Town, Dongyuan County. The different letters (a, b, c) on the error line are significantly different at the 0.05 probability level according to least significant difference test (LSD 0.05).
Agronomy 16 01456 g002
Figure 3. Leaf area index (LAI) of different rice varieties at the heading stage of the main crop at different ecological sites. Note: (A) Yonghe Town, Lianshan County; (B) Sanjiang Town, Liannan County; (C) Shangguan Town, Dongyuan County; (D) Liucheng Town, Dongyuan County. The different letters (a, b) on the error line are significantly different at the 0.05 probability level according to least significant difference test (LSD 0.05).
Agronomy 16 01456 g003
Figure 4. Leaf area index (LAI) of different rice varieties at the heading stage of the ratoon crop at different ecological sites. Note: (A) Yonghe Town, Lianshan County; (B) Sanjiang Town, Liannan County; (C) Shangguan Town, Dongyuan County; (D) Liucheng Town, Dongyuan County. The different letters (a, b) on the error line are significantly different at the 0.05 probability level according to least significant difference test (LSD 0.05).
Agronomy 16 01456 g004
Figure 5. Total above-ground biomass of different rice varieties at the maturity stage of the main crop at different ecological sites. Note: (A) Yonghe Town, Lianshan County; (B) Sanjiang Town, Liannan County; (C) Shangguan Town, Dongyuan County; (D) Liucheng Town, Dongyuan County. The different letters (a, b) on the error line are significantly different at the 0.05 probability level according to least significant difference test (LSD 0.05).
Agronomy 16 01456 g005
Figure 6. Total above-ground biomass of different rice varieties at the maturity stage of the ratoon rice at different ecological sites. Note: (A) Yonghe Town, Lianshan County; (B) Sanjiang Town, Liannan County; (C) Shangguan Town, Dongyuan County; (D) Liucheng Town, Dongyuan County. The different letters (a, b) on the error line are significantly different at the 0.05 probability level according to least significant difference test (LSD 0.05).
Agronomy 16 01456 g006
Figure 7. Correlation analysis of various traits of rice in Northern Guangdong (Qingyuan and Heyuan cities). Note: Asterisks indicate significance levels: *, 0.01 < p < 0.05; **, 0.001 < p < 0.01; ***, 0.0001 < p < 0.001; ****, p < 0.0001. Red indicates a positive correlation, and blue indicates a negative correlation. The deeper the color, the greater the correlation.
Agronomy 16 01456 g007
Figure 8. Correlation analysis of grain yield and yield components with temperature and solar radiation resources during the grain-filling period in rice. Note: Asterisks indicate significance levels: *, 0.01 < p < 0.05; **, 0.001 < p < 0.01. Red indicates a positive correlation, and blue indicates a negative correlation. The deeper the color, the greater the correlation.
Agronomy 16 01456 g008
Table 1. Grain yield and yield components of different rice varieties in main crop season at different ecological sites.
SiteVarietyNo. of Productive Panicles (×104 ha−1)Spikelets
Per Panicle
Seed-Setting Rate (%)1000-Grain Weight (g)Grain Yield
(t ha−1)
Lianshan
Yonghe
QXY285.71 ± 9.72 b151.98 ± 3.10 a82.14 ± 0.32 b21.38 ± 0.06 b7.61 ± 0.11 a
NJXZ327.38 ± 11.40 a131.41 ± 2.96 b83.44 ± 0.22 a21.30 ± 0.04 b7.63 ± 0.09 a
JLYHZ303.57 ± 11.40 ab136.57 ± 3.48 b81.40 ± 0.22 b23.26 ± 0.04 a7.83 ± 0.10 a
Liannan
Sanjiang
QXY291.67 ± 14.98 a158.38 ± 6.25 a81.26 ± 0.33 a21.91 ± 0.11 c8.17 ± 0.09 a
GLY279.76 ± 11.40 a141.59 ± 4.48 b81.18 ± 0.24 a24.14 ± 0.19 b7.73 ± 0.11 b
WLYYZ238.09 ± 9.72 b159.80 ± 3.89 a81.72 ± 0.56 a25.70 ± 0.07 a7.97 ± 0.10 ab
Dongyuan
Shangguan
QXY291.67 ± 17.86 a158.21 ± 7.37 a80.72 ± 0.11 b21.79 ± 0.11 b8.05 ± 0.07 a
GYXZ279.76 ± 11.40 a146.57 ± 3.81 ab82.57 ± 0.60 a23.31 ± 0.17 a7.86 ± 0.10 a
JLYHZ303.57 ± 11.40 a138.89 ± 2.91 b81.25 ± 0.57 ab23.33 ± 0.10 a7.97 ± 0.11 a
Dongyuan
Liucheng
QXY315.48 ± 11.40 a153.09 ± 4.63 a78.15 ± 0.09 c21.96 ± 0.08 b8.26 ± 0.08 a
JLX321.43 ± 6.87 a131.80 ± 2.38 b85.31 ± 0.40 a21.26 ± 0.11 c7.67 ± 0.09 b
WLYYZ244.05 ± 11.40 b158.84 ± 5.16 a81.34 ± 0.40 b25.60 ± 0.04 a8.03 ± 0.10 a
Note: Different lowercase letters indicate significant differences according to LSD test (p < 0.05).
Table 2. Grain yield and yield components of different rice varieties in the ratoon rice at different ecological sites.
SiteVarietyNo. of Productive Panicles (×104 ha−1)Spikelets Per PanicleSeed-Setting Rate (%)1000-Grain Weight (g)Grain Yield
(t ha−1)
Lianshan
Yonghe
QXY202.38 ± 6.87 b89.344 ± 1.94 a75.33 ± 0.47 b19.49 ± 0.14 b2.65 ± 0.04 a
NJXZ250.00 ± 6.87 a56.09 ± 0.76 c76.93 ± 0.49 a18.63 ± 0.06 c2.01 ± 0.03 c
JLYHZ214.29 ± 9.72 b74.68 ± 1.97 b74.59 ± 0.36 b20.38 ± 0.13 a2.42 ± 0.04 b
Liannan
Sanjiang
QXY244.05 ± 5.95 a88.26 ± 0.94 a78.19 ± 0.34 a20.52 ± 0.12 b3.45 ± 0.04 a
GLY220.24 ± 5.95 b68.79 ± 0.76 b75.64 ± 0.55 b21.05 ± 0.33 b2.41 ± 0.04 c
WLYYZ178.57 ± 6.87 c87.06 ± 1.14 a73.45 ± 0.85 c23.48 ± 0.10 a2.67 ± 0.03 b
Dongyuan
Shangguan
QXY226.19 ± 6.87 ab87.36 ± 1.08 a77.22 ± 0.35 b20.15 ± 0.12 b3.07 ± 0.06 a
GYXZ202.38 ± 6.87 b79.33 ± 1.83 b78.63 ± 0.36 a21.10 ± 0.28 a2.66 ± 0.06 b
JLYHZ232.14 ± 11.40 a71.60 ± 1.61 c75.59 ± 0.39 c20.39 ± 0.13 b2.55 ± 0.07 b
Dongyuan
Liucheng
QXY238.09 ± 9.72 a90.30 ± 2.28 a77.05 ± 0.35 b20.41 ± 0.15 b3.37 ± 0.07 a
JLX244.05 ± 11.40 a82.97 ± 2.27 b81.80 ± 0.58 a18.55 ± 0.18 c3.06 ± 0.04 b
WLYYZ184.52 ± 5.95 b84.69 ± 1.34 ab73.62 ± 0.81 c23.62 ± 0.12 a2.71 ± 0.03 c
Note: Different lowercase letters indicate significant differences according to LSD test (p < 0.05).
Table 3. Rice quality of different rice varieties in the main crop season at different ecological sites.
SiteVarietyBrown Rice Rate (%)Milled Rice Rate (%)Head Rice
Rate (%)
Chalky Grain Rate (%)Chalkiness Degree (%)Amylose Content (%)Protein Content (%)
Lianshan
Yonghe
QXY73.50 ± 0.65 c66.07 ± 0.55 c50.99 ± 0.24 c5.06 ± 0.64 a0.63 ± 0.09 a15.75 ± 0.06 a6.35 ± 0.03 c
NJXZ75.31 ± 0.56 b69.95 ± 0.65 b59.22 ± 2.36 b3.85 ± 0.19 a0.50 ± 0.06a b15.48 ± 0.22a b8.35 ± 0.03 b
JLYHZ77.85 ± 0.38 a72.67 ± 0.40 a68.27 ± 0.31 a5.27 ± 0.63 a0.41 ± 0.04 b15.18 ± 0.12 b9.025 ± 0.05 a
Liannan
Sanjiang
QXY77.89 ± 0.63 b69.69 ± 0.46 b58.31 ± 1.03 b3.27 ± 0.14 a0.56 ± 0.02 a15.50 ± 0.04 a7.53 ± 0.03 b
GLY79.16 ± 0.06 a73.50 ± 0.08 a65.44 ± 0.17 a1.56 ± 0.13 b0.33 ± 0.02 b14.60 ± 0.28 b8.13 ± 0.03 a
WLYYZ77.61 ± 0.12 b69.59 ± 0.54 b56.10 ± 0.51 c3.12 ± 0.14 a0.53 ± 0.09 a15.95 ± 0.06 a6.40 ± 0.04 c
Dongyuan
Shangguan
QXY76.47 ± 1.22 b69.14 ± 1.30 b54.07 ± 0.79 b4.19 ± 0.31 b0.64 ± 0.10 b15.93 ± 0.05 a6.33 ± 0.03 c
GYXZ79.44 ± 0.31 a73.33 ± 0.25 a67.29 ± 0.26 a7.47 ± 0.54 a1.69 ± 0.06 a15.10 ± 0.04 b7.7 ± 0.02 b
JLYHZ79.58 ± 0.25 a74.32 ± 0.05 a68.40 ± 0.16 a3.48 ± 0.24 b0.58 ± 0.04 b14.08 ± 0.03 c8.33 ± 0.03 a
Dongyuan
Liucheng
QXY79.09 ± 0.11 a70.78 ± 0.32 b57.25 ± 0.53 b3.40 ± 0.11 a0.62 ± 0.02 a15.43 ± 0.09 a7.48 ± 0.03 c
JLX79.14 ± 0.75 a73.03 ± 0.64 a64.11 ± 0.28 a2.03 ± 0.19 c0.31 ± 0.03 c14.05 ± 0.05 c8.68 ± 0.03 a
WLYYZ79.12 ± 0.21 a72.57 ± 0.14 a63.27 ± 0.11 a2.62 ± 0.16 b0.43 ± 0.01 b14.95 ± 0.03 b7.90 ± 0.02 b
Note: Different lowercase letters indicate significant differences according to LSD test (p < 0.05).
Table 4. Rice quality of different rice varieties in the ratoon rice at different ecological sites.
SiteVarietyBrown Rice Rate (%)Milled Rice Rate (%)Head rice
Rate (%)
Chalky Grain Rate (%)Chalkiness Degree (%)Amylose Content (%)Protein Content (%)
Lianshan
Yonghe
QXY75.35 ± 0.22 b68.93 ± 0.23 b64.07 ± 0.61 b3.59 ± 0.21 a0.57 ± 0.01 a15.40 ± 0.04 a7.28 ± 0.03 c
NJXZ77.95 ± 0.11 a71.79 ± 0.18 a68.79 ± 0.14 a3.08 ± 0.12 ab0.50 ± 0.02 a14.53 ± 0.06 b8.45 ± 0.07 b
JLYHZ78.56 ± 0.55 a72.49 ± 0.30 a69.08 ± 0.21 a2.70 ± 0.19 b0.40 ± 0.03 b14.33 ± 0.05 c9.65 ± 0.03 a
Liannan
Sanjiang
QXY78.86 ± 0.07 a72.13 ± 0.11 ab68.21 ± 0.21 a2.90 ± 0.22 a0.52 ± 0.05 a14.93 ± 0.09 a7.83 ± 0.03 b
GLY79.17 ± 0.16 a72.94 ± 0.53 a69.02 ± 0.39 a1.35 ± 0.11 c0.28 ± 0.01 b14.38 ± 0.15 b8.45 ± 0.03 a
WLYYZ77.72 ± 0.16 b71.61 ± 0.39 b68.56 ± 0.24 a2.01 ± 0.2 b0.46 ± 0.06 a15.03 ± 0.10 a7.50 ± 0.06 c
Dongyuan
Shangguan
QXY77.08 ± 0.36 b71.33 ± 0.19 c65.03 ± 0.21 b3.77 ± 0.21 b0.61 ± 0.02 b15.81 ± 0.08 a7.38 ± 0.03 c
GYXZ79.09 ± 0.12 a72.38 ± 0.09 b65.52 ± 0.17 b5.65 ± 0.18 a1.49 ± 0.04 a15.00 ± 0.09 b8.05 ± 0.03 b
JLYHZ79.20 ± 0.31 a73.39 ± 0.15 a70.44 ± 0.24 a2.61 ± 0.16 c0.54 ± 0.03 b13.90 ± 0.07 c8.48 ± 0.03 a
Dongyuan
Liucheng
QXY78.06 ± 0.34 b72.05 ± 0.15 b68.05 ± 0.05 b3.01 ± 0.03 a0.62 ± 0.03 a15.10 ± 0.05 a7.8 ± 0.02 c
JLX79.12 ± 0.35 a73.83 ± 0.33 a71.57 ± 0.15 a1.78 ± 0.14 b0.28 ± 0.02 c13.98 ± 0.05 c9.08 ± 0.03 a
WLYYZ78.71 ± 0.22 ab72.79 ± 0.25 b71.08 ± 0.25 a1.89 ± 0.11 b0.43 ± 0.02 b14.85 ± 0.06 b8.73 ± 0.03 b
Note: Different lowercase letters indicate significant differences according to LSD test (p < 0.05).
Table 5. Chlorophyll content of different rice varieties in the main crop at different ecological sites.
SiteVarietyChlorophyll a
(mg g−1)
Chlorophyll b
(mg g−1)
Carotenoid
(mg g−1)
Total Chlorophyll
(mg g−1)
Lianshan
Yonghe
QXY0.78 ± 0.01 a0.31 ± 0.01 c0.13 ± 0.00 c1.10 ± 0.02 b
NJXZ0.79 ± 0.01 a0.39 ± 0.01 b0.19 ± 0.00 b1.18 ± 0.02 ab
JLYHZ0.81 ± 0.03 a0.42 ± 0.01 a0.21 ± 0.01 a1.22 ± 0.04 a
Liannan
Sanjiang
QXY1.08 ± 0.02 a0.45 ± 0.01 a0.20 ± 0.00 a1.53 ± 0.03 a
GLY0.84 ± 0.03 b0.35 ± 0.01 b0.17 ± 0.01 b1.19 ± 0.04 b
WLYYZ0.90 ± 0.01 b0.37 ± 0.00 b0.17 ± 0.00 b1.27 ± 0.01 b
Dongyuan
Shangguan
QXY0.81 ± 0.02 a0.36 ± 0.01 a0.16 ± 0.00 a1.18 ± 0.02 a
GYXZ0.53 ± 0.02 c0.25 ± 0.01 c0.11 ± 0.00 b0.78 ± 0.03 c
JLYHZ0.75 ± 0.01 b0.31 ± 0.00 b0.16 ± 0.00 a1.06 ± 0.01 b
Dongyuan
Liucheng
QXY1.23 ± 0.02 a0.52 ± 0.01 a0.23 ± 0.00 a1.75 ± 0.03 a
JLX0.96 ± 0.01 b0.28 ± 0.00 c0.14 ± 0.00 b1.24 ± 0.02 c
WLYYZ1.16 ± 0.03 a0.44 ± 0.02 b0.22 ± 0.01 a1.60 ± 0.05 b
Note: Different lowercase letters indicate significant differences according to LSD test (p < 0.05).
Table 6. Chlorophyll content of different rice varieties in the ratoon crop at different ecological sites.
SiteVarietyChlorophyll a
(mg g−1)
Chlorophyll b
(mg g−1)
Carotenoid
(mg g−1)
Total Chlorophyll
(mg g−1)
Lianshan
Yonghe
QXY0.46 ± 0.01 a0.20 ± 0.00 a0.10 ± 0.00 a0.66 ± 0.01 a
NJXZ0.35 ± 0.01 c0.18 ± 0.00 b0.07 ± 0.00 b0.53 ± 0.01 c
JLYHZ0.38 ± 0.00 b0.18 ± 0.00 b0.10 ± 0.00 a0.57 ± 0.00 b
Liannan
Sanjiang
QXY0.90 ± 0.01 a0.38 ± 0.00 a0.19 ± 0.00 a1.27 ± 0.01 a
GLY0.43 ± 0.00 c0.18 ± 0.00 c0.09 ± 0.00 c0.61 ± 0.00 c
WLYYZ0.58 ± 0.01 b0.24 ± 0.00 b0.13 ± 0.00 b0.82 ± 0.01 b
Dongyuan
Shangguan
QXY0.54 ± 0.00 a0.26 ± 0.00 a0.10 ± 0.00 a0.81 ± 0.00 a
GYXZ0.45 ± 0.01 b0.23 ± 0.00 b0.07 ± 0.00 b0.67 ± 0.01 b
JLYHZ0.42 ± 0.01 c0.17 ± 0.00 c0.07 ± 0.00 c0.59 ± 0.01 c
Dongyuan
Liucheng
QXY0.77 ± 0.00 a0.33 ± 0.00 a0.14 ± 0.00 a1.10 ± 0.00 a
JLX0.71 ± 0.01 b0.31 ± 0.00 b0.11 ± 0.00 b1.02 ± 0.02 b
WLYYZ0.63 ± 0.01 c0.27 ± 0.00 c0.12 ± 0.00 b0.90 ± 0.01 c
Note: Different lowercase letters indicate significant differences according to LSD test (p < 0.05).
Table 7. Nitrogen metabolism enzyme activities of different rice varieties in the main crop at different ecological sites.
SiteVarietyNR (μg min−1 mg−1 FW)GS (U min−1 g−1 FW)GOGAT (U h−1 g−1 FW)
Lianshan
Yonghe
QXY17.08 ± 0.51 a19.08 ± 0.67 b29.67 ± 3.96 a
NJXZ18.64 ± 0.60 a22.28 ± 1.19 a30.65 ± 2.58 a
JLYHZ18.74 ± 0.64 a23.19 ± 0.91 a31.27 ± 3.30 a
Liannan
Sanjiang
QXY33.94 ± 0.61 a34.29 ± 0.42 a44.43 ± 3.88 a
GLY20.32 ± 0.39 c25.02 ± 0.23 c30.08 ± 0.49 b
WLYYZ27.86 ± 0.74 b29.76 ± 1.29 b34.46 ± 2.76 b
Dongyuan
Shangguan
QXY20.86 ± 0.28 a27.26 ± 2.29 a31.78 ± 2.94 a
GYXZ17.78 ± 0.22 b14.75 ± 0.46 c18.55 ± 0.77 b
JLYHZ19.06 ± 0.78 b20.43 ± 0.70 b21.46 ± 1.55 b
Dongyuan
Liucheng
QXY34.20 ± 0.98 a38.14 ± 1.44 a46.00 ± 1.53 a
JLX25.66 ± 1.19 b30.56 ± 0.18 c28.33 ± 1.93 b
WLYYZ30.68 ± 1.58 a33.87 ± 0.43 b33.99 ± 4.08 b
Note: Different lowercase letters indicate significant differences according to LSD test (p < 0.05).
Table 8. Nitrogen metabolism enzyme activities of different rice varieties in the ratoon crop at different ecological sites.
SiteVarietyNR (μg min−1 mg−1 FW)GS (U min−1 g−1 FW)GOGAT (U h−1 g−1 FW)
Lianshan
Yonghe
QXY8.12 ± 0.77 a23.55 ± 1.15 a28.00 ± 1.31 a
NJXZ7.06 ± 0.74 a18.86 ± 0.94 b24.97 ± 0.45 a
JLYHZ7.17 ± 1.97 a20.37 ± 0.27 b26.20 ± 2.46 a
Liannan
Sanjiang
QXY15.04 ± 1.27 a37.46 ± 1.42 a40.47 ± 2.02 a
GLY8.76 ± 0.76 b23.314 ± 0.64 b28.31 ± 1.36 b
WLYYZ12.53 ± 1.45 ab25.65 ± 0.49 b32.00 ± 5.69 ab
Dongyuan
Shangguan
QXY10.16 ± 0.24 a23.84 ± 0.21 a31.73 ± 0.93 a
GYXZ8.62 ± 1.29 a22.23 ± 0.20 a22.52 ± 1.60 b
JLYHZ7.74 ± 1.35 a22.08 ± 2.06 a16.94 ± 2.97 b
Dongyuan
Liucheng
QXY13.41 ± 2.51 a34.17 ± 3.13 a38.02 ± 3.39 a
JLX10.94 ± 0.44 a27.00 ± 2.79 ab36.13 ± 6.38 a
WLYYZ8.91 ± 0.17 a25.66 ± 1.79 b31.57 ± 1.68 a
Note: Different lowercase letters indicate significant differences according to LSD test (p < 0.05).
Disclaimer/Publisher’s Note: The statements, opinions and data contained in all publications are solely those of the individual author(s) and contributor(s) and not of MDPI and/or the editor(s). MDPI and/or the editor(s) disclaim responsibility for any injury to people or property resulting from any ideas, methods, instructions or products referred to in the content.