Article

Plant Growth and Development, Yield and Reproductive Quality of Seeds in Fagopyrum tataricum (L.) Gaertn. Differ Depending on Foliar Silicon Addition in a Three-Year Experiment


1
Department of Plant Breeding and Bioresources Engineering, Faculty of Agriculture and Forestry, University of Warmia and Mazury in Olsztyn, Plac Łódzki 3, 10-724 Olsztyn, Poland
2
Biotechnical Faculty, University of Ljubljana, Jamnikarjeva 101, 1000 Ljubljana, Slovenia
*
Author to whom correspondence should be addressed.
Agronomy 2026, 16(14), 1384; https://doi.org/10.3390/agronomy16141384
Submission received: 2 June 2026 / Revised: 15 July 2026 / Accepted: 20 July 2026 / Published: 21 July 2026
(This article belongs to the Section Soil and Plant Nutrition)

Abstract

Tartary buckwheat is the second most economically important species of the genus Fagopyrum for human nutrition. It has higher nutritional and nutraceutical value than common buckwheat. Tartary buckwheat is considered a species that is well adapted to adverse conditions such as drought, cold and aluminum toxicity. Despite its high stress tolerance, the yield of Tartary buckwheat varies considerably from year to year. The present study was conducted to assess the effect of silicon application on the growth, development, yield, and seed reproductive quality of Tartary buckwheat cultivated in northeastern Poland from 2022 to 2024. The experiment included three genotypes of Tartary buckwheat (of Chinese, Slovenian, and Polish weedy origin). The silicon biostimulant was applied as three foliar sprays at 250 g ha−1 each, at 21-day intervals starting from the three-leaf-unfolded stage (BBCH 13). The use of silicon resulted in a 29% increase in the air-dry mass per plant, an increase in the number of inflorescences and seeds per plant, an increase in the bulk density of achenes, and a reduction in the mean germination time (MGT) of a single seed. The biostimulant did not affect the average yield of achenes or their germination. The main factors that strongly differentiated the plant characteristics and yield of Tartary buckwheat were weather conditions across years of the study and Tartary buckwheat genotypes.

1. Introduction

Buckwheat is grown globally by small-scale farmers and is considered an orphan crop [1]. Over the past six decades, the area under buckwheat cultivation has gradually declined from 5.8 million ha in 1962 to 1.8 million ha in 2019, and global production decreased from nearly five million tons in 1992 to less than one million tons in 2010 [2]. Only two out of the twenty buckwheat species have economic significance: common buckwheat (Fagopyrum esculentum Moench) and Tartary buckwheat (Fagopyrum tataricum (L.) Gaertn.) [3,4]. Common buckwheat is most widely cultivated, accounting for around 90% of global buckwheat production [5]. Tartary buckwheat is grown locally, mainly in southwestern China, Tibet, Nepal, Bhutan, and the cool regions of northern India [6]. A resequencing study of global Tartary buckwheat accessions revealed two independent domestication events with distinct genetic characteristics in southwestern and northern China [7]. In Europe, Tartary buckwheat is cultivated in Islek, a region at the border triangle of Belgium, Germany, and Luxembourg, as well as in Slovenia and northern Italy, and on small plots in Jutland [8].
There is relatively little interest in global buckwheat cultivation due to the difficulty of achieving high and stable yields [9,10]. In common buckwheat, low and inconsistent yields are attributable to flowering and fruiting biology (allogamy, heterostyly, a short flowering period, high rates of flower and embryo abortion, susceptibility to seed shattering) as well as sensitivity to abiotic stresses [11,12,13,14,15,16].
Tartary buckwheat is a self-pollinating species that is more resilient to low temperatures and adverse habitat conditions and has a much higher yield potential than common buckwheat [17,18,19,20]. It is recognized for the high nutritional value and functional attributes of its achenes, mainly due to their higher concentrations of bioactive compounds compared with those of common buckwheat [21,22,23,24,25]. In Central Eastern Europe, Tartary buckwheat often appears as a weed in common buckwheat stands [26].
Despite the aforementioned differences, Tartary buckwheat yields also fluctuate considerably due to the varied timing of entering the generative stage in some forms, susceptibility to seed shattering, and high sensitivity to weather conditions during the growing season [27,28]. The achievement of the optimal plant density requires not only high-quality seeds, but also favorable thermal and moisture conditions. Water is a critical determinant of seed germination [29,30]. It participates in the entire germination process of Tartary buckwheat seeds and plays various roles at different stages [31]. A soil moisture content of 70–75% water capacity is optimal for the hydration and germination of buckwheat seeds [32]. In turn, temperature primarily determines the germination rate of buckwheat seeds that begin to germinate when the soil temperature reaches 5–6 °C [33]. Tartary buckwheat has relatively low environmental requirements [34]. It can be cultivated on nutrient-poor soils in high-altitude areas with a short growing season [35,36]. Under these conditions, the emergence of Tartary buckwheat seedlings can be inhibited by high soil salinity [37,38] and pressure from fungal pathogens [39]. High temperatures contribute to flower abortion, accelerate seed setting, and lead to seed necrosis [40,41]. In turn, water deficit reduces the number of inflorescences and seeds per plant and inhibits dry matter accumulation [41,42,43].
Various types of biostimulants are used in crop production to alleviate the effects of stress and minimize yield losses [44]. These substances induce physiological and molecular changes in plants, thus improving their growth, development, and stress tolerance [45]. Silicon is an element that positively influences the growth of many plant species, even though it is not considered an essential nutrient for vascular plants [46]. Silicon not only enhances plant growth in stress-free environments, but also alleviates the effects of various abiotic stresses in crop production [47]. Research has shown that during drought, silicon can increase plant growth, relative water content, photosynthetic rate, and chlorophyll content [48]. Sun et al. [49] demonstrated that silicon promotes seed germination and the growth of maize seedlings. Silicon acts as a biostimulant that promotes plant growth, especially under stress conditions [47,50,51,52]. In addition, silicon increases the resilience of Tartary buckwheat plants to environmental stresses, in particular drought and aluminum toxicity [53,54,55]. Exogenous silicon improves the stress tolerance of buckwheat by stabilizing thylakoid membranes, enhancing photosynthesis, and supporting morphological development [52].
To the best of the authors’ knowledge, this is the first three-year field trial involving Tartary buckwheat treated with silicon, conducted under different moisture conditions. The aim of the present study was to evaluate the effects of silicon and environmental conditions on plant growth and development, yield, and seed reproductive quality in Tartary buckwheat cultivated in northeastern Poland.

2. Materials and Methods

2.1. Field Experiment

Tartary buckwheat (Fagopyrum tataricum (L.) Gaertn.) was grown in a three-year (2022–2024) field-plot experiment at the Agricultural Experiment Station (AES) in Bałcyny (north-eastern Poland, 53°35′41.4″ N, 19°50′33.0″ E, elevation—137 m ASL), which constitutes the property of the University of Warmia and Mazury in Olsztyn. The first experimental factor was the form (genotype) of Tartary buckwheat: a Chinese cultivar adapted to the environmental conditions of Poland (CN), a regional Slovenian form grown near the town of Šentjernej (SI), and a Polish weedy form sourced from Tartary buckwheat plants growing as a weed in common buckwheat stands in Poland (PL). Three different forms (a variety from a breeding program, a landrace, and a weedy form) were selected for the experiment to ensure a comprehensive assessment of the impact of the planned treatments on Tartary buckwheat. The second experimental factor was the Sikron SF 500 (Penegric International AG, Romanshorn, Switzerland) silicon biostimulant (quartz microparticles, cristobalite dust) containing 97.5% SiO2. Beginning at the three-leaf-unfolded stage (BBCH 13), buckwheat plants were sprayed three times with an aqueous solution of the biostimulant at a rate of 250 g ha−1 of active ingredient at three-week intervals. Plants that were sprayed at the same time intervals with the same volume of pure water served as the control treatments.
Buckwheat was sown between 4 and 6 May in plots with an area of 4 m2 each, at 200 germinating seeds per 1 m2, with a row spacing of 40 cm. Seed germination was tested immediately before sowing, in accordance with the rules of the International Seed Testing Association (ISTA) [56]. Seed germination rates ranged from 97% to 98%, depending on the variety and year. The experiment had a randomized split-plot design with three replicates, and it was conducted on soil of quality class IIIb (“good wheat complex” in the Polish soil suitability classification system). Winter oilseed rape was the preceding crop in all experimental years. Before sowing, mineral fertilizers were applied at: K2O—72 kg ha−1, P2O5—54 kg ha−1, and N—40 kg ha−1 (20 kg as pre-sowing application + 20 kg as top-dressing application during inflorescence emergence). Weeds were controlled mechanically.
Weather data were obtained from the meteorological station located at the AES in Bałcyny. In each season, precipitation was measured using the Selyaninov hydrothermal coefficient (HTC) (Table 1) by dividing the sum of rainfall by the sum of temperatures (T) in the analyzed period and multiplying the result by 10: HTC = (ΣP/ΣT) × 10 [57,58]. Based on the calculated values of HTC, each growing season and parts thereof were divided into the following categories: extremely dry—c ≤ 0.40; very dry—0.41 < c ≤ 0.70; dry—0.71 < c ≤ 1.0; relatively dry—1.01 < c ≤ 1.30; optimal—1.31 < c ≤ 1.60; relatively wet—1.61 < c ≤ 2.0; wet—2.01 < c ≤ 2.5; very wet—2.51 < c ≤ 3.0; extremely wet—c > 3.01 [59].

2.2. Morphological and Growth Analyses

The number of plants per unit area was counted after emergence. Ten plants were sampled randomly from each plot before harvest. The plants were dried under room conditions (biomass moisture content: 11.89–12.23%) and measured to determine plant height, air-dry biomass, number of first-order branches, number of inflorescences, number of achenes per plant, and achene mass per plant. The harvest index (HI) was calculated for each treatment based on the ratio of dry achene mass to the dry mass of whole plants with achenes. In all plots, buckwheat was harvested with a Wintersteiger plot harvester when 75% of the achenes turned brown. In 2022–2023, this stage occurred between 1 and 10 August in genotype PL, between 10 and 20 August in genotype SI, and between 20 and 30 August in genotype CN. In 2024, each form was harvested 7–10 days earlier than in the preceding years of the experiment. Achene yield was determined at 12% moisture content. In the laboratory, the bulk density of achenes was determined in four replicates in each treatment, according to PN EN ISO 7971-3:2010 [60]. Thousand-achene weight (TAW) and germination percentage were determined according to the International Rules for Seed Testing [56]. Eight samples of 100 achenes each were randomly collected from each treatment. The achenes in every sub-sample were weighed to the nearest 0.0001 g (HR 60, A&D Company Limited, Konosu, Japan). When the coefficient of variation did not exceed 4%, the average from sub-sample measurements was multiplied by 10.

2.3. Germination Test

In each treatment, 100 Tartary buckwheat achenes were subjected to a germination test with four replicates. The achenes were spread on filter paper soaked with distilled water and placed in plastic boxes measuring 21 × 12 × 3 cm. The boxes were placed in a germination chamber (Sanyo MLR-350 T, Sanyo Electric Co., Ltd., Sakata, Japan). The seeds were germinated in darkness at 20 °C for seven days. Germination energy (GE, percentage of seeds germinated after 4 days) and germination capacity (GC, percentage of seeds germinated after 7 days) were calculated. In addition, germinated seeds (containing a radicle with a minimum length of 3 mm) were counted each day to determine the mean germination time (MGT) of a single-seed [61].
The statistical analyses involved two-way analysis of variance (ANOVA), with genotype and biostimulant as fixed effects and three replicates as random effects. In the next step, these analyses were expanded to include the random effect of the year of the study. The significance of differences between treatment means was determined using Tukey’s test, at a significance level of p < 0.05. Pearson’s correlation analysis was performed for the most important traits. Additionally, a multivariate analysis of all the studied parameters was performed, and the results were presented as a heatmap and a dendrogram. The data were processed statistically using the Statistica software package [62].

3. Results

3.1. Weather Conditions in Growing Seasons

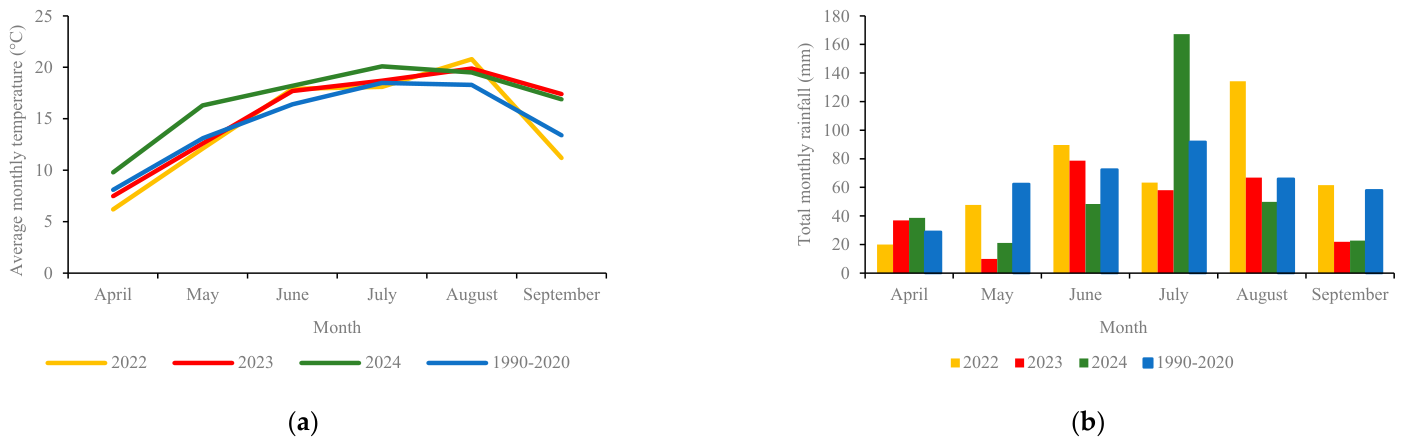
Weather conditions during the growing seasons of 2022–2024 are presented in Figure 1.
In subsequent years of the study, precipitation levels during buckwheat sowing in May accounted for 76%, 16%, and 34% of the long-term average (1991–2020), respectively. In 2022 and 2023, the mean temperature in May was 1 °C and 0.5 °C below the long-term average, respectively (Figure 1a,b). In 2024, May was a hot month, with a mean temperature 3.2 °C above the long-term average (1991–2020). In all experimental years, temperatures in June exceeded the long-term average by 1.5, 1.3, and 1.8 °C, respectively. In 2022 and 2023, total precipitation in June accounted for 124% and 109% of the long-term average, respectively. In 2024, total rainfall in June was equivalent to only 67% of the long-term average (1991–2020). In July, mean temperatures approximated the long-term average in 2022 and 2023 and significantly exceeded that value in 2024. In July, total precipitation was equivalent to 2/3 of the long-term average in the first two years of the experiment but accounted for 182% of that value in 2024. Temperatures in August exceeded the long-term average (1991–2020) in all years of the study. In comparison with the long-term average, total precipitation was twice as high in August 2022, similar in August 2023, and 25% lower in August 2024. The growing season of 2022 can be considered optimal in terms of temperature and rainfall; the growing season of 2023 was dry, whereas the growing season of 2024 was relatively dry (Table 1).

3.2. Plant Density

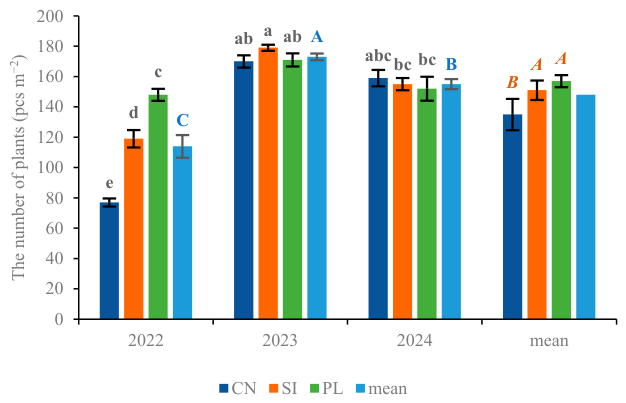
During the three-year experiment, the average density of buckwheat plants reached 148 plants m−2, accounting for 74% of the target value (Figure 2). The number of plants per unit area was highest in 2023—173 plants m−2 (87% of the target value) and lowest in 2022 (57% of the target value). On average, the highest plant density was noted in the weedy form (PL) and the Slovenian accession (SI) of Tartary buckwheat, where the analyzed parameter was 151 and 157 plants m−2, respectively, accounting for 76% and 79% of the target value, respectively; the observed difference was not significant. The Chinese genotype (CN) was characterized by significantly lower average seedling emergence, accounting for 68% of the target value. Significant differences in plant density between years of the study and the cultivated forms of Tartary buckwheat primarily resulted from low seedling emergence, particularly in the Chinese genotype (CN), which reached less than 39% of the target value in 2022 (77 plants m−2). In general, the low percentage of emerged seedlings in 2022 can be attributed to unfavorable rainfall distribution patterns, primarily in the two weeks preceding and following the sowing date. In this year, only 3 mm of rain fell during the two weeks before sowing, and a mere 4.3 mm during the two weeks after sowing. During the same period in 2023, the respective values were 13.6 mm and 10 mm. Water deficit inhibited seed germination and seedling emergence in dry, hard soil crusts. Plant density was negatively correlated with plant height, the number and mass of achenes per plant, achene yield, and the HI (Table 2).

3.3. Biometric Characteristics of Plants

Table S1, included in the Supplementary Materials, presents the results of ANOVA, demonstrating the significance of the effects of experimental factors on the studied traits. The data indicate that in most cases, years of the study (representing weather and environmental conditions) significantly differentiated the values of the studied traits (Table S1).
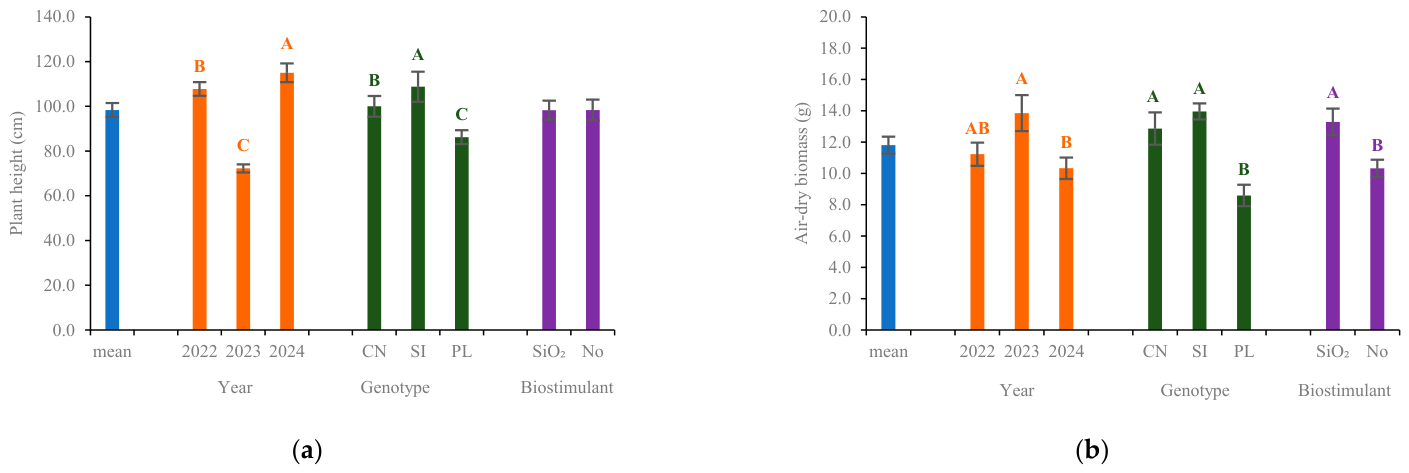
The height of Tartary buckwheat plants differed across years (Figure 3a). Buckwheat plants were significantly taller in 2022 and 2024 than in 2023. The Slovenian form (SI) was characterized by the tallest plants, and the Polish weedy form (PL) was characterized by the shortest plants. In 2023, all studied genotypes produced plants that did not differ significantly in height. This trait was not differentiated by the applied biostimulant. A positive correlation was found between plant height and yield components such as achene mass per plant, TAW, and achene yield (Table 2).
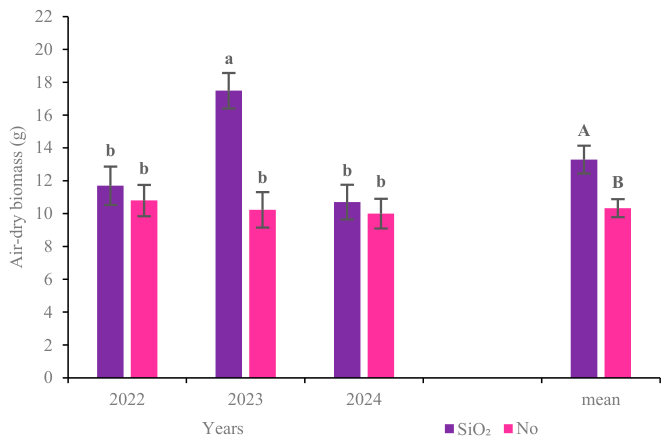
Air-dry biomass differed significantly across years. The air-dry biomass of Tartary buckwheat plants treated with the silicon biostimulant was significantly higher in 2023 compared with the control treatment in that year and all treatments in the other two years of the study. A positive correlation was found between air-dry mass per plant and the number of first-order branches per plant, the number of inflorescences and the number and mass of achenes per plant (Table 2). A comparison of the average values for the studied genotypes revealed trends similar to those observed for plant height: air-dry biomass was highest in the SI form and lowest in the PL form. The silicon biostimulant induced a significant (approx. 29%) increase in the average air-dry biomass of buckwheat plants. However, this increase was significant only in 2023, when the air-dry biomass of silicon-treated plants was 75% higher than that of untreated plants. In the remaining years of the experiment, the silicon biostimulant induced only a 7–8% increase in the biomass of Tartary buckwheat plants (Figure 4).
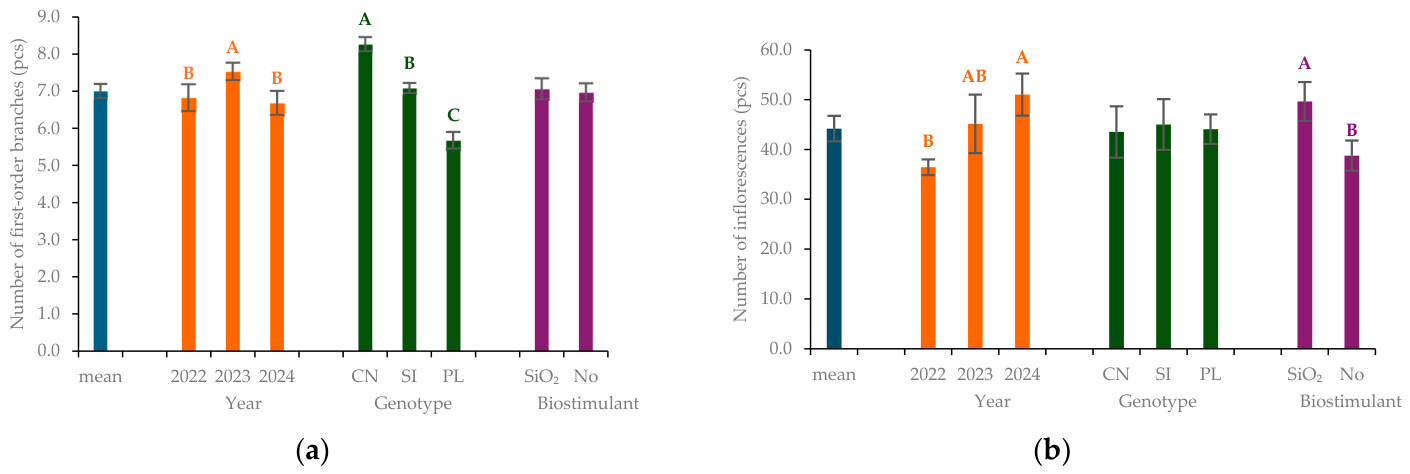
The number of first-order branches was highest in the CN form, and it was 14% and 30% higher than in the SI form and the weedy PL form, respectively (Figure 5a). Plant branching was not affected by the silicon biostimulant.
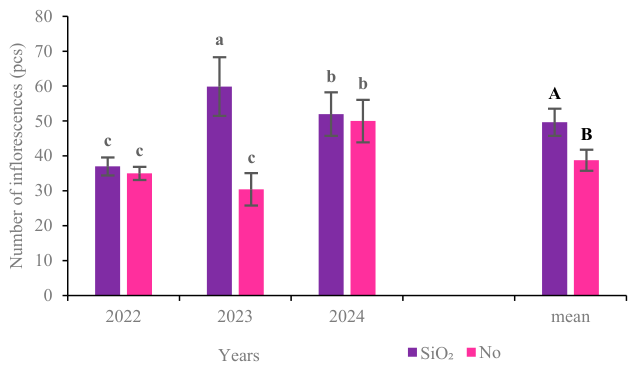
Tartary buckwheat produced 44 inflorescences per plant on average (Figure 5b). The number of inflorescences was significantly greater in 2024 relative to the remaining years of the study, when this parameter was 12% (2023) and 30% (2022) lower. The silicon biostimulant increased the number of inflorescences by 28% on average, but the observed increase was significant only in 2023, when silicon-treated plants produced approximately 100% more inflorescences than untreated plants (Figure 6). In the remaining years of the experiment, only a tendency towards an increase in the number of inflorescences was observed in silicon-treated plants, averaging 4–6%. The number of inflorescences determined the number and mass of achenes per plant (Table 2).
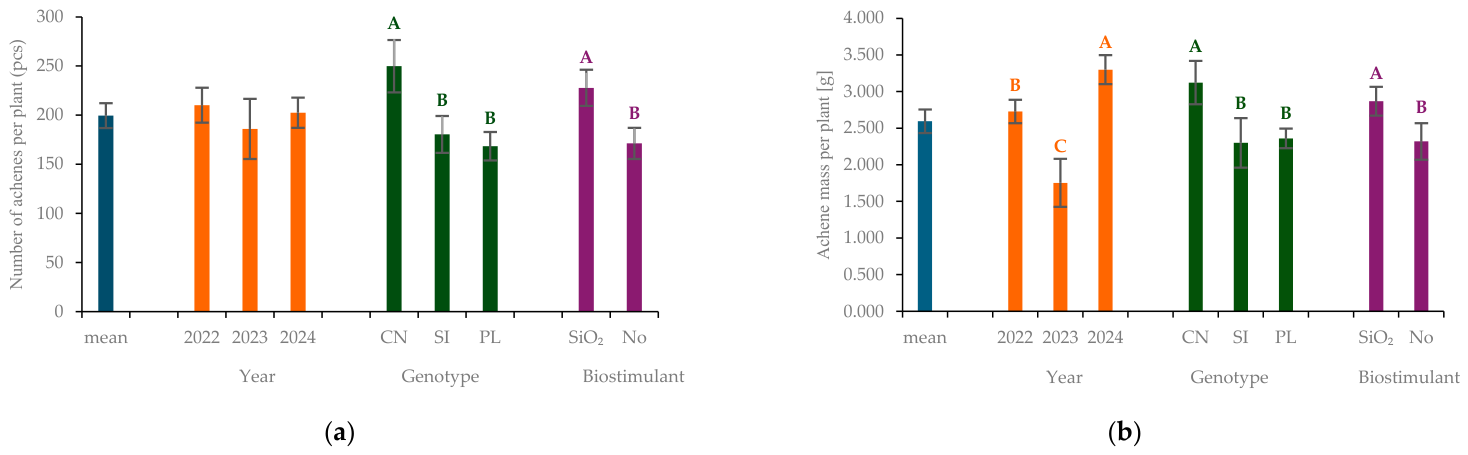
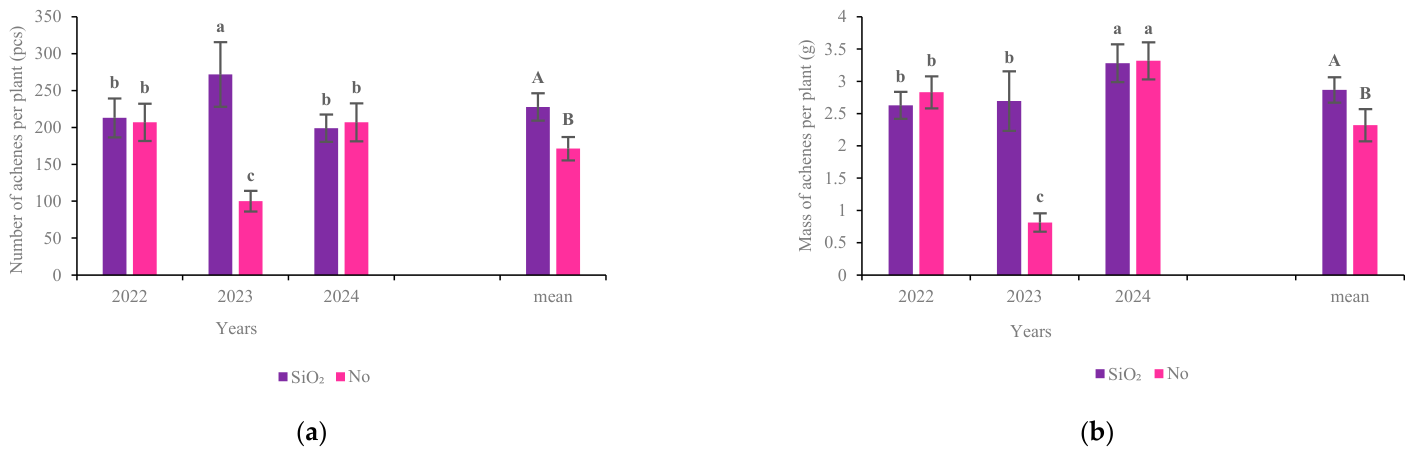
A trend was observed for buckwheat plants to produce slightly more achenes in 2022 and 2024 compared with 2023, when this parameter was approximately 12% lower (Figure 7a). The number of achenes was significantly higher in the CN genotype than in the other two buckwheat accessions, where it was more than 30% lower. The number of achenes per plant increased by more than 30% in response to the silicon biostimulant. Similarly to other biometric parameters, the observed increase resulted from a significant 2.7-fold increase in the number of achenes in silicon-treated plants in 2023 (Figure 8a). No such relationships were noted in the remaining years of the study. The number of first-order branches, the number of inflorescences and the number of seeds per plant were closely correlated with air-dry mass per plant (Table 2).
Achene mass per plant was determined by counting their number and measuring their size. Achene mass per plant was highest in 2024 and slightly lower (by 20%) in 2022, but both values formed one homogeneous group (Figure 7b). Achene mass per plant was lowest in 2023, and it was three times lower than that noted in 2024. The above resulted from a much lower number of achenes and a much lower degree of their filling in 2023. Achene mass per plant was significantly higher in the CN genotype than in the other two genotypes, where this parameter was 35% lower. Silicon had a significant effect on achene mass per plant, and a 24% increase in this parameter was noted in silicon-treated plants. This increase was observed only in 2023, when achene mass per plant was 3.33-fold higher in silicon-treated plants than in untreated plants (Figure 8b).

3.4. Tartary Buckwheat Yield and Crop Quality

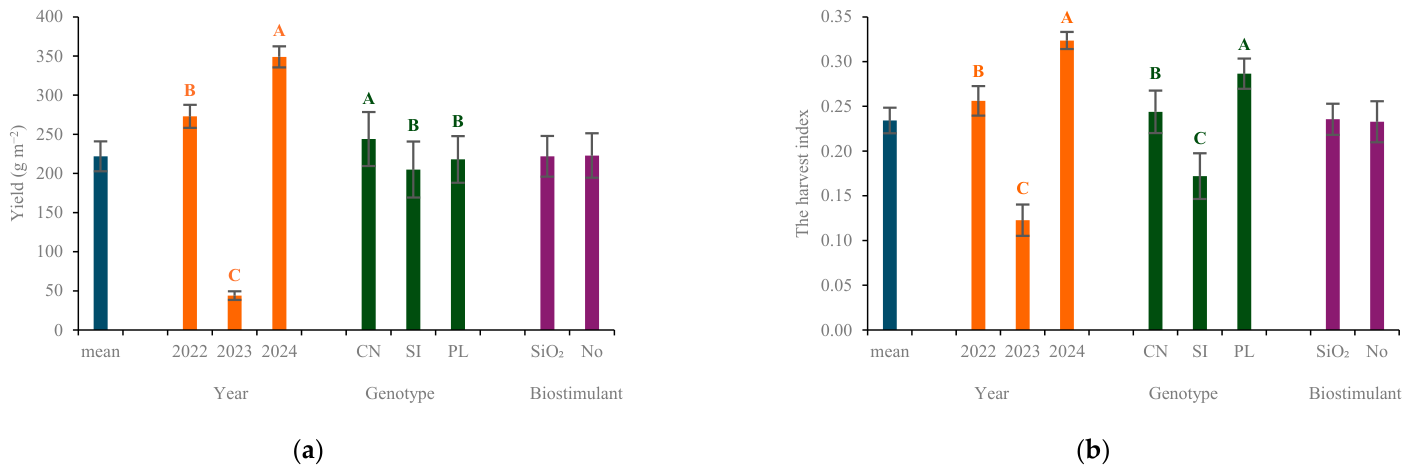
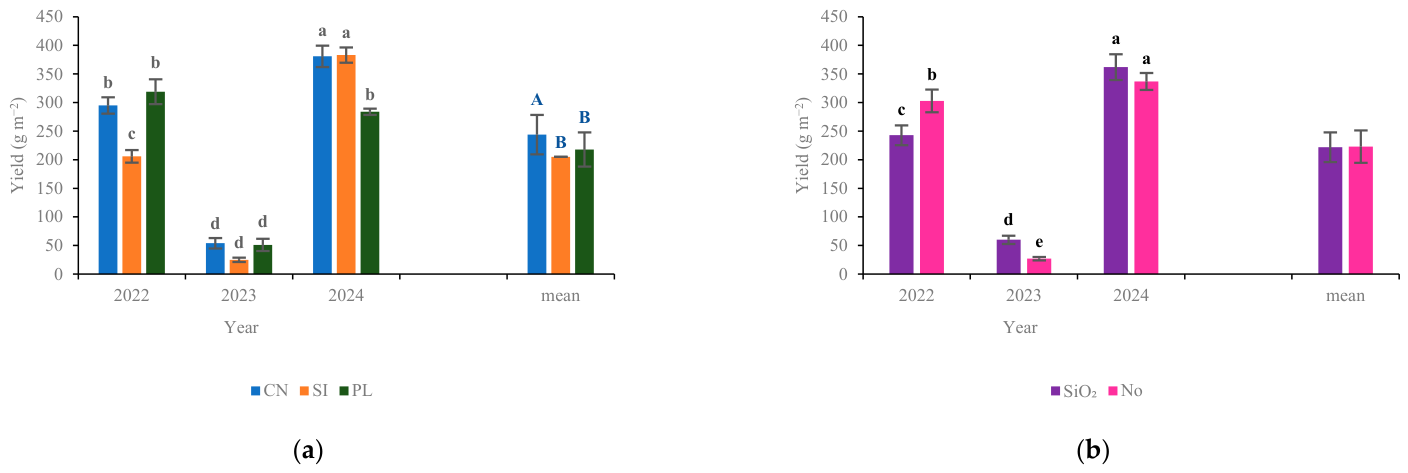
Significant differences in the achene yield of Tartary buckwheat were noted between years of the study. Achene yield was highest in 2024 (349 g m−2), and it was 28% higher than in 2022 (273 g m−2) and eight times higher than in 2023 (44 g m−2) (Figure 9a). Considerable fluctuations in achene yield across years substantially obscured differences in this trait among genotypes. The achene yield of the CN genotype was 12–19% higher than the yields of the other two forms, which did not differ significantly from each other. A tendency toward lower yield was noted in the SI form in 2022 and 2023 and in the weedy PL form in 2024, when the analyzed parameter was around 25% lower relative to the other two genotypes (Figure 10a).
The foliar application of the silicon biostimulant had no significant influence on the average achene yield of Tartary buckwheat. In the critical, dry year of 2023, achene yield tended to increase considerably in all three buckwheat forms in response to silicon application. In 2023, the biostimulant tended to increase achene yield in individual genotypes by approximately 1.8 to 2.6 times (Table S2). However, the observed increase was not significant due to considerable fluctuations in this trait across years (Figure 10b).
During the three-year experiment, the proportion of achene yield in the total biomass yield of Tartary buckwheat was 0.22 on average (Figure 9b). The HI was highest in 2024 and lowest in 2023, and these results were directly related to achene yield in each year. The ratio of achene yield to total biomass yield was highest in the weedy PL form and lowest in the SI genotype of Tartary buckwheat.
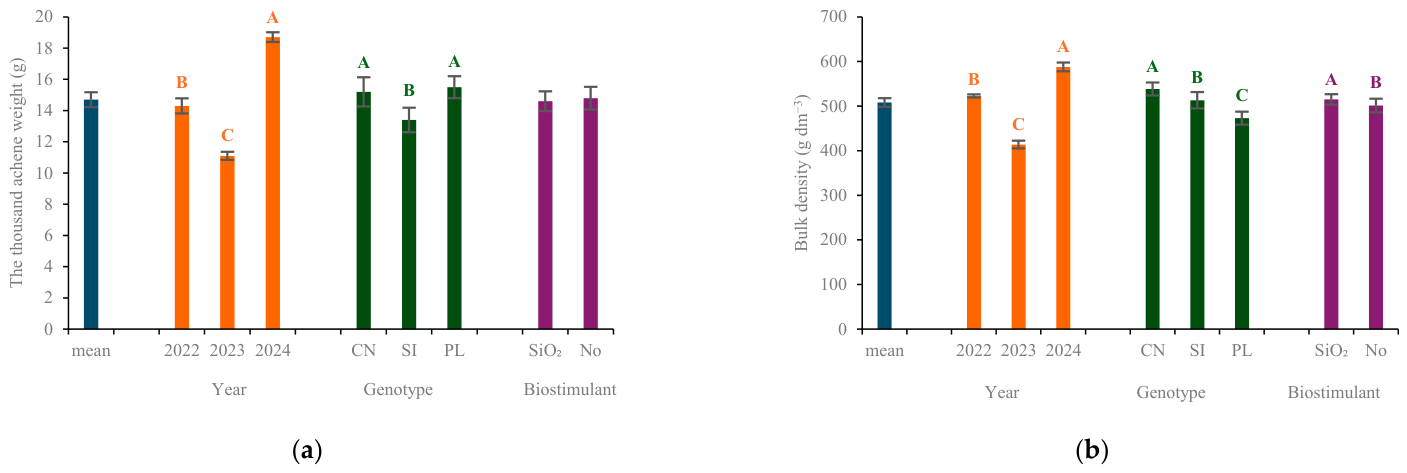
The TAW of Tartary buckwheat differed significantly across years (Figure 11a). This parameter reached its highest value in 2024 and its lowest value in 2023. Significant differences in TAW were also observed between genotypes. This parameter was significantly higher in PL and CN genotypes than in the SI genotype, where it was 13–16% lower. The silicon biostimulant had no significant influence on the TAW of Tartary buckwheat.
The bulk density of Tartary buckwheat achenes also differed across the experimental years (Figure 11b). This parameter reached its highest level in 2024 and its lowest level in 2023. The CN genotype produced achenes with the highest bulk density, and the analyzed parameter was 5% lower in the SI form and more than 12% lower in the weedy PL form. A small but significant (3%) increase in the bulk density of buckwheat achenes was observed in silicon-treated plants compared with untreated plants. This result was attributed to the significant impact of the silicon biostimulant in 2022, when the bulk density of achenes was 12% higher in the treatments where the biostimulant was applied than in the control treatments.
Buckwheat seeds were characterized by high reproductive quality. The average proportion of properly developed seedlings reached 94% after four days and remained at a similar level after seven days. In 2023, the seed germination capacity was significantly lower than in the remaining years of the experiment, during which no significant differences in this parameter were noted (Table 3). The number of germinated seeds was minimally higher in the weedy PL form than in the other two accessions in both the initial and final counts (germination energy and germination capacity). This difference reached only three to four percentage points, but it was statistically significant. Seeds harvested in 2022 were characterized by the shortest MGT. The MGT was 3.3% and 10.8% longer in 2023 and 2024, respectively.
The MGT was longer in the CN genotype than in the other two buckwheat accessions. The silicon biostimulant significantly decreased the MGT of Tartary buckwheat seeds relative to seeds from the control treatments. However, the observed differences were minimal and were estimated at just over one hour.
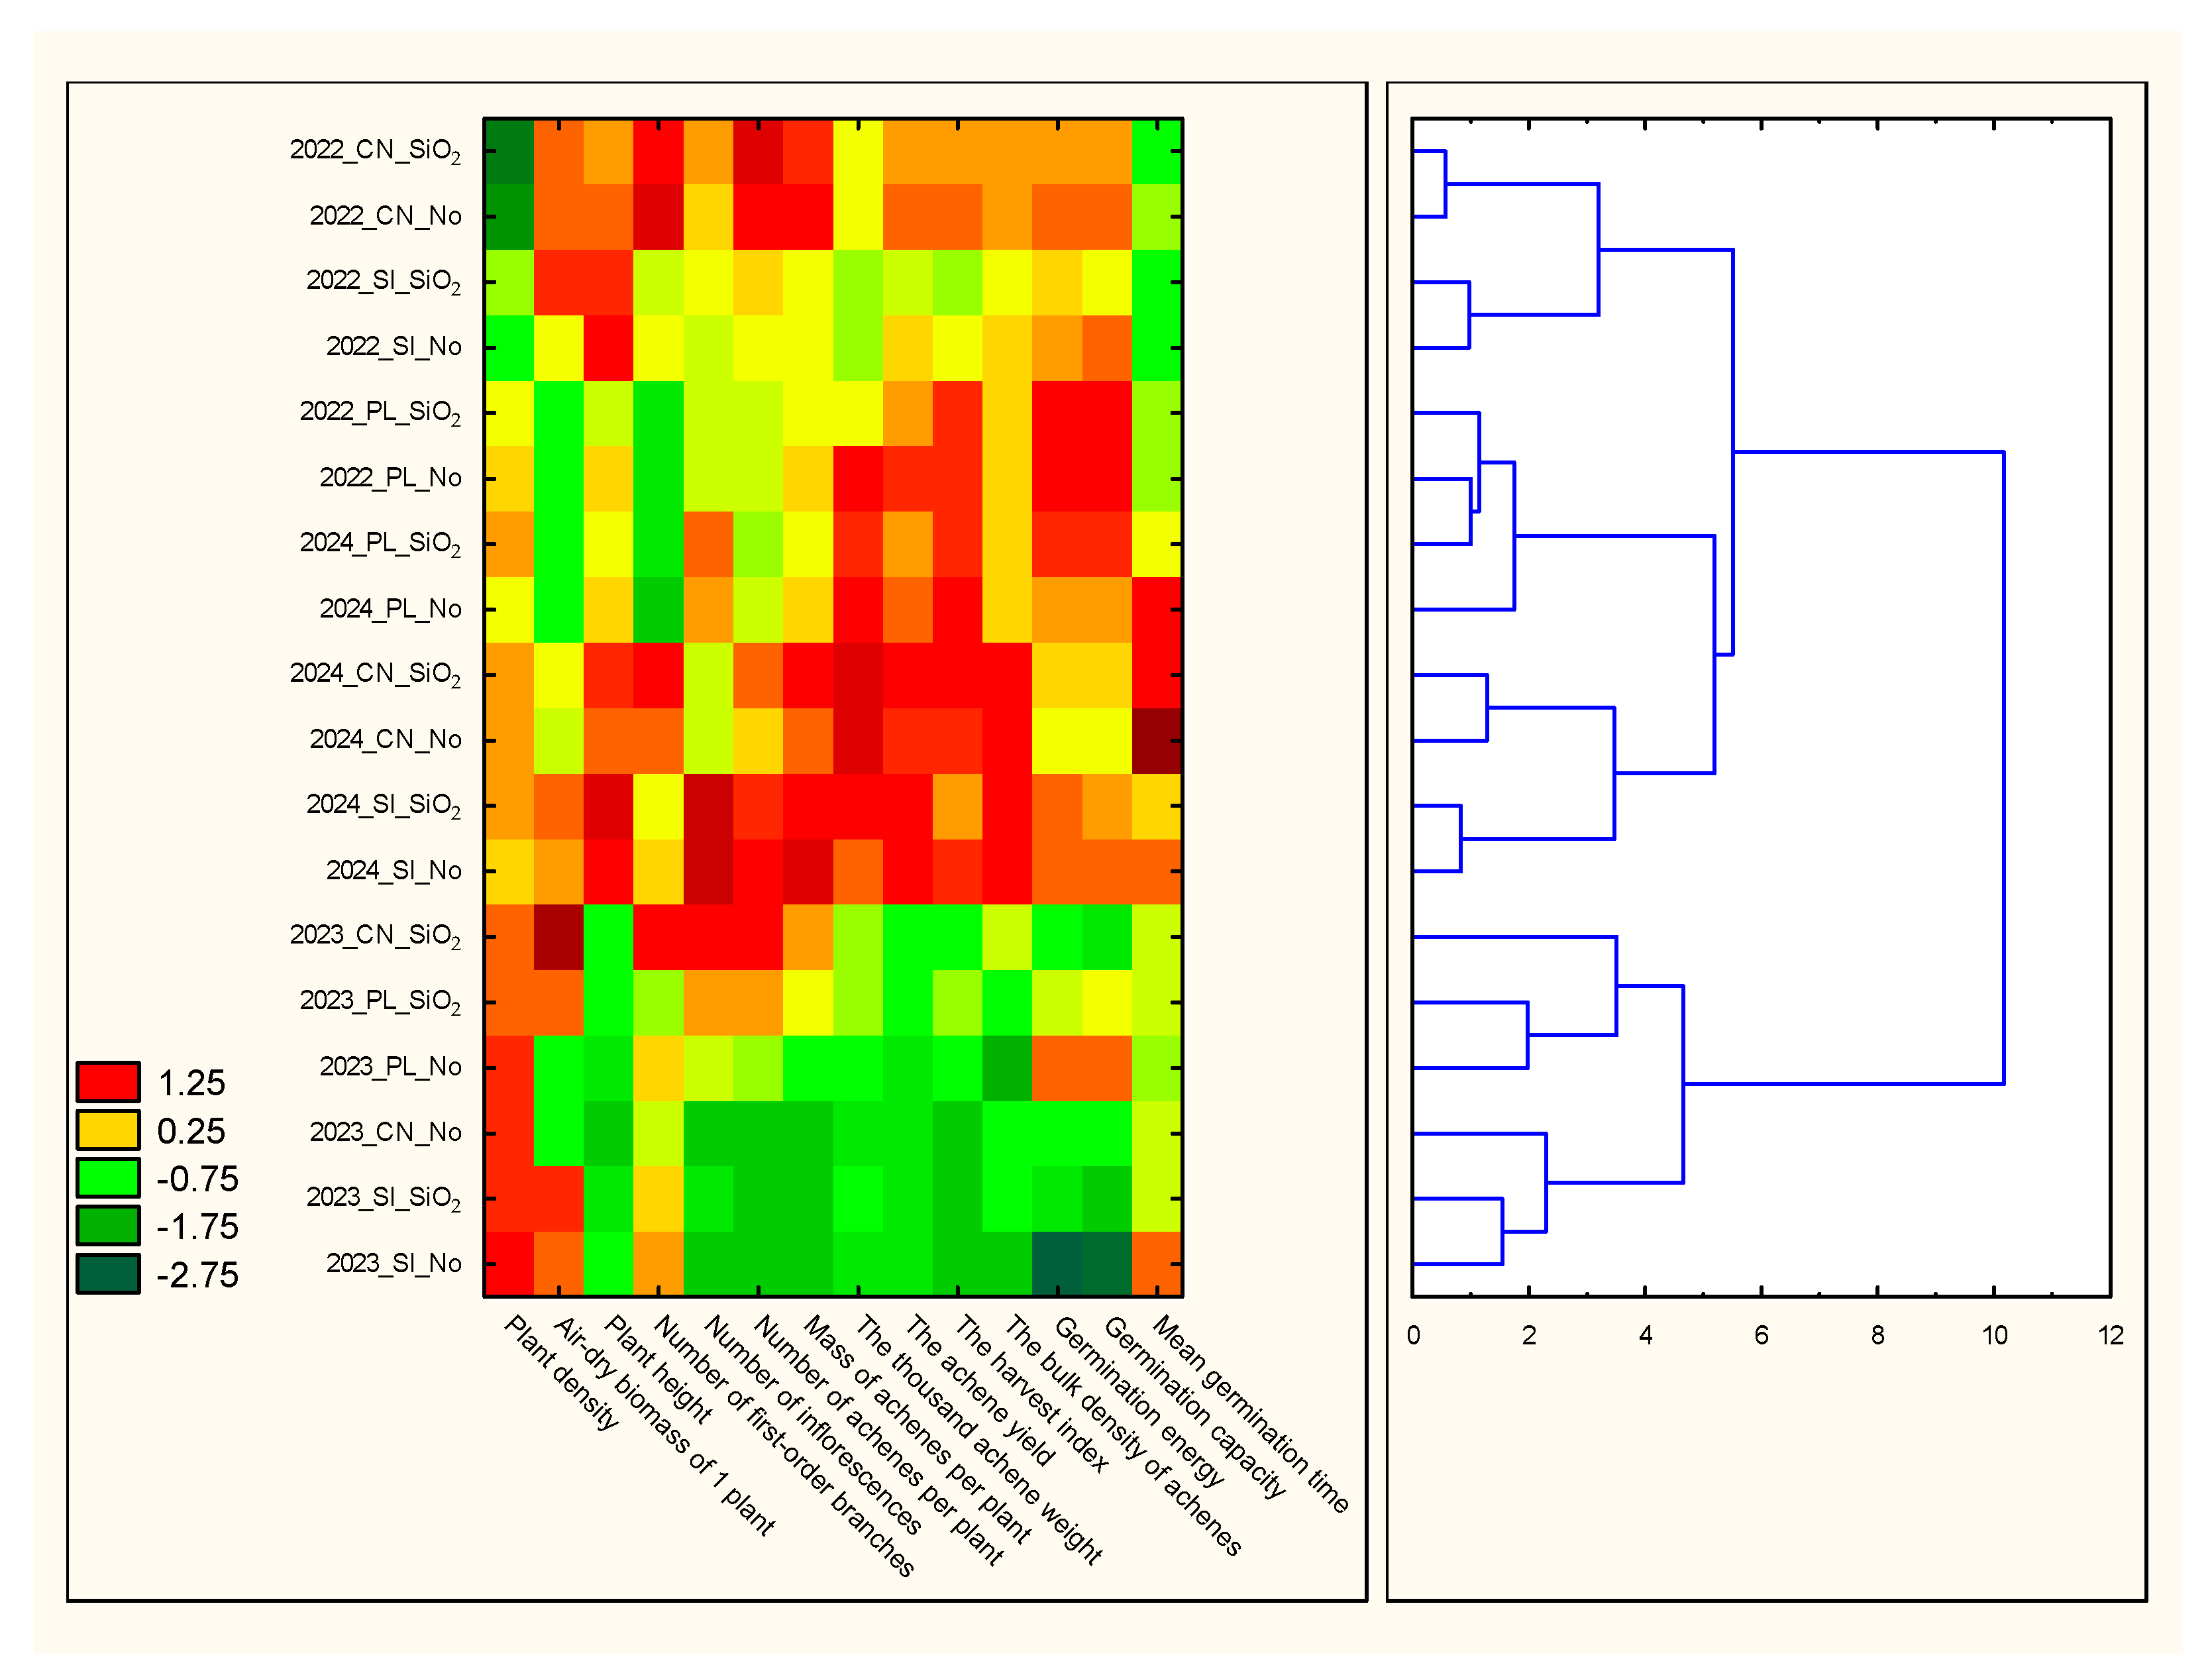
A heatmap and a dendrogram showed that in all treatments, the values of most traits were lower in 2023 than in the other two years of the experiment (Figure 12). The CN and SI genotypes were similar in terms of the studied traits, and clearly distinct from the weedy PL form.

4. Discussion

Germination capacity, defined as the percentage of properly developed seedlings under optimal conditions, is one of the many physiological traits that determine seed quality [63,64]. The high sowing value of Tartary buckwheat seeds (97–98%) sown each year of the experiment, the adjusted seeding rate, and a detailed analysis of weather conditions indicate that the low seedling emergence in 2022 was caused by unfavorable rainfall distribution patterns in the periods preceding and following the sowing date (water deficit). In 2022, only 3 mm of rain fell during the two weeks before sowing, and a mere 4.3 mm during the two weeks after sowing. During the same period in 2023, the respective values were 13.6 mm and 10 mm. The latter value represented the total precipitation in May 2023; however, rainfall occurred shortly after sowing. Combined with the previously moist soil, this resulted in very high plant density. In turn, in 2022, no rainfall was recorded until May 21, and the soil moisture level was not sufficient for achieving and maintaining high plant density.
The degree of plant branching was not significantly affected by differences in plant density, which can probably be attributed to wide row spacing that promoted the development of densely growing plants in a row (Table 2). In a study by Xiang et al. [65], an increase in the planting density of Tartary buckwheat from 60 to 150 plants m−2 was negatively correlated with the number and diameter of first-order branches and the seed setting rate, but positively correlated with branch length and the seed abortion rate. Similar to the observations made by Xiang et al. [65], Zhou et al. [66] found a negative correlation between plant density and height, the number of internodes, and the number of branches on the main shoot in Tartary buckwheat.
The number of branches is a key determinant of buckwheat yield. In this crop species, achenes are set mostly on branches, which are characterized by a higher seed-setting rate than the main stem [67,68]. Water deficit during the growing season can decrease plant height, stem diameter, the number of branches and internode length, and the number and mass of seeds per plant [69]. In the present study, water shortage was probably responsible for the low values of plant height, the number of inflorescences, the number of achenes per plant, and air-dry biomass per plant in 2023 (Figure 3a,b, Figure 5b and Figure 7a,b).
In this study, the silicon biostimulant influenced the air-dry biomass of buckwheat plants without affecting their size or growth habit (Figure 3a,b and Figure 5a). Azad et al. [70] found that a silicon biostimulant enhanced the growth characteristics of Tartary buckwheat, including plant height, the number and length of branches, and dry biomass, in a dose-dependent manner. In another study, only a low dose of the biostimulant had a positive effect on the height of Tartary buckwheat plants; only high doses of silicon increased the number of branches, and medium doses significantly decreased this trait, while the length of branches increased significantly at all doses of the biostimulant [70]. The increase in buckwheat plant biomass following silicon application may be due to improved net photosynthetic rates, particularly under water-deficit conditions [71]. Genotype-specific responses to foliar-applied silicon in common buckwheat have recently been reported by Krucky et al. [71]. The cited authors demonstrated that silicon improved antioxidant defenses and mitigated drought-induced oxidative stress.
In the current experiment, a significant, positive correlation was found between the number of inflorescences per plant and the number and mass of achenes per plant (Table 2). The same relationship was found in common buckwheat [72]. The percentage of seed and fruit set in common buckwheat is very low, which is related to, among other things, the biology of its pollination and fertilization [73]. However, the results of Xiang et al. [67] indicate that despite the different reproductive biology, the seed-setting rate in Tartary buckwheat is only 23–32% (depending on year and cultivar). Tartary buckwheat has a higher seed-setting rate than common buckwheat [72], but these observations indicate that seed setting is influenced by other external factors (light access, temperature, water and nutrient availability) [74].
The number of achenes per plant and TAW are the key yield components in Tartary buckwheat [75]. In the present study, the silicon biostimulant significantly increased the number of achenes per plant (Figure 7a). The beneficial effect of silicon on the reproductive traits of Tartary buckwheat, such as the number of inflorescences and the number and weight of seeds per plant, was evident primarily in the dry year of 2023 (Figure 6 and Figure 8a,b). Azad et al. [70] and She et al. [76] showed an increase in the number of seeds per plant in common buckwheat with increasing silicon doses. In the case of Tartary buckwheat, only a low silicon dose increased the number of seeds per plant [70]. She et al. [76] also demonstrated an increase in the thousand-seed weight of common buckwheat only in response to medium silicon doses. The present study revealed significant variation in the TAW of Tartary buckwheat across years, indicating a significant effect of weather conditions on this trait (Figure 11a).
According to Zhang et al. [77], the main meteorological factors limiting achene yield in Tartary buckwheat include an insufficient number of sunshine hours and low precipitation, followed by low temperature during the flowering and fruiting stage (low mean daily temperature and a higher number of days with a temperature of ≤15 °C). Most photoassimilates are transported to seeds during fruiting and achene filling [78], which significantly affects yield. Achene mass increases rapidly at the onset of the filling stage, after which the rate of increase declines [79]. Mean temperature and precipitation during fruiting and filling are the key meteorological factors that influence the mass of Tartary buckwheat achenes [77], which was confirmed in the current study.
In the present field experiment, Tartary buckwheat plants harvested in the dry season of 2023 were characterized by a significant reduction in height but maintained high air-dry biomass (Figure 3a,b), which partially corroborates the result of greenhouse experiments conducted by Aubert et al. [41,42]. The cited authors found that although seed setting in Tartary buckwheat was maintained under controlled water stress conditions, the number of seeds per plant was significantly reduced [41,42]. This is only partially consistent with the results of the present field experiment, in which only a tendency toward a reduction in the number of achenes per plant was observed, but their filling significantly decreased (a significant reduction in achene mass per plant and TAW) (Figure 7a,b and Figure 11a). Aubert et al. [41] compared the effects of drought stress and high temperatures on 12 different Tartary buckwheat genotypes and found that plants were discriminated to a greater extent by environmental conditions than by variety, which was also observed in the present study.
Hossain et al. [80] demonstrated that increased drought stress in Tartary buckwheat plants resulted in increased activity of SOD, POD, and CAT enzymes, as well as in increased concentrations of secondary metabolites. The authors evaluated 14 genotypes of F. tataricum and reported significant variation in their stress responses. This variation can be assessed at the germination stage, thus identifying the most tolerant genotypes for future breeding programs. The key metabolic differences between tolerant and sensitive types of Tartary buckwheat lie in the efficient activation of flavonoid and phenylpropanoid biosynthesis pathways, and the precise regulation of starch and sucrose metabolism.
In the dry year of 2023, the actual harvested achene yield of Tartary buckwheat was considerably lower than expected based on yield components (plant density, number of seeds per plant, TAW). Such pronounced differences were not observed in the other years of the study. This may suggest slightly higher yield losses in the dry year of 2023 due to seed shedding during combine harvesting. A similar trend was observed for common buckwheat in a study by Liszewski [81]. According to some researchers, seed shattering poses a greater problem in Tartary buckwheat than in common buckwheat [82].
Raihan et al. [83] found that plant growth, including height, fresh weight, and dry weight, was significantly reduced in drought-stressed common buckwheat. Silicon supplementation significantly mitigated these reductions. This aligns with the present finding.
Silicon addition enhanced biomass and seed yield to levels comparable with those noted in adequately watered common buckwheat plants [84], which is consistent with the results of this study.
In the current experiment, the foliar application of the silicon biostimulant induced a significant increase in the bulk density of achenes and a significant decrease in the MGT (Figure 11b; Table 3). However, in the dry year of 2023, a two-fold increase in yield and the HI was also observed, along with an increase in the TAW in treatments with the silicon biostimulant (Figure 10b). There is evidence to indicate that silicon-based biostimulants enhance yield in other crops, including wheat [85]. In the present study, no significant changes were found in the germination rate of Tartary buckwheat seeds obtained from silicon-treated plants, compared with the control treatments (Table 3). Only a reduction in the MGT of buckwheat seeds was observed. According to the literature, silicon promotes seed germination and seedling establishment by increasing biomass accumulation [86]. However, no such data are available for seeds of Tartary buckwheat plants treated with silicon biostimulants.
The silicon biostimulant had the most beneficial effect on plant development, and achene setting and filling in the dry year of 2023 (Figure 4 and Figure 8a,b). This could be a consequence of the physical role of silicon in lowering transpiration. Silicon absorbed by plants may deposit in the form of SiO2 on the leaf apoplast, leading to a lower evapotranspiration rate and osmotic stress [87]. This observation should be verified in future studies. At the physiological and biochemical levels, silicon increases nutrient uptake and modifies gas exchange attributes, leading to an increase in the photosynthetic rate [88]. The use of foliar silicon in common buckwheat improved physiological parameters and plant resistance to drought conditions. However, the response of common buckwheat to water stress, including changes in physiological activity, stress responses, and the involvement of defense mechanisms, as well as the utilization of silicon’s potential to mitigate the negative impact of drought stress, is cultivar-specific [71,89]. Further analyses are needed to determine the impact of silicon on plant physiology, including photosynthesis and the photochemical efficiency of photosystem II, plant growth and development, yield and seed reproductive quality, and to test soil-applied silicon in multi-site trials involving Tartary buckwheat.

5. Conclusions

Silicon applied to three genotypes of Tartary buckwheat induced an increase in the air-dry mass of plants, an increase in the number of inflorescences and fruits per plant, an increase in the bulk density of achenes, and a reduction in the MGT of a single seed. The main factors that strongly differentiated the plant characteristics and yield of Tartary buckwheat were weather conditions across years of the study and Tartary buckwheat genotypes. Based on the results of this study, foliar silicon application can be recommended under dry conditions, when silicon exerts the greatest beneficial effect on plant development, as well as on achene setting and filling.

Supplementary Materials

The following supporting information can be downloaded at: https://www.mdpi.com/article/10.3390/agronomy16141384/s1, Table S1: F statistics of the studied traits from analysis of variance; Table S2: Achene yield of Tartary buckwheat in 2023 (g m−2)—genotype × biostimulant interaction.

Author Contributions

Conceptualization, J.K.; methodology, J.K.; software, J.K.; validation, J.K.; formal analysis, J.K.; investigation, J.K.; resources, J.K. and M.G.; data curation, J.K.; writing—original draft preparation, J.K.; writing—review and editing, J.K. and M.G.; visualization, J.K. and M.G.; supervision, J.K. and M.G.; project administration, J.K.; funding acquisition, J.K. and M.G. All authors have read and agreed to the published version of the manuscript.

Funding

The results presented in this paper were obtained as part of a comprehensive study financed by the University of Warmia and Mazury in Olsztyn, Faculty of Agriculture and Forestry, Department of Plant Breeding and Bioresource Engineering, grant No. 30.610.007-110. The project was financially supported by the Minister of Science as part of the “Regional Initiative of Excellence Program”, RID/SP/0025/2024/01. This research was funded by the Slovenian Research and Innovation Agency, the program P1-0212 “Biology of Plants”.

Data Availability Statement

The original contributions presented in this study are included in the article. Further inquiries can be directed to the corresponding author.

Acknowledgments

We would like to thank the staff of the Department of Plant Breeding and Bioresource Engineering for their technical support during the experiment. The authors thank the anonymous reviewers for valuable comments on an earlier draft of the manuscript.

Conflicts of Interest

The authors declare no conflicts of interest.

References

  1. Fawcett, J.A.; Takeshima, R.; Kikuchi, S.; Yazaki, E.; Katsube-Tanaka, T.; Dong, Y.; Li, M.; Hunt, H.V.; Jones, M.K.; Lister, D.L.; et al. Genome sequencing reveals the genetic architecture of heterostyly and domestication history of common buckwheat. Nat. Plants 2023, 9, 1236–1251. [Google Scholar] [CrossRef] [PubMed]
  2. FAOSTAT. 2025. Available online: http://www.fao.org/faostat/en/#home (accessed on 12 April 2025).
  3. Campbell, C.G. Buckwheat: Fagopyrum esculentum Moench; Promoting the Conservation and Use of Underutilized and Neglected Crops. No. 19; Institute of Plant Genetics and Crop Plant Research: Rome, Italy; Gatersleben/International Plant Genetic Resources Institute: Rome, Italy, 1997; ISBN 92-9043-345-0. [Google Scholar]
  4. Campbell, C.G. Buckwheat crop improvement. Fagopyrum 2003, 20, 1–6. [Google Scholar]
  5. Small, E. 54. Buckwheat—The world’s most biodiversity-friendly crop? Biodiversity 2017, 18, 108–123. [Google Scholar] [CrossRef]
  6. Babu, S.; Yadav, G.S.; Singh, R.; Avasthe, R.K.; Das, A.; Mohapatra, K.P. Production technology and multifarious uses of buckwheat (Fagopyrum spp.): A review. Indian J. Agron. 2018, 63, 415–427. [Google Scholar]
  7. Zhang, K.; He, M.; Fan, Y.; Zhao, H.; Gao, B.; Yang, K.; Li, F.; Tang, Y.; Gao, Q.; Lin, T.; et al. Resequencing of global Tartary buckwheat accessions reveals multiple domestication events and key loci associated with agronomic traits. Genome Biol. 2021, 22, 23. [Google Scholar] [CrossRef] [PubMed]
  8. Kreft, I.; Golob, A.; Vombergar, B.; Germ, M. Tartary Buckwheat Grain as a Source of Bioactive Compounds in Husked Groats. Plants 2023, 12, 1122. [Google Scholar] [CrossRef] [PubMed]
  9. Kuczuk, A. Cumulative energy intensity and energy account in cultivation of buckwheat (Fagopyrum esculentum Moench). J. Res. Appl. Agric. Eng. 2016, 61, 6–14. [Google Scholar]
  10. Żarczyński, P.J.; Mackiewicz-Walec, E.; Krzebietke, S.J.; Sienkiewicz, S.; Hlinková, S.; Żarczyńska, K. Common Buckwheat (Fagopyrum esculentum Mill.) as a Support for Sustainable Agriculture. Sustainability 2026, 18, 2823. [Google Scholar] [CrossRef]
  11. Halbrecq, B.; Romedenne, P.; Ledent, J.F. Evolution of flowering. ripening and seed set in buckwheat (Fagopyrum esculentum Moench): Quantitative analysis. Eur. J. Agron. 2005, 23, 209–224. [Google Scholar] [CrossRef]
  12. Björkman, T. Role of honey bees (Hymenoptera: Apidae) in the pollination of buckwheat in eastern north America. J. Econ. Entomol. 1995, 88, 1739–1745. [Google Scholar] [CrossRef][Green Version]
  13. Björkman, T. The effect of pollen load and pollen grain competition on fertilization success and progeny performance in Fagopyrum esculentum. Euphytica 1995, 83, 47–52. [Google Scholar] [CrossRef]
  14. Björkman, T. The effectiveness of heterostyly in preventing illegitimate pollination in dish-shaped flowers. Sex. Plant Reprod. 1995, 8, 143–146. [Google Scholar] [CrossRef]
  15. Wang, Y.; Scarth, R.; Campbell, C. Interspecific hybridization between diploid Fagopyrum esculentum and tetraploid F. homotropicum. Can. J. Plant Sci. 2005, 85, 41–48. [Google Scholar] [CrossRef]
  16. Płażek, A.; Słomka, A.; Kopeć, P.; Dziurka, M.; Hornyák, M.; Sychta, K.; Pastuszak, J.; Dubert, F. Effects of High Temperature on Embryological Development and Hormone Profile in Flowers and Leaves of Common Buckwheat (Fagopyrum esculentum Moench). Int. J. Mol. Sci. 2019, 20, 1705. [Google Scholar] [CrossRef] [PubMed]
  17. Yao, Y.; Zhao, H.; Sun, L.; Wu, W.; Li, C.; Wu, Q. Genome-wide identification of MAPK gene family members in Fagopyrum tataricum and their expression during development and stress responses. BMC Genom. 2022, 23, 96. [Google Scholar] [CrossRef] [PubMed]
  18. Wu, L.-Y.; Wang, B.; Schoen, D.J.; Huang, S.-Q. Transitions from Distyly to Homostyly Are Associated with Floral Evolution in the Buckwheat Genus (Fagopyrum). Am. J. Bot. 2017, 104, 1232–1240. [Google Scholar] [CrossRef] [PubMed]
  19. Aubert, L.; Decamps, C.; Jacquemin, G.; Quinet, M. Comparison of Plant Morphology. Yield and Nutritional Quality of Fagopyrum esculentum and Fagopyrum tataricum Grown under Field Conditions in Belgium. Plants 2021, 10, 258. [Google Scholar] [CrossRef] [PubMed]
  20. Tsuji, K.; Ohnishi, O. Phylogenetic relationships among wild and cultivated tartary buckwheat (Fagopyrum tataricum Gaert.) populations revealed by AFLP analyses. Genes Genet. Syst. 2001, 76, 47–52. [Google Scholar] [CrossRef]
  21. Bhinder, S.; Singh, B.; Kaur, A.; Singh, N.; Kaur, M.; Kumari, S.; Yadav, M.P. Effect of infrared roasting on antioxidant activity. phenolic composition and Maillard reaction products of Tartary buckwheat varieties. Food Chem. 2019, 285, 240–251. [Google Scholar] [CrossRef] [PubMed]
  22. Bhinder, S.; Kaur, A.; Singh, B.; Yadav, M.P.; Singh, N. Proximate Composition. Amino Acid Profile. Pasting and Process Characteristics of Flour from Different Tartary Buckwheat Varieties. Food Res. Int. 2020, 130, 108946. [Google Scholar] [CrossRef] [PubMed]
  23. Zou, L.; Wu, D.; Ren, G.; Hu, Y.; Peng, L.; Zhao, J.; Garcia-Perez, P.; Carpena, M.; Prieto, M.A.; Cao, H.; et al. Bioactive Compounds. Health Benefits. and Industrial Applications of Tartary Buckwheat (Fagopyrum tataricum). Crit. Rev. Food Sci. Nutr. 2021, 63, 657–673. [Google Scholar] [CrossRef] [PubMed]
  24. Vogrinčič, M.; Žegura, B. Antigenotoxic Effects of Tartary and Common Buckwheat Extracts, Rutin, and Quercetin on DNA Damage Induced by the Dietary Mutagen Acrylamide. Fagopyrum 2025, 42, 41–47. [Google Scholar] [CrossRef]
  25. Ruan, J.; Zhou, Y.; Yan, J.; Zhou, M.; Woo, S.-H.; Weng, W.; Cheng, J.; Zhang, K. Tartary Buckwheat: An Under-Utilized Edible and Medicinal Herb for Food and Nutritional Security. Food Rev. Int. 2020, 38, 440–454. [Google Scholar] [CrossRef]
  26. Kwiatkowski, J.; Kłodawska, K. Prospects for Growing and Using Tartary Buckwheat in Poland; European Regional IBRA Meeting: Euro Ibra 2015: Buckwheat in Europe: History, Culture, Gastronomy and Nutrition; Book of Abstracts; National Museum of Natural History: Luxemburg, 2015; p. 42. [Google Scholar]
  27. Li, J.; Feng, S.; Qu, Y.; Gong, X.; Luo, Y.; Yang, Q.; Zhang, Y.; Dang, K.; Gao, X.; Feng, B. Identifying the primary meteorological factors affecting the growth and development of Tartary buckwheat and a comprehensive landrace evaluation using a multi-environment phenotypic investigation. J. Sci. Food Agric. 2021, 101, 6104–6116. [Google Scholar] [CrossRef] [PubMed]
  28. Singh, V.; Rana, A.; Kapoor, S.; Sood, R.; Kumari, S.; Sharma, S.; Kumar, N.; Singh, I.P. Multi-environment evaluation and identification of Tartary buckwheat (Fagopyrum tataricum Gaertn.) genotypes for superior agronomic and nutritional potential in the North-Western Himalayas. Sci. Rep. 2025, 15, 30900. [Google Scholar] [CrossRef] [PubMed]
  29. Luna, B.; Chamorro, D. Germination Sensitivity to Water Stress of Eight Cistaceae Species from the Western Mediterranean. Seed Sci. Res. 2016, 26, 101–110. [Google Scholar] [CrossRef]
  30. Ramírez-Tobías, H.M.; Peña-Valdivia, C.B.; Trejo, C.; Aguirre, R.J.R.; Vaquera, H.H. Seed Germination of Agave Species as Influenced by Substrate Water Potential. Biol. Res. 2014, 47, 11. [Google Scholar] [CrossRef] [PubMed]
  31. Yongliang, B.; Meiguo, X.; Roumin, L.; Weijun, H.; Shuyan, H.; Rong, Z.; Yiping, G. Metabolomics and water migration analysis provides valuable insights into nutrient generation in Tartary buckwheat (Fagopyrum tataricum) seed germination. Food Agric. Immunol. 2022, 33, 692–708. [Google Scholar] [CrossRef]
  32. Zamaratskaia, G.; Gerhardt, K.; Knicky, M.; Wendin, K. Buckwheat: An underutilized crop with attractive sensory qualities and health benefits. Crit. Rev. Food Sci. Nutr. 2023, 64, 12303–12318. [Google Scholar] [CrossRef] [PubMed]
  33. Virili, A.; Petris, R.; Miceli, F. Late summer sowing positively affects yield of lowland buckwheat in Northeastern Italy. Ital. J. Agron. 2024, 19, 100022. [Google Scholar] [CrossRef]
  34. Luthar, Z.; Golob, A.; Germ, M.; Vombergar, B.; Kreft, I. Tartary Buckwheat in Human Nutrition. Plants 2021, 10, 700. [Google Scholar] [CrossRef] [PubMed]
  35. Zheng, C.; Hu, C.; Ma, X.; Peng, C.; Zhang, H.; Qin, L. Cytotoxic phenylpropanoid glycosides from Fagopyrum tataricum (L.) Gaertn. Food Chem. 2011, 132, 433–438. [Google Scholar] [CrossRef] [PubMed]
  36. Dražić, S.; Glamočlija, D.; Ristić, M.; Dolijanović, Ž; Drazić, M.; Pavlović, S.; Jaramaz, M.; Jaramaz, D. Effect of environment of the rutin content in leaves of Fagopyrum esculentum Moench. Plant Soil Environ. 2016, 62, 261–265. [Google Scholar] [CrossRef]
  37. Lim, J.-H.; Park, K.-J.; Kim, B.-K.; Jeong, J.-W.; Kim, H.-J. Effect of salinity stress on phenolic compounds and carotenoids in buckwheat (Fagopyrum esculentum M.) sprout. Food Chem. 2012, 135, 1065–1070. [Google Scholar] [CrossRef] [PubMed]
  38. Yao, X.; Zhou, M.; Ruan, J.; Peng, Y.; Yang, H.; Tang, Y.; Gao, A.; Cheng, J. Pretreatment with H2O2 Alleviates the Negative Impacts of NaCl Stress on Seed Germination of Tartary Buckwheat (Fagopyrum tataricum). Plants 2021, 10, 1784. [Google Scholar] [CrossRef] [PubMed]
  39. Zou, X.; Zhang, J.; Cheng, T.; Guo, Y.; Han, X.; Liu, H.; Qin, Y.; Li, J.; Xiang, D. Preparation of Tartary buckwheat seed coating agent and its effect on germination. Phyton-Int. J. Exp. Bot. 2024, 93, 699–712. [Google Scholar] [CrossRef]
  40. Aubert, L.; Konrádová, D.; Kebbas, S.; Barris, S.; Quinet, M. Comparison of high temperature resistance in two buckwheat species Fagopyrum esculentum and Fagopyrum tataricum. J. Plant Physiol. 2020, 251, 153222. [Google Scholar] [CrossRef] [PubMed]
  41. Aubert, L.; Quinet, M. Comparison of heat and drought stress responses among twelve Tartary buckwheat (Fagopyrum tataricum) varieties. Plants 2022, 11, 1517. [Google Scholar] [CrossRef] [PubMed]
  42. Aubert, L.; Konrádová, D.; Barris, S.; Quinet, M. Different drought resistance mechanisms between two buckwheat species Fagopyrum esculentum and Fagopyrum tataricum. Physiol. Plant. 2021, 172, 577–586. [Google Scholar] [CrossRef] [PubMed]
  43. Yuan, H.; Wang, Q.; Qi, A.; Li, S.; Hu, Y.; Hu, Z.; Guo, L.; Liang, C.; Li, W.; Liu, C.; et al. Morphological, Physiological, and Photosynthetic Differences of Tartary Buckwheat Induced by Post-Anthesis Drought. Plants 2024, 13, 2161. [Google Scholar] [CrossRef] [PubMed]
  44. Di Sario, L.; Boeri, P.; Matus, J.T.; Pizzio, G.A. Plant Biostimulants to Enhance Abiotic Stress Resilience in Crops. Int. J. Mol. Sci. 2025, 26, 1129. [Google Scholar] [CrossRef] [PubMed]
  45. Goyal, T.; Kumar, D.; Gaurav, A.K.; Mukherjee, A.; Chouhan, G.K.; Verma, J.P. Experiment tools used as a biostimulant for sustainable crop plants improvement and practices. In Agricultural Crop Improvement: Plant and Soil Relationships, 1st ed.; Husen, A., Ed.; CRC Press: Boca Raton, FL, USA, 2025; pp. 283–300. ISBN 9781032630366. [Google Scholar] [CrossRef]
  46. Zargar, S.M.; Mahajan, R.; Bhat, J.A.; Nazir, M.; Deshmukh, R. Role of silicon in plant stress tolerance: Opportunities to achieve a sustainable cropping system. 3 Biotech 2019, 9, 73. [Google Scholar] [CrossRef] [PubMed]
  47. Ma, J.F. Role of silicon in enhancing the resistance of plants to biotic and abiotic stresses. Soil Sci. Plant Nutr. 2004, 50, 11–18. [Google Scholar] [CrossRef]
  48. Helaly, M.N.; El-Hoseiny, H.; El-Sheery, N.I.; Rastogi, A.; Kalaji, H.M. Regulation and physiological role of silicon in alleviating drought stress of mango. Plant Physiol. Biochem. 2017, 118, 31–44. [Google Scholar] [CrossRef] [PubMed]
  49. Sun, Y.; Xu, J.; Miao, X.; Lin, X.; Liu, W.; Ren, H. Effects of exogenous silicon on maize seed germination and seedling growth. Sci. Rep. 2021, 11, 1014. [Google Scholar] [CrossRef] [PubMed]
  50. Ahmed, S.R.; Anwar, Z.; Shahbaz, U.; Skalicky, M.; Ijaz, A.; Tariq, M.S.; Zulfiqar, U.; Brestic, M.; Alabdallah, N.M.; Alsubeie, M.S.; et al. Potential Role of Silicon in Plants Against Biotic and Abiotic Stresses. Silicon 2023, 15, 3283–3303. [Google Scholar] [CrossRef]
  51. Ali, A.M.; Bijay-Singh. Silicon: A crucial element for enhancing plant resilience in challenging environments. J. Plant Nutr. 2024, 48, 486–521. [Google Scholar] [CrossRef]
  52. Raihan, M.R.H.; Antala, M.; Stróżecki, M.; Haque, M.I.; Hasanuzzaman, M.; Juszczak, R.; Rastogi, A. Silicon-induced photosynthetic adaptations in common buckwheat under salt stress revealed by prompt chlorophyll a fluorescence analysis. Sci. Rep. 2025, 15, 19343. [Google Scholar] [CrossRef] [PubMed]
  53. Hua, C.; Jianjun, W.; Jianhong, R.; Fugang, W. Effects of silicon fertilizer treatment on buckwheat seedling drought resistance. Chin. Agric. Sci. Bull. 2015, 31, 40–44. [Google Scholar] [CrossRef]
  54. Qi, A.; Yan, X.; Liu, Y.; Zeng, Q.; Yuan, H.; Huang, H.; Wan, Y. Silicon Mitigates Aluminum Toxicity of Tartary Buckwheat by Regulating Antioxidant Systems. Phyton-Int. J. Exp. Bot. 2024, 93, 1–13. [Google Scholar] [CrossRef]
  55. Germ, M.; Golob, A.; Vogel Mikuš, K.; Likar, M.; Mravlje, J.; Pongrac, P.; Mavrič Čermelj, A.; Park, C.H.; Park, M.O.; Kwiatkowski, J.; et al. The potential of Si and Se as biostimulants to enhance resistance to climatic conditions and improve yields in common and Tartary buckwheat. Fagopyrum 2025, 42, 19–28. [Google Scholar] [CrossRef]
  56. International Seed Testing Association. International Rules for Seed Testing; International Seed Testing Association: Wallisellen, Switzerland, 2023. [Google Scholar]
  57. Selyaninov, G.T. About climate agricultural estimation. Proc. Agric. Meteorol. 1928, 20, 165–177. [Google Scholar]
  58. Svoboda, M.D.; Fuchs, B.A. Handbook of Drought Indicators and Indices. In Drought and Water Crises: Integrating Science. Management and Policy, 2nd ed.; Wilhite, D.A., Pulwarty, R.S., Eds.; CRC Press: Boca Raton, FL, USA, 2017; ISBN 9781315265551. [Google Scholar] [CrossRef]
  59. Skowera, B. Changes of hydrothermal conditions in the Polish area (1971−2010). Fragm. Agron. 2014, 31, 74–87, (In Polish with an English Abstract). [Google Scholar]
  60. PN EN ISO 7971-3; Cereals—Determination of Bulk Density. Called Mass Per Hectolitre—Part 3: Routine Method. Polish Committee for Standardization: Warsaw, Poland, 2010.
  61. Pieper, H. Das Saatgut, 2nd ed.; Parey: Berlin, Germany, 1952. [Google Scholar]
  62. TIBCO Software Inc. Statistica (Data Analysis Software System), Version 13; TIBCO Software Inc.: Palo Alto, CA, USA, 2017.
  63. McDonald, M.B. Seed quality assessment. Seed Sci. Res. 1998, 8, 265–276. [Google Scholar] [CrossRef]
  64. Taylor, A.G. Seed storage, germination, quality and enhancements. In The Physiology of Vegetable Crops, 2nd ed.; Wien, H.C., Stutzel, H., Eds.; CAB International: Wallingford, UK, 2020; pp. 1–30. [Google Scholar]
  65. Xiang, D.B.; Zhao, G.; Wan, Y.; Tan, M.L.; Song, C.; Song, Y. Effect of planting density on lodging-related morphology. lodging rate. and yield of tartary buckwheat (Fagopyrum tataricum). Plant Prod. Sci. 2016, 19, 479–488. [Google Scholar] [CrossRef]
  66. Zhou, Q.; He, P.; Tang, J.; Huang, K.; Huang, X. Increasing planting density can improve the yield of Tartary buckwheat. Front. Plant Sci. 2023, 14, 1313181. [Google Scholar] [CrossRef] [PubMed]
  67. Xiang, D.B.; Song, Y.; Song, C.; Wan, Y.; Ye, X.L.; Liu, C.Y.; Liang, C.C.; Zhao, G. Seed setting and its spatial characteristics in Tartary buckwheat (Fagopyrum tataricum). Phyton-Int. J. Exp. Bot. 2022, 91, 1659–1669. [Google Scholar] [CrossRef]
  68. Cheng, T.; Wang, Q.; Ma, C.; Gan, Z.; Wan, Y.; Ye, X.; Liu, C.; Zou, X.; Zhang, J.; Guo, Y.; et al. Study on the Growth Dynamics of Tartary Buckwheat Flowers and Grains. as Well as Material Basis and Physiological Changes of Their Seed-Setting Differences. Agronomy 2024, 14, 49. [Google Scholar] [CrossRef]
  69. Wan, Y.; Ouyang, J.; Gong, X.; Le, L.; Wu, X.; Wu, Q.; Zou, L.; Zhao, G.; Xiang, D. Water deficit and recovery-induced changes in growth. photosynthetic characteristics. antioxidant enzymes and yield of two Tartary buckwheat genotypes. Int. J. Agric. Biol. 2021, 25, 483–491. [Google Scholar] [CrossRef]
  70. Azad, M.O.K.; Park, B.S.; Adnan, M.; Germ, M.; Kreft, I.; Woo, S.H.; Park, C.H. Silicon biostimulant enhances the growth characteristics and fortifies the bioactive compounds in common and Tartary buckwheat plant. J. Crop Sci. Biotechnol. 2021, 24, 51–59. [Google Scholar] [CrossRef]
  71. Krucky, J.; Hejnak, V.; Vachova, P.; Gupta, A.; Kubes, J.; Popov, M.; Skalicky, M. Silicon application enhances drought resilience in buckwheat: A comparative study of three varieties. Front. Plant Sci. 2025, 16, 1635709. [Google Scholar] [CrossRef] [PubMed]
  72. Kwiatkowski, J. The Effect of Agricultural and Technological Conditions on the Production of Buckwheat (Fagopyrum esculentum Moench) Achenes with Good Technological Properties and a High Nutritional and Reproductive Value; Dissertation and Monographs, 153; UWM: Olsztyn, Poland, 2010; pp. 1–111. ISBN 978-83-7299-646-0. (In Polish with an English Abstract). [Google Scholar]
  73. Taylor, D.P.; Obendorf, R.L. Quantitative assessment of some factors limiting seed set in buckwheat. Crop Sci. 2001, 41, 1792–1799. [Google Scholar] [CrossRef]
  74. Liu, L.S.; Li, L.; Feng, Y.J.; Wang, T.; Li, C.L.; Wu, H.L.; Hu, Y.F.; Wu, Q.; Zhao, H.X. Impact of heat stress on the development, physiological and biochemical characteristics of Tartary buckwheat flowers, and its transcriptomic analysis. Plant Physiol. Biochem. 2025, 220, 109535. [Google Scholar] [CrossRef] [PubMed]
  75. Zhang, Y.; Guo, R.Y.; Li, S.H.; Chen, Y.; Li, Z.D.; He, P.Y.; Huang, X.; Huanget, K. Effects of continuous cropping on soil, senescence, and yield of Tartary buckwheat. Agron. J. 2021, 113, 5102–5113. [Google Scholar] [CrossRef]
  76. She, H.Z.; Nie, J.; Li, Y.S.; Zhang, Y.K.; Huang, K.H.; Zhang, Y.L.; Fang, X.M.; Ruan, R.W.; Yi, Z.L. Effects of silicon application rate on common buckwheat lodging and yield. Sci. Agric. Sin. 2018, 51, 2664–2674. [Google Scholar] [CrossRef]
  77. Zhang, J.; Sun, J.; Chen, H.; Yan, Z.; Liu, S.; Liu, L.; Cao, X. Path Analysis on the Meteorological Factors Impacting Yield of Tartary Buckwheat at Different Sowing Dates. Agronomy 2025, 15, 950. [Google Scholar] [CrossRef]
  78. Zhang, Y.; Wu, X.H.; Huang, X.Y.; He, P.Y.; Chen, Q.F.; Huang, K.F. Difference of grain filling characteristics and starch synthesis between the superior and inferior spikelet of Tartary buckwheat. Int. J. Agric. Biol. 2020, 23, 681–686. [Google Scholar] [CrossRef]
  79. Wu, X.; Zhang, Y.; He, P.; Huang, X.; Huang, K. Effects of tillage methods on senescence and grain filling characteristics of Tartary buckwheat. Zemdirb. Agric. 2020, 107, 301–308. [Google Scholar] [CrossRef]
  80. Hossain, M.S.; Li, J.; Wang, C.; Monshi, F.I.; Tabassum, R.; Islam, M.A.; Faruquee, M.; Muktadir, M.A.; Mia, M.S.; Islam, A.K.M.M.; et al. Enhanced Antioxidant Activity and Secondary Metabolite Production in Tartary Buckwheat under Polyethylene Glycol (PEG)-Induced Drought Stress during Germination. Agronomy 2024, 14, 619. [Google Scholar] [CrossRef]
  81. Liszewski, M. Yields, crop components and nutritional value of buckwheat seeds grown on loamy soil, depending on seeding time and rates. Zesz. Nauk. Akad. Rol. Wroclawiu. Rol. 1996, 68, 223–230, (In Polish with an English Abstract). [Google Scholar]
  82. Farooq, S.; Rehman, R.U.; Pirzadah, T.B.; Malik, B.; Dar, F.A.; Tahir, I. Cultivation, agronomic practices and growth performance of buckwheat. In Molecular Breeding and Nutritional Aspects of Buckwheat; Zhou, M., Kreft, I., Woo, S.H., Chrungoo, N., Wieslander, G., Eds.; Elsevier: New York, NY, USA, 2016; pp. 299–319. [Google Scholar] [CrossRef]
  83. Raihan, M.R.H.; Albert-Saiz, M.; Brestic, M.; Juszczak, R.; Rastogi, A. Deciphering silicon-induced resilience to drought and waterlogging stress in Fagopyrum esculentum Moench: Physiological adaptations during stress and recovery. J. Environ. Manag. 2026, 398, 128448. [Google Scholar] [CrossRef] [PubMed]
  84. Haque, M.I.; Saha, B.; Juszczak, R.; Rastogi, A. Foliar silicon enhances drought resilience and productivity in buckwheat by stabilizing photosynthetic performance. Sci. Rep. 2026, in press. [Google Scholar] [CrossRef] [PubMed]
  85. Kowalska, I.; Kowalczyk, M.; Mołdoch, J.; Pawelec, S.; Radzikowski, P.; Feledyn-Szewczyk, B. The Effects of a Cultivar and Silicon Treatments on Grain Parameters and Bioactive Compound Content in Organic Spring Wheat. Foods 2025, 14, 2406. [Google Scholar] [CrossRef] [PubMed]
  86. Rachappanavar, V.; Gupta, S.K.; Jayaprakash, G.K.; Abbas, M. Silicon mediated heavy metal stress amelioration in fruit crops. Heliyon 2024, 10, e37425. [Google Scholar] [CrossRef] [PubMed]
  87. Rizwan, M.; Ali, S.; Ibrahim, M.; Farid, M.; Adrees, M.; Bharwana, S.A.; Zia-ur-Rehman, M.; Qayyum, M.F.; Abbas, F. Mechanisms of silicon-mediated alleviation of drought and salt stress in plants: A review. Environ. Sci. Pollut. Res. 2015, 22, 15416–15431. [Google Scholar] [CrossRef] [PubMed]
  88. Mavrič Čermelj, A.; Golob, A.; Vogel-Mikuš, K.; Germ, M. Silicon Mitigates Negative Impacts of Drought and UV-B Radiation in Plants. Plants 2022, 11, 91. [Google Scholar] [CrossRef] [PubMed]
  89. Sytar, O.; Kovar, M.; Brestic, M.; Zivcak, M. Cultivar-dependent and drought-induced modulation of secondary metabolites, adaptative defense in Fagopyrum esculentum L. Physiol. Mol. Biol. Plants 2023, 29, 1605–1618. [Google Scholar] [CrossRef] [PubMed]
Figure 1. Average monthly temperature (°C) (a) and total monthly rainfall (mm) (b) during the growing seasons of Tartary buckwheat in 2022–2024 and the long-term average (1991–2020) at the experimental site.
Agronomy 16 01384 g001
Figure 2. The number of Tartary buckwheat plants per unit area in subsequent years of the study. Columns represent means and error bars represent standard error. Values marked with the same letters do not differ significantly at p ≤ 0.05 in Tukey’s test. Lowercase letters denote interactions and uppercase letters denote main factors (regular font for years, italics for genotypes).
Agronomy 16 01384 g002
Figure 3. The effect of year, genotype, and biostimulant on the height (a) and air-dry biomass (b) of Tartary buckwheat plants. Columns represent means and error bars represent standard error. Values marked with the same letters do not differ significantly at p ≤ 0.05 in Tukey’s test.
Agronomy 16 01384 g003
Figure 4. The effect of selected factors on the air-dry biomass of Tartary buckwheat plants [g]—year × biostimulant interactions. Columns represent means and error bars represent standard error. Values marked with the same letters do not differ significantly at p ≤ 0.05 in Tukey’s test. Lowercase letters denote interactions and uppercase letters denote main factors.
Agronomy 16 01384 g004
Figure 5. The effect of year, genotype, and biostimulant on the number of first-order branches (a) and the number of inflorescences (b) in Tartary buckwheat plants. Columns represent means and error bars represent standard error. Values marked with the same letters do not differ significantly at p ≤ 0.05 in Tukey’s test.
Agronomy 16 01384 g005
Figure 6. The effect of selected factors on the number of inflorescences in Tartary buckwheat plants—year × biostimulant interactions. Columns represent means and error bars represent standard error. Values marked with the same letters do not differ significantly at p ≤ 0.05 in Tukey’s test. Lowercase letters denote interactions and uppercase letters denote main factors.
Agronomy 16 01384 g006
Figure 7. The effect of year, genotype, and biostimulant on the number (a) and mass (b) of achenes per Tartary buckwheat plant. Columns represent means and error bars represent standard error. Values marked with the same letters do not differ significantly at p ≤ 0.05 in Tukey’s test.
Agronomy 16 01384 g007
Figure 8. The effect of year and biostimulant on the number (a) and mass (b) of achenes per Tartary buckwheat plant—year × biostimulant interactions. Columns represent means and error bars represent standard error. Values marked with the same letters do not differ significantly at p ≤ 0.05 in Tukey’s test. Lowercase letters denote interactions and uppercase letters denote main factors.
Agronomy 16 01384 g008
Figure 9. The effect of year, genotype, and biostimulant on the achene yield (a) and the harvest index (b) of Tartary buckwheat. Columns represent means and error bars represent standard error. Values marked with the same letters do not differ significantly at p ≤ 0.05 in Tukey’s test.
Agronomy 16 01384 g009
Figure 10. Achene yield of Tartary buckwheat—year × genotype interactions (a) and year × silicon biostimulant interactions (b). Columns represent means and error bars represent standard error. Values marked with the same letters do not differ significantly at p ≤ 0.05 in Tukey’s test. Lowercase letters denote interactions and uppercase letters denote main factors.
Agronomy 16 01384 g010
Figure 11. The effect of year, genotype, and biostimulant on the thousand-achene weight (a) and bulk density (b) of Tartary buckwheat achenes. Columns represent means and error bars represent standard error. Values marked with the same letters do not differ significantly at p ≤ 0.05 in Tukey’s test.
Agronomy 16 01384 g011
Figure 12. A heatmap and a dendrogram illustrating the levels of and relationships between the 14 descriptors listed on the left side of the plot across all Tartary buckwheat treatments.
Agronomy 16 01384 g012
Table 1. Hydrothermal coefficient (HTC) during the growing seasons of Tartary buckwheat in 2022–2024.
YearAprilMayJuneJulyAugustSeptemberMay–
August
20221.081.271.671.132.081.831.58
20231.640.261.481.001.080.421.00
20241.310.420.882.680.830.451.26
Description
extremely dryvery drydryrelatively dryoptimalrelatively wetwetvery wetextremely wet
Table 2. Correlation matrix for selected traits (*—significant correlations).
Plant Density [pcs m−2]Air-Dry Mass Per Plant [g]Plant Height [cm]Number of First-Order Branches Number of Inflorescences Per PlantsNumber of Achenes Per PlantAchene Mass Per Plant [g]Achene Yield [t/ha]Harvest Index
Air-dry mass per plant [g]−0.02
Plant height [cm]−0.47 *0.03
Number of first-order branches per plant−0.170.61 *0.01
Number of inflorescences per plants0.020.50 *0.240.15
Number of achenes per plant−0.37 *0.61 *0.34 *0.48 *0.76 *
Achene mass per plant [g]−0.38 *0.29 *0.65 *0.230.67 *0.84 *
Achene yield [t/ha]−0.39 *−0.29 *0.82 *−0.170.120.240.68 *
Harvest index −0.31 *−0.42 *0.54 *−0.31 *0.250.31 *0.70 *0.85 *
Thousand achene weight [g]−0.10−0.37 *0.61 *−0.250.160.140.59 *0.88 *0.86 *
Orange represents negative correlation, and green represents positive correlation. The intensity of the color corresponds to the strength of the correlation.
Table 3. Germination energy, germination capacity, and mean germination time of Tartary buckwheat seeds.
ParameterGermination Energy [%]Germination Capacity [%]Mean Germination Time [days]
Year of cultivation
202297 a,*97 a2.044 c
202390 b91 b2.111 b
202496 a96 a2.265 a
Genotype; mean for 2022–2024
CN94 b94 b2.181 a
SI93 b93 b2.117 b
PL97 a97 a2.122 b
Biostimulant SiO2; mean for 2022–2024
Yes94 ns95 ns2.111 b
No94 ns95 ns2.169 a
* “a”, “b”—values marked with the same letters do not differ significantly at p ≤ 0.05 in Tukey’s test; “ns”—non-significant.
Disclaimer/Publisher’s Note: The statements, opinions and data contained in all publications are solely those of the individual author(s) and contributor(s) and not of MDPI and/or the editor(s). MDPI and/or the editor(s) disclaim responsibility for any injury to people or property resulting from any ideas, methods, instructions or products referred to in the content.