1. Introduction
Field crop counting is an essential task in smart agriculture, as the quantities of wheat heads, maize tassels, and rice panicles are closely associated with crop growth monitoring, phenotypic analysis, and yield estimation. Accurate organ counting supports breeding selection and field phenotyping [
1,
2], while image-analysis pipelines make such measurements scalable in plant phenotyping [
3]. Recent studies in agricultural artificial intelligence [
4] and high-throughput phenotyping [
5,
6] have further emphasized the role of scalable image analysis in field crop assessment. With the increasing adoption of UAV and remote-sensing platforms [
7,
8], automated crop counting has become more practical. However, images acquired in open fields typically exhibit significant scale variations, target overlap, shadows, background vegetation, and cluttered textures; UAV-based maize-tassel studies illustrate these difficulties directly [
9,
10]. These factors complicate reliable counting operations, even when robust visual models are utilized.
Deep learning has emerged as a mainstream solution for agricultural counting, with density-map regression remaining one of the most widely adopted approaches. This formulation was established for dense object counting by learning a spatial density field [
11], and later CNN-based counting models extended it through multi-column feature extraction [
12], switchable regressors [
13], multi-task supervision [
14], and dilated convolutional backbones [
15]. Rather than directly predicting a scalar count, density-map-based methods estimate a dense response field and compute the final count through the integration of the predicted density map. This formulation is particularly advantageous for crowded agricultural scenes where targets are small, numerous, and partially occluded. Early crop-counting studies demonstrated the practical value of image-based tassel phenotyping [
16], maize-tassel density estimation [
17], and wheat-head benchmarking [
18]. Subsequent crop-specific research expanded the available benchmarks for wheat [
19], rice panicles [
20], and maize tassels [
21], while also exploring cross-platform wheat-ear counting [
22], lightweight wheat-ear density estimation [
23], and rice plant density estimation [
24]. Representative general counting architectures relevant to this study include MCNN [
12], Switch-CNN [
13], CMTL [
14], CSRNet [
15], and CAN [
25]. More recent frameworks illustrate different directions in counting supervision and feature selection, including Bayesian Loss [
26], DM-Count [
27], P2PNet [
28], and SASNet [
29]. Within the specific domain of crop analysis, related work has also addressed realistic field scenarios through TasselNetV2+ [
30], TasselNetV2++ [
31], UAV-based maize-tassel detection [
9,
10], lightweight maize-tassel aggregation [
32,
33], lightweight wheat-ear density estimation [
23], and cross-platform wheat-ear counting [
22].
Nevertheless, density-map regression within agricultural imagery remains inherently challenging. In real-world field scenarios, the size of crop organs exhibits significant variance due to differences in camera viewpoint, imaging altitude, growth stage, and the degree of occlusion. Simultaneously, background regions frequently contain elements—such as leaves, stems, soil textures, and shadows—that share visual similarities with the target objects. Under such conditions, errors in density estimation extend beyond localized misclassifications. Weak false positive responses distributed across non-target regions systematically accumulate during density integration, ultimately resulting in substantial estimation bias. Therefore, the quality of the final count depends heavily on the accuracy of local density responses, and an effective agricultural counting model must jointly optimize local response quality, global count consistency, and background suppression.
Although recent counting methods deliver strong performance, two practical execution issues remain prominent in agricultural analysis. First, numerous high-performing models are resource-demanding and parameter-heavy. They typically rely on large backbone networks or multi-branch architectures that incur substantial parameter and memory costs, significantly reducing their practicality in real-world agricultural pipelines. Lightweight deep learning models have thus garnered increasing attention, as numerous real-world applications demand compact and resource-aware models alongside high accuracy. Within agricultural contexts, this requirement is driven by large-scale phenotyping pipelines [
1,
6], agricultural AI workflows [
4], and UAV-based field surveys [
8]. Recent crop-specific studies increasingly prioritize compact counting and detection architectures over models designed solely to maximize empirical accuracy. Notable examples include cross-platform wheat-ear counting [
22], TasselLFANet for maize tassels [
32], FIDMT-GhostNet for wheat-ear density estimation [
23], and lightweight UAV-based maize-tassel counting [
33]. However, reducing model complexity extends beyond merely decreasing the parameter count. A viable lightweight counting model must preserve the capacity to capture small targets, maintain local structural details, and extract contextual information within cluttered backgrounds. Efficient backbone designs such as MobileNetV2 [
34], MobileNetV3 [
35], and ShuffleNet [
36] show that compactness must be paired with carefully designed feature extraction. Second, even when the macroscopic architecture is effective, existing methods frequently struggle to balance lightweight design with robust multi-scale modeling. In field environments, crop organs exhibit considerable size variations due to differences in imaging height, camera viewpoint, growth stage, and cultivar characteristics. This trade-off is particularly critical in field crop counting, where estimation errors frequently stem from subtle local discrepancies rather than from macroscopic variations in object appearance. Therefore, a lightweight architecture designed for agricultural counting must minimize unnecessary model expansion while retaining scale-sensitive and structure-sensitive feature extraction mechanisms. A lightweight model lacking adequate scale-aware representations may discard vital fine-grained target cues, whereas a stronger yet heavier model often fails to achieve an optimal trade-off between accuracy and compactness; feature-pyramid design provides one established route for preserving multi-scale information [
37]. This fundamental consideration serves as the core motivation for the design of Light-FCCNet.
Multi-scale representations have long been recognized as a crucial factor in visual counting, primarily because the size of target objects often exhibits significant variance both within individual images and across different scenes. Earlier architectures addressed scale variation through multi-column counting networks [
12], feature pyramids [
37], and adaptive crowd-counting structures [
38]. Recent counting and crop-counting studies further support this view through scale-aware feature selection [
29], maize-tassel aggregation [
21,
32], and lightweight wheat-ear density estimation [
23]. These methodologies demonstrate that multi-scale contextual information facilitates the preservation of local response quality for small targets, while simultaneously retaining broader structural details for larger or partially occluded targets. Attention mechanisms have also been extensively adopted to enhance feature selectivity. Channel attention highlights discriminative feature channels [
39], spatial attention emphasizes informative regions [
40], and attention-guided counting models suppress noisy responses in dense scenes [
38,
41]. Within the domain of agricultural imagery, attention mechanisms are particularly beneficial since target organs frequently share texture and color features with the surrounding background. Consequently, recent lightweight models designed for specific crops have integrated attention-based feature refinement for maize tassels [
32,
33] and wheat ears [
23]. However, implementing attention mechanisms in isolation proves insufficient if the initial feature representations are inadequate, whereas relying solely on multi-scale representations may still propagate irrelevant background responses during feature fusion. To address these limitations, Light-FCCNet integrates lightweight feature pyramid aggregation with attention-guided fusion, supervised by a counting-oriented loss function, rather than depending on a single isolated mechanism.
To address these challenges, we propose Light-FCCNet to facilitate parameter-efficient and accurate crop counting within complex field scenes. The primary objective is not merely to improve counting accuracy by expanding model capacity, but rather to preserve robust accuracy under a strict parameter budget. Accordingly, our design integrates three coordinated components. First, a lightweight feature pyramid aggregation module constructs multi-scale representations, functioning as the primary structural mechanism for handling target scale variations. Second, a multi-attention fusion module incorporates both spatial and channel attention mechanisms to strengthen feature interactions, suppress background-induced responses, and mitigate information loss during multi-scale fusion. Third, a tailored FCC loss enhances the optimization formulation by jointly incorporating pixel-level density regression, count-level consistency, and structural similarity constraints between the predicted and target density maps. Together, these components establish a compact agricultural counting framework. The core motivation is to ensure stable overall counting quality through continuous coordination across representation, fusion, and supervision stages, rather than simply accumulating isolated modular improvements.
In this study, we evaluate Light-FCCNet on three public field crop counting datasets: GWHD, MTC, and URC. To clarify the role of each component, we organize the experiments using a progressive ablation setting composed of baseline, baseline_p1, baseline_p1_p2, and full configurations. This configuration allows the individual contributions of lightweight pyramid aggregation, multi-attention fusion, and the FCC loss to be interpreted coherently. Within this ablation trajectory, the full configuration achieves the lowest error across all three datasets. Furthermore, under the same experimental protocol, Light-FCCNet obtains the lowest mean absolute error among the evaluated general counting baselines and the implemented recent cross-task plant-counting baseline while using only 0.92 M parameters. Consequently, the primary contribution of this work extends beyond introducing a smaller model; it provides empirical evidence that strong counting performance can be maintained under strict parameter constraints through the combined effect of these three coordinated components.
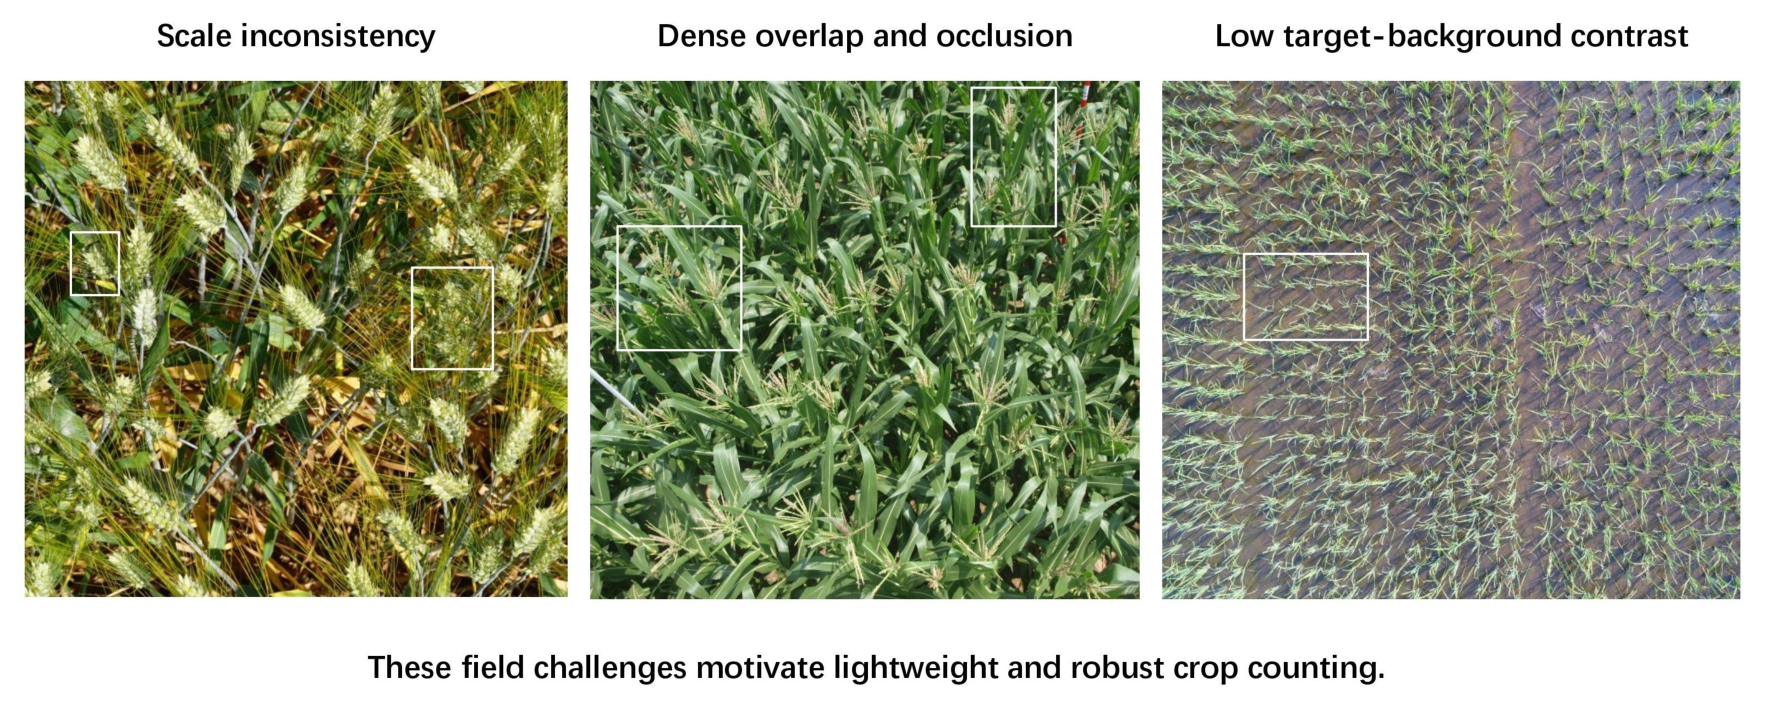
To illustrate the main real-field challenges in crop counting,
Figure 1 presents examples from the GWHD, MTC, and URC benchmarks, focusing on scale inconsistency, dense occlusion, and reduced target-background contrast.
The main aim of this study is to construct and evaluate a compact density-regression framework for field crop counting. The framework is designed around the large target-scale variation, strong background interference, and insufficient count-structure constraints that commonly occur in field imagery. It adopts lightweight operators, feature-pyramid reasoning, attention mechanisms, and density-regression losses so that they respectively support efficient feature extraction and model compression, scale-aware representation, background-response suppression, and count-structure supervision. Through controlled ablation experiments, repeated-seed checks on the key GWHD comparisons, and a background false-response diagnostic analysis, this study further verifies the roles of the individual components in crop-counting scenarios. In this sense, the work shows how a compact density-regression model can be organized to address the main error sources in field crop counting, thereby providing a reference for crop-counting model design under resource-constrained conditions.
The main contributions of this work can be summarized as follows:
We propose Light-FCCNet as a parameter-efficient density-regression framework for field crop counting. Its design assigns lightweight pyramid aggregation, attention-guided fusion, and FCC loss to three field-specific error factors: scale variation, background interference, and count-structure inconsistency.
We provide a mechanism-oriented diagnostic analysis based on background false-response measurements, linking the observed counting errors to scale-sensitive response degradation, background response accumulation, and density-structure distortion.
We extend the empirical evaluation by including a recent cross-task plant-counting baseline on GWHD, MTC, and URC under the same protocol, and by adding repeated-seed stability checks and small-sample statistical tests for the key GWHD comparisons.
2. Materials and Methods
2.1. Overview of Light-FCCNet
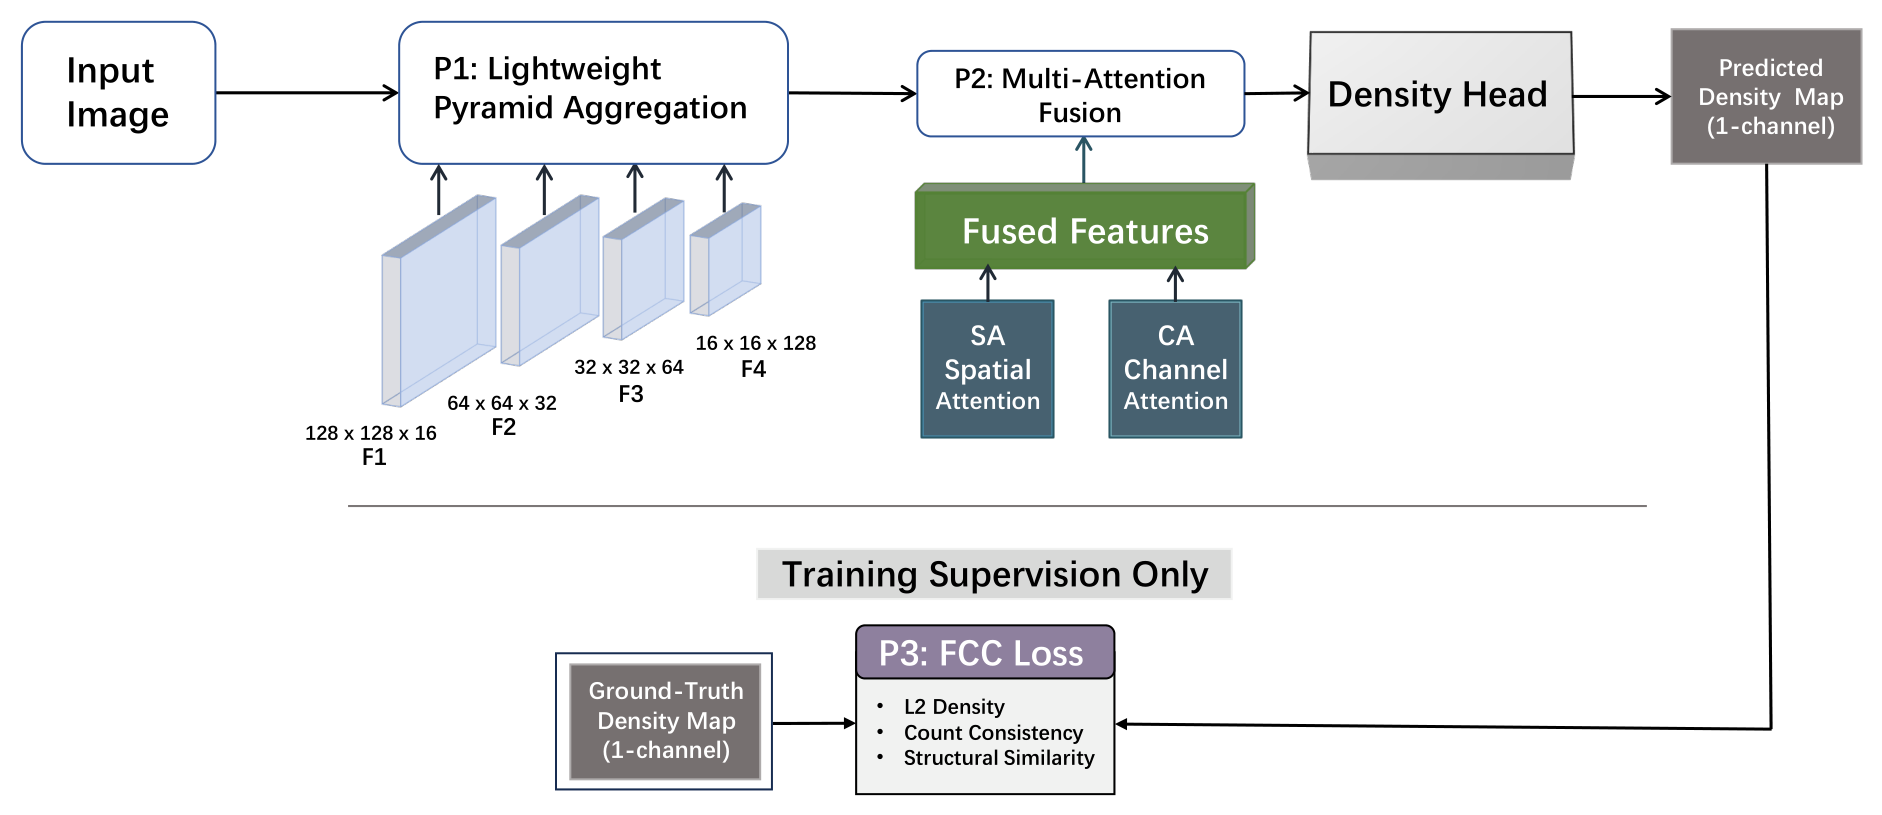
Light-FCCNet is a lightweight density-map regression network developed for field crop counting. The framework is structured to address the primary challenges of field imagery, namely scale variation, dense overlap, and background interference. Specifically, the model receives an agricultural image as input, extracts multi-scale features via a lightweight pyramid aggregation backbone, refines the aggregated representation through multi-attention fusion, and predicts a density map for which the spatial integral yields the final crop count.
The complete framework is constructed upon three coordinated components. The first component is the lightweight feature pyramid aggregation module, serving as the primary structural mechanism to extract multi-scale crop features within a compact network design. The second component is the multi-attention module, which fuses spatial and channel attention mechanisms to strengthen feature interactions and mitigate information loss during feature integration. The third component is the FCC loss, which provides supervision by combining pixel-level density regression, count-level consistency, and structural similarity constraints. Within the canonical ablation analysis utilized throughout this study, these components are denoted as P1 for lightweight feature pyramid aggregation, P2 for multi-attention fusion, and P3 for FCC loss. Consequently, the architectural semantics of Light-FCCNet must be defined explicitly: it constitutes a coordinated framework comprising two structural components (P1 and P2) and one optimization component (P3), rather than three parallel architectural branches.
The baseline configuration provides a lightweight single-scale reference for density-map estimation. It consists of a compact convolutional encoder followed by a density prediction head, without pyramid aggregation, attention fusion, or the structural term of the FCC loss. The encoder uses four sequential depthwise-separable convolutional stages with batch normalization and ReLU activation; the channel widths are set to 16, 32, 64, and 128, with progressive downsampling after the first stage. A density head maps the final feature representation to a single-channel density map, which is resized to the input resolution before count integration. This baseline keeps the same data processing, target generation, optimizer, and evaluation code as the other variants, so the subsequent ablation reflects the incremental effects of P1, P2, and P3.
To clarify the roles of
P1,
P2, and
P3,
Figure 2 provides an architectural overview of the complete framework. The left-to-right flow separates the structural backbone from the supervisory objective and identifies
P3 as an optimization component rather than an auxiliary architectural pathway.
2.2. Data Preprocessing
All datasets are converted into a unified point-supervised density-regression format before training. The reported experiments use a resize-based input pipeline: images are resized to the dataset-specific network resolution, namely for GWHD and MTC and for URC. During training, random horizontal flipping and color jittering are applied to increase orientation and appearance diversity, while validation uses only resizing and normalization. This setting keeps the geometric supervision consistent across all compared models and avoids introducing dataset-dependent crop sampling into the reported protocol. Random resized cropping is supported in the codebase as an optional augmentation, but it is not activated in the experiments reported in this manuscript.
Because density-map regression depends directly on spatial annotation alignment, image transformations and point coordinates are processed jointly. After the transformed point coordinates are obtained, density maps and attention masks are regenerated from the transformed annotations rather than transformed as precomputed raster labels. This procedure avoids interpolation artifacts in the target density maps and ensures that the supervision remains spatially aligned with the input images. For the GWHD dataset, bounding-box annotations are converted into point annotations by extracting the center of each box. The MTC and URC datasets are processed as point-based counting benchmarks in the training pipeline. Ground-truth density maps are generated by placing unit impulses at annotated point locations and convolving the resulting point map with a fixed isotropic Gaussian kernel. The Gaussian bandwidth is set to pixels for GWHD and URC and pixels for MTC, following the dataset-specific training configurations. No geometry-adaptive kernel estimation is used, and the GWHD box-center conversion is deterministic.
Preprocessing in Light-FCCNet combines lightweight appearance and flip augmentation with a unified target-generation protocol across GWHD, MTC, and URC. The same annotation conversion, input-resolution policy, density-target construction, and evaluation procedure are used throughout the reported experiments, so the differences observed in the ablation study and baseline comparisons mainly reflect the model components and loss policy rather than dataset-specific target-generation procedures.
2.3. Lightweight Feature Pyramid Aggregation Module
Serving as the structural core of Light-FCCNet, the lightweight feature pyramid aggregation module corresponds to
P1 in the canonical ablation analysis. The primary objective of this module is to preserve scale-sensitive representations within a compact architectural design. Rather than relying on computationally heavy conventional convolutional stacks, the module employs lightweight convolutional blocks combined with a progressive pyramid structure to extract feature maps at multiple scales. This methodology aligns with efficient mobile-backbone principles introduced by MobileNetV2 [
34], MobileNetV3 [
35], and ShuffleNet [
36], while its multi-scale organization follows the broader rationale of feature-pyramid aggregation [
37].
The basic lightweight convolutional block is formulated as follows. Given an input feature map
, the channel dimension is first split into two groups, denoted as
and
. The first group is projected by a pointwise convolution to obtain
. The projected feature is then used for depthwise spatial filtering and, in parallel, added to the bypass group
to preserve shallow structural information. The filtered and residual features are concatenated along the channel dimension and mapped by the final
fusion layer
where
denotes pointwise convolution,
denotes depthwise convolution,
denotes channel concatenation, and
denotes the final pointwise fusion projection. This configuration reduces computational redundancy while preserving both shallow and deeper local responses. Although the block uses standard lightweight operations related to MobileNet and ShuffleNet-style designs, its role differs from a generic mobile backbone block. The intermediate pointwise feature
is reused both as the depthwise input and as a residual addend before the final projection, and no fixed channel-shuffle permutation is imposed. Inter-branch mixing is instead learned through the final
projection, while the subsequent pyramid stages explicitly preserve downsampled density-sensitive responses for multi-scale counting.
Built upon this lightweight block, the pyramid aggregation module is organized into four sequential stages. The first stage maintains the original feature resolution, extracting a fundamental single-scale representation. The second, third, and fourth stages progressively downsample the feature maps through depthwise-separable operations, constructing representations that target approximately
,
,
, and
spatial scales, respectively. Residual aggregation is incorporated in the deeper stages to ensure that the downsampled responses remain explicitly connected to the projected input features. Letting the resulting multi-scale features be denoted as
, the pyramid aggregation process can be summarized as
where
denotes the lightweight pyramid aggregation backbone and
I represents the input image.
From the perspective of field crop counting, the function of this module extends beyond enlarging receptive fields; it rebalances density-sensitive feature representations under target scale variations. Small crop organs require fine-grained local responses, whereas larger or heavily overlapped targets necessitate broader contextual support. For this reason, the lightweight multi-scale hierarchy establishes the representation basis for subsequent attention-guided fusion while maintaining a compact parameter budget.
2.4. Multi-Attention Module
The multi-attention module corresponds to
P2 within the canonical ablation setting and is constructed upon the pyramid representation generated by
P1. The objective of this module is to enhance the integration of multi-scale features while suppressing irrelevant responses potentially induced by background textures. Within the current framework, the attention stage serves a meaningful purpose only when multi-scale pyramid features are explicitly available; for this reason, the canonical ablation trajectory invariably positions
P2 subsequent to
P1. This structural design is aligned with channel attention [
39], spatial attention [
40], attention-guided counting [
38], and attention-based dense prediction [
42].
The initial operation of the multi-attention module is multi-scale alignment. Each feature map from the pyramid hierarchy is projected to a uniform channel dimension via a
mapping, followed by upsampling to a consistent spatial resolution. Assuming the four pyramid features are denoted as
, the aligned fusion representation is formulated as
where
represents the channel projection for the
ith scale,
denotes bilinear upsampling, and
signifies convolutional fusion subsequent to channel concatenation.
Following alignment and fusion, the aggregated feature map is refined by spatial and channel attention mechanisms. Spatial attention reinforces context-aware localization, guiding the model to emphasize informative regions. Conversely, channel attention reweights the fused channels, ensuring that discriminative feature responses predominantly govern the final representation. While this spatial-channel sequence is related to CBAM [
40], the integration point is different:
P2 is applied after four-scale pyramid alignment rather than after each single-scale convolutional block. Therefore, the attention weights are computed on a fused representation that already contains scale-specific crop responses, making the module more directly tied to density-map refinement in cluttered agricultural scenes. Letting
denote the spatial attention transformation and
denote the channel attention transformation, the final attention-refined feature is expressed as
Beyond feature refinement, the module concurrently generates an auxiliary attention map via a lightweight prediction head
where
stands for the attention head and
represents the Sigmoid activation function. In the experiments reported in this study, this auxiliary map is not used as an additional supervised loss term and does not redefine
P3. It is retained only as an interpretable byproduct of the attention module for post-hoc visualization and diagnostic analysis.
Consequently, the multi-attention module mitigates information loss during multi-scale fusion by aligning and integrating features more precisely than naive aggregation, while its spatial and channel reweighting helps suppress background-induced responses in the fused representation. This capability is important in agricultural images, where leaves, shadows, and soil patterns routinely interfere with crop-organ counting. In the absence of targeted suppression, such invalid responses would continually accumulate within the density map, directly degrading the final counting accuracy.
2.5. FCC Loss
Corresponding to
P3 within the canonical ablation analysis, the FCC loss serves as the optimization component that distinguishes the full model from its structural variants. Unlike the architectural branches
P1 and
P2,
P3 functions as a counting-oriented loss policy. It is designed to improve density estimation from three complementary perspectives: pixel-level regression accuracy, global count consistency, and structural similarity. The density-regression and count-consistency terms are related to the supervision principles used in density-regression and distribution-matching counting methods such as DM-Count [
27]. The distinctive role of FCC loss in this study is the structural similarity term, which explicitly penalizes density-map structure distortion under occlusion and target overlap rather than only constraining the scalar count.
Within this study, the FCC loss is formulated as
where
denotes the density-map regression term,
represents the count-consistency term,
indicates the structural similarity term, and
serves as a weighting coefficient to balance structural supervision against the alternative objectives. In the main full-model experiments,
is fixed at 0.1 for GWHD, MTC, and URC. An additional sensitivity analysis on GWHD evaluates several values of
while keeping the full architecture unchanged.
The density regression term is quantified by the mean squared error between the predicted density map
D and the corresponding ground-truth density map
:
The count-consistency term penalizes discrepancies between the spatial integral of the predicted density map and the actual target count
where
denotes the ground-truth count for the
ith image sample. Furthermore, the structural term is implemented via a structural-similarity-based loss function,
which compels the predicted density map to preserve the structural organization of the target distribution, rather than merely matching independent pixel values [
43].
Within the current experimental configuration, the baseline loss utilized when P3 is disabled solely comprises the density regression and count-consistency terms; conversely, the complete FCC loss incorporates the structural similarity constraint. This distinction is important for interpreting the subsequent ablation results. When use_p3_loss is deactivated, the network is optimized under a simplified counting objective. When activated, the overall optimization target becomes more sensitive to global structural patterns and density distribution consistency. Consequently, P3 must be interpreted as the proposed loss policy rather than as an auxiliary architectural branch appended to the main network structure.
2.6. Canonical Ablation Semantics
To preclude ambiguity in the interpretation of the experimental results, the canonical ablation settings employed in this study are explicitly defined. The four principal configurations are established as follows:
baseline: A single-scale lightweight counting pathway devoid of pyramid aggregation, multi-attention fusion, and the FCC loss;
baseline_p1: The baseline architecture augmented with lightweight feature pyramid aggregation;
baseline_p1_p2: The baseline architecture augmented with both lightweight feature pyramid aggregation and multi-attention fusion;
full: The baseline architecture augmented with lightweight feature pyramid aggregation, multi-attention fusion, and the FCC loss.
Under this formalization, P2 is not treated as an independent module isolated from the pyramid setting, as its functionality is conditioned upon the aligned multi-scale representations generated by P1. Similarly, P3 is formulated as the proposed loss policy rather than an auxiliary structural module. This canonical ablation trajectory is applied throughout the experimental evaluations and serves as the basis for quantifying the contribution of each constituent component. The trajectory should therefore be interpreted as a progressive design analysis rather than a complete orthogonal factorial ablation; additional configurations such as baseline_p3 or baseline_p1_p3 would be useful future extensions but are not claimed in the current results.
3. Experiments
3.1. Datasets
The proposed Light-FCCNet is evaluated on three public field crop counting datasets: GWHD for wheat-head counting [
19], MTC for maize-tassel counting following the TasselNet line of work [
17,
30] and later maize-tassel counting studies [
21], and URC for UAV-based rice counting [
44]. Representing diverse crop categories, these datasets exhibit distinct combinations of scale variance, distribution density, physical occlusion, and background complexity, rendering them suitable for assessing the robustness of lightweight agricultural counting architectures.
GWHD serves as a wheat-head counting benchmark characterized by substantial variances in acquisition conditions and target densities. The original Global Wheat Head Detection benchmark introduced diverse wheat-head imagery for field analysis [
18], and its expanded version further increased the diversity of acquisition conditions and annotations [
19]. This diversity makes GWHD a useful benchmark for evaluating whether a counting model can preserve stable density responses in complex wheat scenes.
MTC constitutes a maize-tassel-counting dataset acquired via Unmanned Aerial Vehicle (UAV) imagery. Earlier tassel phenotyping and counting studies established the relevance of image-based maize-tassel analysis [
16,
17], while later TasselNetV2+ and MLAE-Net studies further developed maize-tassel counting benchmarks and models [
21,
30]. In comparison to wheat-head environments, maize-tassel images frequently exhibit intensified canopy interference and more irregular local structural patterns. UAV-based tassel detection studies also highlight the visual ambiguity between tassels and surrounding foliage [
9,
10], which substantially exacerbates accurate quantification, particularly for lightweight networks constrained by limited representative capacity to preserve structural details.
URC represents a UAV-based rice counting dataset collected from paddy-field RGB imagery [
44]. It contains 355 images and 257,793 manually labeled points, with the local split files used in this study comprising 197 training images, 49 validation images, and 109 test images. This benchmark poses unique challenges because rice targets frequently appear in dense distributions and are visually entangled with the surrounding vegetation. Consequently, URC functions as a robust testbed for evaluating the efficacy of a model in suppressing background-induced false responses while maintaining stable global counting behavior.
The dataset annotations are converted into the unified point-supervised format described in the preprocessing section. For GWHD, bounding boxes are converted to center points, and the local split files contain 3657 training images, 1476 validation images, and 1382 test images after excluding the CSV header row. For MTC, the split files contain 251 training images, 35 validation images, and 75 test images with image–annotation pairs. For URC, HDF5 point annotations are read from the released annotation files and converted into the same density-regression target format. Across the experiments, the reported training pipeline uses the corresponding training and validation split files consistently for model optimization, validation, and checkpoint selection.
Because this study is based on public benchmark datasets rather than a newly collected field trial, not all field-level metadata are available in a consistent form across the three sources. The manuscript therefore reports the public dataset information used by the experimental pipeline, including crop category, imaging modality where available, split files, and annotation format, but does not infer unavailable field coordinates, plot dimensions, cultivar or genotype, growth stage, or acquisition dates.
3.2. Implementation Details
All experiments detailed in this manuscript are executed within the dedicated Light-FCCNet training and evaluation pipeline implemented in PyTorch. The network is optimized with the Adam optimizer using , , , and a weight decay of . A StepLR schedule is used with a step size of 30 epochs and a decay factor of 0.5. The initial learning rate is for GWHD and for MTC and URC. Each model is trained for 100 epochs. Validation is performed after every epoch, and the final checkpoint reported in the manuscript is selected according to the lowest validation MAE. This criterion is applied consistently to Light-FCCNet variants and to the implemented comparison baselines.
To accommodate the intrinsic characteristics of the respective datasets, the input resolution and batch size are adapted by dataset. GWHD and MTC use an input resolution of and a batch size of 16, whereas URC uses an input resolution of and a batch size of 8. Density maps are generated with a Gaussian bandwidth of pixels for GWHD and URC and pixels for MTC. The same data split files, target-generation code, optimizer family, validation code, and metric computation are used for all models evaluated on the same dataset. The experimental environment uses PyTorch 2.1.0, Python 3.10 on Ubuntu 22.04, CUDA 12.1, one NVIDIA RTX 4090 GPU with 24 GB memory (NVIDIA Corporation, Santa Clara, CA, USA), 16 Intel Xeon Gold 6430 vCPUs (Intel Corporation, Santa Clara, CA, USA), and 120 GB system memory.
Each dataset is evaluated under the identical canonical ablation trajectory, comprising the baseline, baseline_p1, baseline_p1_p2, and full models. Within this empirical framework, P2 is selectively activated only when P1 is present, and P3 operates strictly as a loss-policy switch rather than an architectural branch. The FCC loss weighting coefficient is set to 0.1 in all full-model experiments; its sensitivity is treated as a separate experimental question from the canonical architectural ablation. Consequently, the subsequent ablation results directly instantiate the methodological definitions established throughout this study.
3.3. Evaluation Metrics
In accordance with standard practices in field crop counting, the mean absolute error (MAE), mean squared error (MSE), and mean absolute percentage error (MAPE) are employed as the primary evaluation metrics. Let
and
denote the ground-truth and predicted counts of the
ith image, respectively, and let
N represent the total number of evaluated images. These three metrics are mathematically formulated as
and
Lower values of MAE, MSE, and MAPE indicate better counting performance.
In addition to counting accuracy, model compactness and local computational complexity are reported to match the parameter-efficient motivation of this study. Compactness is characterized by the number of trainable parameters and the estimated FP32 model size. Approximate FLOPs are measured using the same hook-based local profiling protocol under the actual evaluation input resolutions, namely for GWHD and MTC, and for URC. These complexity measurements are used as local reference values rather than official literature-reported statistics.
MAPE is retained as a supplementary percentage-based metric, but it is interpreted cautiously. In images with small ground-truth counts, a modest absolute error can produce a large percentage error; therefore, MAPE is not directly comparable in scale to MSE and should not be treated as the sole ranking criterion. The main accuracy discussion is consequently centered on MAE and MSE, with MAPE used to indicate relative-error behavior.
3.4. Ablation Study
The canonical ablation results of Light-FCCNet on the GWHD, MTC, and URC datasets are presented in
Table 1. Within the evaluated ablation trajectory, the
full configuration consistently yields the lowest errors on all three benchmarks. This result indicates that the complete framework provides stable accuracy improvements across diverse crop-counting scenarios. It also shows that lightweight pyramid aggregation, multi-attention fusion, and FCC loss do not function as isolated auxiliary add-ons; instead, their benefits accumulate within the proposed architecture.
To evaluate the stability of the GWHD comparison under stochastic training variation, the key configurations are additionally examined across repeated runs.
Table 2 reports mean ± standard deviation for the repeated configurations and keeps the canonical baseline as the reference row. The repeated-seed results provide an additional view of the ablation trend:
baseline_p1_p2 obtains lower mean MAE and MSE than
baseline_p1, and the
full Light-FCCNet configuration maintains lower MAE, MSE, and MAPE than the implemented TasselNetV2++ baseline. Exact paired Wilcoxon signed-rank tests are further applied to the matched per-seed MAE values for the two central comparisons. The resulting two-sided values are
for
baseline_p1 versus
baseline_p1_p2 and
for
full versus TasselNetV2++. With three repeated runs, the exact test provides a conservative paired-seed check whose resolution is necessarily coarse, and the per-seed ordering remains consistent with the mean-error trend. Overall, the GWHD comparison supports the coordinated progression from the baseline configuration to the full model.
To assess the influence of the FCC loss weighting coefficient,
Table 3 reports an
sensitivity analysis on GWHD using the full Light-FCCNet configuration. The default setting
corresponds to the full-model result reported in the canonical ablation study. In this sweep,
yields the lowest MAE, MSE, and MAPE, showing a balanced improvement across absolute, squared, and percentage errors. This result supports retaining
as the default setting for the main experiments. Larger values of
do not improve the overall error profile.
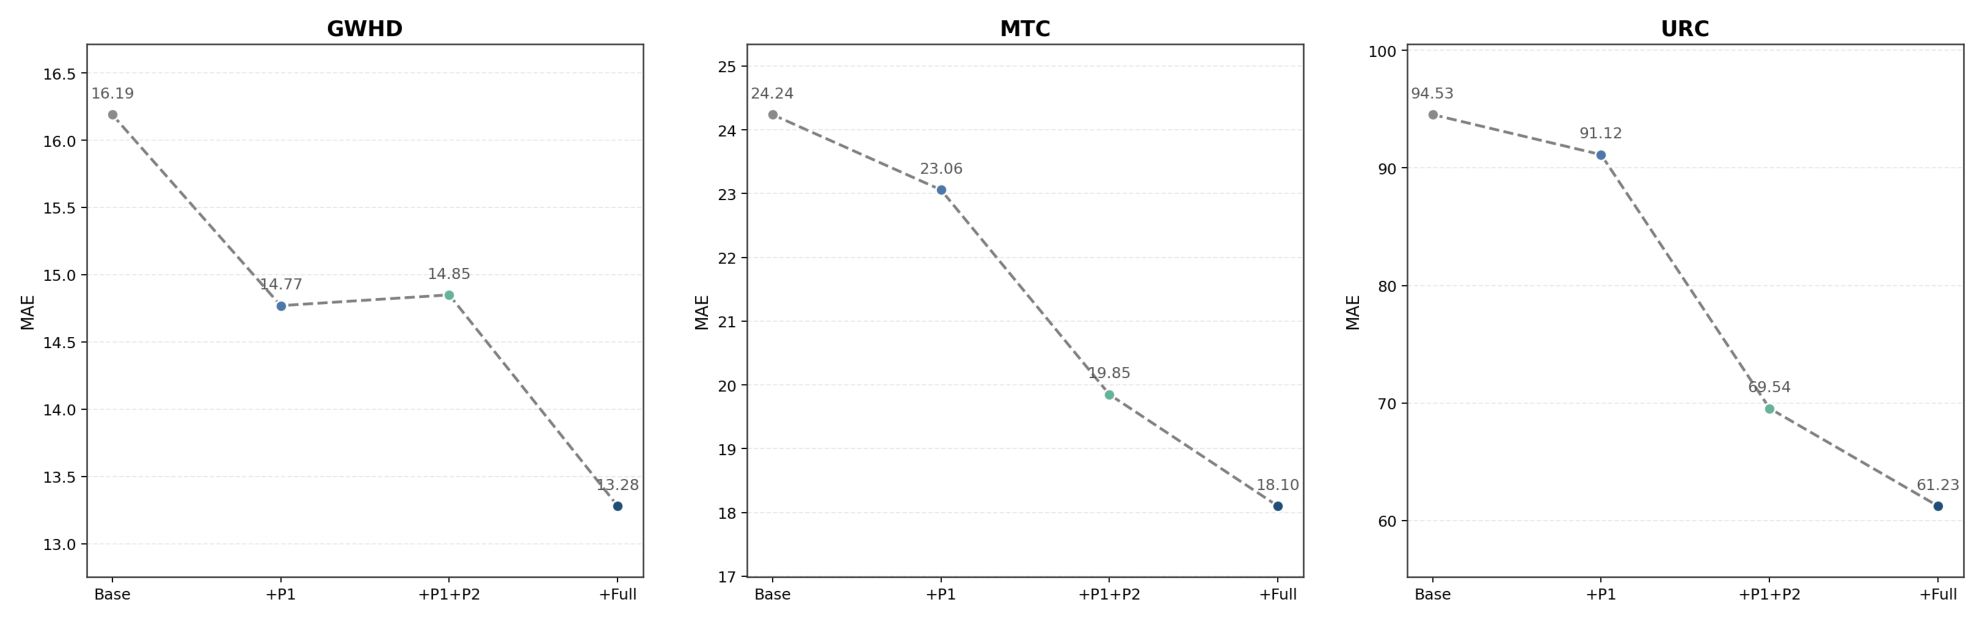
To show the progressive gains along the canonical ablation trajectory,
Figure 3 visualizes the MAE transitions from the
baseline,
baseline_p1, and
baseline_p1_p2 configurations to the
full model across the GWHD, MTC, and URC datasets. This comparison supports the conclusion that Light-FCCNet benefits from coordinated design rather than the isolated contribution of a single module.
Table 1 reveals a progressive but non-uniform improvement pattern across the three datasets. Introducing
P1 consistently improves upon the baseline, indicating that lightweight feature pyramid aggregation provides a more reliable representation basis for field crop counting. The gain is moderate on GWHD but becomes more pronounced on MTC and URC, where scene complexity and background interference are stronger. This pattern suggests that the benefit of
P1 is not limited to adding extra feature scales; it also lies in organizing scale-sensitive information more effectively within a constrained parameter budget.
The effect of
P2 is more prominent on the datasets with stronger canopy interference and background clutter. When the multi-attention module is appended to the pyramid representation, the MTC and URC results improve substantially, supporting the role of attention-guided fusion in suppressing background interference and preserving discriminative multi-scale responses. On GWHD, the canonical single-run result changes only slightly from
baseline_p1 to
baseline_p1_p2, whereas the repeated-seed analysis in
Table 2 shows lower mean MAE and MSE for
baseline_p1_p2. These results indicate that the magnitude of the
P2 contribution depends on the visual complexity and target-background structure of each dataset, and that its role is best interpreted within the complete representation and optimization pipeline.
The final transition from baseline_p1_p2 to full further highlights the role of P3 as the optimization component of the framework. Although P3 is not an isolated structural module, its inclusion reduces the MAE from 14.85 to 13.28 on GWHD, from 19.85 to 18.10 on MTC, and from 69.54 to 61.23 on URC. Relative to the baseline architecture, the full model decreases the MAE by approximately 18.0%, 25.3%, and 35.2% on the three datasets, respectively. These quantitative margins indicate that the FCC loss helps convert enhanced feature representations into more accurate counting predictions.
Overall, the canonical ablation study supports a coherent architectural interpretation of Light-FCCNet. The lightweight feature pyramid aggregation establishes the multi-scale representation, the multi-attention fusion refines this representation in complex backgrounds, and the FCC loss stabilizes the optimization objective. The integration of these components consistently yields the lowest errors within the canonical ablation trajectory across all three datasets, providing direct experimental support for the parameter-efficient counting method proposed in this work.
3.5. Comparison with General and Recent Cross-Task Plant Counting Methods
This subsection positions Light-FCCNet against representative counting models with respect to model compactness, local computational complexity, and counting accuracy. Several crop-specific lightweight methods, including TasselNetV2+ [
30], TasselLFANet [
32], and FIDMT-GhostNet [
23], are closely related to the target application. However, their reported results are based on task-specific datasets, crop-specific splits, or evaluation protocols that do not directly match the unified GWHD, MTC, and URC protocol used here. Rather than mixing incomparable literature numbers, this study reports a controlled implementation of TasselNetV2++ [
31] as a recent plant-counting reference and evaluates it under the same data processing, training, and evaluation pipeline as the other baselines. The parameter counts, estimated FP32 model sizes, and FLOPs of Light-FCCNet, CSRNet [
15], CAN [
25], DM-Count [
27], SASNet [
29], and TasselNetV2++ [
31] are measured under the same profiling setting. To align the complexity analysis with the actual evaluation protocol, FLOPs are reported under the input resolutions used in the experiments:
for GWHD and MTC, and
for URC.
These complexity metrics should be interpreted as approximate measurements rather than official literature-reported values. They are derived via a unified hook-based profiling mechanism and function as standardized references under the same implementation environment. The compactness emphasized in this study mainly refers to parameter efficiency and model size, rather than the lowest FLOPs among the evaluated methods. Hardware-specific deployment latency is outside the main scope because it depends on backend optimization, operator fusion, memory hierarchy, and device-specific kernels. Therefore,
Table 4 is used to characterize the accuracy-compactness trade-off under the actual evaluation input sizes. Because the original TasselNetV2++ study used its own plant-counting datasets and evaluation settings, we report our implemented TasselNetV2++ baseline under the same GWHD, MTC, and URC experimental protocol as the other compared methods, including the same data splits, target generation, training entry point, optimizer family, input resolution, and evaluation code. No pretrained weights from the original TasselNetV2++ study are used.
The dataset-specific counting comparisons are reported in
Table 5,
Table 6 and
Table 7. These three tables are presented separately because GWHD, MTC, and URC represent different crop organs and different field-image difficulties; therefore, the comparative results need to be interpreted at the dataset level rather than only through a pooled summary. In this way, the external comparison can show not only whether Light-FCCNet achieves a lower average error, but also whether the advantage remains stable under wheat-head, maize-tassel, and rice-panicle scenes with different background and scale characteristics.
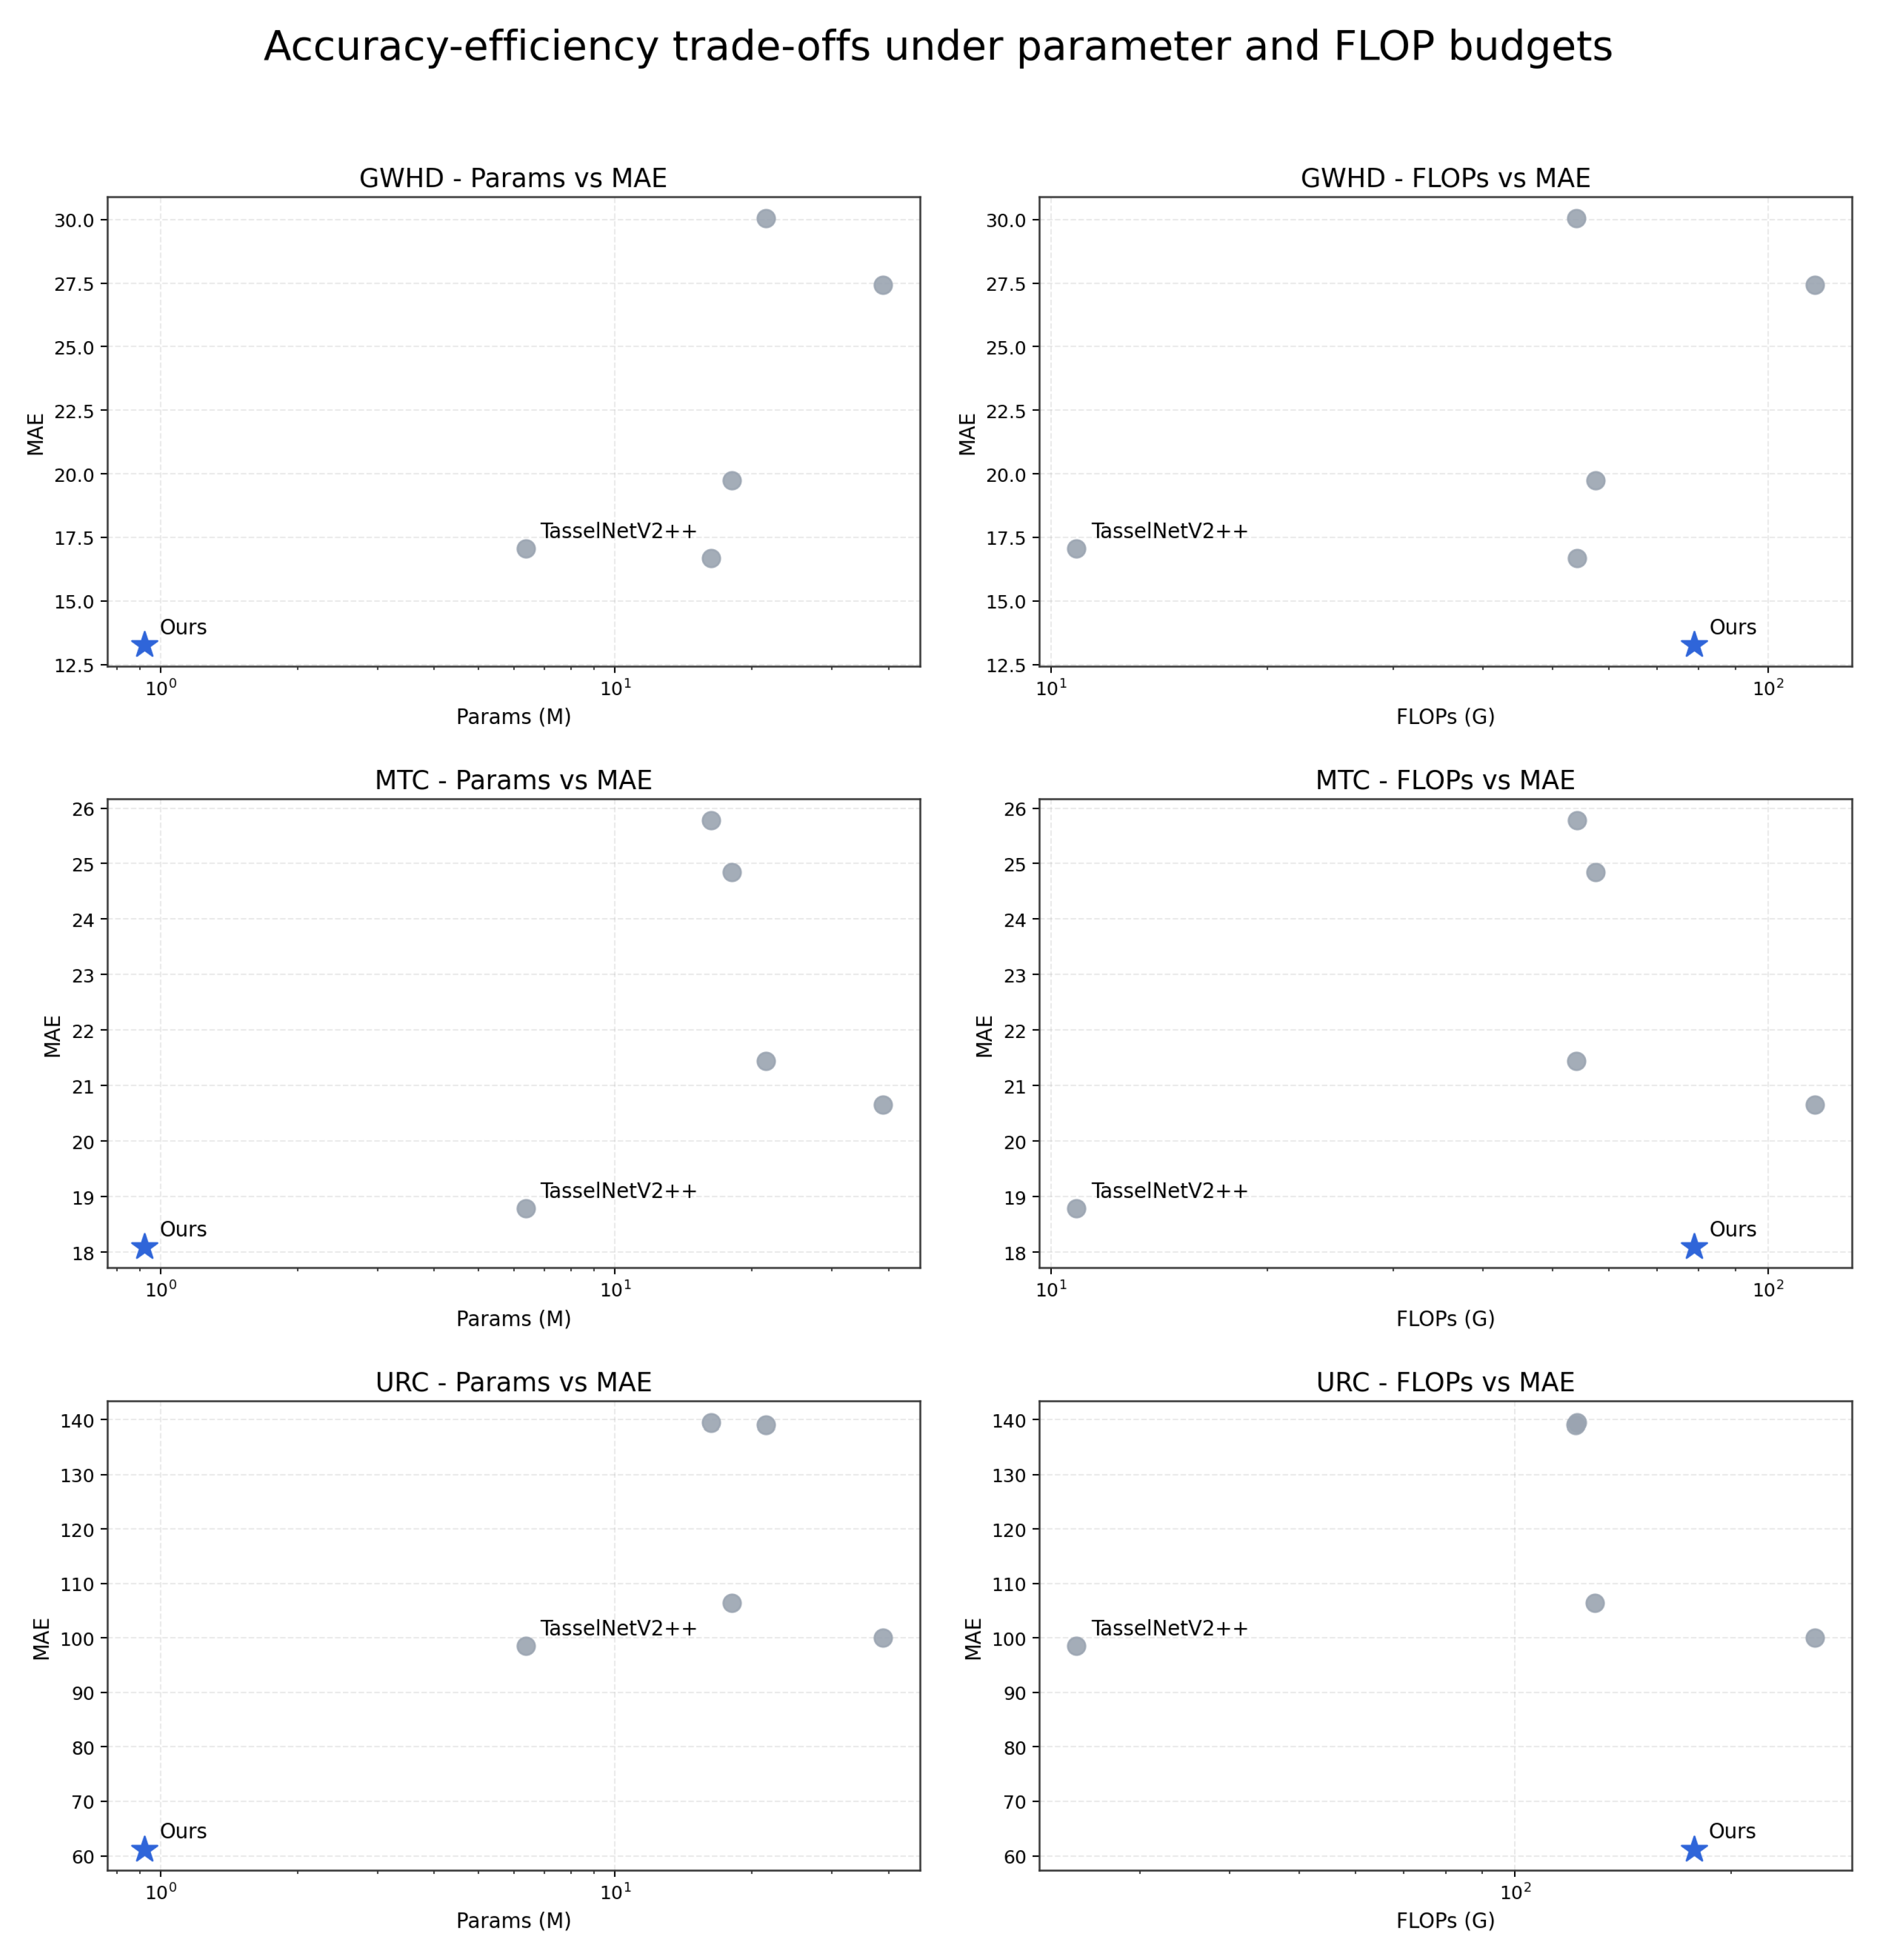
To support the parameter-efficiency analysis,
Figure 4 visualizes the accuracy–efficiency trade-offs across the three evaluated benchmarks from both parameter-MAE and FLOPs-MAE perspectives. The parameter-based panels highlight the position of Light-FCCNet, which achieves the lowest MAE among the evaluated methods under the same experimental protocol while maintaining a 0.92M-parameter footprint, whereas the FLOPs-based panels provide a complementary view of its profiled computational cost.
Under the canonical setting adopted in this study, the ablation results provide internal evidence for Light-FCCNet. Based on
Table 4, Light-FCCNet uses only 0.92 M parameters and has an estimated FP32 model size of 3.49 MB, which is substantially smaller than CSRNet, CAN, DM-Count, SASNet, and TasselNetV2++. The FLOP views in
Figure 4 complement this compactness comparison by showing the locally profiled computational-cost positions of the evaluated methods. Although Light-FCCNet does not obtain the lowest FLOPs under the profiling protocol, it achieves the smallest parameter footprint and model size among the evaluated methods. Within the current comparative setting, the clearest and most stable advantage of Light-FCCNet therefore remains its parameter efficiency, and that advantage directly complements the consistent counting gains observed across all three datasets.
As shown in
Table 5, Light-FCCNet achieves the best performance on GWHD across all three reported metrics. Its MAE of 13.28 is lower than CSRNet (16.69), CAN (19.75), DM-Count (30.05), SASNet (27.42), and TasselNetV2++ (17.05). The same trend is observed for MSE and MAPE, where Light-FCCNet obtains 412.00 and 56.29, respectively. This result indicates that the proposed framework preserves stable density responses in wheat-head scenes, where the targets are small and background textures can easily introduce weak false responses.
Table 6 further shows that Light-FCCNet obtains the lowest MAE and MSE on the MTC dataset, with values of 18.10 and 539.59. These results are lower than those of the general counting baselines and also lower than our implemented TasselNetV2++ in terms of absolute counting error and squared counting error. However, TasselNetV2++ achieves a lower MAPE on MTC. This exception is important for interpreting the comparison fairly: the empirical advantage of Light-FCCNet is not claimed as dominance on every metric, but as a stronger MAE–MSE trade-off under a much smaller parameter footprint. Therefore, the MTC comparison supports the proposed accuracy-compactness argument while also clarifying the remaining metric-specific limitation.
The URC comparison in
Table 7 provides the strongest dataset-level evidence for Light-FCCNet. On this rice-panicle benchmark, Light-FCCNet reduces MAE to 61.23, compared with 139.50 for CSRNet, 106.49 for CAN, 139.09 for DM-Count, 100.07 for SASNet, and 98.49 for TasselNetV2++. It also achieves the lowest MSE and MAPE, with values of 5774.60 and 9.99. Since URC contains dense panicle distributions and strong vegetation interference, the larger performance margin suggests that the coordinated use of pyramid aggregation, attention-guided fusion, and FCC loss is particularly useful when background-induced responses and density-structure distortion are severe.
Taken together,
Table 5,
Table 6 and
Table 7 show that Light-FCCNet achieves the lowest MAE on all three datasets among the evaluated methods. Compared with CSRNet, Light-FCCNet reduces MAE from 16.69, 25.78, and 139.50 to 13.28, 18.10, and 61.23 on GWHD, MTC, and URC, respectively. Compared with CAN, which emphasizes context modeling, Light-FCCNet also maintains a clear advantage in MAE across all datasets, suggesting that context enhancement alone cannot replace the combined design of lightweight pyramid aggregation, attention-guided fusion, and counting-oriented optimization. SASNet is a competitive external comparison method, especially on MTC and URC, but it still trails Light-FCCNet while using 38.90 M parameters and an estimated FP32 model size of 148.39 MB. TasselNetV2++ provides a recent cross-task plant-counting reference under the same experimental protocol; Light-FCCNet obtains lower MAE on GWHD, MTC, and URC while using fewer parameters and a smaller FP32 model size. Because TasselNetV2++ has lower FLOPs under this profiling protocol and lower MAPE on MTC, the compactness claim of Light-FCCNet is framed around parameter efficiency and storage compactness rather than universal computational superiority or dominance on every metric. Overall, the advantage of Light-FCCNet lies in sustaining cross-dataset MAE gains while using the smallest parameter footprint and model size among the evaluated methods.
4. Discussion
The discussion of Light-FCCNet is structured along two connected dimensions. Empirically, the architecture achieves the lowest MAE among the evaluated methods under the same experimental protocol on the GWHD, MTC, and URC benchmarks while using 0.92 M parameters. Methodologically, this result is not derived from an isolated module or from increasing model capacity; rather, it reflects the coordinated use of lightweight pyramid aggregation, multi-attention fusion, and the FCC loss. Therefore, this section focuses on why this parameter-efficient design remains effective across heterogeneous field environments.
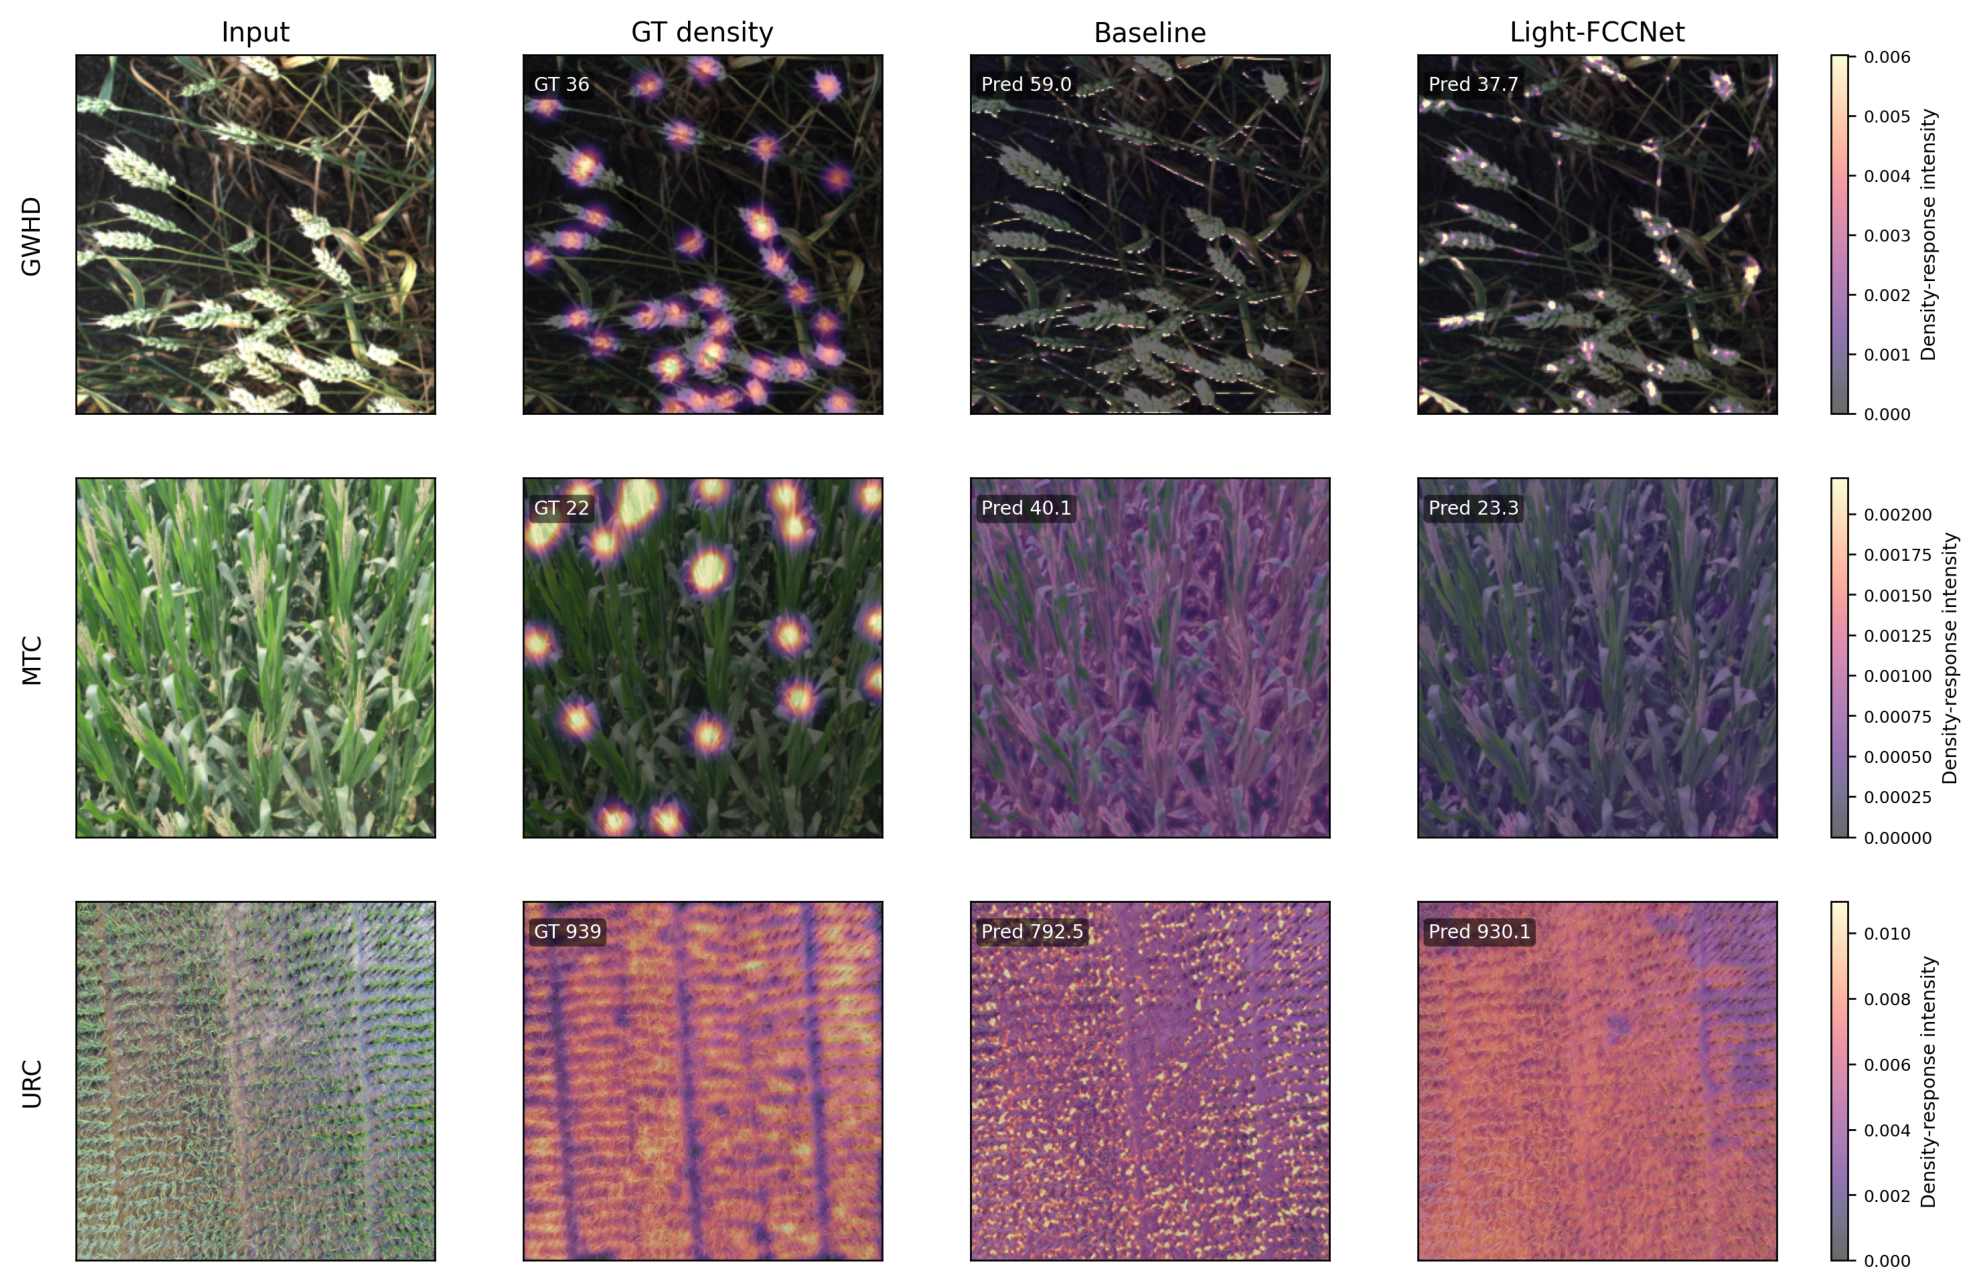
Beyond the quantitative evaluations,
Figure 5 provides a qualitative comparison of representative challenging field acquisitions characterized by complex background interference, dense target occlusion, and severe scale variance. To enhance interpretability, the visualization is organized as a comparative grid of “input image/ground-truth density/representative baseline prediction/Light-FCCNet prediction”. These samples are selected to illustrate typical field failure modes observed during validation, and the figure should be interpreted as qualitative evidence rather than as a statistically exhaustive sample of the full validation distribution.
4.1. Why Lightweight Pyramid Aggregation Helps
The primary function of the lightweight feature pyramid aggregation module is to enhance representational fidelity under scale variance, independent of a computationally burdensome encoder. In the context of field crop counting, individual acquisitions frequently encompass targets exhibiting disparate apparent scales, induced by variations in viewpoint, phenological stages, camera working distances, and localized occlusions. Should the representation exhibit a bias toward a restricted receptive-field range, diminutive crop organs might generate attenuated local responses, whereas enlarged or clustered targets risk excessive spatial smoothing. The empirical ablation results demonstrate that the integration of P1 consistently elevates performance relative to the baseline across all three evaluated datasets, thereby substantiating that lightweight multi-scale aggregation establishes a more robust foundation for density estimation.
This advancement is meaningful because it is achieved within a compact design. The value of P1 is not simply that it introduces additional scales; rather, it helps organize scale-aware representations while preserving a small parameter footprint. Within agricultural counting frameworks, this balance is important: smaller models reduce storage and integration costs, whereas reliable counting still depends on discriminative local responses under severe scale variation. The current empirical findings indicate that the proposed pyramid aggregation module improves this trade-off between structural compactness and representational capacity.
4.2. Why the Effect of Multi-Attention Is Data-Dependent
The discrete contribution of the multi-attention module is reflected by the transition from baseline_p1 to baseline_p1_p2. This transition produces clear gains on MTC and URC, where complex canopy architectures and cluttered backgrounds can introduce stronger non-target responses. On GWHD, the canonical single-run result is nearly unchanged, while the repeated-seed mean results show lower MAE and MSE for baseline_p1_p2. This pattern indicates that attention-guided fusion provides useful refinement once the pyramid representation has been constructed, but the observed magnitude of the gain varies with dataset characteristics.
This pattern suggests that P2 should be understood as a representation-refinement component whose benefit depends on the field scene structure. It improves the discriminative quality of the fused multi-scale representation, and its effect becomes strongest when the refined representation is further optimized by the FCC loss. In this context, P2 is not a generic standalone attention add-on, but a coordinated part of the Light-FCCNet pipeline that works together with P1 and P3 to improve density-map quality and global count consistency.
4.3. Why FCC Loss Is a Key Component
The canonical ablation trajectory shows that P3 is important for final performance. The transition from the baseline_p1_p2 configuration to the full model produces clear improvements across all three benchmarks, with the largest error reduction on the URC dataset. This consistent pattern indicates that stronger feature extraction alone is not sufficient for the strongest observed counting performance in this setting. The optimization objective must also encourage the model to preserve pixel-wise density fidelity, global count consistency, and the structural organization of the predicted density map.
This regulatory function is important in agricultural counting scenarios, where aggregate counting errors often arise from the accumulation of small local deviations during density-map integration. The FCC loss addresses this issue by combining density regression, global count supervision, and structural similarity constraints into a unified optimization objective. As a result, the final model can translate refined feature representations into more stable predictions. The progressive gains recorded across three heterogeneous datasets indicate that P3 is not a cosmetic addition, but a key part of the Light-FCCNet design.
4.4. Mechanistic Analysis Under Field-Specific Visual Challenges
The empirical gains of Light-FCCNet can be interpreted through the error mechanisms that commonly occur in field crop counting. Unlike image-level classification errors, density-regression errors are accumulated spatially: weak false responses over leaves, stems, shadows, or soil can sum to a non-negligible count bias, whereas weak target-region responses can underestimate small or partially occluded organs. Therefore, the role of the proposed components is not treated as generic module stacking. Instead, the components are organized around the field-specific error chain of scale-sensitive response formation, background-response suppression, and density-structure constrained optimization.
The first mechanism is scale-sensitive response degradation. Wheat heads, maize tassels, and rice panicles differ substantially in apparent size across datasets and even within a single image. Small organs may generate weak local density peaks, whereas larger or overlapped organs may be represented by over-smoothed responses. This mechanism explains why P1 is introduced as the representational basis of Light-FCCNet: lightweight pyramid aggregation provides multi-scale features that help maintain local density responses under a constrained parameter budget.
The second mechanism is background false-response accumulation. Leaves, stems, soil texture, shadows, and specular highlights can share color, edge, or texture cues with target organs. Under density-map regression, such regions may produce weak but spatially distributed false responses. Although each local response may be small, the responses can accumulate during density integration and introduce a measurable count bias. This mechanism motivates P2, where spatial-channel attention fusion is used to refine the pyramid representation and suppress non-target responses during feature fusion.
The third mechanism is density-structure distortion under occlusion. In dense field scenes, adjacent crop organs can merge into diffuse density blobs, reducing local separability and weakening the correspondence between visible organs and predicted density peaks. In this case, stronger feature extraction alone is insufficient. The prediction must also preserve the structure of the target density distribution. This explains the complementary role of P3: the FCC loss constrains density regression, global count consistency, and structural similarity so that the refined representation is converted into a more coherent density map.
These mechanisms indicate that the three proposed components address different stages of the same field-specific error process. P1 improves scale-aware response formation, P2 reduces background-induced false responses during feature fusion, and P3 constrains the final density map toward count-consistent and structurally coherent predictions. Therefore, the following background false-response analysis is used as a mechanism-specific diagnostic rather than as a universal substitute for MAE, MSE, or MAPE.
Table 8 reports the background false-response analysis used to diagnose this mechanism. To make the background-response mechanism measurable, the target mask
is generated from point annotations by marking local neighborhoods around annotated crop organs, and the background mask is defined as
. Given a predicted density map
, the background false-response integral is
and the normalized background false-response integral is
These quantities directly measure whether a model reduces accumulated density responses in visually similar non-target regions, rather than merely changing the global scale of the predicted density map. They can be compared across the
baseline,
baseline_p1,
baseline_p1_p2, and
full configurations so that the effect of multi-scale representation, attention-guided fusion, and FCC loss is interpreted against the same field-specific error mechanism.
The background-response measurements provide a mechanism-specific interpretation that complements the accuracy tables. On GWHD, nBFI decreases from 0.93 in the baseline to 0.79 in the full model, while MAE decreases from 16.19 to 13.28. This supports the interpretation that the coordinated representation and supervision reduce the proportion of predicted density assigned to non-target regions in wheat-head scenes. The intermediate configurations also show that P1 strongly reduces the absolute background integral, whereas the addition of P2 further reduces the normalized background share. On MTC, BFI decreases progressively from 37.36 to 29.98 while MAE decreases from 24.24 to 18.10. The normalized background share changes more moderately, suggesting that the improvement combines reduced absolute background accumulation with improved count calibration. On URC, the main accuracy gain is not accompanied by a monotonic reduction in nBFI: MAE decreases substantially from 94.53 to 61.30, whereas nBFI remains within a narrow range. This indicates that the URC improvement is more likely associated with improved target-region density structure and global count behavior than with background integral suppression alone. Therefore, BFI/nBFI should be interpreted as one mechanism-specific diagnostic rather than as a universal replacement for count-error metrics.
4.5. Implications for Field Crop Counting
Together, the dataset-level comparisons and canonical ablation results provide a clear interpretation of Light-FCCNet. Its empirical advantage is not obtained by increasing model capacity. Instead, with 0.92 M parameters, Light-FCCNet obtains the lowest MAE among the evaluated methods across all three datasets under the same experimental protocol through the coordinated use of multi-scale representation, attention-guided feature refinement, and counting-oriented supervision. Therefore, its lightweight characterization should be understood mainly in terms of parameter efficiency, model size, and architectural compactness, rather than absolute FLOP superiority. In applied agricultural analyses, this compact-model design is meaningful because smaller neural networks can reduce storage, transmission, and system-integration burdens while preserving the representation quality required by challenging field imagery.
The comparison with established baselines further supports this assessment. Conventional density regression (exemplified by CSRNet), context-augmented modeling (CAN), distribution-matching methods (DM-Count), heavily parameterized architectures (SASNet), and the implemented cross-task plant-counting baseline (TasselNetV2++) do not attain a better accuracy-parameter outcome than Light-FCCNet in the present comparison setting. This trend implies that, for agricultural quantification tasks, neither arbitrary expansion of model capacity nor isolated strengthening of contextual receptive fields is sufficient to realize a strong accuracy–compactness balance. A more effective direction is to address the three main constraints in field imagery together: scale variance, background perturbation, and aggregate count consistency.
Another implication concerns the design of the ablation study. The canonical ablation trajectory used in this manuscript is more faithful to the proposed architecture than a purely combinatorial interpretation of independent module switches. By defining P1 as pyramid aggregation, P2 as attention fusion conditioned on the pyramid representation, and P3 as the FCC loss, the experiments remain aligned with the method design. This alignment improves the interpretability of the empirical outcomes and makes the contribution easier to evaluate.
The FLOPs profile of Light-FCCNet also needs to be interpreted explicitly. As shown in
Table 4, Light-FCCNet has the smallest parameter count and FP32 model size among the evaluated methods, but it does not have the lowest FLOPs. The main computational overhead comes from multi-scale alignment in
P2, where several pyramid features are projected and upsampled before fusion. This design improves density-map quality under complex field conditions but increases arithmetic cost relative to methods such as TasselNetV2++. Therefore, the lightweight claim of this manuscript refers to parameter efficiency and storage compactness, not universal computational superiority. For deployment scenarios where inference throughput is the primary bottleneck, future optimization should target FLOPs reduction through more efficient scale alignment, operator fusion, or progressive low-resolution fusion.
5. Conclusions
This study introduces Light-FCCNet, a parameter-efficient and accurate density-regression framework tailored for field crop counting. The proposed method integrates three coordinated components: a lightweight feature pyramid aggregation module for extracting scale-aware representations, a multi-attention module for refined multi-scale feature fusion, and an FCC loss tailored for counting-oriented optimization. Rather than functioning as an arbitrary collection of independent branches, these elements form a progressive counting framework in which structural representation and optimization strategy are jointly considered.
Evaluations across the GWHD, MTC, and URC benchmarks demonstrate that the canonical full configuration consistently yields the lowest errors across the main ablation trajectory. Comparisons with established baselines including CSRNet, CAN, DM-Count, SASNet, and our implementation of TasselNetV2++ further show that Light-FCCNet obtains the lowest MAE among the evaluated methods across all three datasets under the same experimental protocol while using 0.92M parameters. This result supports its parameter efficiency and structural compactness in complex agricultural environments. The empirical results also show that this advantage does not stem from any single module; instead, the lightweight pyramid aggregation establishes the multi-scale basis, the multi-attention fusion refines this representation, and the FCC loss translates these representation gains into improved counting accuracy. These findings validate the proposed architecture and confirm that the definitions of P1, P2, and P3 are supported by the experimental results.
Overall, Light-FCCNet illustrates that robust crop-counting accuracy can be achieved with a compact model footprint when feature representation, multi-scale fusion, and loss optimization are designed as a cohesive system rather than loosely concatenated auxiliary add-ons. The main practical implication is that parameter-efficient agricultural counting should be approached as a structured, domain-specific design problem rather than as a simple exercise in reducing backbone width or transplanting generic crowd-counting methods. For future studies with similar field imagery, the full configuration can serve as a preferred setting when accuracy and compact parameter storage are jointly prioritized. The pyramid aggregation component can be retained as the multi-scale representation basis, and the FCC loss weight can be treated as a low-magnitude structural regularization coefficient. This configuration is particularly relevant to applications that value accuracy, parameter efficiency, and model storage, while deployment-specific computational optimization can be further adapted to the target hardware.
The framework is intended to support end users who require repeatable crop-organ counting from field images, including agronomists, plant-phenotyping researchers, precision-agriculture practitioners, and crop breeders. In these settings, a compact counting model can reduce storage and integration costs while preserving the density-map quality needed for phenotyping and yield-related assessment. Future work will extend this framework to broader agricultural benchmarks, more complete crop-specific comparisons, additional crop types beyond wheat, maize, and rice, more deployment-oriented efficiency analysis, richer interpretability studies, larger repeated-run stability evaluations, and more challenging cross-domain or cross-resolution settings.