Article

Comprehensive Assessment of Aluminum Tolerance in Celery (Apium graveolens L.) Germplasm and Its Physiological Basis


College of Horticulture, Sichuan Agricultural University, Chengdu 611130, China
*
Author to whom correspondence should be addressed.
These authors contributed equally to this work.
Agronomy 2026, 16(11), 1105; https://doi.org/10.3390/agronomy16111105
Submission received: 8 May 2026 / Revised: 25 May 2026 / Accepted: 1 June 2026 / Published: 3 June 2026
(This article belongs to the Section Crop Breeding and Genetics)

Abstract

Aluminum (Al) toxicity is an important factor limiting crop production in acidic soils; however, systematic evaluation of Al tolerance and its physiological basis in celery (Apium graveolens L.) remains limited. In this study, 400 μmol·L−1 AlCl3 was identified as the appropriate concentration for Al-tolerance screening through a concentration-gradient experiment. Based on this concentration, 43 celery germplasm accessions were evaluated using 14 morphological and physiological traits. A comprehensive evaluation framework for Al tolerance was established using principal component analysis, membership function analysis, and hierarchical cluster analysis. The comprehensive A-value index enabled quantitative evaluation and classification of Al tolerance, and the accessions were divided into five categories ranging from highly Al-tolerant to highly Al-sensitive. Furthermore, key indicators were identified through stepwise regression analysis, which simplified the evaluation system while maintaining its assessment reliability. Physiological analysis of contrasting accessions showed that Al tolerance in celery was closely associated with restricted Al accumulation, enhanced redox homeostasis, and maintenance of photosynthetic system stability. Among these processes, the coordinated regulation of antioxidant defense and light energy utilization efficiency may represent an important physiological basis for tolerance differentiation. Overall, this study established an integrated framework from screening-concentration optimization to comprehensive evaluation and physiological characterization, providing a technical reference for the screening, evaluation, and breeding utilization of Al-tolerant celery germplasm.

1. Introduction

Soil acidification remains a major constraint on agricultural ecosystems worldwide. It has been estimated that acidic soils affect approximately 30% of the global land area and nearly 50% of potentially arable land [1,2]. Over the past three decades, soil acidification has been substantially accelerated not only by natural processes but also by anthropogenic activities, including acid deposition, industrial and agricultural emissions, and the excessive application of nitrogen fertilizers [3,4,5]. In acidic soils, particularly under conditions of pH < 5.0, aluminum bound to soil minerals can be solubilized and released as free Al3+, a highly phytotoxic ionic form, thereby becoming a major factor limiting crop growth, development, and yield formation [6,7]. Excessive Al3+ not only inhibits root growth but may also transmit stress effects from roots to shoots, thereby impairing whole-plant physiological processes. Moreover, aluminum stress can induce the accumulation of reactive oxygen species (ROS), promote oxidative damage, and disrupt key physiological processes, including photosynthesis [8]. Therefore, alleviating aluminum toxicity has become an urgent priority for maintaining crop productivity and promoting sustainable agricultural development.
Plants have evolved multiple strategies to cope with aluminum toxicity during long-term adaptation [9]. These mechanisms mainly include Al exclusion, which restricts Al entry into root cells through processes such as root-mediated organic acid secretion [10], and internal detoxification, which reduces Al toxicity through intracellular chelation and compartmentalization [11]. In addition, aluminum stress can activate antioxidant defense systems and promote the accumulation of osmoprotectants, thereby alleviating oxidative damage and maintaining cellular homeostasis [12,13]. Maintaining the structural integrity and functional stability of chloroplasts and the photosynthetic apparatus is also an important physiological feature associated with plant responses to aluminum stress. Because aluminum tolerance in plants is a complex quantitative trait controlled by multiple physiological and genetic factors, a single morphological or physiological indicator is insufficient to comprehensively and objectively reflect the actual level of tolerance. In recent years, multivariate statistical methods, including principal component analysis (PCA), membership function analysis, and stepwise regression analysis, have been widely used to screen stress-tolerant germplasm and construct comprehensive evaluation systems in crops such as potato [14], grape [15], and sorghum [16], because these methods can reduce information redundancy among indicators and improve the dimensionality reduction and integration of complex datasets.
Celery (Apium graveolens L.) is a biennial herbaceous vegetable belonging to the genus Apium in the family Apiaceae. Originating from the Mediterranean region, celery is now widely cultivated worldwide [17]. Celery is rich in vitamins, apigenin, flavonoids, terpenoids, and other bioactive compounds, which contribute to its nutritional, functional, and medicinal value [18,19]. Because of its typically shallow root system, celery is highly responsive to changes in the surface soil environment and may therefore be more vulnerable to free Al3+ toxicity in acidic soils, potentially restricting yield formation and quality development [20]. To date, studies on stress tolerance in celery have mainly focused on salt tolerance [21] and heat tolerance [22], whereas systematic aluminum-tolerance evaluation, the construction of a comprehensive assessment framework, and the physiological basis of tolerance differentiation among extreme germplasm accessions remain insufficiently explored. Given the increasing threat of soil acidification, identifying celery germplasm with superior aluminum-tolerance potential and elucidating the physiological mechanisms underlying this tolerance are essential for stress-resistance breeding in celery.
Based on this background, the present study used 43 celery germplasm accessions as experimental materials to systematically evaluate aluminum tolerance under Al3+ stress. By integrating multi-trait measurements with multivariate statistical analyses, this study aimed to: (1) construct a comprehensive evaluation system for aluminum tolerance in celery and classify germplasm accessions according to their tolerance levels; (2) identify core indicators for aluminum-tolerance assessment to improve evaluation efficiency; and (3) characterize physiological response differences between accessions with contrasting tolerance levels through comparative analysis of extreme germplasm. This study provides a theoretical and methodological basis for screening aluminum-tolerant celery germplasm and supporting subsequent stress-resistance breeding.

2. Materials and Methods

2.1. Plant Materials

The experimental materials comprised 43 celery varieties collected from different regions. Supplementary Table S1 provides detailed information on the varieties.

2.2. Experimental Design

2.2.1. Cultivation of Celery Seedlings

Celery seeds were first soaked in a 100 mg/L gibberellic acid solution for 24 h. The seeds were then placed in a light-controlled incubator set at 22 °C and 80% relative humidity to germinate. The seedlings were then transferred to seedling trays containing sponge substrates until they reached the four-leaf-and-one-heart stage, after which they were cultivated for two weeks in hydroponic chambers containing 1/2 Hoagland nutrient solution. The nutrient solution was replaced every 5 days. Seedlings exhibiting robust and consistent growth were finally selected for subsequent aluminum stress treatment.

2.2.2. Aluminum Stress Treatment

To determine the optimal aluminum stress concentration for evaluating aluminum tolerance in celery, a preliminary concentration-gradient experiment was conducted using AlCl3 (Shanghai Macklin Biochemical Co., Ltd., Shanghai, China) as the aluminum source. Five celery germplasm accessions were randomly selected and cultivated under hydroponic conditions as experimental materials. The treatment without AlCl3 was used as the control (CK), whereas the treatments supplemented with AlCl3 were defined as aluminum stress treatments (AS). Four AlCl3 concentrations were established at 100, 200, 400, and 600 μmol·L−1. During the experiment, the pH of the treatment solution was monitored daily and maintained at 4.5 using HCl or NaOH. The treatment solution was replaced every 3 d, and the AlCl3 stress treatment was continued for 7 d.
The aluminum tolerance coefficient (AC) for each trait was calculated as the ratio of the value under Al treatment to the corresponding value under CK. Based on these values, the variation patterns of AC values under different Al3+ concentrations were compared. In addition, coefficient of variation (CV) analysis was used to evaluate the discriminatory capacity of each treatment for distinguishing differences among germplasm accessions. The appropriate Al stress concentration was then selected for subsequent aluminum-tolerance screening and comprehensive evaluation of the 43 celery germplasm accessions.
The same replicate design and sampling procedures were used for both the preliminary concentration-gradient experiment and the subsequent Al-tolerance evaluation of the 43 celery germplasm accessions. For each accession × treatment combination, three biological replicates were established, each consisting of 12 uniformly developed seedlings. After 7 d of treatment, five seedlings from each replicate were randomly selected for growth parameter measurements, and their mean value was used as the value of the corresponding biological replicate. An additional five seedlings from each replicate were randomly selected, and their fresh leaf tissues were collected and pooled as one biological sample. Three independent biological samples were obtained for each accession × treatment combination. The samples were immediately frozen in liquid nitrogen and stored at −80 °C for subsequent physiological and biochemical analyses. Each physiological and biochemical assay was performed with three technical replicates.

2.3. Measurement Growth and Physiological Indicators

2.3.1. Measurement of Growth Indicators

The plant height (PH) and root length (RL) were measured using a ruler (Deli Group Co., Ltd., Ningbo, China), while the stem thickness (ST) was measured using a vernier caliper (Guilin Guanglu Measuring Instrument Co., Ltd., Guilin, China). The fresh weight of the shoot parts (SFW) and root system (RFW) of celery seedlings under different treatments was weighed separately. The aboveground and root samples were then blanched in an oven at 105 °C for 30 min, and then dried at 60 °C until a constant dry weight of the shoot parts (SDW) and root system (RDW) was achieved.

2.3.2. Measurement of Physiological Indicators

Chlorophyll (Chl) was extracted with 95% ethanol under dark conditions for 48 h, and Chl content was calculated from the absorbance values measured at 665, 649, and 470 nm [23]. Soluble sugar (SS) was extracted in a boiling water bath for 20 min, followed by reaction with anthrone reagent, and absorbance was measured at 620 nm. SS content was determined using a glucose standard curve [24]. Malondialdehyde (MDA) was extracted using 10% (w/v) trichloroacetic acid. The supernatant was reacted with 0.6% thiobarbituric acid solution in a boiling water bath for 15 min, after which absorbance values at 532, 600, and 450 nm were recorded [25]. Fresh leaf tissue (0.5 g) was ground in liquid nitrogen and homogenized in 5 mL phosphate buffer (50 mM, pH 7.8). After centrifugation at 4 °C, the supernatant was collected for subsequent analysis. Soluble protein (SP) content was determined at 595 nm using the Coomassie Brilliant Blue G-250 method [26]. Superoxide dismutase (SOD) activity was measured at 560 nm using the NBT photochemical reduction method, whereas peroxidase (POD) and catalase (CAT) activities were determined by monitoring absorbance changes at 470 nm (guaiacol oxidation) and 240 nm (H2O2 decomposition), respectively [27].

2.3.3. Determination of Chlorophyll Fluorescence Parameters

Chlorophyll fluorescence parameters were measured using a portable fluorometer (Walz PAM-2500, Effeltrich, Germany). The maximum photochemical efficiency of PSII (Fv/Fm), quantum yield of photosystem II (Y(II)), photochemical quenching (qP), photochemical quenching based on the lake model (qL), non-photochemical quenching (NPQ), non-photochemical quenching (qN), and electron transport rate (ETR) were recorded.

2.4. Data Processing and Statistical Analysis

Data were processed and organized using Microsoft Excel 2024 (Microsoft Corporation, Redmond, WA, USA). Statistical analyses, including correlation analysis, principal component analysis (PCA), and membership function analysis, were performed using SPSS version 26.0. Differences among treatments were assessed by one-way analysis of variance (ANOVA), followed by Duncan’s multiple range test for mean comparisons at p < 0.05. Figures were generated using GraphPad Prism 10.4 (GraphPad Software, Boston, MA, USA).
The aluminum tolerance coefficient (AC) was calculated based on various morphological and physiological indicators measured under AS CK treatments. Comprehensive aluminum tolerance coefficient (CAC), weighted aluminum tolerance coefficient (WAC), and aluminum tolerance composite value (A) were derived from AC values using the respective formulas below. These values were subsequently used to establish a comprehensive aluminum tolerance evaluation system for assessing aluminum tolerance in celery germplasm resources.
A C = A S i C K i                         i = 1 , 2 , 3 , n
C A C = 1 n i = 1 n A C                         i = 1 , 2 , 3 , n
In the formulas for deriving AC and CAC, i denotes the i-th measured value of the indicator under AS and CK treatments.
F = a 1 F 1 + a 2 F 2 + a i F i                         i = 1 , 2 , 3 , n
In the formula, ai denotes the variance ratio of the i-th principal component, while Fi denotes the score of the i-th principal component.
U x i = X i X i m i n X i m a x X i m i n                         i = 1 , 2 , 3 , n
ω i = P i n = 1 n P i                         i = 1 , 2 , 3 , n
A = i = 1 n U x i × ω i                         i = 1 , 2 , 3 , n
In the formula for deriving A, X i denotes the value of the i-th composite indicator, U x i represents the membership function value of the i-th composite indicator, X i m a x and X i m i n denote the maximum and minimum values of the i-th composite indicator, respectively, ω i is the weight of the i-th composite indicator, and P i is the contribution rate of the i-th principal component.
ω i γ = γ i i = 1 n γ i                         i = 1 , 2 , 3 , n
W A C = i = 1 n A C × ω i γ   i = 1 , 2 , 3 , n
In the formula to derive WAC, value A serves as the reference sequence, while the AC values of each indicator form the comparison sequence for grey correlation analysis. Their correlation yields the grey correlation degree (γi) between each indicator’s AC value and the reference value A, along with the weighting coefficient ω i γ .

3. Results

3.1. Determination of the Screening Concentration for Aluminum Stress

To determine the optimal Al3+ stress concentration for evaluating aluminum tolerance among 43 celery germplasm accessions, a concentration-gradient assay was performed using different Al3+ levels. The results showed that Al3+ stress intensity markedly influenced the phenotypic differentiation among celery accessions (Figure 1A–C). Under low Al3+ treatments (100–200 μmol·L−1), the aluminum-tolerance coefficients for plant height and root length remained relatively high across accessions, ranging from approximately 0.77 to 0.95. Meanwhile, the coefficients of variation were also low, ranging from 3.29% to 9.85% for plant height and from 6.90% to 8.84% for root length. These results indicate that genotypic differences were not sufficiently resolved within this concentration range, resulting in limited discriminatory capacity. When the Al3+ concentration increased to 400 μmol·L−1, the inter-accession dispersion of aluminum-tolerance coefficients increased markedly. The coefficients of variation for plant height and root length reached 10.31% and 9.49%, respectively, the highest values observed among all treatments. This finding suggests that 400 μmol·L−1 AlCl3 provided the greatest resolution of differences among accessions, thereby offering strong discriminatory power for aluminum-tolerance screening. However, when the Al3+ concentration was further increased to 600 μmol·L−1, although the aluminum-tolerance coefficients continued to decline, the coefficients of variation for plant height and root length decreased to 8.99% and 7.80%, respectively, both of which were lower than those recorded at 400 μmol·L−1. This indicates that excessive stress intensity weakened inter-accession differences, thereby reducing the effectiveness of tolerance discrimination.
Taken together, the 400 μmol·L−1 AlCl3 treatment achieved the best balance between stress intensity and discriminatory capacity. This concentration effectively enhanced variation among celery germplasm accessions and was therefore selected as the appropriate stress level for subsequent aluminum-tolerance evaluation in celery.

3.2. Changes in Phenotypic Characteristics of Celery Germplasm Resources Under Aluminum Stress

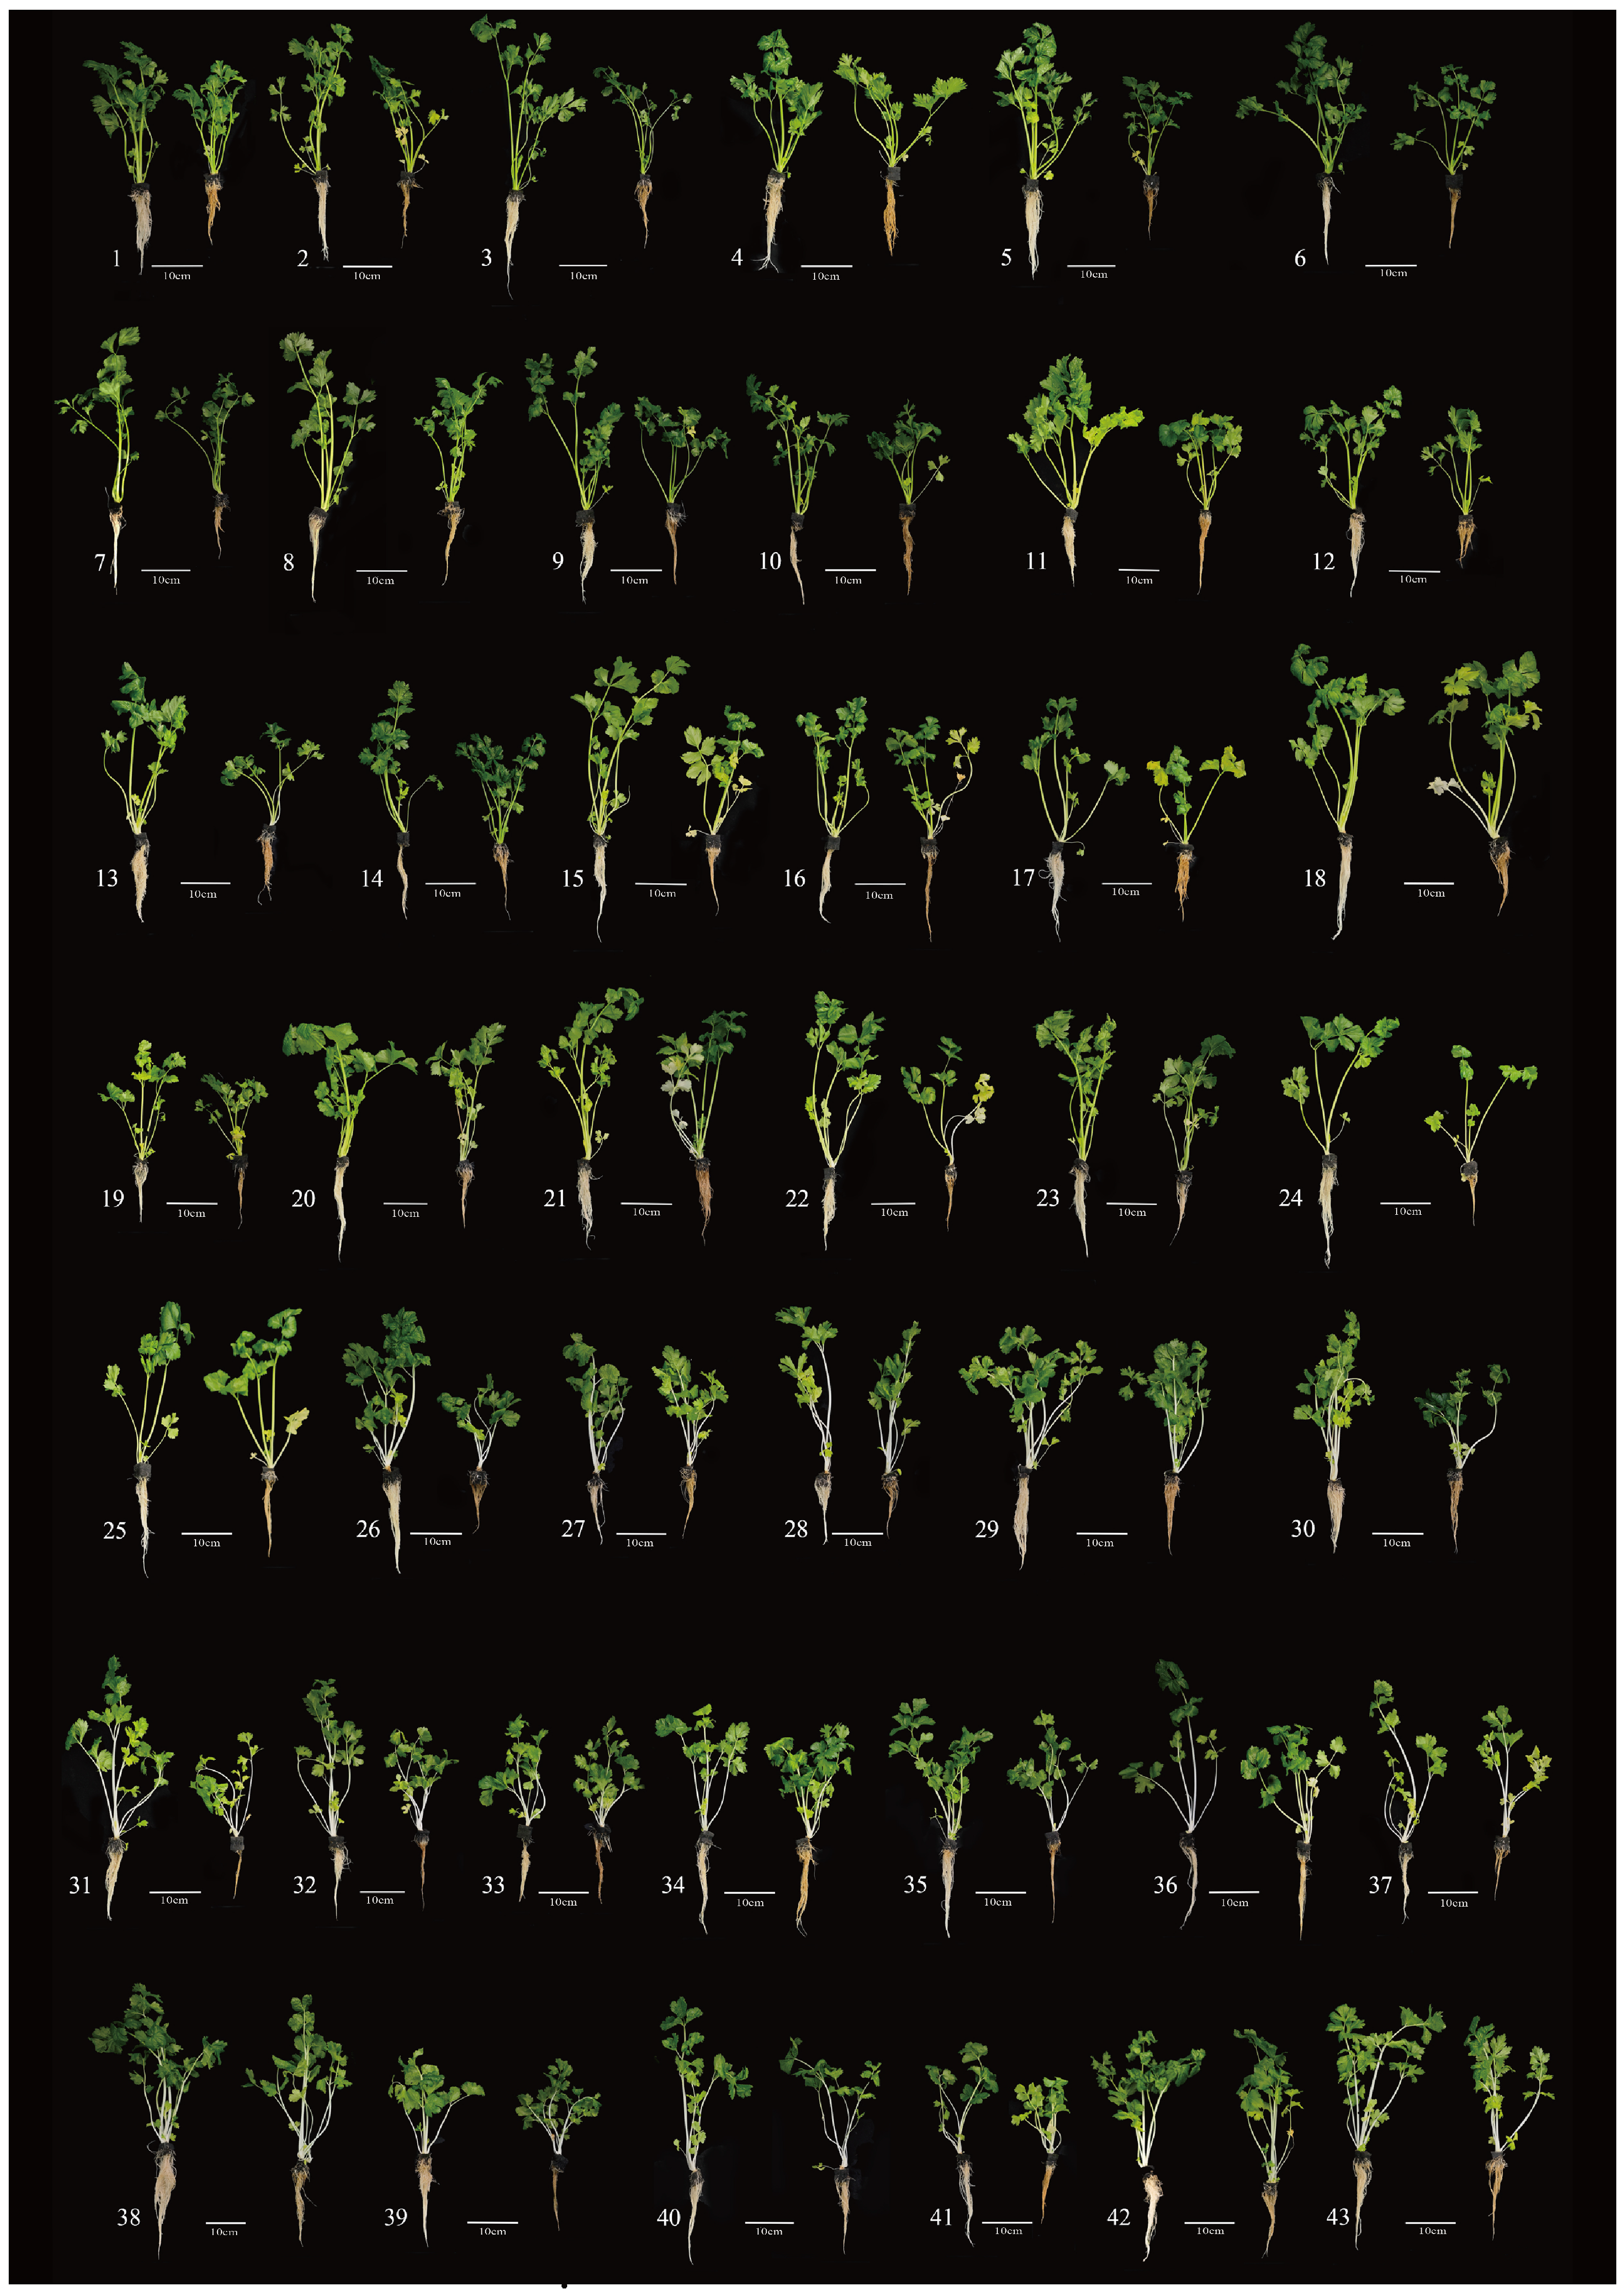
The 43 celery varieties exhibited well-developed root systems, fully expanded leaves, and overall healthy growth under normal growth conditions (Figure 2). In contrast, most celery varieties exhibited weakened overall growth, characterized by reduced plant height, thin stems, and symptoms of root browning and elongation inhibition, under aluminum stress. Notably, varieties 25, 27, 28, 33, and 42 exhibited relatively minor changes in overall growth compared to the control treatment, indicating lower stress susceptibility. In contrast, varieties 3, 5, 9, 13, and 26 exhibited significantly impaired growth compared to the control. The plant height of the 43 varieties under aluminum stress ranged between 17 and 35.56 cm, with reductions of 6.57% to 35.54% compared to the control. Their stem diameter ranged between 2.26 and 4.39 cm, with reductions of 6.80% to 48.85%, while their root length ranged between 10.50 and 19.33 cm, with reductions of 5.85% to 43.02% compared to the control. These findings indicated that aluminum stress disrupted the normal growth and development of celery, inducing a series of observable phenotypic abnormalities.

3.3. Responses of Various Morphological and Physiological Indicators of Celery to Aluminum Stress

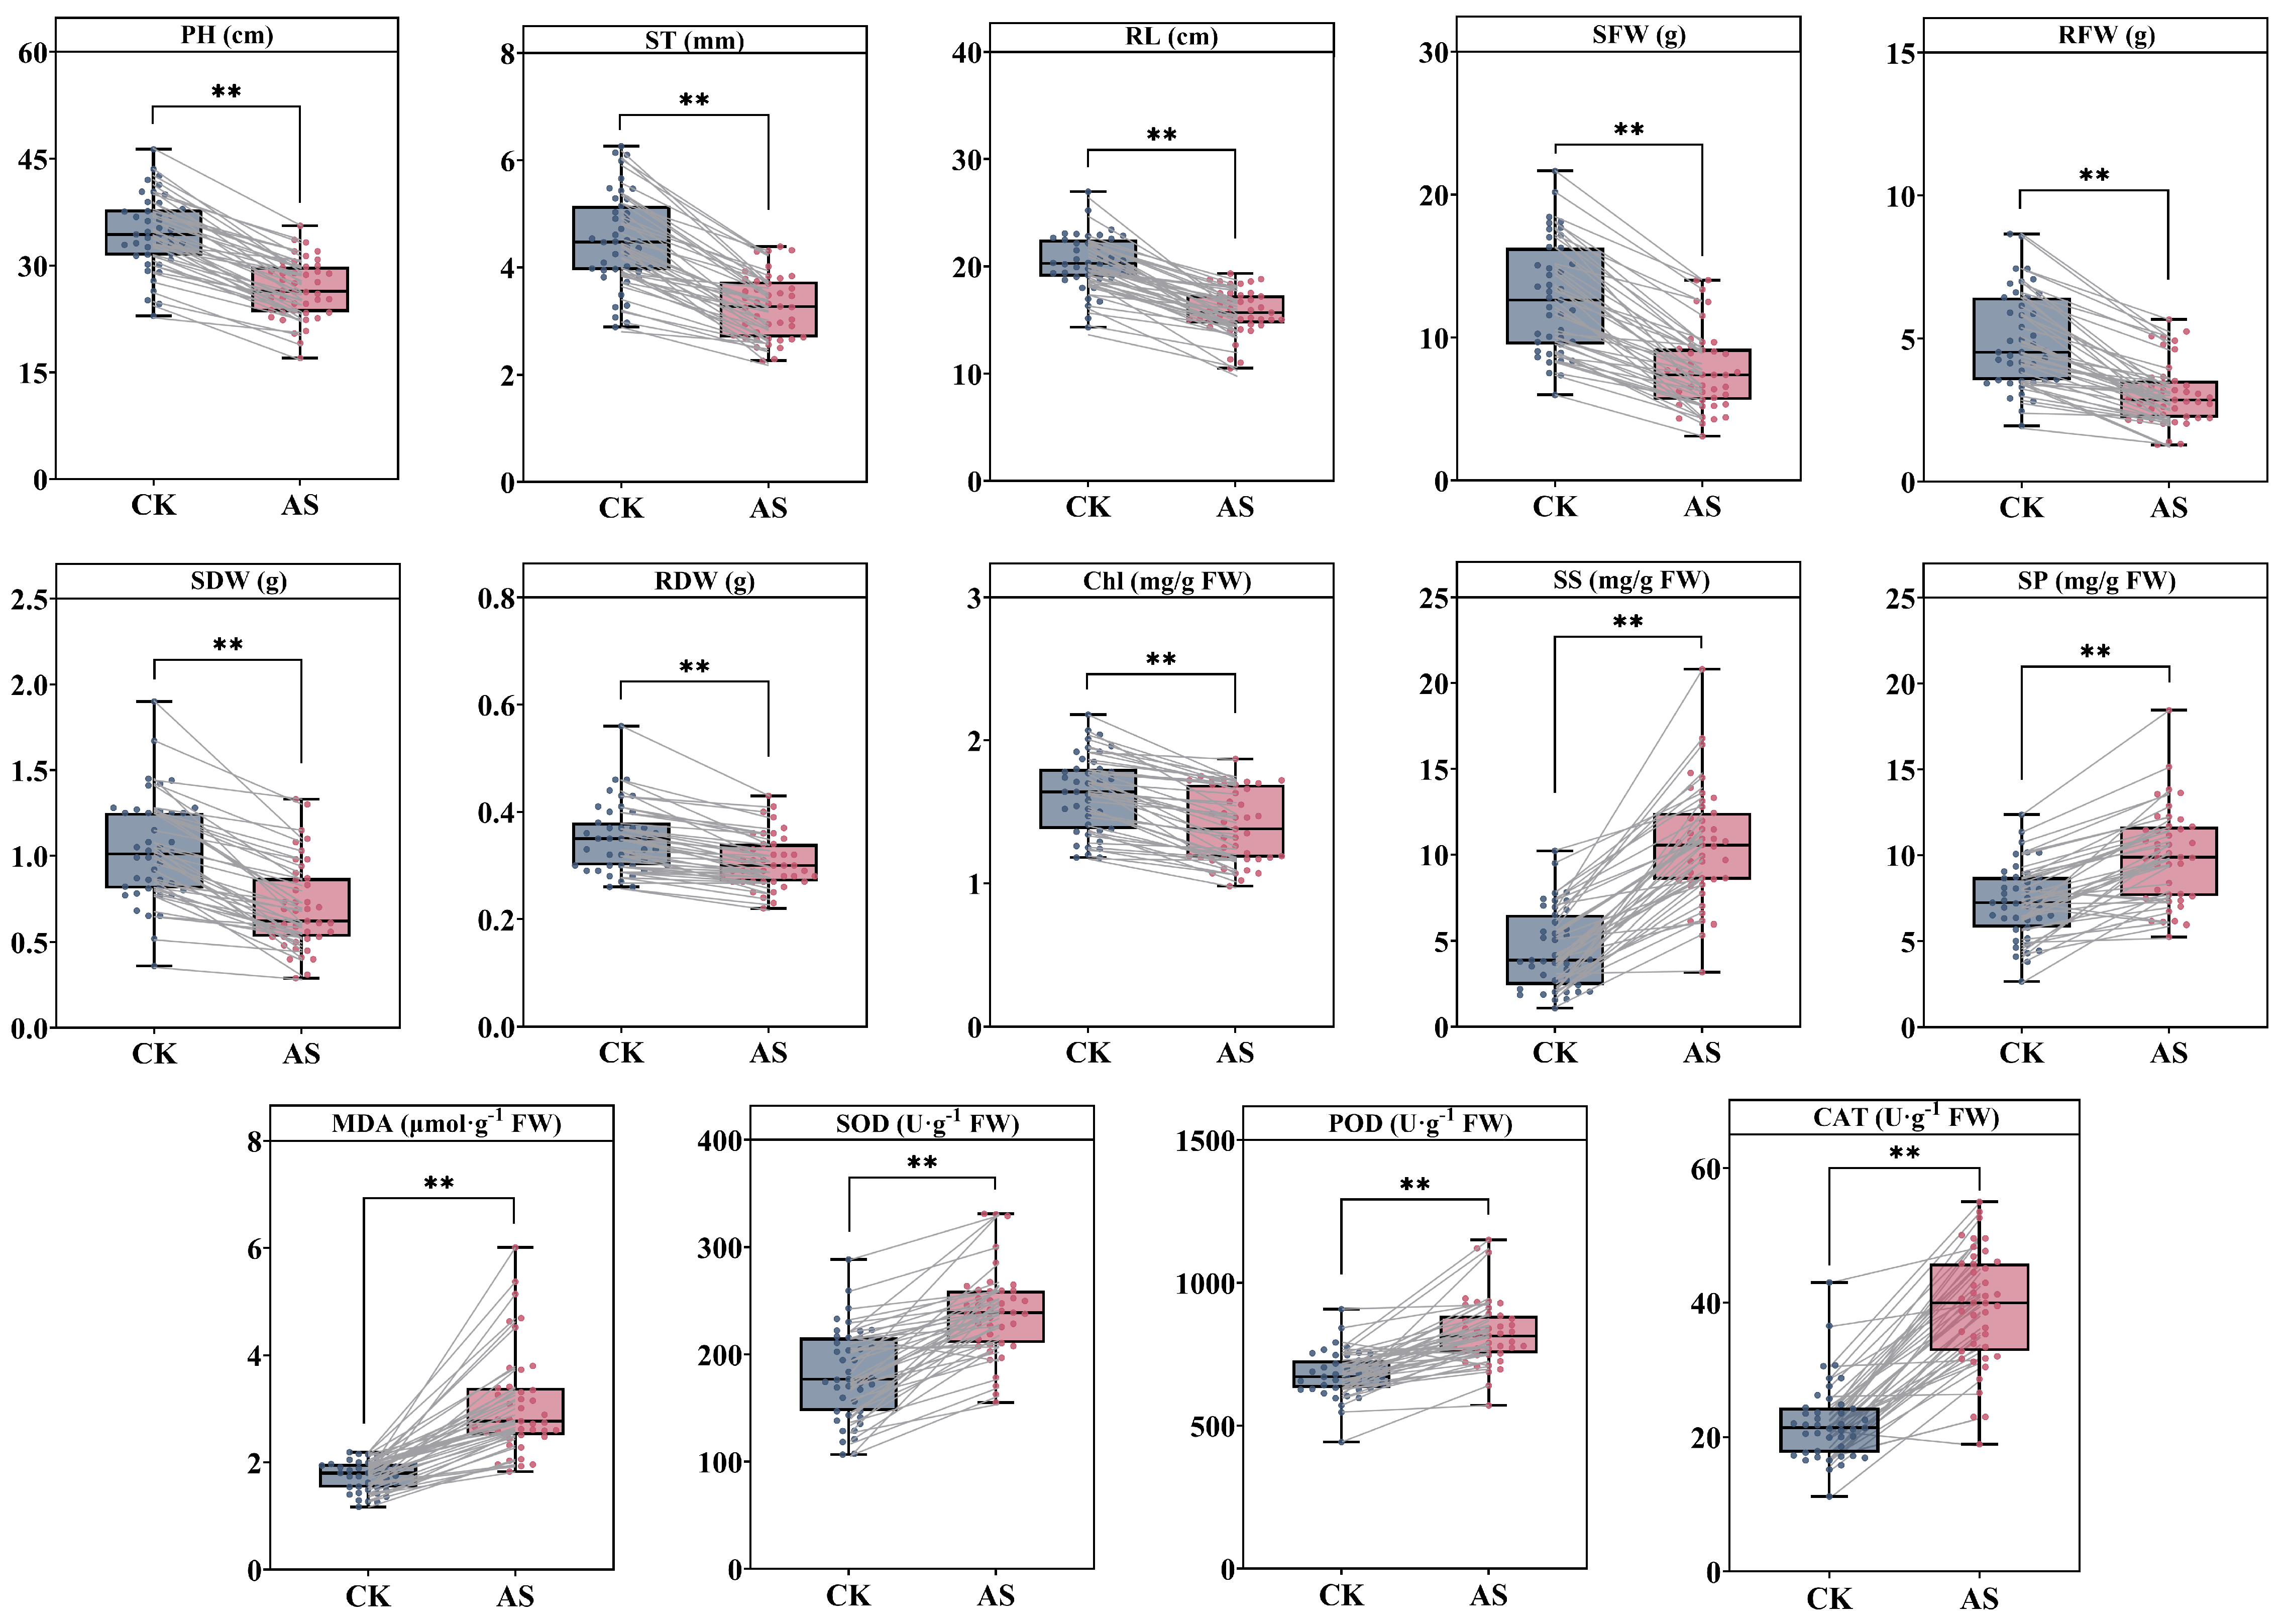
Box-and-whisker plots for the CK and AS groups revealed significant differences in responses of celery traits to aluminum stress (Figure 3). All 43 celery varieties exhibited significantly reduced plant height, stem diameter, root length, dry and fresh aboveground weight, dry and fresh root system weight, and chlorophyll content under aluminum stress compared to the control. The order of decrease was SFW (39.70%) > RFW (35.86%) > SDW (31.25%) > ST (26.45%) > PH (22.54%) > RL (22.15%) > Chl (14.00%) > RDW (11.44%). Moreover, the levels of malondialdehyde, soluble sugars, and soluble proteins, as well as SOD, POD, and CAT activities, significantly increased under aluminum stress compared to the control. The magnitude of increase was SS (185.89%) > CAT (82.61%) > MDA (76.33%) > SP (43.55%) > SOD (35.84%) > POD (22.13%). These findings revealed that various indicators exhibit varying degrees of increase or decrease in response to aluminum stress. The findings further underscored the importance of using a multi-indicator integrated approach to comprehensively characterize celery’s aluminum tolerance as opposed to using a single indicator.

3.4. Aluminum Tolerance Coefficients of Various Parameters in Celery and Their Correlation Analysis

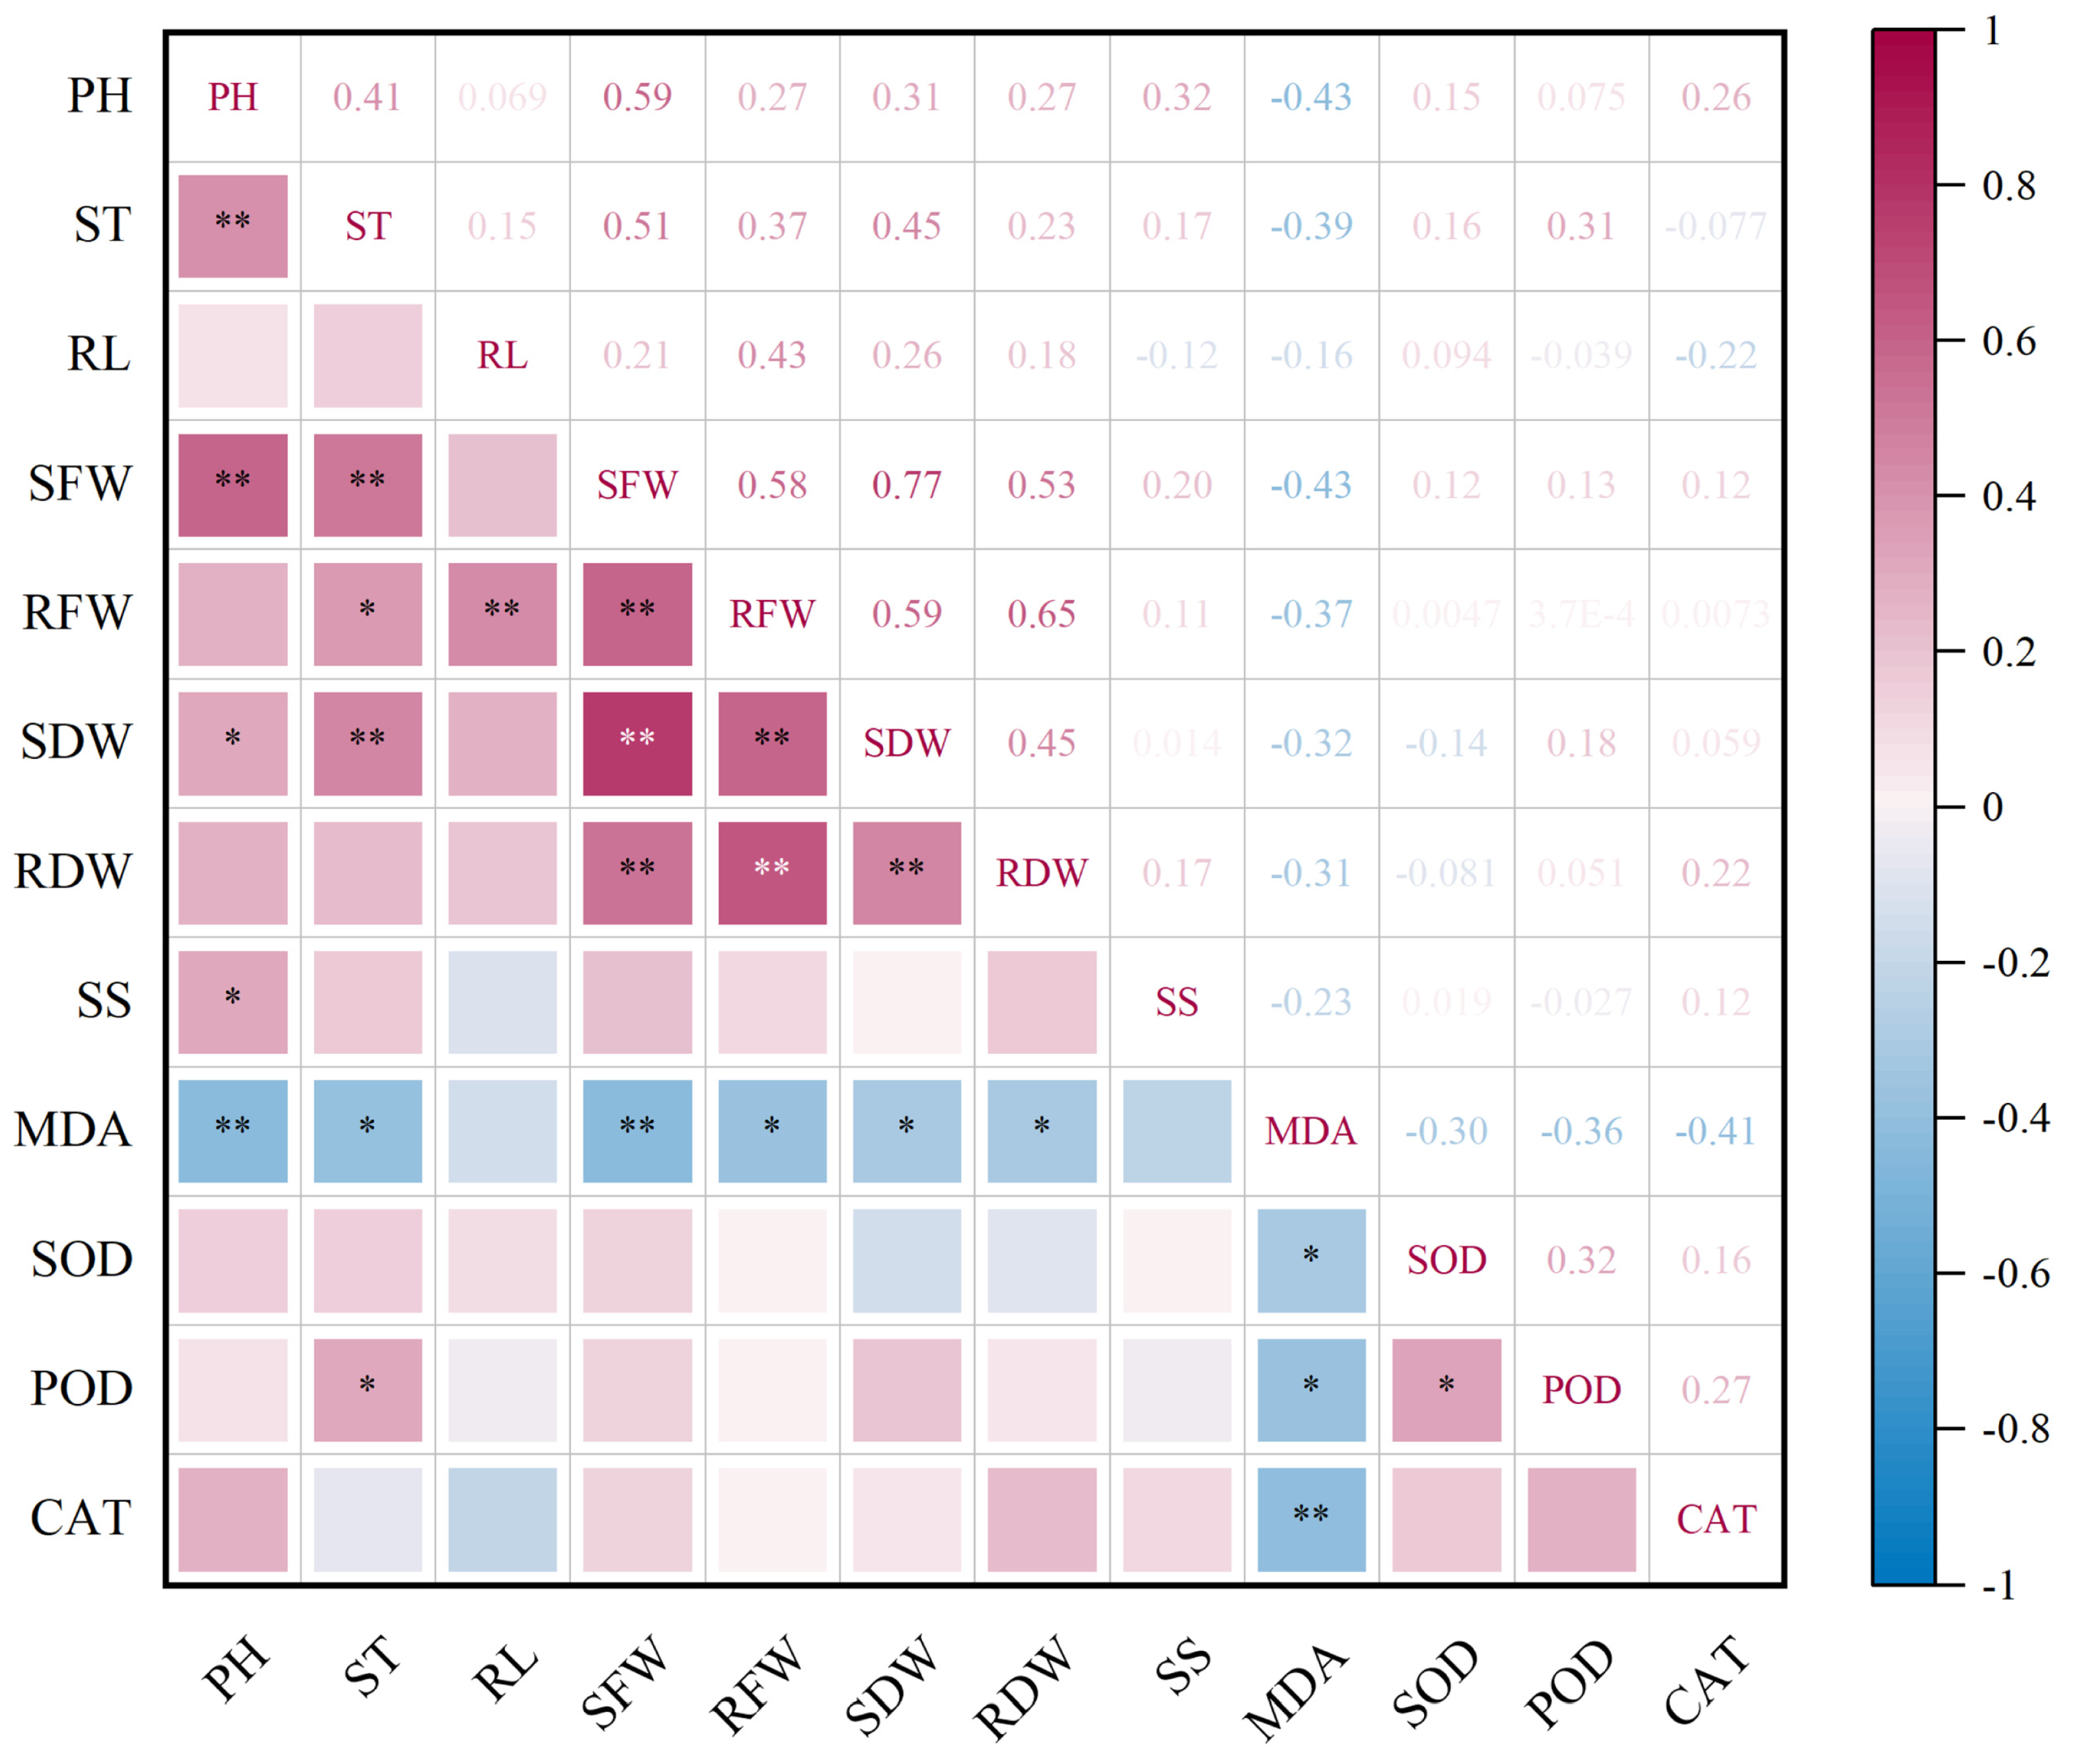
The aluminum tolerance coefficients for each measured index of 43 celery varieties were calculated using Formula (1) (Table S2). Notably, the aluminum tolerance coefficients varied significantly across different indices. The coefficient of variation (CV) ranged between 7.85% and 51.51%, with the CV of soluble sugar being the largest, while that of dry root weight was the smallest. The order of variation magnitude in CV from the highest to lowest was SS > SP > MDA > RFW > CAT > SFW > SDW > SOD > POD > ST > RL > Chl > PH > RDW. Figure 4 shows the correlation analysis of aluminum tolerance coefficients. PH exhibited extremely significant positive correlations with ST and SFW, and a significant positive correlation with SDW. SFW demonstrated extremely significant positive correlations with SDW, RDW, and RFW. ST exhibited significant positive correlations with RFW and SDW, while RL exhibited a significant positive correlation with RFW. These correlations indicate that most growth-related traits showed consistent variation under aluminum stress. MDA exhibited extremely significant negative correlations with PH, ST, and SFW. However, it exhibited significant negative correlations with RFW, SDW, and RDW, suggesting that oxidative damage is a crucial factor inhibiting celery growth under aluminum stress. There were significant negative correlations between MDA and SOD, POD, and CAT. SOD exhibited a significant positive correlation with POD. These findings suggested that the antioxidant defense system was effectively activated to mitigate damage.

3.5. Principal Component Analysis of Aluminum Tolerance Coefficients for Each Trait

Principal component analysis (PCA) was conducted on the aluminum tolerance coefficients of various traits under aluminum stress to overcome the complexity of multi-indicator evaluation, extract crucial indicators, and have a comprehensive performance of celery varieties under aluminum stress (Table 1). The most compositional information was concentrated in the first six principal components, with their cumulative eigenvalue contribution reaching 77.470%. This percentage encompassed most of the information expressed by the original traits, thereby meeting the extraction requirements. The first principal component had an eigenvalue of 4.074, with information primarily derived from PH, ST, SFW, RFW, SDW, and RDW. The second principal component had an eigenvalue of 1.988, with information mainly from SP, RL, and MDA. The third principal component had an eigenvalue of 1.363, with information primarily from SOD and POD. The fourth principal component has an eigenvalue of 1.256, with its information primarily derived from CAT. The fifth principal component has an eigenvalue of 1.164, with its information mainly from Chl. The sixth principal component has an eigenvalue of 1.001, with its information primarily from SS.
Because different principal components vary in their ability to explain the total variation in the original dataset, this study used the ratio of each principal component contribution rate to the cumulative contribution rate as a weighting coefficient to construct the comprehensive F-value model. This approach integrated information from multiple principal components and facilitated the comprehensive evaluation and ranking of aluminum tolerance among different materials while retaining the major variation information contained in the original multi-trait dataset. The equation for the comprehensive quality evaluation is as follows:
F = 0.376 F 1 + 0.183 F 2 + 0.126 F 3 + 0.116 F 4 + 0.107 F 5 + 0.09 F 6

3.6. Comprehensive Evaluation of Aluminum Tolerance in Celery Varieties

The A, CAC, WAC, and F values for each variety were calculated using Equations (2), (6), (8) and (9), respectively. Aluminum tolerance was assessed using four distinct methods (Table 2). A values ranged between 0.222 and 0.681. Varieties exhibiting the highest aluminum tolerance based on the A values included ‘Siji Xiqin’, ‘Shubaiqin No. 1’, and ‘Youdian’. In contrast, ‘Ruixue No. 2’, ‘Jidanhuang-Chunbulao Xiangqin’, and ‘Susheng Qincai’ exhibited extreme sensitivity to aluminum stress. F values ranged between −1.961 and 1.327. The strongly aluminum-tolerant varieties based on the F values included ‘Shubaiqin No. 1’, ‘Huangyu Xiangqin’, and ‘Kexing Cuinen Baiganqin’, while the extremely aluminum-sensitive varieties comprised ‘Ruixue No. 2’, ‘Wentula Xiqin’, and ‘Jidanhuang-Chunbulao Xiangqin’. CAC values ranged between 0.650 and 1.270. The strongly aluminum-tolerant varieties based on the CAC values included ‘Siji Kongxinbai Qincai’, ‘Chunbulao Huangqin’, and ‘Chuanbaigan’. In contrast, ‘Wentula Xiqin’, ‘Jidanhuang-Chunbulao Xiangqin’, and ‘Huangyu Shiqin’ exhibited extreme sensitivity to aluminum stress. WAC values ranged between 0.568 and 1.189. The strongly aluminum-tolerant varieties based on WAC values included ‘Siji Kongxin Baiqin’, ‘Chunbulao Huangqin’, and ‘Shubaiqin No. 1’. In contrast, ‘Wentula Xiqin’, ‘Jidanhuang-Chunbulao Xiangqin’, and ‘Baoqin’ exhibited extreme sensitivity to aluminum stress. Rankings based on A, CAC, WAC, and F values exhibited some variation but had overall consistency, thereby aligning well with the intuitive results from the phenotyping map.

3.7. System Cluster Analysis and Establishment of Stepwise Regression Equations for Aluminum Tolerance

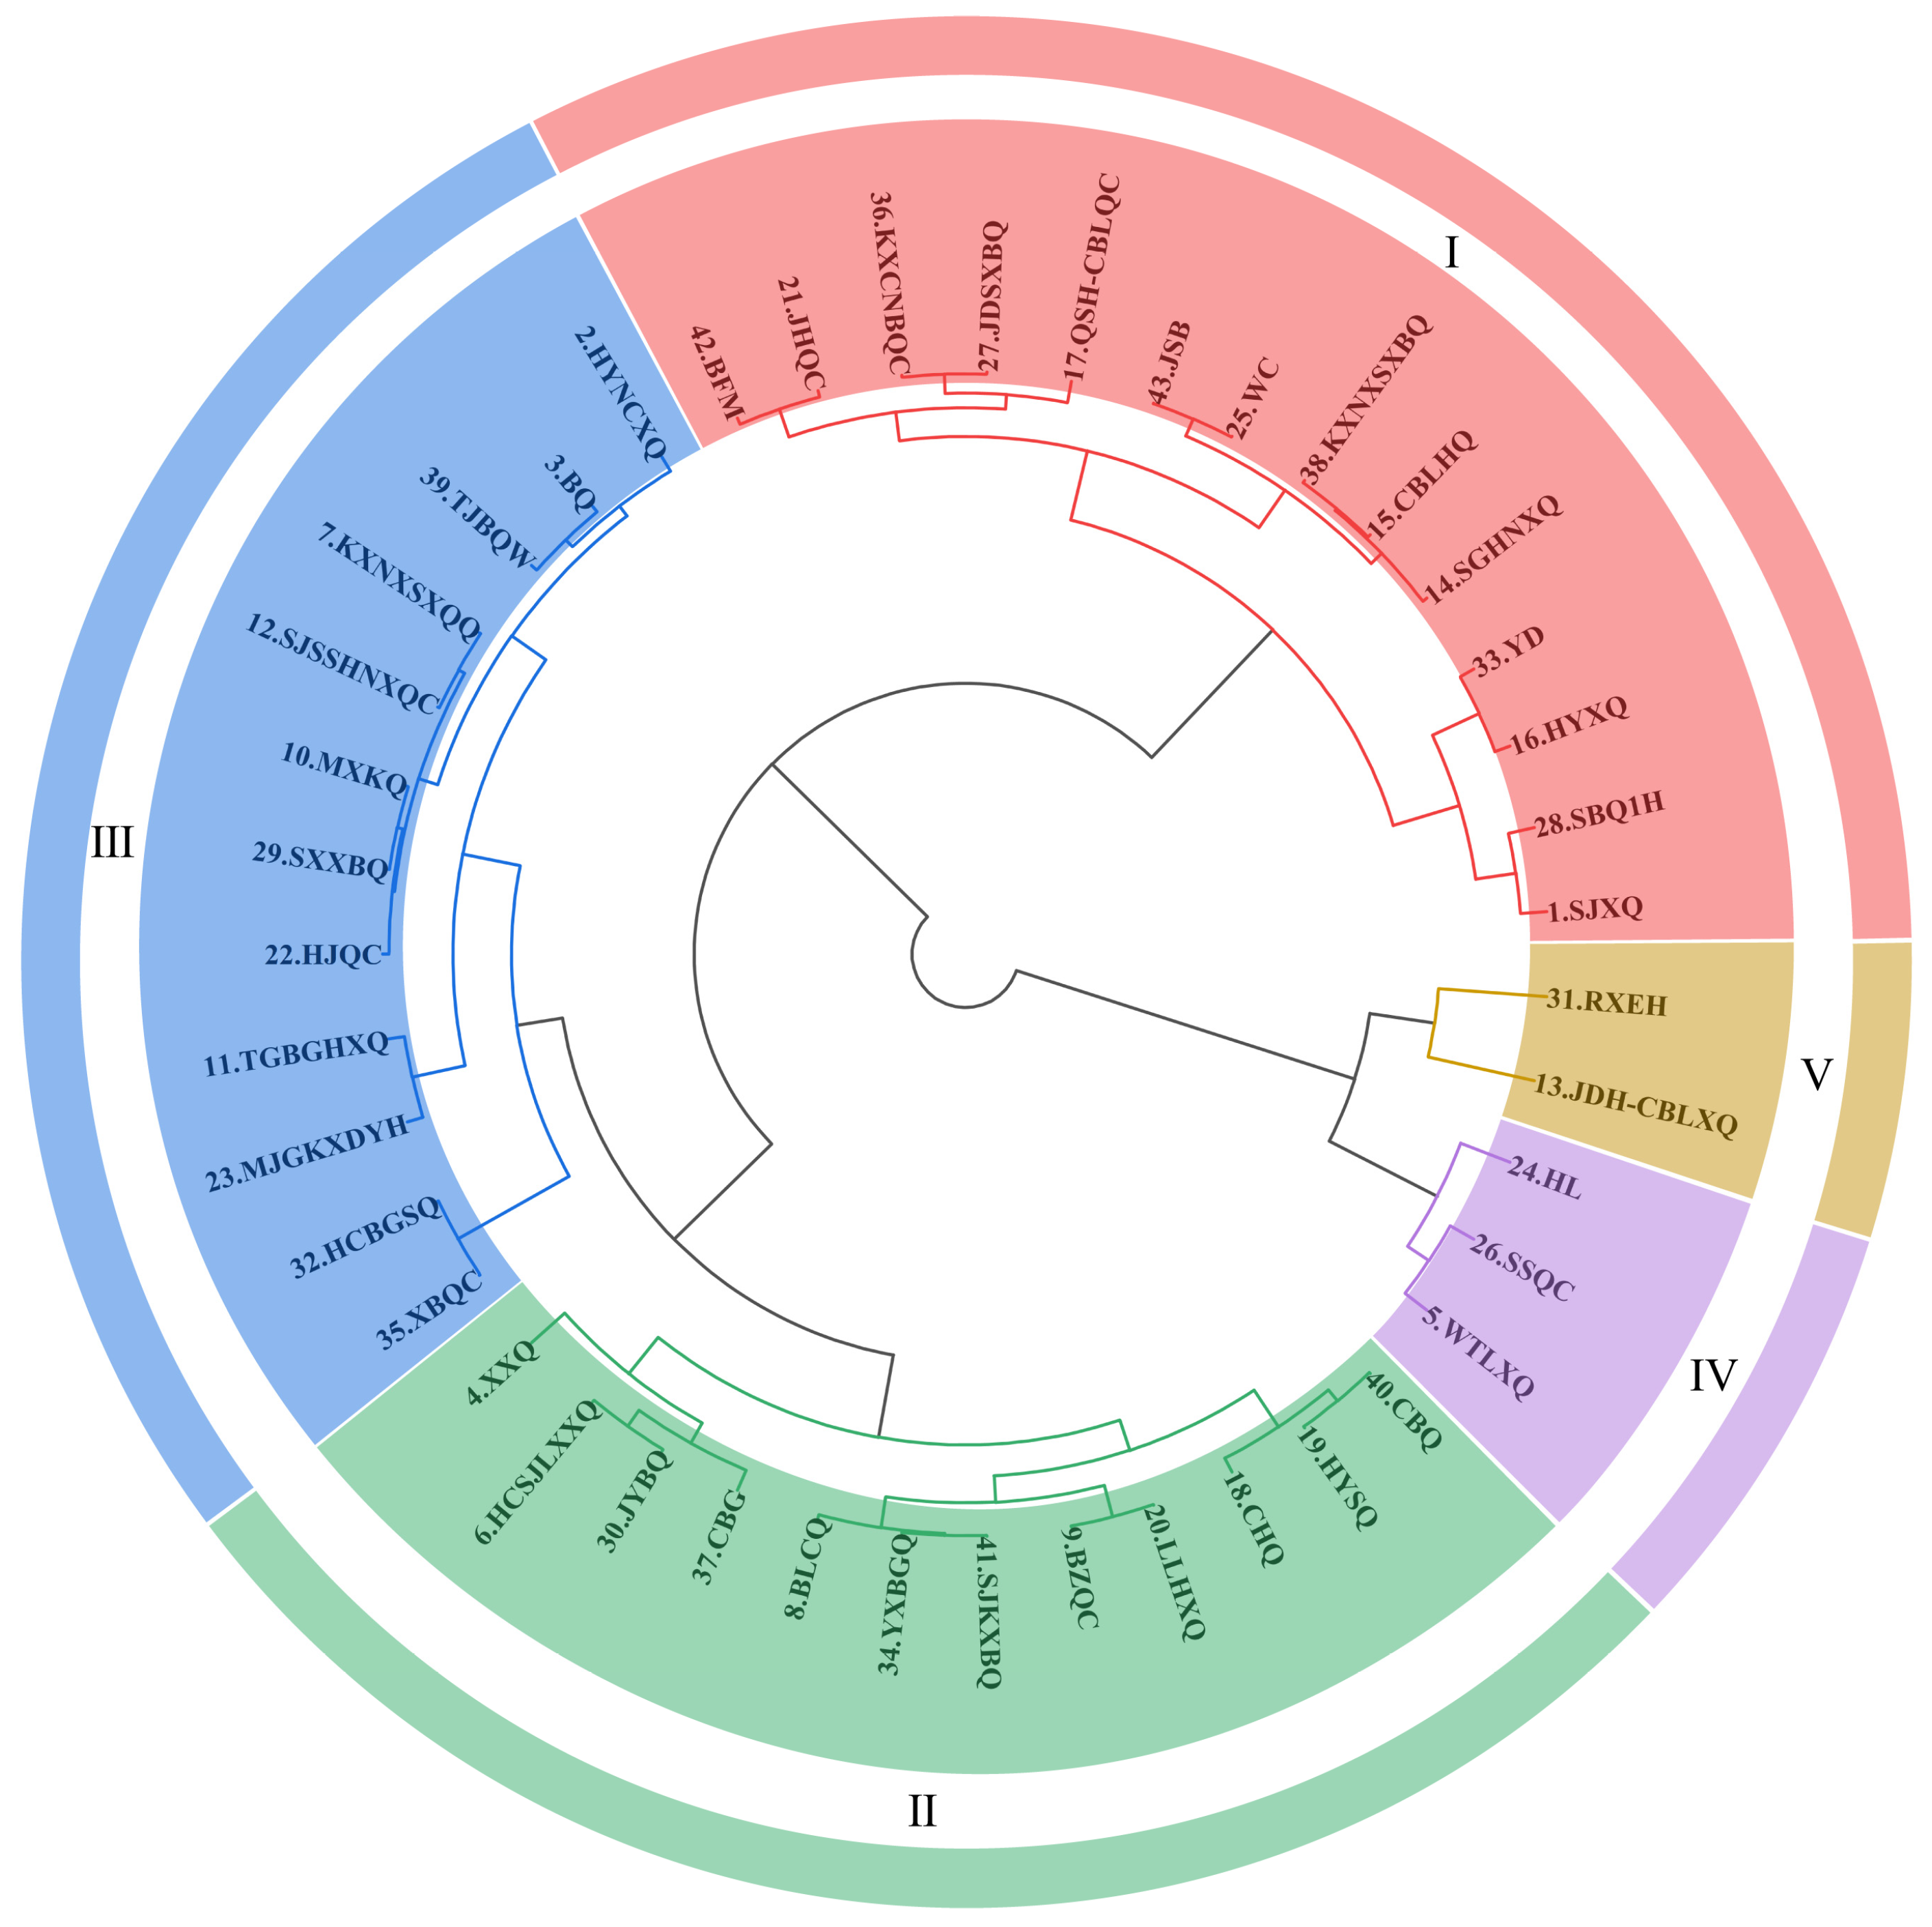
CAC, WAC, F value, and A value reflect the aluminum tolerance of the tested materials from different perspectives. CAC represents the average aluminum tolerance coefficient calculated across all measured traits and can reflect the overall capacity of a material to maintain trait performance at the multi-trait level. WAC further accounts for differences in the relative associations between individual indicators and the comprehensive evaluation results and can therefore serve as a weighted auxiliary index for aluminum tolerance evaluation. The F value, derived from principal component analysis, summarizes the major sources of variation captured by multiple morphological and physiological indicators, while reducing the influence of inter-indicator correlations and information redundancy. The A value integrates multi-indicator information through the combination of principal component contribution rates, membership function-based normalization, and weight allocation, thereby mitigating the influence of differences in measurement scale and dimensionality on the evaluation results. Systematic cluster analysis based on the A values classified the 43 celery varieties into five categories according to aluminum tolerance levels (Figure 5). Category I comprised 14 varieties, including ‘Siji Xiqin’, ‘Shubaiqin No.1’, and ‘Youdian’, with extremely strong aluminum tolerance. The A values of varieties in category I ranged between 0.580 and 0.681. Category II comprised 12 varieties, including ‘Caohuangqin’, ‘Caobaiqin’, and ‘Huangyu Shiqin’, with aluminum tolerance. The A values of varieties in category II ranged between 0.475 and 0.551. Category III comprised 12 varieties, including ‘Siji susheng Huangnen xiaoqincai’, ‘Kexing nongxiang Shixinqingqin’, and ‘Shixin Xiaobaiqin’, with moderate aluminum tolerance. The A values of varieties in category III ranged between 0.391 and 0.462. Category IV comprised 3 varieties, i.e., ‘Houlai-Kongxin Erhuangqin’, ‘Wentula Xiqin’, and ‘Susheng Qincai’, exhibiting aluminum sensitivity. The A values of these varieties were 0.340, 0.322, and 0.310, respectively. Category V comprised 2 varieties, i.e., ‘Ruixue No. 2’ and ‘Jidanhuang-Chunbulao Xiangqin’, exhibiting extreme aluminum sensitivity. The A values of the two varieties were 0.271 and 0.222, respectively.
Using the A value as the dependent variable and the AC values of 14 morphological and physiological traits as independent variables, stepwise regression analysis was performed to identify key indicators associated with aluminum tolerance in celery. The optimal regression equation was established as follows: A = 0.445 + 0.217 S D W + 0.368 S T + 0.206 R D W + 0.057 S P + 0.110 P O D + 0.177 S F W 0.171 C h l + 0.158 P H + 0.072 R F W . The coefficient of determination (R2) was approximately 1.000, and the model was highly significant, with an F value of 776.198 (p < 0.01). These results indicate that the regression model had a high goodness of fit and strong explanatory power, suggesting that it could be used to identify key indicators associated with aluminum tolerance and to support the prediction of aluminum tolerance in celery. In the regression equation, SDW, ST, RDW, SP, POD, SFW, ChI, PH, and RFW were retained as major explanatory variables closely associated with the A value, suggesting that these traits may serve as candidate indicators for evaluating aluminum tolerance in celery germplasm.
Precision analysis of aluminum tolerance in celery varieties was conducted using stepwise regression equations (Table S3). There was a highly significant correlation between regression values and A values (r = 0.998), with a prediction accuracy exceeding 94% for all the varieties and an average precision of 98.710%. This finding demonstrated that the regression equation could be effectively applied to predict aluminum tolerance in celery germplasm resources. Moreover, the regression equation constructed based on the A values derived from nine crucial morphological and physiological indicators, including SDW, RDW, and POD, enables efficient aluminum tolerance evaluation and streamlines the identification process.

3.8. Physiological and Biochemical Responses of Contrasting Aluminum-Tolerant and Aluminum-Sensitive Celery Accessions Under Aluminum Stress

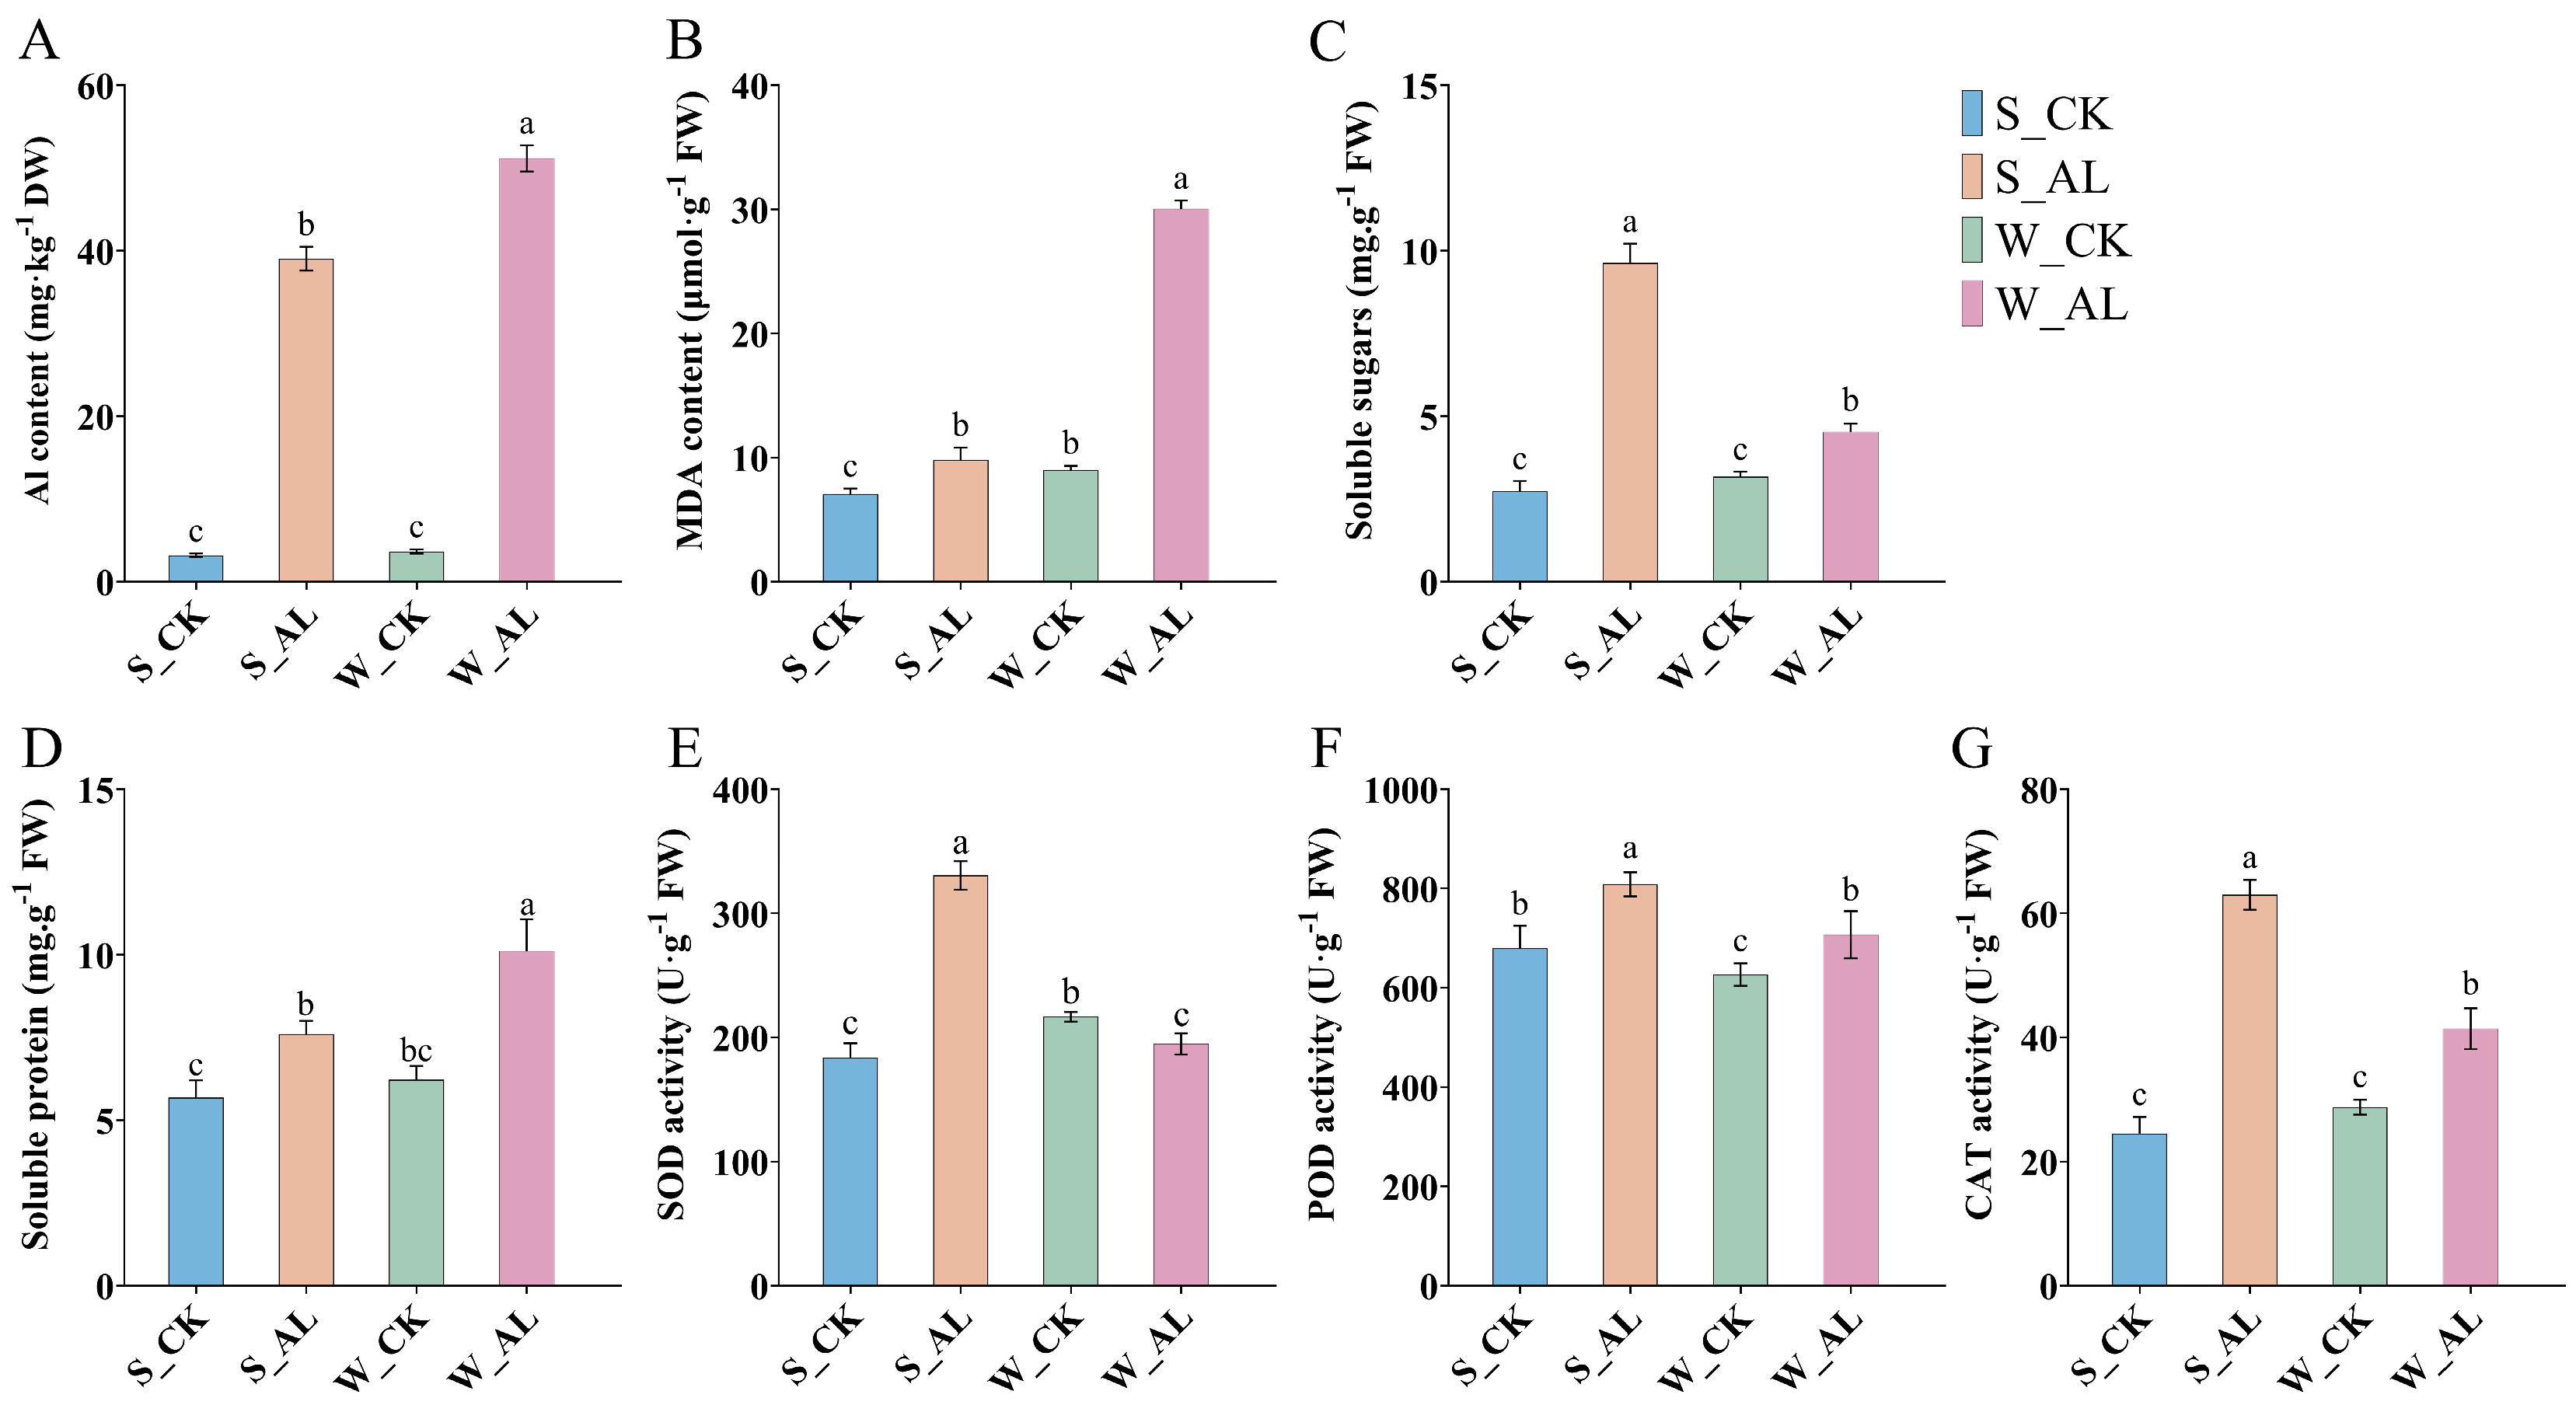
Based on the comprehensive evaluation of the 43 celery germplasm accessions, the highly aluminum-tolerant accession Shubaiqin No. 1 (SBQ) and the highly aluminum-sensitive accession Wentula Xiqin (WTL) were selected as contrasting materials for analyzing physiological and biochemical responses under Al stress. The results showed that Al treatment significantly altered leaf physiological and biochemical traits in both accessions. Regarding Al accumulation, leaf Al content increased significantly in both accessions compared with the control. Notably, WTL exhibited a 14.0-fold increase, exceeding the 12.2-fold increase observed in SBQ, and its final absolute Al content was also significantly higher than that of SBQ (Figure 6A). The difference in Al accumulation between the two accessions was consistent with changes in membrane lipid peroxidation. Specifically, WTL exhibited more pronounced membrane lipid peroxidation than SBQ. As shown in Figure 6B, MDA content in WTL increased by 233.78% relative to the control, whereas that in SBQ increased by only 38.54%.
Regarding osmotic regulatory substances (Figure 6C,D), soluble sugar content increased significantly in SBQ, reaching a 253.06% increase, whereas WTL showed only a 43.05% increase. Soluble protein content also increased in both accessions, with increases of 33.66% in SBQ and 62.63% in WTL. Changes in antioxidant enzyme activities further highlighted the contrasting responses between the two accessions (Figure 6E–G). After Al treatment, SOD, POD, and CAT activities in SBQ increased by 80.08%, 18.92%, and 156.42%, respectively. In contrast, CAT and POD activities in WTL increased by only 44.03% and 12.81%, respectively, whereas SOD activity decreased by 10.06%.
Overall, the aluminum-tolerant accession SBQ exhibited lower Al accumulation and MDA content under Al stress, accompanied by a substantial increase in soluble sugar content and marked enhancement of antioxidant enzyme activities. By contrast, the sensitive accession WTL showed higher Al accumulation and more severe membrane lipid peroxidation, together with a relatively weaker antioxidant defense response.

3.9. Photosynthetic Pigment and Chlorophyll Fluorescence Responses of Contrasting Aluminum-Tolerant and Aluminum-Sensitive Celery Accessions Under Aluminum Stress

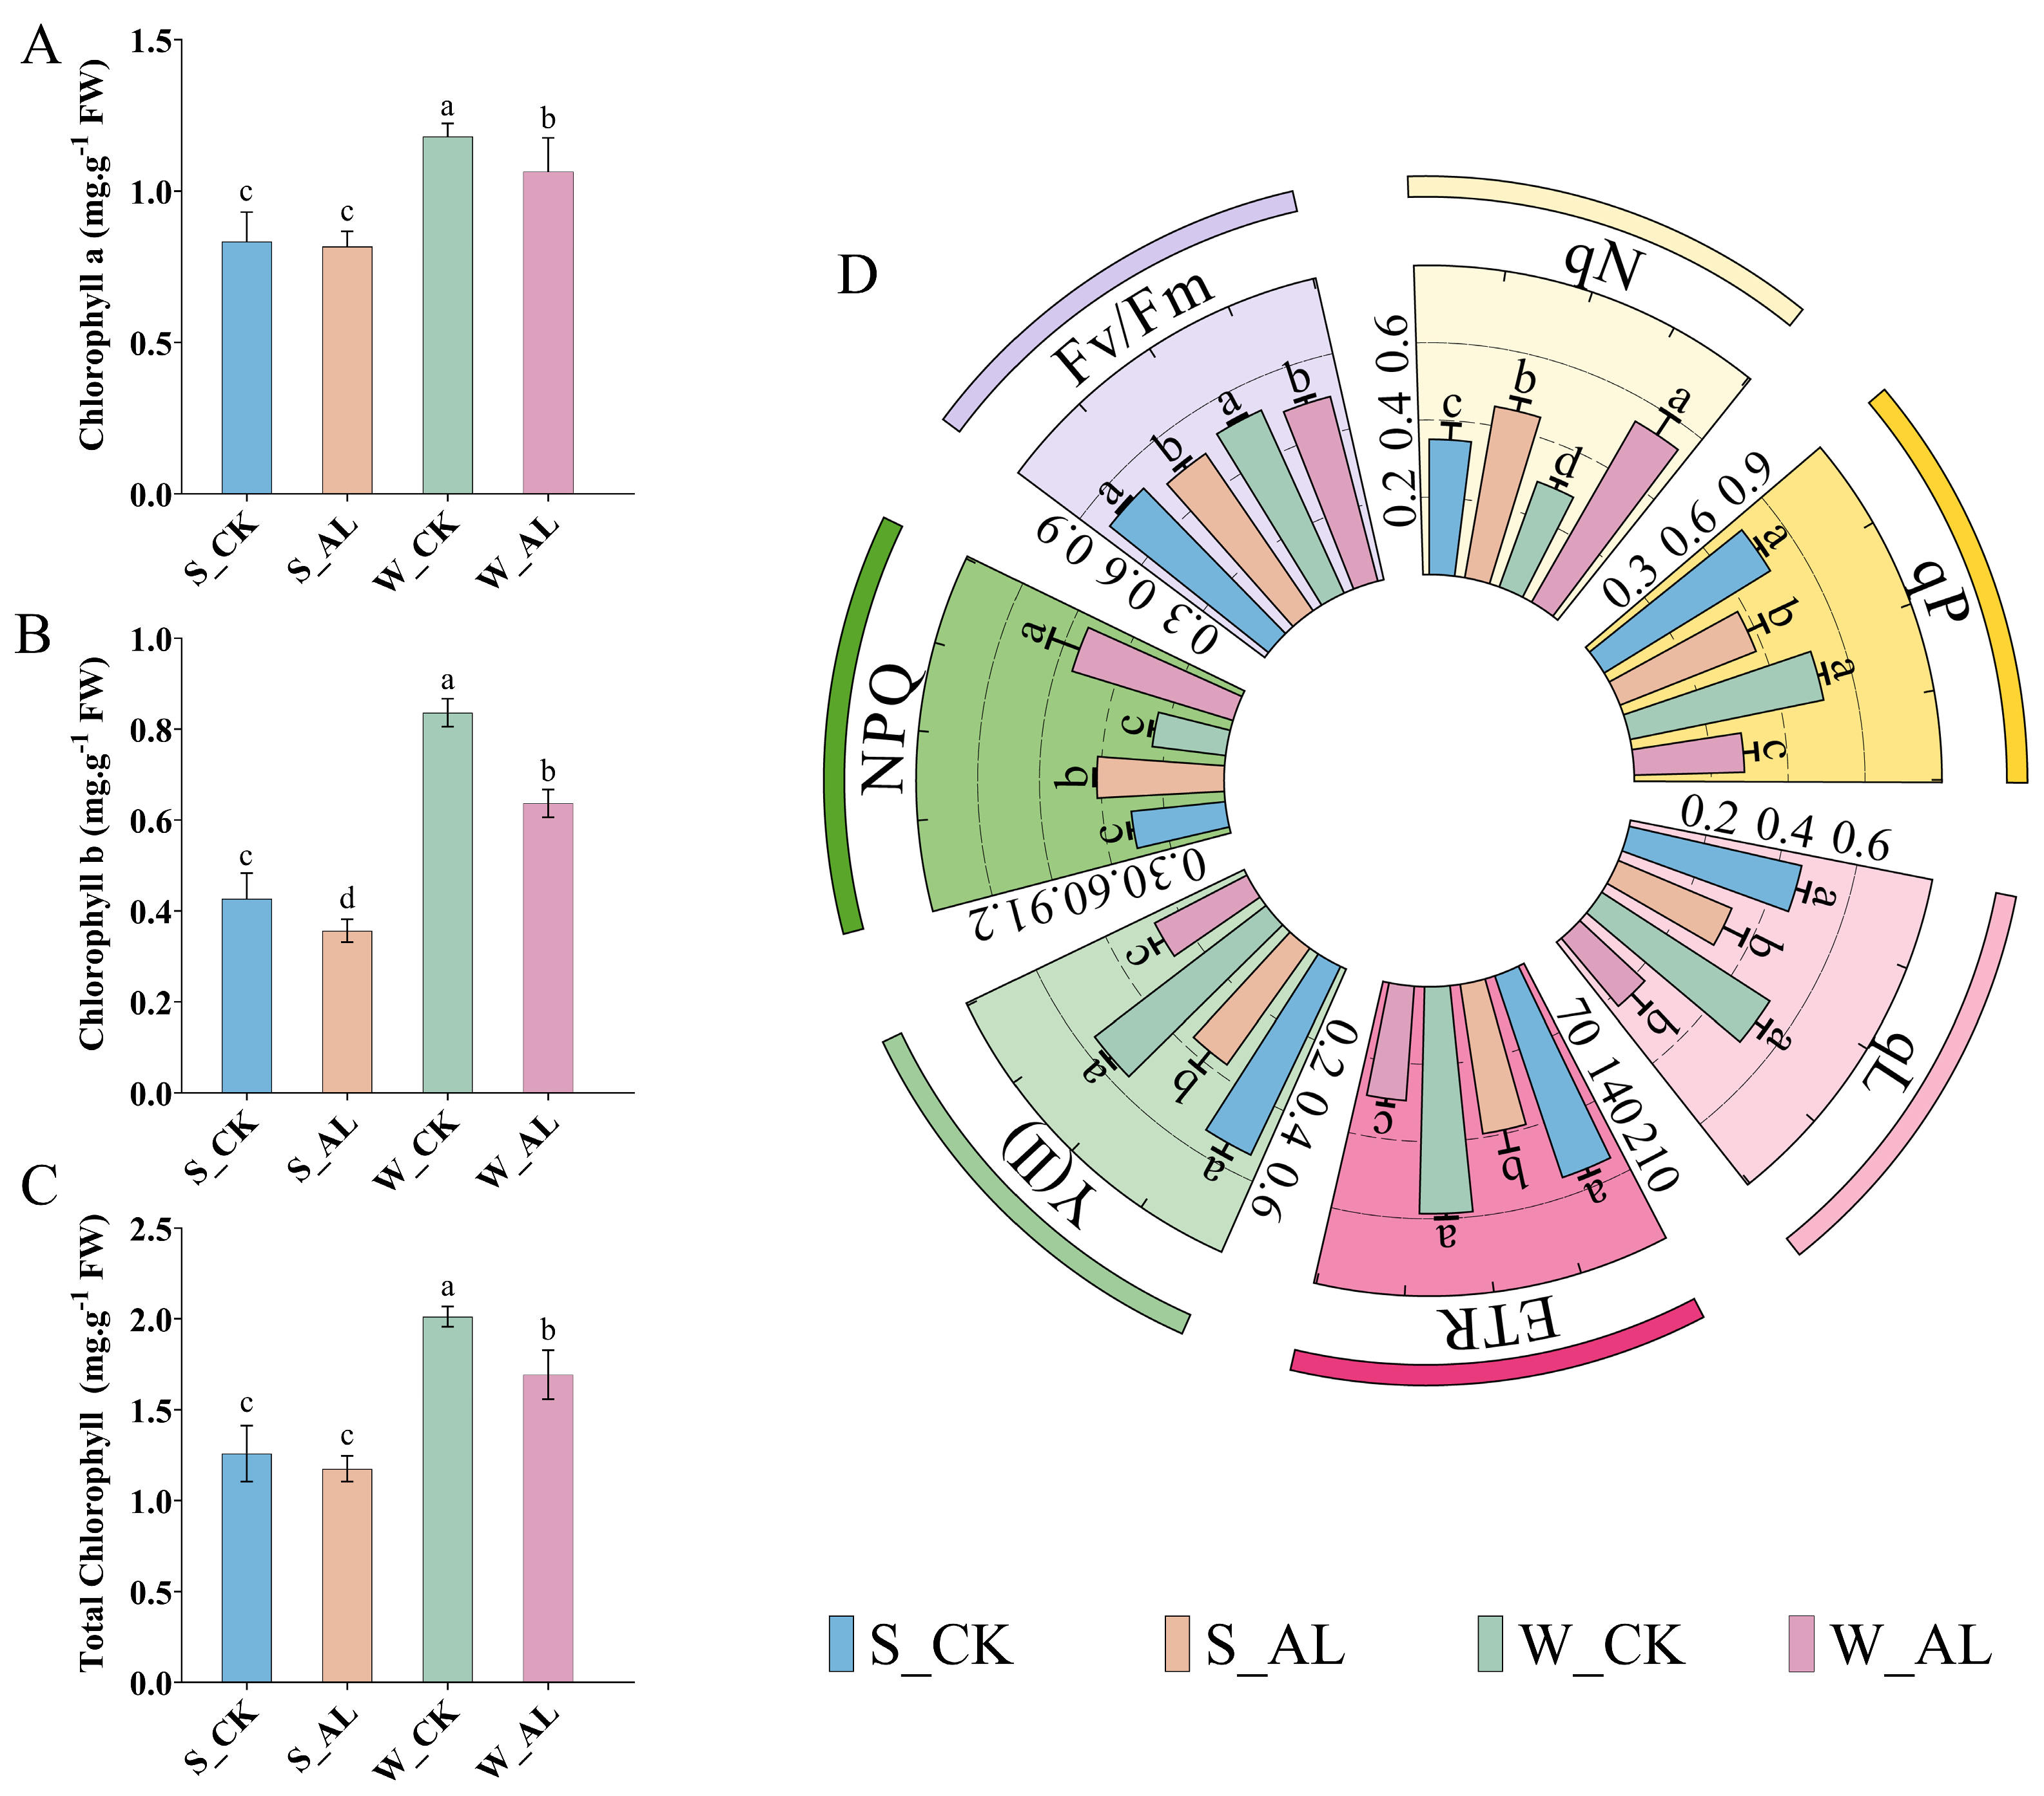
Al treatment significantly altered photosynthetic pigment contents and chlorophyll fluorescence parameters in celery leaves. Regarding photosynthetic pigments, Al stress reduced the contents of chlorophyll a, chlorophyll b, and total chlorophyll in both contrasting accessions, with greater reductions observed in the aluminum-sensitive accession WTL than in the aluminum-tolerant accession SBQ. As shown in Figure 7A–C, total chlorophyll content decreased by 6.60% in SBQ, whereas the reduction reached 15.87% in WTL. Specifically, Chl a and Chl b contents decreased by 9.97% and 24.22% in WTL, respectively, whereas the corresponding decreases in SBQ were only 1.90% and 15.82%. These results indicate that WTL exhibited more severe pigment degradation under Al stress.
In terms of chlorophyll fluorescence parameters (Figure 7D), Al treatment caused varying degrees of decline in Fv/Fm, Y(II), ETR, qP, and qL in both accessions. In WTL, the effective quantum yield of PSII photochemistry [Y(II)] and the electron transport rate (ETR) decreased by 51.91% and 49.56%, respectively, which were approximately 1.6-fold greater than the corresponding decreases in SBQ. Meanwhile, qP and qL in WTL decreased by 43.21% and 55.90%, respectively, which were markedly greater than the corresponding decreases of 24.77% and 29.27% observed in SBQ. By contrast, Fv/Fm showed only slight changes in both accessions, decreasing by 5.55% in SBQ and 6.15% in WTL. In addition, Al treatment induced increases in non-photochemical quenching-related parameters. qN and NPQ increased by 27.98% and 35.32% in SBQ, respectively, whereas the corresponding increases in WTL reached 86.83% and 130.48%.
Overall, the aluminum-sensitive accession WTL showed greater reductions in chlorophyll content and more pronounced alterations in chlorophyll fluorescence parameters under Al stress, whereas the aluminum-tolerant accession SBQ was better able to maintain photosynthetic pigment levels and photosystem stability.

4. Discussion

4.1. Determination of the Aluminum Stress Concentration and Growth Responses of Celery to Aluminum Stress

The appropriate establishment of stress intensity is a prerequisite for accurately identifying stress-tolerant germplasm. Previous studies have shown that moderate stress intensity is generally more conducive to revealing genotypic differences, whereas excessively low or high stress intensity may reduce the discriminatory capacity of screening [28]. Under low-intensity stress, plant growth is only slightly affected, making it difficult to fully distinguish potential differences in tolerance among genotypes. Conversely, under high-intensity stress, different materials often exhibit convergent growth inhibition, resulting in weakened genotypic differentiation [29]. The results of the present study were consistent with this general pattern. Under 100–200 μmol·L−1 Al3+ treatments, the aluminum-tolerance coefficients of the tested accessions remained relatively high and showed limited variation, whereas 600 μmol·L−1 Al3+ caused stronger growth suppression and reduced inter-accession differentiation. In contrast, the 400 μmol·L−1 AlCl3 treatment resulted in greater dispersion in aluminum-tolerance coefficients, indicating that this concentration was more conducive to distinguishing genotypic differences. Therefore, 400 μmol·L−1 AlCl3 was selected as the appropriate screening concentration for subsequent aluminum-tolerance evaluation of the 43 celery germplasm accessions.
Driven by multiple factors, including anthropogenic activities and acid deposition, soil acidification has become an increasingly serious constraint on agricultural production [30,31]. In acidic soils, aluminum can be extensively solubilized and released as phytotoxic Al3+, thereby inhibiting plant growth and development [32,33]. Tóth et al. [34] reported that aluminum stress caused toxic effects in 25 common bean genotypes, leading to significant reductions in growth parameters such as root length and root dry weight. Zheng et al. [35] also found that aluminum stress significantly inhibited watermelon growth and biomass accumulation, as reflected by decreases in plant height, root length, and shoot and root fresh and dry weights. In the present study, aluminum stress impaired the overall growth performance of the 43 celery germplasm accessions, as indicated by reduced plant height, thinner stems, root browning, and inhibited root elongation. These results are consistent with previous findings in crops such as common bean and watermelon, suggesting that growth suppression is a common phenotypic response to aluminum toxicity across different crop species. Reactive oxygen species (ROS) are by-products of aerobic metabolism in plants, and peroxisomes represent important sites of ROS generation in plant cells [36]. Under adverse conditions such as aluminum stress, ROS levels can rapidly increase, and excessive ROS may induce oxidative damage, including lipid peroxidation, protein inactivation, and DNA damage [37,38,39]. To counteract oxidative injury, plants have evolved complex antioxidant defense systems to alleviate oxidative stress [40,41]. In rice [42] and Pinus massoniana [43], enhanced activities of antioxidant enzymes such as SOD, POD, and CAT have been shown to contribute to the mitigation of aluminum-induced oxidative stress. Similarly, the present study found that SOD, POD, and CAT activities in celery leaves increased significantly after aluminum treatment, indicating that celery may mitigate aluminum-induced oxidative damage by activating antioxidant defense responses.

4.2. Construction of a Comprehensive Evaluation System for Aluminum Tolerance in Celery and Identification of Key Evaluation Indicators

An effective strategy for coping with soil acidification involves not only elucidating the mechanisms of aluminum toxicity but also identifying and breeding crop varieties with superior aluminum tolerance. Aluminum tolerance in crops is determined by coordinated changes in multiple morphological and physiological traits; therefore, a single indicator is insufficient to comprehensively reflect the actual tolerance level. Therefore, constructing a multi-trait comprehensive evaluation system is essential for the accurate screening of aluminum-tolerant germplasm. Although multivariate statistical methods, such as principal component analysis (PCA), membership function analysis, and cluster analysis, have been widely applied in the evaluation of salt-tolerant [21] and heat-tolerant [22] celery germplasm, systematic studies on aluminum tolerance in celery remain limited, thereby restricting the efficient screening and utilization of aluminum-tolerant germplasm. In this study, correlation analysis first revealed significant associations among morphological and physiological traits under aluminum stress, indicating that these traits were not independent of one another but were jointly involved in the response to aluminum stress. However, the strong correlations among traits also suggested the presence of information redundancy and potential collinearity, which may affect the accuracy of comprehensive evaluation. To reduce this interference, PCA was further applied to the 14 traits to achieve dimensionality reduction. Six principal components were extracted, with a cumulative contribution rate of 77.47%, indicating that they captured most of the information contained in the original dataset. The broadly consistent results obtained from CAC, WAC, F value, and A value suggest that the aluminum tolerance evaluation was relatively stable across different analytical approaches. Rather than relying on a single trait or index, the combined use of these methods provides a more integrated assessment of aluminum tolerance. In particular, PCA- and membership function-based evaluation helps integrate multi-trait information and reduce the potential bias caused by trait dimensionality and redundancy. Therefore, the A value may provide a more practical basis for ranking materials and classifying aluminum tolerance levels in germplasm screening. Based on the A value, hierarchical cluster analysis further classified the 43 celery germplasm accessions into five categories: highly aluminum-tolerant, aluminum-tolerant, moderately aluminum-tolerant, aluminum-sensitive, and highly aluminum-sensitive. Among these accessions, ‘Siji Xiqin’ and ‘Shubaiqin No. 1’ obtained relatively high comprehensive scores, indicating strong potential for aluminum tolerance. In contrast, ‘Wentula Xiqin’ and ‘Ruixue No. 2’ showed lower scores, indicating greater sensitivity to aluminum stress. These results demonstrate that the established evaluation system has good applicability for classifying celery germplasm and identifying aluminum-tolerant candidate accessions.
On the basis of the comprehensive evaluation system, key indicators were further screened to facilitate the efficient identification of aluminum tolerance. Because aluminum tolerance involves multiple processes, including growth maintenance [44,45], antioxidant defense regulation [46], and metabolic adjustment [47], reliance on a single indicator is insufficient to reflect its overall characteristics. Therefore, it is necessary to identify representative key indicators that can effectively reflect comprehensive aluminum tolerance. Following indicator-screening strategies based on stepwise regression analysis in tomato [48] and grape [16], the A value was used as the dependent variable representing comprehensive aluminum tolerance, and a stepwise regression model was established as follows: A = 0.445 + 0.217 S D W + 0.368 S T + 0.206 R D W + 0.057 S P + 0.110 P O D + 0.177 S F W 0.171 C h l + 0.158 P H + 0.072 R F W . Model validation showed that the predicted values were highly significantly and positively correlated with the A values (r = 0.998), indicating that the established model had a high goodness of fit and strong predictive consistency. Accordingly, nine key indicators were identified, namely SDW, ST, RDW, SP, POD, SFW, Chl, PH, and RFW. These indicators covered multiple dimensions, including morphological growth, biomass accumulation, photosynthetic pigment status, physiological metabolism, and antioxidant defense, thereby providing a practical indicator set for subsequent screening of aluminum-tolerant celery germplasm.
These core indicators may provide a useful basis for the preliminary screening of large-scale celery germplasm collections. Compared with the simultaneous assessment of all measured traits, evaluation based on a limited set of representative indicators can reduce the workload associated with trait measurement and facilitate comparisons among different genotypes or accessions. Because these indicators encompass biomass accumulation, morphological growth, antioxidant responses, and photosynthetic pigment status, they can partly reflect the ability of celery plants to maintain growth and regulate physiological processes under aluminum stress. Therefore, these indicators may serve as candidate screening traits for identifying aluminum-tolerant celery germplasm and breeding populations. However, their practical application requires further validation across different environmental conditions and genetic backgrounds to confirm the stability, reliability, and applicability of the evaluation system in breeding practice.

4.3. Physiological and Photosynthetic Response Mechanisms of Highly Aluminum-Tolerant Celery Accessions

Differences in physiological and photosynthetic responses between accessions with contrasting aluminum tolerance under Al stress may reflect distinct mechanisms contributing to tolerance formation. In the present study, leaf Al content in the aluminum-tolerant accession was significantly lower than that in the sensitive accession, suggesting that restricted Al accumulation in aboveground tissues may be an important contributor to aluminum tolerance. This finding is consistent with observations in blueberry, where tolerant genotypes generally exhibited lower leaf Al accumulation and less pronounced photosynthetic impairment [49]. In contrast, excessive Al accumulation in the sensitive accession was accompanied by a marked increase in MDA content, indicating intensified membrane lipid peroxidation and more severe oxidative damage to cellular membranes. Previous studies have shown that increased leaf Al content is often associated with elevated MDA levels, suggesting that tissue Al accumulation may aggravate membrane damage [50].
Aluminum toxicity is usually accompanied by substantial accumulation of reactive oxygen species (ROS); therefore, antioxidant defense capacity is considered an important physiological component of plant aluminum tolerance. In the present study, SOD, POD, and CAT activities were significantly enhanced in the aluminum-tolerant accession, whereas these enzyme activities in the sensitive accession showed only slight increases or even decreased. This indicates that the aluminum-tolerant accession possessed stronger ROS-scavenging capacity and a greater ability to maintain cellular redox homeostasis. Similar findings have also been reported in apple, where enhanced antioxidant capacity during the alleviation of Al toxicity was accompanied by improved cellular metabolic status [51]. Similar phenomena have also been reported in other vegetable crops. In lettuce, aluminum toxicity has been shown to promote H2O2 and MDA accumulation and increase SOD and CAT activities, suggesting that activation of the antioxidant system may help mitigate aluminum-induced oxidative damage [13]. Similarly, Al treatment increased MDA content, superoxide anion accumulation, and electrolyte leakage in watermelon, whereas exogenous NO alleviated aluminum toxicity by enhancing POD and CAT activities and decreasing MDA and superoxide anion accumulation [35]. These reports are consistent with the lower membrane lipid peroxidation and stronger antioxidant enzyme activities observed in aluminum-tolerant celery materials in this study.
Meanwhile, soluble sugar accumulated markedly in the aluminum-tolerant accession, which is consistent with previous findings showing that increased soluble sugar content under stress conditions contributes to osmotic adjustment and the reduction in stress-induced damage [52]. In contrast, the marked increase in soluble protein content in the sensitive accession may be associated with altered protein metabolism or the accumulation of stress-related proteins under adverse conditions [53,54]. These results suggest that differences in both enzymatic and non-enzymatic defense systems jointly contributed to the contrasting aluminum-stress responses of the two accessions. In addition to oxidative defense, photosynthetic system stability is also an important factor underlying differences in aluminum tolerance. Previous studies have shown that aluminum stress can inhibit leaf photochemical efficiency and electron transport and induce enhanced non-photochemical quenching, thereby reducing the risk of photooxidative damage caused by excess excitation energy [55]. In the present study, the sensitive accession showed a marked decrease in chlorophyll content, substantial reductions in Y(II) and ETR, and a significant increase in NPQ, indicating that its photosystem was more severely impaired and relied more strongly on enhanced energy dissipation to mitigate excess excitation pressure. By contrast, the aluminum-tolerant accession was able to maintain higher electron transport capacity and more stable photosynthetic performance under Al stress. Previous transcriptomic studies in watermelon leaves have shown that aluminum stress influences the expression of genes associated with antioxidant enzymes and photosynthetic pathways [35]. Similarly, transcriptome analyses of tea plant leaves demonstrated that aluminum treatment modulates antioxidant enzyme activities and the expression of aluminum-responsive genes [56]. Although these molecular studies cannot directly explain the regulatory mechanisms underlying aluminum tolerance in celery, they are consistent with the enhanced antioxidant capacity and maintenance of photosynthetic performance observed in this study. Further studies integrating gene expression analysis and transcriptomic approaches are needed to clarify the molecular basis of aluminum tolerance in celery.
Overall, aluminum tolerance in celery is unlikely to depend on a single physiological process, but instead may involve the coordinated regulation of multiple mechanisms, including restricted aluminum accumulation in leaves, enhanced antioxidant defense, osmotic adjustment, reduced membrane lipid peroxidation, and maintenance of photosynthetic stability.

5. Conclusions

This study identified 400 μmol·L−1 AlCl3 as the appropriate screening concentration for evaluating aluminum tolerance in celery. Based on this concentration, a comprehensive evaluation system was established for 43 celery germplasm accessions, enabling their classification according to aluminum-tolerance levels. Furthermore, nine key indicators were identified, improving screening efficiency while maintaining evaluation reliability and demonstrating the practical applicability of the established system. Comparative analysis of contrasting accessions showed that aluminum tolerance in celery was closely associated with restricted Al accumulation, enhanced antioxidant defense, and maintenance of photosynthetic system stability. Overall, this study provides a methodological framework for the systematic screening and evaluation of aluminum-tolerant celery germplasm. Further studies integrating molecular and genetic analyses are needed to clarify the regulatory mechanisms underlying aluminum tolerance and provide stronger theoretical support for aluminum-tolerance breeding.

Supplementary Materials

The following supporting information can be downloaded at: https://www.mdpi.com/article/10.3390/agronomy16111105/s1, Table S1: Celery Germplasm Resource Information; Table S2: Aluminum Tolerance Coefficients for Various Parameters of Celery; Table S3: Accuracy Analysis of Regression Equations.

Author Contributions

G.Q.: Conceptualization, Data curation, Writing—original draft. X.L.: Visualization, Writing—original draft. Q.L.: Methodology, Investigation. H.W.: Methodology, Formal analysis. X.Z.: Methodology, Supervision. Z.L.: Methodology, Investigation. F.L.: Methodology, Validation. M.L.: Supervision, Validation. W.L.: Supervision, Project administration. C.J.: Supervision, Project administration. Y.Z.: Conceptualization, Funding acquisition, Writing—review & editing. All authors have read and agreed to the published version of the manuscript.

Funding

Supported by the earmarked fund for Sichuan Innovation Team Program of CARS (SCCXTD-2024-22).

Data Availability Statement

The original contributions presented in this study are included in the article/Supplementary Material. Further inquiries can be directed to the corresponding author.

Conflicts of Interest

The authors declare no conflicts of interest.

References

  1. von Uexküll, H.R.; Mutert, E. Global extent, development and economic impact of acid soils. Plant Soil. 1995, 171, 1–15. [Google Scholar] [CrossRef]
  2. Zhang, W.; Munyaneza, V.; Yi, B.; Zhang, X.; Zhang, P.; Kant, S.; Xu, F.; Ding, G. Tolerance to aluminum toxicity in Brassica napus is mediated by regulating cell wall Al sequestration, antioxidant defense, and metabolic adaptation. J. Hazard. Mater. 2025, 498, 139837. [Google Scholar] [CrossRef] [PubMed]
  3. Zhang, X.; Guo, J.; Vogt, R.D.; Mulder, J.; Zhang, X. Soil acidification as an additional driver to organic carbon accumulation in major Chinese croplands. Geoderma 2020, 366, 114234. [Google Scholar] [CrossRef]
  4. Zhu, X.F.; Shen, R.F. Towards sustainable use of acidic soils: Deciphering aluminum-resistant mechanisms in plants. Fundam. Res. 2024, 4, 1533–1541. [Google Scholar] [CrossRef]
  5. Chen, C.; Xiao, W.; Chen, H.Y.H. Mapping global soil acidification under N deposition. Glob. Change Biol. 2023, 29, 4652–4661. [Google Scholar] [CrossRef]
  6. Ur Rahman, S.; Han, J.C.; Ahmad, M.; Ashraf, M.N.; Khaliq, M.A.; Yousaf, M.; Wang, Y.; Yasin, G.; Nawaz, M.F.; Khan, K.A.; et al. Aluminum phytotoxicity in acidic environments: A comprehensive review of plant tolerance and adaptation strategies. Ecotoxicol. Environ. Saf. 2024, 269, 115791. [Google Scholar] [CrossRef]
  7. Rahman, M.A.; Lee, S.H.; Ji, H.C.; Kabir, A.H.; Jones, C.S.; Lee, K.W. Importance of mineral nutrition for mitigating aluminum toxicity in plants on acidic soils: Current status and opportunities. Int. J. Mol. Sci. 2018, 19, 3073. [Google Scholar] [CrossRef] [PubMed]
  8. Guo, P.; Qi, Y.P.; Cai, Y.T.; Yang, T.Y.; Yang, L.T.; Huang, Z.R.; Chen, L.S. Aluminum effects on photosynthesis, reactive oxygen species and methylglyoxal detoxification in two Citrus species differing in aluminum tolerance. Tree Physiol. 2018, 38, 1548–1565. [Google Scholar] [CrossRef]
  9. Che, J.; Zhao, X.Q.; Shen, R.F. Molecular mechanisms of plant adaptation to acid soils: A review. Pedosphere 2023, 33, 14–22. [Google Scholar] [CrossRef]
  10. Ma, J.F.; Ryan, P.R.; Delhaize, E. Aluminium tolerance in plants and the complexing role of organic acids. Trends Plant Sci. 2001, 6, 273–278. [Google Scholar] [CrossRef]
  11. Shen, R.F.; Ma, J.F.; Kyo, M.; Iwashita, T. Compartmentation of aluminium in leaves of an Al-accumulator, Fagopyrum esculentum Moench. Planta 2002, 215, 394–398. [Google Scholar] [CrossRef] [PubMed]
  12. Xu, S.; Wu, L.; Li, L.; Zhong, M.; Tang, Y.; Cao, G.; Lin, K.; Ye, Y. Aluminum-induced alterations to the cell wall and antioxidant enzymes involved in the regulation of the aluminum tolerance of Chinese fir (Cunninghamia lanceolata). Front. Plant Sci. 2022, 13, 821360. [Google Scholar] [CrossRef] [PubMed]
  13. Song, C.; Bibi, Z.; Ali, S.; Ahmad, R. Silicon mitigates aluminum toxicity in lettuce by improving photosynthetic pigments and antioxidant defense system. BioMetals 2026, 1–14. [Google Scholar] [CrossRef]
  14. Li, X.; Luo, L.; Shi, X.; Li, S.; Wang, L.; Li, D.; Li, F. Screening drought tolerance in potato germplasm resources in the northwestern region of China. BMC Plant Biol. 2025, 25, 777. [Google Scholar] [CrossRef]
  15. Wang, Y.; Li, D.; Liu, C.; Shi, X.; Huang, Y.; Liu, C.; Zhou, Y. Screening and identification of grain sorghum germplasm for salt tolerance at seedling stage. Front. Plant Sci. 2025, 16, 1610685. [Google Scholar] [CrossRef]
  16. Zhang, Y.; Xu, S.; Mo, L. Screening of grape genotypes for aluminum tolerance and evaluation on selecting indices. Soil Sci. Plant Nutr. 2020, 66, 560–568. [Google Scholar] [CrossRef]
  17. Li, M.Y.; Hou, X.L.; Wang, F.; Tan, G.F.; Xu, Z.S.; Xiong, A.S. Advances in the research of celery, an important Apiaceae vegetable crop. Crit. Rev. Biotechnol. 2018, 38, 172–183. [Google Scholar] [CrossRef]
  18. Li, M.Y.; Feng, K.; Hou, X.L.; Jiang, Q.; Xu, Z.S.; Wang, G.L.; Liu, J.X.; Wang, F.; Xiong, A.S. The genome sequence of celery (Apium graveolens L.), an important leaf vegetable crop rich in apigenin in the Apiaceae family. Hortic. Res. 2020, 7, 9. [Google Scholar] [CrossRef]
  19. Wang, X.J.; Luo, Q.; Li, T.; Meng, P.H.; Pu, Y.T.; Liu, J.X.; Zhang, J.; Liu, H.; Tan, G.F.; Xiong, A.S. Origin, evolution, breeding, and omics of Apiaceae: A family of vegetables and medicinal plants. Hortic. Res. 2022, 9, uhac076. [Google Scholar] [CrossRef]
  20. Salehi, B.; Venditti, A.; Frezza, C.; Yücetepe, A.; Altuntaş, Ü.; Uluata, S.; Butnariu, M.; Sarac, I.; Shaheen, S.; Petropoulos, S.A.; et al. Apium plants: Beyond simple food and phytopharmacological applications. Appl. Sci. 2019, 9, 3547. [Google Scholar] [CrossRef]
  21. Wu, L.; Du, J.; Zhang, Y.; Xue, Y.; Jiang, C.; Lu, W.; Zheng, Y.; Zhou, C.; Xiong, A.; Li, M. Identification and evaluation of celery germplasm resources for salt tolerance. Agronomy 2024, 14, 1048. [Google Scholar] [CrossRef]
  22. Li, M.; Li, J.; Xie, F.; Zhou, J.; Sun, Y.; Luo, Y.; Zhang, Y.; Chen, Q.; Wang, Y.; Lin, Y.; et al. Combined evaluation of agronomic and quality traits to explore heat germplasm in celery (Apium graveolens L.). Sci. Hortic. 2023, 317, 112039. [Google Scholar] [CrossRef]
  23. Xiong, J.; Yang, X.; Sun, M.; Zhang, J.; Ding, L.; Sun, Z.; Feng, N.; Zheng, D.; Zhao, L.; Shen, X. Mitigation effect of exogenous nano-silicon on salt stress damage of rice seedlings. Int. J. Mol. Sci. 2025, 26, 85. [Google Scholar] [CrossRef] [PubMed]
  24. He, M.; Chen, P.; Li, M.; Lei, F.; Lu, W.; Jiang, C.; Liu, J.; Li, Y.; Xiao, J.; Zheng, Y. Physiological and transcriptome analysis of changes in endogenous hormone and sugar content during the formation of tender asparagus stems. BMC Plant Biol. 2024, 24, 581. [Google Scholar] [CrossRef] [PubMed]
  25. Li, X.; Ahammed, G.J.; Zhang, X.N.; Zhang, L.; Yan, P.; Zhang, L.P.; Fu, J.Y.; Han, W.Y. Melatonin-mediated regulation of anthocyanin biosynthesis and antioxidant defense confer tolerance to arsenic stress in Camellia sinensis L. J. Hazard. Mater. 2021, 403, 123922. [Google Scholar]
  26. Bradford, M.M. A rapid and sensitive method for the quantitation of microgram quantities of protein utilizing the principle of protein-dye binding. Anal. Biochem. 1976, 72, 248–254. [Google Scholar] [CrossRef]
  27. Liang, Y.; Bai, T.; Liu, B.; Yu, W.; Teng, W. Different antioxidant regulation mechanisms in response to aluminum-induced oxidative stress in Eucalyptus species. Ecotoxicol. Environ. Saf. 2022, 241, 113748. [Google Scholar] [CrossRef]
  28. Han, L.; Ge, L.; Fei, L.; Huang, C.; Li, Y.; Fan, W.; Zhu, D.; Zhao, L. A comprehensive evaluation of soybean germplasm resources for salt tolerance during germination. Plants 2025, 14, 791. [Google Scholar] [CrossRef]
  29. Kochian, L.V.; Piñeros, M.A.; Hoekenga, O.A. The physiology, genetics and molecular biology of plant aluminum resistance and toxicity. Plant Soil 2005, 274, 175–195. [Google Scholar] [CrossRef]
  30. Yu, Z.; Chen, H.Y.H.; Searle, E.B.; Sardans, J.; Ciais, P.; Peñuelas, J.; Huang, Z. Whole soil acidification and base cation reduction across subtropical China. Geoderma 2020, 361, 114107. [Google Scholar] [CrossRef]
  31. Zhang, Q.; Zhu, J.; Wang, Q.; Xu, L.; Li, M.; Dai, G.; Mulder, J.; Xi, Y.; He, N. Soil acidification in China’s forests due to atmospheric acid deposition from 1980 to 2050. Sci. Bull. 2022, 67, 914–917. [Google Scholar] [CrossRef]
  32. Chauhan, D.K.; Yadav, V.; Vaculík, M.; Gassmann, W.; Pike, S.; Arif, N.; Singh, V.P.; Deshmukh, R.; Sahi, S.; Tripathi, D.K. Aluminum toxicity and aluminum stress-induced physiological tolerance responses in higher plants. Crit. Rev. Biotechnol. 2021, 41, 715–730. [Google Scholar] [CrossRef] [PubMed]
  33. Riaz, M.; Yan, L.; Wu, X.; Susain, S.; Aziz, O.; Jiang, C. Mechanisms of organic acids and boron induced tolerance of aluminum toxicity: A review. Ecotoxicol. Environ. Saf. 2018, 165, 25–35. [Google Scholar] [CrossRef] [PubMed]
  34. Tóth, B.; Moloi, M.J.; Szőke, L.; Danter, M.; Grusak, M.A. Cultivar differences in the biochemical and physiological responses of common beans to aluminum stress. Plants 2021, 10, 2097. [Google Scholar] [CrossRef]
  35. Zheng, Y.; Xiao, J.; Zheng, K.; Ma, J.; He, M.; Li, J.; Li, M. Transcriptome profiling reveals the effects of nitric oxide on the growth and physiological characteristics of watermelon under aluminum stress. Genes 2021, 12, 1735. [Google Scholar] [CrossRef]
  36. Sandalio, L.M.; Romero-Puertas, M.C. Peroxisomes sense and respond to environmental cues by regulating ROS and RNS signalling networks. Ann. Bot. 2015, 116, 475–485. [Google Scholar] [CrossRef] [PubMed]
  37. Yamamoto, Y.; Kobayashi, Y.; Devi, S.R.; Rikiishi, S.; Matsumoto, H. Aluminum toxicity is associated with mitochondrial dysfunction and the production of reactive oxygen species in plant cells. Plant Physiol. 2002, 128, 63–72. [Google Scholar] [CrossRef]
  38. Huang, H.; Ullah, F.; Zhou, D.X.; Yi, M.; Zhao, Y. Mechanisms of ROS regulation of plant development and stress responses. Front. Plant Sci. 2019, 10, 800. [Google Scholar] [CrossRef]
  39. Wu, Y.; Yang, Z.; How, J.; Xu, H.; Chen, L.; Li, K. Overexpression of a peroxidase gene (AtPrx64) of Arabidopsis thaliana in tobacco improves plant’s tolerance to aluminum stress. Plant Mol. Biol. 2017, 95, 157–168. [Google Scholar] [CrossRef]
  40. Halliwell, B. Reactive oxygen species (ROS), oxygen radicals and antioxidants: Where are we now, where is the field going and where should we go? Biochem. Biophys. Res. Commun. 2022, 633, 17–19. [Google Scholar] [CrossRef]
  41. Pirzadah, T.B.; Malik, B.; Tahir, I.; Rehman, R.U.; Hakeem, K.R.; Alharby, H.F. Aluminium stress modulates the osmolytes and enzyme defense system in Fagopyrum species. Plant Physiol. Biochem. 2019, 144, 178–186. [Google Scholar] [CrossRef]
  42. Zhou, X.; Gu, Z.; Xu, H.; Chen, L.; Tao, G.; Yu, Y.; Li, K. The effects of exogenous ascorbic acid on the mechanism of physiological and biochemical responses to nitrate uptake in two rice cultivars (Oryza sativa L.) under aluminum stress. J. Plant Growth Regul. 2016, 35, 1013–1024. [Google Scholar] [CrossRef]
  43. Ling, J.; Tan, J.; Chen, H.; Yang, Z.; Luo, Q.; Jia, J. Physiology, transcriptome and root exudates analysis of response to aluminum stress in Pinus massoniana. Forests 2023, 14, 1410. [Google Scholar] [CrossRef]
  44. Roy, B.; Bhadra, S. Effects of toxic levels of aluminium on seedling parameters of rice under hydroponic culture. Rice Sci. 2014, 21, 217–223. [Google Scholar] [CrossRef]
  45. Alvim, M.N.; Ramos, F.T.; Oliveira, D.C.; Isaias, R.; França, M.G.C. Aluminium localization and toxicity symptoms related to root growth inhibition in rice (Oryza sativa L.) seedlings. J. Biosci. 2012, 37, 1079–1088. [Google Scholar] [CrossRef]
  46. dos Santos, B.S.; Ferreira, T.C.; Rosalem, P.F.; Olivio, M.L.G.; Bossardi, V.P.; Martins, A.R.; Souza, L.A.; Camargos, L.S. Aluminum stress in Crotalaria spp.: Anatomic changes, antioxidative response and nutrition. Plant Stress 2025, 17, 100967. [Google Scholar] [CrossRef]
  47. Zhang, Y.; Wu, J.; Liang, Z.; Chen, H.; Xu, T.; Tang, M. Different arbuscular mycorrhizal fungi alleviate aluminum-induced metabolic disruption and promote loquat growth. Ind. Crops Prod. 2025, 236, 121927. [Google Scholar] [CrossRef]
  48. Gao, S.; An, J.; Chen, H.; Shi, Y.; Wang, Y.; Wang, Q.; Yang, Y.; Zhang, Y.; Ding, Z.; Wang, H.; et al. Establishment of a comprehensive evaluation system for aluminum tolerance in tomato seedlings based on principal component analysis-clustering analysis-stepwise regression analysis. Chin. Bull. Bot. 2022, 57, 479. [Google Scholar]
  49. Cárcamo, M.P.; Reyes-Díaz, M.; Rengel, Z.; Alberdi, M.; Omena-Garcia, R.P.; Nunes-Nesi, A.; Inostroza-Blancheteau, C. Aluminum stress differentially affects physiological performance and metabolic compounds in cultivars of highbush blueberry. Sci. Rep. 2019, 9, 11275. [Google Scholar] [CrossRef]
  50. Lu, J.; Qu, X.; Li, J.; Li, Z.; Yuan, J. Characteristics of aluminum accumulation and distribution in leaves of different ages in Camellia oleifera. Forests 2023, 14, 2322. [Google Scholar] [CrossRef]
  51. Lyu, M.; Liu, J.; Xu, X.; Liu, C.; Qin, H.; Zhang, X.; Tian, G.; Jiang, H.; Jiang, Y.; Zhu, Z.; et al. Magnesium alleviates aluminum-induced growth inhibition by enhancing antioxidant enzyme activity and carbon–nitrogen metabolism in apple seedlings. Ecotoxicol. Environ. Saf. 2023, 249, 114421. [Google Scholar] [CrossRef]
  52. Keunen, E.; Peshev, D.; Vangronsveld, J.; Van Den Ende, W.; Cuypers, A. Plant sugars are crucial players in the oxidative challenge during abiotic stress: Extending the traditional concept. Plant Cell Environ. 2013, 36, 1242–1255. [Google Scholar] [CrossRef]
  53. Wu, X.; Khan, S.; Qi, Y.; Zhang, C.; Anwar, S.; Yin, L.; Huang, J. Metabolic and nutritional responses of contrasting aluminum-tolerant banana genotypes under Al stress. Plants 2025, 14, 385. [Google Scholar]
  54. Wang, W.; Vinocur, B.; Altman, A. Plant responses to drought, salinity and extreme temperatures: Towards genetic engineering for stress tolerance. Planta 2003, 218, 1–14. [Google Scholar] [CrossRef]
  55. de Sousa, A.; AbdElgawad, H.; Fidalgo, F.; Teixeira, J.; Matos, M.; Tamagnini, P.; Fernandes, R.; Figueiredo, F.; Azenha, M.; Teles, L.O.; et al. Subcellular compartmentalization of aluminum reduced its hazardous impact on rye photosynthesis. Environ. Pollut. 2022, 315, 120313. [Google Scholar] [CrossRef]
  56. Huang, D.; Gong, Z.; Chen, X.; Wang, H.; Tan, R.; Mao, Y. Transcriptomic responses to aluminum stress in tea plant leaves. Sci. Rep. 2021, 11, 5800. [Google Scholar] [CrossRef]
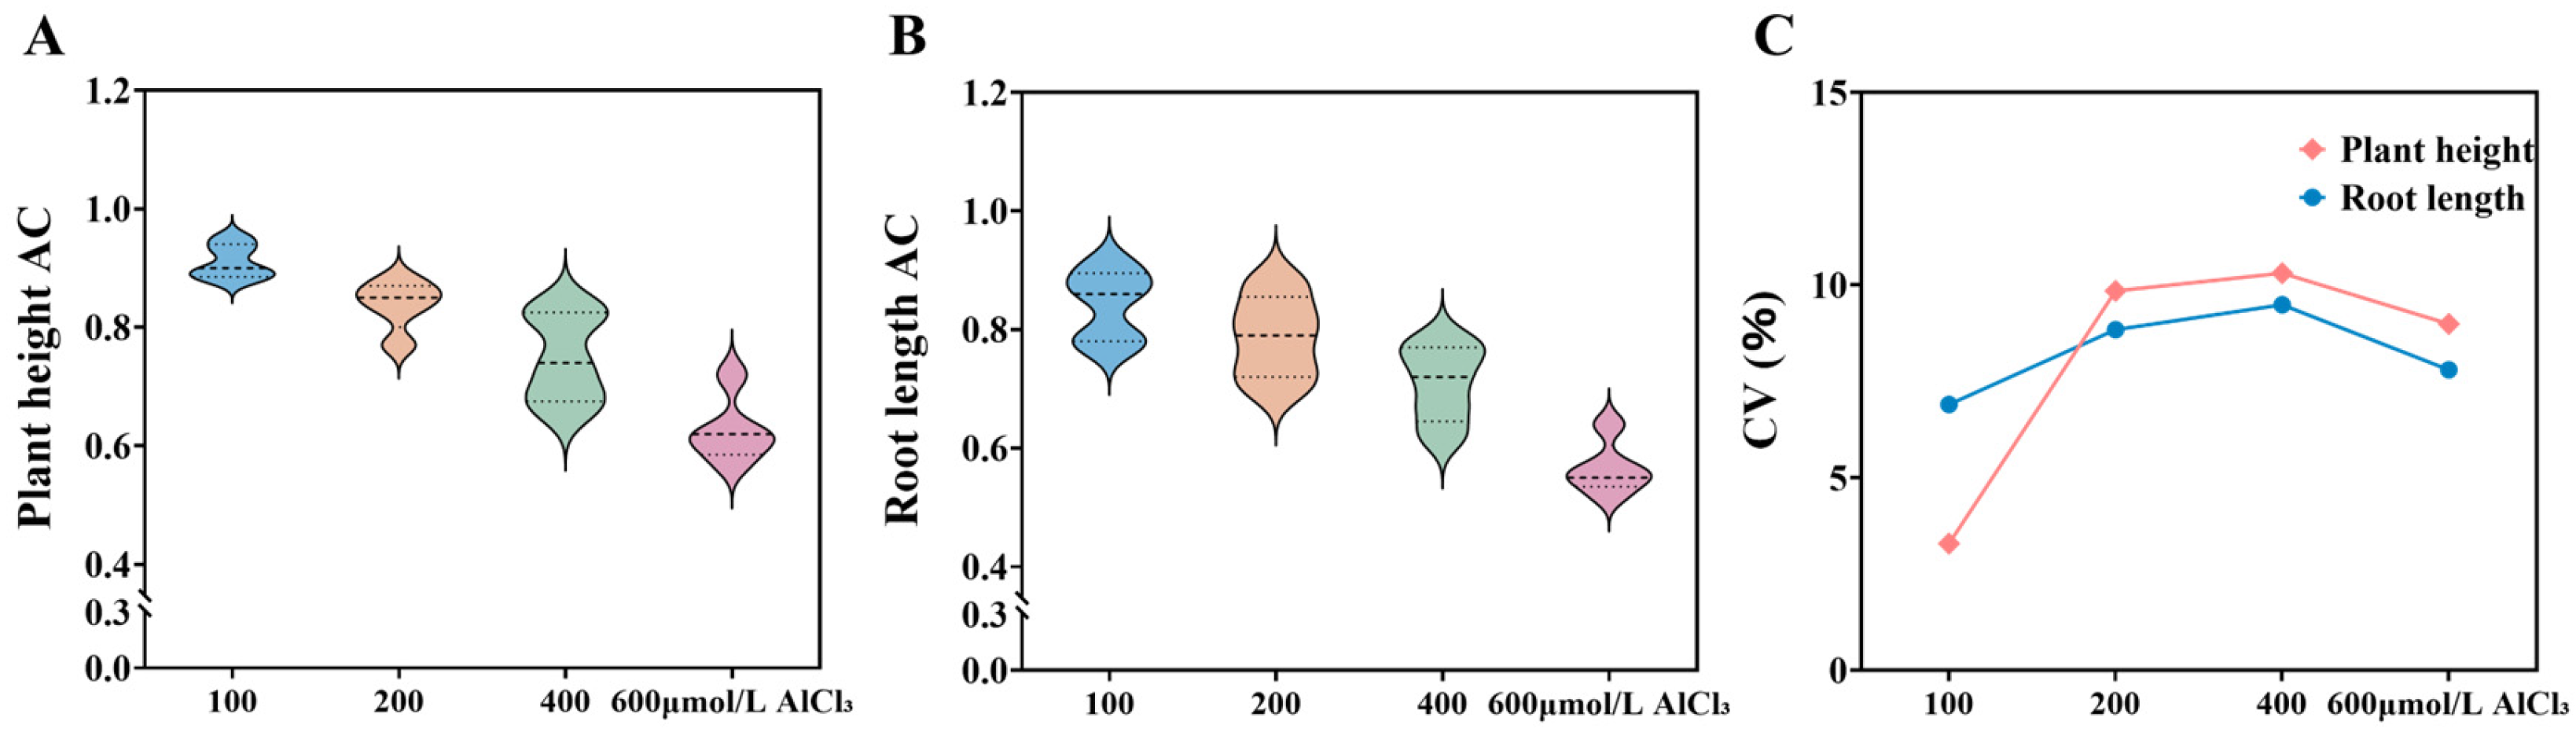
Figure 1. Distribution and variation in aluminum tolerance coefficients (ACs) for plant height and root length in celery under different AlCl3 concentrations: (A) Plant height AC; (B) Root length AC; (C) Coefficients of variation (%).
Agronomy 16 01105 g001
Figure 2. Phenotypic characteristics of 43 celery germplasm accessions under AlCl3 stress. Numbers correspond to accessions listed in Supplementary Table S1. (Left) Control; (Right) AlCl3 treatment. Scale bar = 10 cm.
Agronomy 16 01105 g002
Figure 3. Responses of various morphological and physiological indicators of celery to aluminum stress. PH: Plant height; ST: stem thickness; RL: Root length; SFW: Shoot Fresh Weight; RFW: Root Fresh Weight; SDW: Shoot Dry Weight; RDW: Root Dry Weight; Chl: Chlorophyll; SS: Soluble sugar; SP: Soluble protein; MDA: Malondialdehyde content; SOD: Superoxide dismutase activity; POD: Peroxidase activity; CAT: Catalase activity; ** indicates significance at p < 0.01.
Agronomy 16 01105 g003
Figure 4. Correlation analysis of aluminum tolerance coefficients in celery varieties under aluminum stress. PH: Plant height; ST: stem thickness; RL: Root length; SFW: Shoot Fresh Weight; RFW: Root Fresh Weight; SDW: Shoot Dry Weight; RDW: Root Dry Weight; SS: Soluble sugar; MDA: Malondialdehyde content; SOD: Superoxide dismutase activity; POD: Peroxidase activity; CAT: Catalase activity; * and ** denotes significance at p < 0.05 and p < 0.01, respectively.
Agronomy 16 01105 g004
Figure 5. Cluster analysis of the aluminum tolerance of the 43 celery varieties based on A values. I: Strongly aluminum-tolerant type, II: Aluminum-tolerant type, III: Medium aluminum-tolerant type, IV: Aluminum-sensitive type, V: Extremely aluminum-sensitive type.
Agronomy 16 01105 g005
Figure 6. Physiological responses of SBQ and WTL under AlCl3 stress. (A) Al content: aluminum content; (B) MDA: Malondialdehyde content; (C) Soluble sugar; (D) Soluble protein; (E) SOD: Superoxide dismutase activity; (F) POD: Peroxidase activity; (G) CAT: Catalase activity. Different letters indicate significant differences among treatments at p < 0.05. S_CK and W_CK represent the control groups of SBQ and WTL, respectively, whereas S_AL and W_AL represent the AlCl3 treatment groups of SBQ and WTL, respectively.
Agronomy 16 01105 g006
Figure 7. Photosynthetic pigments and chlorophyll fluorescence parameters of SBQ and WTL under AlCl3 stress. (A) Chlorophyll a; (B) Chlorophyll b; (C) Total chlorophyll; (D) Chlorophyll fluorescence parameters (Fv/Fm, Y(II), ETR, qP, qL, NPQ, qN). Different letters indicate significant differences among treatments at p < 0.05. S_CK and W_CK represent the control groups of SBQ and WTL, respectively, whereas S_AL and W_AL represent the AlCl3 treatment groups of SBQ and WTL, respectively.
Agronomy 16 01105 g007
Table 1. Principal Component Analysis of Individual Parameters in Celery Seedlings Under Aluminum Stress.
TraitsPrincipal Component
IIIIIIIVVVI
PH0.659−0.203−0.338−0.0020.1890.134
ST0.6360.0540.196−0.0700.3210.486
RL0.3300.3510.269−0.624−0.250−0.186
SFW0.8620.174−0.1360.0160.210−0.003
RFW0.7230.4220.085−0.043−0.293−0.089
SDW0.7170.4500.0700.1830.259−0.074
RDW0.6440.281−0.0250.318−0.391−0.157
Chl0.159−0.158−0.541−0.3810.495−0.361
SS0.303−0.285−0.4800.092−0.3350.545
SP−0.3190.5260.1070.3900.4560.014
MDA−0.7110.435−0.0530.0800.0460.171
SOD0.200−0.5340.411−0.3060.0990.021
POD0.303−0.4350.6310.2130.1750.080
CAT0.275−0.533−0.0500.523−0.077−0.459
Eigenvalue4.0741.9881.3631.2561.1641.001
Contribution rate (%)29.10214.2019.7348.9698.3137.152
Cumulative contribution rate (%)29.10243.30353.03762.00670.31877.470
Table 2. A value, CAC value, WAC value, and F value for the comprehensive evaluation of aluminum tolerance in celery.
NumberA CAC WAC F
ValueRankValueRankValueRankValueRank
10.68111.11881.04681.0774
20.442340.947310.87531−0.45632
30.451320.812380.70341−0.85238
40.475260.962260.91327−0.09026
50.322400.650430.56843−1.63042
60.491250.898330.853320.06121
70.461280.957280.90328−0.27729
80.525200.953290.901290.34716
90.511220.790400.728390.04322
100.459300.881350.834350.03223
110.420360.846370.78837−0.63933
120.462270.997210.92623−0.33430
130.271420.712420.64842−1.61341
140.583120.992220.924240.27718
150.581131.25221.16920.53714
160.64141.022160.977161.1282
170.61471.069120.987140.7768
180.551150.950300.889300.26719
190.544170.783410.716400.19620
200.511210.979250.91925−0.21527
210.62261.084111.02690.9237
220.456310.895340.84333−0.40631
230.427350.987230.93221−0.67735
240.340390.870360.82136−1.32139
250.590100.980240.928220.66112
260.310410.810390.75538−1.59840
270.60491.20361.14261.0645
280.66921.21651.15331.3271
290.459291.23441.1504−0.25028
300.492241.12871.05770.02124
310.222431.001200.94120−1.96143
320.391380.914320.83734−0.74837
330.64831.011170.957171.0106
340.526190.957270.918260.53415
350.391371.09991.02510−0.65634
360.60481.037150.993131.0963
370.501231.23931.1465−0.02625
380.580321.050141.005120.75010
390.447331.086101.01411−0.69636
400.545161.005190.952190.54713
410.527181.27011.18910.30117
420.62551.005180.957180.7749
430.590111.054130.977150.69611
Disclaimer/Publisher’s Note: The statements, opinions and data contained in all publications are solely those of the individual author(s) and contributor(s) and not of MDPI and/or the editor(s). MDPI and/or the editor(s) disclaim responsibility for any injury to people or property resulting from any ideas, methods, instructions or products referred to in the content.