Article

Improved Water Use Efficiency in Rice During Drought–Rewatering Cycles: Insights from Transcriptomics and Metabolomics


State Key Laboratory of Water Resources Engineering and Management, Wuhan University, Wuhan 430072, China
*
Author to whom correspondence should be addressed.
Agronomy 2026, 16(10), 975; https://doi.org/10.3390/agronomy16100975
Submission received: 12 April 2026 / Revised: 3 May 2026 / Accepted: 11 May 2026 / Published: 14 May 2026
(This article belongs to the Section Plant-Crop Biology and Biochemistry)

Abstract

Alternate wetting and drying (AWD) is a crucial water-saving irrigation strategy in rice production, yet its regulatory mechanisms during drought–rewatering cycles remain unclear, particularly across recovery stages. Using a polyethylene glycol (PEG-6000) hydroponic system, we analyzed physiological, metabolomic, and transcriptomic responses of Oryza sativa L. ssp. japonica under control, continuous drought, and rewatering treatments. The net photosynthetic rate (Pn) recovered within one day after rewatering, and subsequently exceeded control levels, indicating a photosynthetic compensatory effect. In contrast, instantaneous water-use efficiency (WUE) showed only a transient increase before declining thereafter and remaining lower than under continuous drought, revealing an asynchronous recovery in which carbon assimilation precedes the recovery of transpiration. Metabolomic analysis indicated a shift from drought-induced accumulation to recovery-driven metabolic reprogramming, with coordinated up-regulation of central carbon metabolism and chlorophyll biosynthesis. Decreases in citrate, malate, and glutamate suggested their sustained utilization to support nitrogen assimilation and chlorophyll synthesis. Transcriptomic data further revealed large-scale reprogramming during late recovery, including up-regulation of nitrogen assimilation genes (e.g., NIA, NiR), linking carbon–nitrogen coordination with photosynthetic compensation. Overall, these results demonstrate that stage-specific integration of physiological recovery, metabolic restructuring, and transcriptional regulation underlies AWD-induced efficiency and identify early rewatering as a critical window for optimizing WUE.

1. Introduction

Rice (Oryza sativa L.) ranks among the world’s most essential cereal crops, serving as the primary dietary staple for over half of the global population. Rice production predominantly depends on conventional flooded irrigation, consuming substantially more water than other staple cereals (e.g., wheat or maize). In rice cultivation, the total water usage ranges from 6000 to 90,000 m3 per hectare [1,2]. As water scarcity becomes increasingly severe, developing water-saving irrigation techniques that sustain or enhance rice productivity has become imperative [3].
Water Use Efficiency (WUE) is a key indicator for assessing the effectiveness of water resource utilization in agricultural production. It is defined as the ratio of carbon dioxide fixed through photosynthesis to the water lost via transpiration [4]. Studies have demonstrated that WUE varies significantly among crops, with reported ranges of 0.6–1.7 kg/m3 for wheat, 0.6–1.6 kg/m3 for rice, and 1.1–2.7 kg/m3 for maize [5]. The primary factors affecting WUE include genetics, environment, soil, and management [6]. For example, crop WUE is strongly affected by differences in photosynthetic pathways (such as C3 and C4 plants) as well as their ability to regulate stomatal conductance [7]. Research indicates that elevated CO2 facilitates a 19% increase in rice WUE under arid and windy conditions, driven by a 9.1% gain in total biomass and an 8.2% decline in transpiration [8]. Agronomic practices such as adopting drip irrigation over traditional flood irrigation, using mulch for moisture conservation, and optimizing nitrogen and phosphorus fertilization strategies have been shown to enhance water productivity [9]. Enhancing WUE not only supports crop yield formation but also serves as a scientific basis for field water management, addressing global water scarcity challenges.
Alternate Wetting and Drying (AWD) is a water-saving irrigation technique for rice cultivation that alternates between flooding and drying periods in paddy fields, allowing rice plants to meet their water requirements while reducing irrigation input and improving WUE [10]. AWD irrigation involves monitoring soil moisture thresholds, typically at 60–70% of field capacity, and irrigating only when root zone moisture is insufficient. Mild AWD can reduce irrigation water use by approximately 20–30% compared to conventional flooding irrigation [11,12]. Meta-analysis and field studies have shown that AWD irrigation can reduce irrigation water input by approximately 25%, increase WUE by 20–30%, and cause little or no yield penalty compared with conventional flooding [10,13,14]. The International Rice Research Institute (IRRI) and the FAO have therefore recommended AWD as a scalable water-saving technology for global rice systems. However, the physiological mechanisms underlying WUE improvement under AWD, particularly the coordination between photosynthetic carbon assimilation and transpiration, remain incompletely understood.
AWD irrigation enhances WUE through multiple physiological and agronomic mechanisms [15]. Compared with continuous flooding, AWD reduces unproductive water losses by minimizing surface runoff and deep percolation, thereby improving irrigation efficiency [10,11]. While the agronomic benefits of AWD in improving WUE are well-documented at the field scale, including reduced irrigation water input and enhanced water productivity with no or less yield penalties, understanding the underlying physiological and molecular regulatory mechanisms remains essential [13,16].
Previous studies have shown that the improvement of WUE under AWD is closely associated with changes in photosynthetic and transpiration-related traits. Drought or intermittent soil drying generally reduces net photosynthetic rate (Pn), stomatal conductance (gs), transpiration rate (Tr), and chlorophyll content in rice, thereby limiting carbon assimilation capacity [17,18,19]. Experimental data demonstrated that upon rewatering, rice plants restored their chlorophyll content to a higher level, with photosynthetic rates showing a more pronounced compensatory effect and enhanced efficiency [17]. It has been reported that a moderate wetting and drying regime contributes to superior photosynthetic performance in flag leaves during late growth stages [20].
With the rapid advancement of multi-omics technologies, research on the molecular basis of WUE regulation under AWD and drought–rewatering conditions has progressively moved to a deeper mechanistic level. Transcriptomic studies have demonstrated that dehydration and rehydration constitute a complex and dynamic regulatory process involving biological processes related to photosynthesis, nitrogen metabolism, phytohormone signaling, and gene expression regulation [21,22,23,24]. Meanwhile, previous metabolomic and multi-omics analyses have indicated that drought stress is associated with substantial shifts in carbon and nitrogen metabolism, amino acid metabolism, starch and sucrose metabolism, and redox-related processes, suggesting that metabolic reconfiguration may facilitate the recovery of photosynthetic function and cellular homeostasis after rehydration [25,26,27]. Overall, these findings imply that post-rewatering photosynthetic recovery is closely linked to an integrated recovery program, in which transcriptional activation and metabolic reorganization jointly facilitate the restoration of carbon assimilation capacity and may, in some cases, contribute to its transient enhancement.
Despite substantial progress in understanding rice responses to drought stress, most previous studies have focused primarily on the stress phase, whereas the molecular basis of photosynthetic recovery and compensatory enhancement after rehydration remains largely underexplored. In particular, how transcriptional and metabolic reprogramming are coordinated with physiological recovery and WUE improvement during the drought–rewatering cycle is still unclear. Therefore, in this study, we integrated physiological measurements, metabolomic profiling, and transcriptomic analysis to quantify the regulatory coupling and coordinated mechanisms underlying photosynthetic recovery and WUE enhancement in japonica rice following rehydration. By establishing direct correlations between molecular shifts and physiological performance, this research provides a mechanistic framework for understanding how rice optimizes its internal processes during the drought–rewatering cycle, offering insights into the biological drivers of water-saving irrigation strategies.

2. Materials and Methods

2.1. Plant Material and Growth Conditions

Seeds of rice (Oryza sativa L. ssp. japonica) were germinated in the dark at 28 °C and 90% relative humidity for 5 days. Healthy germinated seedlings were transferred to plastic boxes containing 1 L of Yoshida nutrient solution (Coolaber, Beijing, China) [28] supplemented with 2.9 mM NH4NO3, 0.3 mM NaH2PO4, 0.5 mM K2SO4, 1 mM CaCl2, and 1.6 mM MgSO4·7H2O. Plants were grown in a controlled chamber (30 °C, 16 h light/8 h dark, 60% relative humidity, ~300 μmol m−2 s−1 PAR, ~550 ppm CO2) for 6 weeks prior to treatments.
For the osmotic stress treatments, a 10% (w/v) polyethylene glycol (PEG-6000) solution was prepared by dissolving 100 g of PEG-6000 solid (Coolaber, Beijing, China) into the standard Yoshida nutrient solution and adjusting the final volume to 1000 mL. The pH of all solutions was meticulously adjusted to 5.7–5.9.
To eliminate potential confounding factors and ensure experimental rigor, a synchronized refreshment protocol was implemented for all treatment groups throughout the experiment. On the designated treatment days (Day 0, 3, 6, 9, and 12), the nutrient media for all groups (CK, CD, and CE) were refreshed at 18:00. Specifically, the osmotic stress for the CD and CE groups was initiated at 18:00 on t = 0 by replacing the standard nutrient solution with 1 L of 10% (w/v) PEG-6000 solution. Simultaneously, the nutrient solution for the CK group was also refreshed with fresh IRRI medium to ensure that all plants were subjected to identical mechanical disturbance and transient root-air exposure, thereby eliminating potential errors arising from the handling process. This standardized procedure ensured that all plants, including the control group, were subjected to identical mechanical disturbance and root-air exposure. Physiological parameters were consistently measured at 09:00 the following morning to allow for a 17 h stabilization period post-handling.

2.2. Rice Physiological and Morphological Traits

Photosynthetic parameters—including net photosynthetic rate (Pn), stomatal conductance (gs), transpiration rate (Tr) and intercellular CO2 concentration (Ci)—were measured on the youngest fully expanded leaves between 9:00 and 11:00 a.m. using a portable photosynthesis system (LI-6800; LI-COR Biosciences, Lincoln, NE, USA) to minimize diurnal variation. Two initial treatments were established: a well-watered control (CK) and a drought-stressed group (CD). Drought stress was imposed at t = 0, and measurements were conducted at designated time points (Day 0, 1, 3, 4, 6, 8, 10, 12 and 14) to enable continuous, non-destructive monitoring of physiological responses. Rehydration treatment (CE) was initiated at 18:00 on t = 3 by replacing the nutrient solution, thus designating t = 4 as the first full day of the rewatering phase, while the remaining plants were maintained under their original treatments.
Water use efficiency (WUE) was calculated as the ratio of net photosynthetic rate (Pn) to transpiration rate (Tr):
WUE = P n / T r
Pn is the net photosynthetic rate (µmol CO2 m−2 s−1) and Tr is the transpiration rate (mmol H2O m−2 s−1).
To evaluate the pigment-level structural adjustments within the photosynthetic apparatus, the youngest fully expanded leaves were collected at four key time points: t = 0 (the onset of drought stress), t = 4 (1 d post-rewatering for the CE group, corresponding to 4 d of continuous drought for the CD group), t = 6 (3 d post-rewatering), and t = 12 (9 d post-rewatering). To accommodate the destructive nature of the sampling, independent sets of plants were harvested at each stage (n = 3 biological replicates per treatment per time point).
Ten leaf discs (5 mm in diameter) were excised from fresh rice leaves from each group, placed into a centrifuge tube, and immersed in 10 mL of anhydrous ethanol (≥99.8% purity). The mixture was extracted for 30 s to ensure complete contact between the tissue and ethanol, then incubated in the dark for 24 h to facilitate pigment extraction. After extraction, the solution volume was adjusted to 25 mL with anhydrous ethanol. The absorbance of the extract was measured at 665, 649, and 470 nm using a UV-6400 visible spectrophotometer (Shanghai Metash Instruments Co., Shanghai, China). Chl a and Chl b concentrations were calculated according to Lichtenthaler and Wellburn (1983) [29], using both absorbance values in the following equations:
Chl a = 13.95 × A665 − 6.88 × A649
Chl b = 24.96 × A649 −7.32 × A665
Car = (1000 × A470 − 2.05 × Chl a − 114.8 × Chl b)/245
where A665, A649 and A470 represent the absorbance at 665, 649 and 470nm, respectively. Total chlorophyll was calculated as the sum of Chl a and Chl b. The results were expressed as μg/cm2.

2.3. Metabolome Analysis and Sample Preparation

For each biological replicate, a unified batch of fresh tissue (approximately 500 mg), pooled from six independent seedlings to minimize individual biological variation, was immediately flash-frozen in liquid nitrogen. To ensure high statistical robustness, six independent biological replicates (n = 6) were analyzed for each treatment (representing a total of 36 seedlings per treatment group). Samples were transported on dry ice to Majorbio Laboratory (Shanghai, China) and stored at −80 °C.
Metabolites were then profiled using a gas chromatography system (Agilent 7890B, Santa Clara, CA, USA) coupled with a quadrupole mass spectrometer (Agilent 5977A, USA). Multivariate analyses, including principal component analysis (PCA) and partial least squares discriminant analysis (PLS-DA), as well as metabolic pathway enrichment, were performed using MetaboAnalyst 4.0 (http://www.metaboanalyst.ca/).

2.4. RNA-Seq Library Construction and Transcriptomic Data Processing

Utilizing the same batch of leaf tissue described in Section 2.3, total RNA was extracted and sequencing libraries were constructed for six independent biological replicates (n = 6) per treatment. Raw RNA-Seq reads were subjected to quality control using Sickle implemented in Trinity v2.5.1 with default parameters. High-quality clean reads were then mapped to the reference genome, and gene-level read counts were obtained using HTSeq v0.6.1. Gene expression levels were normalized and expressed as FPKM (fragments per kilobase of exon per million mapped reads), calculated according to both gene length and read count. Differentially expressed genes (DEGs) were identified with the EdgeR package (v3.1.2), using a false discovery rate (FDR) < 0.05 as the significance threshold.
Volcano plots were generated to visualize the overall distribution of DEGs across treatments, with up- and down-regulated genes indicated by red and blue dots, respectively. The identified DEGs were further subjected to Gene Ontology (GO) enrichment (Majorbio Cloud Platform (https://cloud.majorbio.com, accessed on 10 May 2026) and Kyoto Encyclopedia of Genes and Genomes (KEGG) pathway analysis (https://www.kegg.jp/kegg/pathway.html), accessed on 10 May 2026) to determine the major biological processes and metabolic pathways affected by drought and rehydration treatments [30]. Raw sequencing data have been deposited in the NCBI Sequence Read Archive (SRA) under BioProject PRJNA1453766.

2.5. Statistical Analysis

Gas exchange parameters, including net photosynthetic rate (Pn), stomatal conductance (gs), and transpiration rate (Tr), were automatically calculated by the LI-6800 system software (LI-COR Biosciences, Lincoln, NE, USA). Data processing and preliminary statistical analysis were performed using Microsoft Excel (version 2013; Microsoft Corp., Redmond, WA, USA). All physiological and biochemical data were presented as the mean ± standard deviation (SD). Statistical analyses were performed using SPSS 25.0 (IBM Corp., Armonk, NY, USA). One-way analysis of variance (ANOVA) followed by Duncan’s multiple range test was employed to determine significant differences among treatments at a significance level of p < 0.05.
For individual transcriptomic and metabolomic profiling, six biological replicates (n = 6) were employed to ensure robust identification of differentially expressed genes and metabolites. For the integrated analysis (e.g., Pearson correlation and heatmap visualization) involving physiological parameters, a representative subset of three biological replicates (n = 3) was utilized to ensure precise alignment and biological synchronization across multi-scale datasets. Pearson correlation coefficients (r) and linear regression analyses were conducted and visualized using Origin 2024 (OriginLab, Northampton, MA, USA) and the TBtools-II software (version 2.119).

3. Results

3.1. Photosynthetic Performance and WUE Under Drought and Rehydration

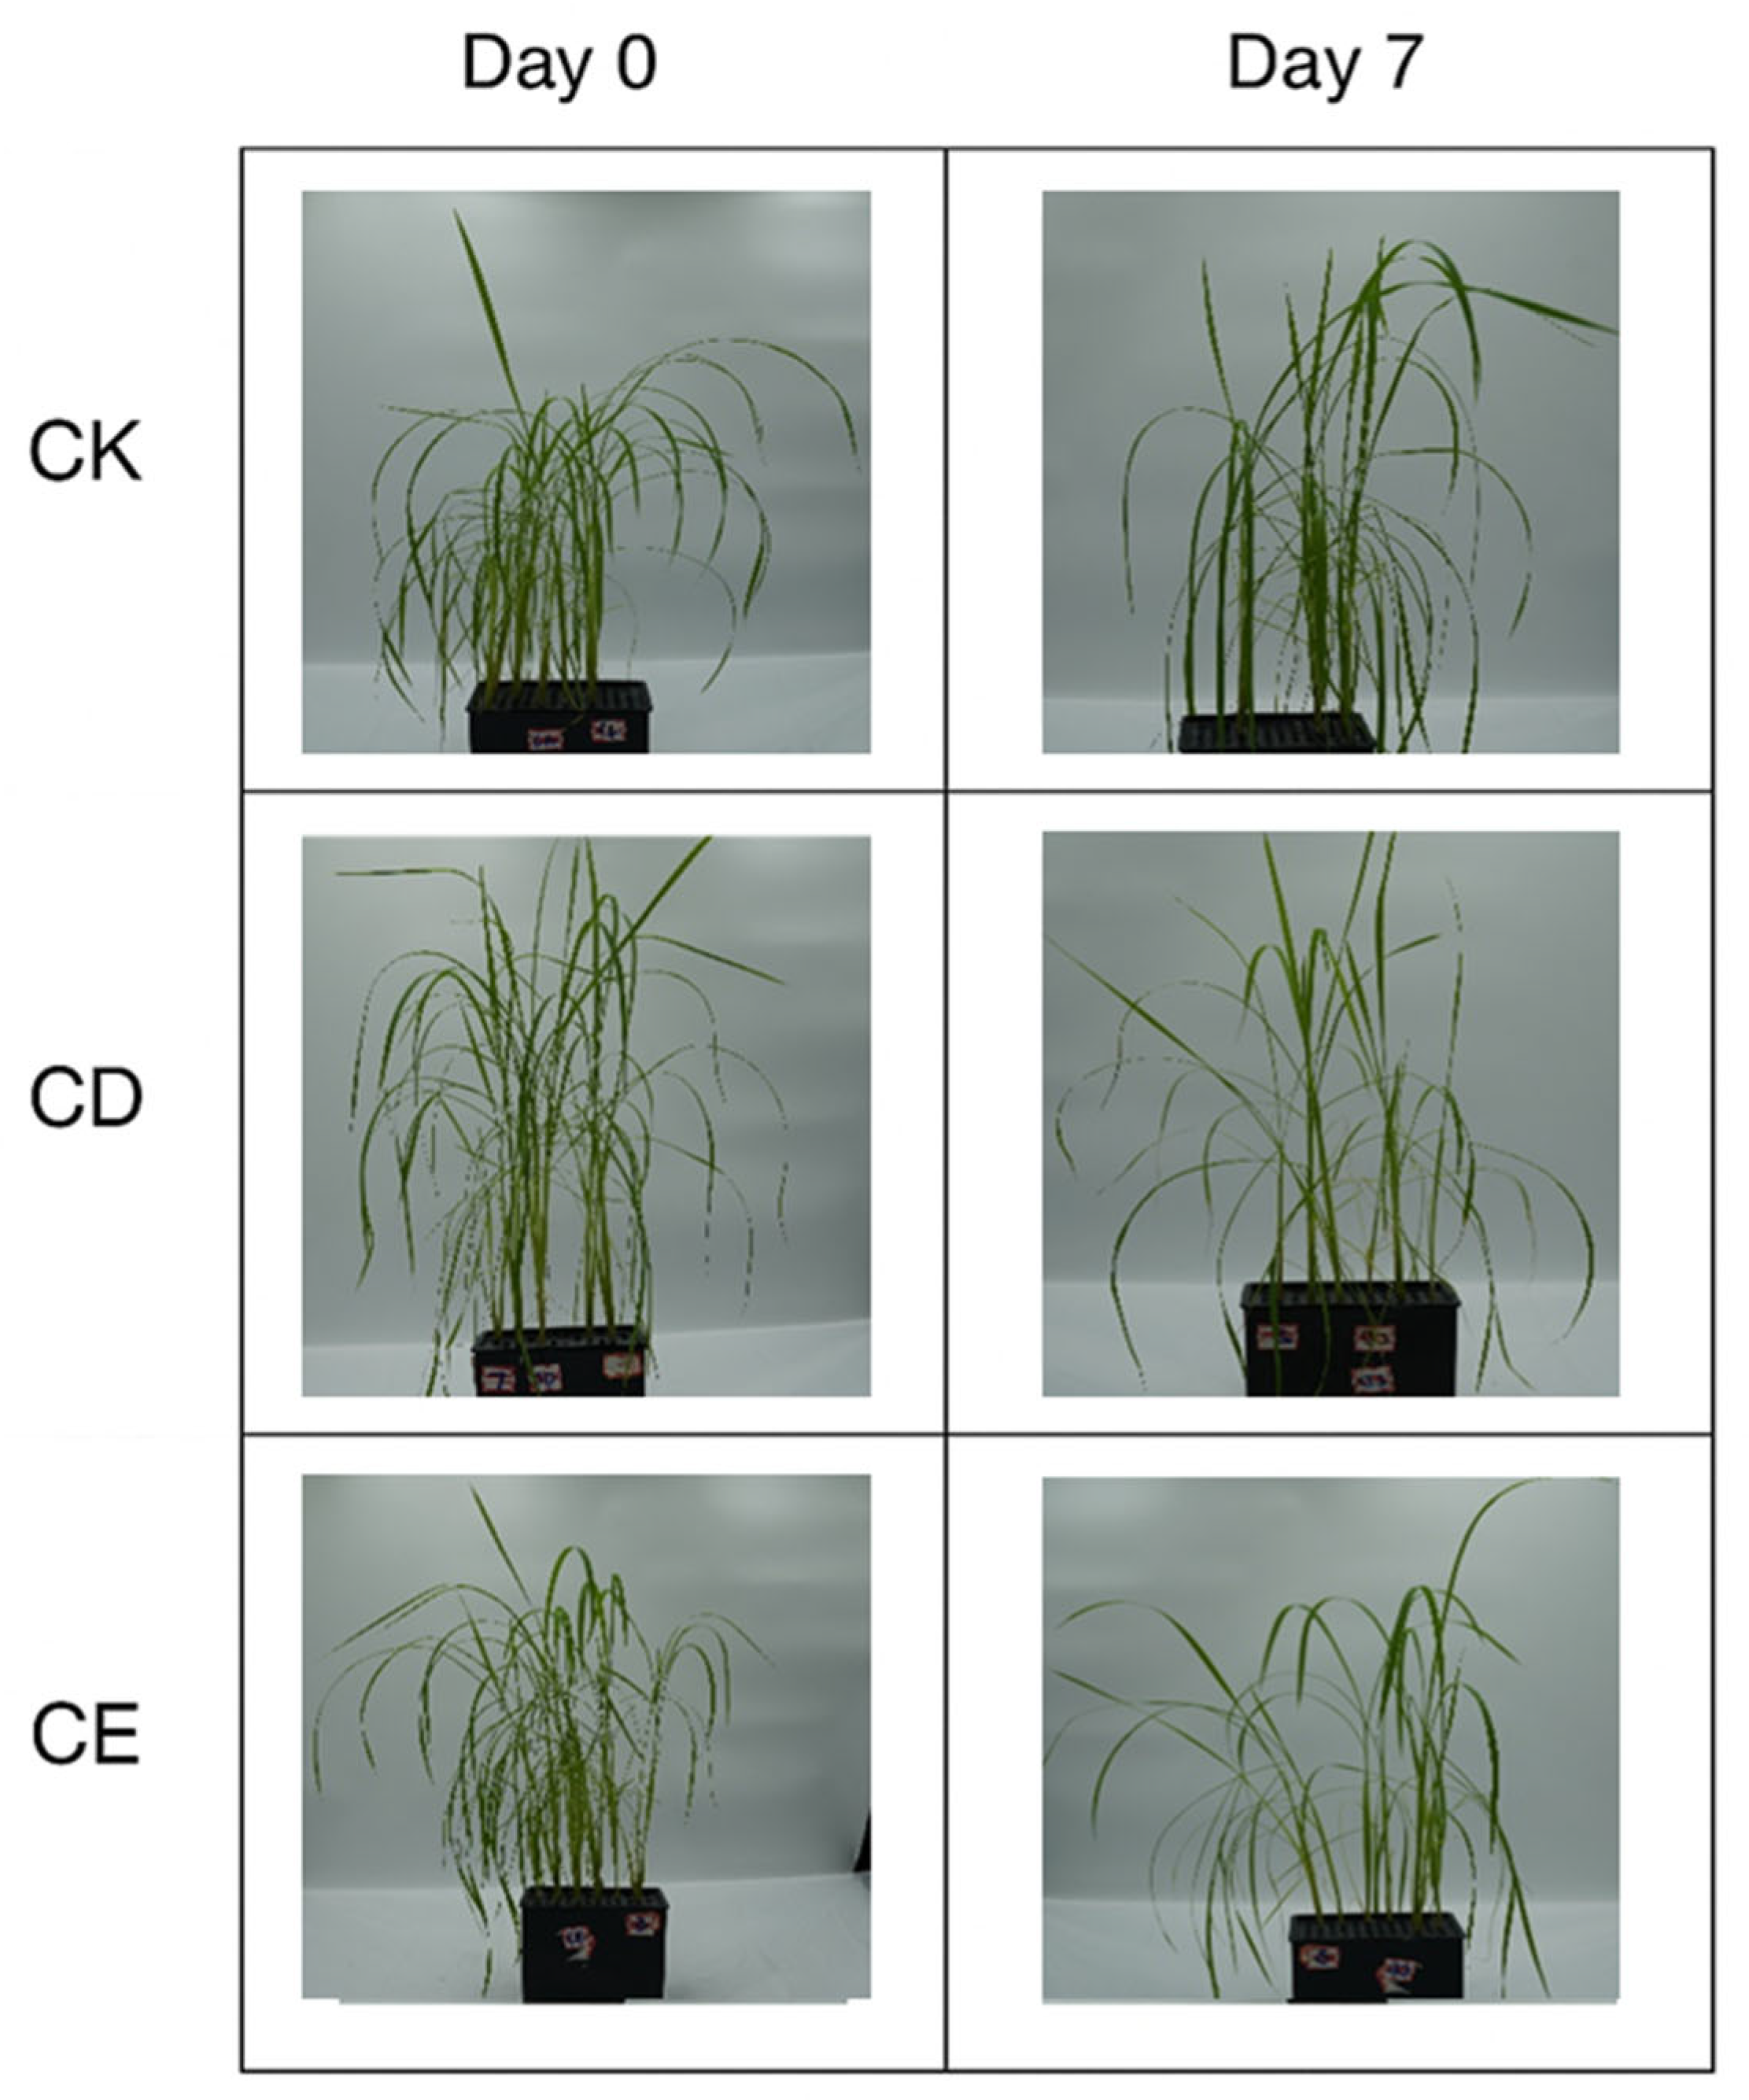
Phenotypic observations revealed distinct morphological responses of rice plants under different water-regime treatments at Days 0 and 7 (Figure 1). At Day 0, all plants showed similar appearances with fully expanded, healthy green leaves. By Day 7, the continuously flooded plants (CK) maintained turgid leaves and upright posture, whereas continuously drought-stressed plants (CD) exhibited pronounced leaf rolling, wilting, and chlorosis, indicating significant water stress. In contrast, rice after rewatering (CE) displayed partial morphological recovery by Day 7, with greener leaves and more open leaf angles compared to CD, implying some restoration of turgor following rehydration.
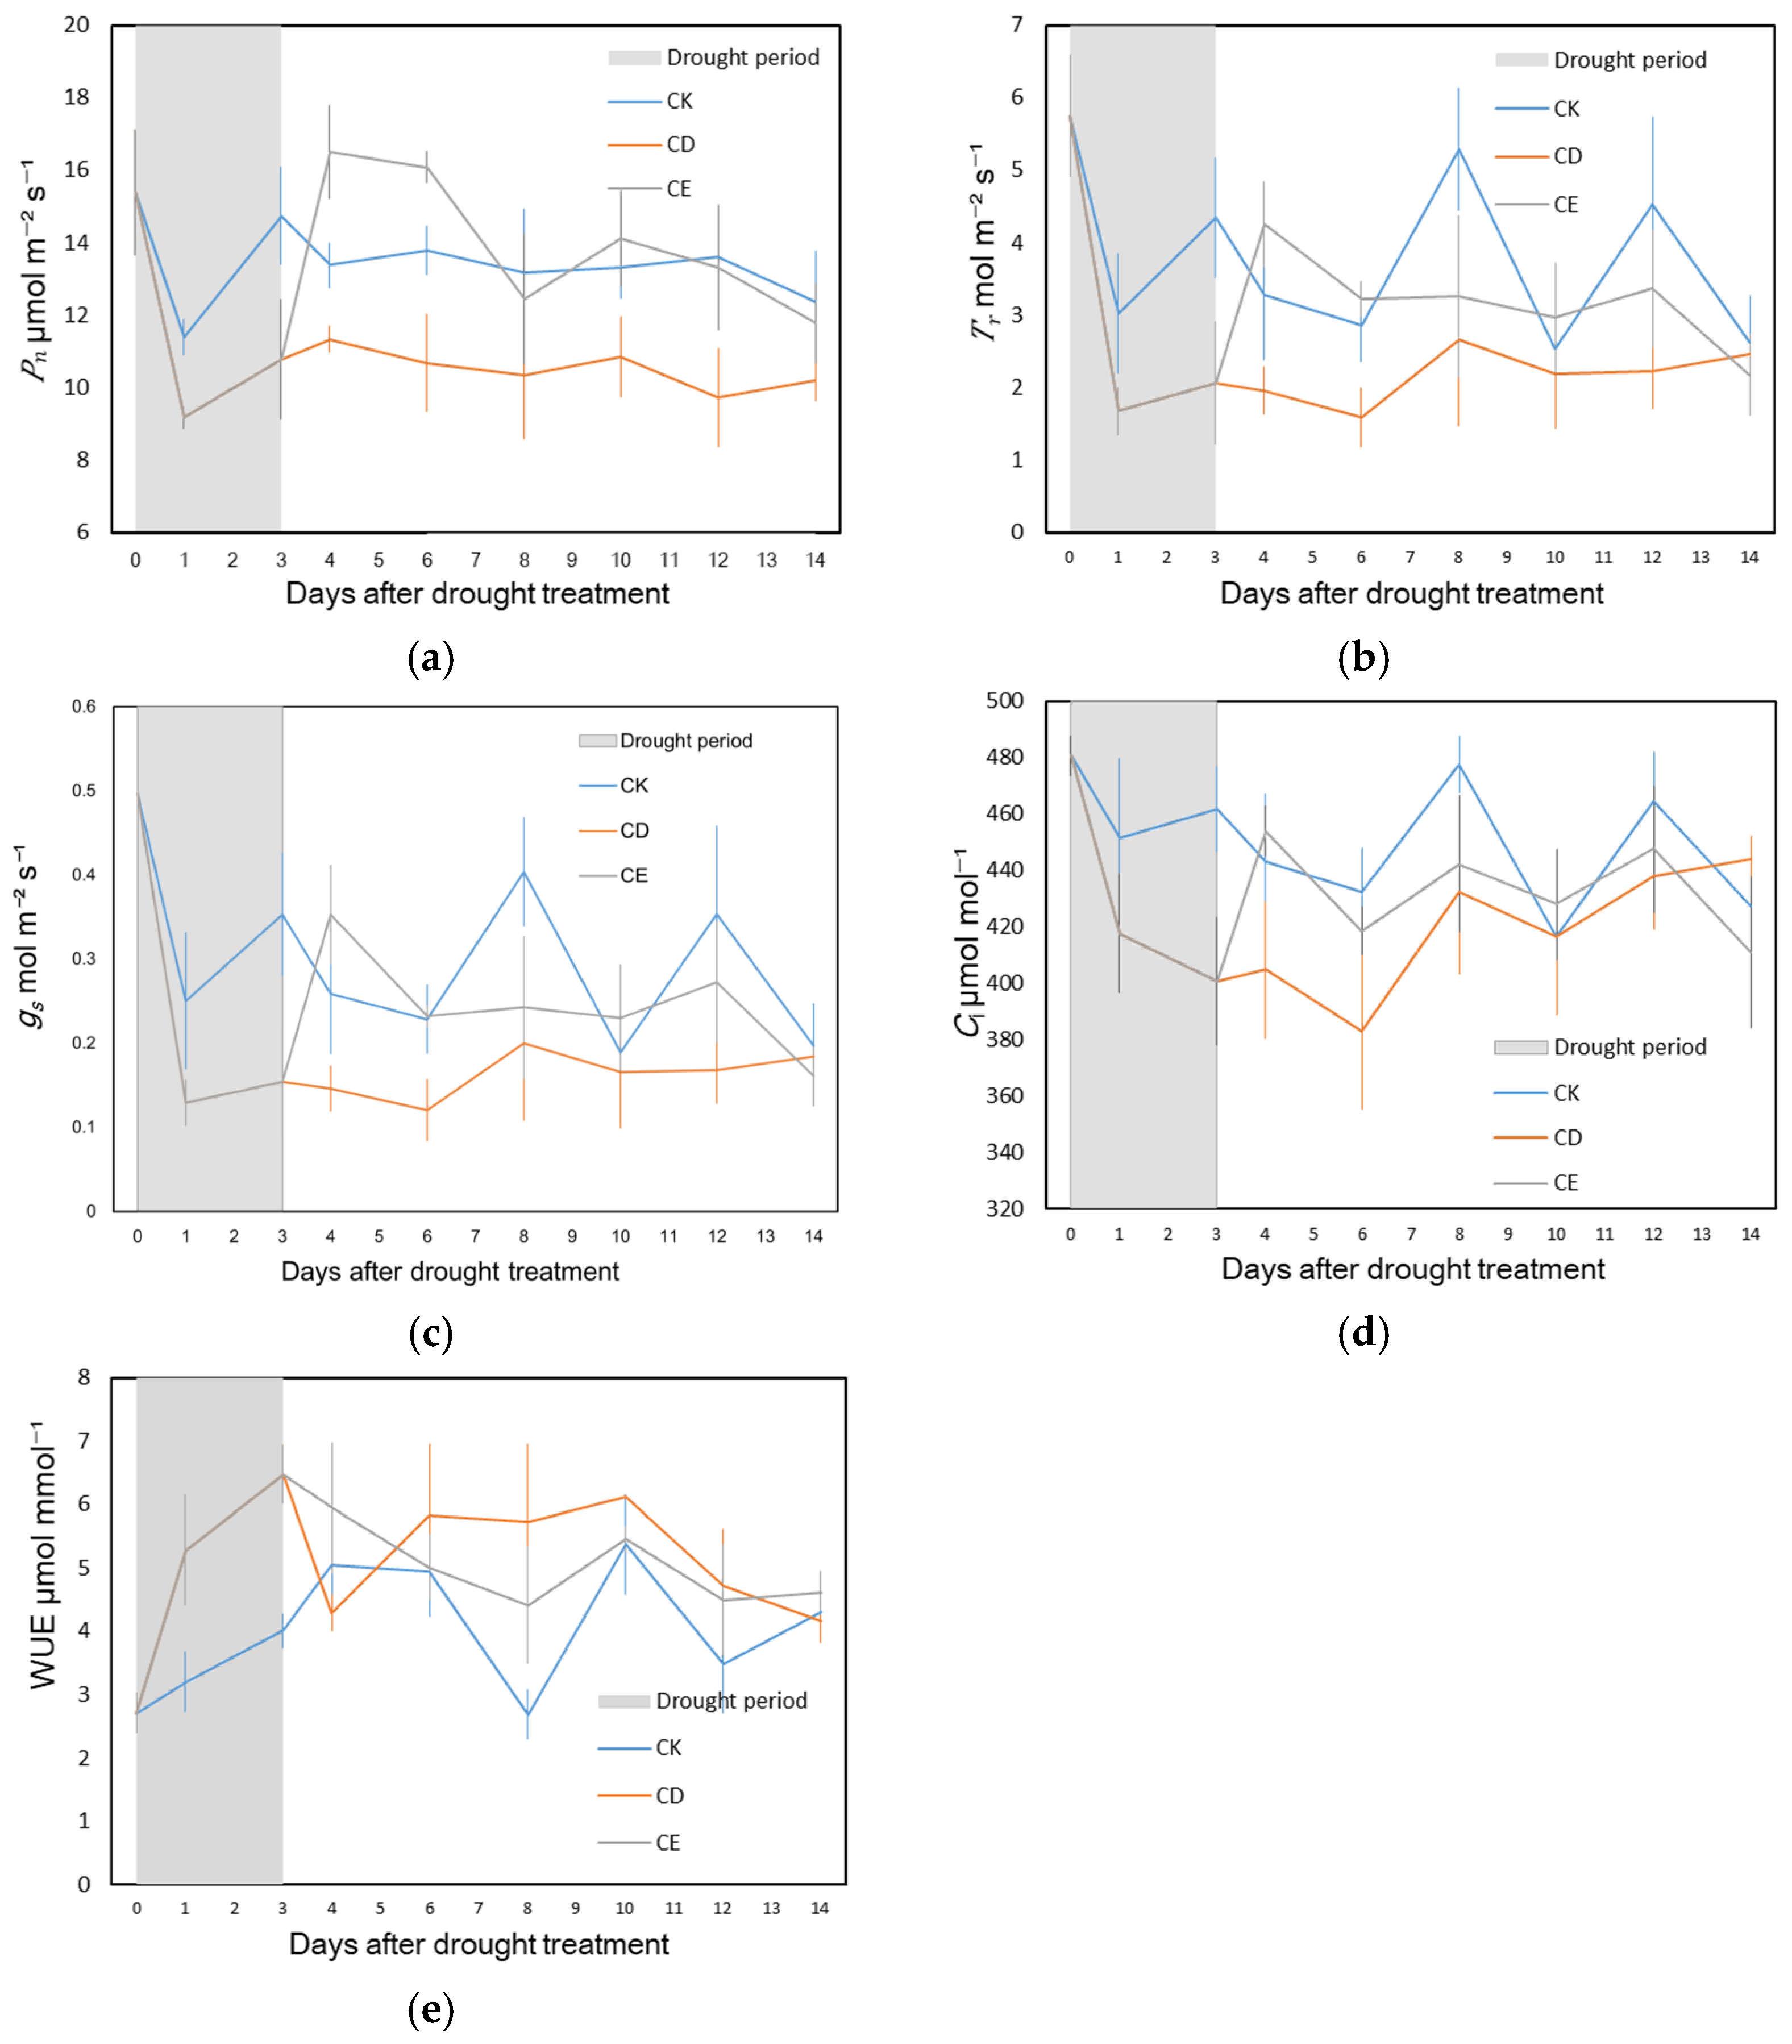
Gas-exchange measurements further demonstrated the contrasting physiological responses of rice plants under different water regimes (Figure 2). At the onset of drought (Day 1), the Pn in CD plants dropped from 15.4 µmol m−2 s−1 on Day 0 to 9.2 µmol m−2 s−1, a reduction of nearly 40%, and remained low (about 10.5 µmol m−2 s−1) throughout the drought period (Figure 2a). In contrast, CE plants showed a rapid rebound in Pn following rehydration at 16:00 on Day 3, reaching 16.5 µmol m−2 s−1 on Day 4, which was about 20% higher than the peak value in the continuously flooded control (CK), and demonstrating a significant photosynthetic super-compensation effect.
Tr in CD plants declined sharply from 5.75 mmol m−2 s−1 to 1.68 mmol m−2 s−1 on Day 3 and remained below 2.2 mmol m−2 s−1 during drought (Figure 2b). Following rehydration, CE plants recovered to 4.25 mmol m−2 s−1 on Day 4 and maintained moderate values (about 3.3 to 3.4 mmol m−2 s−1) thereafter. However, unlike the super-compensation observed in, Tr in CE plants did not exceed CK levels during the initial recovery phase (Day 4–6), but rather fluctuated near or slightly below the control values.
The variation in gs is similar to the trend in Tr (Figure 2c). On Day 1, gs in CD plants decreased from 0.50 mol to 0.13 mol m−2 s−1 and remained below 0.20 mol m−2 s−1, reflecting severe stomatal closure and restricted gas diffusion. After rehydration, gs in CE plants increased rapidly to 0.35 mol m−2 s−1 on Day 4 and stabilized around 0.23–0.27 mol m−2 s−1 during the recovery phase, without sustained elevation above CK.
The variation in Ci provided further evidence of the physiological shifts occurring during drought and recovery (Figure 2d). During drought stress, Ci in CD plants decreased continuously to its lowest point at 383 µmol mol−1 on t = 6. After rehydration, Ci in CE plants exhibited a rapid recovery, surging back to 453.9 µmol mol−1 on t = 4, which was comparable to the CK level. Throughout the remainder of the experiment, Ci in CE plants remained stable and comparable to the control. Notably, Ci recovered to control levels by t = 4, coinciding with the day when Pn showed super-compensation.
The instantaneous WUE displayed an opposite trend relative to Tr and gs (Figure 2e). During drought period, WUE in CD plants increased markedly from 2.73 to 6.48 µmol CO2 mmol−1 H2O by Day 3. This increase was primarily driven by the greater suppression of Tr relative to Pn under water deficit. After rehydration, CE plants maintained elevated WUE (about 5.46 µmol CO2 mmol−1 H2O at Day 10), slightly higher than CK (about 5.37 µmol CO2 mmol−1 H2O). By t = 14, WUE values in all treatments converged (4.2–4.6 µmol CO2 mmol−1 H2O).
Overall, the gas-exchange measurements revealed that rehydration rapidly restores photosynthetic and water-use functions in CE plants. Specifically, Pn and WUE exhibited a robust rebound within 24 h (by Day 4), reaching or significantly exceeding the levels of the well-watered control group (CK). In contrast, the recovery of gs and Tr was more gradual, with values remaining comparable to or lower than CK throughout the recovery phase. Meanwhile, Ci was quickly restored to control levels upon rehydration and remained stable thereafter. Although CD plants exhibited higher WUE, their Pn remained consistently suppressed throughout the experimental period.

3.2. Chlorophyll and Carotenoids Content Responses to Drought and Rehydration

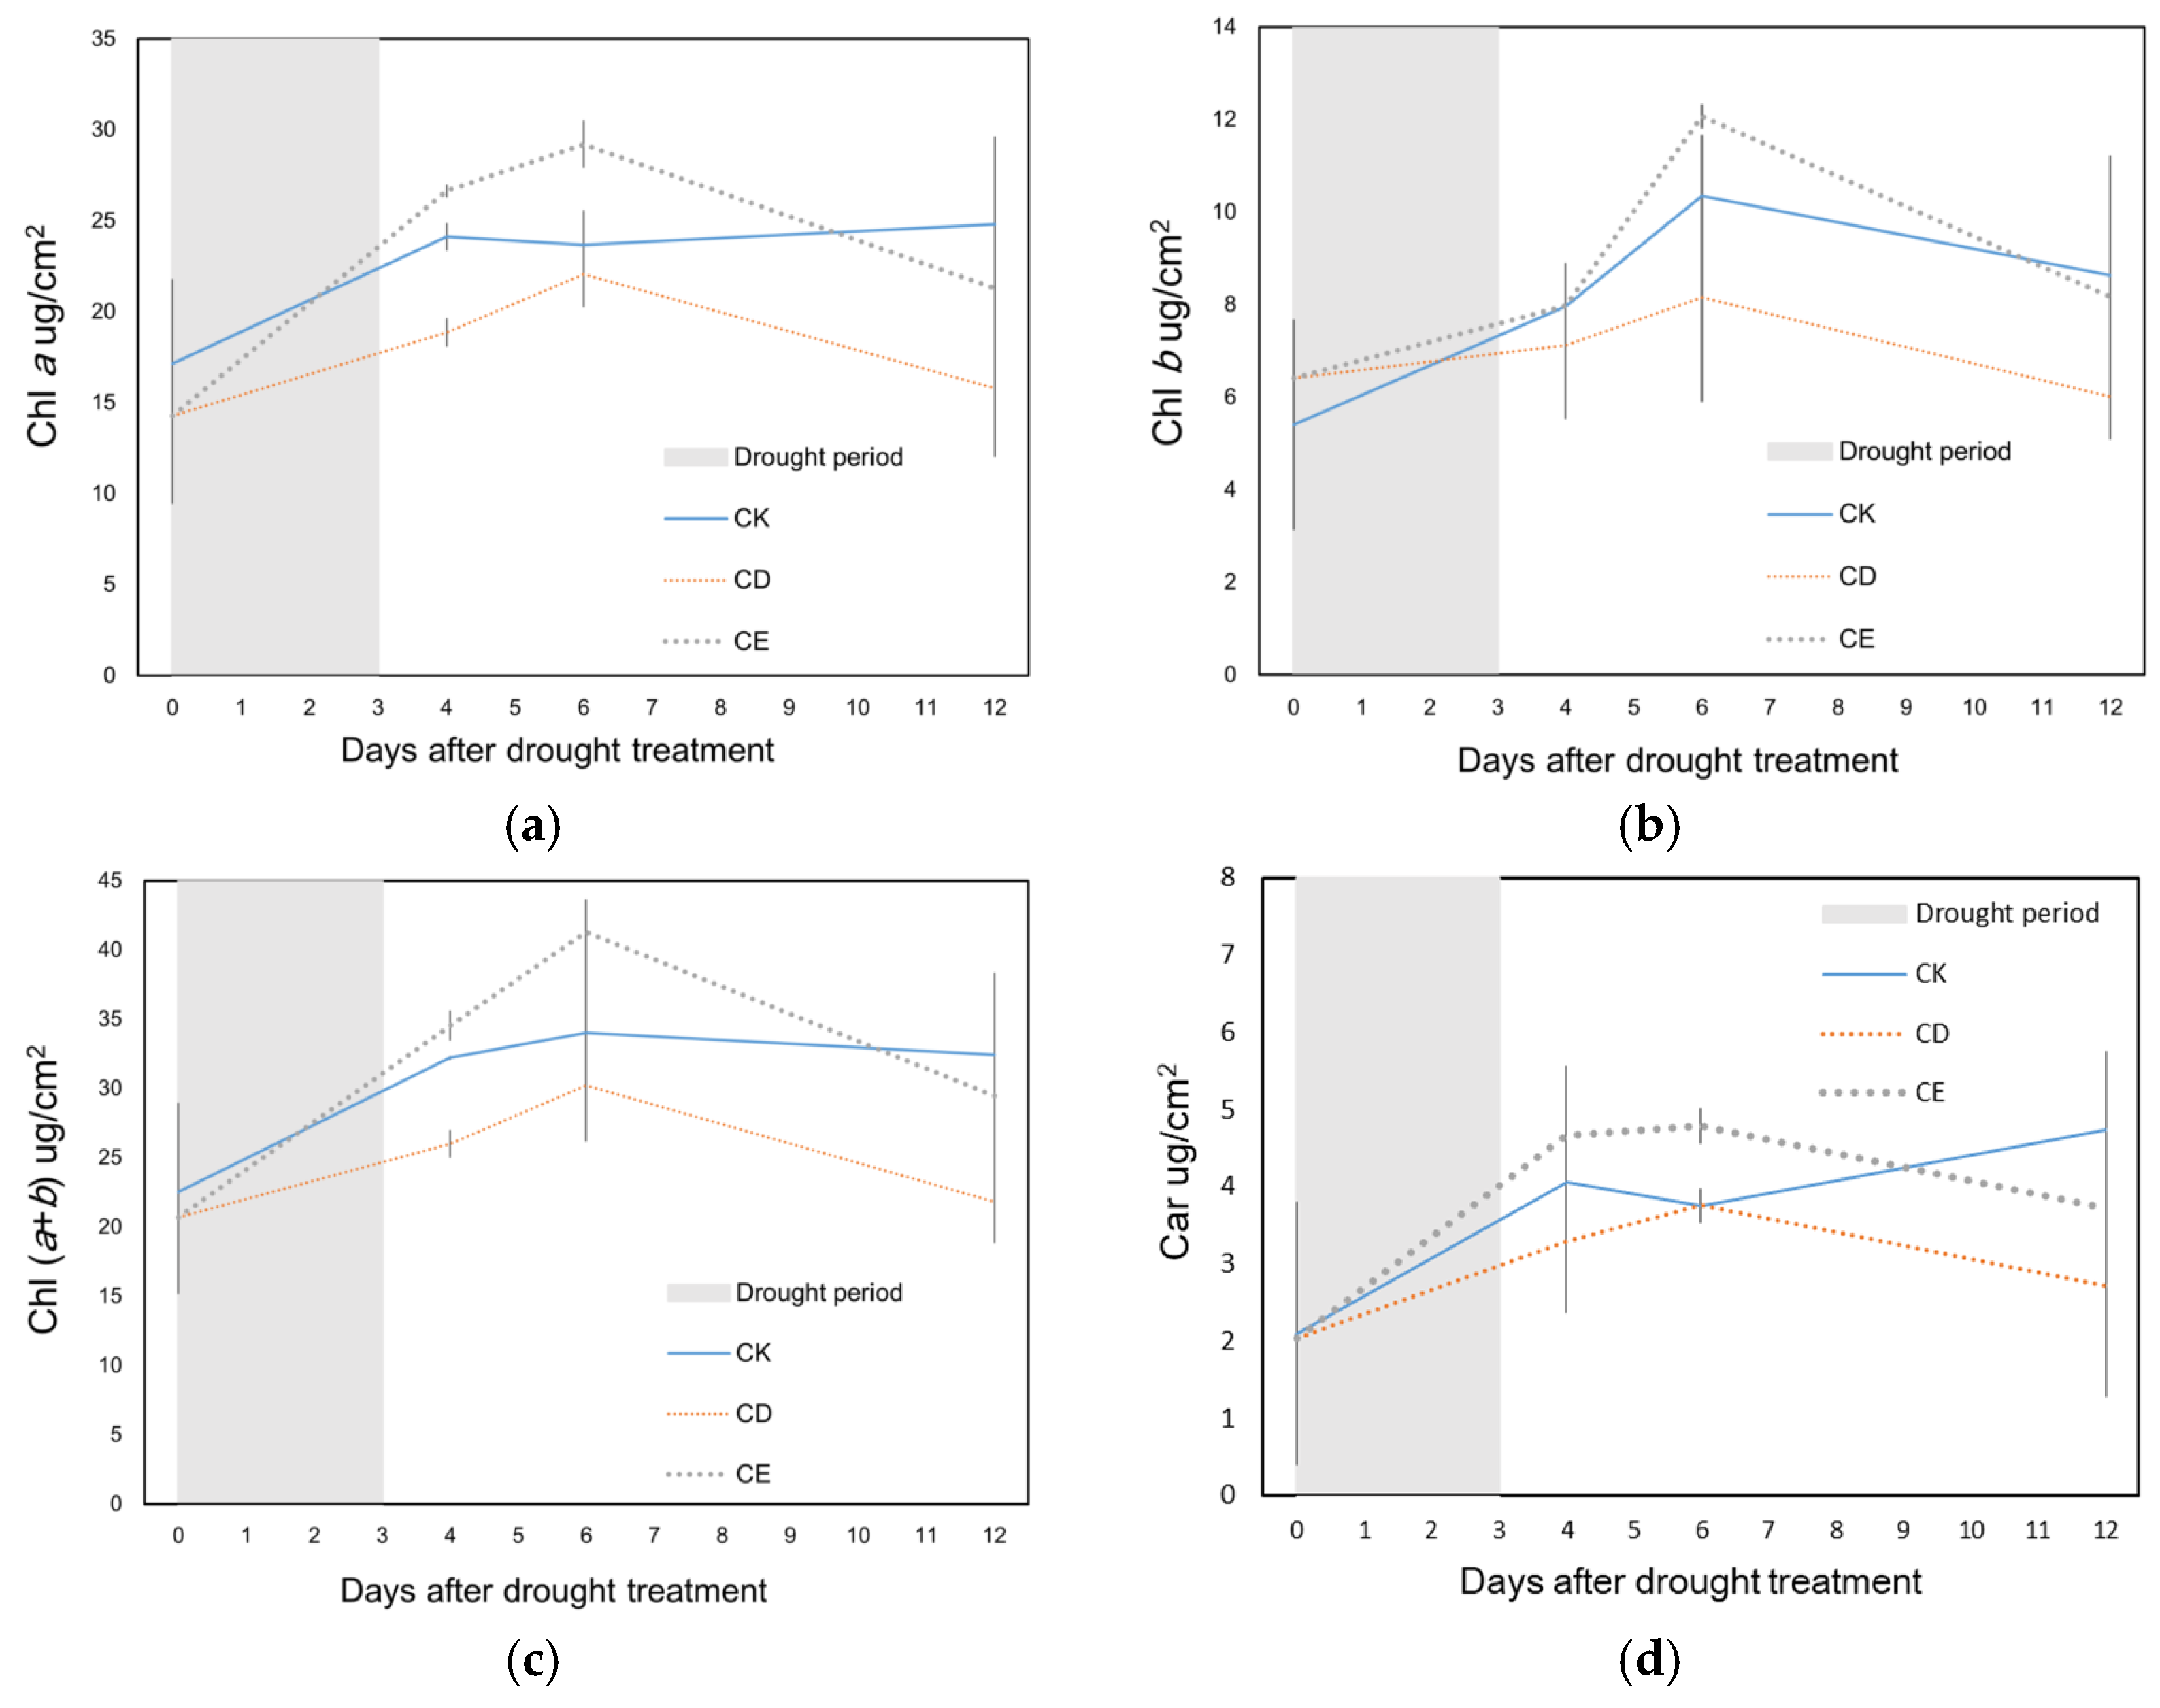
To evaluate the impact of drought and rewatering on the photosynthetic apparatus, pigment contents and their ratios were quantified (Figure 3). Throughout the observation period, drought treatment (CD) exerted a continuous inhibitory effect on pigment accumulation. On t = 4, 6, and 12, the chlorophyll a (Chl a) content in the CD group was 21.8%, 6.7%, and 36.4% lower than that of the control (CK), respectively, with all pigment indices remaining at lower levels at each sampling point.
Rewatering treatment (CE) induced a significant over-compensatory recovery in pigment levels. On t = 4 (the first day of rewatering), the Chl a content in the CE group (26.65 μg/cm2) recovered rapidly and was significantly higher than that of the CK by 10.5% (Figure 3a). As rewatering progressed, by t = 6 (3 d post-rewatering), all indices in the CE group reached their peaks during the observation period, with Chl a content (29.21 μg/cm2) exceeding the CK by 23.5%. By t = 12, pigment contents in all treatments exhibited a decline.
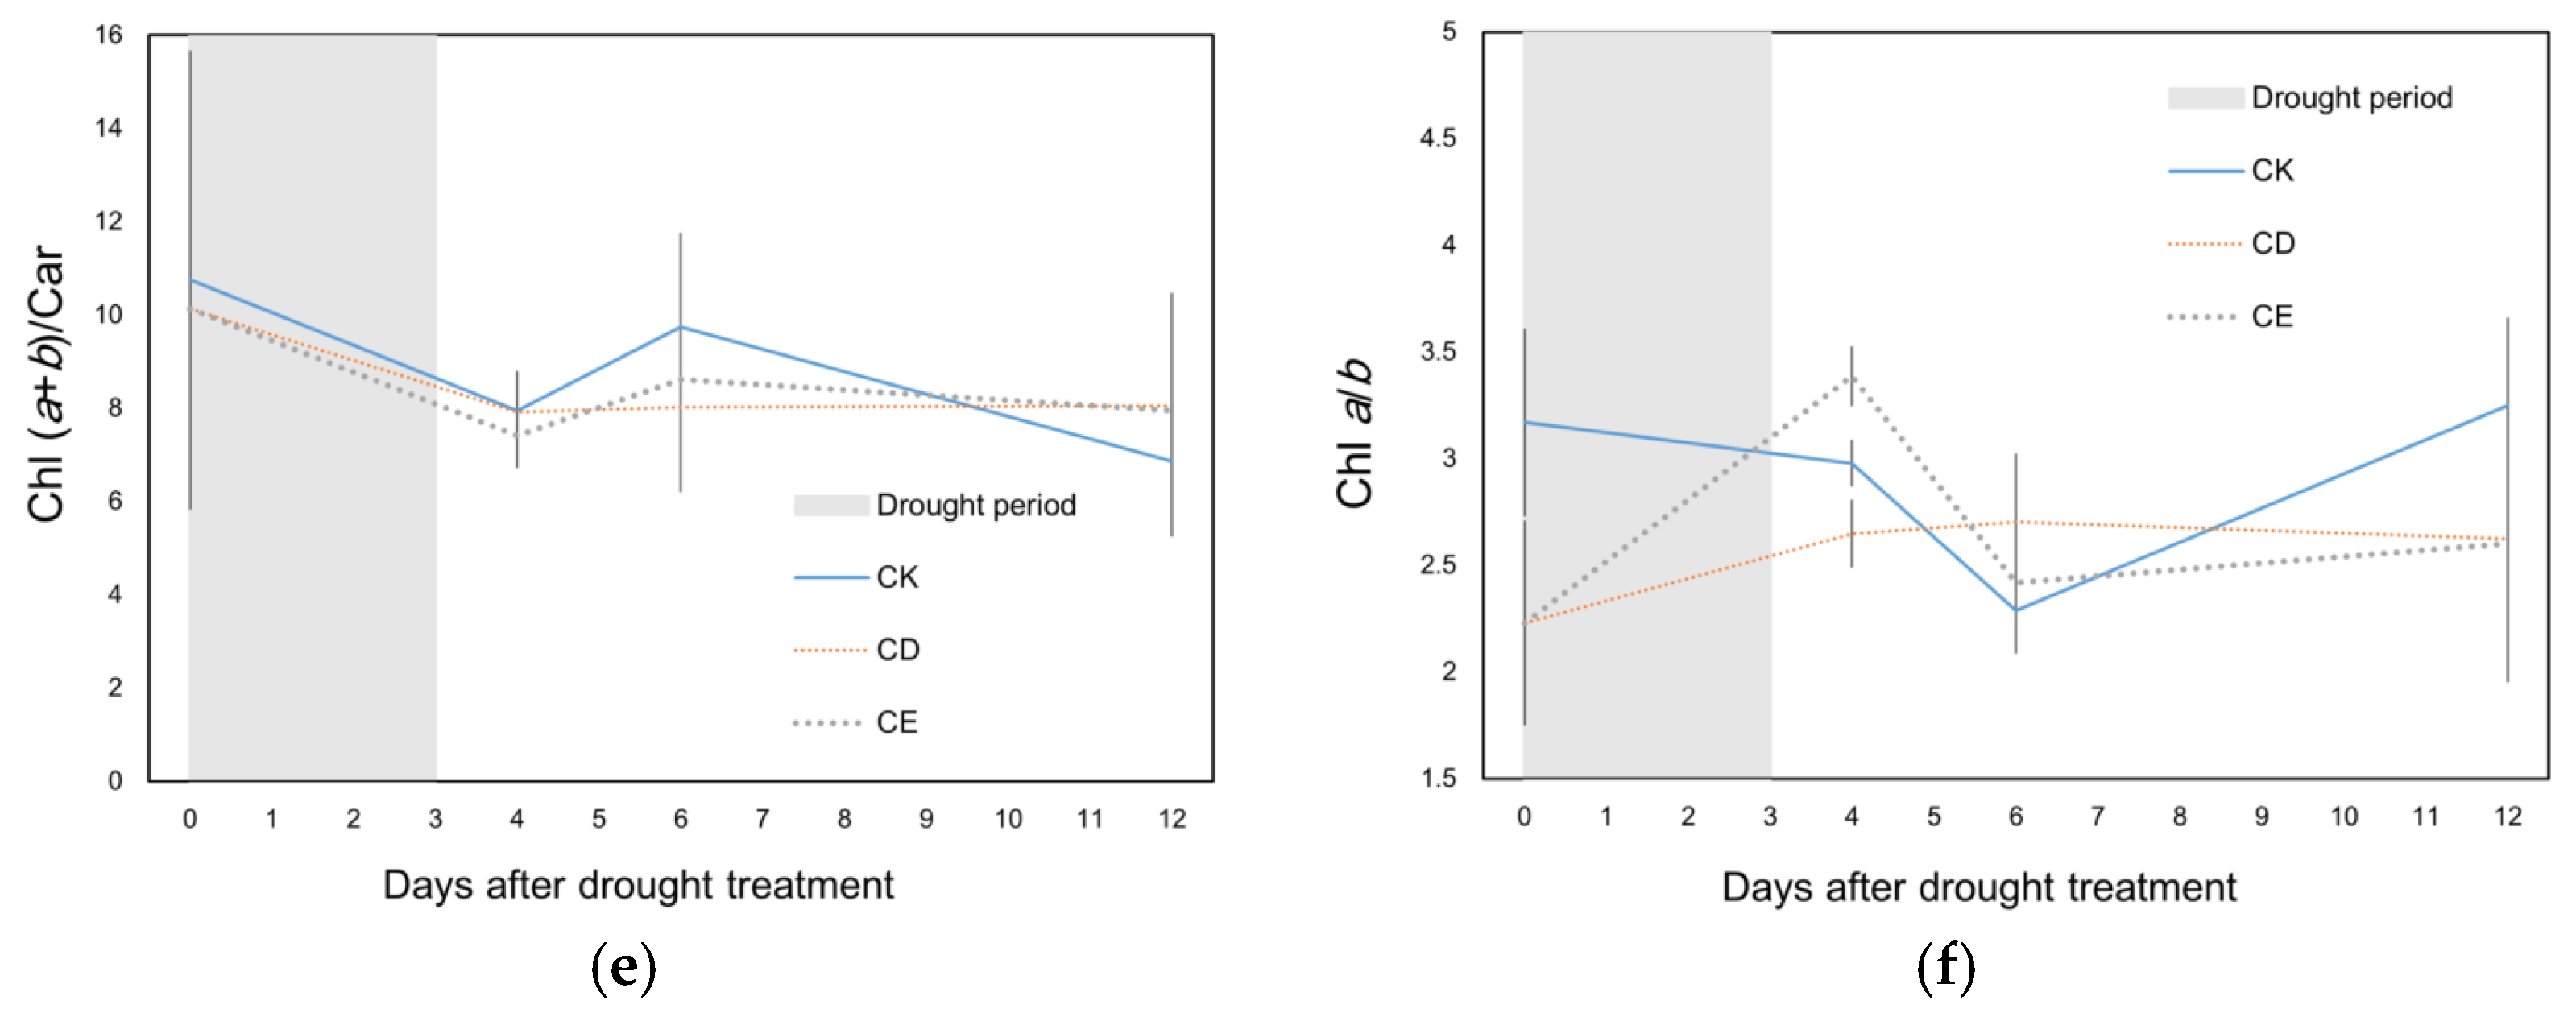
The Chl a/b ratio (Figure 3f) displayed distinct inter-group variations (p < 0.05). At the initial stage (t = 0), the ratio in the CD/CE group (2.23) was significantly lower than that in the CK (3.08). On t = 4 (the first day of rewatering), the CE group reached the significantly highest ratio (3.39), which was markedly higher than both the CK and CD groups. Notably, on t = 6, the CD group exhibited a significantly higher ratio (2.70) compared to the CK (2.01), primarily due to the more pronounced degradation of Chl b (8.16 μg/cm2) under sustained stress. By the end of the observation (t = 12), the ratio in the CK group (3.25) was again significantly higher than those in the CE and CD groups.

3.3. Metabolomics Analysis Under Different Water Treatments

To reveal the metabolic regulatory mechanisms in rice leaves under different water regimes, untargeted metabolomics profiling was conducted on plants from CK, CD, and CE groups. A total of 1247 metabolites were identified in both positive and negative ion modes, encompassing amino acids, organic acids, sugars, lipids, and secondary metabolites. The normalized metabolite abundance data were subjected to multivariate statistical analyses to assess overall metabolic shifts among treatments.
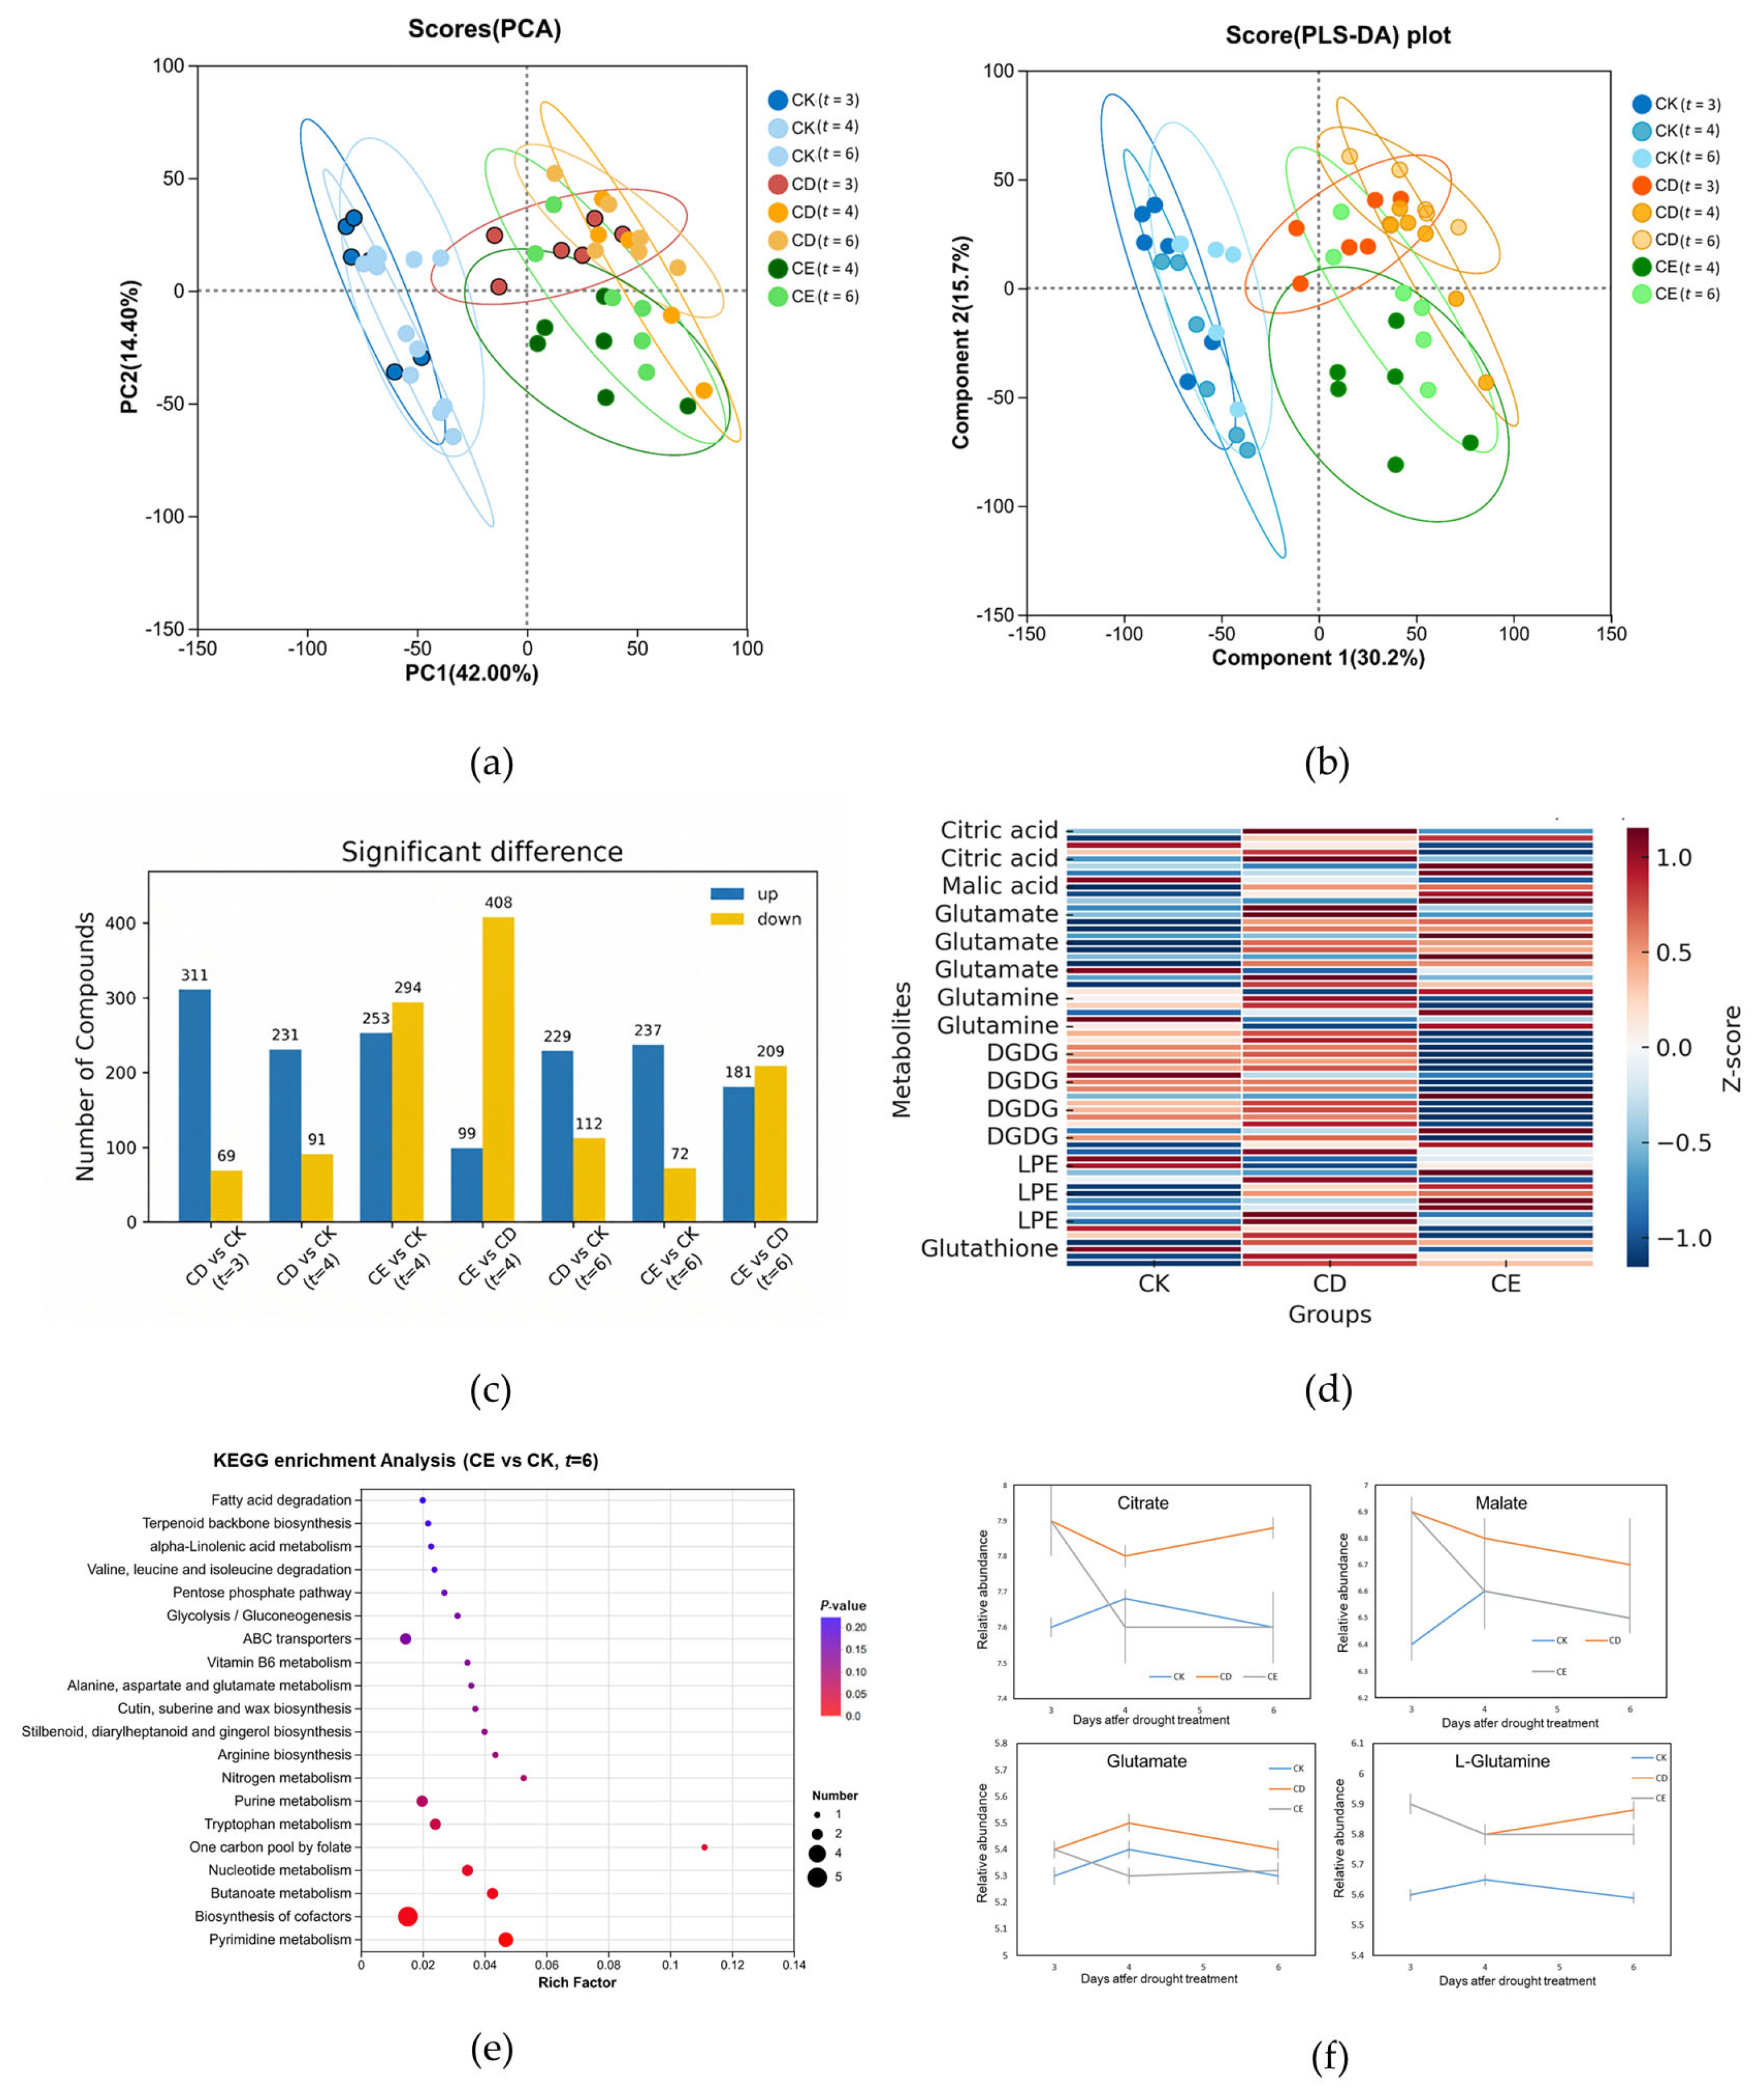
To evaluate metabolic alterations under varying water regimes, untargeted metabolomic profiling was performed. Unsupervised principal component analysis (PCA) revealed distinct separation among treatments (Figure 4a), with the first two components explaining 42.00% and 14.40% of the total variance, respectively. Notably, CD samples at all-time points (t = 3, 4, 6) exhibited a consistent and significant separation from the CK group along the PC1 axis, reflecting the profound and sustained impact of continuous drought on the overall metabolic profile. At Day 3 (t = 3, prior to rehydration), the CD group characterized the common metabolic state of all stressed plants following the initial drought period, serving as the pre-recovery reference baseline for the CE group. Following the initiation of rewatering, the CE samples (at t = 4 and 6) shifted into unique metabolic spaces. These samples did not return to the CK clustering area but instead followed a distinct trajectory toward a new metabolic equilibrium, indicating the occurrence of complex metabolic reprogramming during the recovery process. This separation was further validated by supervised partial least squares discriminant analysis (PLS-DA), where Component 1 (30.2%) primarily drove the discrimination among groups (Figure 4b). The distinct spatial positioning of CE samples relative to both the CK and CD groups confirms that metabolic recovery involves an active reprogramming mechanism rather than a passive restoration to the pre-stress state.
The number of differentially accumulated metabolites (DAMs) varied across comparisons (Figure 4c). At Day 3 (t = 3, prior to rewatering), the CD group, which also represented the drought-stressed state of the CE group at this time point, exhibited 311 upregulated and 69 downregulated metabolites relative to the CK group (CD vs. CK at t = 3). This suggests that drought stress induced a substantial global shift in the metabolic profile, characterized primarily by metabolite accumulation. By Day 4 (t = 4, 1 day post-rewatering), the CE group exhibited 99 upregulated and 408 downregulated DAMs compared with the continuously stressed CD treatment (CE vs. CD at t = 4). This indicates a rapid metabolic transition induced by rehydration, dominated by a large-scale downregulation of metabolites. Notably, this metabolic shift was temporally synchronized with the peak Pn values and the initial rebound of chlorophyll a and b contents observed in the CE group (Figure 2a and Figure 3a,b). By the late recovery stage (t = 6), the CE group still exhibited 237 upregulated and 72 downregulated DAMs compared with the CK group (CE vs. CK at t = 6). This pattern indicates that the metabolic profile had not yet fully reverted to the control state, instead manifesting sustained metabolic adjustments. Concurrently, chlorophyll contents recovered to high levels, suggesting that metabolic shifts and the restoration of the photosynthetic system are characterized by coordinated evolutionary features across the time series (Figure 3a,b). Heatmap analysis of differentially accumulated metabolites (DAMs) revealed distinct metabolic signatures among treatments (Figure 4d). The CE group clustered separately from both the CK and CD groups, indicating that rewatering induced a unique metabolic profile distinct from both control and drought conditions).
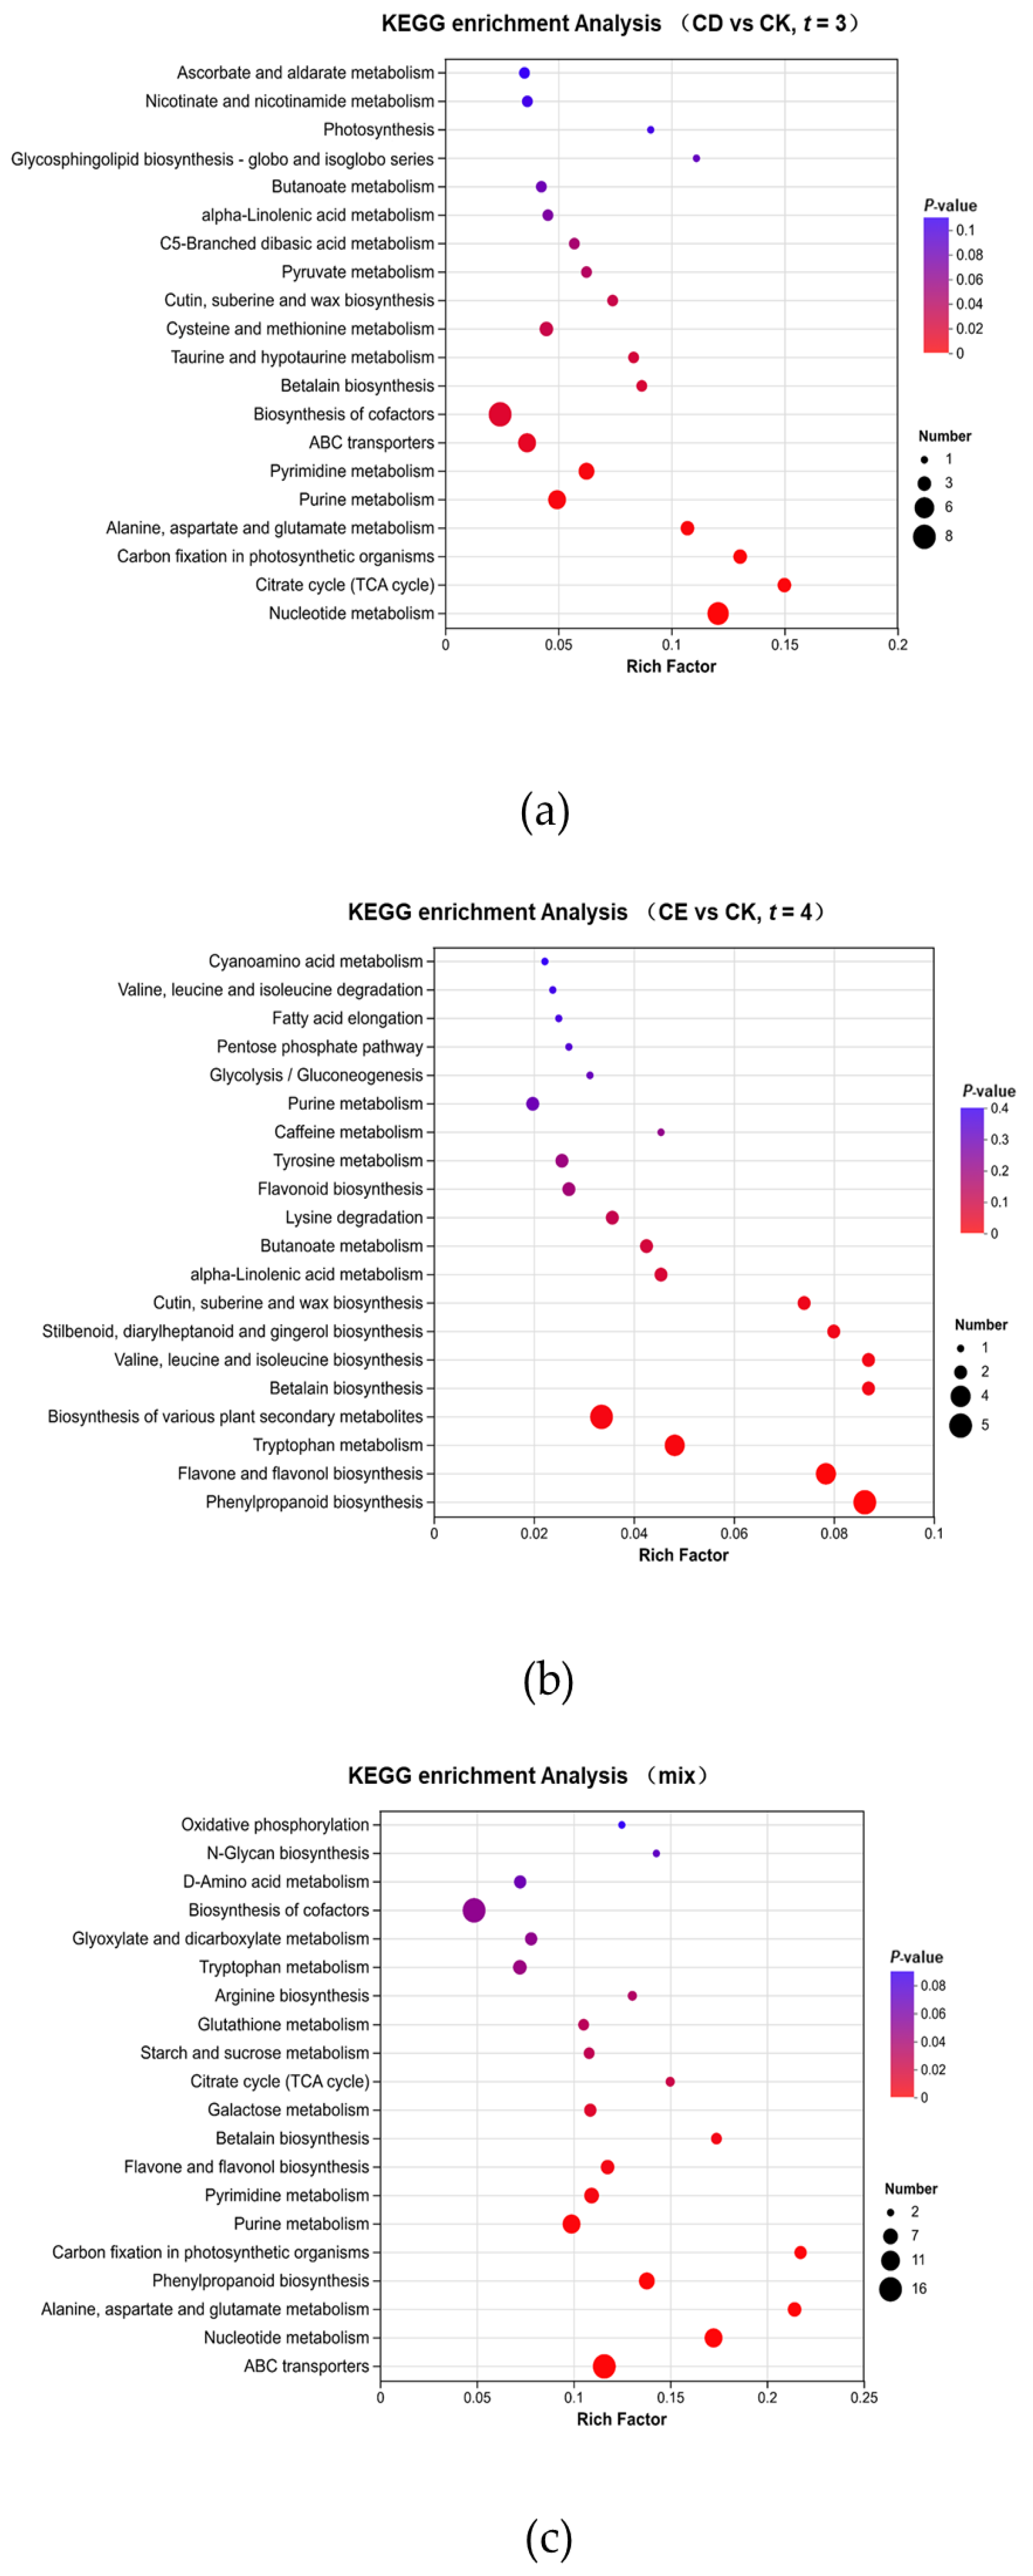
KEGG pathway enrichment analysis revealed the molecular trajectory of rice plants evolving from drought to rewatering recovery. Before rewatering (t = 3) metabolic disturbances were primarily reflected in the impairment of primary metabolic pathways, such as the Citrate cycle (TCA cycle) and Carbon fixation in photosynthetic organisms (Figure A1a in Appendix A). During the early stage of rewatering (t = 4), the plants did not immediately return to a normal state but instead rapidly activated defensive secondary metabolism centered on phenylpropanoid and flavonoid biosynthesis (Figure A1b in Appendix A). The comprehensive analysis of all stages (Mix) further highlighted the high-flux transport requirements maintained by ABC transporters throughout the process (Figure A1c in Appendix A). By the late recovery stage (t = 6), the metabolic function of the CE group shifted toward growth reconstruction (Figure 4e). The TCA cycle, Carbon fixation in photosynthetic organisms, and Porphyrin and chlorophyll metabolism were significantly enriched in this stage. The activation of these energy metabolism hubs and photosynthetic precursor synthesis pathways provided core molecular support for the rebound of chlorophyll content and the full recovery of Pn after rewatering.
Notably, although the TCA cycle exhibited extremely high enrichment significance at t = 6 (Figure 4e), the relative abundances of its key substrates, such as citrate and malate, declined rapidly in the CE group after rewatering and remained consistently lower than those in the drought group (CD) (Figure 4f). Under drought stress, organic acids accumulated for stress resistance, whereas after rewatering, these organic acids were consumed to drive the efficient repair of physiological functions (Figure 4f). The enrichment of alanine, aspartate, and glutamate metabolism indicated active carbon–nitrogen coordination (Figure 4e, Figure A1c in Appendix A). Following rewatering, glutamate—acting as a central hub of nitrogen metabolism—showed a rapid decline to levels below the control (Figure 4f), suggesting its intensive conversion into proteins required for repair. Concurrently, L-glutamine remained at a high level (Figure 4f), serving as a stable nitrogen reservoir to provide the material foundation for sustained growth after rehydration.

3.4. Transcriptomic Analysis Under Different Water Treatments

To elucidate the global transcriptional regulation underlying drought stress and subsequent rehydration in rice leaves, RNA-sequencing (RNA-Seq) was performed on samples from CK, CD, and CE rice plants at t = 6. Each treatment included six biological replicates, yielding 48 samples and 310.76 Gb of clean data. Each sample generated over 5.89 Gb of high-quality reads, with >95.57% Q30 bases and alignment rates of 93.8–98.3% to the reference genome, ensuring high sequencing reliability. In total, 37,020 genes were detected, including 34,702 annotated and 2318 novel genes, corresponding to 69,754 transcripts (40,959 known and 28,795 newly identified).
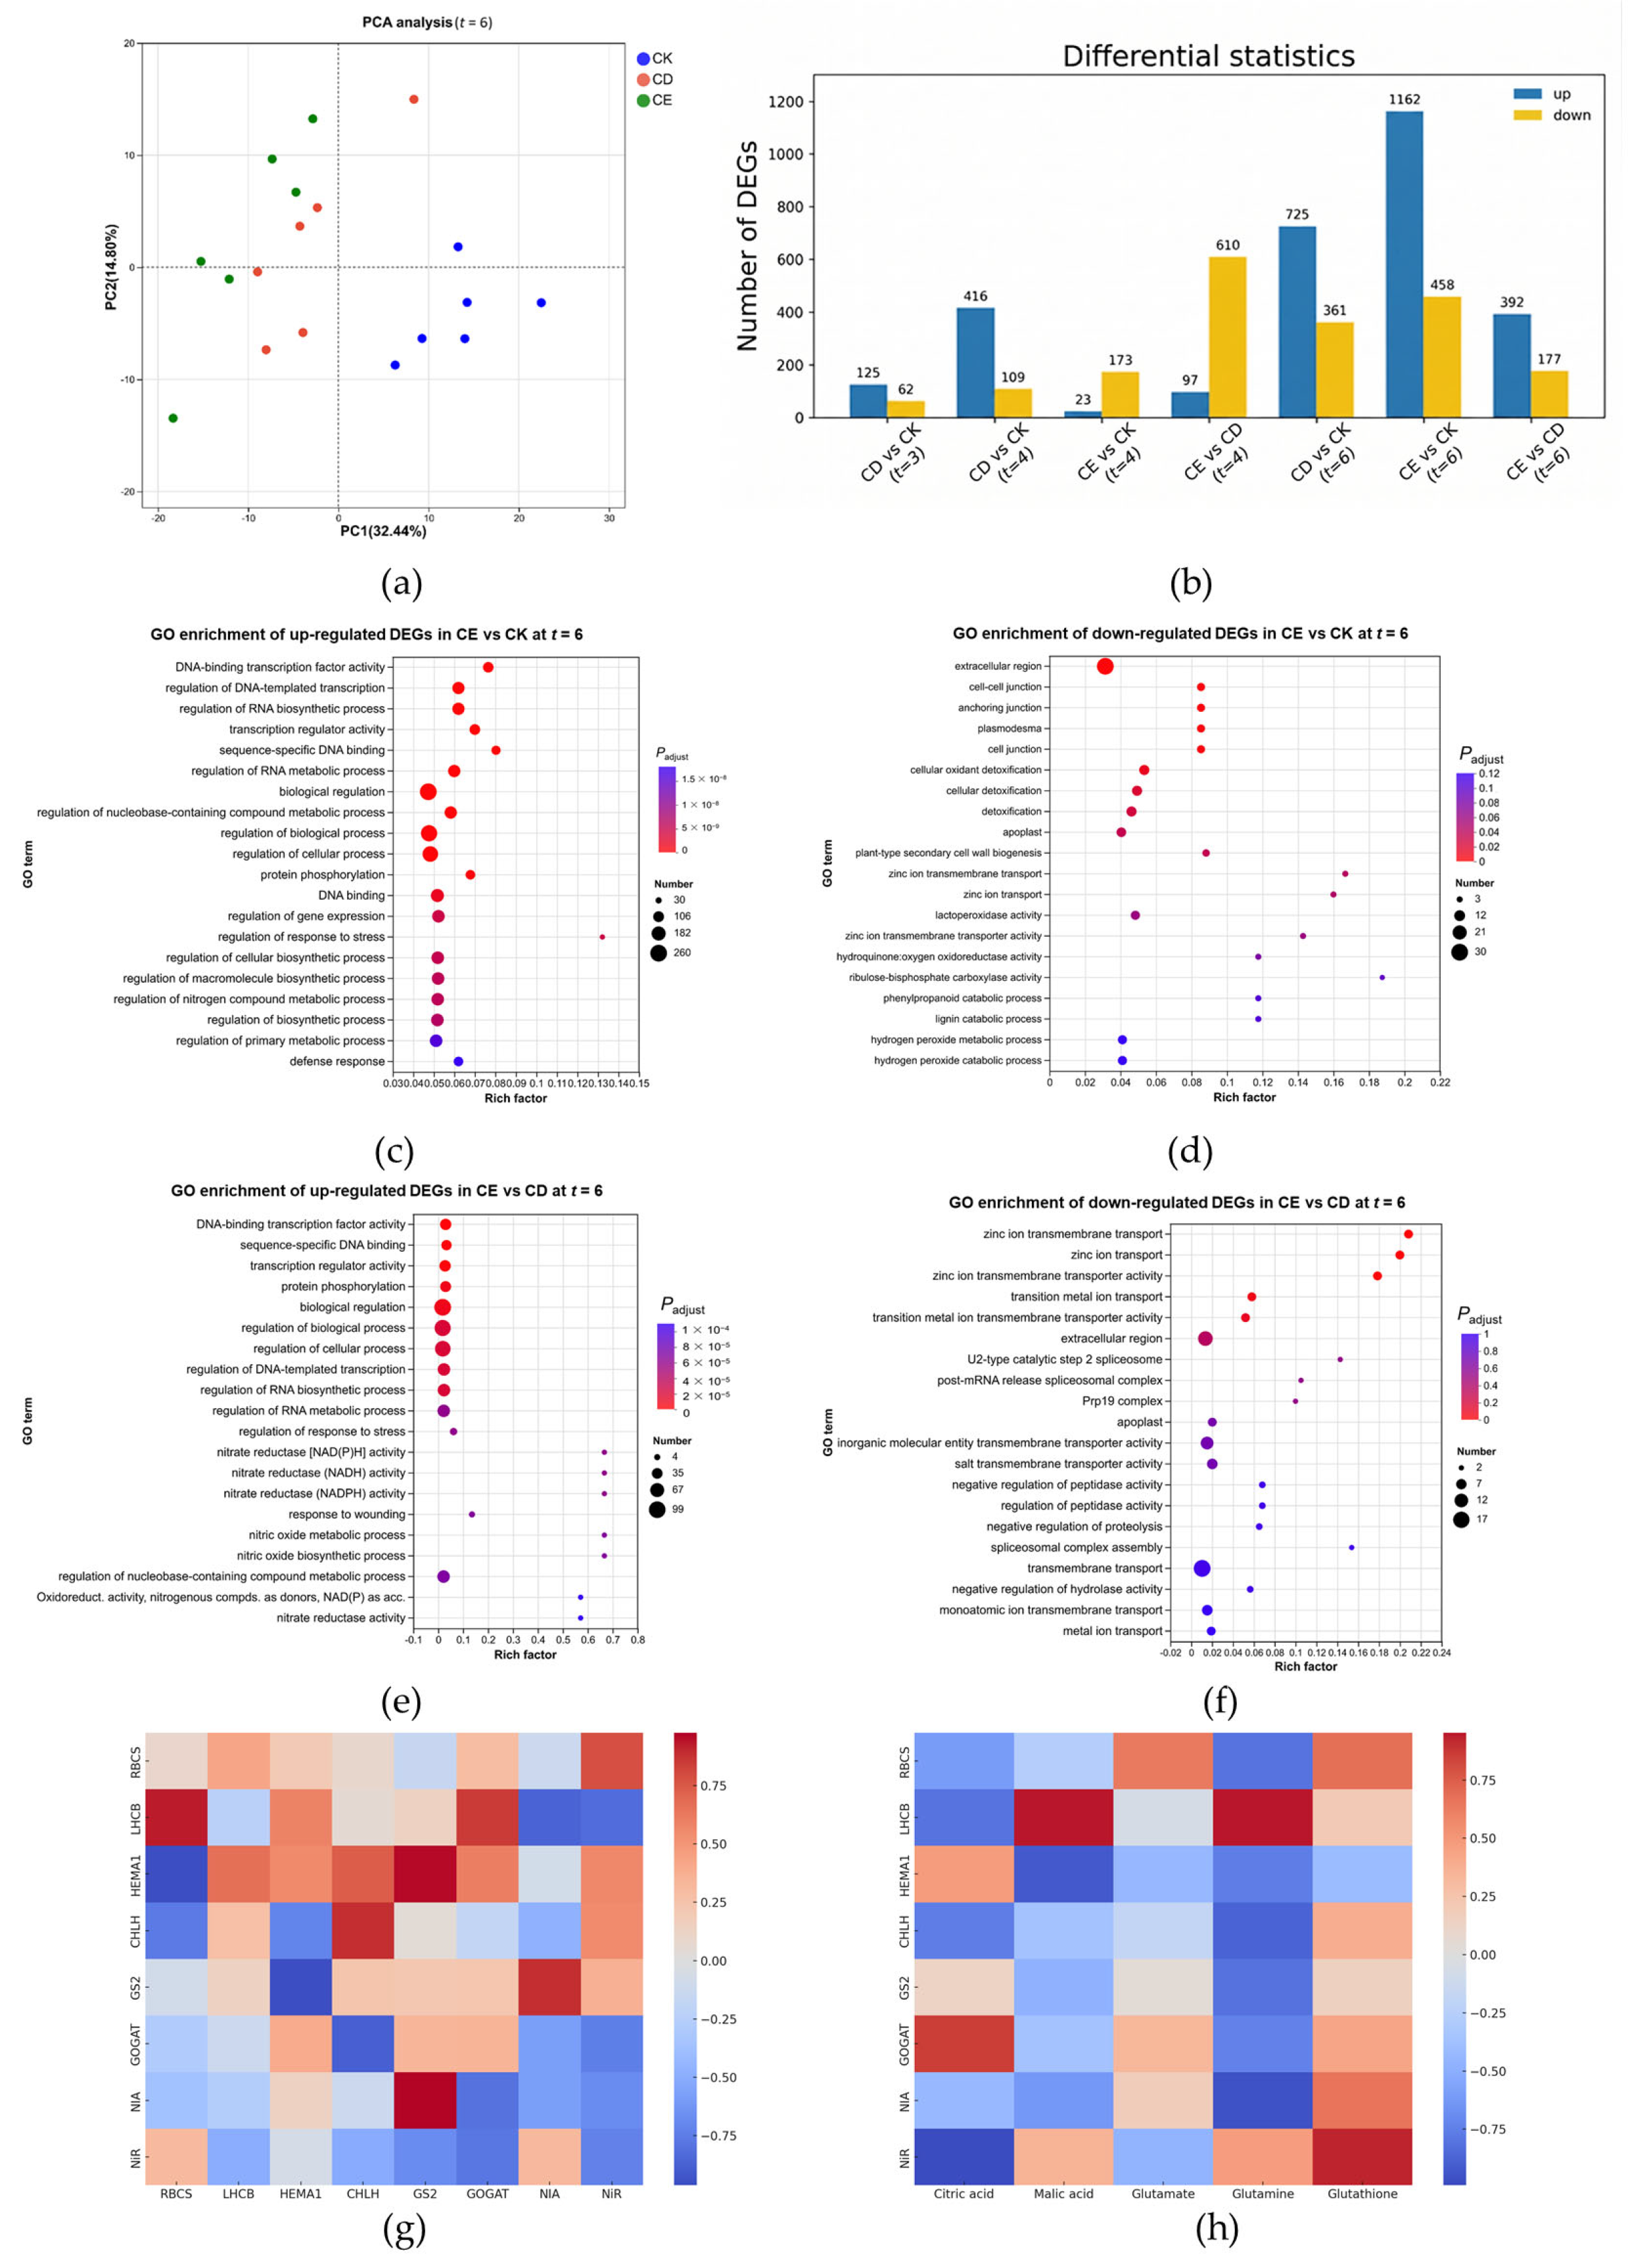
PCA at the late recovery stage (t = 6) in Figure 5a showed that the first two principal components explained 32.44% and 14.80% of the total variance, respectively, with a prominent separation observed along the PC1 axis between the well-watered control (CK) and the drought and rewatering treatments (CD and CE). Although the CD and CE samples occupied the same hemisphere of the PC1 axis, they remained distinctly partitioned in the two-dimensional space, indicating that by the late recovery stage, CE plants established a unique transcriptional signature rather than simply reverting to the control state or remaining in a stress state.
The spatial divergence was further corroborated by the quantitative evolution of differentially expressed genes (DEGs), which showed a dramatic shift from drought stage (t = 3) to the late recovery stage (t = 6) (Figure 5b). Specifically, at drought stage (t = 3), the CD vs. CK comparison showed 187 DEGs (125 up-regulated, 62 down-regulated), reflecting the baseline molecular impact of water deficit. After rehydration (t = 4), CE vs. CK showed only 196 DEGs with a limited number of up-regulated genes (23), a significant majority (173) were down-regulated. This shift is further highlighted by the CE vs. CD comparison at t = 4, which exhibited 707 DEGs, primarily characterized by the massive down-regulation (610 genes) of stress-related genes. By the late recovery stage (t = 6), the number of DEGs in the CE vs. CK comparison soared to 1620 (1162 up-regulated, 458 down-regulated), representing an 8.2-fold increase compared to t = 4 and demonstrating that the full manifestation of transcriptomic reprogramming reaches its peak intensity during the late recovery phase.
GO enrichment analysis revealed the functional basis of this massive transcriptional burst at t = 6 (Figure 5c–f). Among the 1162 up-regulated DEGs in CE vs. CK (Figure 5c), the most statistically significant terms were centered on core genetic control, including DNA-binding transcription factor activity, regulation of RNA biosynthetic process, and sequence-specific DNA binding. The term regulation of response to stress exhibited the highest Rich Factor (approximately 0.13), indicating a high proportion of stress-responsive genes were specifically mobilized during this late stage. Furthermore, broad categories such as biological regulation, regulation of biological process, and cellular process involved the largest number of genes (exceeding 260 genes each), reflecting a global and systemic restructuring of cellular activity. Conversely, the 458 down-regulated DEGs in CE vs. CK at t = 6 reflected a significant recalibration of cellular structures and metabolic efficiency (Figure 5d). The extracellular region emerged as the most dominant down-regulated category, characterized by the highest gene count and most significant p-adjust value. Significant down-regulation was also observed in structural communication components, including cell–cell junction, anchoring junction, and plasmodesma, all of which exhibited high statistical significance (deep red color). Interestingly, while these structural terms were highly significant, the highest Rich Factor among down-regulated genes was observed for ribulose-bisphosphate carboxylase activity, suggesting a highly specific and proportional reduction in certain Calvin cycle components compared to the control at this late stage.
The comparison between rewatered plants (CE) and continuously stressed plants (CD) at t = 6 (Figure 5e,f) highlighted the specific molecular shifts induced by water relief. Among the 392 up-regulated DEGs in CE vs. CD (Figure 5b), there was a robust and exceptional surge in nutrient assimilation. The most prominent discovery was the enrichment of nitrate reductase activity (including NAD(P)H, NADH, and NADPH-dependent forms), which achieved the highest Rich factors (exceeding 0.6) and high statistical significance (Figure 5e). This was closely coupled with the enrichment of the nitric oxide biosynthetic process and oxidoreductase activity, suggesting that rewatering triggers a potent activation of nitrogen uptake and signaling mechanisms to drive growth. The 177 down-regulated DEGs in CE vs. CD at t = 6 represented the suppression of drought-adaptive structural and transport mechanisms (Figure 5b,f). The most striking finding was the massive down-regulation of ion transport, with zinc ion transmembrane transport, zinc ion transport, and transition metal ion transport exhibiting the highest Rich factors (0.18–0.21) and highest significance. This shift indicates that rewatering leads to a strategic reduction in metal ion transport and structural stress-adaptation programs that were necessary during the persistent drought in the CD group.
To further elucidate the molecular organizational logic underlying the physiological over-recovery observed in rewatered plants, we performed a targeted correlation analysis of representative genes and metabolites specifically within the CE treatment group at the late recovery stage (t = 6). Co-expression analysis (Figure 5g) revealed positive correlations among core nitrogen assimilation genes, including NIA, NiR, and GOGAT, indicating that rewatering activated a coordinated nitrogen assimilation process. Genes related to chlorophyll biosynthesis and photosystem components, such as RBCS, exhibited parallel expression trends, providing a molecular basis for the rapid pigment accumulation following drought release. The gene–metabolite correlation heatmap at t = 6 in the CE group (Figure 5h) indicated that transcriptional activation directly drove the restoration of key metabolic pools. GOGAT expression was strongly correlated with citrate, and NiR tightly coupled with glutathione, linking nitrogen assimilation to carbon supply and redox buffering. LHCB showed a negative correlation with glutamine. These CE-internal correlations suggest that post-rewatering over-compensation is not a simple recovery of individual components, but is orchestrated by a nitrogen-centered, coordinated regulatory network.

3.5. Integrated Correlation Analysis

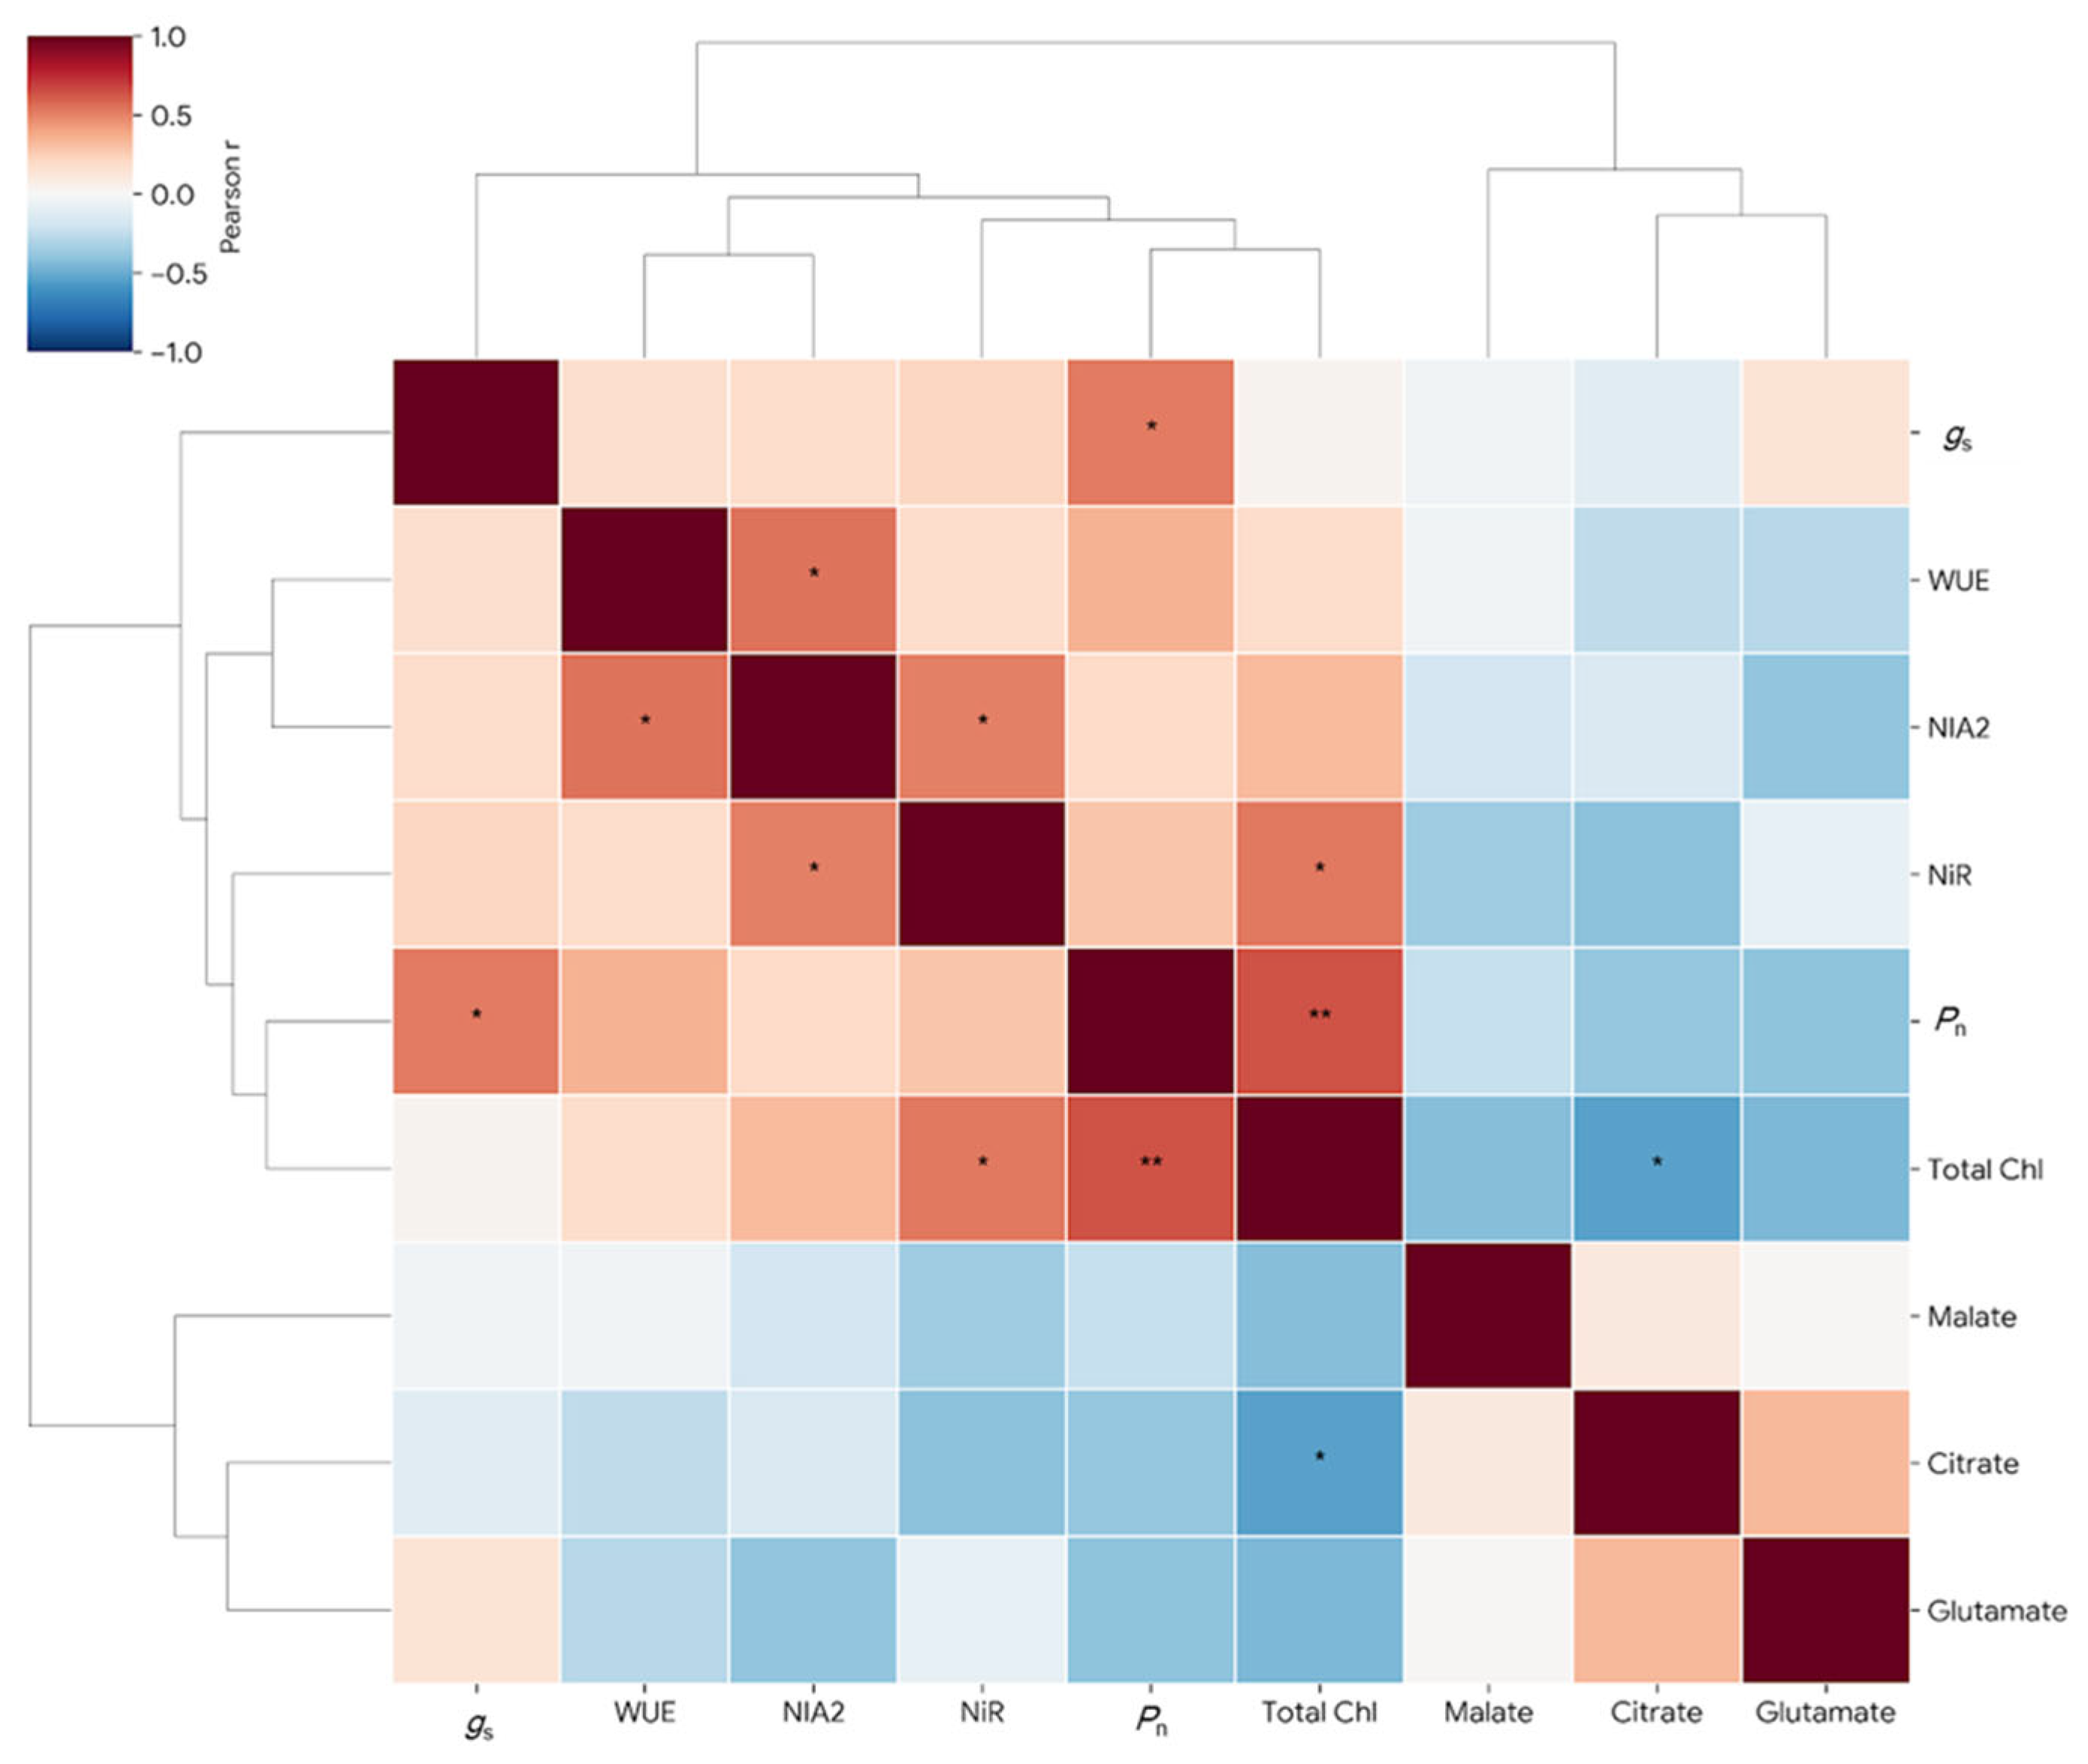
To systematically elucidate the regulatory network underlying the photosynthetic compensation effect during the drought–rewatering cycle, a Pearson correlation analysis and hierarchical clustering were performed on key physiological, transcriptomic, and metabolic parameters (Figure 6). The analysis identified two distinct functional modules. Module I comprised Pn, total chlorophyll content, and key nitrogen-assimilation components (the transcript abundance of NiR and NIA2). Within this module, Pn was strongly and positively coupled with NiR (r = 0.48) and total chlorophyll (r = 0.65), suggesting a high degree of biological synchronization between nitrogen assimilation and photosynthetic recovery during the rewatering phase.
In contrast, Module II primarily included TCA cycle intermediates, specifically citrate and malate. Notably, these organic acids exhibited a robust negative correlation with the nitrogen-assimilation traits in Module I (e.g., NiR vs. citrate, r = −0.45; NiR vs. malate, r = −0.49). This inverse relationship highlights a significant metabolic trade-off, suggesting that organic acid pools were rapidly mobilized as carbon skeletons to prime the nitrogen assimilation pathway, thereby facilitating the rapid synthesis of amino acids and photosynthetic pigments upon rehydration. Importantly, while gs also showed a positive trend with Pn, its correlation coefficient was notably lower than that of the nitrogen-related indicators. This confirms that the overall magnitude of photosynthetic compensation is primarily governed by nitrogen-mediated metabolic reprogramming rather than stomatal dynamics.

4. Discussion

4.1. Photosynthetic Compensation and Improved WUE After Rehydration

Drought stress is widely recognized to suppress photosynthetic capacity in plants through three major mechanisms: stomatal closure, chlorophyll degradation, and structural and functional impairment of the photosynthetic apparatus [31]. Numerous studies have shown that drought reduces mesophyll conductance, Rubisco activity, thylakoid integrity, and electron transport efficiency, collectively contributing to reduced carbon assimilation [32,33]. Consistent with these reports, rice seedlings in our study exhibited a significant decline in Pn under drought stress (Figure 2a), reflecting the classic inhibition of photosynthetic activity observed across many crop species [34]. Notably, the synchronized transient decline in Pn, gs, and Tr across all treatments observed on t = 1 reflects a physiological adjustment or “handling effect” following the standardized refreshing of the nutrient medium at the end of t = 0. This procedure was performed for all groups, including the control, to ensure that subsequent physiological differences were driven solely by osmotic potential rather than variations in nutrient availability.
After rewatering, Pn in CE plants increased rapidly within 24 h and exceeded that of CK plants during early recovery phase (t = 4, 6, 7), indicating a transient photosynthetic compensation. Thereafter, Pn gradually returned to levels comparable to CK. These results suggest that rewatering not only restored pre-drought photosynthetic capacity but temporarily enhanced carbon assimilation. However, this enhancement was transient rather than sustained.
Importantly, the recovery of photosynthesis in CE plants was accompanied by a non-proportional adjustment of stomatal traits. Although Tr showed a transient increase following rewatering, gs did not remain higher than CK during recovery. This partial decoupling between Pn and stomatal parameters is further supported by our correlation analysis (Figure 6), which revealed that the correlation coefficient between Pn and gs (r = 0.52, p < 0.05) was notably lower than those of biochemical indicators. Nevertheless, CE plants maintained relatively higher WUE than CK across most of the recovery period, indicating that enhanced carbon assimilation was not associated with a proportional increase in water loss.
Following rewatering, CE plants exhibited higher Pn than CK while Ci returned to levels comparable to CK. The partial decoupling between Pn and stomatal parameters suggests that the transient enhancement of photosynthesis cannot be fully explained by stomatal conductance alone, but likely involves recovery of biochemical capacity within the photosynthetic apparatus. This pattern is consistent with a shift from stomatal limitation under drought to greater biochemical control during early recovery [17].
The dynamics of WUE further highlight differences in the coordination between carbon assimilation and water flux among treatments. Continuously drought-stressed plants (CD) exhibited the highest WUE throughout the experiment, but their Pn remained constrained, reflecting a conservative water-use strategy under low transpiration. In contrast, CE plants maintained relatively high WUE after rewatering while displaying enhanced Pn, with the overall ranking of treatments being CD > CE > CK. These results indicate that the transient photosynthetic compensation following rewatering was achieved without a proportional increase in water loss, suggesting a temporary coordination between enhanced carbon assimilation and moderate water flux.
Collectively, the drought–rewatering cycle altered not only stomatal behavior but also the regulation of photosynthetic assimilation capacity. The transient elevation of Pn and its partial decoupling from stomatal parameters during early recovery imply a rapid reorganization of biochemical processes within the photosynthetic apparatus [35]. This quantitative evidence from Figure 6 further confirms that nitrogen-mediated metabolic reprogramming, rather than mere stomatal reopening, is the primary driver of this compensatory effect.

4.2. Chlorophyll Dynamics and Their Role in Photosynthetic Recovery

Drought stress is commonly associated with reductions in chlorophyll content and destabilization of the photosynthetic apparatus, largely due to enhanced chlorophyll degradation, impaired chloroplast function, and increased oxidative pressure [36,37]. In our study, continuously drought-stressed plants (CD) maintained consistently lower levels of chlorophyll and carotenoids throughout the observation period (Figure 3a–d), indicating sustained suppression of the pigment system under water deficit. Notably, an increase in pigment content from t = 3 to t = 6 was observed across all treatments (Figure 3a–c). This common upward trend likely reflects ongoing developmental progression or environmental influences during the experimental period rather than drought-specific recovery.
Following rewatering, CE plants exhibited rapid and pronounced chlorophyll accumulation at t = 6 (Figure 3a–c). During this period, total chlorophyll in CE significantly exceeded both CK and CD, indicating effective structural restoration of the photosynthetic apparatus after drought release. The recovery was driven by a potent mobilization of nitrogen assimilation. Our transcriptomic data revealed a dramatic enrichment in nitrate reductase activity (Rich Factor > 0.6) and up-regulation of NIA and NiR genes in rewatered plants (Figure 5e–g). Notably, our quantitative regression analysis revealed that NiR transcript abundance explained 56.5% of the variation in total chlorophyll accumulation (R2 = 0.58, p < 0.05; Figure 6), confirming that the nitrogen-mediated pathway provided the essential biochemical foundation for rapid pigment reconstruction [38].
The temporal window of pigment enhancement closely overlapped with the phase of photosynthetic compensation (Figure 2a and Figure 3a–c). The hierarchical clustering in Figure 6 placed total chlorophyll, Pn, and NiR into a single co-responsive module (Module I), emphasizing their biological synchronization. Correlation analysis showed that nitrogen assimilation was tightly coupled with carbon metabolism; specifically, the negative correlation between NiR and citrate (Figure 6) suggests that the TCA cycle provided necessary carbon skeletons for amino acid and pigment biosynthesis. This suggests that the TCA cycle provided necessary carbon skeletons, while the restored antioxidant pool (Glutathione) created a protected environment for nascent chlorophyll molecules [39].
The dynamics of carotenoids and pigment ratios provide critical insights into the photoprotective strategies employed during recovery. After rewatering, carotenoids in CE plants reached a plateau after an initial rapid increase (Figure 3d). This limited amplitude suggests a physiological down-regulation of photoprotective investment as photosynthetic function stabilized and oxidative pressure diminished [40]. This transition is corroborated by the transcriptomic down-regulation of cellular oxidant detoxification and hydrogen peroxide metabolic processes at t = 6 (Figure 5e), indicating that the relief of drought stress reduced the requirement for sustained high-level antioxidant defenses.
Overall, rewatering induced coordinated restoration of pigment accumulation and photosynthetic performance, highlighting the importance of structural recovery of the light-harvesting system in facilitating post-drought functional reactivation [41]. Further analysis at the metabolic and regulatory levels is required to elucidate the mechanisms underlying this coordinated response.
The stability of the Chl a/b ratio (Figure 3f) further demonstrates that the stoichiometry between photosystem core complexes and light-harvesting antennas remained robust. The recovery in CE plants was primarily driven by the expansion of the overall pigment pool size rather than a radical structural reorganization of the photosystems.

4.3. Metabolic and Transcriptional Reprogramming Supports Photosynthetic Compensation

Multivariate analyses (Figure 4a,b,e) revealed that drought and subsequent rewatering were accompanied by a pronounced restructuring of the leaf metabolome, rather than simple quantitative shifts in metabolite abundance. The establishment of a distinct metabolic state in CE, separated from both CK and CD, indicates that recovery involves active reprogramming rather than passive restoration to pre-stress conditions. This reconfiguration is particularly evident during early rehydration, when the magnitude and direction of DAM changes suggest an intensive redistribution of metabolic resources (Figure 4c).
Under continuous drought, the accumulation of organic acids such as citrate and malate, together with elevated levels of nitrogen-containing metabolites including glutamate and glutamine, reflects an altered carbon–nitrogen balance under stress (Figure 4f) [27]. In contrast, rewatering triggered a rapid depletion of these previously accumulated pools, especially evident at t = 4. Our integrated analysis (Figure 6) confirmed this metabolic transition, identifying a distinct co-responsive module (Module II) for these organic acids that is negatively correlated with nitrogen assimilation indicators. The predominance of down-regulated metabolites in CE relative to CD suggests accelerated consumption or redistribution. This early metabolic shift highlights a significant “metabolic trade-off”, wherein TCA cycle intermediates are rapidly mobilized as carbon skeletons to support the surge in nitrogen metabolism and photosynthetic repair.
The synchronized up-regulation of NIA and NiR (Figure 5g) at t = 6 suggests sustained activation of nitrate reduction, thereby supporting downstream glutamate production through nitrogen assimilation pathways. Glutamate is the primary substrate for 5-aminolevulinic acid synthesis and thus serves as a key entry point into tetrapyrrole biosynthesis, the shared metabolic pathway leading to chlorophyll production [38]. This transcriptomic-metabolic coupling suggests that the chlorophyll over-recovery is not a transient spike but a sustained structural restoration [22,42]. Furthermore, the negative correlation between NiR and citrate (Figure 6) supports a tight carbon–nitrogen coupling mechanism. This suggests that TCA cycle-derived carbon skeletons may sustain amino acid synthesis and the rebuilding of the photosynthetic apparatus, including Rubisco-associated functions [43,44].
Interestingly, despite the massive accumulation of chlorophyll in CE plants, the Chl/Car ratio remained comparable across all treatments (Figure 3f). This maintenance of pigment stoichiometry suggests a highly coordinated synchronization between light-harvesting components and photoprotective pigments [45]. The significant negative correlation observed between LHCB expression and glutamine levels within the CE group (Figure 5h) suggests a potential metabolic feedback link between nitrogen status and the transcriptional regulation of the light-harvesting system. Growing evidence indicates that glutamine serves not only as a primary nitrogen storage molecule but also as a critical signaling messenger modulating plant gene expression. In rice, glutamine can rapidly induce the expression of various transcription factors and responsive genes; meanwhile, in other plant species, elevated glutamine levels have been linked to the repression of photosynthesis-related genes, including members of the LHCA and LHCB families. Consequently, we speculate that as nitrogen reserves (glutamine) are replenished following rewatering, rice plants may fine-tune the transcription of light-harvesting genes through a metabolic–transcriptomic coupling mechanism, thereby facilitating functional recovery while maintaining the internal equilibrium of the photosystems [46,47].

4.4. Methodological Considerations and Limitations

While this study provides novel insights into the physiological and molecular mechanisms of rice recovery, certain methodological considerations regarding the experimental model should be acknowledged. In this study, we utilized a 10% (w/v) PEG-6000 hydroponic system to simulate osmotic stress. Based on the established model by Michel and Kaufmann (1973), the osmotic potential of this solution at 30 °C is approximately −0.15 to −0.18 MPa [48]. This intensity represents a moderate drought level for rice seedlings. Notably, this simulated potential is significantly more negative than the typical re-watering thresholds encountered in field-based AWD management, where soil matric potential often fluctuates between −0.02 to −0.06 MPa. This indicates that the osmotic challenge imposed in our laboratory setting was sufficiently robust to capture the core regulatory responses relevant to field conditions.
However, it is essential to distinguish between PEG-induced osmotic stress and actual soil desiccation. While PEG is an excellent tool for isolating the osmotic component of water deficit, it does not replicate the complex bio-mechanical stresses associated with drying soil. In field conditions, the receding water film increases soil matrix impedance and alters the physical tension between cell-wall cellulose microfibrils and the plasma membrane [49]. These mechanical forces can significantly impact root hair integrity and trigger distinct structural signaling pathways that are largely bypassed in a hydroponic medium. Therefore, while our results clarify the transcriptomic and metabolic reprogramming triggered specifically by osmotic signals, particularly the asynchronous recovery of photosynthesis and transpiration, future research incorporating field-based AWD cycles is necessary to validate these mechanisms within the broader soil–plant–atmosphere continuum.

5. Conclusions

In conclusion, our results confirm the hypothesis that post-drought photosynthetic compensation in rice is an active, nitrogen-mediated regulatory process rather than a passive consequence of stomatal reopening. The rapid rebound of net photosynthetic rate and the brief excessive compensation are consistent in time with the increase in chlorophyll accumulation, the dynamic redistribution of carbon and nitrogen metabolites, and the synchronous changes in related gene expression. As recovery progresses, the synchronized up-regulation of nitrogen assimilation genes (e.g., NIA, NiR) and the TCA cycle-mediated carbon–nitrogen coupling (e.g., GOGAT and citrate) provide the essential tetrapyrrole precursors and carbon skeletons required for the sustained rebuilding of the photosynthetic apparatus.
Evidence suggests that the rapid depletion of drought-accumulated organic acids and amino acids is associated with initial repair processes, while the subsequent maintenance of pigment stoichiometry (Chl/Car ratio) is indicative of an efficiency-oriented strategy that balances rapid growth with photoprotection. Crucially, the relatively high WUE maintained during first day of recovery was primarily associated with enhanced carbon assimilation efficiency rather than reduced transpiration, indicating that rewatered rice prioritizes metabolic optimization to maximize biomass accumulation per unit of water loss. Collectively, these results reveal that post-drought rewatering triggers a highly synchronized structural, metabolic, and transcriptional transition that supports both the restoration and transient enhancement of photosynthetic capacity. This integrative framework provides new insights into the dynamic recovery mechanisms of rice, suggesting that C-N allocation dynamics are central to crop resilience. Future studies should examine these patterns under field conditions and further resolve metabolic flux distributions to optimize irrigation strategies for sustainable rice production.

Author Contributions

H.Q.; methodology, investigation, data curation, writing—original draft preparation, X.D.; investigation, validation, data curation, X.W.; investigation and validation, Y.Z.; investigation and validation, J.M.; investigation, resources, L.S.; writing—review and editing, supervision, funding acquisition. All authors have read and agreed to the published version of the manuscript.

Funding

This research was funded by the National Natural Science Foundation of China (Grant No. 52425901).

Data Availability Statement

Raw sequencing data have been deposited in the NCBI Sequence Read Archive (SRA) under BioProject PRJNA1453766.

Conflicts of Interest

The authors declare no conflicts of interest.

Appendix A

Figure A1. KEGG pathway enrichment analysis of differentially accumulated metabolites (DAMs) at various stages. (a) CD vs. CK at t = 3: Enrichment analysis reveals the metabolic disruption under peak drought stress. Significant enrichment is observed in the Citrate cycle (TCA cycle), Carbon fixation in photosynthetic organisms, and Alanine, aspartate and glutamate metabolism, reflecting the early impact of water deficit on primary metabolism and energy balance (p < 0.02). (b) CE vs. CK at t = 4: Enrichment analysis captures the immediate metabolic shifts 24 h after rewatering. The high Rich Factor and significant enrichment in Phenylpropanoid biosynthesis, Flavone and flavonol biosynthesis, and Tryptophan metabolism indicate a rapid activation of defensive secondary metabolism rather than a simple reversion to the control state. (c) KEGG enrichment analysis (Mix): A global overview of metabolic pathway alterations across all experimental stages. The sustained high enrichment of ABC transporters, Nucleotide metabolism, and Alanine, aspartate and glutamate metabolism underscores the fundamental roles of intensive transmembrane transport and carbon–nitrogen redistribution throughout the drought–rewatering cycle.
Agronomy 16 00975 g0a1

References

  1. Pimentel, D.; Berger, B.; Filiberto, D.; Newton, M.; Wolfe, B.; Karabinakis, E.; Clark, S.; Poon, E.; Abbett, E.; Nandagopal, S. Water resources: Agricultural and environmental issues. BioScience 2004, 54, 909–918. [Google Scholar] [CrossRef]
  2. Yao, L.; Zheng, H.-B.; Liu, J.-X.; He, H.; Huang, H. Current situation and prospect of rice water-saving irrigation technology in China. Chin. J. Ecol. 2014, 33, 1381. [Google Scholar]
  3. Mekonnen, M.M.; Hoekstra, A.Y. Four billion people facing severe water scarcity. Sci. Adv. 2016, 2, e1500323. [Google Scholar] [CrossRef] [PubMed]
  4. Bramley, H.; Turner, N.C.; Siddique, K.H. Water use efficiency. In Genomics and Breeding for Climate-Resilient Crops: Vol. 2 Target Traits; Springer: Berlin/Heidelberg, Germany, 2013; pp. 225–268. [Google Scholar]
  5. Zwart, S.J.; Bastiaanssen, W.G. Review of measured crop water productivity values for irrigated wheat, rice, cotton and maize. Agric. Water Manag. 2004, 69, 115–133. [Google Scholar] [CrossRef]
  6. Blum, A. Effective use of water (EUW) and not water-use efficiency (WUE) is the target of crop yield improvement under drought stress. Field Crops Res. 2009, 112, 119–123. [Google Scholar] [CrossRef]
  7. Leakey, A.D.; Ferguson, J.N.; Pignon, C.P.; Wu, A.; Jin, Z.; Hammer, G.L.; Lobell, D.B. Water use efficiency as a constraint and target for improving the resilience and productivity of C3 and C4 crops. Annu. Rev. Plant Biol. 2019, 70, 781–808. [Google Scholar] [CrossRef]
  8. Yoshimoto, M.; Oue, H.; Kobayashi, K. Energy balance and water use efficiency of rice canopies under free-air CO2 enrichment. Agric. For. Meteorol. 2005, 133, 226–246. [Google Scholar] [CrossRef]
  9. Fukai, S.; Mitchell, J. Factors determining water use efficiency in aerobic rice. Crop Environ. 2022, 1, 24–40. [Google Scholar] [CrossRef]
  10. Carrijo, D.R.; Lundy, M.E.; Linquist, B.A. Rice yields and water use under alternate wetting and drying irrigation: A meta-analysis. Field Crops Res. 2017, 203, 173–180. [Google Scholar] [CrossRef]
  11. Bouman, B.; Tuong, T.P. Field water management to save water and increase its productivity in irrigated lowland rice. Agric. Water Manag. 2001, 49, 11–30. [Google Scholar] [CrossRef]
  12. Xiao, Z.; Zhang, N.; Zhang, Y.; Zhu, K.; Wang, W.; Zhang, W.; Gu, J.; Zhang, G.; Liu, L.; Zhang, J.; et al. Synergistic mechanism of moderate wetting drying irrigation improving rice productivity and environmental sustainability. Field Crops Res. 2025, 332, 110035. [Google Scholar] [CrossRef]
  13. Ramos-Fernández, L.; Peña-Amaro, R.; Huanuqueño-Murillo, J.; Quispe-Tito, D.; Maldonado-Huarhuachi, M.; Heros-Aguilar, E.; Flores del Pino, L.; Pino-Vargas, E.; Quille-Mamani, J.; Torres-Rua, A. Water Use Efficiency in Rice Under Alternative Wetting and Drying Technique Using Energy Balance Model with UAV Information and AquaCrop in Lambayeque, Peru. Remote Sens. 2024, 16, 3882. [Google Scholar] [CrossRef]
  14. Yang, J.; Zhou, Q.; Zhang, J. Moderate wetting and drying increases rice yield and reduces water use, grain arsenic level, and methane emission. Crop J. 2017, 5, 151–158. [Google Scholar] [CrossRef]
  15. Wang, C.; Fa, X.; Meng, Q.; Zhang, Y.; Wang, W.; Zhu, K.; Zhang, W.; Gu, J.; Liu, L.; Zhang, J.; et al. Comparison of Agronomic and Physiological Characteristics for Rice Varieties Differing in Water Use Efficiency under Alternate Wetting and Drying Irrigation. Agronomy 2024, 14, 1986. [Google Scholar] [CrossRef]
  16. Li, Z.; Shen, Y.; Zhang, W.; Wang, Z.; Gu, J.; Yang, J.; Zhang, J. A moderate wetting and drying regime produces more and healthier rice food with less environmental risk. Field Crops Res. 2023, 298, 108954. [Google Scholar] [CrossRef]
  17. Xu, Q.; Ma, X.; Lv, T.; Bai, M.; Wang, Z.; Niu, J. Effects of Water Stress on Fluorescence Parameters and Photosynthetic Characteristics of Drip Irrigation in Rice. Water 2020, 12, 289. [Google Scholar] [CrossRef]
  18. Wang, L.; Zhang, X.; She, Y.; Hu, C.; Wang, Q.; Wu, L.; You, C.; Ke, J.; He, H. Physiological Adaptation Mechanisms to Drought and Rewatering in Water-Saving and Drought-Resistant Rice. Int. J. Mol. Sci. 2022, 23, 14043. [Google Scholar] [CrossRef]
  19. Yang, X.; Wang, X.; Li, Y.; Yang, L.; Hu, L.; Han, Y.; Wang, B. Effects of Drought Stress at the Booting Stage on Leaf Physiological Characteristics and Yield of Rice. Plants 2024, 13, 3464. [Google Scholar] [CrossRef]
  20. Zhang, H.; Zhang, S.; Yang, J.; Zhang, J.; Wang, Z. Postanthesis Moderate Wetting Drying Improves Both Quality and Quantity of Rice Yield. Agron. J. 2008, 100, 726–734. [Google Scholar] [CrossRef]
  21. Zhang, H.; Xue, Y.; Wang, Z.; Yang, J.; Zhang, J. An Alternate Wetting and Moderate Soil Drying Regime Improves Root and Shoot Growth in Rice. Crop Sci. 2009, 49, 2246–2260. [Google Scholar] [CrossRef]
  22. Park, S.Y.; Jeong, D.-H. Comprehensive Analysis of Rice Seedling Transcriptome during Dehydration and Rehydration. Int. J. Mol. Sci. 2023, 24, 8439. [Google Scholar] [CrossRef] [PubMed]
  23. Zhu, Q.; Hassan, M.A.; Li, Y.; Fang, W.; Wu, J.; Wang, S. Physiological and Transcriptomic Characterization of Rice Genotypes under Drought Stress. Agronomy 2024, 14, 2247. [Google Scholar] [CrossRef]
  24. Wang, Y.; Zhang, Y.; Qiao, H.; Zheng, Y.; Hou, X.; Shi, L. An integrated transcriptome and physiological analysis of nitrogen use efficiency in rice (Oryza sativa L. ssp. indica) under drought stress. Front. Genet. 2024, 15, 1483113. [Google Scholar] [CrossRef]
  25. Gayen, D.; Barua, P.; Lande, N.V.; Varshney, S.; Sengupta, S.; Chakraborty, S.; Chakraborty, N. Dehydration-responsive alterations in the chloroplast proteome and cell metabolomic profile of rice reveals key stress adaptation responses. Environ. Exp. Bot. 2019, 160, 12–24. [Google Scholar] [CrossRef]
  26. Wang, X.; Liu, H.; Zhang, D.; Zou, D.; Wang, J.; Zheng, H.; Jia, Y.; Qu, Z.; Sun, B.; Zhao, H. Photosynthetic Carbon Fixation and Sucrose Metabolism Supplemented by Weighted Gene Co-expression Network Analysis in Response to Water Stress in Rice With Overlapping Growth Stages. Front. Plant Sci. 2022, 13, 864605. [Google Scholar] [CrossRef] [PubMed]
  27. Lamlom, S.F.; Radwan, N.S.; Emwas, A.H.; Jaremko, M.; Abdelsalam, N.R. Tissue-specific metabolomic profiling reveals cultivar-dependent drought tolerance mechanisms in rice (Oryza sativa L.). BMC Plant Biol. 2026, 26, 170. [Google Scholar] [CrossRef]
  28. Yoshida, S.; Forno, D.A.; Cock, J.H. Laboratory Manual for Physiological Studies of Rice; CABI Digital Library: Wallingford, UK, 1971. [Google Scholar]
  29. Lichtenthaler, H.K.; Wellburn, A.R. Determinations of total carotenoids and chlorophylls a and b of leaf extracts in different solvents. Biochem. Soc. Trans. 1983, 11, 591–592. [Google Scholar] [CrossRef]
  30. Klopfenstein, D.V.; Zhang, L.; Pedersen, B.S.; Ramírez, F.; Warwick Vesztrocy, A.; Naldi, A.; Mungall, C.J.; Yunes, J.M.; Botvinnik, O.; Weigel, M.; et al. GOATOOLS: A Python library for Gene Ontology analyses. Sci. Rep. 2018, 8, 10872. [Google Scholar] [CrossRef] [PubMed]
  31. Khalvandi, M.; Siosemardeh, A.; Roohi, E.; Keramati, S. Salicylic acid alleviated the effect of drought stress on photosynthetic characteristics and leaf protein pattern in winter wheat. Heliyon 2021, 7, e05908. [Google Scholar] [CrossRef] [PubMed]
  32. Flexas, J.; Medrano, H. Drought-inhibition of Photosynthesis in C3 Plants: Stomatal and Non-stomatal Limitations Revisited. Ann. Bot. 2002, 89, 183–189. [Google Scholar] [CrossRef] [PubMed]
  33. Lawlor, D.W.; Tezara, W. Causes of decreased photosynthetic rate and metabolic capacity in water-deficient leaf cells: A critical evaluation of mechanisms and integration of processes. Ann. Bot. 2009, 103, 561–579. [Google Scholar] [CrossRef]
  34. Flexas, J.; Bota, J.; Loreto, F.; Cornic, G.; Sharkey, T. Diffusive and metabolic limitations to photosynthesis under drought and salinity in C3 plants. Plant Biol. 2004, 6, 269–279. [Google Scholar] [CrossRef]
  35. Flexas, J.; Barón, M.; Bota, J.; Ducruet, J.-M.; Gallé, A.; Galmés, J.; Jiménez, M.; Pou, A.; Ribas-Carbó, M.; Sajnani, C.; et al. Photosynthesis limitations during water stress acclimation and recovery in the drought-adapted Vitis hybrid Richter-110 (V. berlandieri × V. rupestris). J. Exp. Bot. 2009, 60, 2361–2377. [Google Scholar] [CrossRef]
  36. Jarin, A.S.; Islam, M.M.; Rahat, A.; Ahmed, S.; Ghosh, P.; Murata, Y. Drought Stress Tolerance in Rice: Physiological and Biochemical Insights. Int. J. Plant Biol. 2024, 15, 692–718. [Google Scholar] [CrossRef]
  37. Wang, S.; Ma, Q.; Li, C.; Zhang, S.; Liu, X. Chloroplast Responses to Drought: Integrative Mechanisms and Mitigation Strategies. Int. J. Mol. Sci. 2025, 26, 11872. [Google Scholar] [CrossRef] [PubMed]
  38. Shimizu, T.; Masuda, T. The role of tetrapyrrole-and GUN1-dependent signaling on chloroplast biogenesis. Plants 2021, 10, 196. [Google Scholar] [CrossRef]
  39. Jasinska, W.; Dindo, M.; Cordoba, S.M.C.; Serohijos, A.W.R.; Laurino, P.; Brotman, Y.; Bershtein, S. Non-consecutive enzyme interactions within TCA cycle supramolecular assembly regulate carbon-nitrogen metabolism. Nat. Commun. 2024, 15, 5285. [Google Scholar] [CrossRef] [PubMed]
  40. Dall’Osto, L.; Holt, N.E.; Kaligotla, S.; Fuciman, M.; Cazzaniga, S.; Carbonera, D.; Frank, H.A.; Alric, J.; Bassi, R. Zeaxanthin protects plant photosynthesis by modulating chlorophyll triplet yield in specific light-harvesting antenna subunits. J. Biol. Chem. 2012, 287, 41820–41834. [Google Scholar] [CrossRef] [PubMed]
  41. Phung, T.-H.; Jung, H.-i.; Park, J.-H.; Kim, J.-G.; Back, K.; Jung, S. Porphyrin Biosynthesis Control under Water Stress: Sustained Porphyrin Status Correlates with Drought Tolerance in Transgenic Rice. Plant Physiol. 2011, 157, 1746–1764. [Google Scholar] [CrossRef]
  42. Chen, S.; Li, P.; Tan, S.; Pu, X.; Zhou, Y.; Hu, K.; Huang, W.; Liu, L. Combined Proteomic and Physiological Analysis of Chloroplasts Reveals Drought and Recovery Response Mechanisms in Nicotiana benthamiana. Plants 2021, 10, 1127. [Google Scholar] [CrossRef]
  43. Yang, X.; Nian, J.; Xie, Q.; Feng, J.; Zhang, F.; Jing, H.; Zhang, J.; Dong, G.; Liang, Y.; Peng, J.; et al. Rice Ferredoxin-Dependent Glutamate Synthase Regulates Nitrogen-Carbon Metabolomes and Is Genetically Differentiated between japonica and indica Subspecies. Mol. Plant 2016, 9, 1520–1534. [Google Scholar] [CrossRef]
  44. Zhong, C.; Cao, X.; Hu, J.; Zhu, L.; Zhang, J.; Huang, J.; Jin, Q. Nitrogen Metabolism in Adaptation of Photosynthesis to Water Stress in Rice Grown under Different Nitrogen Levels. Front. Plant Sci. 2017, 8, 1079. [Google Scholar] [CrossRef] [PubMed]
  45. Ruban, A.V.; Lee, P.J.; Wentworth, M.; Young, A.J.; Horton, P. Determination of the Stoichiometry and Strength of Binding of Xanthophylls to the Photosystem II Light Harvesting Complexes. J. Biol. Chem. 1999, 274, 10458–10465. [Google Scholar] [CrossRef]
  46. Kan, C.-C.; Chung, T.-Y.; Juo, Y.-A.; Hsieh, M.-H. Glutamine rapidly induces the expression of key transcription factor genes involved in nitrogen and stress responses in rice roots. BMC Genom. 2015, 16, 731. [Google Scholar] [CrossRef]
  47. Liao, H.-S.; Lee, K.-T.; Chung, Y.-H.; Chen, S.-Z.; Hung, Y.-J.; Hsieh, M.-H. Glutamine induces lateral root initiation, stress responses, and disease resistance in Arabidopsis. Plant Physiol. 2024, 195, 2289–2308. [Google Scholar] [CrossRef] [PubMed]
  48. Michel, B.E.; Kaufmann, M.R. The Osmotic Potential of Polyethylene Glycol 6000. Plant Physiol. 1973, 51, 914–916. [Google Scholar] [CrossRef]
  49. Passioura, J. Soil conditions and plant growth. Plant Cell Environ. 2002, 25, 311–318. [Google Scholar] [CrossRef] [PubMed]
Figure 1. Morphological responses of rice plants under different water treatments. Plants were photographed at Day 0 (before drought) and Day 7 (4 days after rehydration) under three irrigation regimes: continuous flooding (CK), continuous drought (CD), and rehydration after drought (CE).
Agronomy 16 00975 g001
Figure 2. Gas-exchange responses of rice plants to drought and rehydration (ae) Changes in gas-exchange parameters of rice leaves during the drought–rehydration cycle. (a) Net photosynthetic rate (Pn), (b) transpiration rate (Tr), (c) stomatal conductance (gs), (d) intercellular CO2 concentration (Ci), and (e) instantaneous water-use efficiency (WUE). Data represent means ± SD (n = 3). The shaded area indicates the drought period, and the unshaded area represents the recovery phase following rehydration.
Agronomy 16 00975 g002
Figure 3. Effects of drought and rehydration on pigment composition in rice leaves. (a) Chlorophyll a (Chl a), (b) chlorophyll b (Chl b), and (c) total chlorophyll (Chl a + b) contents under different water regimes (CK, continuously flooded; CD, continuous drought; CE, drought followed by rehydration). (d) Carotenoid (Car) content. (e) Ratio of total chlorophyll to carotenoids (Chl a + b/Car). (f) Ratio of chlorophyll a to chlorophyll b (Chl a/Chl b). Data are presented as means ± SD (n = 3). Different letters above bars indicate significant differences among treatments at p < 0.05. The shaded area represents the drought period of CE treatment.
Agronomy 16 00975 g003aAgronomy 16 00975 g003b
Figure 4. Metabolomic responses of rice leaves under drought stress and rehydration. (a,b) Principal component analysis (PCA) and partial least-squares discriminant analysis (PLS-DA) of metabolite profiles from well-watered (CK), drought-stressed (CD), and rewatered (CE) plants. (c) Statistical analysis of the number of differentially accumulated metabolites (DAMs) in different pairwise comparisons. (d) Heatmap and time-course profiles of selected metabolites, including citrate, malate, glutamate, and L-glutamine, across the three treatments. (e) KEGG pathway enrichment analysis of DAMs in CE vs. CK at t = 6. (f) Relative abundance of key metabolic intermediates involved in energy and nitrogen metabolism across time points (t = 3, 4, 6). Values represent mean ± SD (n = 6).
Agronomy 16 00975 g004
Figure 5. Transcriptomic responses of rice leaves to different water treatments. (a) PCA of gene expression profiles under CK, CD, and CE. (b) Numbers of DEGs. (cf) GO enrichment analysis of up- and down-regulated differentially expressed genes (DEGs) under drought and rehydration treatments. (g) Gene–gene co-expression heatmap within the CE group at t = 6. The heatmap shows the Pearson correlation coefficients between representative genes involved in nitrogen assimilation (e.g., NIA, NiR, GOGAT), photosynthesis (RBCS), and light-harvesting (LHCB) specifically for the rewatered (CE) treatment at t = 6. Red and blue colors indicate positive and negative correlations, respectively. (h) Gene–metabolite correlation heatmap within the CE group at t = 6. The heatmap displays the correlation between the expression levels of key transcripts and the abundance of selected primary metabolites (e.g., citrate, glutathione, glutamine) in CE plants at t = 6.
Agronomy 16 00975 g005
Figure 6. Correlation heatmap showing the relationships between key physiological traits (e.g., Pn, gs, and total chlorophyll content), representative metabolites (e.g., citrate, glutamate), and the expression levels of core regulatory genes (e.g., NIA2 and NiR). The color scale represents Pearson correlation coefficients (r), with red indicating positive correlations and blue indicating negative correlations. Asterisks denote statistical significance (* p < 0.05; ** p < 0.01).
Agronomy 16 00975 g006
Disclaimer/Publisher’s Note: The statements, opinions and data contained in all publications are solely those of the individual author(s) and contributor(s) and not of MDPI and/or the editor(s). MDPI and/or the editor(s) disclaim responsibility for any injury to people or property resulting from any ideas, methods, instructions or products referred to in the content.