Article

Pig Manure and Biochar Reduce Nitrogen Availability and Rice Yield Compared to Mineral Fertilization in a Three-Year Field Experiment

1
Agronomy College, Shenyang Agricultural University, Shenyang 110866, China
2
Key Laboratory of Biochar and Soil Improvement, Ministry of Agriculture and Rural Affairs, Shenyang 110866, China
*
Authors to whom correspondence should be addressed.
Agronomy 2025, 15(9), 2242; https://doi.org/10.3390/agronomy15092242
Submission received: 2 September 2025 / Revised: 17 September 2025 / Accepted: 19 September 2025 / Published: 22 September 2025

Abstract

Substituting chemical fertilizers with organic alternatives represents an effective strategy for mitigating soil nitrogen (N) loss and reducing chemical fertilizer use. However, the efficacy of organic substitution in regulating soil N fertility and rice growth requires further investigation, and mechanistic studies elucidating how organic fertilizers affect soil N transformation processes and availability are still deficient. To address this, we conducted a three-year field experiment from 2021 to 2023, comparing three rice fertilization regimes: (1) chemical fertilizer as the control (CK), (2) substitution with organic fertilizer (OF), and (3) substitution with biochar-based organic fertilizer (BF). Both organic substitution treatments were applied as basal fertilizer, and the rice plants received equivalent topdressing applications. The soil N availability, gross and net N transformation rates, and soil microbial activity were analyzed, and the rice growth index and yield were determined. The results showed that organic substitution (OF and BF) significantly increased the soil total carbon content, stimulated microbial biomass growth and enhanced enzymatic activity associated with soil C and N cycling. However, the limited N input from organic substitution significantly decreased the soil gross N mineralization rate by 28.30% (OF) and 58.14% (BF), compared to chemical fertilization (CK). It also reduced the gross N nitrification rate by 38.30% (OF) and 36.17% (BF). These suppressed N transformation processes ultimately led to 11.97% (OF) and 14.72% (BF) lower soil mineral N contents. The soil N deficiency during critical early vegetative growth stages substantially constrained rice development, resulting in significant yield reductions in the OF and BF treatments compared to chemical fertilization (CK). These results indicate that complete organic substitution compromises rice yields due to insufficient N availability; therefore, we recommend integrated organic–mineral fertilization as an optimal strategy to achieve both crop productivity and environmental benefits.

Graphical Abstract

1. Introduction

Fertilizer application is an effective way to increase food production and alleviate hunger worldwide [1]. To achieve the highest crop yields, farmers frequently apply fertilizers in amounts that exceed crop demands [2]. Excessive and unreasonable N fertilization in this context results in large quantities of active N being lost into the environment, leading to a reduction in nitrogen use efficiency (NUE), as well as environmental pollution of adjacent water bodies and the atmosphere [3,4].
Replacing chemical fertilizers with organic fertilizers offers a viable solution to the environmental risks posed by excessive N application. Commonly, organic fertilizers contain higher amounts of organic matter compared to chemical fertilizers. As the core aspect of soil fertility, organic matter incorporation can significantly increase soil nutrient contents and ameliorate the soil quality, thereby enhancing soil productivity [5]. Organic fertilizer also stimulates microbial growth and optimizes the microbial community structure by improving soil properties and supplying abundant carbon (C) and N sources, thereby enhancing nutrient contents and availability [6]. Moreover, the application of organic fertilizers can decrease the soil nutrient loss potential by increasing the soil’s water and nutrient retention capacity [7]; therefore, the co-application of chemical fertilizers with organic fertilizers has been shown to increase fertilizer use efficiency, prolong nutrient availability, promote crop growth, and ultimately achieve high yields [8]. For example, Zhang et al. [9] demonstrated that substituting chemical fertilizer with organic fertilizer improved crop yield and NUE and concurrently reduced the excessive N loss. Guan et al. [10] reported that 50% substitution of chemical N with chicken manure increased rice N uptake efficiency by 8.3% without a reduction in crop yield compared to chemical N treatment, even though 20% less N was applied via this method. However, the nutrient content of majority-organic fertilizers is lower than that of chemical fertilizers [11]. To achieve yield performance equivalent to that of chemical fertilizers, organic amendments must be applied at rates multiple times higher than those needed for chemical fertilizers. In the short-term, this will undoubtedly increase the cost to famers.
As a new type of soil amendment, biochar has shown its potential to increase the soil’s nutrient retention capacity and decrease the risk of loss by ameliorating soil physiochemical and microbiological properties [12,13]. The positive effect of biochar on soil nutrient retention can be attributed to its adsorption capacity through its relatively high specific surface area and abundant pore structure [14]. For example, Zhang et al. [15] reported that the decreased inorganic N leaching by biochar was mainly attributed to the adsorption of NH4+–N and NO3–N via biochar surface functional groups, electrostatic attraction, and surface complexation. Although the influence of biochar on soil nutrient availability in fertilized soil has attracted wide attention, few studies have been conducted to investigate how biochar affects nutrient transformation under organic amendments. According to the existing results, biochar may affect organic fertilizer via the adsorption of small organic molecules, facilitating humus formation and protecting soil organic carbon (SOC) from mineralization [16]. Moreover, the co-application of biochar with organic fertilizers is reported to increase dissolved organic carbon (DOC) and extractable organic carbon (EOC) contents in soil, further affecting soil C mineralization and nutrient cycling processes [17].
Regarding the effect on soil N, the co-application of biochar with organic fertilizers is reported to increase the soil N immobilization rate and availability [9]. Nguyen et al. [18] showed that the application of biochar-based organic fertilizers enhanced soil N mineralization and increased plant N adsorption. However, contrasting findings have been observed in some studies, demonstrating that biochar amendment exerted no effects or even a negative effect on N mineralization or the mineralizable N pool in soil systems [19,20,21]. In summary, the function of biochar in organic amendment management, particularly with regard to soil N, remains uncertain under field conditions.
Due to the high N demand of rice cultivation, a major goal for Chinese rice production is to improve N use efficiency and preserve soil N stocks [22]. However, while the 15N isotope dilution technique is powerful for quantifying key N transformation processes, clarifying N immobilization characteristics and loss risks [23,24], its application in studies involving the complete substitution of chemical fertilizers with organic fertilizers in paddy soils remains scarce. Therefore, the specific objectives of this study were to (1) evaluate the effects of organic fertilizer substitution on N availability and corresponding influencing factors and (2) investigate potential synergistic effects between biochar and organic fertilizers on soil N availability and transformation characteristics. We hypothesized that the distinct nutrient composition and forms, especially with regard to nitrogen, of organic fertilizers compared to chemical fertilizers alter soil nutrient availability and consequently affect rice growth and yield. This study aimed to evaluate the feasibility of biochar-based organic fertilization as a sustainable N management strategy in rice production systems, providing empirical evidence for its agronomic and environmental benefits.

2. Materials and Methods

2.1. Study Site Description

The field experiment was initiated in 2021 in Haicheng city, Liaoning Province, Northeastern China (40.85° N, 122.75° E). The site is characterized by a typical temperate continental monsoon climate with a mean annual temperature of 7.0 °C, 160 frost-free days, and mean annual precipitation of 650.4 mm. The paddy soil at the experimental site was classified as Hydragric Anthrosol.

2.2. Experimental Design

The rice (Oryza sativa L.) cultivation experiment was conducted from 2021 to 2023. Three base fertilizer treatments were employed, including CK, chemical fertilizer (with N:P2O5:K2O = 24:12:12) applied at a rate of 750 kg ha−1 year−1; OF, organic fertilizer applied at a rate of 7500 kg ha−1 year−1; and BF, biochar-based fertilizer applied at a rate of 7500 kg ha−1 year−1. The organic fertilizer application rates were calculated to maintain comparable levels of N, P, and K nutrient supply relative to the chemical fertilizer treatment. Three replicate plots 667 m2 in area were established for each treatment in a randomized block design. The organic fertilizers used in the experiment were pig manure and biochar-based organic fertilizer consisting of 20% biochar and 80% pig manure, provided by Liaoning Hengrun Agriculture Co., LTD., Haicheng, China. The biochar was pyrolyzed from corn straw at 500–600 °C. The basic properties of the paddy soil and fertilizers are shown in Table 1, and the nutrient contents of the fertilizers were determined according to the National Agricultural Technology Extension Service Center of China [25].
Prior to transplanting, the base fertilizers—both chemical and organic formulations—were spread evenly across the treatment plots and thoroughly mixed into the upper 20 cm of soil through rotary tillage operations. Rice was transplanted in mid-May of each year at a density of 30 cm × 20 cm. During rice growth, each treatments received 187.5 kg ha−1 of ammonium sulfate [(NH4)2SO4] and 75 kg ha−1 of diammonium phosphate [(NH4)2PO3] was applied as tillering fertilizer about ten days after rice transplanting. Additionally, between 15 June and 20 June, 50 kg ha−1 of ammonium chloride (NH4Cl) and 75 kg ha−1 of potassium chloride (KCl) were applied as panicle fertilizer. The actual amounts of N, P, and K applied in each treatment (including both the basal and topdressing fertilizers) are summarized in Table S1.

2.3. Plant Sampling and Analysis

At each critical growth stage (tillering, jointing, heading, and maturation), ten representative rice plants were randomly sampled from each plot to determine the tiller number, plant height, and aboveground biomass. The fresh samples were subjected to a kill-green treatment at 105 °C for 2 h and then dried at 80 °C for 2 days to determine the rice aboveground dry matter. The over-dried plant samples were separated into three parts—stem sheath, leaf, and panicle—and the dry weight was measured separately. The rice SPAD values were determined by using a chlorophyll meter (SPAD-502, Konica Minolta, Tokyo, Japan) at the first three stages, and at the maturation stage, rice plants were manually harvested from two designated 1.0 m2 areas in each plot. After threshing and air-drying, the grain moisture content was determined using a grain moisture tester (PM-8188-A, Kett, Tokyo, Japan), and the grain yield was calculated at a standard 14% moisture content.

2.4. Soil Sampling and Analysis

In the period 2021 through 2023, three soil cores from depths of 0–20 cm were collected at the tillering, jointing, heading, and maturation stage from each plot with a soil auger (with a diameter of 5 cm). After the surface debris was removed, the samples were thoroughly mixed and then divided into three parts: one portion of fresh soil was used to determine the soil NH4+–N and NO3–N contents, another portion was stored at −80 °C for microbial analysis, and the remaining soil was air-dried for further analysis. At the maturity stage in each year, the soil pH value and total C, N, P, and K contents were determined according to Bao [26].

2.4.1. Analysis of Soil Properties

The soil pH value was determined by using a pH meter (HI 2221, HANNA, Salerno, Italy). The soil cation exchange capacity (CEC) was measured via the ammonium acetate centrifugal exchange method [26] using a flame spectrophotometer (FP640, Ruifeng, Ningbo, China). The total nitrogen (TN) and total carbon (TC) were determined by using an elemental analyzer (Elementar MacroCube, Langenselbold, Germany). The total phosphorus (TP) and total potassium (TK) were determined according to the method of Bao [26], and the NH4+–N and NO3–N were determined using a continuous flow analyzer (SEAL AA3, Norderstedt, Germany) after extraction with 2 mol L−1 KCL. Microbial biomass carbon (MBC) and microbial biomass nitrogen (MBN) were measured via the chloroform fumigation-extraction method [27] and analyzed using a TOC analyzer (Multi C/N 3100, Analytik Jena, Jena, Germany). Soil urease activity was determined via the buffer method [28]. The activities of soil β-glucosidase, soil neutral phosphatase, and soil neutral protease were determined using four separate assay kits (β-glucosidase: Cat. No. BC0165; neutral phosphatase: Cat. No. BC0465; neutral protease: Cat. No. BC0275) purchased from Beijing Solarbio Science & Technology Co., Ltd., Beijing, China.

2.4.2. Method for Soil Gross N Turnover Rate

The soil gross N transformation rate was determined via a 15N pool dilution method. Specifically, 30 g of air-dried soil was distributed evenly in an Erlenmeyer flask and pre-incubated with 6 mL of deionized water for 24 h. Subsequently, 3 mL of 15N-labeled (15NH4)2SO4 or K15NO3 solution (100 mg N L−1) was uniformly applied to achieve a final exogenous N concentration of 10 mg kg−1 soil [29]. After labeling, soil samples were collected at 0.5 h and 24.5 h. The incubated soils were extracted with 150 mL of 2 mol·L−1 KCl, and the concentrations of NH4+–N and NO3–N were determined according to the procedures described in Section 2.4.1. Subsequently, a portion of the KCl extract (50 mL) was subjected to the diffusion procedure for trapping ammonia (NH3) on acidified filter paper (Whatman No. 42), following the method described by Zhang et al. [30]. Then, the 15N/14N isotope ratio was measured using an isotope ratio mass spectrometer (Delta V Advantage, Thermo Fisher Scientific, Dreieich, Germany) [31].
The following equations were used to estimate the soil N transformation rate. The gross transformation rate is initially established by Kirkham and Bartholomew [32] and improved by Hart et al. [33]:
M o r g = ( N H 4 ) 0 ( N H 4 ) t t × lg N % 0   15 N % t   15 l g [ ( N H 4 ) 0 ( N H 4 ) t ]
O N H 4 = ( N O 3 ) 0 ( N O 3 ) t t × lg N % 0   15 N % t   15 l g [ ( N 0 3 ) 0 ( N 0 3 ) t ]
I N H 4 = M o r g a n e t O N H 4
C N O 3 = I N O 3 = O N H 4 n n e t
In these equations, M o r g   represents the gross rates of N mineralization, in units of mg kg−1 d−1; O N H 4   represents the gross rates of N nitrification, in units of mg kg−1 d−1; t represents the time interval. N % 0   15 and N % t   15 represent the atom percentage excess of 15NH4+–N at times 0 and t, respectively; the same applies to the calculation of gross nitrification rates. I N H 4 and I N O 3 represent the gross immobilization rates of NH4+–N and NO3–N, respectively. Finally, a n e t   and n n e t   represent the net ammonification rate and net nitrification rate, respectively.

2.5. Data Processing and Statistical Analysis

Differences in soil properties and rice growth among the treatments were statistically evaluated by using one-way analysis of variance (ANOVA), followed by Duncan’s multiple range test (DMRT). A repeated-measures ANOVA was employed to assess year-to-year variation. A repeated-measures ANOVA was employed to assess year-to-year variation in variables measured once per year at a single growth stage. All statistical analyses were conducted using IBM SPSS Statistics 26.0 (IBM Corp., Armonk, NY, USA). Redundancy analysis (RDA) was adopted to assess the complex associations between N transformation and environmental variables. The Mantel test was adopted to investigate the effect of N transformation character on soil nutrients and rice yield. The correlations between different parameters were analyzed via Pearson’s correlation analysis (p < 0.05 and p < 0.01). The data were organized using Excel 2016, and visualization was achieved using Origin software package, version 2024.

3. Results

3.1. Soil Properties

As shown in Table 2, different responses of soil properties to CK and OF application were observed. The TC contents in the OF and BF treatments were 3.85% and 2.72% lower, respectively, than that in CK in 2021. As the experimental period continued, the TC contents generally increased in OF and BF but decreased in the CK treatment. As a result, the TC contents in OF and BF were 4.71% and 3.21% higher than that in the control by 2023, but there was no significant difference in the TC content between the OF and BF treatments. The addition of OF or BF did not result in a significant difference in TN, TP, and TK contents from those in control soil, or in the pH value.

3.2. Soil Inorganic N Content

The inorganic N contents in the OF and BF treatment were lower than those in the CK treatment during most of the growth stages (Figure 1). During the experiment, the NH4+–N content ranged within 11.41–4.18 mg kg−1, 10.87–4.92 mg kg−1, and 9.58–5.29 mg kg−1 for CK, OF, and BF, respectively (Figure 1a). The NH4+–N content under the CK treatment was higher than those in the OF and BF treatments during the tillering and maturation stages in both years of the experiment. However, during the jointing and heading stages, the NH4+–N content was inconsistent across the treatments.
On average, the NH4+–N content showed a tendency of CK > OF > BF (Table S2), and the NH4+–N content in OF was higher than that in BF during the tillering, jointing, and heading stages.
The soil NO3–N content ranged within 4.21–2.39 mg kg−1, 3.62–0.83 mg kg−1, and 3.92–1.13 mg kg−1 for CK, OF, and BF, respectively (Figure 1d–f). Similarly to the soil NH4+–N content, the NO3–N content in CK was also higher than those in BF and OF, especially during the tillering stage in 2021, when the NO3-N content was 141.43% and 64.88% higher than those in OF and BF, respectively.
Across three years of cultivation, the NO3-N contents in the organic substitution treatments (OF and BF) gradually increased, narrowing the gap with the CK treatment. The biochar-based organic fertilizer resulted in a higher NO3–N content than did OF during the heading stage. On average, the content was significantly higher for BF than for OF in the tillering stage.

3.3. Effect of Different Fertilization on Soil N Transformation

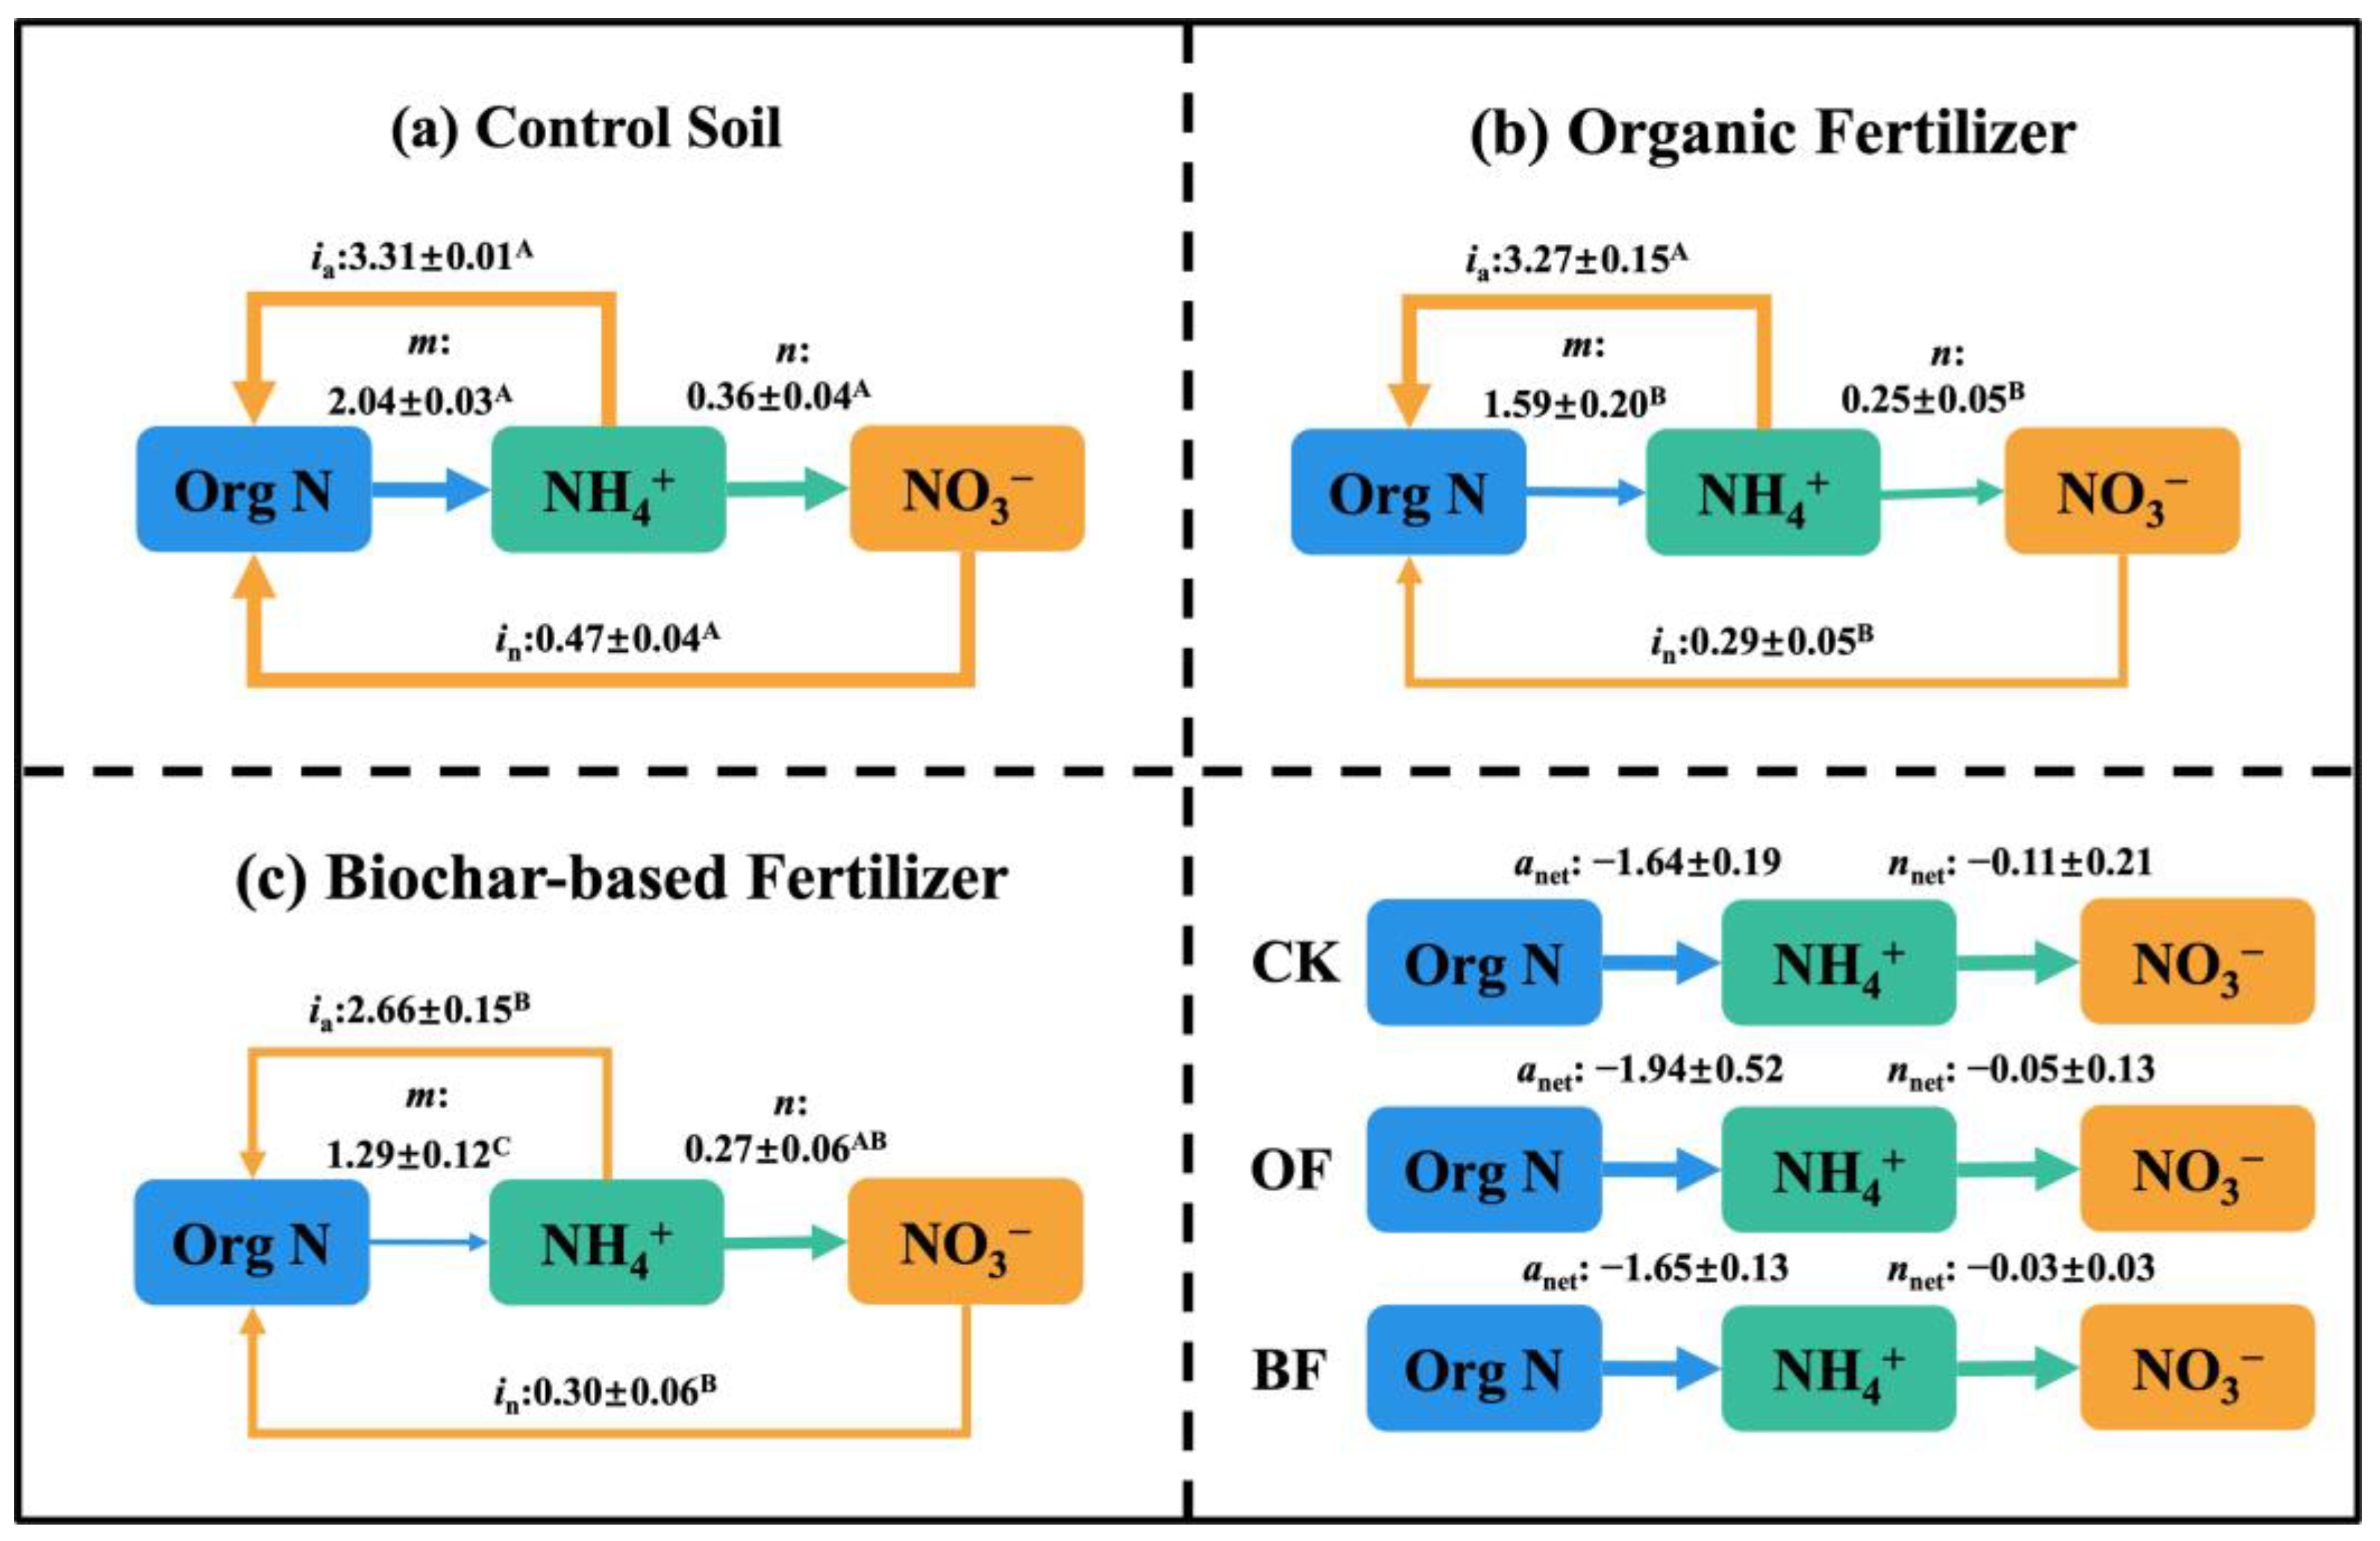
The gross N transformation varied across the treatments (Figure 2). After 3 years of organic fertilization, the gross N mineralization rates (m) was significantly decreased compared to than with CK. Specifically, m in the CK treatment was 2.04 mg N kg−1 d−1, which was 28.30% and 58.14% higher than those for OF and BF, respectively. The m value for the biochar-based organic fertilizer was even lower than that for the organic fertilizer treatment. The gross N nitrification rate (n) showed a tendency of CK > BF > OF. The n value for the CK treatment was 33.33% and 44% higher than that for the BF and OF treatments, respectively, but BF insignificantly differed from OF.
The gross NH4+–N immobilization rate (ia) for the CK and OF treatments was higher than that for BF by 24.44% and 22.93%, respectively. The organic substitution treatments also decreased the soil NO3–N immobilization rate (in) by 38.30% (OF) and 36.17% (BF) compared to CK.
The soil net ammonification rate (anet) and net nitrification rate (nnet) were not affected by the different fertilization treatments. Among the three treatments, CK exhibited the highest anet value at −1.64 mg N kg−1 d−1, while nnet was highest under the BF treatment, reaching −0.03 mg N kg−1 d−1.

3.4. Effect of Different Fertilization on Soil Enzymatic Activity

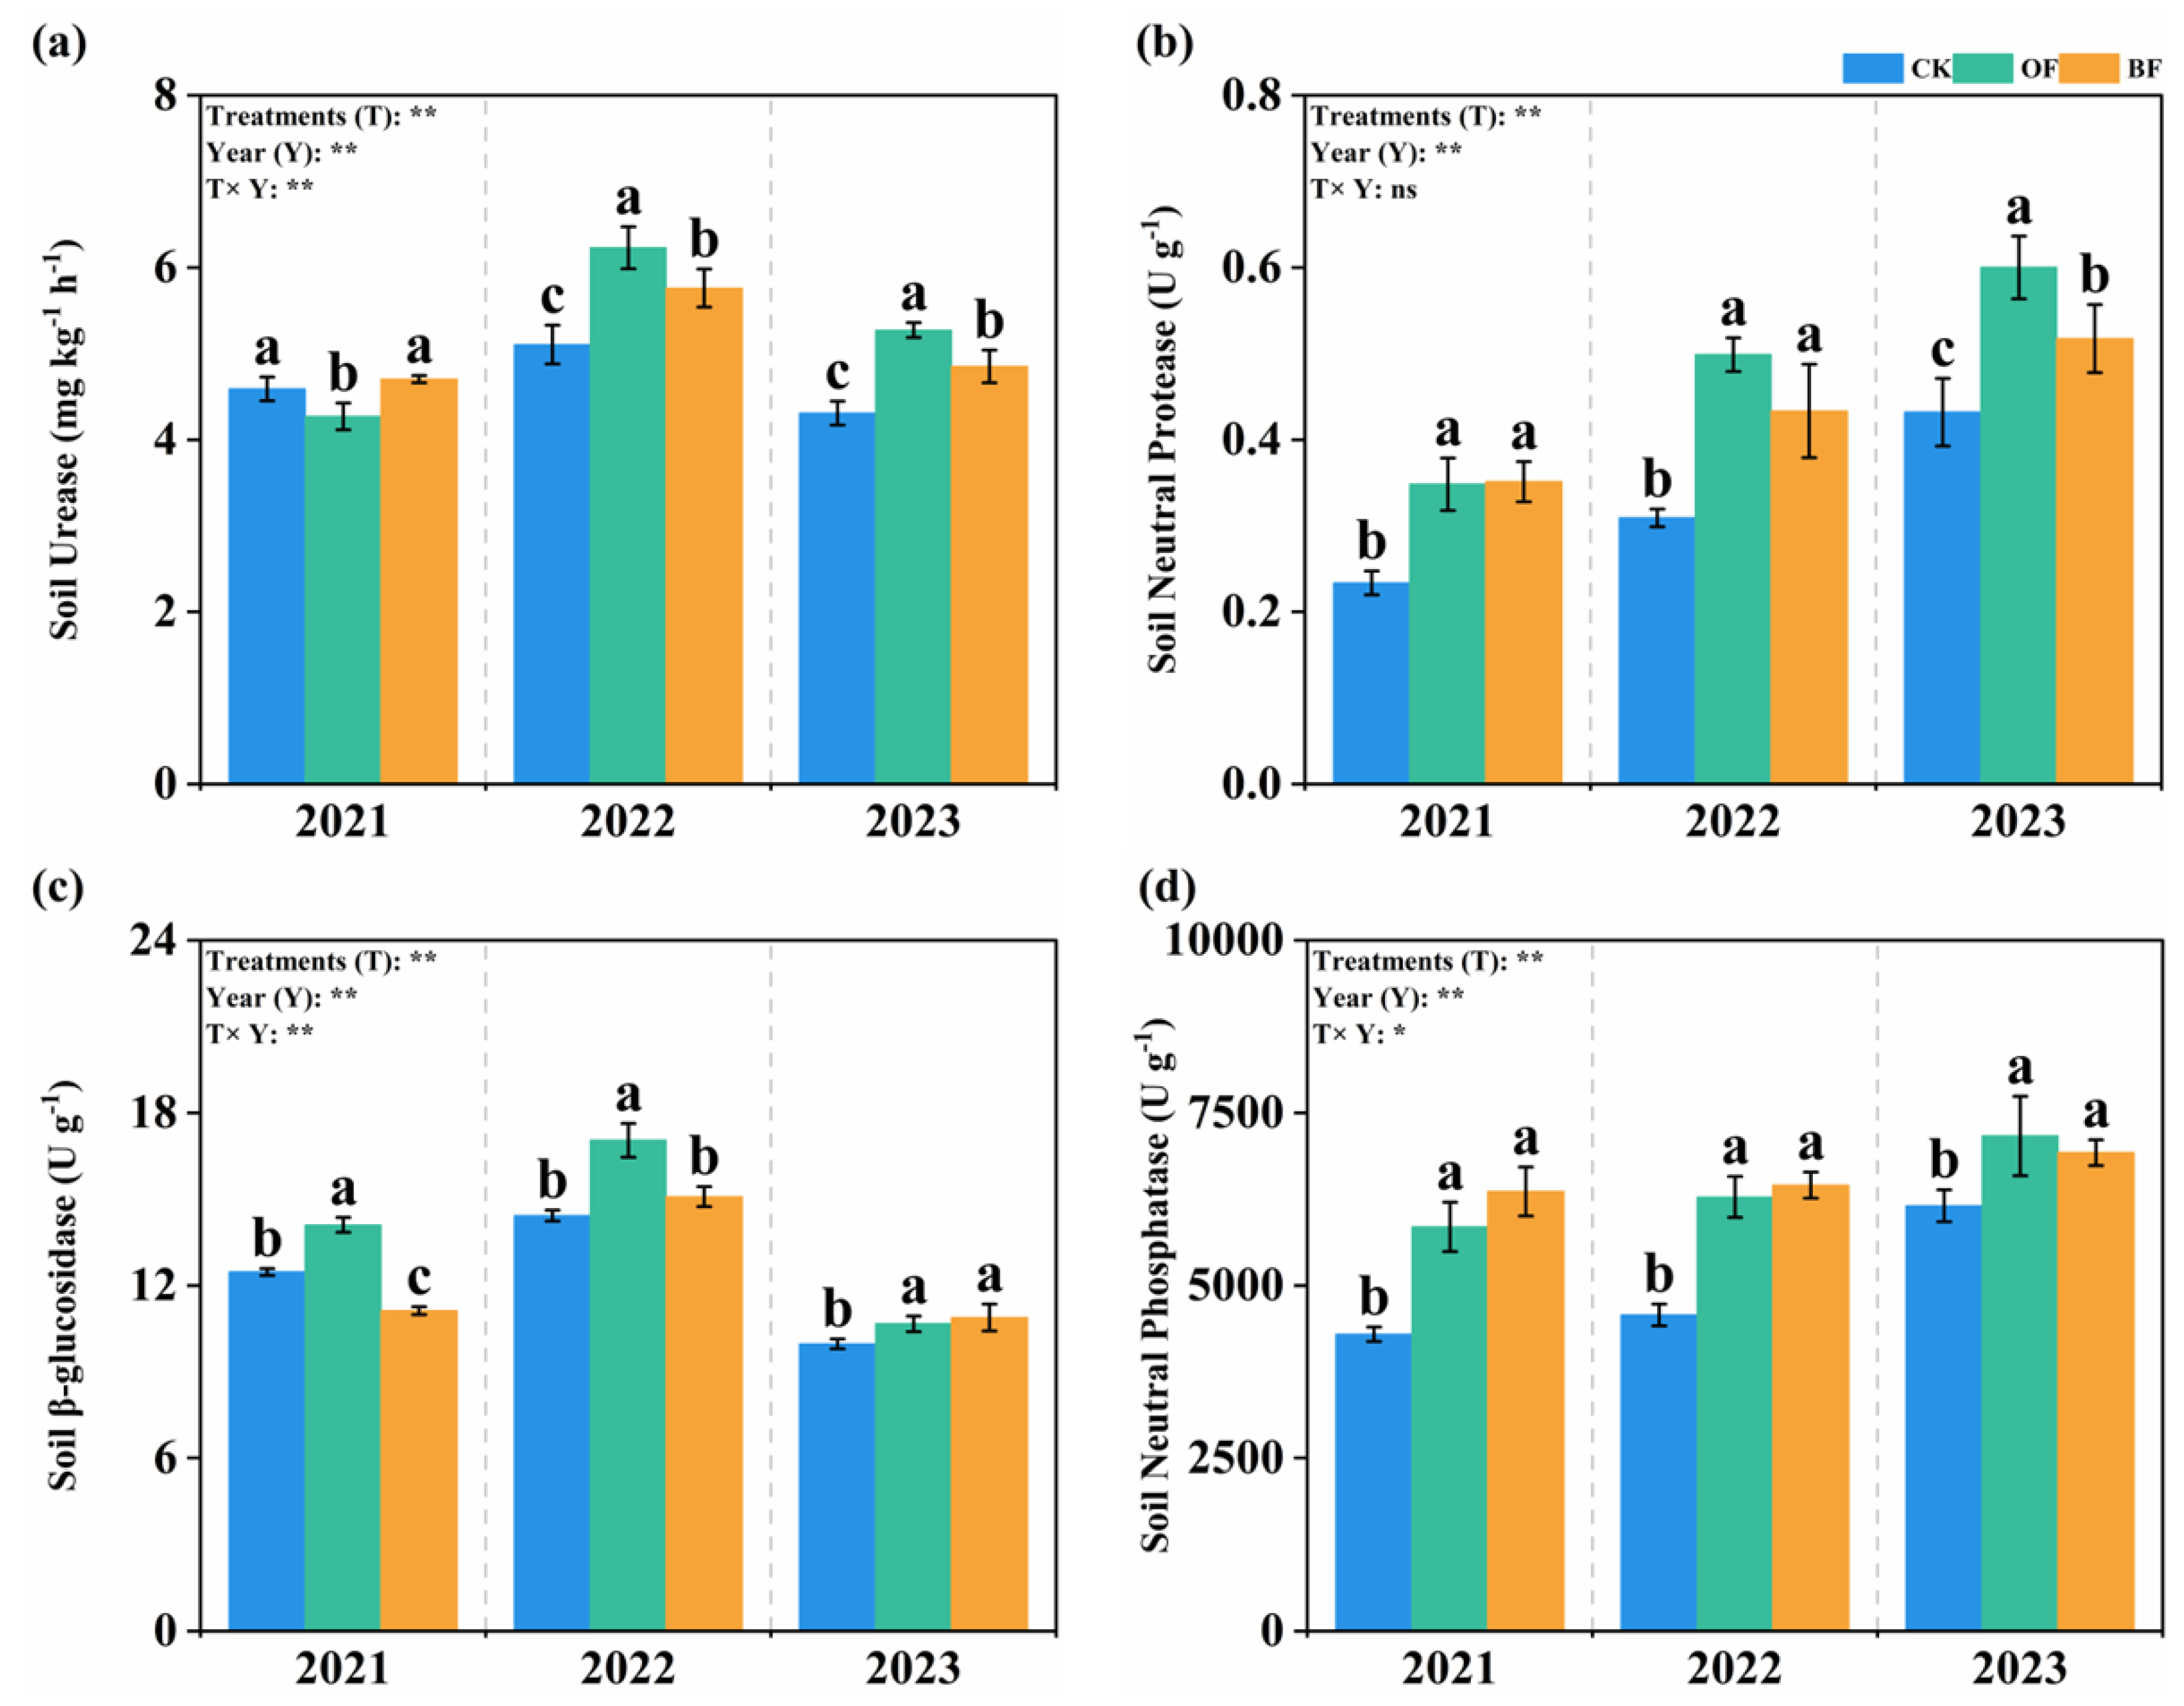
The application of organic fertilizers increased soil enzyme activities governing soil C-N turnover (Table S3 and Figure 3). Specifically, soil urease activity showed a trend of OF > BF > CK, and the urease activity in OF soil was significantly higher than that in BF soil during 2022 and 2023. Like with the soil urease activity, the OF treatment also showed the highest soil neutral protease activity—45.45% and 11.63% higher than that for CK and BF.
The average soil β-glucosidase activity in OF was significantly higher than that in CK and BF; this variation mainly derived from 2021 and 2022. The β-glucosidase activity under the BF treatment increased annually, reaching a significant level in 2023 with respect to the between OF and CK treatments. Soil neutral protease activity in BF was also increased by organic fertilizer application, especially in 2021, and the average soil neutral protease activity from 2021 to 2023 was 31.41% higher than that in CK.

3.5. Soil Microbial Biomass Contents

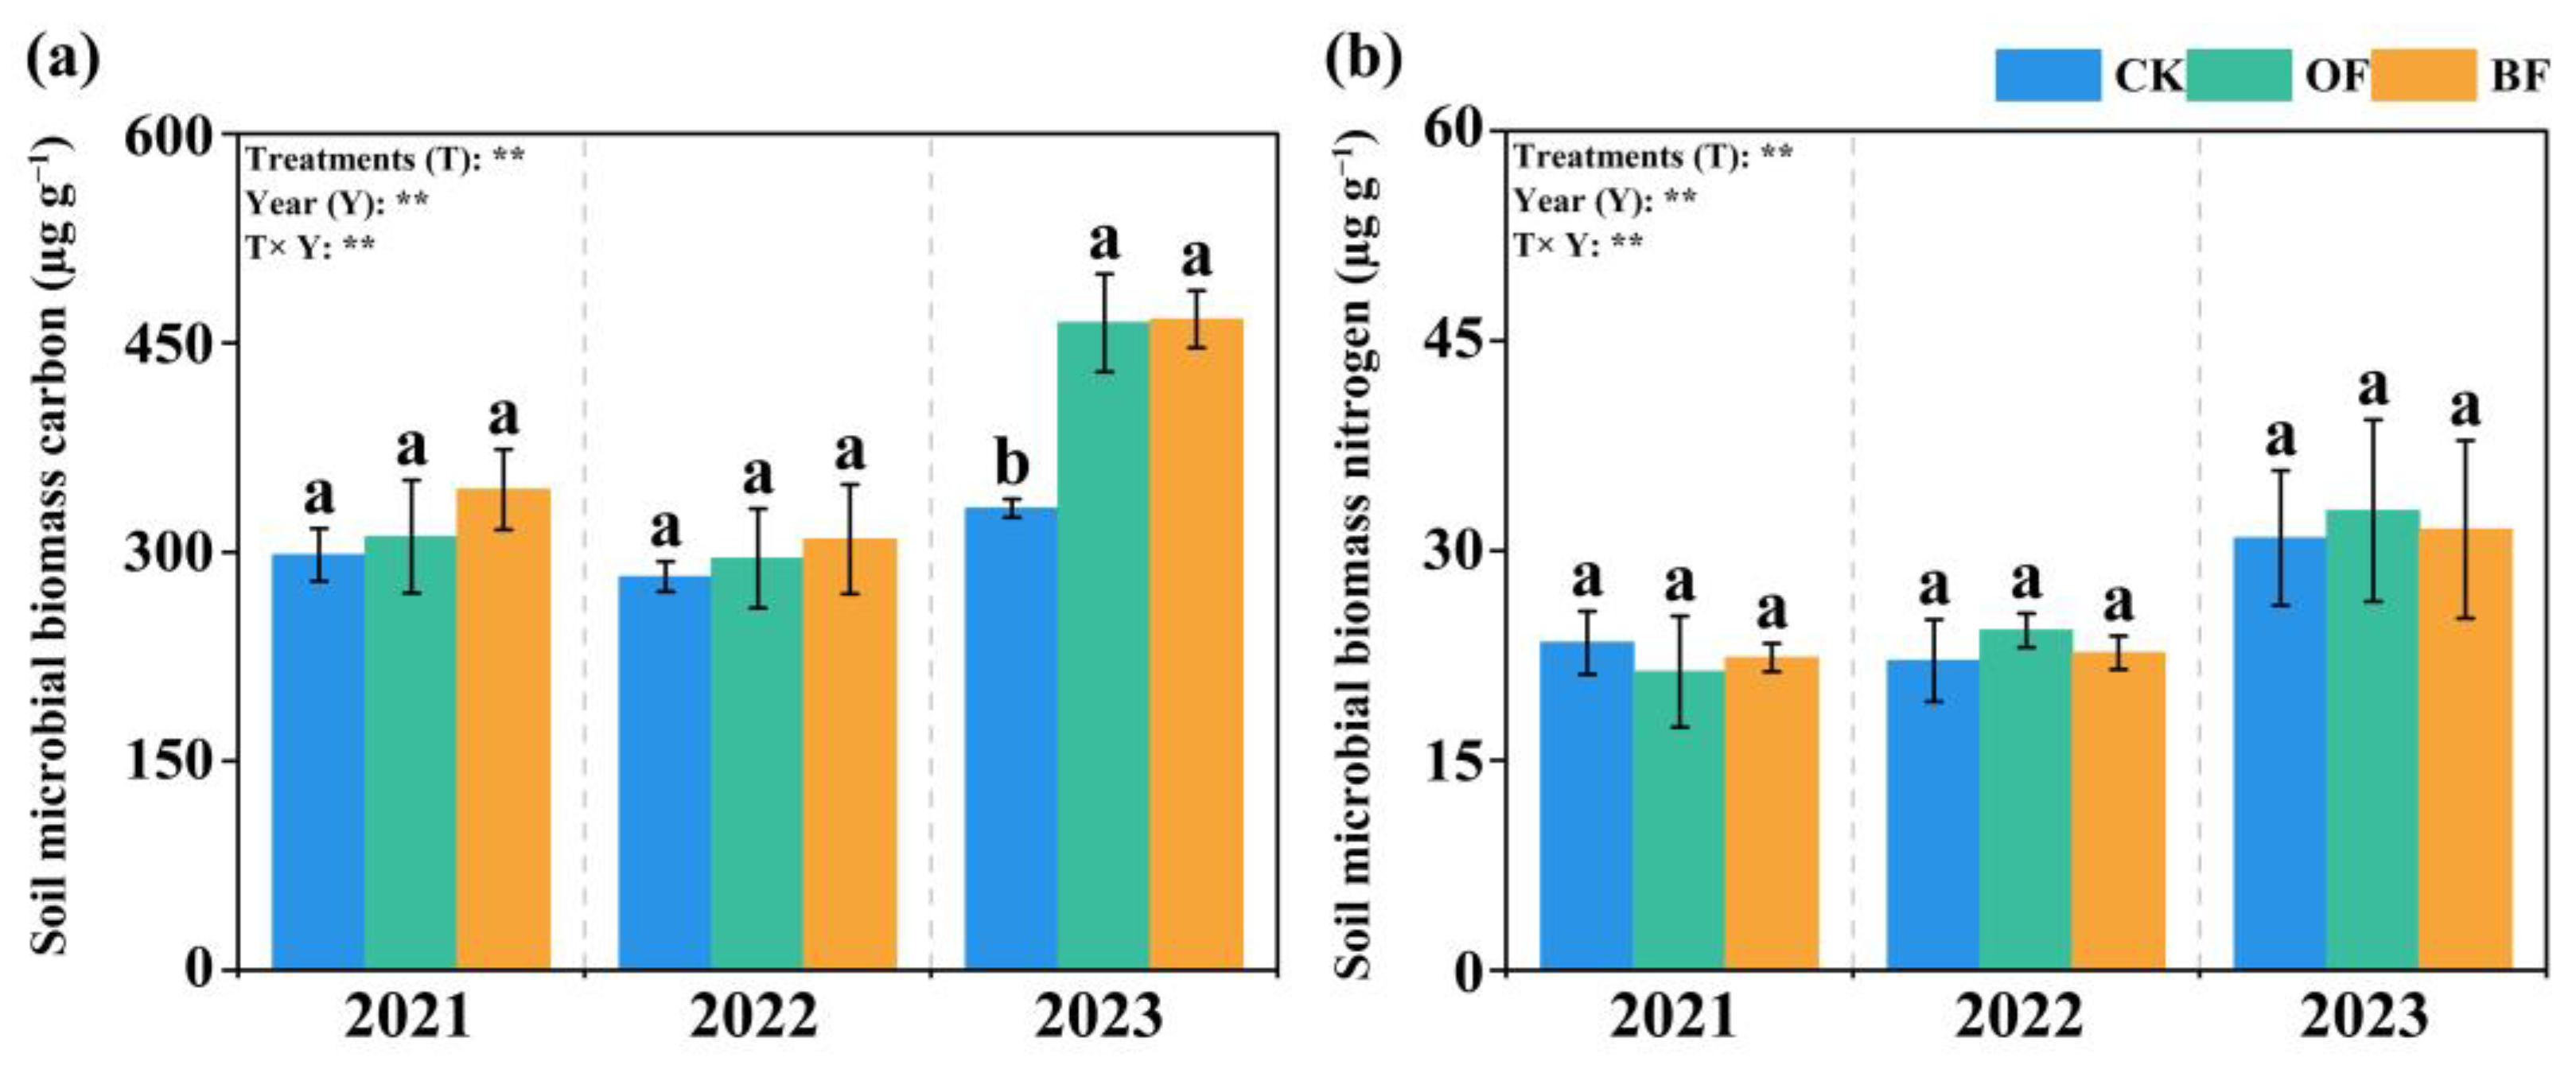
Organic fertilizer (OF and BF) application increased the soil microbial biomass C in 2023 (Figure 4). Specifically, the BF and OF treatments showed 40.93% and 40.15% higher MBC contents when compared to CK in 2023. Although no statistically significant differences in MBN were observed between treatments during 2022–2023, the pattern OF > BF > CK was consistently maintained throughout the experimental period.

3.6. Effect of Different Fertilization on Rice Growth

Rice growth was negatively affected by organic fertilizer substitution. As shown in Figure 5, the rice physiological indices as indicated by SPAD values, were inhibited in the OF and BF treatments across the rice growth stages. The SPAD value reflects the chlorophyll content of the plant leaf, which is mainly determined by soil N availability. In coordination with the results of Figure 1, showing that organic fertilizer resulted in lower soil N availability, organic fertilizer application generally decreased the SPAD value (Figure 5a). Due to the low N availability, the rice tillers and plant height were also inhibited by organic fertilizer application in both years of the experiment.
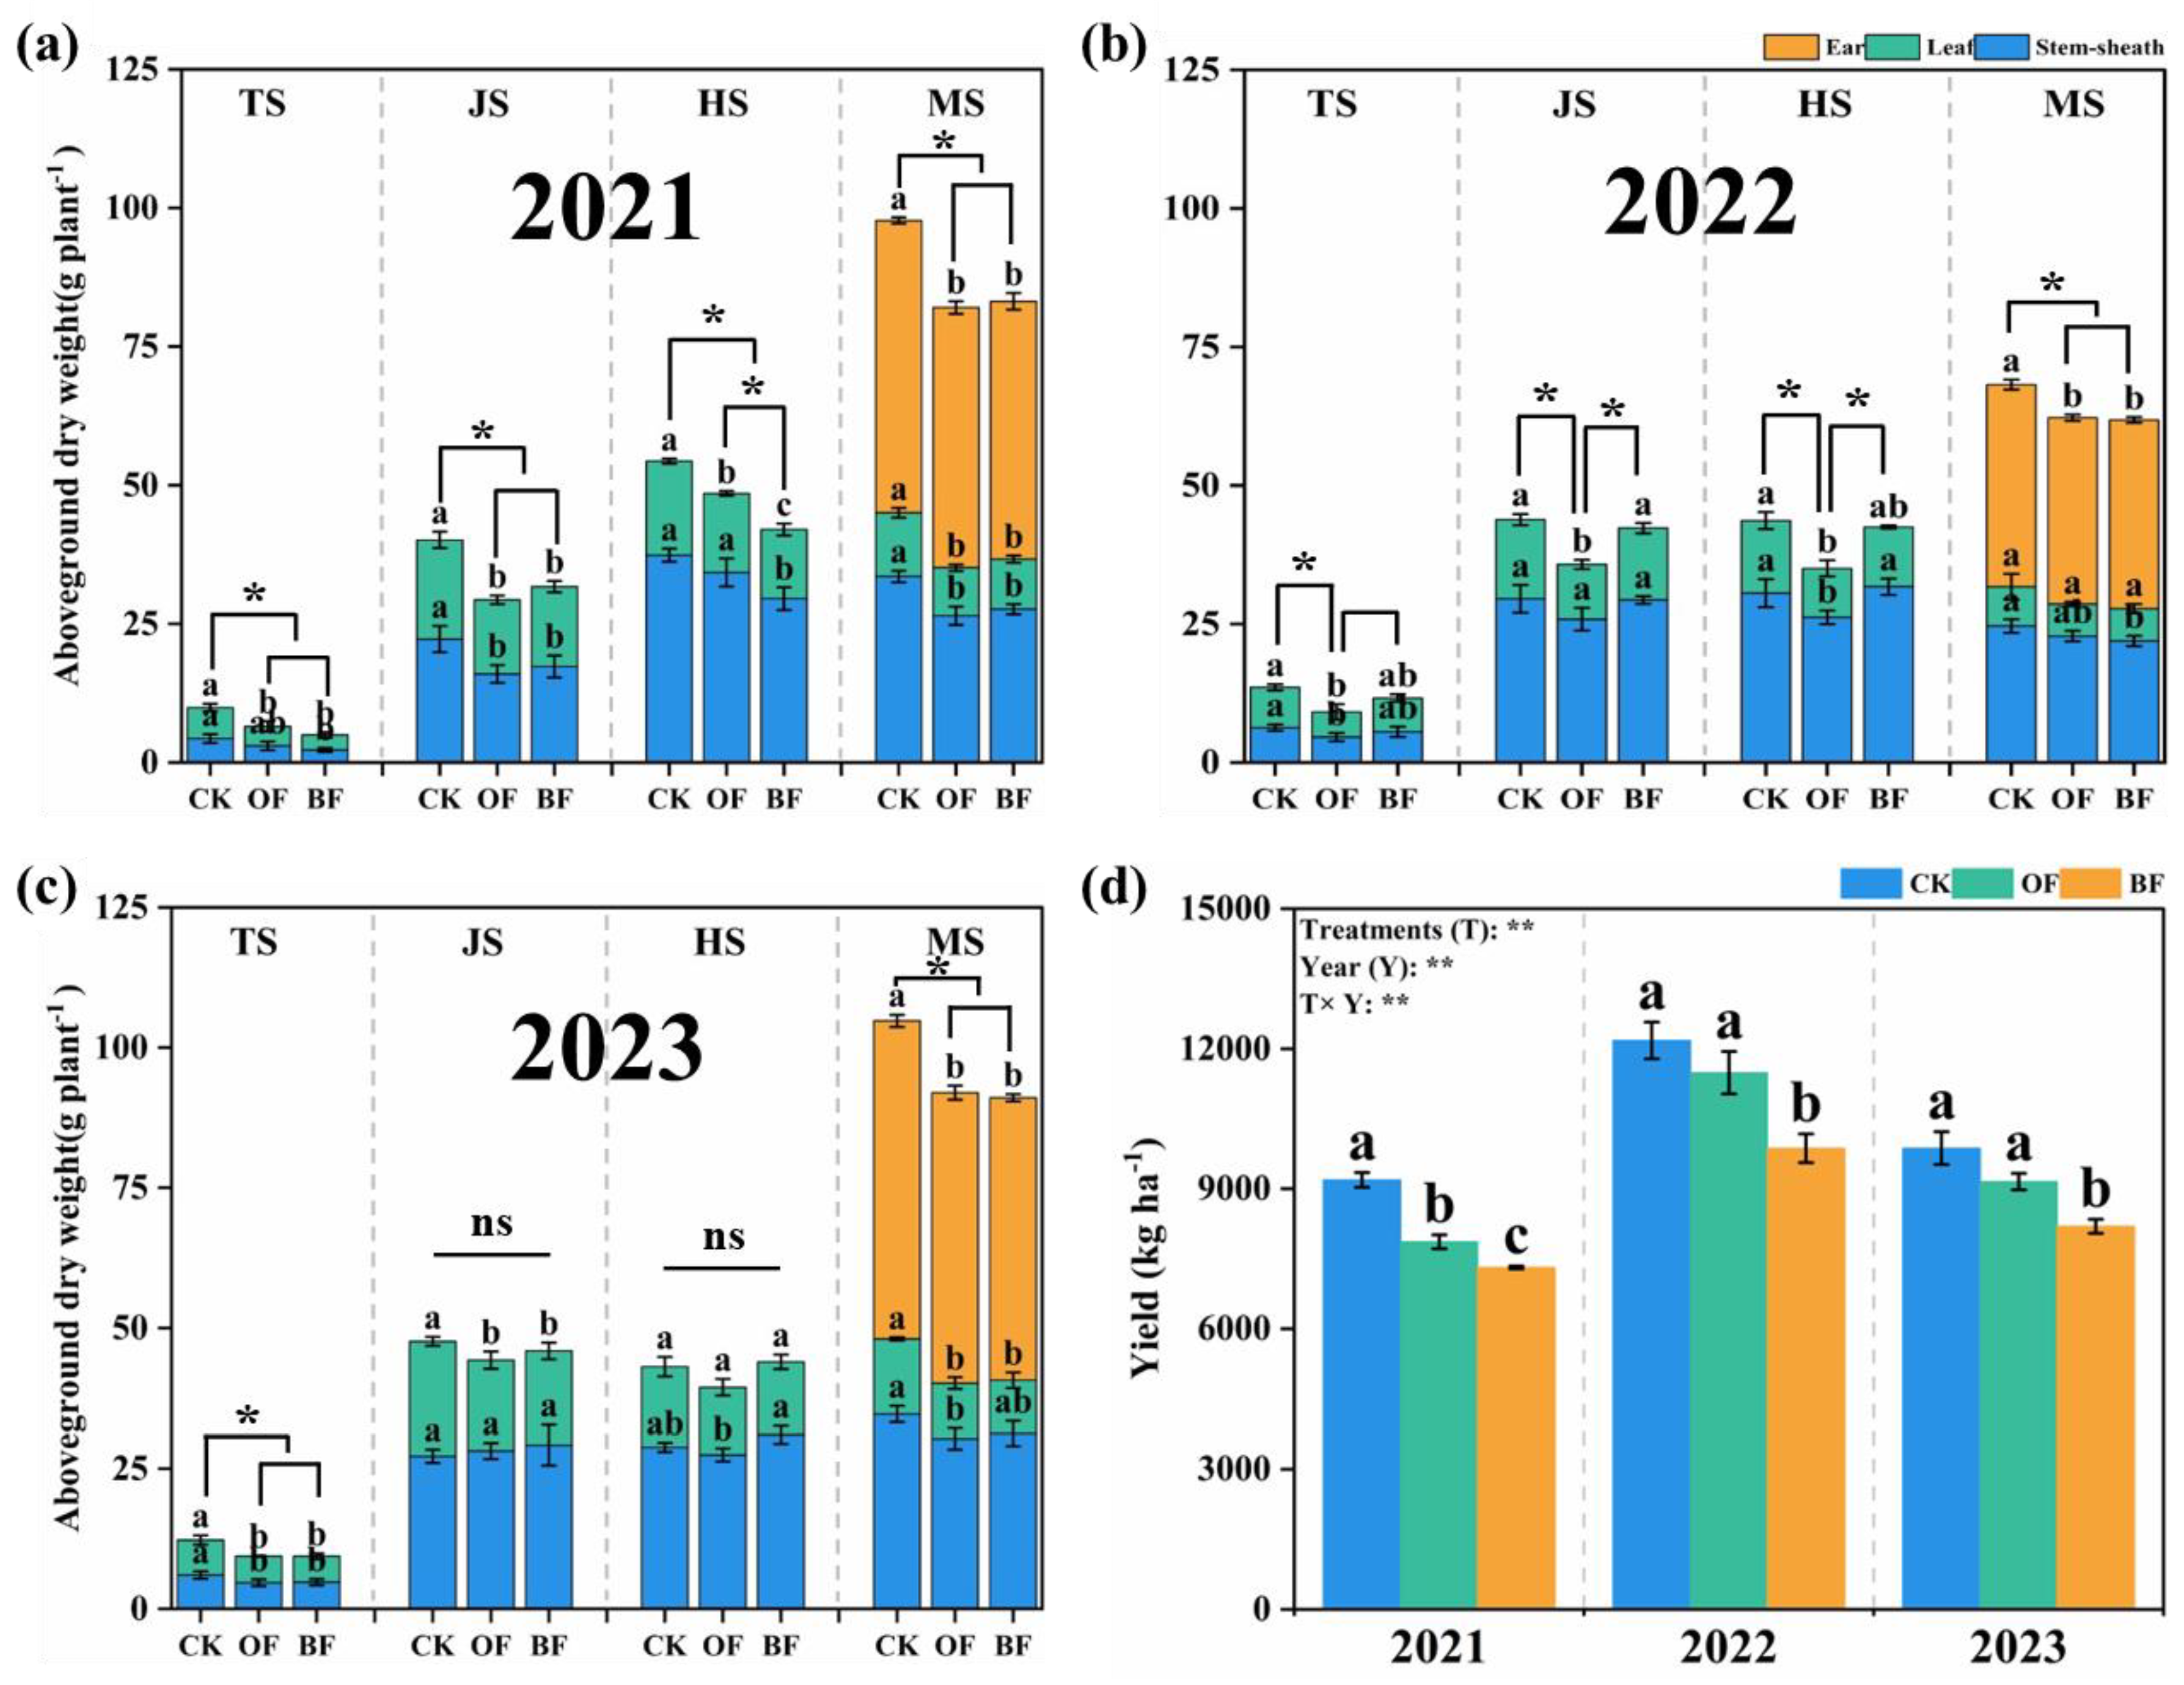
The amounts of rice above ground dry matters including panicle, leaf, and stem, in the OF and BF treatments, were significantly lower than those in CK throughout the four growth stages in both years of the experiment (Figure 6a–c). At the maturation stage, CK exhibited a significantly higher total dry weight than the organic fertilizer treatments; specifically, its dry weight was 7.52% higher than those for OF and BF in 2021, 9.56% and 10.28% higher than those for OF and BF in 2022, and 13.94% and 15.07% higher than OF and BF in 2023, respectively. As a result, the rice yield was also decreased in the organic fertilizer treatments. In particular, the BF treatment showed decreased of 1876.45, 2312.58, and 1672.79 kg ha−1 in 2021, 2022, and 2023, respectively, when compared to CK (Figure 6d).

4. Discussion

4.1. Organic Substitution Decreased Soil Gross N Turnover Rate and N Availability

Fertilizer N is an important supplement for soil N, and it determines soil N availability in the short-term after fertilization. In the present study, we found that organic fertilizer substitution decreased both the gross and net soil N turnover rates and the soil available N concentration during rice growth (Figure 1) when compared to the chemical fertilizer treatment. This was primarily attributed to the lower amount of N supplied in the OF and BF treatments. Specifically, when identical rates of total N, P, and K were applied, 180 kg N ha−1 was received as the basal fertilizer in CK the treatment, whereas only 79.05 and 72.68 kg N ha−1 were supplied annually by the organic fertilizer substitution treatments (OF and BF) annually. Consequently, the limited N supplement resulted in lower soil NH4+–N and NO3–N contents in OF and BF during rice growth (Figure 1). These results indicated that although receiving equivalent amounts of topdressing N were received, 100% substitution of base fertilizer with organic fertilizer decreased the soil N availability, ultimately inhibiting rice growth and dry matter accumulation (Figure 5 and Figure 6).
Besides the reasons mentioned above, the differences in release characteristics between chemical and organic fertilizers also affected soil N availability. Typically, the N in chemical fertilizers is in forms that are easily absorbed, such as urea, ammonium, and nitrate-N fertilizer [34,35], which is conducive to rice assimilation [36,37]. In contrast, the N in organic fertilizers is mainly in organic form (such as proteins, amino acids, and polypeptides); this N is unavailable to plants until it is mineralized into inorganic forms by soil microorganisms [38]. Thus, a “delay effect” results in lower amounts of inorganic N in BF and OF soils, which was lower than in chemically fertilized soil, especially during the early stage of rice growth.
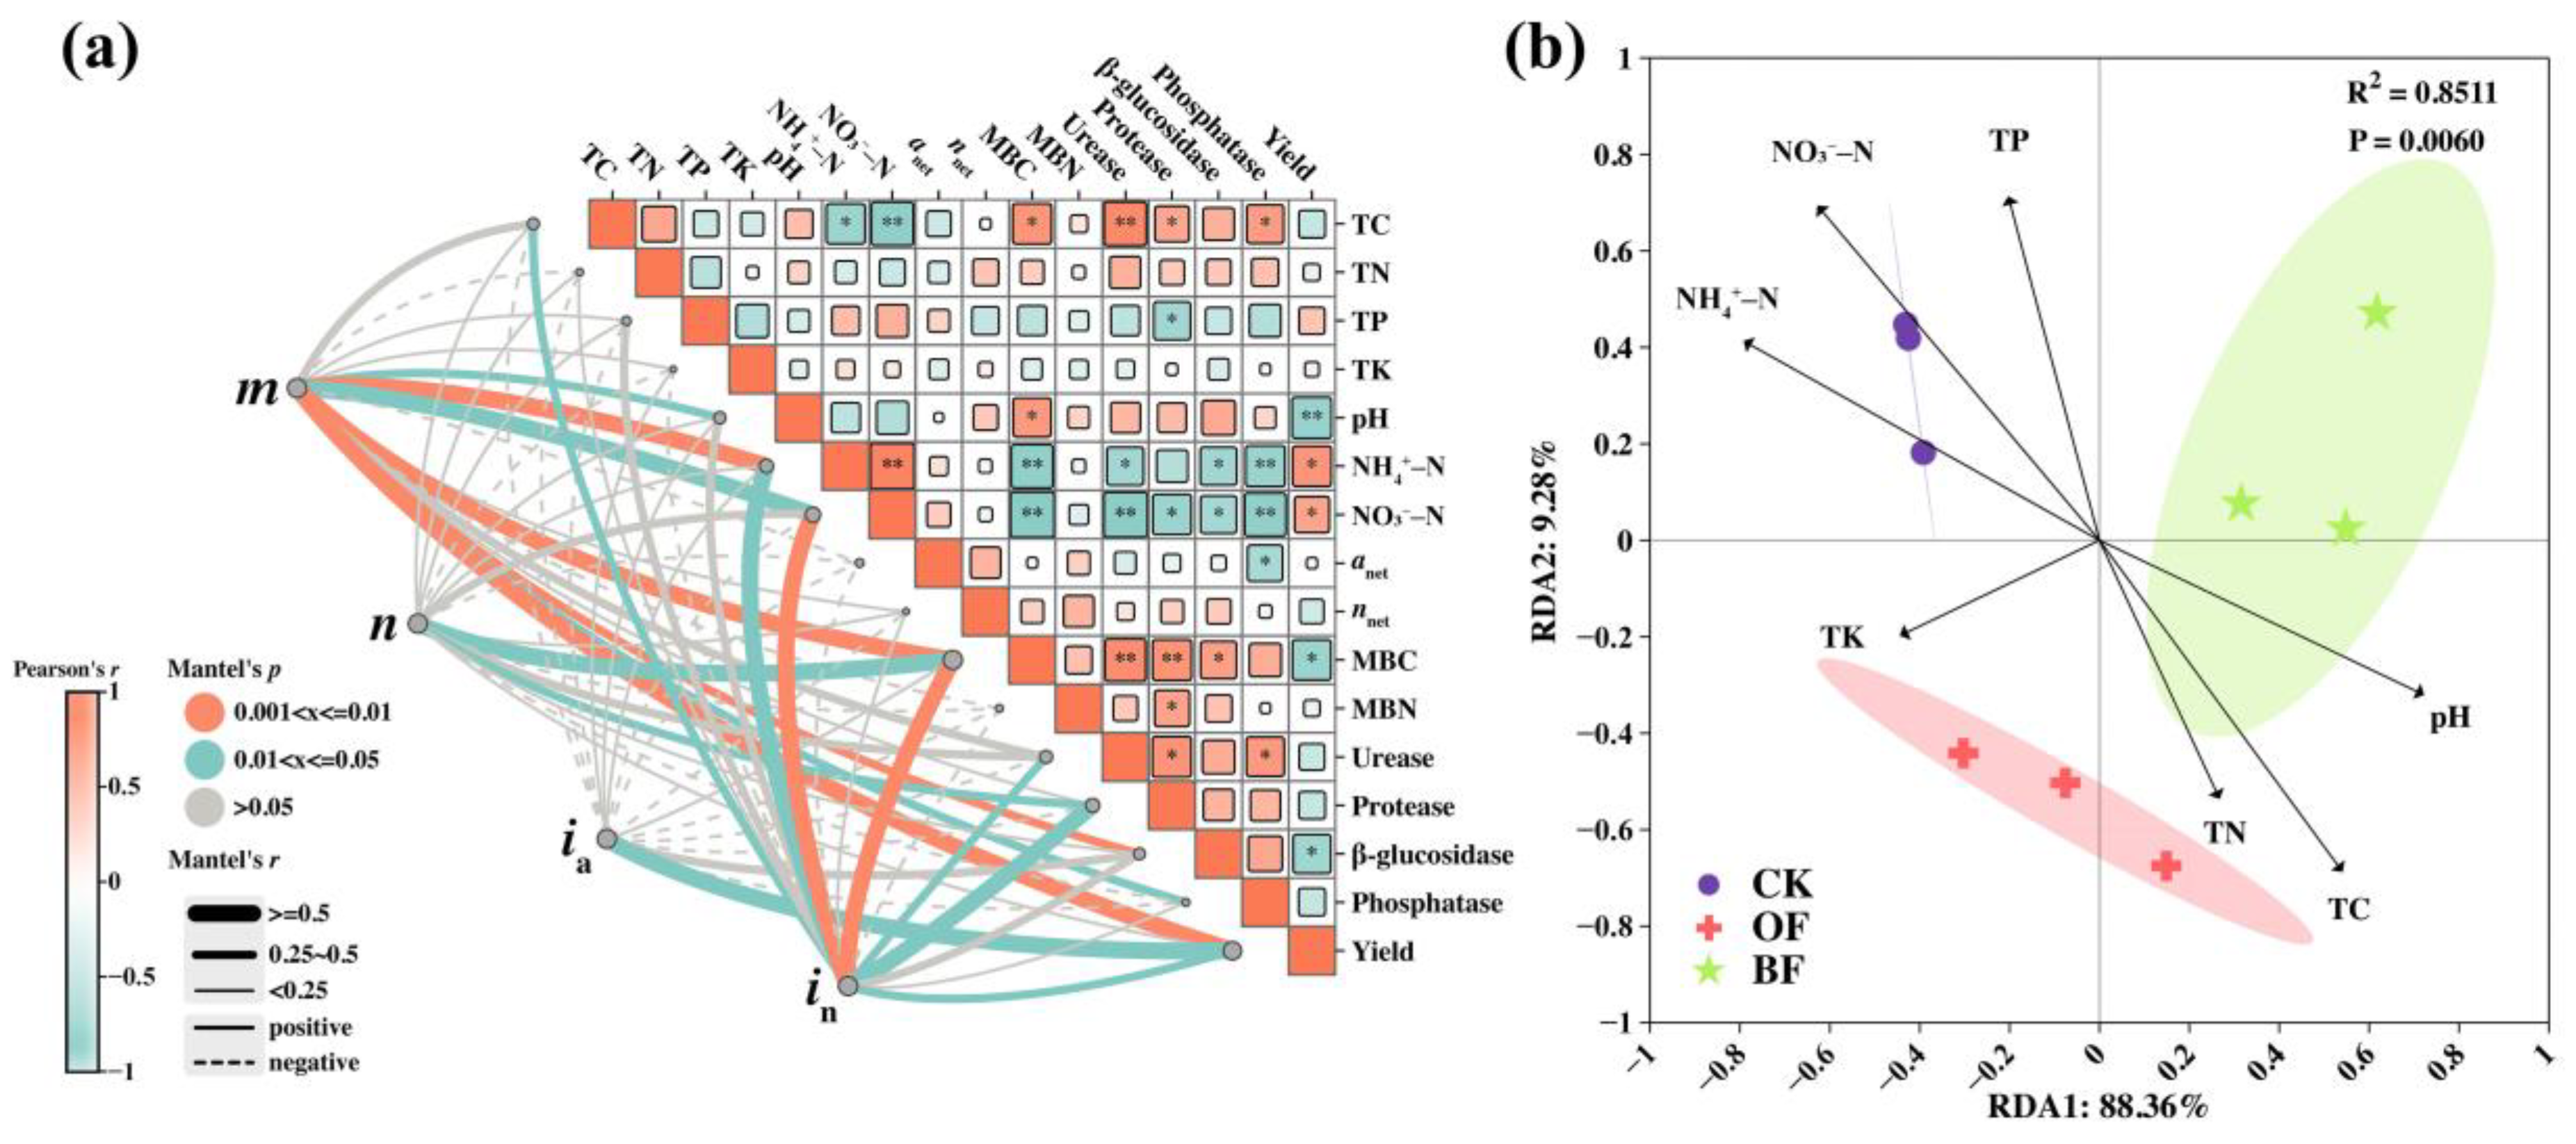
The soil N turnover process that determines N availability depends strongly on soil properties, such as pH, organic matter, and nutrient contents. Usually, the net and gross N turnover rates are used to characterize soil N transformations [39]. The gross N turnover rates are more able to provide insight into information on the actual dynamics of the soil N cycle. Although some results have shown that organic fertilizer application can increase soil gross N mineralization rates (m) by supplying more organic N into soil [40,41], in the present study, the gross N mineralization rates (m) were significantly decreased by organic fertilizer application, and the value of m was much lower in the BF treatment (Figure 2). As mentioned above, this could potentially be attributed to the amount of N supplied by organic fertilizer being lower than that supplied by chemical fertilizer, limiting the soil N transformation process [42]. Besides utilization by plants or loss to the environment, N immobilization is an important pathway for fertilizer N, referring to the process whereby soil microbes assimilate inorganic N into their cellular biomass. The microbial biomass N (MBN) is subsequently incorporated into soil organic N [43]. However, unlike the organic-matter-derived N, MBN is part of the soil labile N pool, and is highly mineralizable [44]. Consequently, the limited inorganic N supplement in the OF and BF treatments restricted the formation of MBN readily available for mineralization, further decreasing the gross N mineralization rate (Figure 2). The strongly positive correlation between m and the soil MBC content in Figure 7a supports this inference. As the soil N transformation process is mainly driven by soil microorganisms [45], decreased soil N contents and MBN also inhibit the gross N nitrification and immobilization rates.
Microbial extracellular enzymes serve as critical drivers of organic matter decomposition [46]. Our findings revealed that the organic fertilizer treatments (OF and BF) significantly enhanced enzyme activities (Figure 3). This agrees with the results of previous studies showing that organic fertilizer input generally stimulates soil enzyme production through the supply of organic nutrients and the activation of microbial communities [47,48,49]. Redundancy analysis (RDA) further demonstrated that N transformation in organic-amended soils (OF and BF) was predominantly influenced by TC and TN contents (Figure 7b), indicating that organic amendments stimulated the growth of soil microorganisms by supplying labile C and N substrates, thereby increasing extracellular enzyme activities and MBC [50]. Both TN and MBN remained relatively stable during the three years of fertilization (Table 2 and Figure 4b), indicating that the soil N pool tended to remain stable in contrast to the substantial C inputs; thus the microbial acquisition of C and N resources became imbalanced. Under such N limitations, the microbial communities likely utilized N more tightly, resulting in reduced release into the mineral N pool [51].
In this study, the gross N mineralization rate in the BF treatment was significantly lower than that in the OF treatment (Figure 2). This is primarily ascribed to the fact that 20% of the organic fertilizer was replaced by biochar in the biochar-based fertilizer (BF). Organic C and N are highly biochemically stable due to the biochar’s aromatic structure, which exhibits slower mineralization kinetics compared to natural organic matter [52,53], thus inhibiting the soil mineralization potential. According to Xie et al. [54], only 2% of biochar-N is mineralized one year after soil incorporation. In addition, the decreased N mineralization rate could also be explained by biochar’s protective effect on organic N molecules through its pore structure or adsorption ability [55]. Previous researchers illustrated that the porous structure and surface functional groups confined biochar to adsorbing low-molecular-weight organic N compounds, such as amino acids and peptides [56]. This reduced the concentration of enzymatically accessible substrates, further leading to a 10.42% reduction in neutral protease activity in BF compared to OF (Figure 3). Meanwhile, biochar exhibits significant adsorption capacity for NH4+ [57], resulting in a 6.97% reduction in the total NH4+–N content in the BF treatment relative to the OF treatment (Table S2). Then the decreased NH4+–N concentration then inhibited the soil gross N nitrification rate. These findings align with those of Nguyen et al. [58], who also found that the biochar application decreased inorganic N availability. The limited availability of inorganic N not only constrained microbial activity but also suppressed gross NH4+–N immobilization rate (Figure 2). However, a seven-year field experiment [59] demonstrated that biochar application can effectively reduce soil nitrogen loss, likely due to its increased density of carboxyl and hydroxyl functional groups that enhance nutrient retention and sustain soil fertility [60].

4.2. Decline in Nitrogen Content Directly Reduces Rice Yield

Organic fertilizer application decreased rice dry matter accumulation throughout this three-year study (Figure 6). In contrast, Lan et al. [61] reported that after 33 years of fertilization, significant increases in rice yield were observed under NPK with partial manure substitution, particularly when the substitution rate was below 75%. The difference suggests that moderate substitution levels can enhance soil organic C, microbial biomass, and nutrient availability, thereby supporting crop growth [62]. The inhibited rice growth under the organic fertilization treatments is primarily ascribed to the temporal mismatch between the soil N availability and rice N requirements. In accordance with our findings, wei et al. [63] also found that short-term organic amendments failed to enhance crop yields, since the organic N in organic fertilizer requires further mineralization into inorganic forms before plant utilization. Therefore, the mineralization process exhibited pronounced delayed-release characteristics, which affected nutrient availability for crop utilization (Figure 1). Consequently, N deficiency occurred due to insufficient N release from the OF treatment during the critical tillering-to-jointing stages (vegetative growth phase). This limitation impaired key growth parameters including tiller formation, dry matter accumulation, and SPAD values (Figure 5) [64,65], resulting in lower yields in OF and BF than in CK (Figure 7). Correlation analysis (Figure 7a) revealed a significant positive relationship (p < 0.05) between the rice yield and the gross N mineralization rate and inorganic N content (NH4+–N and NO3–N), confirming the critical role of sufficient N supply in yield formation.
Similarly to the OF treatment, the biochar-based organic fertilizer amendment also failed to sustain rice yields at the CK level. This aligns with the findings by Chen et al. [66], who reported that rice grain yield was not affected by biochar in an initial two-year period. Notably, in their study, yields increased by 12.3% over the longer term, suggesting that the yield-enhancing effects of biochar may require an extended period to manifest. Considering the potential reasons, the effect could be attribute to the available N in BF soil being even lower than that in OF soil, further proved by that the rice yields showing a significant positive correlation with soil mineral N levels (Figure 7). This N deficiency directly manifested through decreased chlorophyll contents (as indicated by SPAD values) and reduced tiller number at the tillering stage, consequently constraining yield the potential.

5. Conclusions

This three-year field study showed that 100% substitution of basal fertilizer with organic fertilizer increased the soil TC content, and enhanced microbial proliferation and enzyme activity. However, due to its limited N supplementation, organic fertilizer and biochar-based organic fertilizer substitution decreased the soil gross N transformation rate and soil N availability compared to chemical fertilizer treatments, thereby inhibiting rice growth during the early stages. Despite the application of equivalent topdressing, rice dry matter accumulation remained insufficient during later growth stages, ultimately resulting in significant rice yield reductions. Therefore, complete substitution of base fertilizer with organic amendments appears to be infeasible under the current conditions of N supply, whereas the combined application of organic and inorganic fertilizers may represent a viable strategy to optimize rice productivity and soil health. Additionally, our findings indicate that while the agronomic benefits were limited, organic fertilizers had a positive effect on increasing the soil organic carbon content, suggesting that these amendments may be particularly beneficial in soils with low organic matter contents. Future research should focus on identifying appropriate substitution ratios of organic for chemical fertilizers and developing slow-release or nutrient-enriched formulations to better meet crop N demands. In the longer term, it is also essential to evaluate the cumulative effects of biochar and other organic amendments on soil fertility and rice productivity.

Supplementary Materials

The following supporting information can be downloaded at: https://www.mdpi.com/article/10.3390/agronomy15092242/s1, Table S1: Actual amounts of N, P, and K applied in each treatment (basal + topdressing); Table S2: Average soil inorganic N concentration from 2021–2023; Table S3: Average soil enzyme activity from 2021–2023.

Author Contributions

J.L.: Investigation, Data curation, Writing—Original draft; M.Z.: Investigation, Methodology; M.P.: Investigation; H.Y.: Software and Visualization; S.S.: Investigation; Q.S.: Investigation; T.H.: Funding acquisition. J.M.: Funding acquisition; Z.L.: Supervision, Writing—Reviewing and Editing, Funding acquisition. W.C.: Supervision. All authors have read and agreed to the published version of the manuscript.

Funding

This work was supported by the National Natural Science Foundation of China (U23A2052; 42477361; 42007081); the earmarked fund for the China Agriculture Research System (CARS-01-51); the National Key Research and Development Program of China (2024YFD150150; 2023YFD150050).

Data Availability Statement

The data that support the findings of this study are available from the corresponding author upon reasonable request.

Conflicts of Interest

The authors declare no conflicts of interest.

References

  1. Khoshnevisan, B.; Rafiee, S.; Pan, J.; Zhang, Y.; Liu, H. A multi-criteria evolutionary-based algorithm as a regional scale decision support system to optimize nitrogen consumption rate; a case study in North China plain. J. Clean. Prod. 2020, 256, 120213. [Google Scholar] [CrossRef]
  2. Ren, H.; Han, K.; Liu, Y.; Zhao, Y.; Zhang, L.; He, Q.; Li, Z.; Zhang, J.; Liu, P.; Wang, H.; et al. Improving smallholder farmers’ maize yields and economic benefits under sustainable crop intensification in the North China Plain. Sci. Total Environ. 2021, 763, 143035. [Google Scholar] [CrossRef] [PubMed]
  3. Zhao, C.; Huang, H.; Qian, Z.; Jiang, H.; Liu, G.; Xu, K.; Hu, Y.; Dai, Q.; Huo, Z. Effect of side deep placement of nitrogen on yield and nitrogen use efficiency of single season late japonica rice. J. Integr. Agr. 2021, 20, 1487–1502. [Google Scholar] [CrossRef]
  4. He, Z.; Ding, B.; Pei, S.; Cao, H.; Liang, J.; Li, Z. The impact of organic fertilizer replacement on greenhouse gas emissions and its influencing factors. Sci. Total Environ. 2023, 905, 166917. [Google Scholar] [CrossRef]
  5. Jin, N.; Jin, L.; Wang, S.; Li, J.; Liu, F.; Liu, Z.; Luo, S.; Wu, Y.; Lyu, J.; Yu, J. Reduced chemical fertilizer combined with bio-organic fertilizer affects the soil microbial community and yield and quality of lettuce. Front. Microbiol. 2022, 13, 863325. [Google Scholar] [CrossRef]
  6. Geisseler, D.; Linquist, B.A.; Lazicki, P.A. Effect of fertilization on soil microorganisms in paddy rice systems—A meta-analysis. Soil Biol. Biochem. 2017, 115, 452–460. [Google Scholar] [CrossRef]
  7. Hansen, S.; Berland Frøseth, R.; Stenberg, M.; Stalenga, J.; Olesen, J.E.; Krauss, M.; Radzikowski, P.; Doltra, J.; Nadeem, S.; Torp, T.; et al. Reviews and syntheses: Review of causes and sources of N2O emissions and NO3 leaching from organic arable crop rotations. Biogeosciences 2019, 16, 2795–2819. [Google Scholar] [CrossRef]
  8. Salam, M.A.; Sarker, M.N.I.; Sharmin, S. Do organic fertilizer impact on yield and efficiency of rice farms? Empirical evidence from Bangladesh. Heliyon 2021, 7, e07731. [Google Scholar] [CrossRef]
  9. Zhang, F.; Chen, M.; Xing, Y.; Han, J.; Wang, X. Reduction of nitrogen fertilizer and simultaneously application of organic fertilizer optimizes yield, water productivity and nitrogen metabolism of spring maize by improving soil properties in the Loess Plateau of China. J. Agric. Food Res. 2025, 19, 101634. [Google Scholar] [CrossRef]
  10. Guan, G.; Tu, S.; Yang, J.; Zhang, J.; Yang, L. A field study on effects of nitrogen fertilization modes on nutrient uptake, crop yield and soil biological properties in rice-wheat rotation system. Agr. Sci. China 2011, 10, 1254–1261. [Google Scholar] [CrossRef]
  11. Wang, H.; Zheng, H.; Jiang, Z.; Dai, Y.; Liu, G.; Chen, L.; Luo, X.; Liu, M.; Wang, Z. Efficacies of biochar and biochar-based amendment on vegetable yield and nitrogen utilization in four consecutive planting seasons. Sci. Total Environ. 2017, 593–594, 124–133. [Google Scholar] [CrossRef]
  12. Xia, F.; Zhang, Z.; Zhang, Q.; Huang, H.; Zhao, X. Life cycle assessment of greenhouse gas emissions for various feedstocks-based biochars as soil amendment. Sci. Total Environ. 2024, 911, 168734. [Google Scholar] [CrossRef]
  13. Lehmann, J. A handful of carbon. Nature 2007, 447, 143–144. [Google Scholar] [CrossRef]
  14. Ding, Y.; Liu, Y.; Liu, S.; Li, Z.; Tan, X.; Huang, X.; Zeng, G.; Zhou, L.; Zheng, B. Biochar to improve soil fertility. A review. Agron. Sustain. Dev. 2016, 36, 36. [Google Scholar] [CrossRef]
  15. Zhang, L.; Jing, Y.; Chen, C.; Xiang, Y.; Rezaei Rashti, M.; Li, Y.; Deng, Q.; Zhang, R. Effects of biochar application on soil nitrogen transformation, microbial functional genes, enzyme activity, and plant nitrogen uptake: A meta-analysis of field studies. GCB Bioenergy 2021, 13, 1859–1873. [Google Scholar] [CrossRef]
  16. Wang, J.; Sun, L.; Sun, Y.; Yang, S.; Qin, Q.; Xue, Y. Integrated enzyme activities and untargeted metabolome to reveal the mechanism that allow long-term biochar-based fertilizer substitution improves soil quality and maize yield. Environ. Res. 2025, 270, 120935. [Google Scholar] [CrossRef]
  17. Gu, W.; Wang, Y.; Sun, Y.; Liu, Z.; Wang, W.; Wu, D.; Zhang, Y.; Sun, W.; Wang, X.; Feng, Z.; et al. Assessing the formation and stability of paddy soil aggregate driven by organic carbon and Fe/Al oxides in rice straw cyclic utilization strategies: Insight from a six-year field trial. Sci. Total Environ. 2024, 951, 175607. [Google Scholar] [CrossRef]
  18. Nguyen, T.T.N.; Wallace, H.M.; Xu, C.-Y.; Xu, Z.; Farrar, M.B.; Joseph, S.; Van Zwieten, L.; Bai, S.H. Short-term effects of organo-mineral biochar and organic fertilisers on nitrogen cycling, plant photosynthesis, and nitrogen use efficiency. J. Soil Sediment 2017, 17, 2763–2774. [Google Scholar] [CrossRef]
  19. Gelardi, D.L.; Lazicki, P.A.; Rath, D.; Leinfelder-Miles, M.M.; Scow, K.M.; Geisseler, D.J.; Parikh, S.J. Three-year field trials with seven biochars reveal minor changes in soil chemical properties but no impact on crop yield. Field Crop Res. 2025, 325, 109807. [Google Scholar] [CrossRef]
  20. Gao, S.; DeLuca, T.H.; Cleveland, C.C. Biochar additions alter phosphorus and nitrogen availability in agricultural ecosystems: A meta-analysis. Sci. Total Environ. 2019, 654, 463–472. [Google Scholar] [CrossRef] [PubMed]
  21. Craswell, E.T.; Chalk, P.M.; Kaudal, B.B. Role of 15N in tracing biologically driven nitrogen dynamics in soils amended with biochar: A review. Soil Biol. Biochem. 2021, 162, 108416. [Google Scholar] [CrossRef]
  22. Zhang, H.; Zhang, J.; Yang, J. Improving nitrogen use efficiency of rice crop through an optimized root system and agronomic practices. Crop Environ. 2023, 2, 192–201. [Google Scholar] [CrossRef]
  23. Barraclough, D. The use of mean pool abundances to interpret 15N tracer experiments: I. Theory. Plant Soil 1991, 131, 89–96. [Google Scholar] [CrossRef]
  24. Braun, J.; Mooshammer, M.; Wanek, W.; Prommer, J.; Walker, T.W.N.; Rütting, T.; Richter, A. Full 15N tracer accounting to revisit major assumptions of 15N isotope pool dilution approaches for gross nitrogen mineralization. Soil Biol. Biochem. 2018, 117, 16–26. [Google Scholar] [CrossRef]
  25. National Agricultural Technology Extension Service Center. Specification for Soil Analysis Techniques; China Agricultural Press: Beijing, China, 2006. [Google Scholar]
  26. Bao, S. Soil Agricultural Chemical Analysis, 3rd ed.; China Agricultural Press: Beijing, China, 2000. [Google Scholar]
  27. Carter, M.R.; Gregorich, E.G. Soil Sampling and Methods of Analysis, 2nd ed.; CRC Press: Boca Raton, FL, USA, 2007. [Google Scholar]
  28. Zhao, R.; Liu, J.; Xu, N.; He, T.; Meng, J.; Liu, Z. Urea hydrolysis in different farmland soils as affected by long-term biochar application. Front. Environ. Sci. 2022, 10, 950482. [Google Scholar] [CrossRef]
  29. Cao, Y.; Zhang, J.; Wen, T. Stable Isotope Tracing Technology and Mass Spectrometry Analysis: Application in Soil, Ecology and Environment Research; Science Press: Beijing, China, 2018. [Google Scholar]
  30. Zhang, P.; Wen, T.; Zhang, J.; Cai, Z. On improving the diffusion method for determination of δ15N–NH4+ and δ15N–NO3- in soil extracts. Acta Pedol. Sin. 2017, 54, 948–957. [Google Scholar] [CrossRef]
  31. Liu, Z.; Xu, N.; Cao, T.; An, Z.; Yang, X.; He, T.; Yang, T.; Meng, J. Maize straw is more effective than maize straw biochar at improving soil N availability and gross N transformation rate. Eur. J. Soil Sci. 2023, 74, e13403. [Google Scholar] [CrossRef]
  32. Kirkham, D.; Bartholomew, W.V. Equations for following nutrient transformations in soil, utilizing tracer data. Soil Sci. Soc. Am. J. 1954, 18, 33–34. [Google Scholar] [CrossRef]
  33. Hart, S.C.; Nason, G.E.; Myrold, D.D.; Perry, D.A. Dynamics of gross nitrogen transformations in an old-growth forest: The carbon connection. Ecology 1994, 75, 880–891. [Google Scholar] [CrossRef]
  34. Zhou, L.; Zhao, P.; Chi, Y.; Wang, D.; Wang, P.; Liu, N.; Cai, D.; Wu, Z.; Zhong, N. Controlling the hydrolysis and loss of nitrogen fertilizer (urea) by using a nanocomposite favors plant growth. ChemSusChem 2017, 10, 2068–2079. [Google Scholar] [CrossRef] [PubMed]
  35. Nasraoui-Hajaji, A.; Gouia, H. Photosynthesis sensitivity to NH4+–N change with nitrogen fertilizer type. Plant Soil Environ. 2014, 60, 274–279. [Google Scholar] [CrossRef]
  36. Jiang, P.; Xie, X.; Huang, M.; Zhou, X.; Zhang, R.; Chen, J.; Wu, D.; Xia, B.; Xiong, H.; Xu, F.; et al. Characterizing N uptake and use efficiency in rice as influenced by environments. Plant Prod. Sci. 2016, 19, 96–104. [Google Scholar] [CrossRef]
  37. Atere, C.T.; Ge, T.; Zhu, Z.; Tong, C.; Jones, D.L.; Shibistova, O.; Guggenberger, G.; Wu, J. Rice rhizodeposition and carbon stabilisation in paddy soil are regulated via drying-rewetting cycles and nitrogen fertilisation. Biol. Fertil. Soils. 2017, 53, 407–417. [Google Scholar] [CrossRef]
  38. Jones, D.L.; Kemmitt, S.J.; Wright, D.; Cuttle, S.P.; Bol, R.; Edwards, A.C. Rapid intrinsic rates of amino acid biodegradation in soils are unaffected by agricultural management strategy. Soil Biol. Biochem. 2005, 37, 1267–1275. [Google Scholar] [CrossRef]
  39. Shaw, M.R.; Harte, J. Response of nitrogen cycling to simulated climate change: Differential responses along a subal pine ecotone. Global Change Biol. 2001, 7, 193–210. [Google Scholar] [CrossRef]
  40. Dai, S.; Wang, J.; Cheng, Y.; Zhang, J.; Cai, Z. Effects of long-term fertilization on soil gross N transformation rates and their implications. J. Integr. Agr. 2017, 16, 2863–2870. [Google Scholar] [CrossRef]
  41. Tan, C.; Du, Y.; Hu, X.; Li, X.; Wang, Y.; Yan, T.; Zhang, J.; Niu, W.; Gu, X.; Müller, C.; et al. Aerated irrigation improves soil gross nitrogen transformations in greenhouse tomato: Insights from a 15N-tracing study. Soil Till. Res. 2024, 242, 106140. [Google Scholar] [CrossRef]
  42. Yu, Q.; Ye, J.; Sun, W.; Lin, H.; Wang, Q.; Ma, J. Influences of organic material application on the physically separated soil organic carbon and nitrogen fractions in rice fields. J. Soil Sediment 2021, 21, 1079–1088. [Google Scholar] [CrossRef]
  43. Gao, Y.; Liang, A.; Zhang, Y.; McLaughlin, N.; Zhang, S.; Chen, X.; Zheng, H.; Fan, R. Dynamics of microbial biomass, nitrogen mineralization and crop uptake in response to placement of maize residue returned to Chinese Mollisols over the maize growing season. Atmosphere 2021, 12, 1166. [Google Scholar] [CrossRef]
  44. Yuan, C.; Wei, K.; Wang, J.; Wang, Y.; Zhu, B. Effect of different proportions of mineral nitrogen fertilizer substitutions with organic manure on soil phosphorus fractions distribution in an Entisol profile. J. Soil Sci. Plant Nutr. 2024, 24, 3238–3248. [Google Scholar] [CrossRef]
  45. Chen, B.; Liu, E.; Tian, Q.; Yan, C.; Zhang, Y. Soil nitrogen dynamics and crop residues. A review. Agron. Sustain. Dev. 2014, 34, 429–442. [Google Scholar] [CrossRef]
  46. Kheirfam, H.; Sadeghi, S.H.; Homaee, M.; Zarei Darki, B. Quality improvement of an erosion-prone soil through microbial enrichment. Soil Till. Res. 2017, 165, 230–238. [Google Scholar] [CrossRef]
  47. Li, Q.; Zhang, D.; Cheng, H.; Ren, L.; Jin, X.; Fang, W.; Yan, D.; Li, Y.; Wang, Q.; Cao, A. Organic fertilizers activate soil enzyme activities and promote the recovery of soil beneficial microorganisms after dazomet fumigation. J. Environ. Manag. 2022, 309, 114666. [Google Scholar] [CrossRef]
  48. Yan, B.; Zhang, Y.; Wang, Y.; Rong, X.; Peng, J.; Fei, J.; Luo, G. Biochar amendments combined with organic fertilizer improve maize productivity and mitigate nutrient loss by regulating the C–N–P stoichiometry of soil, microbiome, and enzymes. Chemosphere 2023, 324, 138293. [Google Scholar] [CrossRef]
  49. Zhang, X.; Dong, W.; Dai, X.; Schaeffer, S.; Yang, F.; Radosevich, M.; Xu, L.; Liu, X.; Sun, X. Responses of absolute and specific soil enzyme activities to long term additions of organic and mineral fertilizer. Sci. Total Environ. 2015, 536, 59–67. [Google Scholar] [CrossRef]
  50. Liu, Q.; Zhu, Z.; Abdalla, K.; Ge, T.; Wu, X.; Kuzyakov, Y.; Pausch, J. Microbial response to long-term fertilization of paddy soils: Apparent and real priming effects. Geoderma 2024, 445, 116884. [Google Scholar] [CrossRef]
  51. Yang, J.; Wang, Z.; Liu, Z.; Chang, Q.; Wang, B.; Zhang, Y.; Bai, E. Intensified Aridity Hinders Soil Microbes From Improving Their Nitrogen Use Efficiency. Global Change Biol. 2025, 31, e70453. [Google Scholar] [CrossRef]
  52. Chen, W.; Meng, J.; Han, X.; Lan, Y.; Zhang, W. Past, present, and future of biochar. Biochar 2019, 1, 75–87. [Google Scholar] [CrossRef]
  53. Lehmann, J.; Rillig, M.C.; Thies, J.; Masiello, C.A.; Hockaday, W.C.; Crowley, D. Biochar effects on soil biota—A review. Soil Biol. Biochem. 2011, 43, 1812–1836. [Google Scholar] [CrossRef]
  54. Xie, Z.; Xu, Y.; Liu, G.; Liu, Q.; Zhu, J.; Tu, C.; Amonette, J.E.; Cadisch, G.; Yong, J.W.H.; Hu, S. Impact of biochar application on nitrogen nutrition of rice, greenhouse-gas emissions and soil organic carbon dynamics in two paddy soils of China. Plant Soil. 2013, 370, 527–540. [Google Scholar] [CrossRef]
  55. Ghani Achakzai, A.; Buriro, A.H.; Gul, S.; Ziad, T.; Bano, A.; Ghori, S.A.; Ponya, Z.; Ismail, T. Evaluation of the effect of biochar-based organic fertilizer on the growth performance of fennel and cumin plants for three years. Environ. Pollut. Bioavail. 2022, 34, 374–384. [Google Scholar] [CrossRef]
  56. Wiedner, K.; Schimpf, C.; Polifka, S.; Glaser, B. Effect of biochar fertilizers on amino acid variability of Secale cereale and Lupinus angustifolius. Biochar 2019, 1, 187–201. [Google Scholar] [CrossRef]
  57. Zheng, Y.; Bolan, N.; Jenkins, S.N.; Mickan, B.S. Organic particles and high pH in food waste anaerobic digestate enhanced NH4+ adsorption on wood-derived biochar. Sci. Total Environ. 2024, 946, 174458. [Google Scholar] [CrossRef]
  58. Nguyen, T.T.N.; Xu, C.-Y.; Tahmasbian, I.; Che, R.; Xu, Z.; Zhou, X.; Wallace, H.M.; Bai, S.H. Effects of biochar on soil available inorganic nitrogen: A review and meta-analysis. Geoderma 2017, 288, 79–96. [Google Scholar] [CrossRef]
  59. Liu, B.; Li, H.; Li, H.; Zhang, A.; Rengel, Z. Long-term biochar application promotes rice productivity by regulating root dynamic development and reducing nitrogen leaching. GCB Bioenergy 2021, 13, 257–268. [Google Scholar] [CrossRef]
  60. He, L.; Shan, J.; Zhao, X.; Wang, S.; Yan, X. Variable responses of nitrification and denitrification in a paddy soil to long-term biochar amendment and short-term biochar addition. Chemosphere 2019, 234, 558–567. [Google Scholar] [CrossRef]
  61. Lan, X.; Shan, J.; Huang, Y.; Liu, X.; Lv, Z.; Ji, J.; Hou, H.; Xia, W.; Liu, Y. Effects of long-term manure substitution regimes on soil organic carbon composition in a red paddy soil of southern China. Soil Till. Res. 2022, 221, 105395. [Google Scholar] [CrossRef]
  62. Ren, F.; Zhang, X.; Liu, J.; Sun, N.; Sun, Z.; Wu, L.; Xu, M. A synthetic analysis of livestock manure substitution effects on organic carbon changes in China’s arable topsoil. CATENA 2018, 171, 1–10. [Google Scholar] [CrossRef]
  63. Wei, Z.; Hoffland, E.; Zhuang, M.; Hellegers, P.; Cui, Z. Organic inputs to reduce nitrogen export via leaching and runoff: A global meta-analysis. Environ. Pollut. 2021, 291, 118176. [Google Scholar] [CrossRef]
  64. Fageria, N.K. Yield physiology of rice. J. Plant Nutr. 2007, 30, 843–879. [Google Scholar] [CrossRef]
  65. Zhao, S.; Jang, S.; Lee, Y.K.; Kim, D.-G.; Jin, Z.; Koh, H.-J. Genetic basis of tiller dynamics of rice revealed by genome-wide association studies. Plants 2020, 9, 1695. [Google Scholar] [CrossRef] [PubMed]
  66. Chen, S.; Liu, G.; Hong, Y.; Ma, Y.; Guo, S.; Yan, P.; Mi, W. Biochar amendment was less effective for rice yield improvement but more effective for soil quality relative to inorganic fertilization in a low fertility paddy soil. J. Soil Sci. Plant Nutr. 2024, 24, 4918–4928. [Google Scholar] [CrossRef]
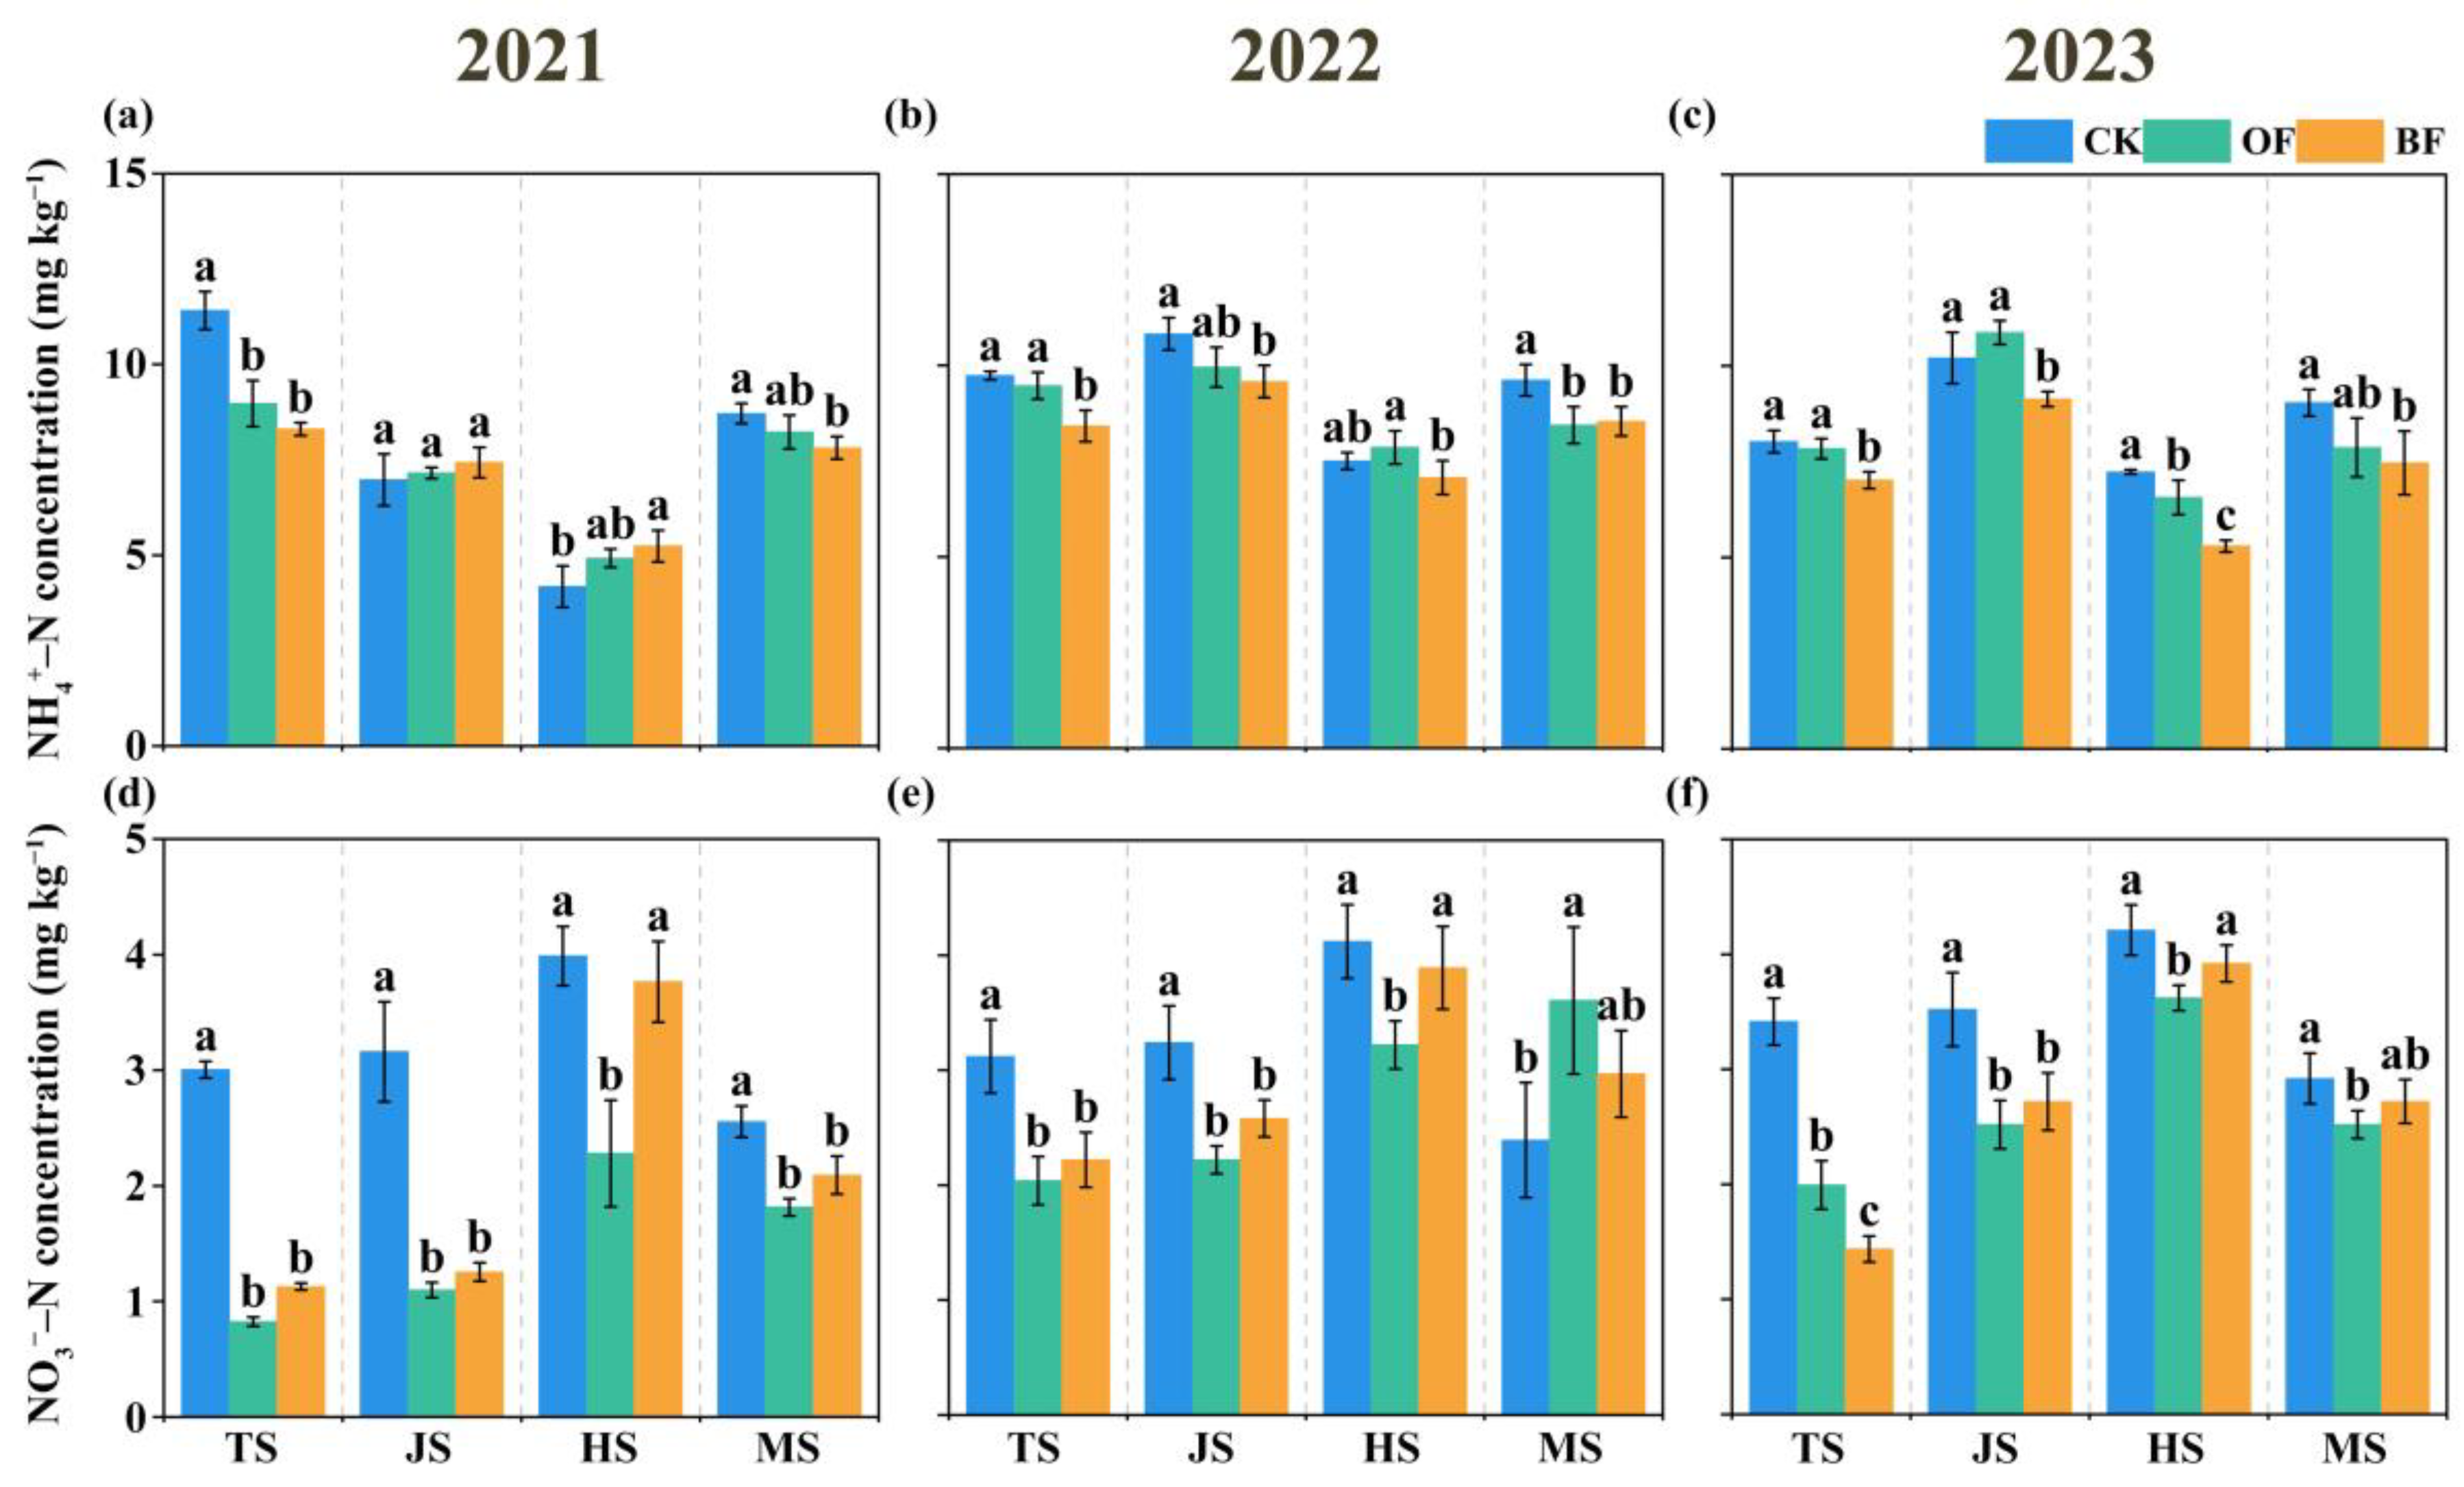
Figure 1. Soil NH4+–N (ac) and NO3–N (df) contents during 2021–2023. Data are means ± standard deviations (n = 3). Statistical significance of differences in soil inorganic N contents among treatments was determined by means of one-way ANOVA followed by Duncan’s test, with different letters indicating significant (p < 0.05) differences between treatments in same year. Abbreviations: TS, tillering stage; JS, jointing stage; HS, heading stage; MS, maturation stage.
Agronomy 15 02242 g001
Figure 2. Flow chart of gross N turnover rates (mg N kg−1 day −1) in different treatments. Data are means ± standard deviations (n = 3). Statistical significance of differences in soil gross N turnover rates among treatments was determined by means of one-way ANOVA followed by Duncan’s test, with different letters indicating significant (p < 0.05) differences between treatments. Org N: organic N. m, n, ia, and in indicate gross rates of mineralization, nitrification, NH4+–N immobilization, and NO3–N immobilization, respectively. anet and nnet indicate net ammonification and nitrification rate.
Agronomy 15 02242 g002
Figure 3. Soil enzyme activity under different fertilization treatments during 2021–2023: (a) soil urease; (b) soil neutral protease; (c) soil β-glucosidase; (d) soil neutral phosphatase. Data are means ± standard deviations (n = 3). Statistical significance of differences in soil enzyme activity among treatments was determined by means of one-way ANOVA followed by Duncan’s test, with different letters indicating significant (p < 0.05) differences between treatments in same year. Year-to-year variations were evaluated via repeated-measures ANOVA. Symbols * and ** indicate significant differences at p < 0.05 and p < 0.01 between years, respectively. ns indicates no significance.
Agronomy 15 02242 g003
Figure 4. Soil microbial biomass under different fertilization treatments during 2021–2023: (a) soil microbial carbon; (b) soil microbial nitrogen. Data are means ± standard deviations (n = 3). Statistical significance of differences in soil microbial biomass among treatments was determined by means of one-way ANOVA followed by Duncan’s test, with different letters indicating significant (p < 0.05) differences between treatments in same year. Year-to-year variations were evaluated via repeated-measures ANOVA. Symbols ** indicate significant differences at p < 0.01 between years, respectively.
Agronomy 15 02242 g004
Figure 5. Physiological indices of rice at different growth stages under different fertilization treatments from 2021 to 2023: (a) SPAD value; (b) tiller number; (c) plant height. Data are means ± standard deviations (n = 3). Statistical significance of differences in rice physiological indices among treatments was determined by means of one-way ANOVA followed by Duncan’s test, with different letters indicating significant (p < 0.05) differences between treatments in same year. Year-to-year variations were evaluated via repeated-measures ANOVA. Abbreviations: TS, tillering stage; JS, jointing stage; HS, heading stage; MS, maturation stage.
Agronomy 15 02242 g005
Figure 6. Rice dry matter accumulation at different growth stages (ac) and yield (d) from 2021 to 2023. Data are means ± standard deviations (n = 3). Statistical significance of differences in rice dry matter and yield among treatments was determined by means of one-way ANOVA followed by Duncan’s test, with different letters indicating significant (p < 0.05) differences between treatments in same year. Symbol * in (ac) indicates significant difference in total dry matter weight (p < 0.05). ns indicates no significant difference. Year-to-year variations were evaluated via repeated-measures ANOVA. Symbols ** in (d) indicate significant differences at p < 0.01 between years, respectively. Abbreviations: TS, tillering stage; JS, jointing stage; HS, heading stage; MS, maturation stage.
Agronomy 15 02242 g006
Figure 7. Correlation analysis of soil physicochemical properties, biological activity, and yield and Mantel test analysis of N transformation (a). Redundancy analysis of environmental factors and N transformation (b). The R2 value represents the explained variation. Symbols * and ** indicate significance levels of p < 0.05 and p < 0.01.
Agronomy 15 02242 g007
Table 1. The basic properties of the tested soil (0–20 cm) and organic fertilizers.
TC
(g kg−1)
TN
(g kg−1)
TP
(g kg−1)
TK
(g kg−1)
CEC
(cmol kg−1)
pH
Soil14.941.210.4924.5365.796.84
Organic fertilizer74.6910.547.6228.4866.97/
Biochar-based fertilizer83.859.697.1028.7883.80/
TC: soil total carbon; TN: soil total nitrogen; TP: soil total phosphorus; TK: soil total potassium; CEC: soil cation exchange capacity. The abbreviation definitions are the same in the table below.
Table 2. Effect of organic fertilizer application on basic soil properties (2021–2023).
YearTreatmentsTC (g kg−1)TN (g kg−1)TP (g kg−1)TK (g kg−1)pH
2021CK15.06 ± 0.14 a1.28 ± 0.07 a0.51 ± 0.02 a24.87 ± 0.47 a6.83 ± 0.02 a
OF14.48 ± 0.08 b1.24 ± 0.07 a0.49 ± 0.02 a24.02 ± 0.45 a6.88 ± 0.03 a
BF14.65 ± 0.14 b1.27 ± 0.04 a0.49 ± 0.03 a23.98 ± 0.48 a6.85 ± 0.01 a
2022CK14.88 ± 0.19 b1.28 ± 0.04 a0.53 ± 0.02 a24.65 ± 0.46 a6.86 ± 0.02 a
OF15.37 ± 0.20 a1.27 ± 0.01 a0.51 ± 0.03 a24.17 ± 0.49 a6.84 ± 0.02 a
BF14.75 ± 0.17 b1.30 ± 0.03 a0.53 ± 0.02 a24.14 ± 0.53 a6.84 ± 0.02 a
2023CK14.65 ± 0.21 b1.30 ± 0.04 a0.53 ± 0.02 a24.68 ± 0.46 a6.80 ± 0.03 a
OF15.34 ± 0.18 a1.34 ± 0.03 a0.50 ± 0.01 a24.64 ± 0.39 a6.84 ± 0.03 a
BF15.12 ± 0.18 a1.31 ± 0.04 a0.51 ± 0.01 a24.47 ± 0.31 a6.86 ± 0.04 a
Source of variation
Treatment (T)**nsns*ns
Year (Y)**nsnsnsns
T × Y*nsnsns*
Data are means ±  standard deviations (n = 3). Statistical significance of differences in basic soil properties among treatments was determined by means of one-way ANOVA followed by Duncan’s test, with different letters indicating significant (p < 0.05) differences between treatments in same year. Year-to-year variations were evaluated via repeated-measures ANOVA. Symbols * and ** indicate significant differences at the p < 0.05 and p < 0.01 between years, respectively. ns indicates no significance.
Disclaimer/Publisher’s Note: The statements, opinions and data contained in all publications are solely those of the individual author(s) and contributor(s) and not of MDPI and/or the editor(s). MDPI and/or the editor(s) disclaim responsibility for any injury to people or property resulting from any ideas, methods, instructions or products referred to in the content.