Article

Recirculating Aquaculture Biosolids Are Comparable to Synthetic Fertilizers for Grain Protein and Yield in Durum Wheat

1
Department of Biosystems Engineering, University of Arizona, Tucson, AZ 85721, USA
2
Independent Researcher, Tucson, AZ 85742, USA
*
Author to whom correspondence should be addressed.
Agronomy 2025, 15(9), 2237; https://doi.org/10.3390/agronomy15092237
Submission received: 30 August 2025 / Revised: 18 September 2025 / Accepted: 20 September 2025 / Published: 22 September 2025

Abstract

Nitrogen is essential for durum wheat (Triticum turgidum subsp. durum) production, yet conventional sources such as urea-ammonium nitrate (UAN) and monoammonium phosphate (MAP) are energy-intensive to manufacture and, when mismanaged, contribute to soil degradation, nutrient runoff, and greenhouse gas emissions. Organic alternatives such as dairy manure solids (DMS) may reduce reliance on synthetic fertilizers but risk phosphorus accumulation and nutrient imbalances. Recirculating aquaculture systems generate nutrient-rich biosolids (RAB) that remain underutilized as fertilizers despite the rapid expansion of global aquaculture. We conducted a field experiment in Tucson, Arizona, USA, during the 2023–2024 winter growing season to evaluate RAB as a nitrogen source for Desert Durum® wheat under irrigated arid conditions. Treatments supplied equivalent nitrogen rates using UAN, MAP, DMS, or RAB. Grain yields (3.6–4.8 t ha−1) were not significantly affected by fertilizer source, but grain protein concentration was: RAB (101 ± 4 g kg−1) was statistically comparable to UAN and MAP (96 ± 5 g kg−1) and significantly higher than DMS (83 ± 4 g kg−1) by ~20%. While this study was limited to small plots and a single season, these results demonstrate that aquaculture biosolids can maintain yields while enhancing protein compared with DMS, supporting their use as a supplement to or replacement for synthetic nitrogen fertilizers in arid wheat systems.

1. Introduction

Intensive agriculture depends heavily on synthetic nitrogen fertilizers. Urea-ammonium nitrate (UAN), for example, is energy-intensive to produce and contributes to soil degradation, nutrient runoff, and greenhouse gas emissions [1,2,3,4,5,6]. Organic alternatives, such as dairy manure solids (DMS), are often viewed as more sustainable, but when applied at nitrogen-sufficient rates, they can similarly degrade soils through phosphorus overloading, heavy metal accumulation, residual pharmaceuticals, and microbial disruption [7,8,9,10,11,12]. These limitations underscore the need for alternative nitrogen sources that maintain crop productivity while reducing long-term environmental harm.
As global food demand is projected to increase by 70% by 2050, nutrient cycling must become more efficient across food sectors [13]. Aquaculture, the fastest-growing animal food sector, now supplies over 56% of global seafood, but conventional systems discharge nutrient-rich waste into aquatic environments, driving eutrophication and biodiversity loss, and in some cases contributing to antimicrobial resistance through pharmaceutical use [13,14,15,16,17,18]. In contrast, recirculating aquaculture systems minimize waste discharge by capturing and concentrating nutrients into biosolids [19]. These biosolids, rich in organic carbon, nitrogen, and phosphorus, which may additionally harbor microbial communities, are often discarded despite their agronomic potential [20,21].
This emerging biosolid stream is unique in that it is generated worldwide wherever aquaculture expands, yet it remains rarely integrated into agricultural nutrient cycles. In practice, recirculating aquaculture biosolids (RAB) is continuously produced at recirculating aquaculture (RAS) facilities, where it is currently treated as a disposal burden and thus may be available at little or no cost to nearby farms. However, as quality standards, safety regulations, and distribution infrastructure develop, the market value of RAB would be expected to adjust similarly to other organic fertilizers such as livestock manure. The primary expenses associated with RAB use are transportation, drying, or dewatering, which parallel the logistics of handling manure. Once dewatered, RAB can be spread with standard manure-spreading equipment or incorporated into soil as a slurry, making its field application familiar to farmers accustomed to organic amendments. Compared to synthetic fertilizers, which are tied to volatile global markets for natural gas and phosphate reserves, RAB represents a potentially cost-effective local alternative wherever aquaculture and agriculture are geographically proximate.
Redirecting RAB to agriculture could link aquaculture and crop production through closed-loop nutrient systems. While biosolids from municipal and livestock waste have been widely studied as fertilizers, the application of RAB remains underexplored [8,22,23]. This is due in part to its relatively recent emergence with the expansion of RAS, limited awareness of its composition among agronomists, and the absence of established regulatory pathways. A few studies have examined aquaculture sludge in forage or winter wheat systems, but no known research has evaluated RAB in durum wheat, a high-value cereal sensitive to nitrogen availability and soil health [21,24,25,26,27]. Unlike DMS, which often supplies excess phosphorus and limited sulfur, RAB contains comparatively lower phosphorus and measurable sulfur inputs. This distinction positions RAB as potentially better aligned with crop protein synthesis requirements while reducing the risk of soil phosphorus accumulation. In contrast, synthetic fertilizers such as UAN and monoammonium phosphate (MAP) deliver highly soluble nitrogen and phosphorus but lack organic carbon and sulfur, limiting their contributions to soil organic matter and secondary nutrient supply. RAB may offer advantages over both synthetic and manure-based fertilizers, including stabilized nutrient release, enhanced microbial activity, and reduced contaminants under responsible feed and water management [15,19,20,21]. These potential advantages must also be considered with the broader regulatory landscape, as biosolid applications are increasingly scrutinized for heavy metals, pathogens, and emerging contaminants [8,20]. While municipal and livestock biosolids face well-established oversight, aquaculture-derived biosolids remain relatively underexplored in both agronomic research and regulatory frameworks [21,24], with recent studies highlighting both opportunities for nutrient recovery and the need for clearer guidelines on biosolid use in agriculture.
Integrating RAB into agricultural systems could support broader sustainability goals by reducing synthetic fertilizer use, offsetting aquaculture waste burdens, and closing critical nutrient loops [17,18,25,26]. If proven effective, RAB may also meet organic certification standards and provide value-added potential in regenerative systems [20,22].
This study addresses the current knowledge gap by evaluating RAB as a sole nitrogen source for Desert Durum® wheat under arid field conditions in Tucson, Arizona [28,29,30]. RAB’s performance is compared to dairy manure solids (DMS) and synthetic fertilizers (UAN and MAP, hereafter referred to as the Control) in terms of grain yield, grain protein content, and post-harvest soil nutrient composition. We hypothesized that RAB would deliver agronomic outcomes comparable to synthetic nitrogen while promoting more favorable soil nutrient dynamics. By assessing RAB’s short-term performance in a high-value cereal crop, this work contributes to broader efforts to integrate waste valorization into sustainable agricultural production.

2. Materials and Methods

2.1. Site Description and Experimental Design

Fieldwork was conducted during the 2023–2024 winter growing season at the University of Arizona Campus Agricultural Center in Tucson, Arizona (32.282296° N, 110.947267° W). The soil is classified as loamy sand (85% sand, 12% clay, 3% silt). The experiment was conducted on loamy sand because this texture is representative of irrigated wheat production in arid southwestern U.S. systems. Loamy sand soils are characterized by low organic matter, limited water-holding capacity, and low inherent fertility, making them responsive to fertilizer inputs and suitable for evaluating nitrogen source effects under nutrient-limited conditions.
Prior to planting, the field was unamended and devoid of vegetation. Soil preparation involved tractor disking to a depth of 13–15 cm. Baseline (0–15 cm) soil nutrient concentrations were as follows: total carbon 13,300 mg kg−1, total nitrogen 500 mg kg−1, nitrite 2.68 µmol L−1, nitrate 159.00 µmol L−1, phosphate 16.16 µmol L−1, and sulfate 57.38 µmol L−1. These baseline measurements provide context for nutrient availability at the start of the experiment.
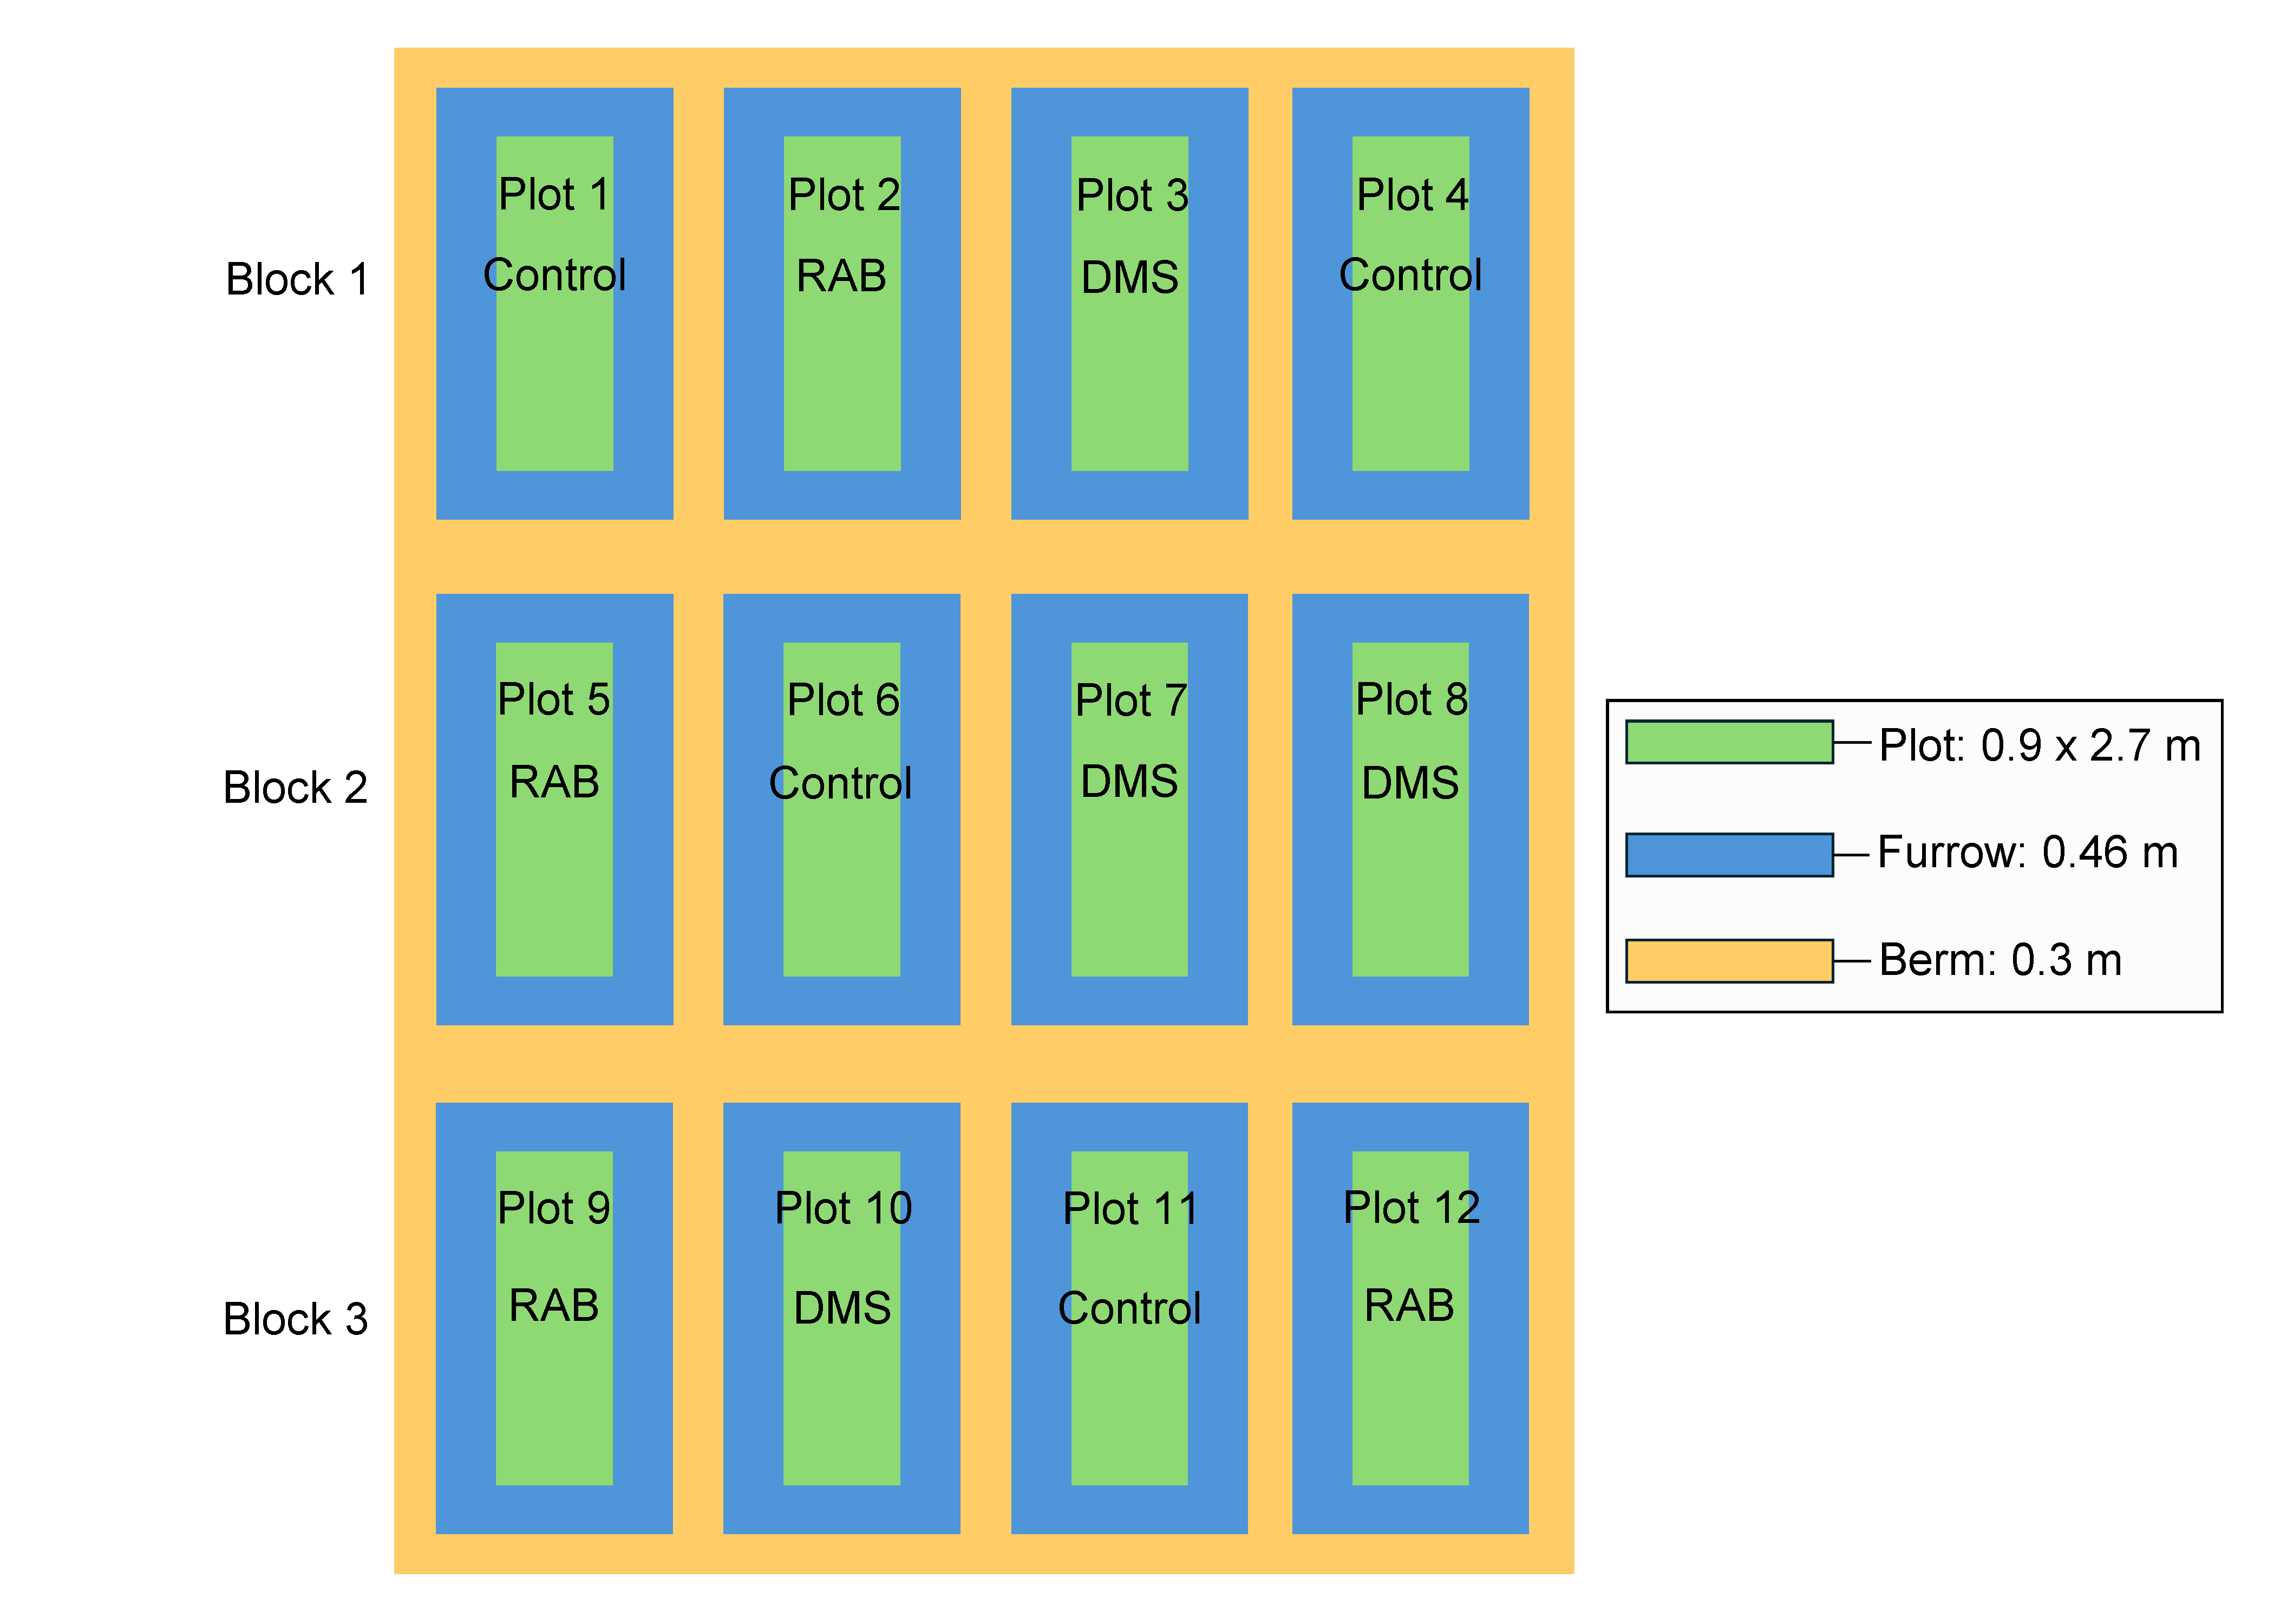
The experimental site is shown (Figure 1). A randomized complete block design with four replicates was implemented to account for spatial variability and environmental gradients. Treatment assignments were randomized using Python (version 3.11.6) with the random.shuffle function to ensure unbiased distribution and reproducibility of treatments. Each plot measured 0.91 m × 2.74 m (2.5 m2) and was separated by 0.3 m berms and 0.46 m furrows to facilitate irrigation. The field layout is illustrated (Figure 2). Flood irrigation was performed seven times throughout the season totaling ~100 cm of applied water, with an additional 18 cm of precipitation. The mean air temperature during the growing season was 16.3 °C, and the mean soil temperature was 15.9 °C. Crop development was monitored using the Feekes scale, a standardized system for phenological tracking in cereal crops.

2.2. Fertilizer Treatments

Three fertilizer treatments were applied: (1) synthetic control (urea-ammonium nitrate [UAN] + monoammonium phosphate [MAP]; hereafter, Control), (2) dairy manure solids (DMS), and (3) recirculating aquaculture system biosolids (RAB). DMS were sourced from regional dairy operations, sun-dried, and manually crushed. RAB were obtained from Merchant’s Garden (Tucson, AZ, USA), mineralized through aeration, sun-dried, and similarly crushed.
Fertilizer applications were split across six growth stages (Feekes scale) between November 2023 and April 2024: pre-planting, tillering, jointing, boot, heading, and ripening (Table 1). All treatments were applied at a total nitrogen-equivalent rate of 336 kg N ha−1, scaled to plot area, based on regional recommendations [30]. The Control received phosphorus supplementation via MAP, while DMS and RAB plots supplied phosphorus according to their inherent N:P ratios without additional inputs. For Control plots, the UAN rate was adjusted to account for nitrogen supplied by MAP, ensuring that total nitrogen inputs across treatments were equivalent.
The nutrient composition of DMS and RAB was determined from subsamples collected prior to application, while manufacturer specifications were used for UAN and MAP. Carbon, nitrogen, and sulfur composition is reported (Table 2), and nitrite, nitrate, phosphate, and sulfate composition (Table 3).
Application methods differed by fertilizer type. MAP (granular), DMS, and RAB were applied to the soil surface by hand and incorporated into the top 5 cm of soil by hand-turning. Following incorporation, UAN (liquid) was injected into twelve 5–10 cm guide holes per plot using a 20 mL syringe to ensure even distribution. Flood irrigation followed each fertilization event to further aid incorporation [28,29].
The nitrogen application rate of 336 kg N ha−1 reflects the upper end of regional recommendations [30] and has also been directly tested in irrigated durum wheat systems in Arizona, where it produced positive effects on biomass and nitrogen uptake [31]. This rate was selected to account for the small plot size, which increases the relative influence of edge effects, drift, and weed competition compared to larger commercial fields. Using the maximum recommended rate ensured that all treatments were supplied with sufficient nitrogen to evaluate relative performance under these conditions. High nitrogen application rates are common in irrigated wheat systems of the arid Southwest due to low inherent soil fertility, coarse-textured soils prone to leaching, and the need to sustain yield and protein targets under intensive production.

2.3. Seeding and Emergence

Desert Durum® wheat was hand-spread at a rate of 168 kg ha−1 based on regional agronomic recommendations [30]. Seeds were incorporated manually to ~5 cm depth. Emergence was evaluated one-week post-planting in a 0.84 m2 section per plot. Reseeding was performed where necessary to achieve a target density of ~237 plants m−2, accounting for a 75% emergence rate and a 20% buffer [29].

2.4. Soil Sampling and Laboratory Analysis

Soil samples were collected pre-treatment and post-harvest from the 0–15 cm depth using a stainless-steel, T-handled soil sampling probe, with three subsamples per plot composited prior to analysis. Samples were oven-dried at 60 °C for 1 h and ground prior to analysis. Total carbon, nitrogen, and sulfur were measured by high-temperature catalytic combustion with thermal conductivity detection (ECS 4010, Costech Analytical Technologies, Santa Clarita, CA, USA); with detection limits of 0.005 mg for carbon and nitrogen, and 0.022 mg for sulfur.
Anion analyses were performed by the Arizona Laboratory for Emerging Contaminants (ALEC), Tucson, Arizona, USA. Dissolved anions of nitrite (NO2), nitrate (NO3), orthophosphate (PO43− as P), and sulfate (SO42−) were quantified by ion chromatography (ICS-6000, Thermo Scientific, Waltham, MA, USA) with suppressed conductivity detection, following EPA Method 300.0 (Rev. 2.1) [32]. This method is based on anion separation using a carbonate/bicarbonate eluent and conductivity detection after suppression. External calibration (5–250 µmol L−1) yielded R2 > 0.99. Method detection limits were 5 µmol L−1 for all reported anions. Quality control procedures included calibration blanks, laboratory reference standards, and continuing calibration verification.
Contaminant analyses, such as heavy metals, pathogens, and pharmaceuticals, were not performed in this study because RAB contaminant profiles are highly source-specific, governed by feed composition, water quality, and system management. A single-source assay would not be generalizable and could be misleading as an indicator of broader risk.

2.5. Grain Harvest and Analysis

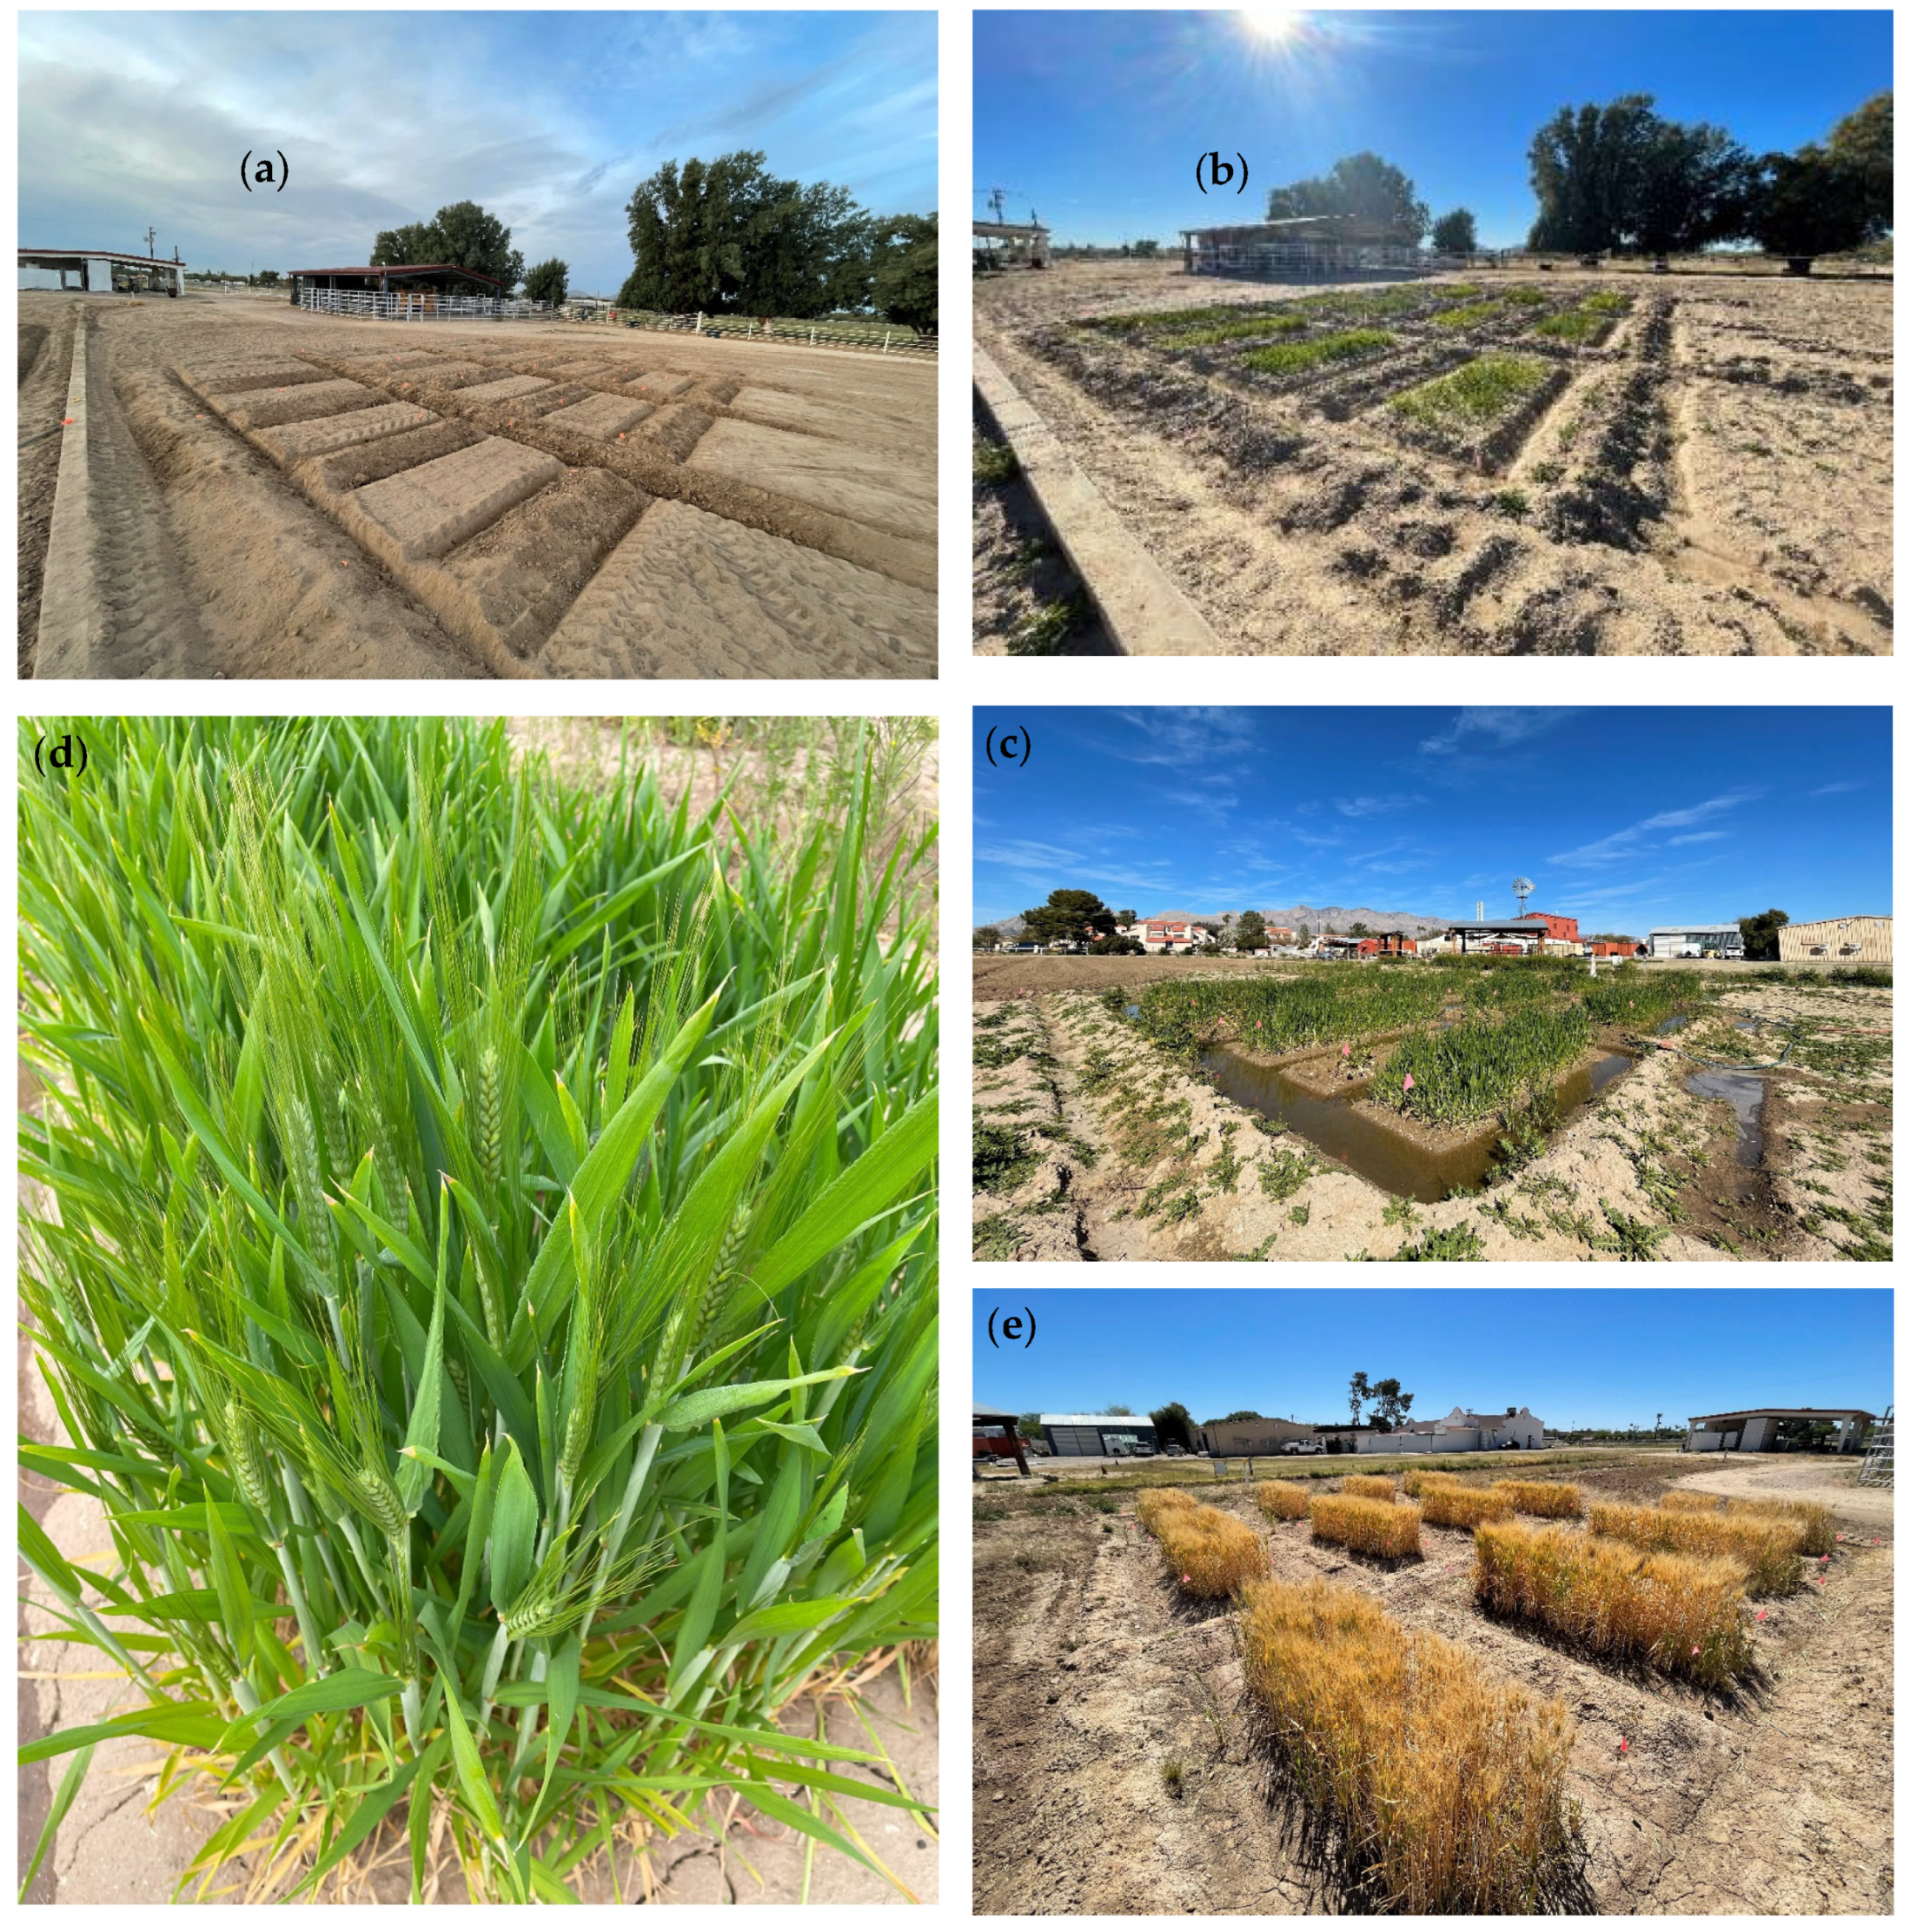
Wheat was harvested on 15 May 2024. Heads were manually cut, threshed, and winnowed using a two-bucket-and-fan method. Samples were submitted to Farwell Grain Inspection (Casa Grande, AZ, USA) for analysis of moisture and grain protein content using FOSS 1220 and 1241 whole-grain analyzers (FOSS Analytical A/S, Hillerød, Denmark). Test weight was determined using standard chondrometer procedures. Both analyzers were calibrated with the same standards to ensure consistency. Moisture content did not differ significantly among treatments (Control: 9.2%, DMS: 8.8%, RAB: 8.6%) and fell within expected measurement variability. Representative growth stages are shown (Figure 3). Plot-level grain mass (kg plot−1) was scaled to areal yield (t ha−1) by multiplying by 4, based on a harvested area of 2.5 m2 (10,000 m2 ha−1/2.5 m2 plot−1/1000 kg t−1).

2.6. Statistical Analysis

Statistical analyses were performed in R (version 4.4.2) via RStudio (version 2024.09.1+394). The following packages were used: rstatix (version 0.7.2) for ANOVA and Tukey’s HSD, Hmisc (version 5.2-1) for correlation analysis, effectsize (version 0.8.9) for η2 estimates, and ggpubr (version 0.6.0) and ggcorrplot (0.1.4.1) for data visualization. One-way ANOVA was used to evaluate treatment effects on grain protein content, yield, and soil metrics followed by Tukey’s HSD for pairwise comparisons (α = 0.05). Pearson correlations and effect sizes (η2) were reported. Plot 12 was excluded from yield analysis due to >25% pest damage, which caused anomalous reduction in harvestable biomass. Its exclusion ensured that treatment effects on yield were not confounded by pest pressure; all other analyses retained four replicates per treatment. Data are reported as means ± standard deviation.

2.7. Environmental and Replicability Considerations

Average weed coverage ranged from 10–20% peaking at 30–40% due to herbicide-free management. Manual weeding was conducted throughout the season, though minor inconsistencies could not be entirely prevented. Wildlife interference (coyotes) damaged in-ground soil sensors resulting in incomplete soil moisture data, which were excluded from analysis.
For improved replicability, future studies may benefit from pest barriers, photographic phenological documentation, and reinforced sensor enclosures. Redundant data collection tools are also recommended in wildlife-prone settings.

2.8. Ethical Considerations

No herbicides, pesticides, traps, or active pest control methods were used, minimizing chemical interference while supporting ecological integrity and treatment comparability. However, this contributed to weed pressure and wildlife disturbance, illustrating trade-offs common to organic and regenerative systems.

3. Results

3.1. Fertilizer Composition

The fertilizer treatments differed in nutrient composition (Table 2). Recirculating aquaculture biosolids (RAB) contained the most carbon and sulfur, dairy manure solids (DMS) had intermediate levels, and synthetics (MAP, UAN) contained no measurable carbon or sulfur. UAN had the highest nitrogen content, while RAB and DMS were lower.
Table 2. Fertilizer carbon, nitrogen, and sulfur composition.
FertilizerTotal Carbon (g kg−1)Total Nitrogen (g kg−1)Total Sulfur (g kg−1)
MAPNA110BDL
UANNA320BDL
DMS207355
RAB3314419
Total carbon, nitrogen, and sulfur composition by fertilizer treatment. NA = not applicable (value less than the lowest calibration standard); BDL = below detection limit. Detection limits were 0.005 mg for carbon and nitrogen, and 0.022 mg for sulfur. Control = monoammonium phosphate (MAP) and urea-ammonium nitrate (UAN); DMS = dairy manure solids; RAB = recirculating aquaculture biosolids.
Anion concentrations also varied (Table 3): RAB was rich in sulfate, DMS intermediate, while MAP and UAN contained none. MAP had the highest phosphate, DMS was lower, and RAB contained relatively little. Nitrite was similar in RAB and DMS, while nitrate was detected only in RAB. Theoretical values for UAN nitrate and MAP phosphate are shown for comparison.
Table 3. Fertilizer anion concentrations.
FertilizerNitrite (µmol L−1)Nitrate (µmol L−1)Phosphate (µmol L−1)Sulfate (µmol L−1)
MAPNANA8694 1NA
UANNA5710 1NANA
DMS388BDL24585856
RAB4304832815,640
Nitrite, nitrate, phosphate, and sulfate concentrations by fertilizer treatment. NA = not applicable (value less than the lowest calibration standard); BDL = below detection limit. Detection limits were 5.00 µmol L−1 for all anions. Control = monoammonium phosphate (MAP) and urea-ammonium nitrate (UAN); DMS = dairy manure solids; RAB = recirculating aquaculture biosolids. 1 Theoretical concentrations for UAN nitrate and MAP phosphate were calculated based on a standardized 1 g L−1 solution.

3.2. Soil Composition

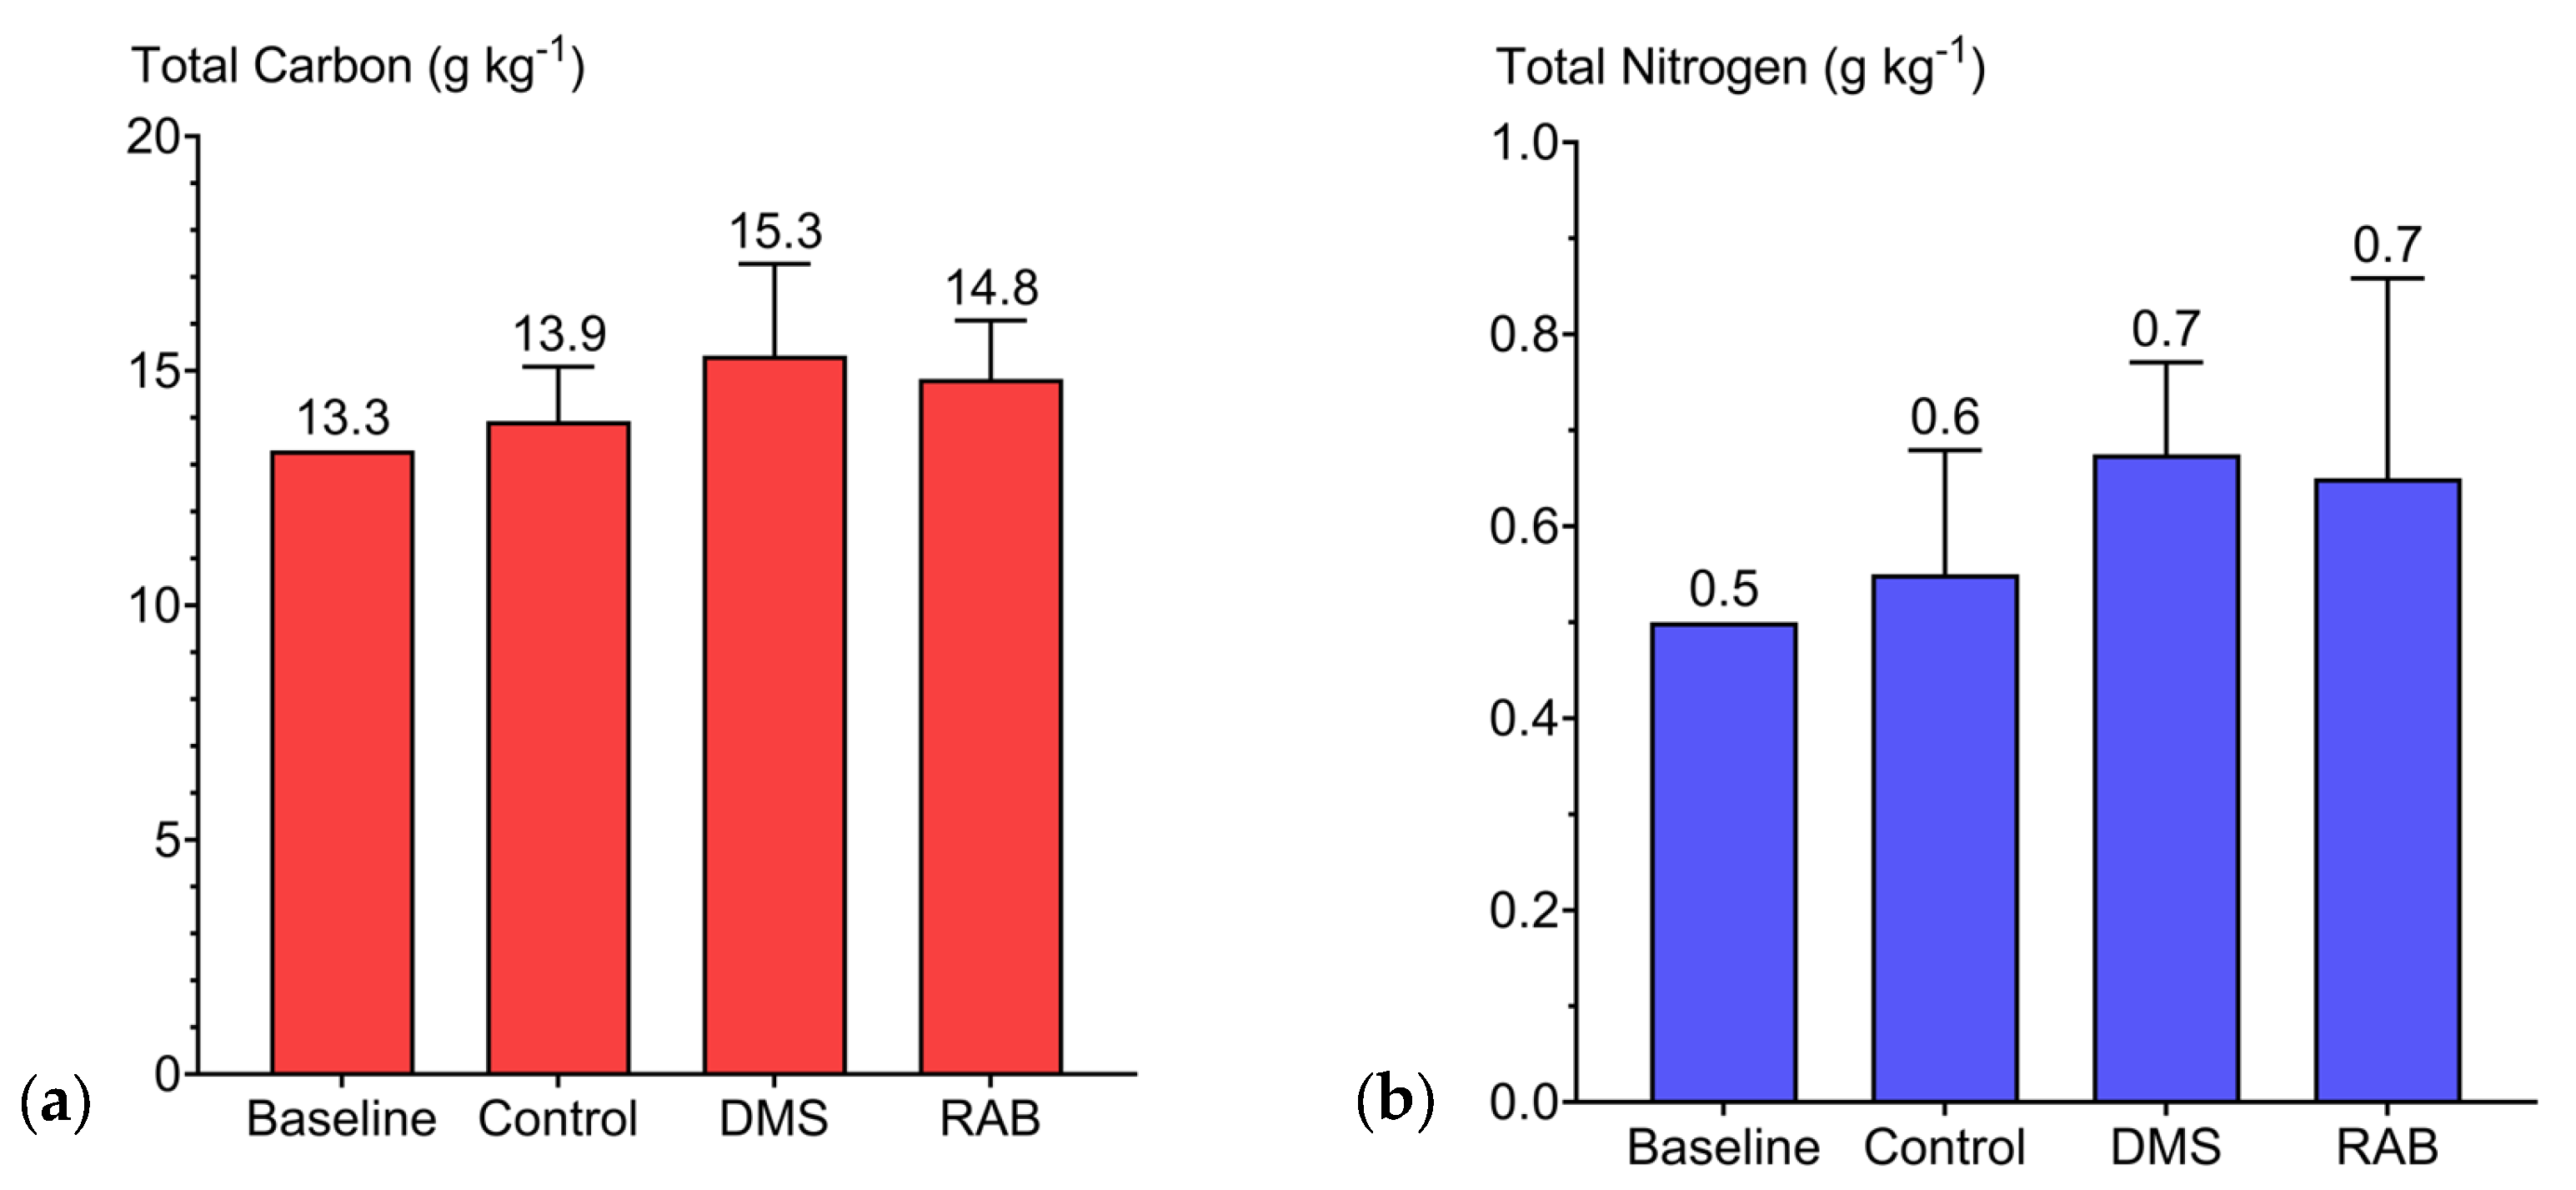
Relative to the baseline (13.3 g kg−1 C, 0.5 g kg−1 N), post-harvest soils showed modest increases in carbon and nitrogen in RAB and DMS plots relative to the Control and baseline, though differences were not significant (Figure 4).
Sulfur remained below detection in all treatments. Soil anion concentrations (Figure 5) indicated higher sulfate and nitrate in RAB plots, while phosphate was slightly greater in DMS. However, none of these differences were statistically significant.

3.3. Wheat Quality Metrics

Grain protein content, yield, and test weight were measured across treatments (Table 4). ANOVA revealed a significant effect on protein content, with RAB and the Control both higher than DMS (p < 0.01) but not differing from one another. In contrast, yield and test weight did not vary significantly among treatments, though DMS appeared to produce higher yields and RAB slightly higher test weight. One RAB replicate (Plot 12) was excluded from yield analysis due to >25% pest damage.

3.4. Statistical Analyses

3.4.1. Grain Protein Content

ANOVA identified a significant effect of fertilizer treatment on grain protein content (p = 0.002). Block was included as a factor but was not significant (p = 0.277), indicating minimal block-to-block variability. Treatment explained 76.5% of the variance in protein content (η2 = 0.77), reflecting a very large effect size.
Post hoc comparisons (Tukey’s HSD, α = 0.05) indicated that DMS plots had significantly lower protein content than both the Control (p = 0.004) and RAB (p < 0.001), whereas Control and RAB did not differ significantly (p = 0.195).

3.4.2. Grain Yield

ANOVA did not identify a significant effect of fertilizer treatment on grain yield (p = 0.069). Block was included as a factor but was not significant (p = 0.377), indicating minimal block-to-block variability. Treatment explained 51% of the variance in yield (η2 = 0.51), suggesting a moderate effect size but with considerable uncertainty.
Post hoc comparisons (Tukey’s HSD, α = 0.05) indicated that DMS yields were higher than the Control (p = 0.027), though this difference was not significant after Bonferroni adjustment (adjusted p = 0.081). No significant differences were observed between the Control and RAB (p = 0.065) or between DMS and RAB (p = 0.728).
Weed pressure and wildlife interference, including the exclusion of one RAB replicate due to pest damage, likely reduced treatment separability and statistical power for yield outcomes. This may help explain the moderate effect sizes observed despite a lack of statistically significant treatment differences.

3.4.3. Soil Nutrient Concentrations

ANOVA did not detect statistically significant treatment effects for soil nitrogen, carbon, nitrite, nitrate, phosphate, or sulfate concentrations (p > 0.05 for all comparisons) after accounting for block effects. Block was included as a factor and was significant only for nitrate concentrations (p = 0.039), suggesting that block-to-block variability contributed to nitrate differences. Effect size analysis indicated moderate treatment-related variability for nitrate (η2 = 0.26), phosphate (η2 = 0.30), and sulfate (η2 = 0.24), though these effects were not statistically significant. Descriptive values are illustrated (Figure 4 and Figure 5).

3.4.4. Regression Analyses

Regression analysis of grain protein content showed that treatment explained 76.5% of the variance (R2 = 0.77; adjusted R2 = 0.71; p = 0.0015). Dairy manure solids (DMS) significantly reduced protein content compared to the Control (β = −1.30; p = 0.004), while recirculating aquaculture biosolids (RAB) did not differ significantly (β = 0.48; p = 0.195).
For grain yield, regression excluding Plot 12 (RAB) due to pest damage explained 51% of the variance (R2 = 0.51; adjusted R2 = 0.39; p = 0.058). Although the overall model was not statistically significant, DMS produced a significant positive effect relative to the Control (β = 0.64; p = 0.027), whereas RAB showed a positive but non-significant trend (β = 0.55; p = 0.065).

3.4.5. Correlation Analyses

Correlation analysis revealed a weak to moderate negative relationship between grain protein content and yield (r = −0.48; p = 0.131), which was not statistically significant. The 95% confidence interval (−0.84 to 0.16) indicates considerable uncertainty in both the strength and direction of the association. Plot 12 (RAB) was excluded to avoid distortion of the observed pattern.
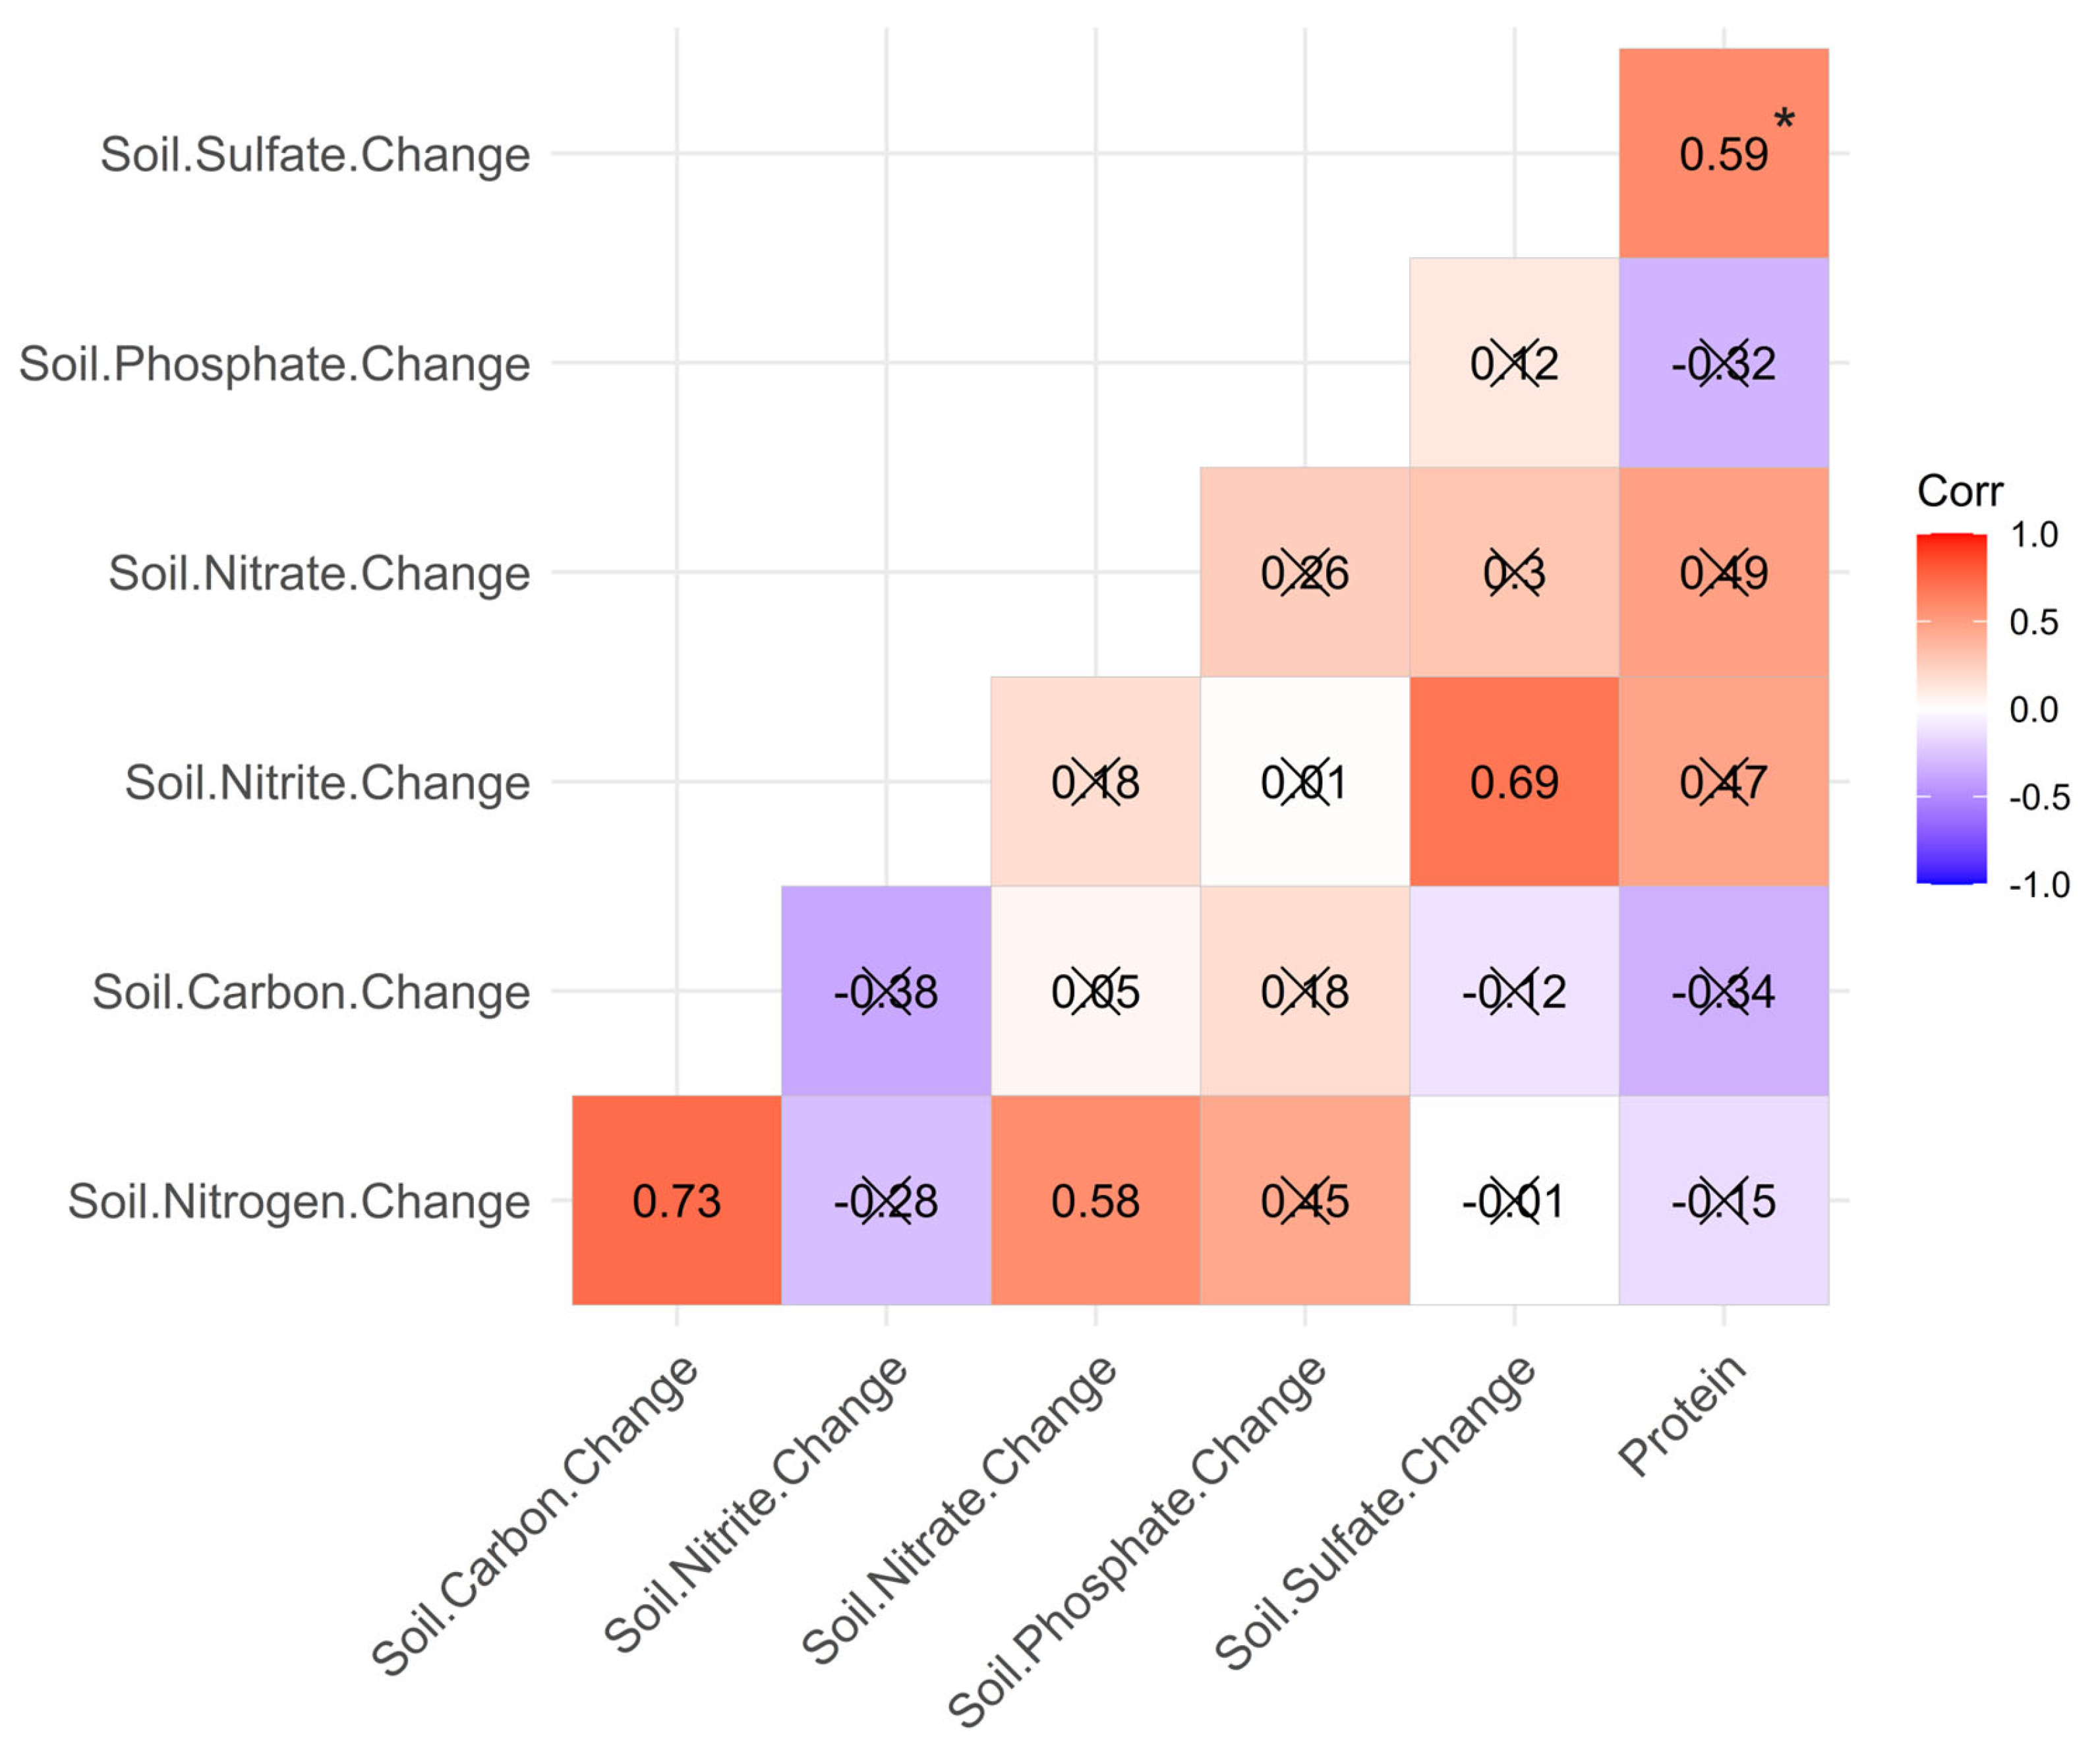
A significant positive correlation was observed between soil sulfate and grain protein content (r = 0.59; p = 0.043). Moderate but non-significant positive correlations were also noted between protein content and soil nitrite (r = 0.47; p = 0.12) and nitrate (r = 0.49; p = 0.11). Other soil metrics, including total nitrogen and carbon, exhibited weak or negligible associations with protein content. Among all soil variables, sulfate showed the strongest relationship with protein concentration. These associations are visualized (Figure 6), which presents a correlation heatmap of soil and protein variables.
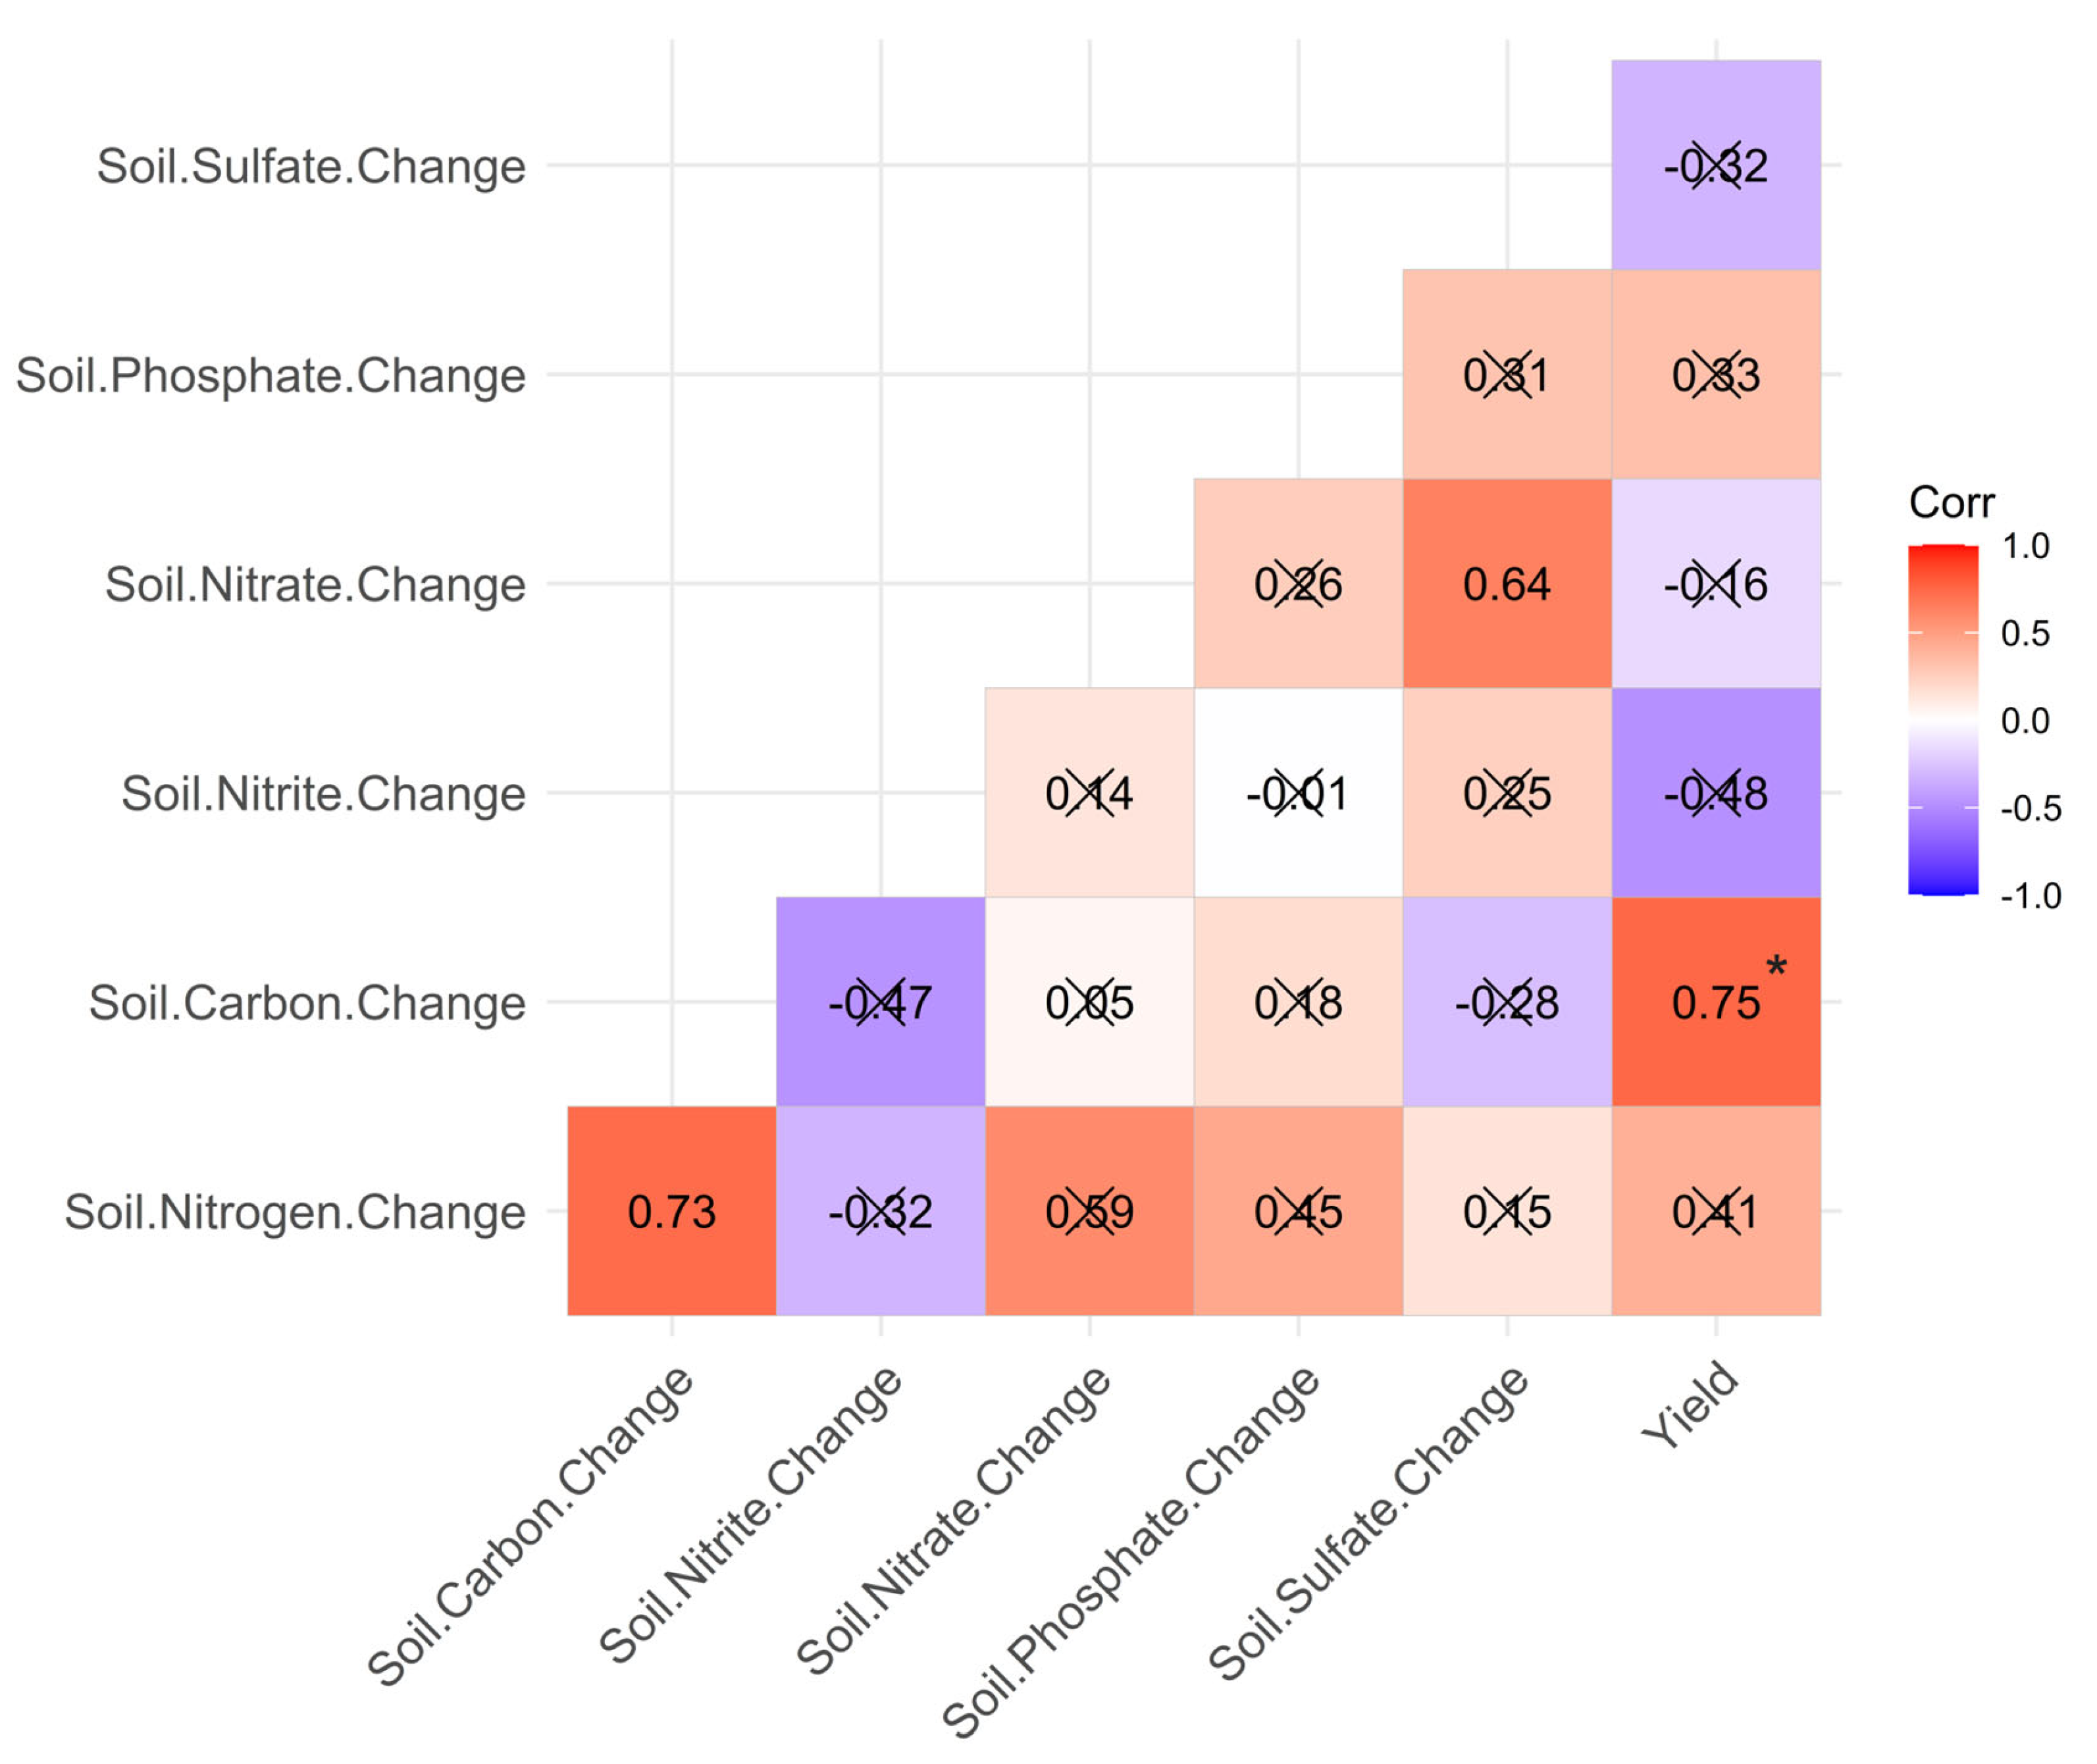
A significant positive correlation was observed between soil carbon change and grain yield (r = 0.75, p = 0.008) after excluding Plot 12 (RAB). This indicates that increases in soil carbon were strongly associated with higher yields. Other soil variables, including nitrogen, phosphate, and sulfate changes, showed weaker or non-significant associations (p > 0.05). These relationships are shown (Figure 7), which highlights soil carbon change as the metric most strongly associated with yield.

4. Discussion

4.1. Interpretation of Fertilizer Composition Results

4.1.1. Fertilizer Carbon, Nitrogen, and Sulfur Composition

The compositional differences in carbon, nitrogen, and sulfur among fertilizer types reflect their distinct sources and formulations. Organic inputs such as recirculating aquaculture biosolids (RAB) and dairy manure solids (DMS) contribute organic carbon, which is largely absent from synthetic fertilizers such as monoammonium phosphate (MAP) and urea-ammonium nitrate (UAN). This organic fraction is agronomically important because it may support microbial activity, improve soil structure, and enhance long-term nutrient retention [5,22]. In this way, RAB resembles other biosolid-based fertilizers shown to improve soil quality and microbial function, while MAP and UAN primarily deliver soluble nutrients without contributing to soil organic matter.
Nitrogen availability also differed sharply among fertilizers. UAN supplies highly concentrated, immediately available nitrogen, whereas RAB and DMS provide lower but more gradually mineralized pools. Rapid-release nitrogen from UAN can stimulate early crop growth. However, it carries higher risks of leaching or volatilization if not closely synchronized with crop uptake [2,3,7]. Similarly, some organic amendments, such as poultry manure, can release large amounts of readily available nitrogen that, when concentrated near roots, may induce localized ammonia or ammonium toxicity symptoms [33], underscoring the diversity of nutrient dynamics among manure sources. By contrast, organically bound nitrogen in RAB and DMS is released more slowly, potentially improving synchronization with plant demand and reducing losses [22,23]. However, the modest protein levels observed across treatments in this study suggest that environmental factors such as weed competition may have masked clearer treatment-level differences in nitrogen sufficiency. It should also be noted that application methods differed by fertilizer type: UAN was injected below the surface, whereas RAB and DMS were surface-applied and lightly incorporated. Injection reduces exposure to volatilization and may improve early nitrogen availability, while surface application can increase short-term losses but may also influence nutrient cycling, though this was not directly measured in the present study. These differences may have influenced nitrogen dynamics and should be considered when comparing fertilizer performance.
Sulfur availability further distinguished organic and synthetic inputs. RAB contained the highest measurable sulfur, with DMS contributing smaller amounts, while MAP and UAN contained no sulfur. Sulfur plays a critical role in protein synthesis and enzymatic activity in cereals, including durum wheat [34]. Its presence in RAB could therefore provide an agronomic advantage, while systems relying solely on MAP or UAN may require supplemental sulfur inputs to sustain crop quality. Some commercial formulations of UAN include added sulfur, such as UAN-S, but the UAN used in this study contained none.
It should be noted that the UAN and MAP formulations tested here were applied at relatively high rates consistent with regional recommendations. Outcomes under lower or more balanced mineral fertilization regimes may differ, therefore our findings should be interpreted in the context of these application levels.
Overall, these results underscore that fertilizer composition influences not only nutrient supply but also soil ecological processes. Organic-based fertilizers such as RAB and DMS may offer co-benefits for soil health through carbon and secondary nutrients, whereas synthetic products provide high concentrations of rapidly available nitrogen but lack these ancillary functions. Balancing these trade-offs is central to designing fertilization strategies that support both productivity and sustainability.

4.1.2. Fertilizer Anion Concentrations

Nitrogen-containing anions most clearly distinguished fertilizer sources. Nitrite and nitrate were primarily associated with organic inputs, and RAB in particular may have contributed to ongoing nutrient transformations. Recirculating aquaculture systems are known to harbor nitrifiers such as Nitrosomonas and Nitrobacter in their biofilters [19], and prior studies suggest that aquaculture waste solids can retain microbial populations including potential nitrifying communities relevant to nutrient cycling [21,24]. In this study, however, microbial activity was not measured, so any such contribution to nitrogen dynamics remains speculative. Extended availability may also reflect gradual mineralization of organically bound nitrogen, a process not directly assessed here. By contrast, synthetic fertilizers such as UAN supply nitrate in a highly soluble and immediately available form, which can be advantageous for rapid plant uptake but also increases vulnerability to environmental losses if not synchronized with crop demand [3,7].
Phosphorus dynamics also varied among fertilizer types. While MAP is formulated to release large amounts of phosphate, its solubility and plant availability are constrained in alkaline soils, such as those in Tucson, Arizona, where phosphorus exists primarily as hydrogen phosphate (HPO42−). Rapid phosphate release without microbial buffering can destabilize soil nutrient cycling and elevate the risk of runoff and nutrient loss [7,22]. By contrast, phosphorus inputs from RAB and DMS are lower and more gradually mineralized, potentially reducing accumulation in soil and minimizing downstream eutrophication risks [2,7,23]. These differences suggest that organic-based fertilizers may offer a more balanced phosphorus contribution, supporting crop demand while mitigating environmental trade-offs.
Sulfate inputs further distinguished organic and synthetic fertilizers. RAB and DMS supplied measurable sulfate, while MAP and UAN contained no measurable sulfate.
Taken together, these patterns underscore that organic fertilizers such as RAB and DMS contribute not only macronutrients but also secondary nutrients and soil support absent from synthetic fertilizers. This positions them as promising tools for building soil fertility and resilience, while synthetic inputs remain more suitable for delivering concentrated, rapidly available nutrients when closely managed.

4.1.3. Implications for Fertilizer Selection

Fertilizer choice has critical implications for both crop productivity and environmental sustainability. Organic amendments such as RAB and DMS supply gradual nutrient release, organic carbon inputs that may foster microbial activity, biological function, and long-term fertility, although microbial effects were not directly measured here [5,20,22,23]. By contrast, synthetic fertilizers such as UAN and MAP deliver concentrated nutrients in soluble form, which can support rapid plant growth but elevate risks of leaching, volatilization, and nutrient imbalances if not carefully managed [2,3,7].
The contrasting patterns in nutrient composition highlight how organic and synthetic inputs serve different roles. Organic fertilizers contribute carbon and secondary nutrients, while also supporting microbial nutrient cycling. Synthetic fertilizers provide high levels of immediately available nitrogen and phosphorus, but without organic matter or buffering capacity. These differences underscore the need to tailor fertilization strategies to crop requirements and soil conditions.
Aquaculture-derived by-products such as RAB are particularly notable for their potential within circular economy frameworks. By recycling nutrients from aquaculture back into agriculture, RAB reduces waste burdens while providing agronomically valuable inputs [19,21,24]. While these findings are promising, validation through multi-season, field-scale studies remains essential to determine the long-term reliability of RAB as a sustainable fertilizer option. Future studies should include factorial designs combining mineral and organic fertilizers, and nitrogen-rate gradients, as mixed strategies are increasingly recognized as central to sustainable and balanced fertilization practices. This trial was intentionally limited to a single growing season as an initial evaluation of RAB in durum wheat. Although multi-year studies are needed to confirm consistency across variable conditions, single-season experiments are a common and appropriate first step in exploratory fertilizer research, providing valuable baseline data for broader validation. Additionally, these comparisons reflect high application rates for MAP and UAN in this trial; under lower or balanced mineral regimes, agronomic and environmental outcomes may differ.

4.2. Interpretation of Soil Composition Results

4.2.1. Soil Carbon, Nitrogen, and Sulfur Composition

Differences in soil carbon and nitrogen responses across treatments appear to reflect both the quality of organic matter inputs and their degree of pre-application processing. DMS, composed largely of partially digested plant residues such as cellulose and lignin, may contribute more stable organic fractions that are less prone to rapid decomposition. Such compounds are known to support long-term carbon sequestration, soil aggregation, and microbial habitat quality [5,22]. By contrast, RAB, derived from fish waste and feed residues, likely contain a higher proportion of labile organic matter. The prior mineralization occurring within aquaculture systems can further accelerate decomposition, reducing the amount of carbon retained in soil over the long term. These compositional differences highlight how organic input stability can shape soil carbon trajectories and their potential for long-term sequestration.
Nitrogen availability also differed across treatments in ways consistent with fertilizer origin. Organic inputs such as RAB and DMS provide nitrogen in complex, organically bound forms that mineralize gradually, potentially reducing losses compared to synthetic fertilizers, as noted in field studies [22,23]. RAB may have introduced microbial taxa from aquaculture biofilters, but such contributions remain unverified since microbial dynamics were not directly measured in this trial. Future research using microbial genetic profiling will be needed to confirm whether these communities play longer-term roles in stabilizing nutrient pools and synchronizing release with crop demand [19,21,24].
Sulfur remained consistently limited across treatments, but the pathways differed between fertilizer sources. In organic inputs such as RAB and DMS, sulfur contributions may be rapidly mobilized and taken up by crops, minimizing residual soil accumulation. The synthetic fertilizers used in this study, MAP and UAN, contained no sulfur, creating the potential for sulfur limitation in cereal systems where protein quality and enzymatic activity are sulfur-dependent [34]. While sulfur-fortified formulations, such as UAN-S, are available commercially, they were not part of this experiment. This distinction underscores the importance of evaluating sulfur dynamics not only in soil pools but also in plant uptake, as fertilizer strategies lacking supplemental sulfur may compromise grain quality.
Because only a single post-harvest sampling was performed, short-term nutrient dynamics, particularly for nitrogen and sulfur in these sandy soils, were not captured. This limits resolution of in-season transformations and constrains interpretation of temporal cycling patterns.

4.2.2. Soil Anion Concentrations

Differences in soil anion dynamics among fertilizer treatments reflect both the inherent nutrient content of inputs and the soil processes they facilitate. Organic amendments such as RAB and DMS contributed a broader suite of anions, including nitrite, nitrate, phosphate, and sulfate, alongside organic carbon and possible but unverified microbial taxa, consistent with prior findings in aquaculture-derived residues [21,24]. In contrast, synthetic fertilizers such as MAP and UAN primarily delivered targeted anions, phosphate in the case of MAP and nitrate in the case of UAN, without organic carbon or microbial additions.
The occurrence of nitrite and nitrate in RAB-amended soils is consistent with ongoing nitrification, which could result from mineralization of organic nitrogen. Prior studies also indicate that aquaculture wastes can retain microbial activity, including nitrifiers relevant to nitrogen cycling [19,21,24], suggesting that microbes may have contributed as well. Since microbial dynamics were not directly assessed here, this interpretation remains provisional. By contrast, nitrate from synthetic sources such as UAN is supplied in a highly soluble, immediately available form. While this supports rapid crop uptake, it also increases vulnerability to leaching losses if fertilizer inputs are not well synchronized with crop demand [3,7].
Phosphate availability also diverged between fertilizer types. DMS supplies both inorganic phosphate and organically bound phosphorus, the latter requiring microbial mineralization to become plant-available. While this can provide a longer-term phosphorus source, it also raises concerns about accumulation and potential leaching. In alkaline soils such as those of southern Arizona, phosphate is prone to fixation as hydrogen phosphate (HPO42−), limiting bioavailability and elevating the risk of downstream eutrophication if applied excessively [7,22]. By contrast, RAB provides lower inherent phosphate inputs, which may better align with crop demand while reducing risks of soil phosphorus buildup and environmental loading [2,7,23].
Sulfate inputs further distinguished organic and synthetic fertilizers. RAB supplies substantial sulfate consistent with its relatively high sulfur content, much of which is present in soluble or readily mineralizable forms derived from fish waste and uneaten feed. This profile suggests direct fertilizer contributions that are rapidly mobilized and taken up by crops, underscoring the fast turnover of sulfur in agricultural systems. By contrast, DMS contributed lower amounts of sulfate and may contain a greater proportion of sulfur bound in organic forms such as amino acids and structural residues. These pools would require microbial mineralization before becoming plant-available, resulting in a slower release rate compared with RAB. Because sulfur is critical for protein synthesis and enzymatic activity in cereals [34], these differences imply that RAB may provide a more immediate nutritional advantage, whereas DMS may contribute to longer-term sulfur cycling but with less immediate impact on crop protein. It should also be noted that certain synthetic blends, such as UAN-S, include supplemental sulfur and may alter this dynamic.
Overall, these patterns underscore the dual role of organic fertilizers in contributing both macronutrients and secondary anions, while also fostering biogeochemical transformations that extend nutrient cycling beyond direct chemical additions. Future work incorporating soil microbiome profiling and multi-season field trials will be essential to clarify how these dynamics scale under different management and environmental conditions.

4.2.3. Fertilizer Impacts on Soil Health and Sustainable Integration

Organic fertilizers such as DMS and RAB show promise for enhancing soil carbon and nitrogen pools, with potential co-benefits for soil fertility and resilience. However, these effects may be transient, and their long-term persistence remains uncertain. RAB in particular may introduce biota associated with aquaculture wastes capable of influencing nitrogen, sulfur, and phosphorus cycling, as discussed above. If such microbes persist post-application, they may contribute to continued nutrient transformation and availability, distinguishing RAB from more inert fertilizers. However, this remains hypothetical, and confirmation would require direct microbial analyses and highlight the need for longer-term studies that incorporate soil microbiome analyses and nutrient cycling assessments.
Building on these observations, future research should test explicit hypotheses such as whether aquaculture-derived nitrifying taxa persist in soils following RAB application and contribute to nitrogen cycling; whether RAB-associated microbial consortia enhance synchronization between nutrient mineralization and crop uptake; and whether the combined carbon–sulfur–microbial contributions of RAB underpin its apparent ability to sustain grain protein. Addressing these hypotheses will require multi-season trials that integrate soil microbiome sequencing, isotopic tracing of nutrient fluxes, and factorial fertilizer designs.
While this study characterized baseline soil carbon, nitrogen, and anion pools, soil pH and salinity (EC) were not measured. These parameters are particularly important under arid, irrigated conditions: soil pH directly influences phosphorus solubility, with alkaline soils such as those in southern Arizona favoring less available forms such as hydrogen phosphate (HPO42−), while EC reflects accumulation of soluble salts that can impose osmotic stress on crops. However, in the present trial their omission is unlikely to affect interpretation: the relatively small fertilizer additions compared with the large background soil mass would not be expected to substantially alter pH or EC during a single season, and any short-term fluctuations from irrigation or fertilizer inputs would have occurred uniformly across all plots. Nevertheless, future trials should include these parameters to provide additional resolution on nutrient availability and plant stress responses under variable field conditions.
Contaminant assays including heavy metals, pathogens, and pharmaceuticals were also not performed. Unlike other organic fertilizers with more generalizable profiles, RAB composition is highly source-specific, governed by feed composition, water quality, and system management. A single-source assay would therefore have limited external validity and could misrepresent broader risk. Comprehensive contaminant risk assessment requires source-specific chains of custody, validated multi-analyte panels, and temporal replication, which were beyond the scope of this first-season evaluation focused on agronomic endpoints. In addition, a post hoc power analysis was not conducted, as the small sample size and single-season design would render such calculations unreliable and unlikely to provide inference beyond the descriptive statistics, effect sizes, and confidence intervals already reported. Future multi-site, multi-season trials should integrate such analyses so that agronomic outcomes can be interpreted alongside safety considerations within appropriate regulatory frameworks. Our conclusions are accordingly limited to agronomic performance under the tested conditions and do not constitute a safety determination for RAB in other contexts.
Beyond soil-level impacts, the integration of aquaculture-derived inputs into agriculture addresses two pressing challenges simultaneously: managing nutrient-rich aquaculture waste and reducing reliance on synthetic fertilizers. The findings of this study, though limited in scale and duration, suggest that RAB can supply essential nutrients for durum wheat production while contributing to soil quality improvements. This positions aquaculture waste recycling as a practical step toward circular nutrient economies that benefit both industries. Scaling this work to long-term, replicated field trials will be critical for determining whether RAB can consistently enhance crop performance, support soil resilience, and promote more sustainable fertilizer systems.

4.3. Interpretation of Wheat Quality Metrics

4.3.1. Grain Protein Content in Context

Fertilizer treatments influenced wheat protein content in ways that reflect differences in nutrient composition. RAB maintained protein concentrations comparable to the Control, which may reflect its measurable sulfur inputs, whereas the Control likely sustained protein content through high levels of readily available nitrogen. DMS produced significantly lower protein concentrations than both RAB and the Control, a result that may be explained by its comparatively limited sulfur contribution.
Weed pressures during the growing season likely suppressed overall protein values across treatments by competing with wheat for available nitrogen during critical protein synthesis stages. Such biotic stress underscores the importance of integrating weed management with fertilizer strategies to optimize grain quality outcomes. Taken together, these findings suggest that RAB can maintain wheat protein content comparable to synthetic fertilizers, while DMS may constrain protein accumulation [26,27,34].

4.3.2. Grain Yield in Context

Fertilizer treatments did not produce statistically significant differences in yield or test weight (p > 0.05), though descriptive trends were observed. DMS plots tended to show higher yields, potentially reflecting greater carbon and phosphorus inputs, which may have promoted vegetative growth and improved soil structure through the addition of more stable organic matter. This pattern is consistent with prior findings that manure-derived fertilizers can enhance soil physical properties and nutrient retention [22,23], though in the present trial, the effect did not reach statistical significance and should thus be interpreted in that context.
RAB yields were broadly comparable to those of the Control, though interpretation is complicated by pest damage that reduced harvestable output in one replicate. Correlations between yield and soil carbon suggest that organic matter inputs from both DMS and RAB may have contributed to productivity, even though direct fertilizer nutrient concentrations were lower than those of synthetic fertilizers. These associations should be interpreted cautiously given the limited sample size and lack of statistical separation among treatments.
The numerically higher yields associated with DMS were accompanied by lower grain protein concentrations, highlighting a well-recognized trade-off between quantity and quality in wheat production [26,27]. In contrast, RAB appeared to support both moderate yield and relatively higher grain protein, suggesting that its nutrient profile may better balance agronomic and quality outcomes, though this inference is provisional.
Test weight also did not differ significantly among treatments, though RAB showed numerically higher values than DMS. Because test weight is often positively associated with protein content, larger multi-season studies may help determine whether the protein advantages observed under RAB consistently translate into improvements in grain density and marketability.
Taken together, these results are best interpreted as indicative trends rather than definitive treatment effects. They suggest that organic fertilizers such as DMS and RAB have the potential to support competitive yields relative to conventional fertilizers, but their agronomic benefits may differ. DMS may favor biomass production through stable carbon and phosphorus inputs, whereas RAB may better support integrated outcomes of yield and quality. Longer-term, replicated trials will be needed to confirm these dynamics and assess how they scale under diverse field conditions.
The uncontrolled disturbances observed in this trial, including high weed pressure and pest interference, likely reduced the ability to detect subtle treatment differences. This highlights the need for replicated, multi-season studies under more controlled conditions to strengthen inference.

4.4. Interpretation of Regression Analyses

Regression models provided additional perspective on how fertilizer treatments influenced both grain protein content and yield. For protein, the analysis suggested that DMS was associated with reduced protein accumulation, consistent with its comparatively lower sulfur content and the gradual mineralization of organically bound nitrogen, patterns previously reported in wheat nutrition studies [26,34]. By contrast, RAB maintained protein concentrations statistically comparable to synthetic fertilizers, indicating its potential to sustain grain quality while offering co-benefits for soil. These outcomes may reflect a more balanced nutrient supply than DMS, particularly through sulfur contributions and gradual organic nitrogen mineralization [22,23], though this inference is tentative.
Yield regressions indicated modest positive trends under both DMS and RAB relative to synthetic inputs, though these effects were not statistically robust. The direction of these relationships suggests that organic amendments may support competitive yields, potentially through their contributions of stable carbon and phosphorus in the case of DMS [22,23], or sulfur contributions in the case of RAB [34]. However, the small sample size, uncontrolled field conditions, and lack of statistical separation underscores that these findings should be regarded as exploratory.
Taken together, regression analyses complement the group comparisons by showing that treatment effects may be directional rather than categorical. While DMS appeared to favor biomass production at the expense of protein quality [26,27], and RAB showed potential to balance both outcomes, these patterns should be interpreted as indicative trends requiring confirmation through multi-season, replicated studies across diverse field conditions.

4.5. Interpretation of Correlation Analyses

Correlations among soil and crop variables provided additional insight into potential mechanisms underlying treatment responses. The negative association between yield and protein content aligns with the widely recognized trade-off between grain quantity and quality in wheat systems [26,27]. Although not statistically significant in this study, the trend suggests that modest yield gains may occur at the expense of reduced protein concentration, reinforcing the importance of balancing these outcomes when evaluating fertilizer strategies.
Sulfur emerged as a particularly important factor for grain protein. The positive correlation between sulfate dynamics and protein content suggests that sulfur availability may have supported amino acid and protein biosynthesis, consistent with prior work identifying sulfur as a key determinant in cereal protein quality [26,34]. This highlights the potential need to reconsider sulfur management as a key lever for improving grain quality, particularly in systems reliant on inputs like RAB that inherently supply sulfur.
For yield, soil carbon change was strongly and positively correlated, consistent with broader evidence that organic matter inputs improve soil fertility, water retention, and nutrient supply [5,22,23]. This relationship underscores the value of carbon-rich amendments such as DMS and RAB, which may support sustainable yield improvements while contributing to long-term soil health [22,23].
Together, these patterns indicate that while nitrogen remains essential, sulfur and carbon dynamics may play equally critical roles in shaping wheat productivity and quality [5,22,26,34]. Integrating these insights into fertilizer management could help design strategies that more effectively balance yield and protein outcomes in durum wheat systems.

5. Conclusions

This study demonstrates the potential of recirculating aquaculture system biosolids (RAB) as a sustainable fertilizer for durum wheat production. Despite containing substantially lower nutrient concentrations than synthetic fertilizers, approximately seven-fold lower in total nitrogen, over twenty-fold lower in phosphate, and orders of magnitude lower in nitrate, RAB maintained grain protein content (101 ± 4 g kg−1) comparable to synthetic inputs (96 ± 5 g kg−1). In addition, it supplied sulfur and organic carbon that may support long-term soil fertility. By contrast, dairy manure solids (DMS) tended to produce the highest, though not significant, mean yield (4.8 ± 0.8 t ha−1) but the lowest protein concentration (83 ± 4 g kg−1), highlighting a well-recognized trade-off between biomass production and grain quality. These contrasts suggest that RAB may help balance productivity with nutritional quality, whereas DMS may favor vegetative growth at the expense of protein concentration.
No signs of nitrogen or phosphorus deficiency were observed, suggesting that organically bound nutrient forms and gradual mineralization processes may have helped sustain crop demand under field conditions. While microbial transformations may have also contributed, microbial dynamics were not directly assessed in this study.
This work was limited by its single-season duration, small plot size, high weed pressure, and wildlife interference, all of which reduced statistical power for certain outcomes. In addition, no measurements of potential contaminants such as heavy metals, pharmaceuticals, or pathogens were included. The absence of direct microbial analyses should also be noted. Prior studies indicate that nitrifying taxa from aquaculture systems can persist in associated waste; however, their role in soil nutrient cycling and stability remains unverified here. Future research should explicitly characterize microbial communities in RAB and test hypotheses such as whether aquaculture-derived nitrifiers persist in soils and contribute to nitrogen cycling; whether RAB-associated microbes improve synchronization between nutrient mineralization and crop uptake; and whether combined carbon–sulfur–microbial contributions underpin its ability to sustain grain protein. Multi-season, multi-site trials that integrate microbial profiling and nutrient flux monitoring will be required to evaluate these mechanisms under diverse field conditions.
It should also be noted that the synthetic fertilizer treatments, UAN and MAP, in this study were applied at the upper end of regional recommendations. Under lower or balanced mineral fertilization regimes, outcomes may differ from those observed here, particularly with respect to environmental risk.
By recycling nutrients from aquaculture into agriculture, RAB exemplifies a circular economy approach that links food production systems while reducing waste. These findings provide a foundation for further research into aquaculture-derived fertilizers, positioning RAB as a potential contributor to more sustainable cropping systems, soil health, and food security.

Supplementary Materials

The following supporting information can be downloaded at: https://www.mdpi.com/article/10.3390/agronomy15092237/s1.

Author Contributions

Conceptualization, R.W.; methodology, R.W.; validation, R.W.; formal analysis, R.W.; investigation, R.W. and C.W.; resources, R.W., T.C. and M.R.; data curation, R.W. and T.C.; writing: original draft preparation, R.W.; writing: review and editing, R.W., C.W. and M.R.; visualization, R.W.; supervision, M.R.; project administration, R.W., C.W. and M.R.; funding acquisition, R.W. and M.R. All authors have read and agreed to the published version of the manuscript.

Funding

This research was partially supported by the Arizona Grain Research and Promotion Council (AGRPC; no award number) for equipment, supplies, and testing. The corresponding author was supported as a Graduate Research Assistant by the University of Arizona during the study. The funders had no role in the design of the study; in the collection, analyses, or interpretation of data; in the writing of the manuscript; or in the decision to publish the results.

Data Availability Statement

The dataset supporting the findings of this study is available in the Supplementary Materials of this article.

Acknowledgments

The authors utilized Microsoft Word for spell checking and editing of the manuscript.

Conflicts of Interest

The authors declare no conflicts of interest. The funders had no role in the design of the study; in the collection, analyses, or interpretation of data; in the writing of the manuscript; or in the decision to publish the results.

Abbreviations

The following abbreviations are used in this manuscript:
RABrecirculating aquaculture system biosolids
DMSdairy manure solids
MAPmonoammonium phosphate
UANurea-ammonium nitrate
RASrecirculating aquaculture system
ANOVAanalysis of variance
HSDhonestly significant difference (Tukey’s post hoc test)

References

  1. Smil, V. Enriching the Earth: Fritz Haber, Carl Bosch, and the Transformation of World Food Production; MIT Press: Cambridge, MA, USA, 2004. [Google Scholar]
  2. Tilman, D.; Cassman, K.G.; Matson, P.A.; Naylor, R.; Polasky, S. Agricultural sustainability and intensive production practices. Nature 2002, 418, 671–677. [Google Scholar] [CrossRef]
  3. Smith, P.; Bustamante, M.; Ahammad, H.; Clark, H.; Dong, H.; Elsiddig, E.; Haberl, H.; Harper, R.; House, J.; Jafari, M.; et al. Agriculture, forestry and other land use (AFOLU). In Climate Change 2014: Mitigation of Climate Change. Contribution of Working Group III to the Fifth Assessment Report of the Intergovernmental Panel on Climate Change; Cambridge University Press: Cambridge, UK, 2014. [Google Scholar]
  4. Wyer, K.E.; Kelleghan, D.B.; Blanes-Vidal, V.; Schauberger, G.; Curran, T.P. Ammonia emissions from agriculture and their contribution to fine particulate matter: A review of implications for human health. J. Environ. Manag. 2022, 323, 116285. [Google Scholar] [CrossRef]
  5. Lal, R. Restoring soil quality to mitigate soil degradation. Sustainability 2015, 7, 5875–5895. [Google Scholar] [CrossRef]
  6. Mekonnen, M.M.; Hoekstra, A.Y. Four billion people facing severe water scarcity. Sci. Adv. 2016, 2, e1500323. [Google Scholar] [CrossRef] [PubMed]
  7. Carpenter, S.R.; Caraco, N.F.; Correll, D.L.; Howarth, R.W.; Sharpley, A.N.; Smith, V.H. Nonpoint pollution of surface waters with phosphorus and nitrogen. Ecol. Appl. 1998, 8, 559–568. [Google Scholar] [CrossRef]
  8. Nicholson, F.A.; Smith, S.R.; Alloway, B.J.; Carlton-Smith, C.; Chambers, B.J. An inventory of heavy metals inputs to agricultural soils in England and Wales. Sci. Total Environ. 2003, 311, 205–219. [Google Scholar] [CrossRef]
  9. Li, Y.; McCrory, D.F.; Powell, J.M.; Saam, H.; Jackson-Smith, D. A survey of selected heavy metal concentrations in Wisconsin dairy feeds. J. Dairy Sci. 2005, 88, 2911–2922. [Google Scholar] [CrossRef]
  10. Arikan, O.A.; Mulbry, W.; Rice, C. Management of antibiotic residues from agricultural sources: Use of composting to reduce chlortetracycline residues in beef manure from treated animals. J. Hazard. Mater. 2009, 164, 483–489. [Google Scholar] [CrossRef]
  11. Kaur, J. Pharmaceuticals as emerging contaminant in agriculture: Source, transport, ecological risks, and removal strategies. In Sustainable Agriculture Reviews; Springer: Cham, Switzerland, 2021; pp. 133–176. [Google Scholar] [CrossRef]
  12. Goss, M.J.; Unc, A.; Chen, S. Transport of nitrogen, phosphorus and microorganisms from manure into surface- and groundwater. In Biological Resource Management Connecting Science and Policy; Springer: Berlin/Heidelberg, Germany, 2000; pp. 31–55. [Google Scholar]
  13. FAO. The State of World Fisheries and Aquaculture 2024: Blue Transformation in Action; Food and Agriculture Organization of the United Nations: Rome, Italy, 2024. [Google Scholar]
  14. Soto, D.; Aguilar-Manjarrez, J.; Hishamunda, N. Building an Ecosystem Approach to Aquaculture; Food and Agriculture Organization of the United Nations: Rome, Italy, 2008. [Google Scholar]
  15. Boyd, C.E.; Tucker, C.S. Pond Aquaculture Water Quality Management; Springer: New York, NY, USA, 2012. [Google Scholar]
  16. Naylor, R.L.; Hardy, R.W.; Buschmann, A.H.; Bush, S.R.; Cao, L.; Klinger, D.H.; Little, D.C.; Lubchenco, J.; Shumway, S.E.; Troell, M. A 20-year retrospective review of global aquaculture. Nature 2021, 591, 551–563. [Google Scholar] [CrossRef]
  17. Cabello, F.C. Heavy use of prophylactic antibiotics in aquaculture: A growing problem for human and animal health and for the environment. Environ. Microbiol. 2006, 8, 1137–1144. [Google Scholar] [CrossRef]
  18. Schar, D.; Zhao, C.; Wang, Y.; Larsson, D.G.J.; Gilbert, M.; Van Boeckel, T.P. Twenty-year trends in antimicrobial resistance from aquaculture and fisheries in Asia. Nat. Commun. 2021, 12, 5384. [Google Scholar] [CrossRef] [PubMed]
  19. Timmons, M.B.; Vinci, B.J. The Yellow Book of Recirculating Aquaculture, 5th ed.; Ithaca Publishing Company LLC: Ithaca, NY, USA, 2022. [Google Scholar]
  20. de Amorim Júnior, S.S.; de Souza Pereira, M.A.; Morishigue, M.; de Costa, R.B.; de Oliveira Guilherme, D.; Magalhães Filho, F.J.C. Circular economy in the biosolids management by nexus approach: A view to enhancing safe nutrient recycling—Pathogens, metals, and emerging organic pollutants concern. Sustainability 2022, 14, 14693. [Google Scholar] [CrossRef]
  21. Zhang, H.; Gao, Y.; Liu, J.; Lin, Z.; Lee, C.T.; Hashim, H.; Wu, W.-M.; Li, C. Recovery of nutrients from fish sludge as liquid fertilizer to enhance sustainability of aquaponics: A review. Chem. Eng. Trans. 2021, 83, 55–60. [Google Scholar] [CrossRef]
  22. Antille, D.L.; Godwin, R.J.; Sakrabani, R.; Seneweera, S.; Tyrrel, S.F.; Johnston, A.E. Field-scale evaluation of biosolids-derived organomineral fertilizers applied to winter wheat in England. Agron. J. 2017, 109, 654–674. [Google Scholar] [CrossRef]
  23. Pampana, S.; Rossi, A.; Arduini, I. Biosolids benefit yield and nitrogen uptake in winter cereals without excess risk of N leaching. Agronomy 2021, 11, 1482. [Google Scholar] [CrossRef]
  24. Burducea, M.; Lobiuc, A.; Dirvariu, L.; Oprea, E.; Olaru, S.M.; Teliban, G.-C.; Stoleru, V.; Poghirc, V.A.; Cara, I.G.; Filip, M.; et al. Assessment of the fertilization capacity of the aquaculture sediment for wheat grass as sustainable alternative use. Plants 2022, 11, 634. [Google Scholar] [CrossRef]
  25. Shewry, P.R.; Hey, S.J. The contribution of wheat to human diet and health. Food Energy Secur. 2015, 4, 178–202. [Google Scholar] [CrossRef]
  26. Gerba, L.; Getachew, B.; Walelign, W. Nitrogen fertilization effects on grain quality of durum wheat (Triticum turgidum L. var. durum) varieties in central Ethiopia. Agric. Sci. 2013, 4, 123–130. [Google Scholar] [CrossRef]
  27. Flagella, Z.; Giuliani, M.M.; Giuzio, L.; Volpi, C.; Masci, S. Influence of water deficit on durum wheat storage protein composition and technological quality. Eur. J. Agron. 2010, 33, 197–207. [Google Scholar] [CrossRef]
  28. Ottman, M. Planting Dates for Small Grains in Arizona; University of Arizona Cooperative Extension: Tucson, AZ, USA, 2015. [Google Scholar]
  29. Husman, S.; Ottman, M. Irrigation of Small Grains in Arizona; University of Arizona Cooperative Extension: Tucson, AZ, USA, 2015. [Google Scholar]
  30. Ottman, M. Fertilizing Small Grains in Arizona; University of Arizona Cooperative Extension: Tucson, AZ, USA, 2020. [Google Scholar]
  31. Mon, J.; Bronson, K.F.; Hunsaker, D.J.; Thorp, K.R.; White, J.W.; French, A.N. Interactive effects of nitrogen fertilization and irrigation on grain yield, canopy temperature, and nitrogen use efficiency in overhead sprinkler-irrigated durum wheat. Field Crops Res. 2016, 191, 54–65. [Google Scholar] [CrossRef]
  32. U.S. Environmental Protection Agency. Method 300.0: Determination of Inorganic Anions by Ion Chromatography, Revision 2.1; Environmental Monitoring Systems Laboratory, Office of Research and Development, U.S. EPA: Cincinnati, OH, USA, 1997. [Google Scholar]
  33. Pan, W.L.; Madsen, I.J.; Bolton, R.P.; Graves, L.; Sistrunk, T. Ammonia/Ammonium Toxicity Root Symptoms Induced by Inorganic and Organic Fertilizers and Placement. Agron. J. 2016, 108, 2485–2492. [Google Scholar] [CrossRef]
  34. Narayan, O.P.; Kumar, P.; Yadav, B.; Dua, M.; Johri, A.K. Sulfur nutrition and its role in plant growth and development. Plant Signal. Behav. 2022, 18, 2030082. [Google Scholar] [CrossRef]
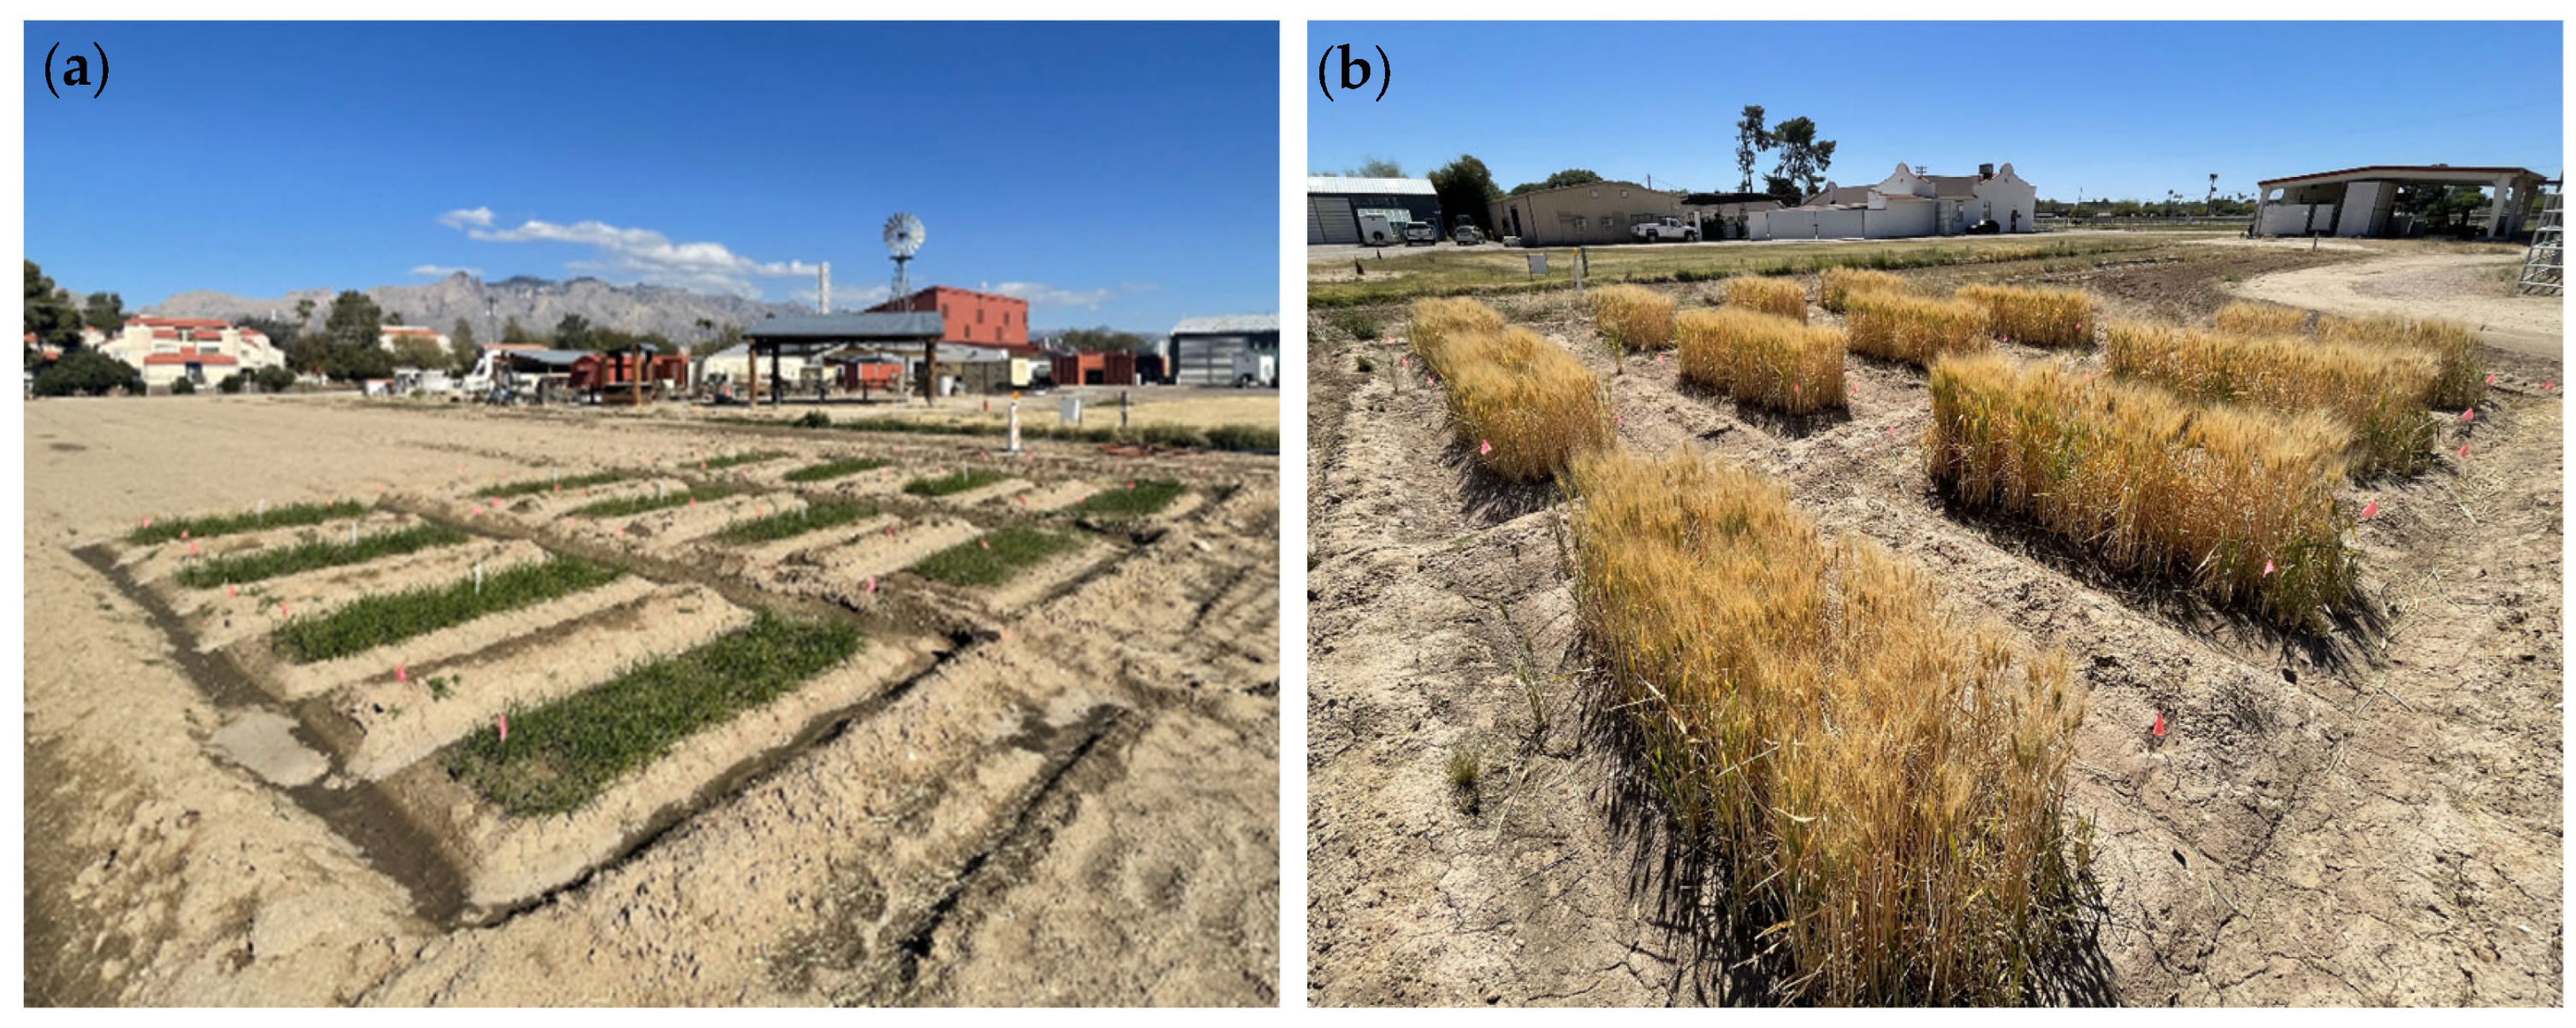
Figure 1. Field plots at the University of Arizona Campus Agricultural Center in Tucson, Arizona, shown during (a) early vegetative growth and (b) pre-harvest maturity of Desert Durum® wheat. The field experiment evaluated the productivity of recirculating aquaculture biosolids as a sole nitrogen source compared to synthetic fertilizers and dairy manure solids during the 2023–2024 winter growing season. Photo credit: Ryan Wheaton.
Agronomy 15 02237 g001
Figure 2. Experimental field layout showing plot arrangement, irrigation furrows, and berms.
Agronomy 15 02237 g002
Figure 3. Representative field conditions across the growing season: (a) pre-treatment field setup, (b) early stand establishment and seedling emergence of Desert Durum® wheat, (c) late vegetative growth, (d) early grain filling, and (e) physiological maturity prior to harvest. Field study conducted in Tucson, Arizona, during the 2023–2024 winter growing season.
Agronomy 15 02237 g003
Figure 4. Mean soil carbon (a) and nitrogen (b) content (g kg−1) by treatment. Error bars represent ± standard deviation (n = 4). No significant differences were detected among treatments (p > 0.05). Control = monoammonium phosphate (MAP) and urea–ammonium nitrate (UAN); DMS = dairy manure solids; RAB = recirculating aquaculture biosolids.
Agronomy 15 02237 g004
Figure 5. Mean soil anion concentrations by treatment: (a) nitrite and nitrate, (b) phosphate and sulfate. Error bars represent ± standard deviation (n = 4). No significant differences were detected among treatments (p > 0.05). Control = monoammonium phosphate (MAP) and urea-ammonium nitrate (UAN); DMS = dairy manure solids; RAB = recirculating aquaculture biosolids.
Agronomy 15 02237 g005
Figure 6. Correlation heatmap of soil variables and grain protein content. Pearson correlation coefficients (r) are shown, with color intensity indicating strength and direction of association. A significant positive correlation was observed between soil sulfate change and grain protein content (p < 0.05); all other associations were non-significant (p > 0.05). Significant correlations are denoted with an asterisk (*); non-significant associations are marked with a cross (×).
Agronomy 15 02237 g006
Figure 7. Correlation heatmap of soil variables and grain yield. Pearson correlation coefficients (r) are shown, with color intensity indicating strength and direction of association. A significant positive correlation was observed between soil carbon change and yield (p < 0.05); all other associations were non-significant (p > 0.05). Significant correlations are denoted with an asterisk (*); non-significant associations are marked with a cross (×).
Agronomy 15 02237 g007
Table 1. Fertilizer application rates and dates by growth stage.
Growth Stage (Feekes)DateUAN/MAP (kg ha−1)DMS (kg ha−1)RAB (kg ha−1)
Pre-plant (0)15 Nov 2023112.1/112.1112.1/0.82112.1/0.09
Tillering 5 (5)16 Jan 202444.8/044.8/0.3344.8/0.03
Jointing 2 (7)05 Feb 202444.8/044.8/0.3344.8/0.03
Boot 1 (9)06 Mar 202444.8/044.8/0.3344.8/0.03
Heading 1 (10.1)20 Mar 202456.0/056/0.4156.0/0.04
Ripening (11)04 Apr 202433.6/033.6/0.2533.6/0.03
Total336.3/112.1336.3/2.46336.3/0.26
Values represent nitrogen/phosphorus (kg ha−1) applied at each stage during the 2023–2024 winter growing season in Tucson, Arizona, USA. Totals reflect cumulative nutrient inputs per treatment across all applications, expressed in kg ha−1 equivalents; actual treatment volumes were scaled to individual plot dimensions.
Table 4. Wheat quality metrics.
TreatmentGrain Protein (g kg−1)Grain Yield (t ha−1)Test Weight (kg hL−1)
Control96 ± 5 a3.6 ± 0.479.2 ± 0.5
DMS83 ± 4 b4.8 ± 0.877.8 ± 1.3
RAB101 ± 4 a4.4 ± 0.880.1 ± 0.4
Values are expressed as mean ± standard deviation (n = 4). Grain protein is reported in g kg−1 (converted from wt.%). Superscript letters denote statistical groupings based on ANOVA followed by Tukey’s HSD (α = 0.05); treatments sharing the same letter are not significantly different. Control = monoammonium phosphate (MAP) and urea-ammonium nitrate (UAN); DMS = dairy manure solids; RAB = recirculating aquaculture biosolids.
Disclaimer/Publisher’s Note: The statements, opinions and data contained in all publications are solely those of the individual author(s) and contributor(s) and not of MDPI and/or the editor(s). MDPI and/or the editor(s) disclaim responsibility for any injury to people or property resulting from any ideas, methods, instructions or products referred to in the content.