Article

Comparative UV-B Stress Responses in Maize and Sorghum Based on Biophoton Emission Measurements and Morphophysiological Traits

1
Institute of Agronomy, Department of Agronomy, Kaposvár Campus, Hungarian University of Agriculture and Life Sciences, Guba Sándor Str 40., H-7400 Kaposvár, Hungary
2
Nitrogénművek Zrt, Hősök Tere 14., H-8105 Pétfürdő, Hungary
*
Author to whom correspondence should be addressed.
Agronomy 2025, 15(9), 2224; https://doi.org/10.3390/agronomy15092224
Submission received: 18 August 2025 / Revised: 14 September 2025 / Accepted: 19 September 2025 / Published: 20 September 2025
(This article belongs to the Section Plant-Crop Biology and Biochemistry)

Abstract

Ultraviolet-B (UV-B, 280–315 nm) radiation is an increasingly relevant abiotic stressor under climate-change scenarios, yet crop-specific tolerance mechanisms remain insufficiently understood. We compared maize (Zea mays L.) and grain sorghum (Sorghum bicolor L.) seedlings exposed to eight UV-B durations (1–12 h), applied every second day over 14 days of juvenile growth. Highly sensitive, non-invasive biophoton emission imaging (NightShade® LB 985), chlorophyll content measurements (SPAD-502), and morphophysiological traits (shoot/root lengths, biomass, root collar diameter) were assessed. Biophoton emission kinetics measured immediately and 24 h after exposure suggested differing temporal defense dynamics: maize showed an early modest increase, a mid-exposure reduction, and a later pronounced peak around 6 h. Sorghum tended to reach a dominant peak earlier (≈3 h) and maintain relatively steady emissions thereafter, potentially reflecting more uniform antioxidant activation. SPAD patterns aligned with these trends: maize retained higher chlorophyll at lower exposures (0–6 h; p < 0.05), whereas sorghum surpassed maize at extreme exposures (10–12 h; p = 0.036). Morphophysiological traits showed no significant treatment effects, though minor low-dose peaks suggested possible ROS-mediated stimulation. These results indicate species-specific UV-B acclimation patterns and demonstrate the utility of biophoton imaging as a rapid screening tool for assessing crop resilience.

1. Introduction

Maize (Zea mays L.) and grain sorghum (Sorghum bicolor (L.) Moench.) are two of the most significant cereal crops globally, contributed their exceptional adaptability and wide range of uses, particularly in human nutrition and livestock feed [1,2]. The life cycle, sowing time, and nutrient requirements of corn and grain sorghum are practically identical, which makes it possible to easily integrate sorghum cultivation into corn production technology [3]. The most significant disparities pertain to their respective water and soil requirements. Grain sorghum has emerged as a viable alternative for mitigating crop losses incurred due to the deleterious effects of climate change, primarily because of its lower water demand. In terms of soil requirements, sorghum has been found to be less demanding than corn. However, excessive soil acidity or alkalinity has been demonstrated to result in poor germination and emergence, as well as considerable yield losses [4,5].
It is evident that climate change has resulted in an increased frequency of extreme weather conditions, which has consequently led to a notable decline in the stability of maize yield [6]. Among the various abiotic stressors, a gradual rise in ultraviolet-B (UV-B) radiation (280–315 nm) has emerged as a key factor [7,8]. Although UV-B radiation constitutes a mere 1.5% of the total solar radiation that reaches Earth’s surface [9,10], it has been demonstrated to exert significant detrimental effects on mitochondrial and chloroplast DNA, in addition to exerting an influence on the overall morphology of plants. These impacts disrupt several vital physiological processes [11,12,13]. In a foundational study, Middleton and Teramura [14] demonstrated that elevated UV-B levels trigger the detachment of chlorophyll molecules from the photosynthetic apparatus, thereby reducing photosynthetic efficiency. This physiological adjustment appears to be aimed at limiting UV-B absorption and protecting photosystem II (PSII) from damage [15,16]. In order to counteract this decline in photosynthetic activity, it is essential to have an efficient hydrogen peroxide (H2O2) scavenging system [17]. Increased peroxidase activity has been reported in response to various environmental stressors, with UV-B radiation playing a particularly prominent role as part of the plant’s defense mechanism [18,19]. Furthermore, the highly reactive hydroxyl radical (OH˙) is produced via Fenton-type reactions, when UV-B -induced H2O2 reacts with redox-active metals (Fe2+/Mn2+) in chloroplasts and peroxisomes, causing rapid oxidation of membrane lipids and nucleic acids. Due to its extreme reactivity and short lifetime, OH˙ formation is a key trigger for recruiting non-enzymatic antioxidants (e.g., flavonoids, ascorbate) that prevent propagation of oxidative damage [20]. Pospíšil [21] showed that under UV-B exposure, over-reduction in the PSII electron transport chain promotes one-electron reduction of O2, yielding O2, primarily at the acceptor side of PSII. The superoxide radical is rapidly dismutated—either spontaneously or via superoxide dismutases—into H2O2, linking O2 generation directly to peroxidase-mediated defense pathways. However, not only disrupting processes may be linked to UV-B presence, but, it also activates the UVR8 (UV-B RESISTANCE 8) photoreceptor, which facilitates adaptation to UV-induced stress by regulating the expression of DNA repair enzymes [22].
Sensitivity to UV-B radiation varies widely both within and across plant species, but the underlying mechanisms remain poorly understood, and findings in the literature are often inconsistent [23,24]. For instance, He et al. [25] reported no significant changes in chlorophyll content under increasing UV-B radiation in rice (Oryza sativa L.) and peas (Pisum sativum L.), with similar results later observed in white clover (Trifolium repens L.) [26] and cucumber (Cucumis sativus L.) [27]. Conversely, other studies have documented a decline in chlorophyll content, as evidenced in spinach (Spinacia oleracea L.) [28] and frogweed (Lemna major L.) [29]. Middleton and Teramura’s [14] observations of elevated UV-B levels eliciting an increase in chlorophyll concentration in soybean (Glycine max L.) are of particular interest. The results pertaining to maize have been inconclusive. Some studies demonstrated a decline in chlorophyll content of approximately 16% after three days of UV-B exposure at a constant dose, with more substantial declines observed at higher intensities [30,31]. However, other studies have reported an increase in chlorophyll content in different maize genotypes [32,33]. Conversely, exposure to UV-B radiation in grain sorghum resulted in an increase in chlorophyll and carotenoid contents, accompanied by a decrease in the chlorophyll a/b ratio [34]. The reduction in photosynthetic pigments has been shown to substantially impair the rate of photosynthesis [35,36].
Numerous studies have examined the effects of UV-B radiation on the development of vegetative plant organs, yielding more consistent findings than investigations into chlorophyll content. Prolonged exposure or higher doses of UV-B radiation significantly influence morphological traits, plant growth, and biomass accumulation [37]. Radiation-induced morphological changes can include increased leaf thickness, altered leaf shape and width, reduced stem elongation and enhanced axillary shoot formation [38,39,40,41]. Changes in plant growth and leaf area have been documented in several species, including wheat (Triticum aestivum L.) [42], buckwheat (Fagopyrum esculentum M.) [38], peas (Pisum sativum L.) [43] and soybeans [44]. However, in maize, higher UV-B exposure did not significantly affect growth parameters such as plant height or leaf development. By contrast, grain sorghum exhibited a notable reduction in plant height under similar conditions [45]. Similar findings were reported by Kataria and Guruprasad [34], who observed reduced height and decreased biomass accumulation, attributing this to shortened internodes. Interestingly, Zhang et al. [46] used filters to block most of the UV radiation and subsequently observed a significant increase in shoot growth. In their research, Coleman and Day [47] also observed increased shoot growth intensity accompanied by a reduction in leaf area.
In contemporary plant research, various non-invasive, in vivo analytical techniques play a crucial role in detecting plant stress states as they allow for the repeated, non-destructive monitoring of individual plants throughout their development. One such method is the increasingly utilized biophoton emission measurement technique, which detects light emissions associated with photosynthetic and oxidative activities [48,49]. This technique enables the evaluation of photosystem II (PSII) performance via delayed fluorescence (DF) and various oxidative processes and ultra-weak bioluminescence (UWLE) [50]. Previous studies have clearly demonstrated that DF [51,52] and UWLE [50,53] is a reliable indicator of stress conditions in plants [51,52].
Our study has several specificities: first of all, we investigate the juvenile developmental stages of two plant species under UV-B exposures that we expect to continue to experience in the future due to climate change, and in each case using highly sensitive, non-invasive instruments to detect the resulting stress conditions. In addition, we carry out a comparative analysis of the two plant species that could be potential alternatives to each other due to climate change. Our results and conclusions can make a significant contribution to the development of future crop production strategies. Despite the wealth of research conducted on the subject of UV radiation in the international literature [33,54,55], our study employs a distinctive amalgamation of experimental approaches, incorporating biophoton emission analysis, chlorophyll content determination, and measurements of root length, root mass, and root collar diameter. Despite the plethora of comparative analyses that are currently available, no study to date has employed a methodology that is comparable to the one proposed herein. This fact serves to emphasize the uniqueness of the present research.

2. Materials and Methods

The selection of appropriate hybrids was essential to ensure consistency; so, hybrids of maize and sorghum belonging to the same maturity group were used. Consequently, KWS KASHMIR® was selected for maize, and KWS SO MSN 190® for grain sorghum. KWS KASHMIR® is a medium-maturity hybrid corn intended for use in cereal production, with FAO numbers ranging from 350 to 400. Both hybrids are characterized by their noteworthy drought tolerance, vigorous early growth, and robust disease resistance. Prior to sowing, seeds were treated with Redigo M + Concep III (Syngenta Crop Protection, Greensboro, NC, USA). The plants were cultivated under controlled laboratory conditions in pots with a diameter of 13 cm. The experiment involved the planting of three seeds in each pot at a depth of 2 cm. The soil used in this study was Florimo® general potting compost, a blend of Sphagnum moss and plain peat, composted cattle manure, and clay. The minimum organic matter content of the soil was 70%. The experimental design involved the examination of 18 individual plants per treatment group (UV-B 1; 2; 3; 4; 6; 8; 10; and 12 h) and 33 plants in the control group, thus yielding a total sample size of 177 plants for both species. In order to circumvent the potentially deleterious effects of multiple stress factors, the quantity of water was meticulously regulated to the level required for optimal plant growth. Consequently, every other day, 50 mL of distilled water was added to each pot.
The summary of the whole experiment setup can be seen in Figure 1. Eight distinct UV-B irradiation treatments, differing in duration, were applied at regular intervals ranging from 1; 2; 3; 4; 6; 8; 10 and 12 h. Treatment delivery occurred at regular, consistent time points, every two days. A total of eight experimental treatments involving different time intervals were conducted. Throughout all developmental stages, the plants were exposed to UV radiation from 8:00, with the distance between the UV lamps and the plants maintained at 30 cm to prevent the high temperature emitted by the lamps from affecting the plants. This ensured the uniformity of the effects observed across all experimental units. The lamps utilized in this study have a UV index of 14, which corresponds to levels currently found in tropical and subtropical climates. The UV index is a measure of the intensity and potential hazards of UV radiation that has been standardized on an international level. In order to eliminate variability in water availability and to avoid the adverse effects of drought, the soil mass within each pot was standardized (950 g/pot). The cultivation of plants was conducted in a controlled environment using a Pol-Eco Apartura KK 1450 climate chamber, which was maintained at a diurnal temperature cycle of 22 °C during the day and 16 °C at night, with a 12 h light and 12 h dark photoperiod. Following the emergence of the plants, their growth rate was monitored through daily measurements of shoot length, performed manually using a standard ruler. The germination of seedlings was defined as the emergence of a minimum shoot height of 1 mm.
On the 7th and 14th days following sowing, the physiological responses of the plants to stress were evaluated by assessing changes and differences in biophoton emission and chlorophyll content. These measurements provided insight into alterations in photosynthetic activity and stress-related physiological processes over time. To prevent the confounding of multiple stress factors, only the water volume necessary for optimal plant growth was supplied. The experimental period spanned 14 days post-sowing, after which the plants had reached the 3- to 4-leaf stage, corresponding to BBCH growth stages 13–14. At the end of the experiment (day 14), the stem and root biomass, shoot and root lengths, as well as the root collar diameter of the plants were measured. In the case of both biophoton emission measurements (7th and 14th days) and morphophysiological examinations (14th day), the assessment was made of all 176 plants available.

2.1. In Vivo Stress Testing Methods

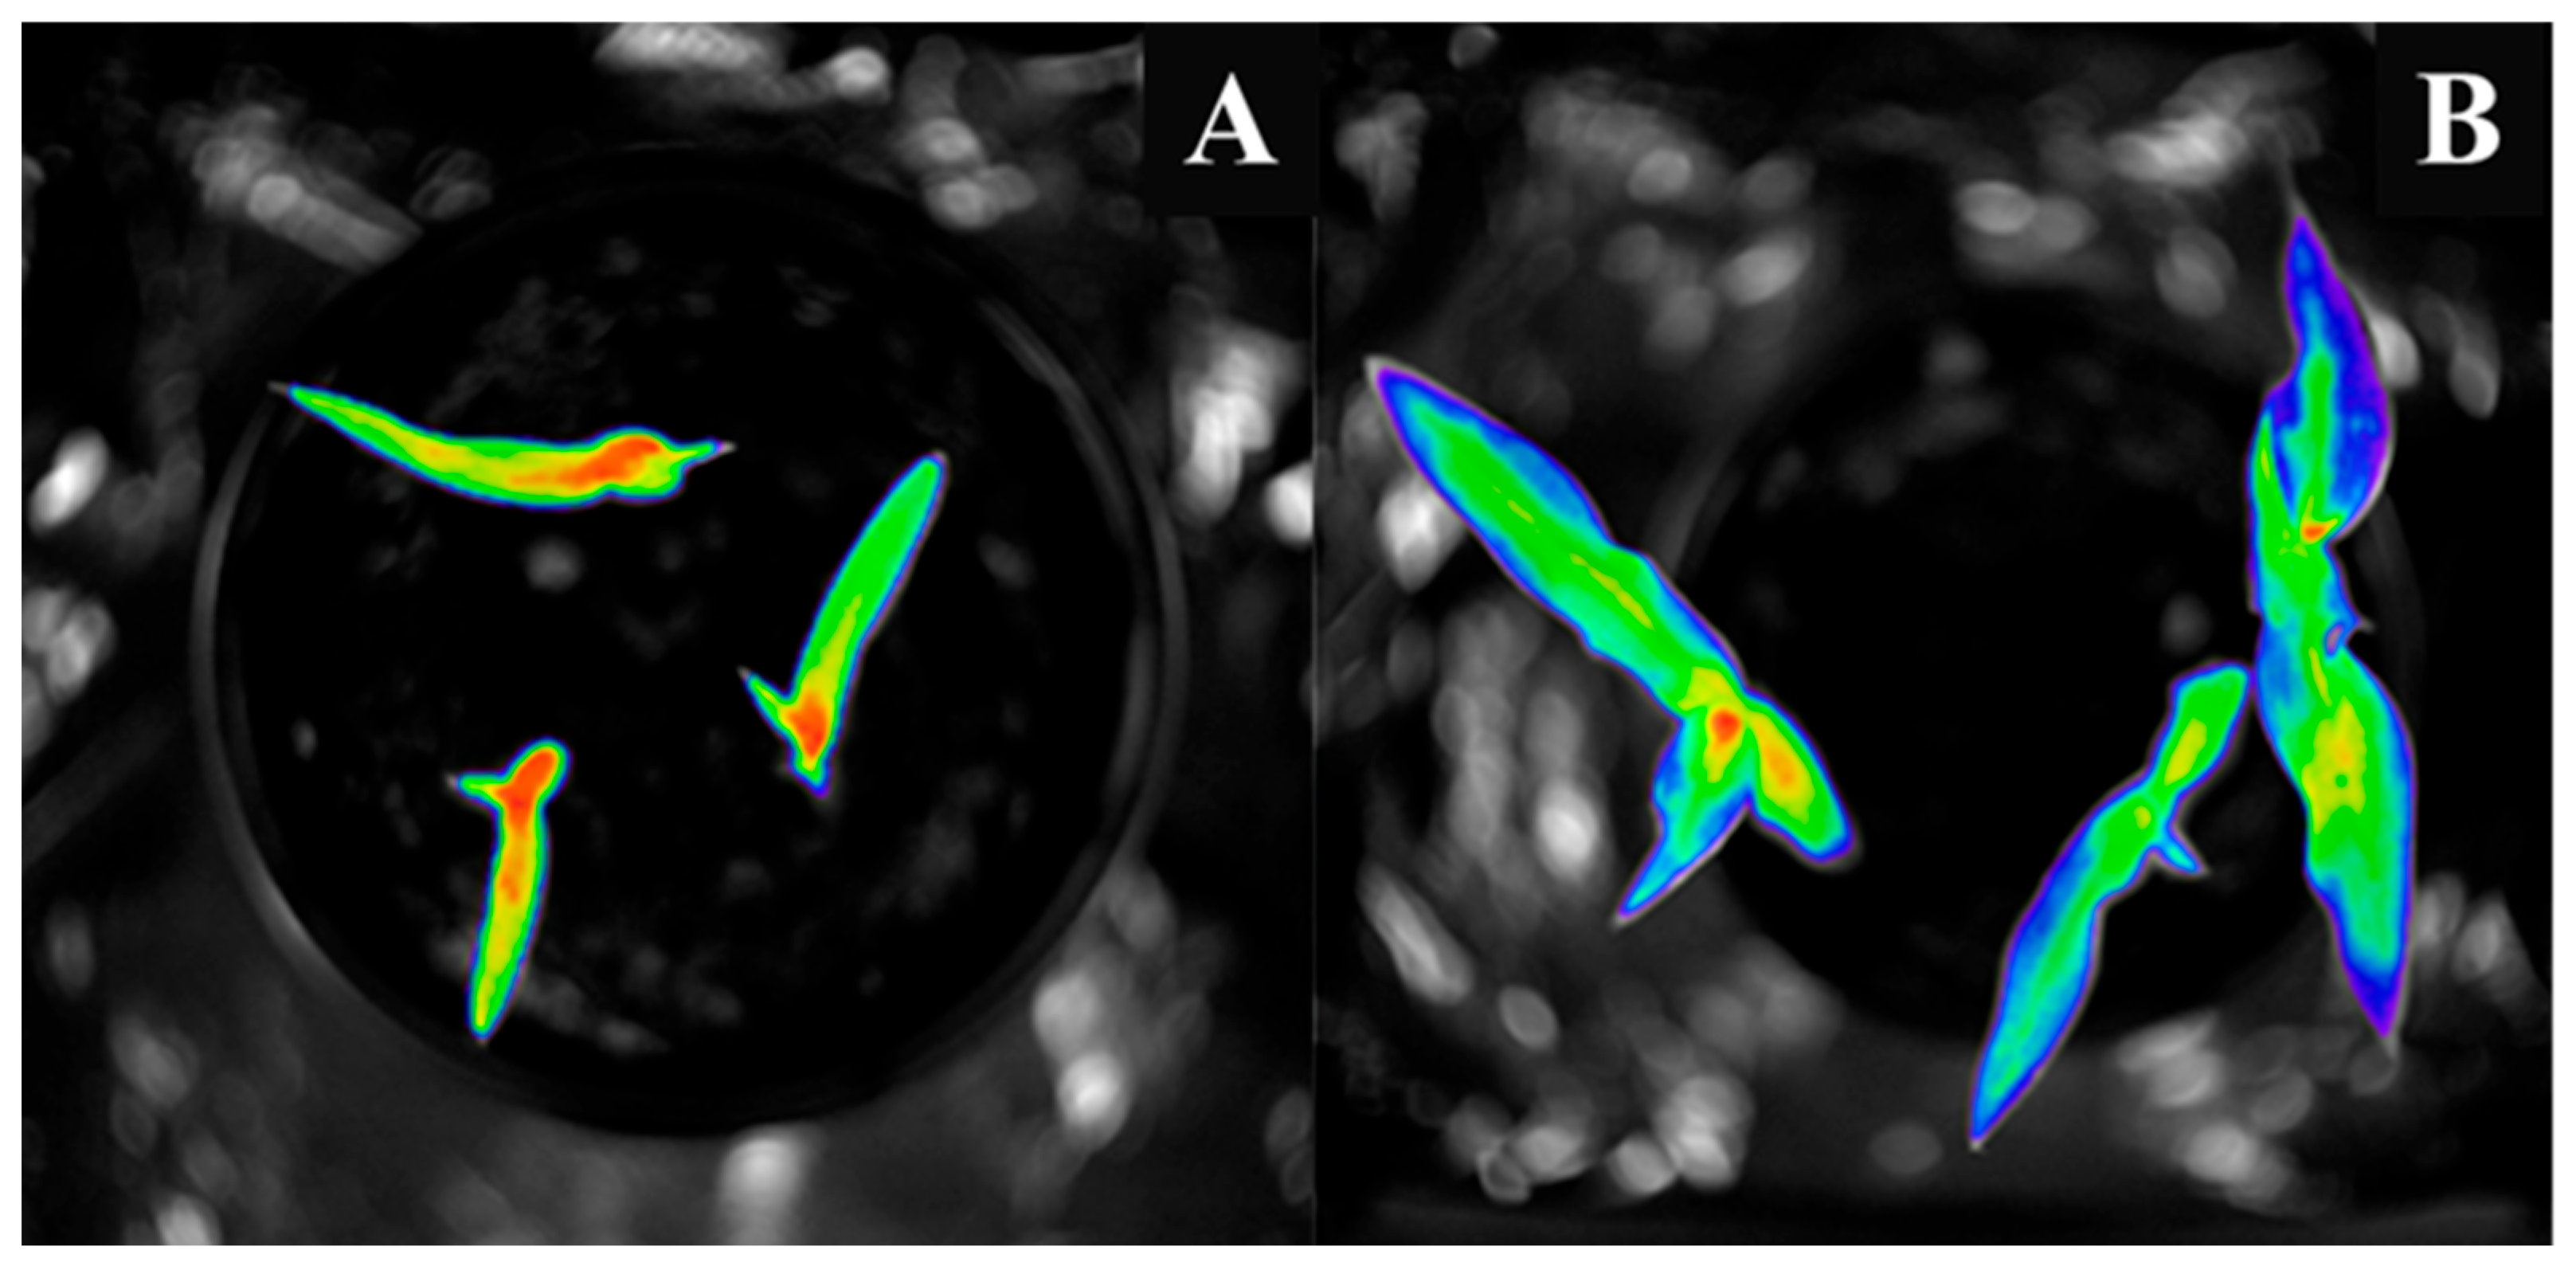
The process of biophoton emission was detected and quantitatively assessed using the NightShade® LB 985 In Vivo Plant Imaging System (Berthold Technologies Bioanalytical Instruments, Bad Wildbad, Germany). The system is equipped with a NightOwlcam CCD camera (Berthold Technologies) that is thermoelectrically cooled to a temperature of −68 °C, the purpose of which is to minimize thermal noise. The acquisition of images was conducted with an exposure time of 60 s and utilized a 4 × 4 pixel binning mode to enhance the signal-to-noise ratio. During the process of data collection, the “background correction” and “cosmic suppression” functions were both activated in order to eliminate high-intensity pixel artifacts that were potentially the result of cosmic radiation. In order to establish a standardized baseline, LED panels emitting light at peak wavelengths—namely, far-red (730 nm), red (660 nm), green (565 nm), and blue (470 nm)—were applied for five seconds at maximum intensity. Subsequent to the application of illumination, the occurrence of bioluminescence was monitored for a period of 10 min in conditions of darkness. The imaging system was operated using IndiGo™ software version 2.0.5.0 (Berthold Technologies Bioanalytical Instruments, Bad Wildbad, Germany), which made it possible to visualize the biophoton emission as it can be seen in Figure 2A,B. It is imperative to note that all measurements were conducted under identical instrument settings to ensure comparability across treatments. Consequently, any observed variations in relative pixel intensities could be attributed exclusively to differences in photon emission induced by the treatments. Image analysis was also performed using IndiGo™ software, with results expressed in counts per second (cps). In order to normalize for variations in plant size, the measurement of photosynthetic activity was expressed further as counts per second per square millimeter (cps/mm2).
The assessment of chlorophyll content was conducted utilizing a Konica Minolta® SPAD-502 (Konica Minolta, Europaallee 17 30855 Langenhagen Germany) chlorophyll meter, thereby facilitating the determination of the SPAD index. In order to ensure a more representative and accurate estimation of leaf chlorophyll concentration, measurements were taken at five points on all 177 plant, on the 7th and 14th days post-hatching. The measurement points were systematically located on the same leaves and spaced evenly to obtain data along the entire leaf surface. Consequently, following the two measurement days, a total of 1770 data points were available for analysis.
The SPAD value is dimensionless. The value obtained during measurement is derived from the optical density difference between the red and infrared wavelengths, and can range from 1 to 100 [56].

2.2. Examining Stem and Root Growth

The growth dynamics of plants subjected to UV-B radiation at different time intervals were examined systematically. Daily measurements were taken from the soil surface to the tip of the uppermost leaf from the point of germination onwards. However, comparative analysis between the two plant species was complicated by their inherent differences in growth patterns.
During the eradication phase of the experiment, the stalks of maize and grain sorghum were excised just above the rootstock. Subsequently, the root systems were carefully extracted from the soil, rinsed under running water, and gently blotted dry using paper towels. Following sample preparation, the leaf area index and fresh shoot biomass were determined. For the root systems, total root length and fresh root mass were recorded. All mass measurements were conducted using a precision analytical balance. Four parameters were measured (root length, root collar diameter, root weight, and stem weight) using a 1 mm precision for length and a laboratory scale accurate to 0.01 g for weight.

2.3. Statistical Methodologies

The data was organized and recorded in the Microsoft® Excel software program. The dataset, encompassing parameters such as germination, growth, and in vivo stress detection, was subjected to a one-way ANOVA analysis to investigate variations in germination ability, growth rates, and biophoton emission among the various experimental treatments and conditions. All analyses were carried out using R Statistical Software version 4.3.2 [57] and agricolea package [58].

3. Results

3.1. Comparison of Stress Tolerance of Maize and Sorghum

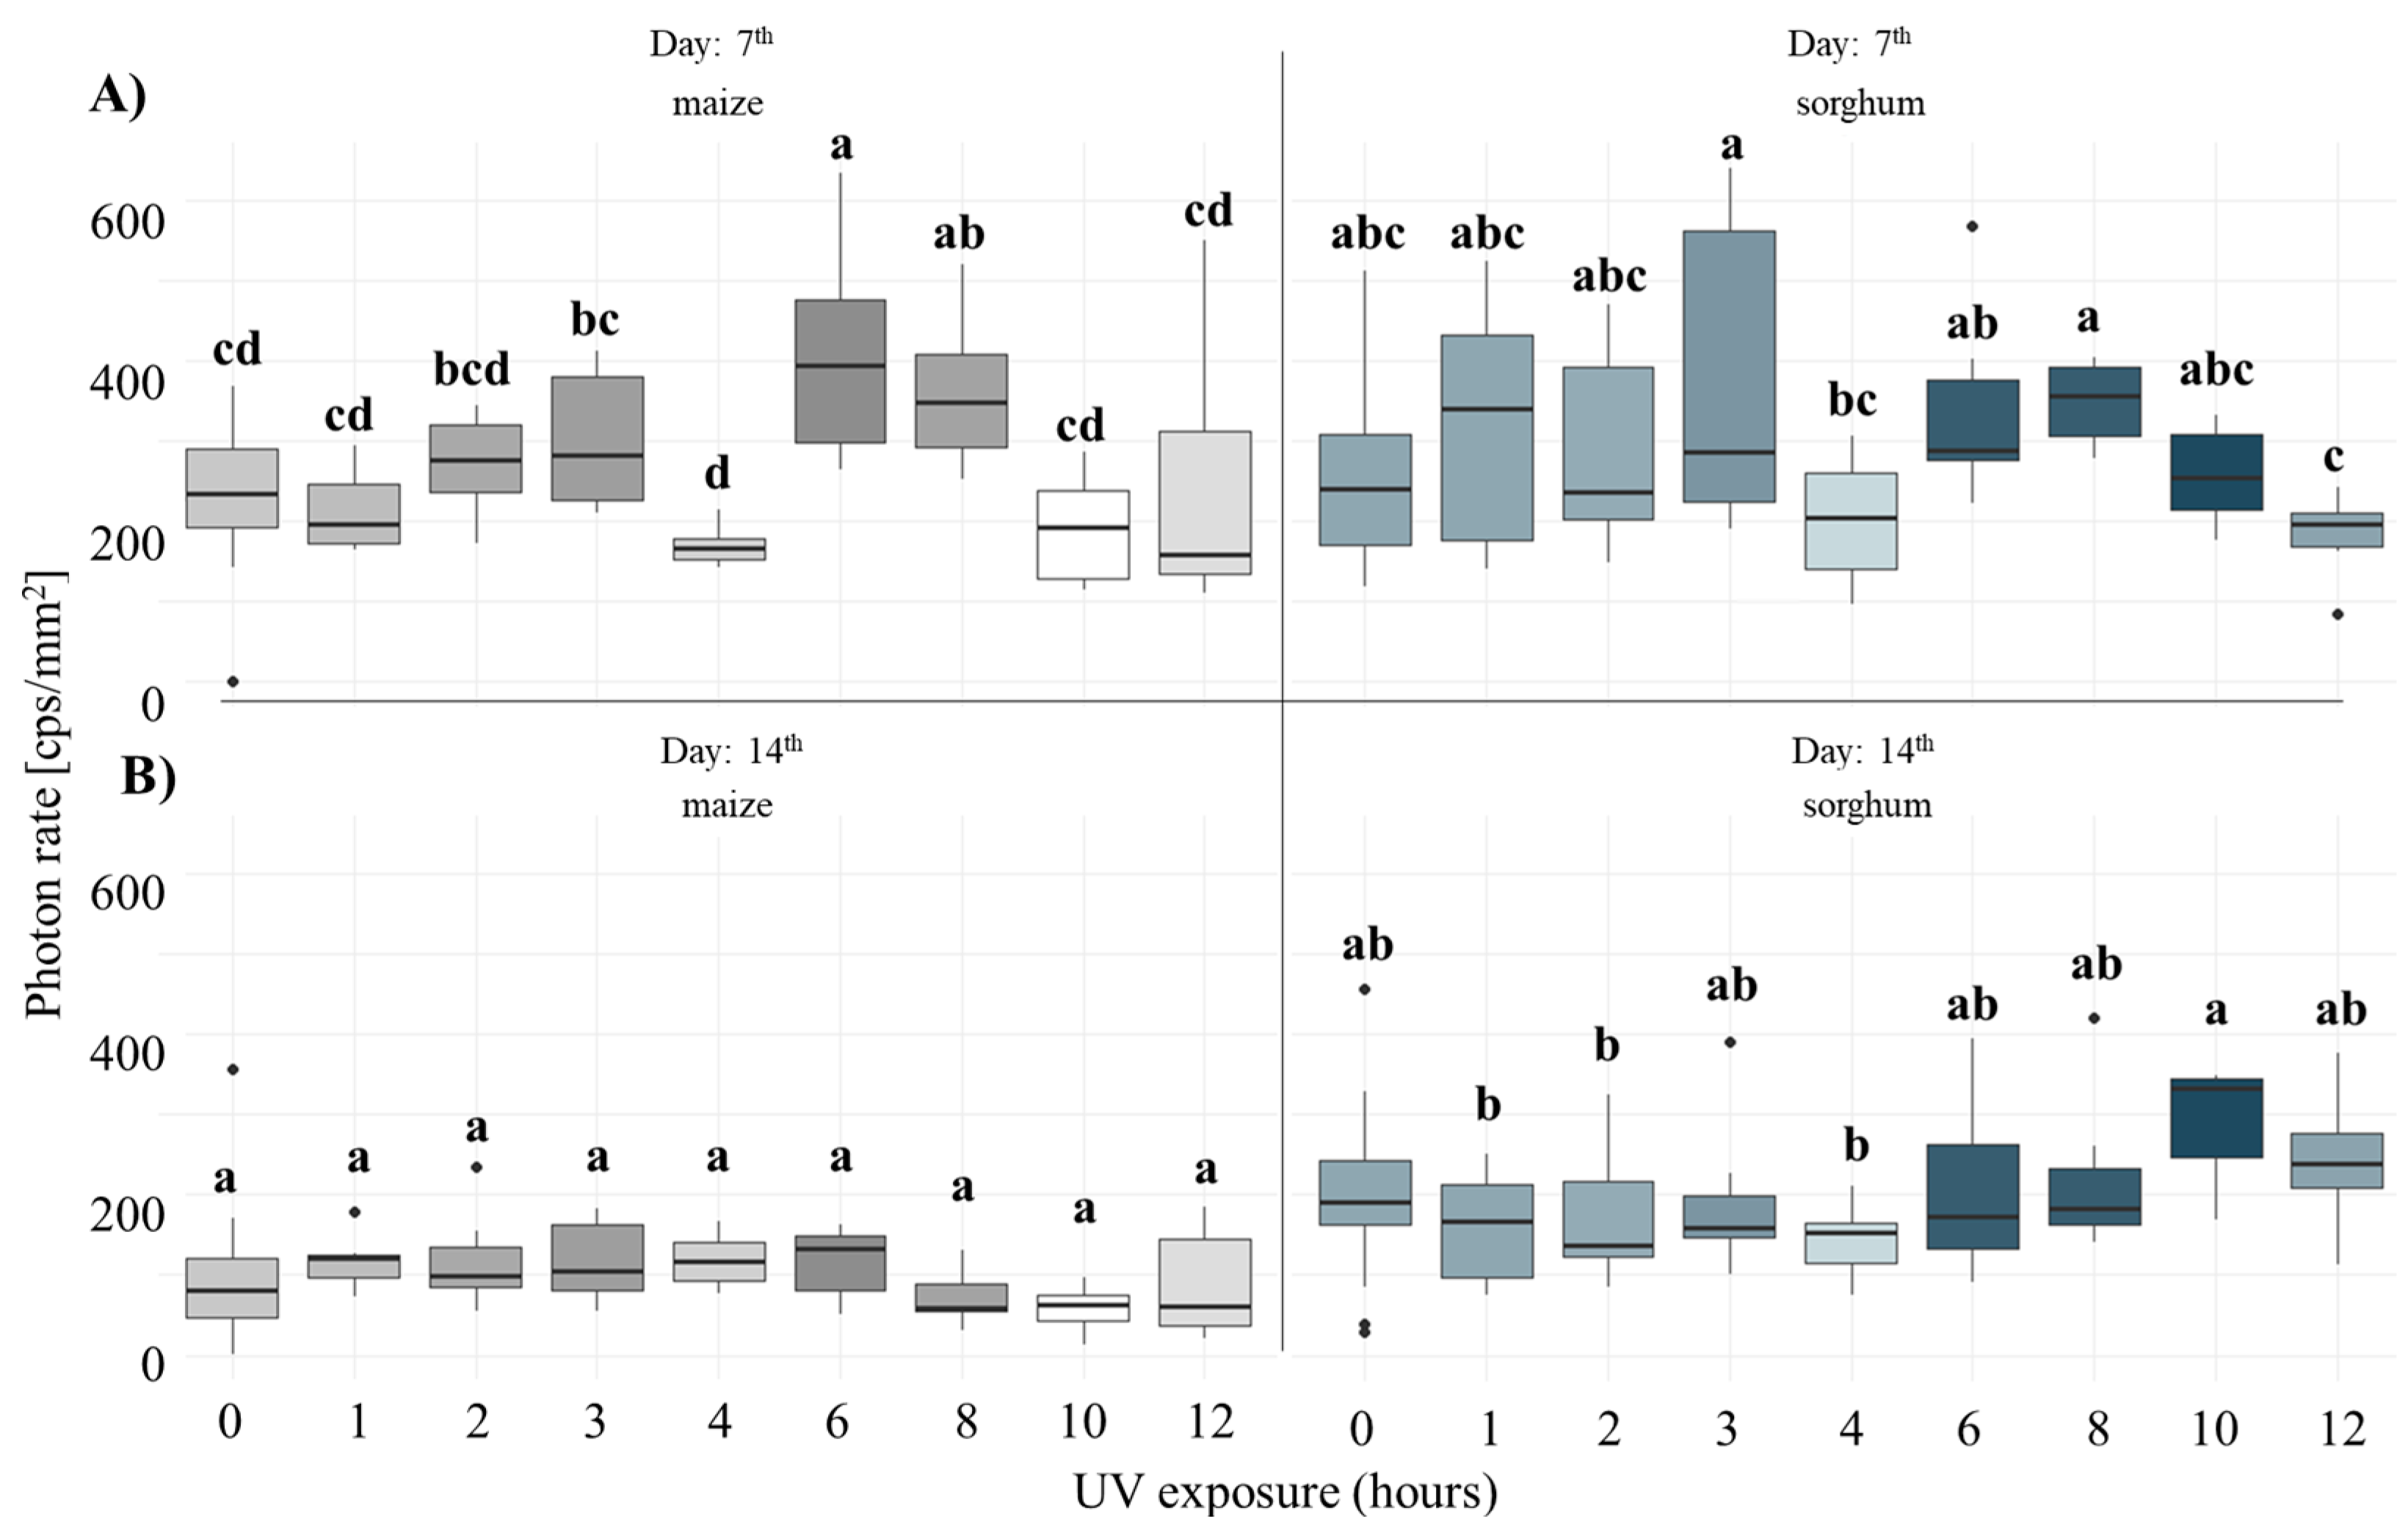
One of the primary objectives of the present study was to assess the effects of varying durations of UV-B radiation on maize and grain sorghum. As illustrated by Figure 3, significant alterations in initial biophoton emission were observed among various plant species on days 7 and 14. A subsequent analysis of variance was conducted on the day 7 post-sowing results, which revealed that the intensity of initial biophoton emission in maize was significantly influenced by the different durations of UV-B exposure (p < 0.0001). This finding indicates a notable effect on plant health. To facilitate a more detailed interpretation, the Duncan post hoc test was employed. As demonstrated in Figure 4, an initial gradual increase was observed, followed by a significant decline at 4 h of exposure. This decline can be attributed to an intensified stress response. A similar trend was evident for the 6, 8, 10, and 12 h treatments; however, a pronounced decrease was specifically observed at the 10 and 12 h exposures. Notably, maize reaches its median peak at 6 h (with a secondary high at 8 h) while sorghum peaks earlier at 3 h and then maintains steadier emission through 6–8 h; both, however, share a synchronized trough at 4 h, underscoring an acute stress point. The interquartile ranges for maize at 6 and 8 h are particularly wide, with several outliers indicating heterogeneous antioxidant bursts among individual plants. By day 14, no statistically significant differences were detected between treatments, as confirmed by the results of the one-way ANOVA (p = 0.386), indicating p > 0.05. Both species display compressed boxplots with overlapping groupings, reflecting a convergence of their stress responses after repeated UV-B pulses.
In the context of grain sorghum, a subsequent analysis of variance was conducted on the results obtained on day 7. This analysis revealed that different UV-B exposures exhibited a smaller yet statistically significant effect on the initial biophoton emission (p = 0.0478). In this case, a similar trend to that observed in maize was found, but for sorghum, a significantly greater variance in the initial biophoton emission intensity was observed during the 1, 2, and 3 h treatments. This variance decreased significantly as biophoton emission increased following a more intense stress effect at 4 h, and the lowest variance coincided with the lowest emission intensity at 12 h. Sorghum’s highest dispersion occurs at 3 h and, to a lesser extent, at 10 h, but overall, tighter interquartile ranges during prolonged exposures signify more uniform defense activation. By day 14, the initial biophoton emission was also significantly reduced in sorghum, as confirmed by ANOVA (p = 0.0446), indicating that repeated UV-B stress led to convergence in their response profiles. In conclusion, grain sorghum demonstrated a greater degree of resistance to UV-B irradiation at different time intervals than maize, owing to a smaller decrease in initial biophoton emission intensity and a more consistent antioxidative response.
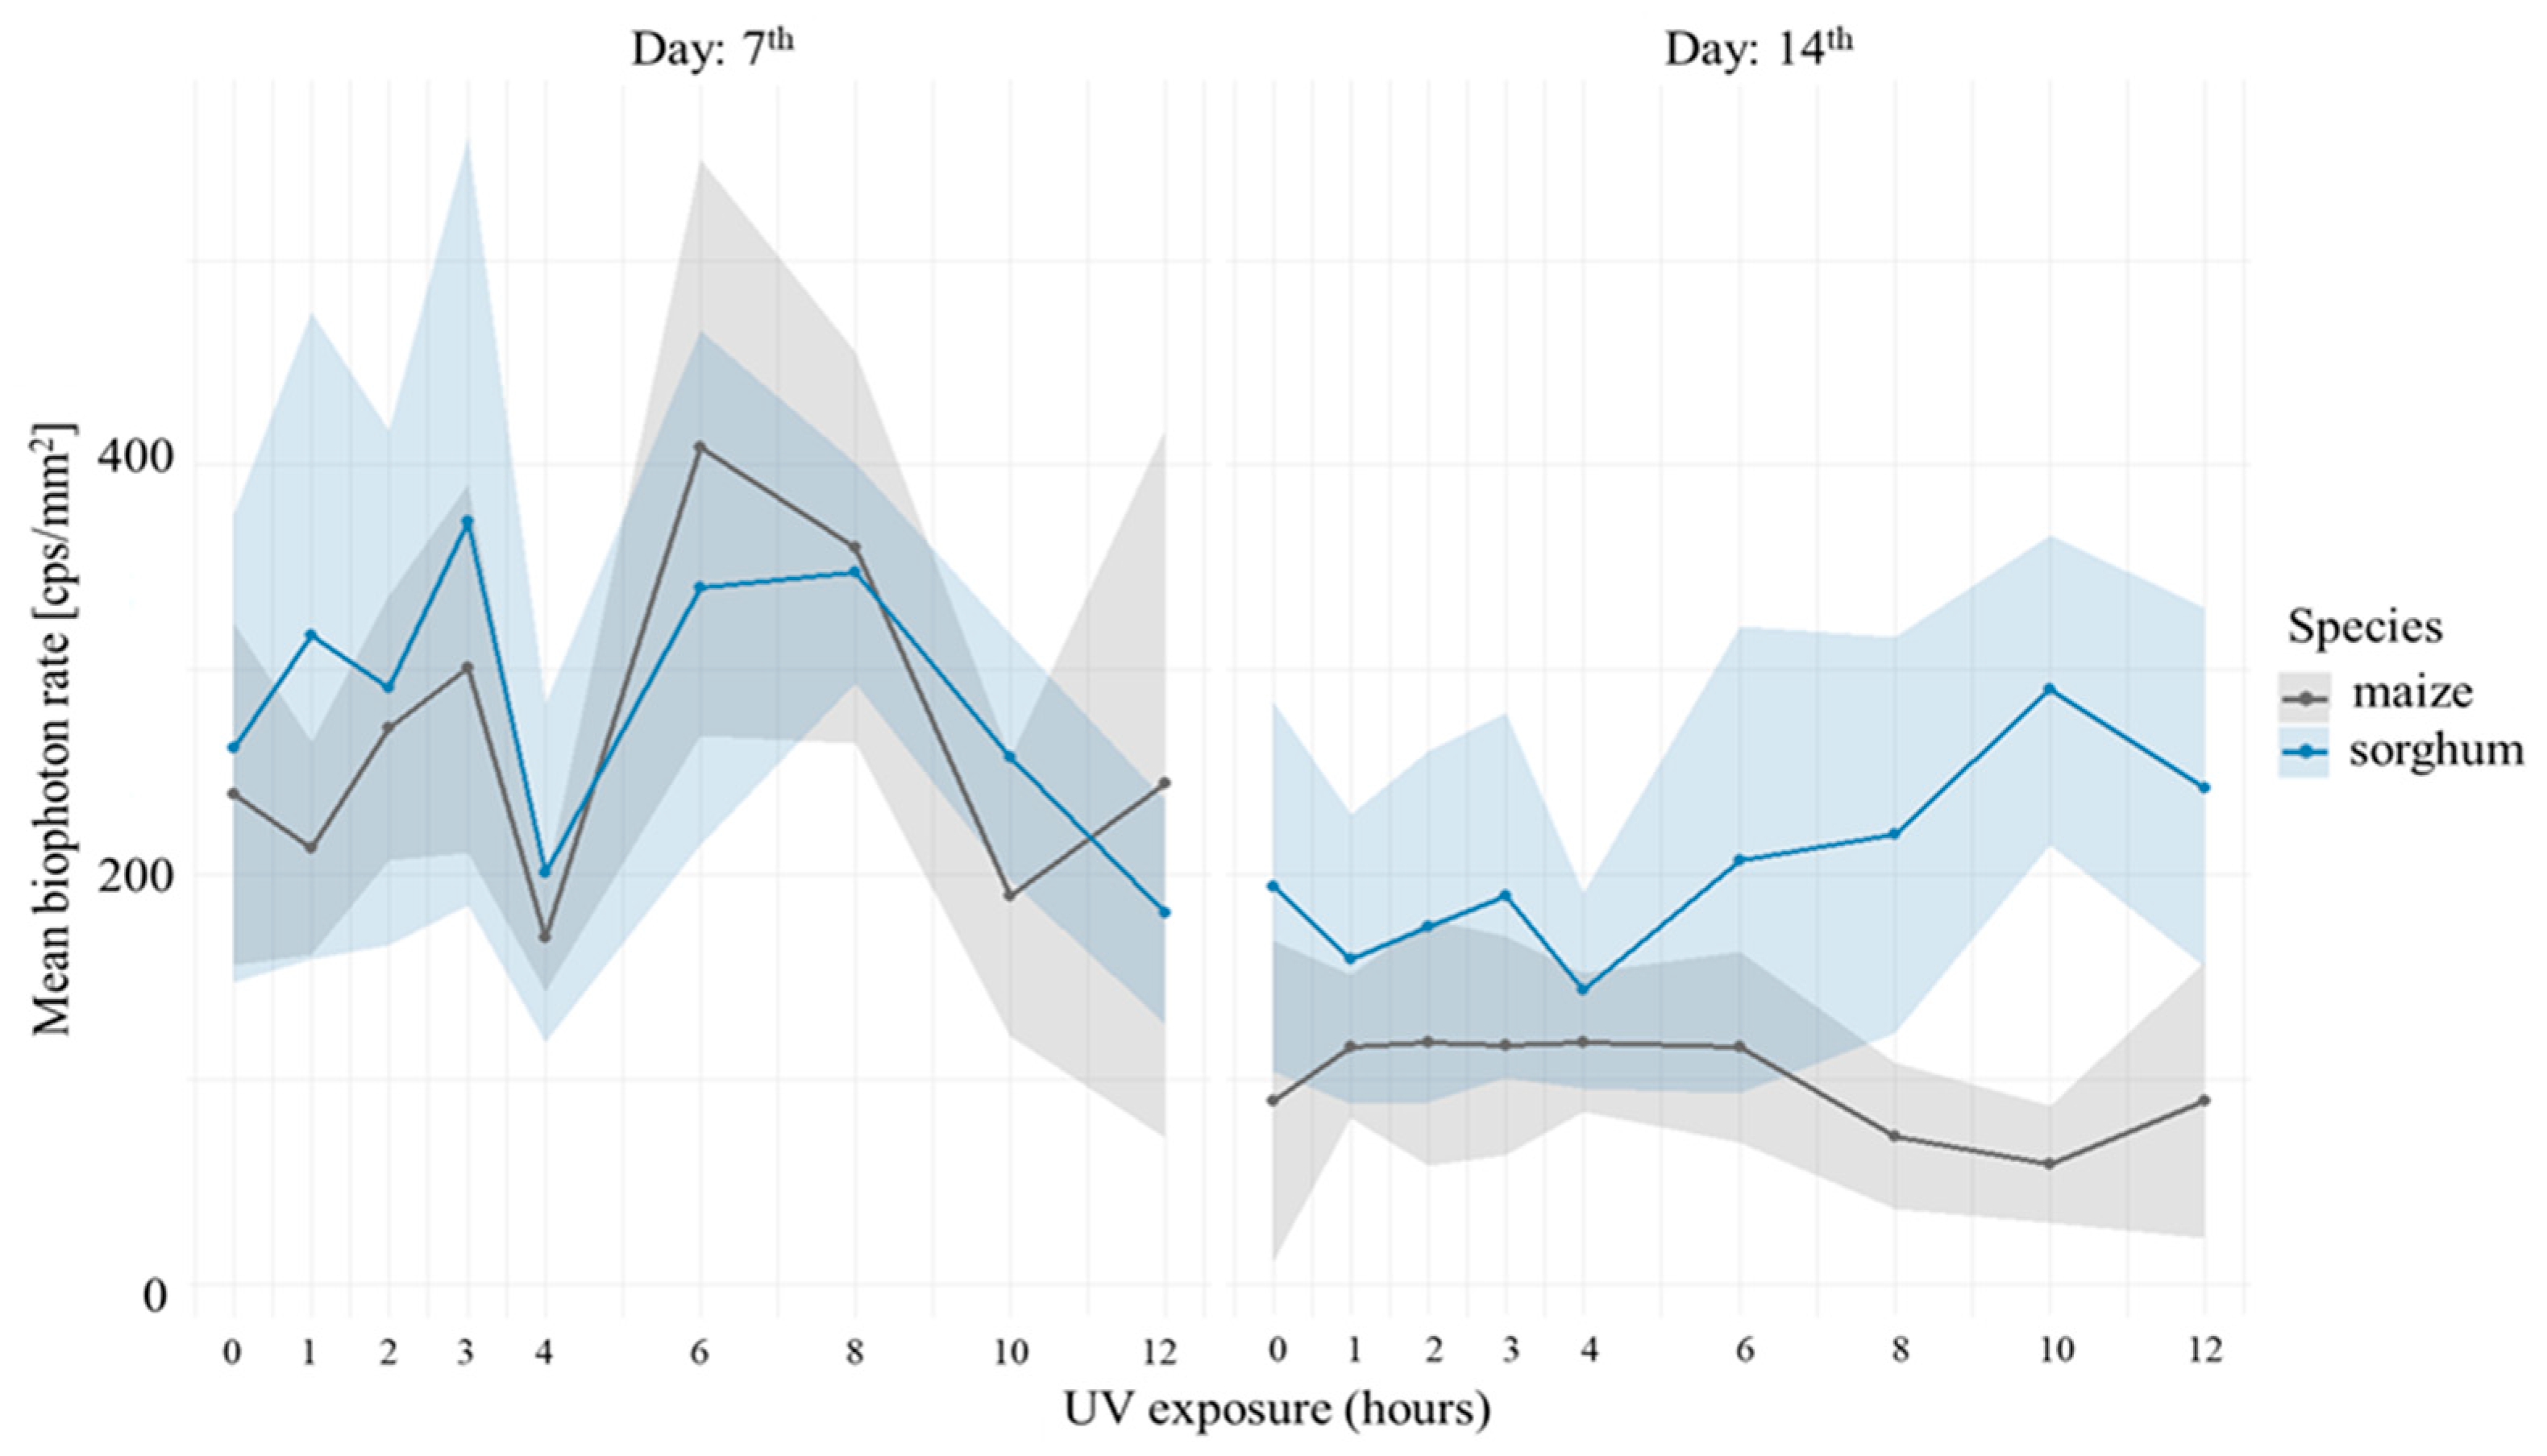
In Figure 4, on the first biophoton measurement day (day 7), the maximum biophoton emission intensity values were observed at 3, 6, and 8 h of UV-B exposure, followed by a linear decline at higher doses. Notably, on day 7, both maize and sorghum responded almost identically—their emission curves are highly correlated, with a sharp trough at 4 h in both species indicating an acute stress response. After this dip, both recover to local maxima at 6 h and 8 h before declining again. The results obtained on the 7th day also show that initial biophoton emission in both species exhibits a broader distribution, whereas the slope of increase remains much tighter—especially in sorghum, whose slope values cluster within a narrow range. In contrast, maize’s slope values display substantial variability even at this early time point, and on average maize exhibits higher slope values, reflecting a more pronounced acute stress response.
In maize, the mean emission (black line) appears to rise toward 12 h, but this is driven primarily by an expanding variance (shaded area) rather than a uniform increase across individuals. Sorghum, by comparison, maintains tighter variability throughout.
By the second measurement day (day 14), the two curves diverge markedly. Sorghum exhibits generally higher biophoton values—reflecting better overall physiological status—and its curve is almost the mirror image of maize. For short UV-B exposures (1–4 h), maize emission remains essentially constant at roughly 100 cps mm−2, whereas sorghum continues to fluctuate, still showing the 4 h minimum before climbing steadily to a pronounced peak at 10 h. Maize, however, shows only a slight decrease after its 6 h peak and then reaches its lowest emission at 10 h, underscoring its greater sensitivity to prolonged UV-B stress. By day 14, maize also displays a concomitant decline in initial emission and an increase in slope, whereas sorghum’s initial emission declines only slightly and its slope remains largely unchanged. One-way ANOVA showed that there is a significant difference (p < 0.001) between maize and sorghum in the control group (0 h exposure) on the 14th day after sowing. This difference disappeared under the 1, 2, 3, 4 and 6 h UV-B radiation. The longer and higher radiation triggered a negative impact in maize plants reducing the initial biphoton emission intensity (p = 0.003 at 8 h, p < 0.001 at 10 h, p = 0.005 at 12 h exposure on the 14th day after sowing).
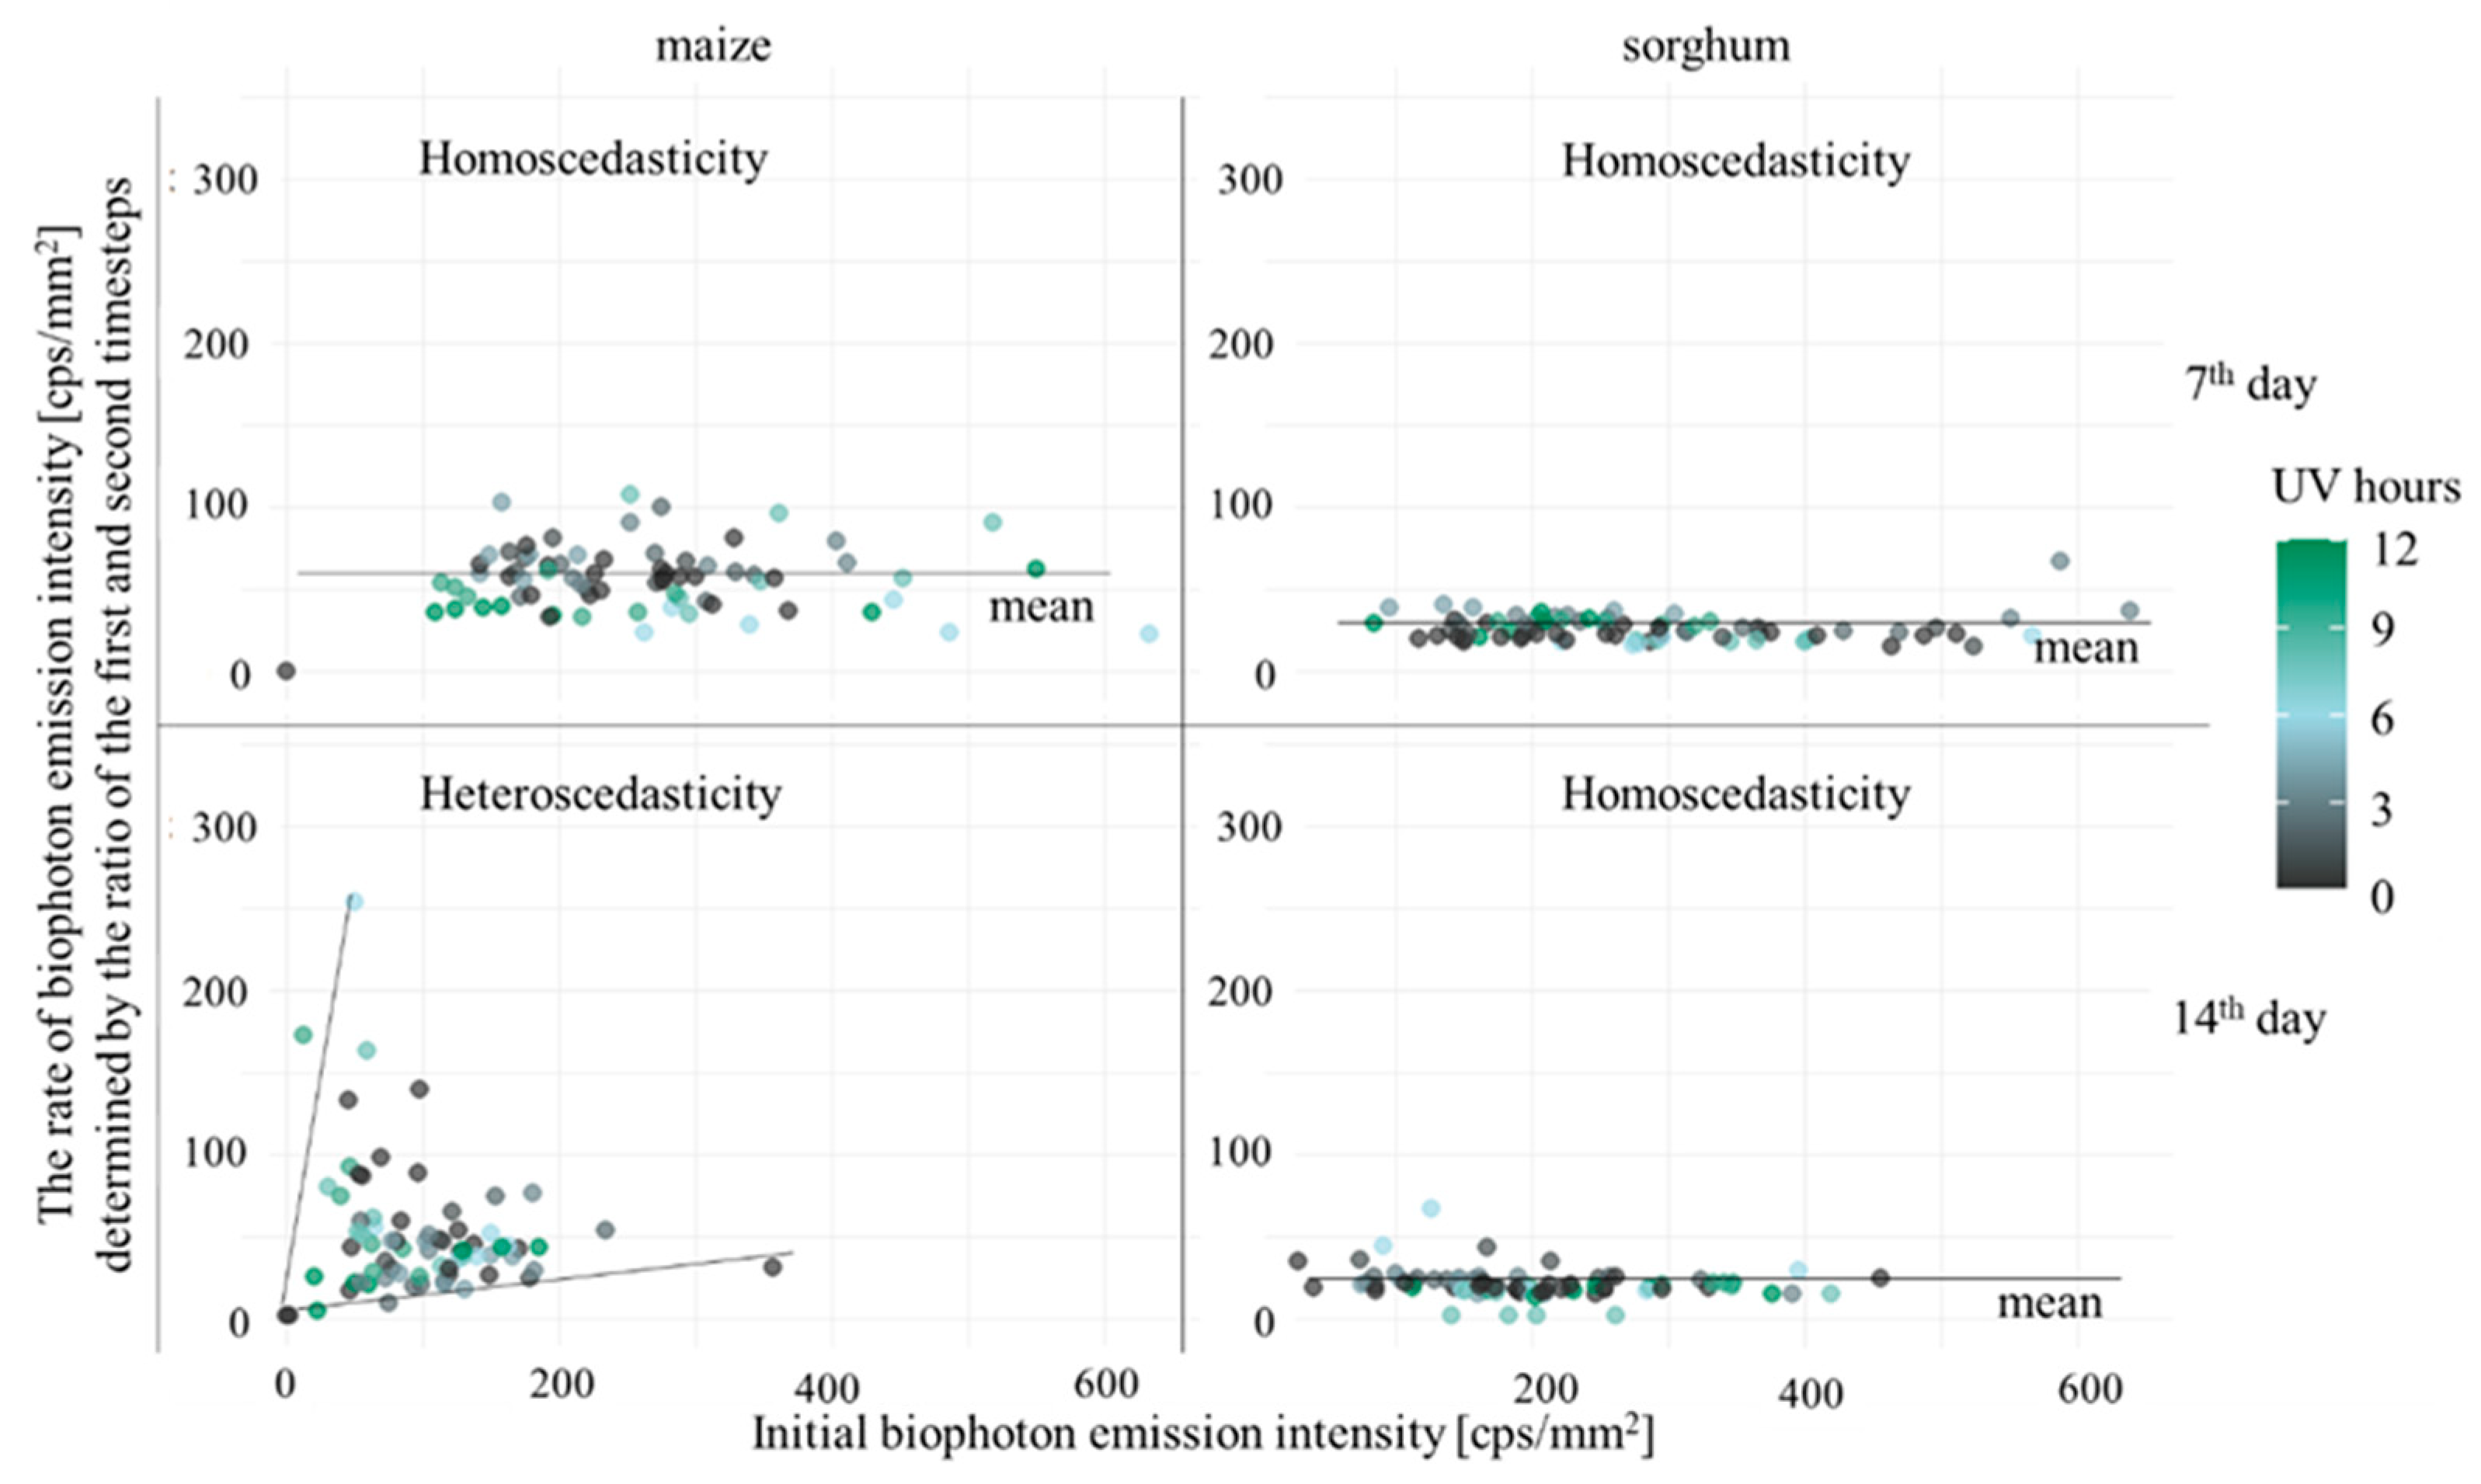
To accurately assess the responses exhibited by plants concerning levels of stress, the initial intensity of biophoton emission must be given full consideration. Furthermore, it is crucial to undertake systematic and continuous monitoring of the subsequent decline in emission intensity as measurement intervals are recorded. The rationale for this is that a more rapid decay in intensity would likely reflect a stronger impact of stress on the plant in question. Figure 5 integrates these two effects: the x-axis shows initial biophoton emission (cps mm−2)—with higher values corresponding to lower stress levels—while the y-axis represents the magnitude of decay between the first two measurement steps (i.e., after 1 min and 2 min measurements).
On the 7th day following the sowing process, initial emission values demonstrate significant variability, reflecting the combined influence of all UV-B treatments. In contrast, decay values remain confined to a narrow range, particularly in the case of sorghum, which exhibits minimal variability. In contrast, maize exhibits a more extensive decay distribution. By day 14th, the pattern for sorghum remains largely unchanged and closely resembles its day 7th profile, indicating stable physiological status. However, maize exhibited a reduction in initial emission and an increase in decay, indicative of a heightened stress response to UV-B exposure. Furthermore, a few maize individuals on day 14th show exceptionally high decay (>200 cps mm−2), whereas sorghum outliers remain within moderate decay levels.
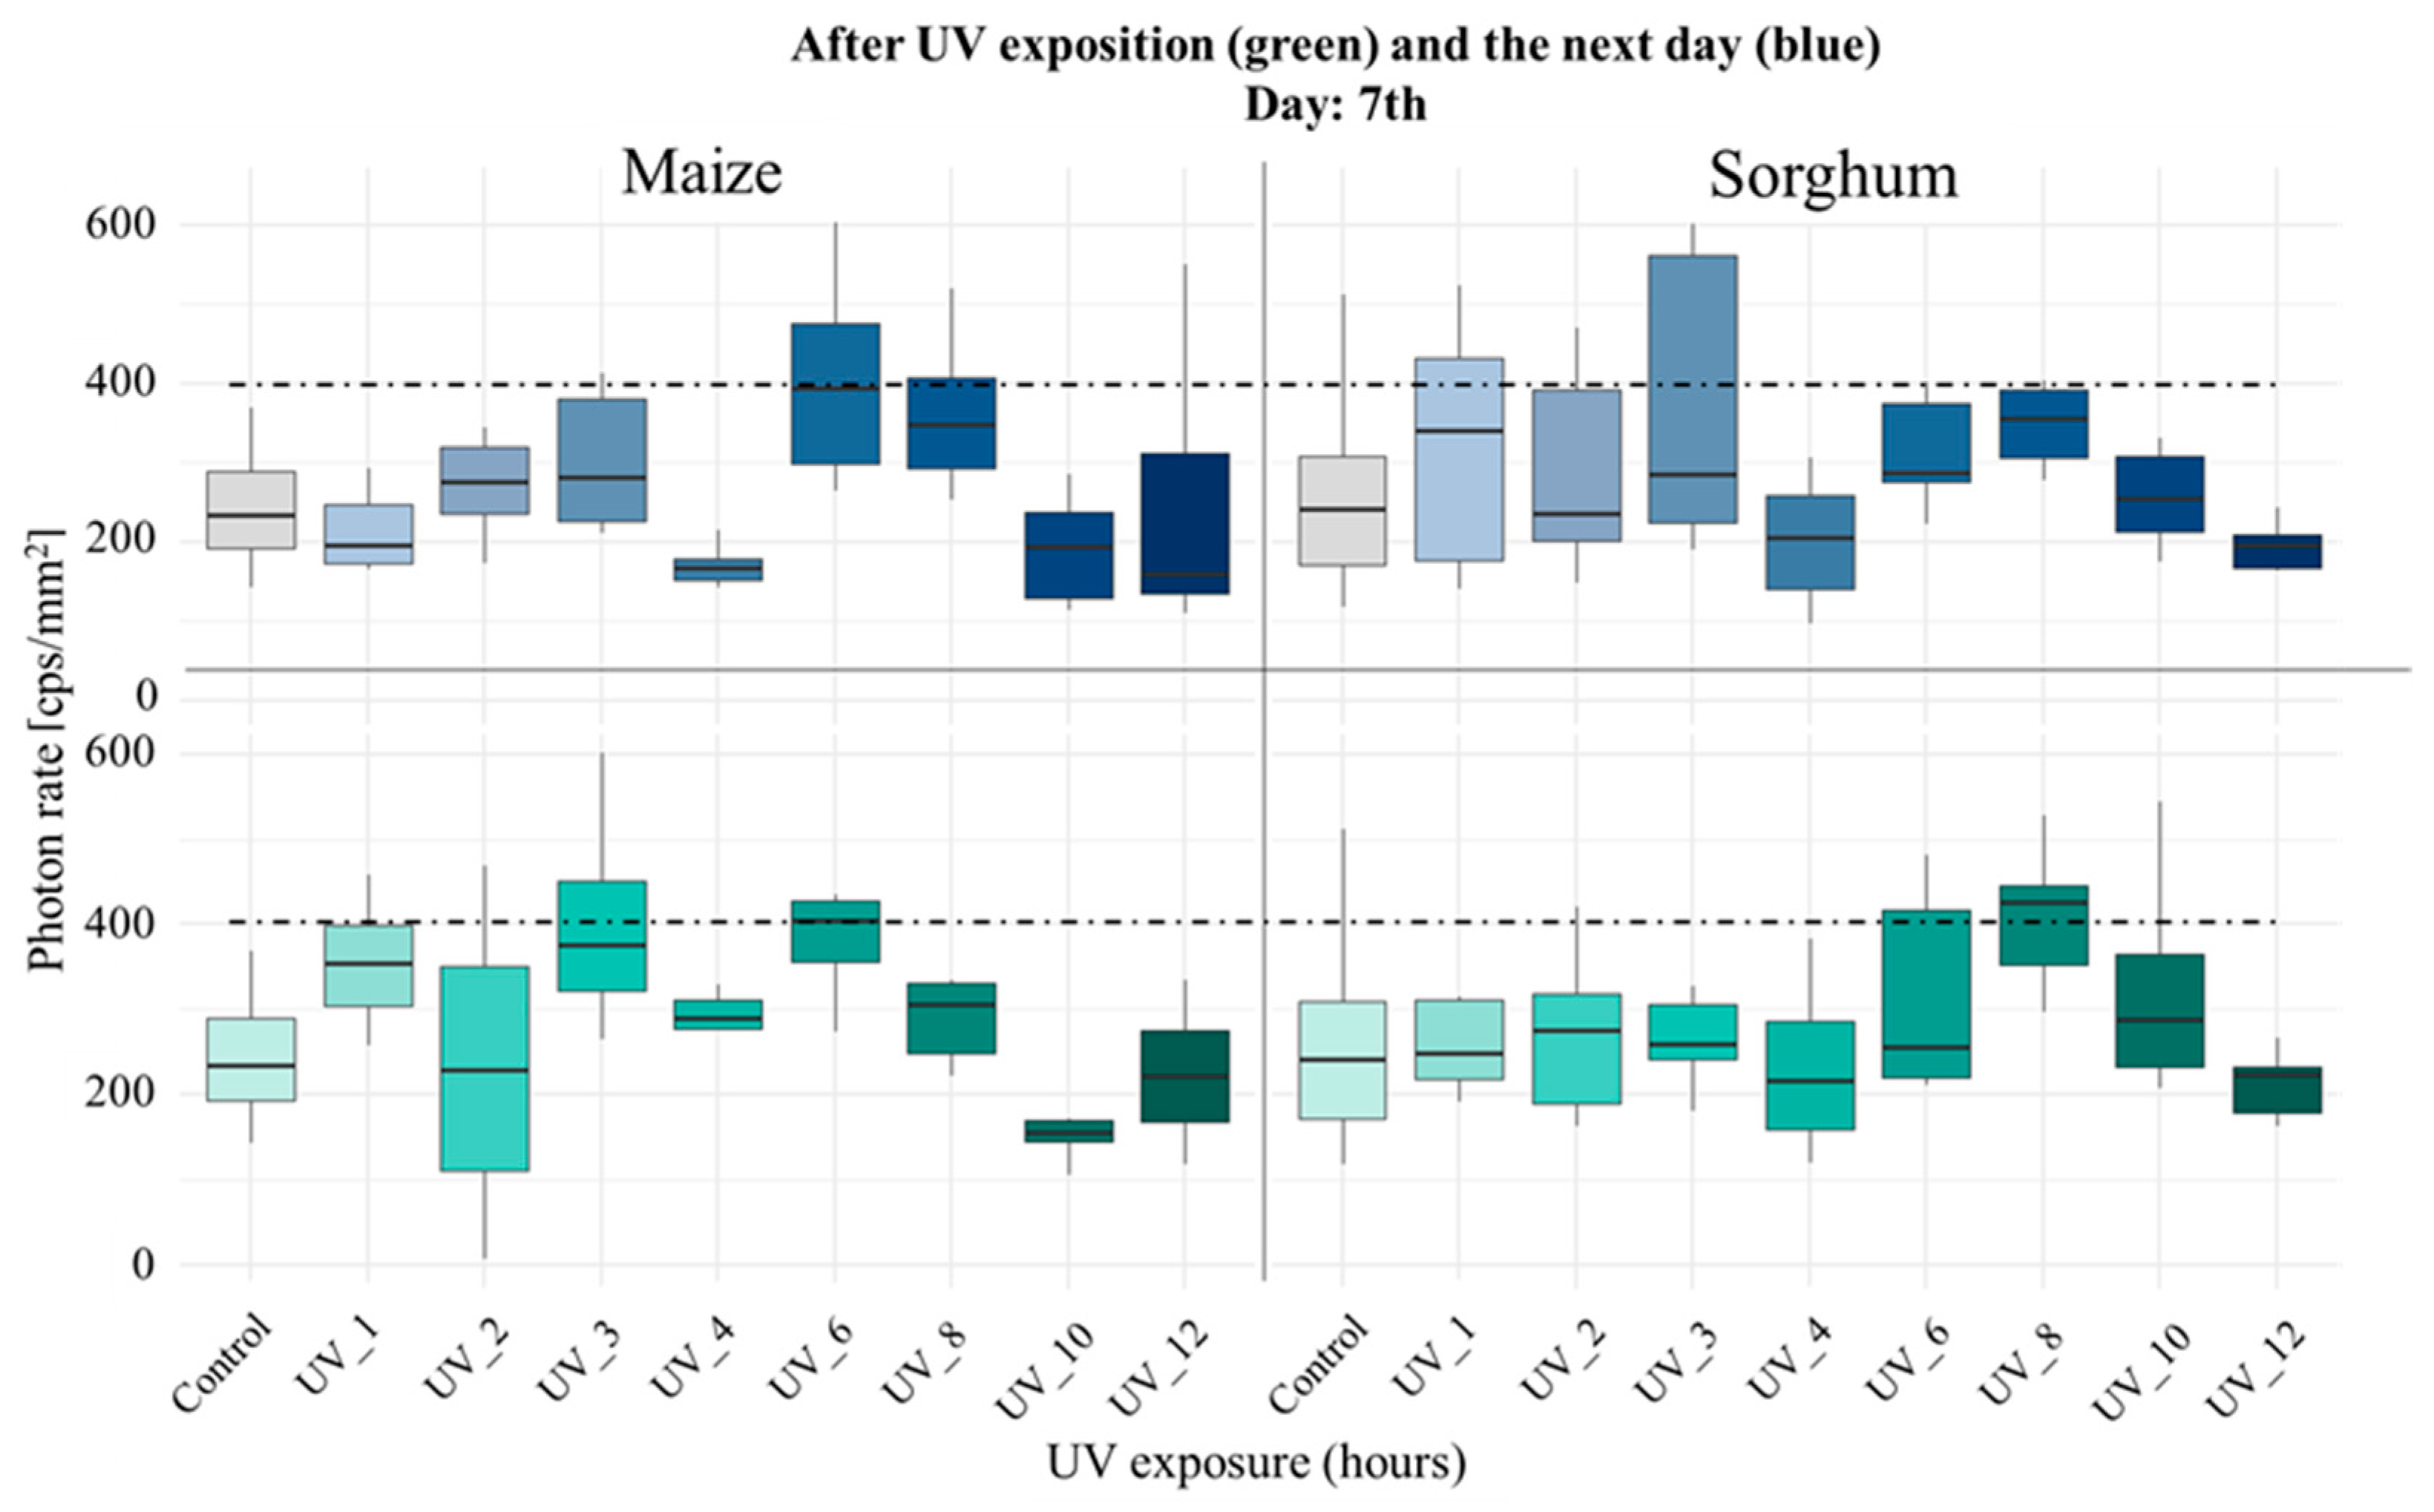
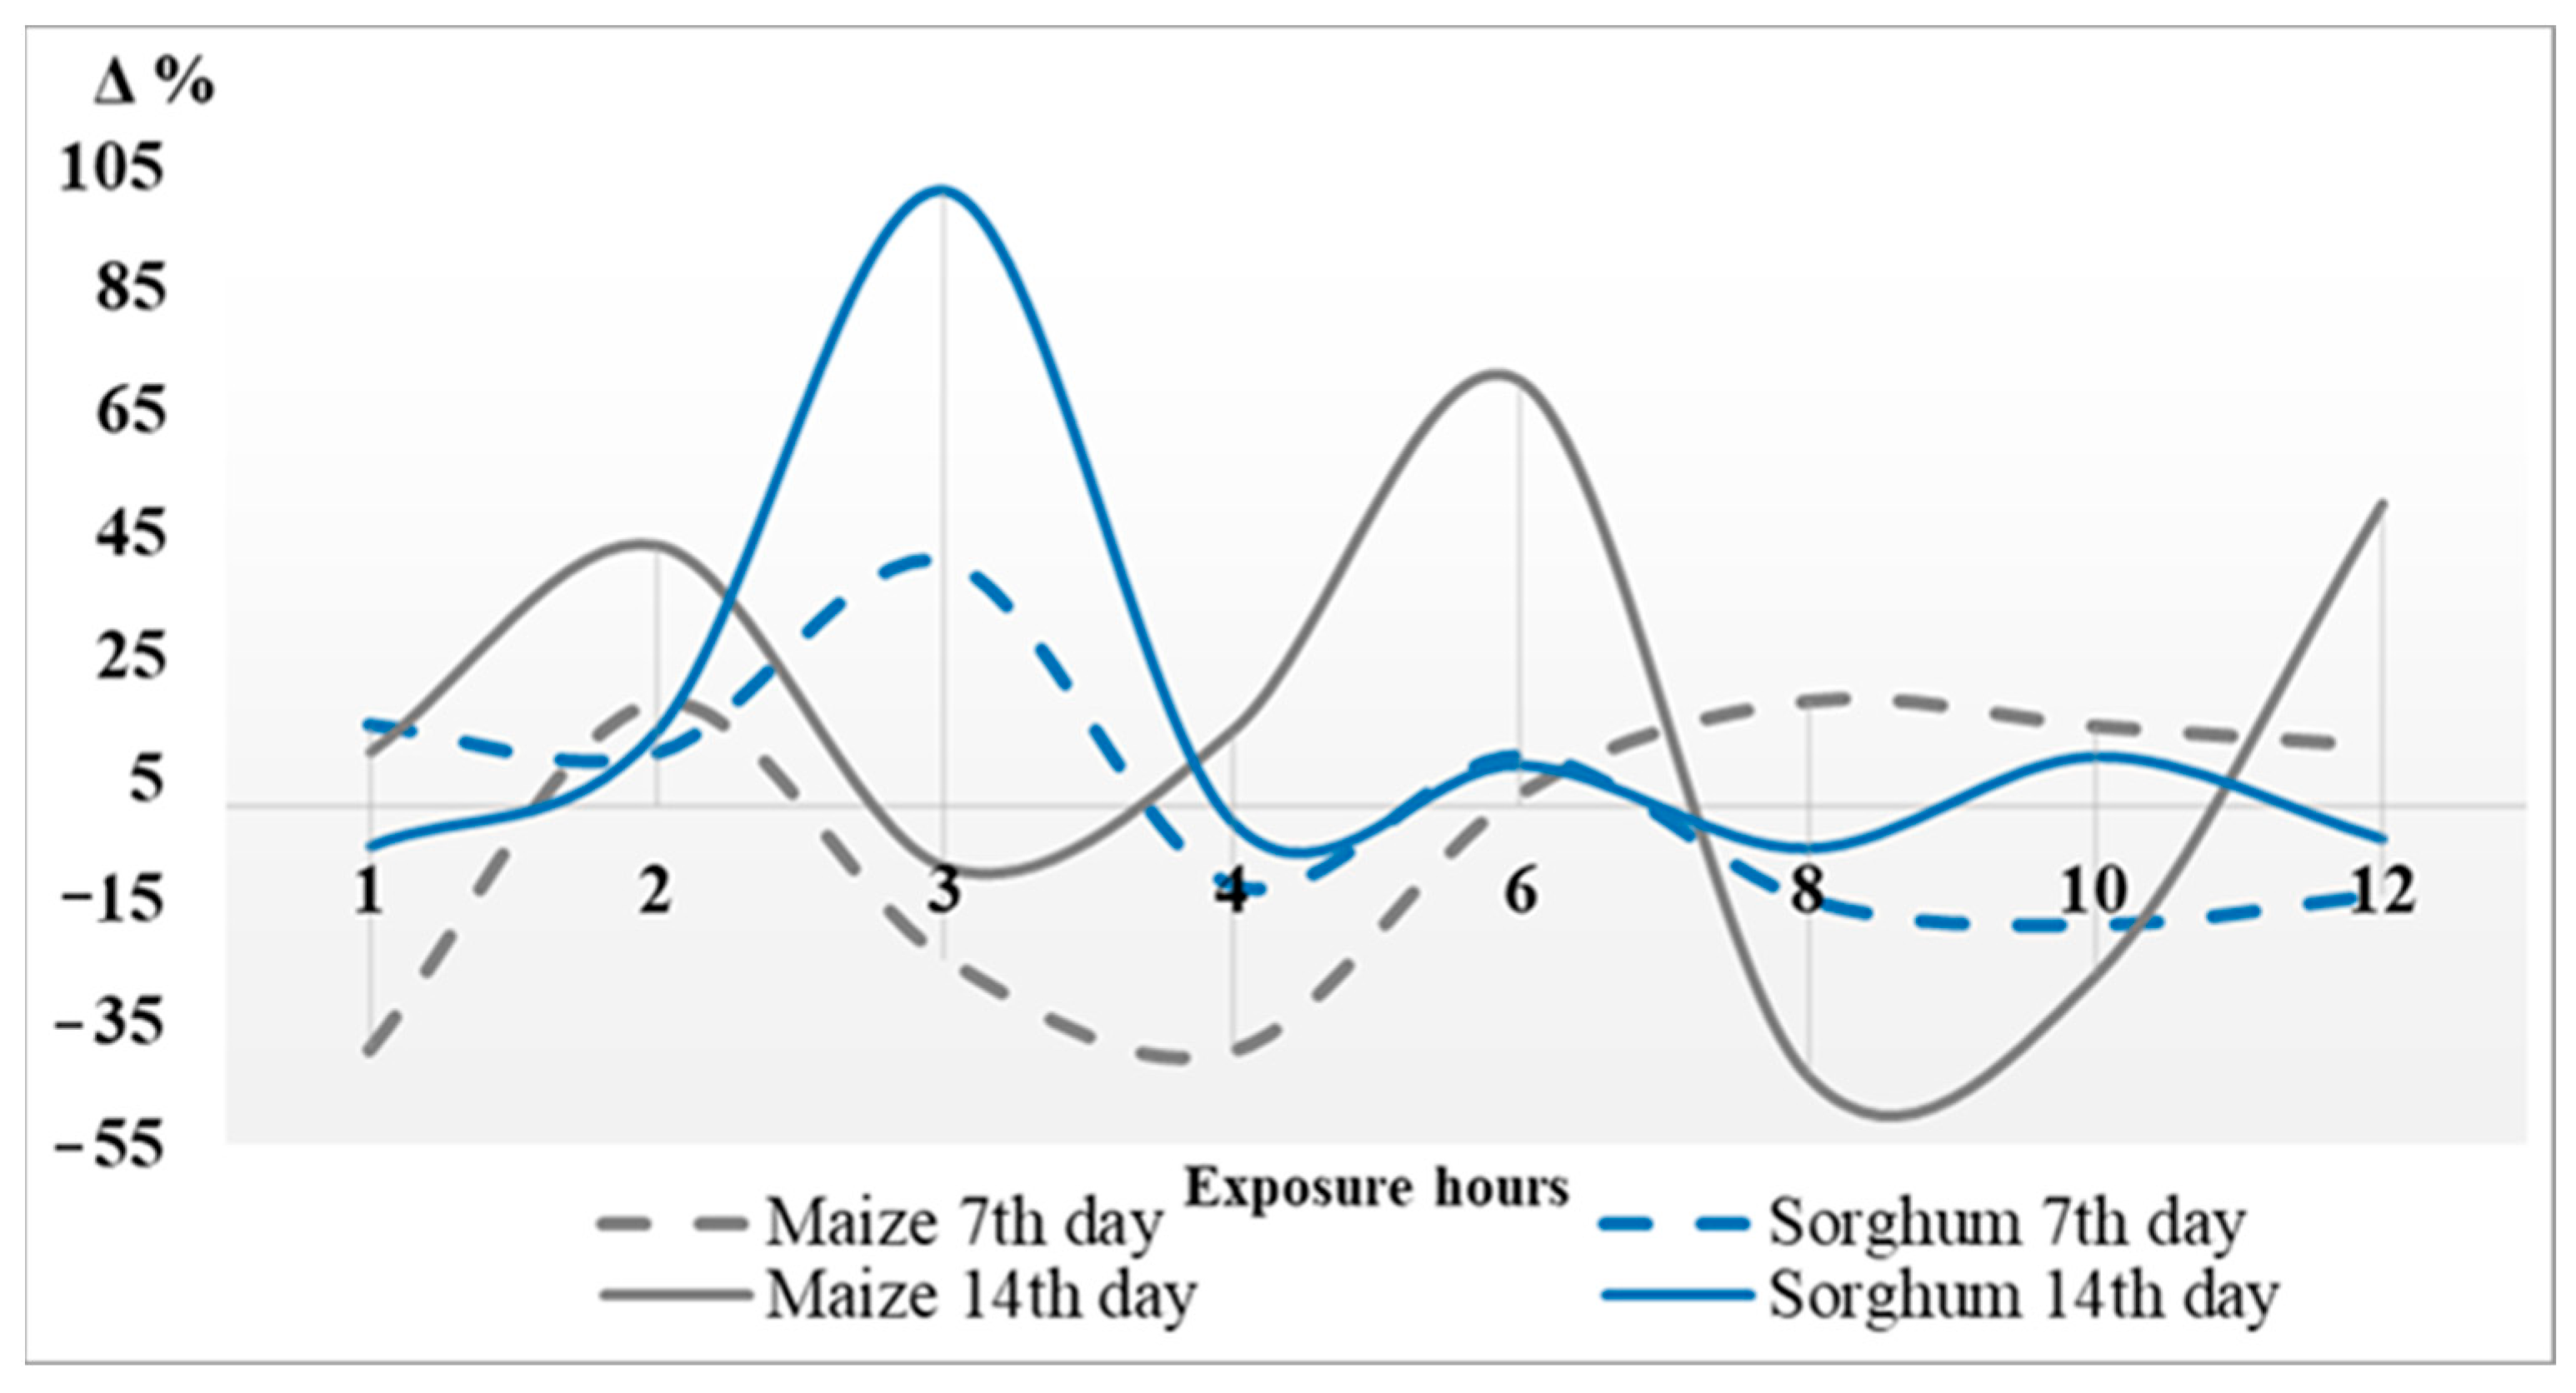
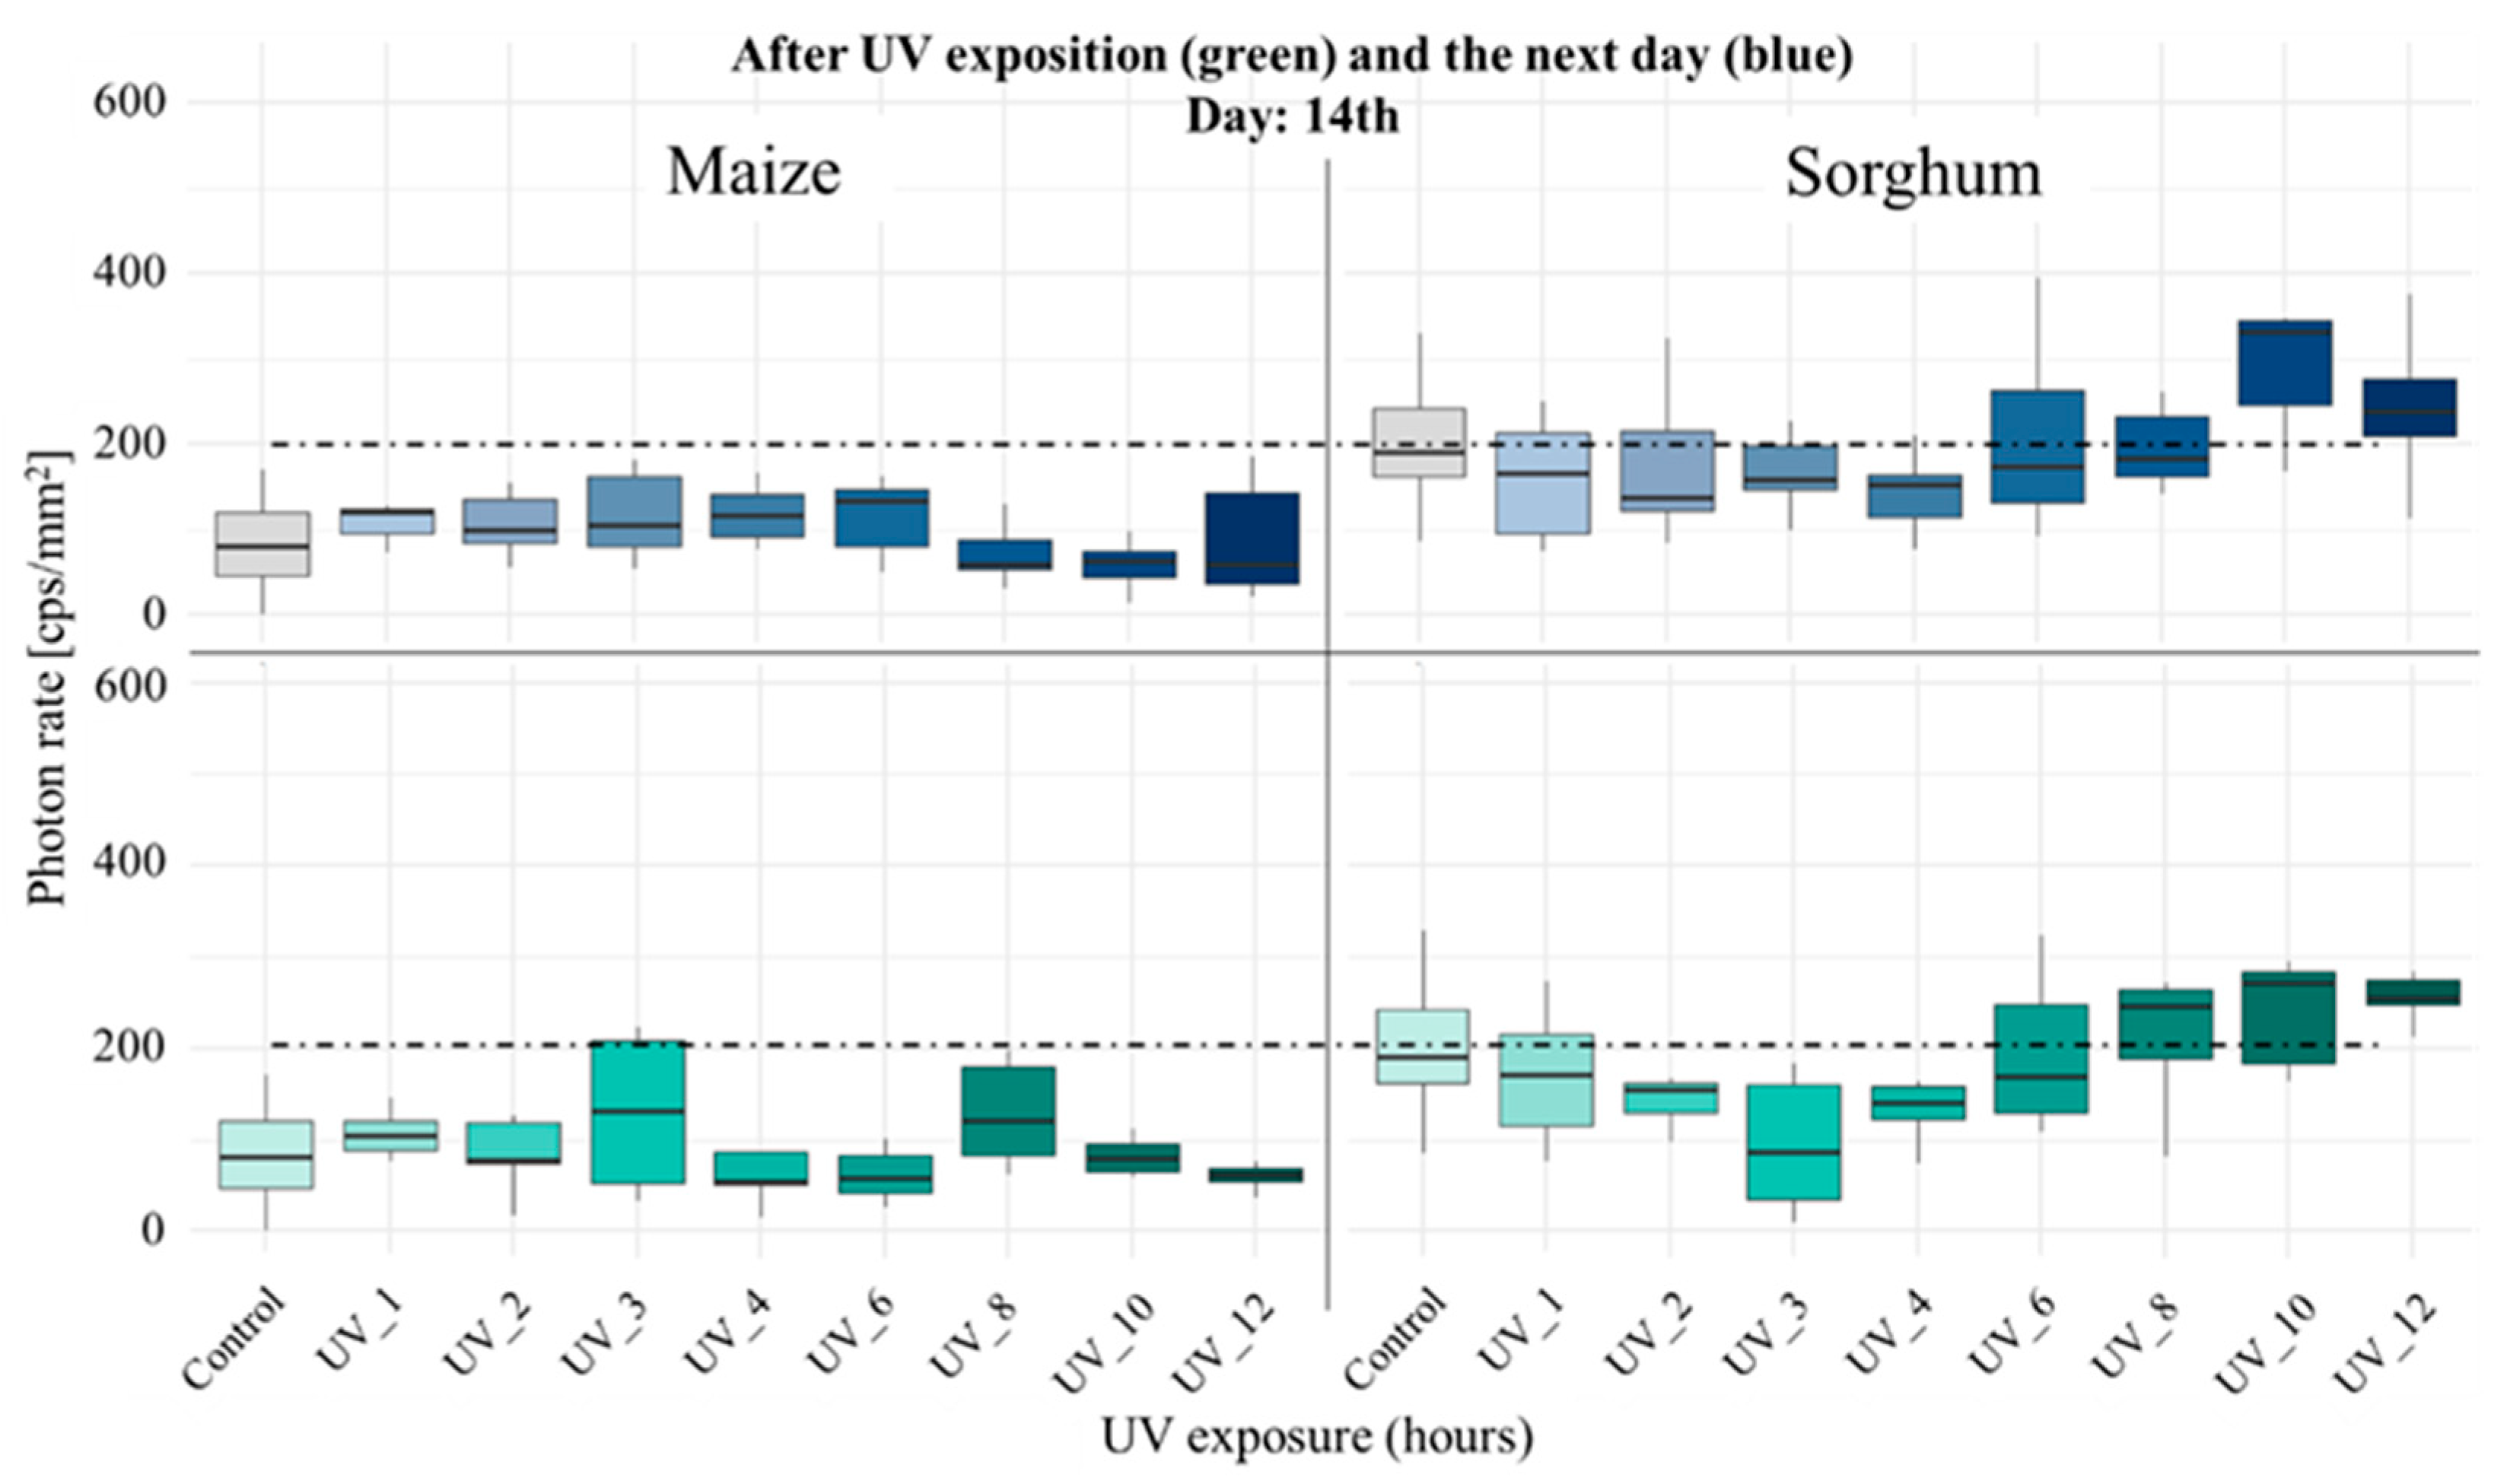
Figure 6 presents a comparison between the initial biophoton emission intensity [cps/mm2] measured immediately after UV-B exposure (“UV_after,” lower/green panel) and those recorded 24 h later (“Next day” upper/blue panel) in maize and sorghum on Day 7, while Figure 7 contains the mean values of initial biophoton emission intensity right after UV-B exposure and the next day and their percentage change (Δ%) from one day to the other, as well.
The stress reactions of maize and sorghum to different UV-B irradiations exhibit similar patterns (Figure 6). The control members without UV-B radiation of maize and sorghum have no significant differences in initial biophoton emissions (Figure 6); however, sorghum showed slightly higher variability. The response of maize to UV-B irradiation is more imbalanced than that of sorghum, especially for 1 h, 2 h, 3 h and 4 h exposure. Sorghum demonstrated a positive response to extended exposures, particularly to the 8 h radiation with mean values of 409.28 cps/mm2 (Figure 7). Conversely, two outliers were identified at 3 h and 6 h exposure for maize (Figure 6), with mean initial biophoton emission values of 399.34 and 399.72 cps/mm2, respectively (Figure 7). On the next day after UV-B treatment (7th day after sowing) the reactions of maize and sorghum showed significant differences. For maize, the initial biophoton emission intensity decreased at 1 h, 3 h and 4 h of exposure (Figure 7). This suggests that the direct UV-B effect was positive for maize for short periods, decaying its positive effect by the next day. However, longer UV-B exposure increased the biophoton emission values by the next day, especially for eight hours of exposure (+17.4%), suggesting that maize was directly stressed by this prolonged exposure and regeneration processes were initiated by the following day. Conversely, the response of sorghum exhibited an inverse relationship with this outcome. As demonstrated in Figure 7, for irradiations of shorter durations (1 h, 2 h and 3 h), there was a significant increase in the initial biophoton emission values by the following day. The increases observed were 13.5%, 8.9% and 40.1%, respectively. In contrast, for prolonged UV-B irradiation, a decline in the initial biophoton values was observed on the next day (8 h −15.1%, 10 h −19.2%, 12 h −14.2%) (Figure 7), indicating that sorghum exhibits greater resistance to prolonged UV irradiation in comparison to maize.
The investigation thus far has focused on the responses of the 7-day early developmental stage. The subsequent series of measurements was conducted on the 14th day after sowing, at which point the plants still remained within the juvenile developmental stage. However, it should be noted that a decrease in the initial biophoton emission values is a regular occurrence during this phase. As the plant progresses through its vegetative phase, there is a concomitant decrease in the initial biophoton emission value. Consequently, a direct comparison with the results on day 7th (Figure 6 and Figure 7) is not possible.
For maize, after just 1 h of UV-B radiation, emission rises modestly by ~9% (106.8 → 116.5 cps/mm2), but then jumps by +42.8% at 2 h (83.0 → 118.5 cps/mm2) (Figure 7 and Figure 8). Interestingly, the 3 h treatment shows a slight decline (−9.9%). Thereafter, emission rebounds at 4 h (+12.5%) and peaks most dramatically at 6 h, with a +69.7% increase (68.3 → 116.0 cps mm−2). However, prolonged exposures (8 and 10 h) trigger substantial drops of −43.9% and −27.7%, respectively. By 12 h, maize partially recovers (+49.6%), hinting at late--stage repair activity but never quite regaining the robustness of its mid-exposure response.
By contrast, sorghum starts at a far higher baseline and exhibits a different profile (Figure 8). A slight dip at 1 h (−6.1%) suggests an immediate down-regulation, yet the plant rebounds by +12.8% at 2 h (Figure 7). The most striking change occurs at 3 h, where emission more than doubles (+101.0%, 94.5 → 189.9 cps/mm2). Beyond this, sorghum’s response plateaus: a small fall at 4 h (−2.2%), followed by moderate gains at 6 h (+7.2%) and 10 h (+8.5%), with only modest declines at 8 h (−6.5%) and 12 h (−4.9%). These relatively minor fluctuations underscore sorghum’s ability to maintain a consistently high emission level under extended UV stress.
Taken together, maize demonstrates a pronounced pattern, characterized by an early surge, a mid-exposure trough, a second peak at 6 h, and eventual collapse under severe UV. In contrast, sorghum mounts a single, dominant peak at 3 h and sustains its defense more evenly thereafter. Furthermore, the marked increase in maize (6 h) of +69.7% as opposed to the significant increase in sorghum (3 h) of +101.0%. Maize’s defenses gradually accumulate to a subsequent peak, while sorghum responds promptly and vigorously, subsequently reaching a state of equilibrium.

3.2. Comparison of the Leaf Chlorophyll Content of Maize and Sorghum as an Answer to UV-B Exposure

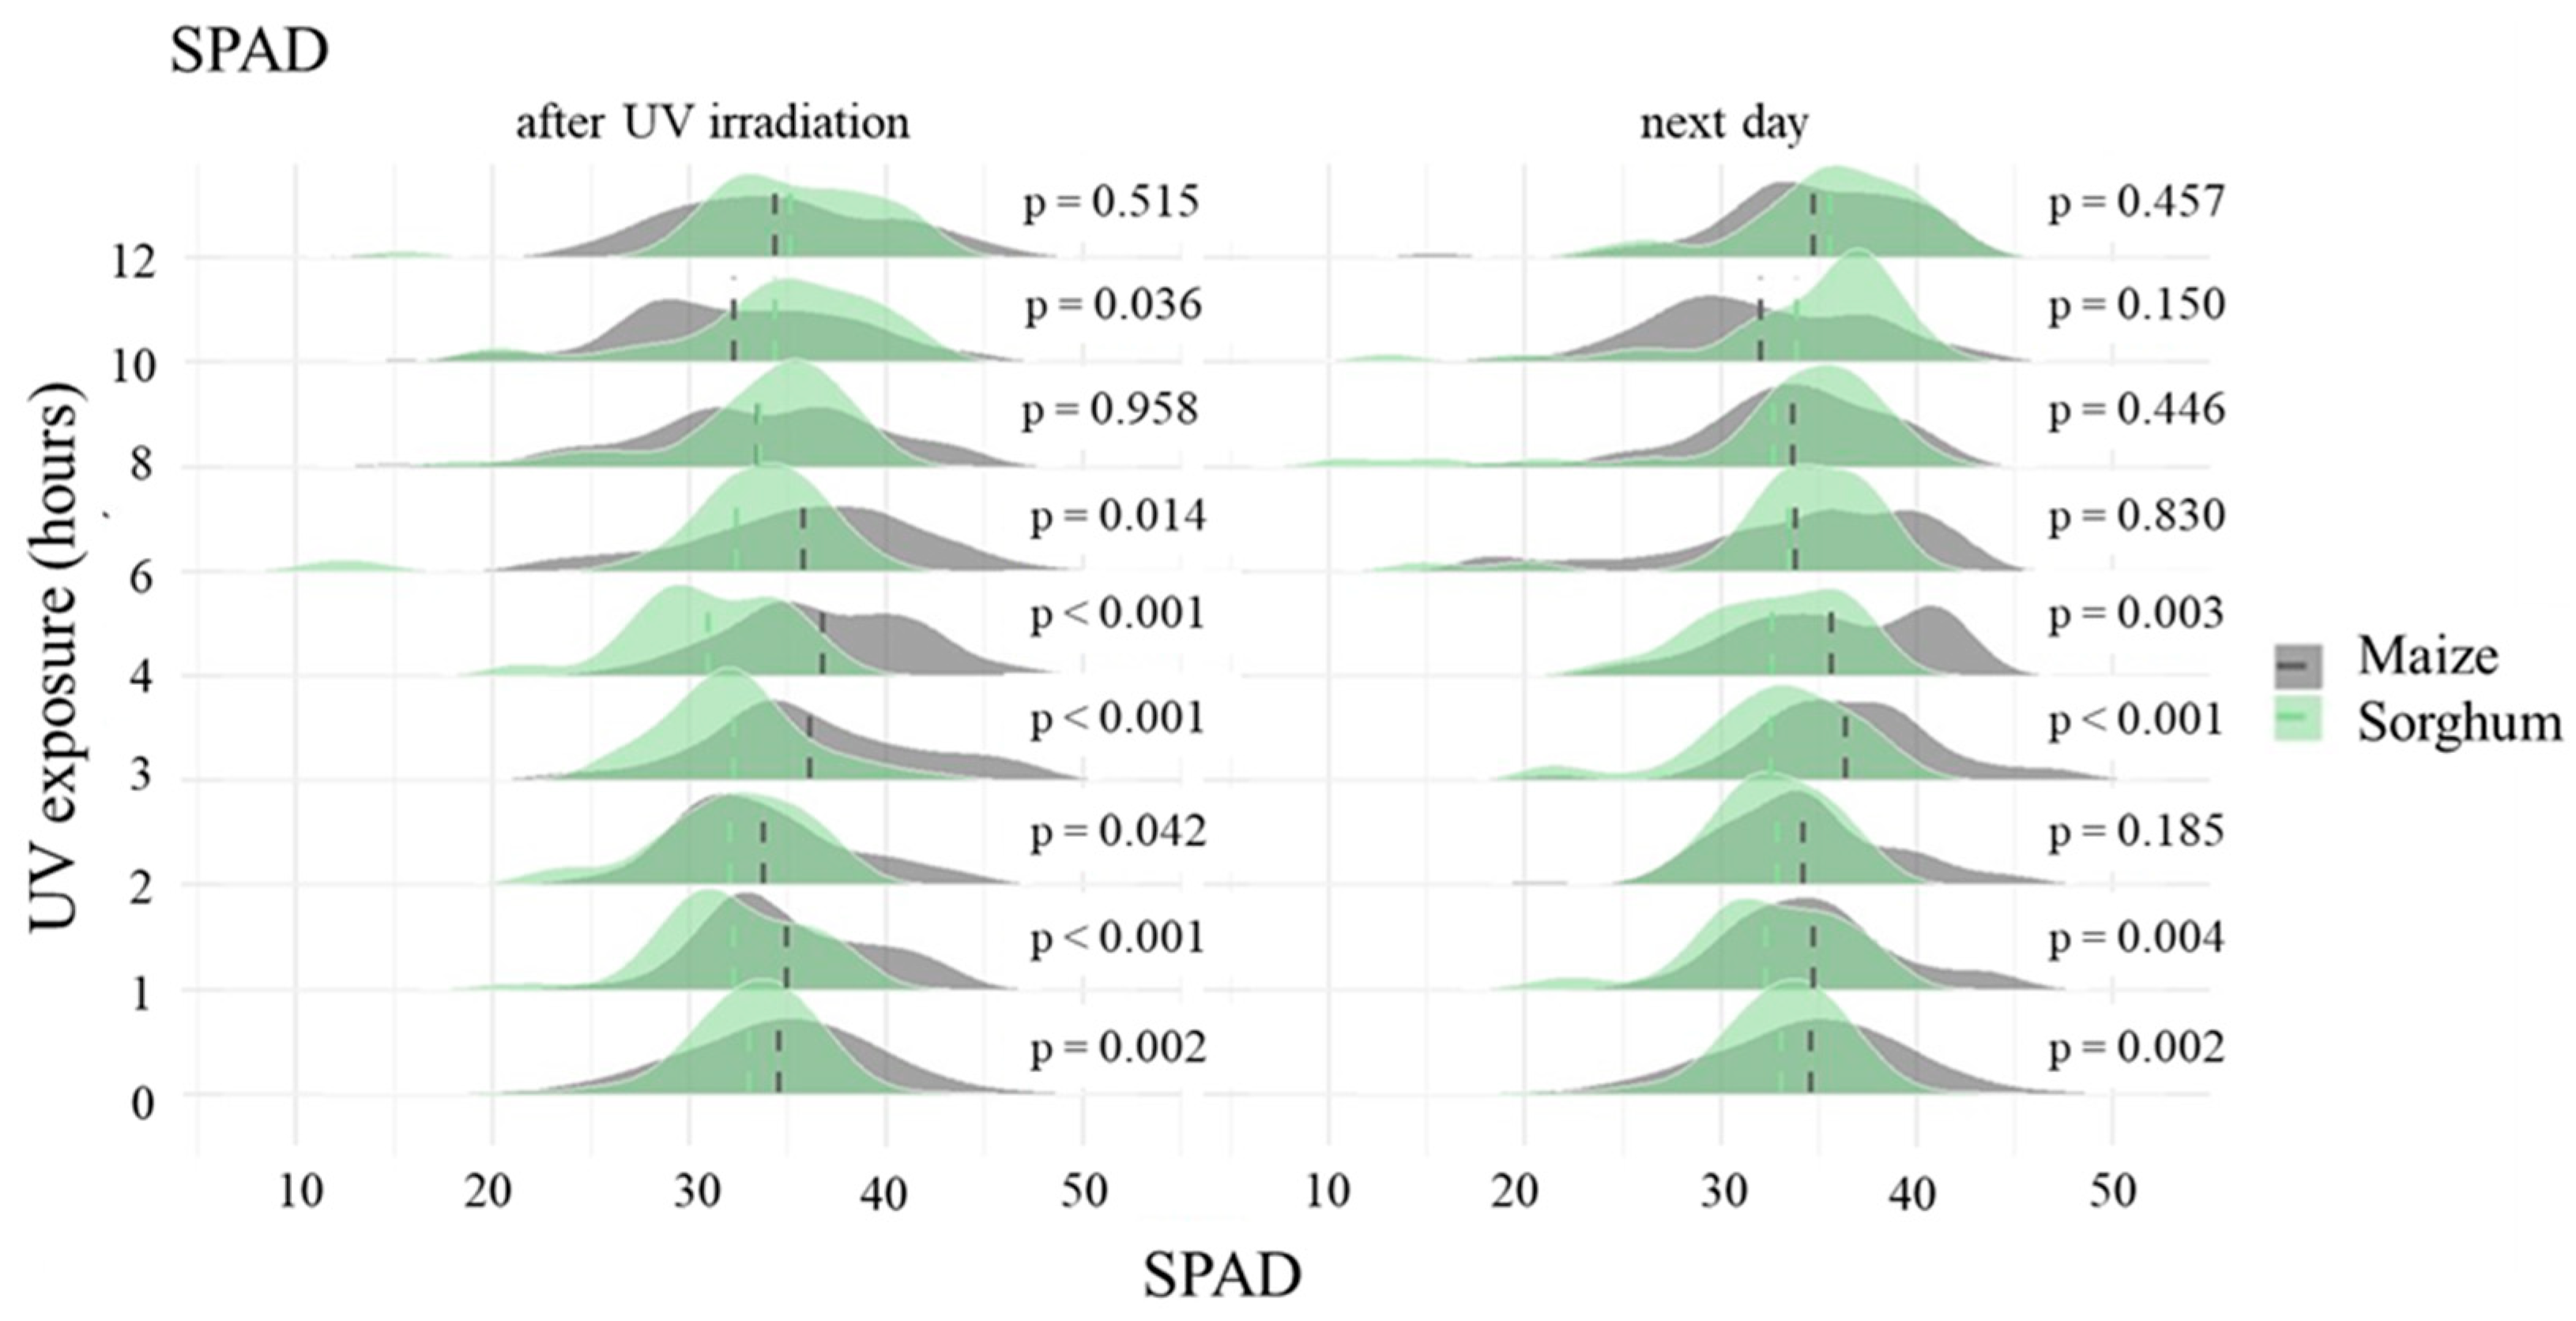
In Figure 9, there are ridge-plot panels, showing how UV-B exposure alters leaf chlorophyll content (SPAD) distributions in maize (gray) versus sorghum (green), both immediately after irradiation (left column) and 24 h later (right column). The vertical lines mark each species’ median (50th percentile). The density ridge plots of SPAD values reveal that, immediately after UV-B irradiation, maize (gray) consistently retains higher chlorophyll content than sorghum (green) at low to moderate exposure durations (0–6 h), as evidenced by statistically significant p-values (p < 0.05). Maize exhibits more rapid induction of antioxidant enzymes—such as superoxide dismutase and catalase—that scavenge ROS before they can initiate lipid peroxidation or pigment bleaching [59]. Consequently, the maize SPAD distributions are shifted toward higher values relative to sorghum under acute UV stress. Moreover, when examining recovery dynamics on the next (7th and 14th) days, maize again outperforms sorghum at short exposure durations (0, 1, 3 and 4 h; p = 0.002–0.004), indicating a faster chloroplast repair response.
However, it is noteworthy that under very high UV-B exposure (10 h and 12 h), the density ridges shift in favor of sorghum, such that sorghum SPAD values exceed those of maize, most strikingly at 10 h after irradiation, where the difference remains statistically significant (p = 0.036). This reversal likely reflects a survival-mode transition in maize that sorghum largely avoids.

3.3. Comparison of the Root and Stem Characteristics of Maize and Sorghum as the Answer to UV-B Exposure

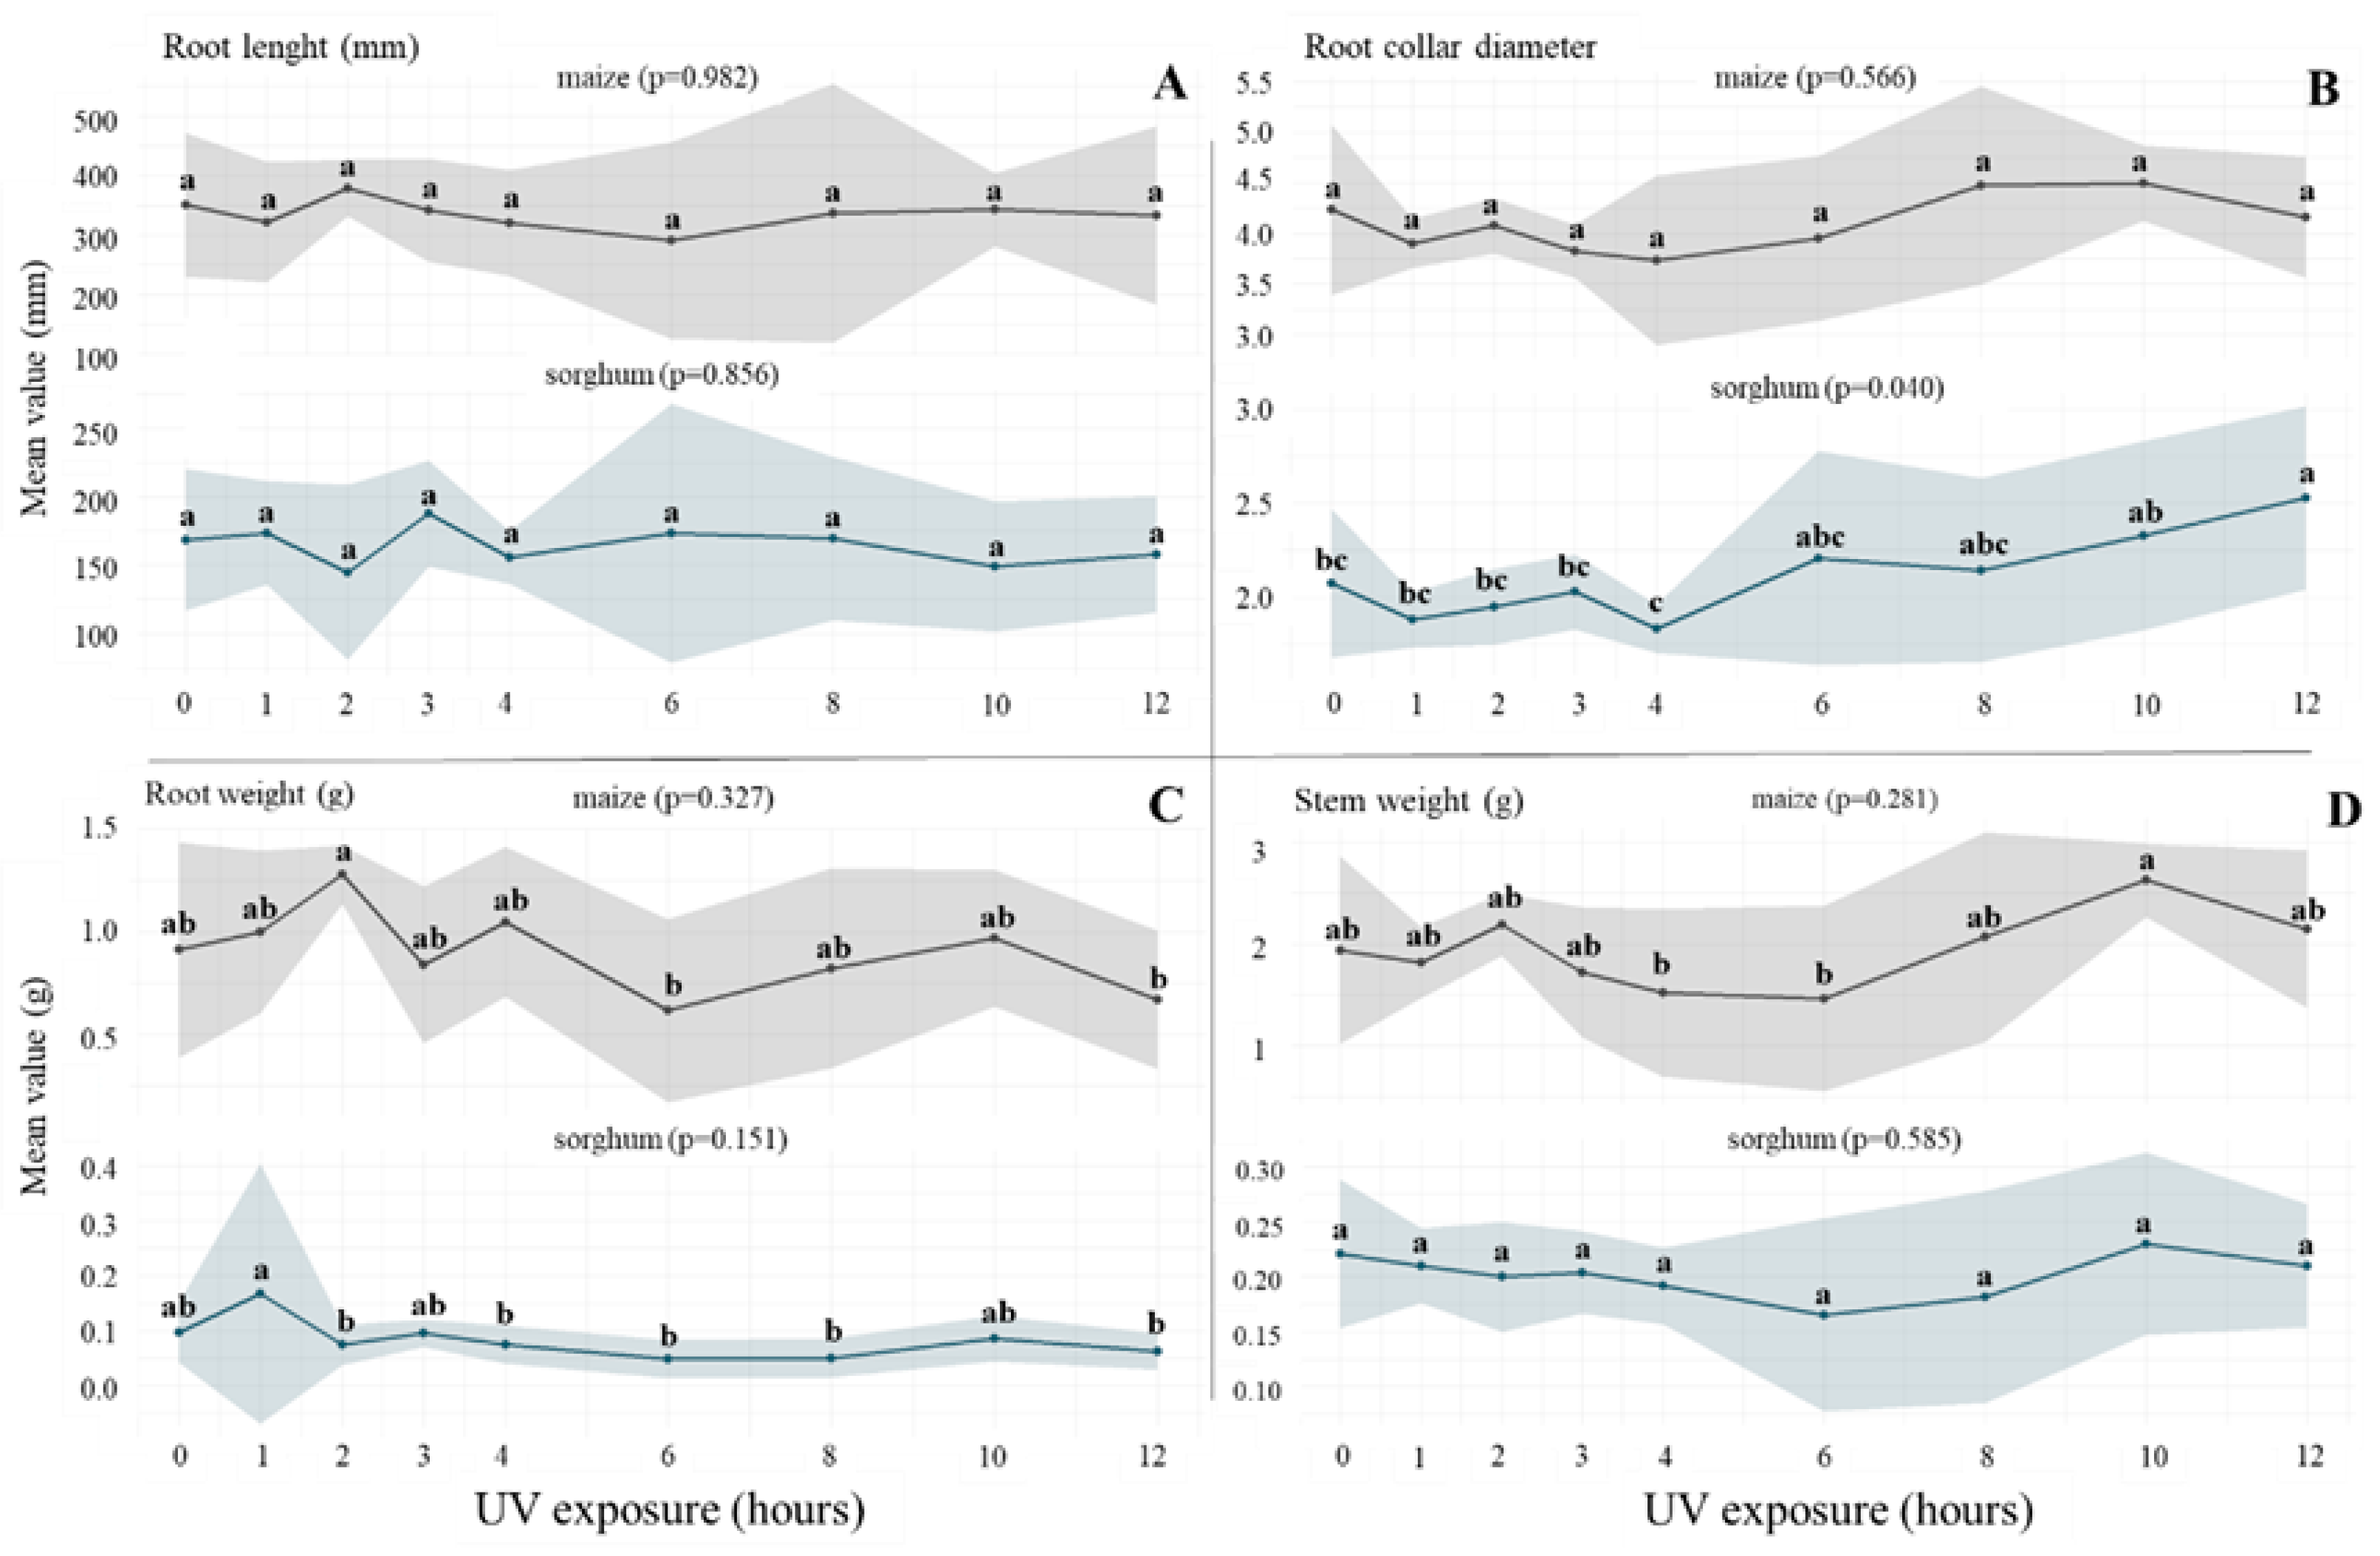
As a next step, some root and stem characteristics were examined on the 14th day after sowing. The root length (mm) (Figure 10A), the root collar diameter (mm) (Figure 10B), the root mass (g) (Figure 10C) and stem weight (g) (Figure 10D) were measured under various daily durations of UV-B exposure. A Duncan’s multiple-range test was conducted. The root length (mm) (Figure 10A) was yielding no statistically significant differences among the various exposure treatments for either maize or sorghum. However, a parallel trend is evident at lower UV-B doses: maize displays a local maximum in root length after 2 h of exposure, while sorghum exhibits a corresponding peak at 3 h. Correia et al. [60] examined the impact of UV-B radiation over an extended period on root growth. The findings revealed a decline in root length. However, in our case, no statistically significant differences were observed during the 14 day study period, which suggests that the root degradations possibly do not occur during the initial sensitive developmental stage.
The response of the root collar diameter (mm) to elevated UV-B irradiation shows a different pattern than root length (Figure 10B). The root collar diameter of maize under different radiations shows no significant differences; however, a notable observation is the striking similarity between the maize curves. The results demonstrate a slight increase in root collar diameter and root length, and a decrease in variance for 3 h exposure time. This is followed by a significant increase in variance for 4 h, 6 h and 8 h exposure, while the variance decreases at 10 h exposure. However, the mean values do not change significantly. In the case of sorghum, there is a linear increase in root collar diameter at higher radiation times (Figure 10B).
For the case of maize, a strong correlation is observed between root mass (g) and the root length (mm) measurements, with a peak observed at 3 h exposure with a low variance. This is in marked contrast to the 6 h and 12 h values, where significantly lower root mass values are observed (Figure 10C). This decline, however, does not manifest in the root length. If the root mass decreases while the root length does not, it can be deduced that the roots of maize have become weaker and thinner. Conversely, sorghum root mass exhibited a more balanced result, with a positive outlier value at 1 h exposure.
The final stage of the analysis is the examination of the stem weight (Figure 10D). A close observation reveals a similarity between the curves of maize and sorghum. It is important to emphasize the 10 h exposure, where the stem weight of both crops abruptly increases and surpasses the other values, while at the 12 h exposure, it reverts to approximately the average. A secondary maximum is also observed at 2 h exposure for maize, but not for sorghum. Sorghum also demonstrates a smoother curve in this instance, as observed for all the other parameters.

4. Discussion

In the present study, the physiological responses of maize and grain sorghum to UV-B irradiation of varying durations were investigated. The evolution of initial biophoton emission intensity, chlorophyll content (SPAD), and changes in various morphological parameters were the primary focus of the study.

4.1. Biophoton Emission as an Indicator of Stress

The initial biophoton emission value is considered an indicator of the physiological state of plants, particularly the state of the photosynthetic apparatus [51,61]. This is especially relevant in the case of UV-B radiation due to the link between oxidative processes and photosynthetic activity [62].
This initial increase may be due to a temporary rise in antioxidant enzyme levels after shorter UV-B exposure, which aligns with the findings of Shine and Guruprasad [63]. Previous studies by Papadopoulos et al. [64] and Kakani et al. [65] have also demonstrated that some plants respond positively to low-dose UV-B radiation. However, further increasing exposure leads to photoinhibition and degradation of the PSII system [66], resulting in a subsequent decrease in initial biophoton emission intensity. Our results show that the decrease in photon emission observed during the 4 h UV treatment is consistent with the results of our previous work [67,68], where we found that UV exposure resulted in a decrease in the initial biophoton emission intensity by the 4th hour treatment. The reason for this may be based on the general concept of stress associated with the work of Selye et al. [69]. After the initial onset of stress—assuming that the intensity of stress is not lethal—a temporary decrease in production is followed by the necessary onset of the acclimatization phase of plant metabolism, during which defense mechanisms are activated and, ultimately, plant production not only returns to its original state, but in some cases even exceeds the metabolic intensity of the baseline state. This phenomenon is called the general adaptation syndrome [69], one element of which is that the “application” of the mild stress mentioned above practically paves the way for the subsequent, possibly stronger stress effect, which the plant will be able to withstand more easily, as it increases resilience and activates general defense mechanisms more quickly and at a higher level.
In contrast, grain sorghum showed an increase in initial biophoton emission intensity after 8–10 h of treatment and was consequently found to be more resistant to UV-B radiation stress. A steeper slope was observed in maize, suggesting that prolonged UV-B stress leads to possible damage in this species.
During the normal operation of the photosynthetic electron transport chain, protons are pumped from one side of the thylakoid membrane (stroma) to the other (lumen) creating a proton gradient (ΔpH) and an electrical potential difference (ΔΨ) between the two sides of the thylakoid membrane [70]. It is well documented in the literature that UV exposure initiates the accumulation of H2O2 that has diverse consequences for the photosynthetic machinery. In their work, Foyer and Shigeoka [71] highlighted the importance of the antioxidant network of chloroplasts in terms of the extent of photosynthetic activity. They emphasized that in cases of stress, the H2O2 level in chloroplasts can increase by several orders of magnitude, and although it is difficult to accurately quantify the H2O2 level in the stroma, it is clear that H2O2 is a significant inhibitor of photosynthesis, as at a concentration of 10 mM, the rate of CO2 fixation can decrease by up to 50% due to the oxidation of thiol-modulated enzymes [71]. H2O2 can oxidize ATP synthase or other membrane proteins, resulting in fewer protons leaving the thylakoid interior and the electrical potential difference (ΔΨ) remaining, which ultimately leads to a decrease in DF or a prolonged decay. Also, it may increase membrane permeability, causing the charge difference to escape more quickly, which also results in a rapid decrease in ΔΨ, i.e., a faster decay of DF [72]. In addition, H2O2 in the Calvin cycle can oxidize thioredoxin, which then cannot activate thiol-modulated enzymes (e.g., GAPDH, FBPase, PRK). This results in a slowdown of the Calvin cycle, which also affects back to the electron transport chain: less NADP+ leads to photoinhibition, when the accumulated electrons are forced to take alternative routes, such as Mehler reaction, when electrons are transferred from ferredoxin or directly from PSI to oxygen, resulting in the formation of superoxide radicals that are converted to H2O2, which further increases ROS production and can damage PSII and the D1 protein in the PSII reaction center. The latter is particularly sensitive and therefore easily degraded and/or inactivated. As a result of the repair mechanisms that occur, the plant replaces the damaged D1 protein, but if the damage is faster than the repair, PSII activity is permanently reduced [73] and it causes a decrease in DF [74].
Furthermore, H2O2 also functions as a signaling molecule and activates the expression of genes encoding antioxidant enzymes, and can induce NPQ (non-photochemical quenching) components, resulting in increased energy dissipation in the form of heat [75], which also triggers decrease in DF.

4.2. Chlorophyll Content of Leaves in Maize and Sorghum Under UV-B Exposure

Regarding the evolution of chlorophyll content, leaves in optimally developing plants have a higher chlorophyll content than leaves in plants exposed to more intense abiotic stress [76]. The observed 4 h decrease did not occur in the SPAD values, which suggests that this moderate level of UV stress probably does not cause severe structural changes. However, the statistically significant decrease in DF clearly indicates that UV treatment causes a reversible but well-defined disruption in the PSII electron transport chain. This is because maize induces various antioxidant enzymes that scavenge ROS more rapidly, thus avoiding pigment bleaching and lipid peroxidation [59], which explains the differences observed following UV treatment. Further studies [66] attribute this phenomenon to a distinct and rapid recovery phase in maize. SPAD values measured in sorghum were higher than in maize in the 10- and 12 h UV treatments. Dehariya et al. [36] previously described that high UV-B radiation did not significantly affect carotenoid content; however, they also observed a decrease in chlorophyll levels in maize. Yao et al. [77] observed a significant decrease in chlorophyll levels with increasing UV-B exposure; however, no such decrease was observed in our study. Previous studies by He et al. [25] also found no significant changes in chlorophyll concentration in rice and peas.

4.3. Root and Stem Traits of Maize and Sorghum Under UV-B Exposure

In contrast to the literature showing a significant decrease in root length with increasing UV-B exposure [60,78], our results based on root length data at day 14 showed no statistical difference in root length between the two-plant species under different treatments. Similar results were obtained by Mathur et al. [79] among different rice genotypes. This is likely because root degradation occurs at a later stage of development than that examined in our study (BBCH 13–14).
In terms of root collar diameter, a decrease was observed in some plant species as the UV-B dose increased [79,80,81], while a slight increase was observed in others [29,82]. For maize, no significant differences were observed at different radiation levels, but striking similarities were observed between root collar diameter and root length curves. Our results show a slight increase in diameter with different exposures, while significant variations in variance are observed. In contrast, the root collar diameter in sorghum increased linearly with gradual increases in UV radiation. No similar increase or explanation thereof has been published in the international literature to date.
The evolution of root mass on day 14 shows a strong correlation between root mass and length in maize. In contrast, however, the decrease in root mass observed in the 6 and 12 h treatments were not accompanied by a corresponding decrease in root length. This suggests that the maize roots became thinner and therefore weaker.
The decrease in various root parameters is due to a reduction in photosynthesis and cell division caused by increasing UV-B radiation. The same results were obtained by Meng et al. [83] in soybean, and Sah et al. [81] in rice, who also observed a significant decrease in photosynthesis and cell division in the plants they studied.
The development of the vegetative mass of plant parts shows significant similarities between the two species. Data from Cybulski and Peterjohn [84] show an increase in stem mass for some plants under elevated UV-B exposure. However, the exact values have not yet been determined. By contrast, most studies report a decrease in vegetative part mass of wheat, soybean and maize [23,24,85].

5. Conclusions

The objective of this study was to compare the stress tolerance of maize and grain sorghum under varying durations of UV-B exposure. The findings demonstrate that grain sorghum exhibited elevated levels of UV-B radiation resistance across all evaluated exposure periods, indicating its potential as a possible substitute for maize in future shift in agricultural production due to climate change. The results of morphophysiological measurements revealed species-specific differences; however, it is important to mention that the two plant species have different growth rates, which may contribute to the observed differences (in the case of the control group). The analysis of root parameters (root length, root collar diameter, root weight) and stem biomass development indicated that grain sorghum exhibited higher levels of stress tolerance. In conclusion, the examined parameters were found to be re-liable indicators for the assessment of the stress effects induced by UV-B radiation.
In order to refine observations on the time scale, it is recommended that future studies incorporate intermediate time points (e.g., 5 h) in order to more accurately determine the stage at which plant metabolism begins to successfully compensate for the temporary increase in H2O2 levels caused by UV stress.
Direct methods are also required to assess ROS levels; measurements of lipid oxi-dation (MDA), H2O2, total antioxidant capacity, and antioxidant enzymes, which would provide insights into the mechanisms underlying recovery.

Author Contributions

Conceptualization, K.S.-T. and A.P.; methodology, K.S.-T. and A.P.; validation, I.J. and C.V.; data curation, K.S.-T. and A.P.; writing—original draft preparation, K.S.-T., A.P. and I.J.; visualization, K.S.-T.; supervision, K.S.-T. and I.J. All authors have read and agreed to the published version of the manuscript.

Funding

Supported by the EKÖP-MATE/2024/25/D University Research Scholarship Program of the Ministry for Culture and Innovation from the Source of the National Research, Development and Innovation and supported by the EKÖP-MATE/2024/25/K new national excellence program of the ministry for culture and innovation from the source of the national research, development and innovation fund. This work was supported by the Flagship Research Groups Program of the Hungarian University of Agriculture and Life Sciences.

Data Availability Statement

The datasets analyzed during the current study are not publicly available due to privacy reasons, but they are available from the corresponding author on reasonable request.

Conflicts of Interest

The authors declare no conflicts of interest. The funders had no role in the design of the study; in the collection, analyses, or interpretation of data; in the writing of the manuscript; or in the decision to publish the results.

References

  1. Tubiello, F.N.; Fabi, C.; Conchedda, G.; Casse, L.; Bottini, G. Comparison of WorldCereal with FAOSTAT Data: An Exploratory Analysis. In FAO Statistics Working Paper Series; FAO: Rome, Italy, 2025; pp. 25–46. [Google Scholar] [CrossRef]
  2. Bakari, H.; Djomdi Ruben, Z.F.; Roger, D.D.; Cedric, D.; Guillaume, P.; Pascal, D.; Philippe, M.; Gwendoline, C. Sorghum (Sorghum bicolor L. Moench) and Its Main Parts (By-Products) as Promising Sustainable Sources of Value-Added Ingredients. Waste Biomass Valorization 2023, 14, 1023–1044. [Google Scholar] [CrossRef]
  3. Popescu, A.; Condei, R. Some Considerations on the Prospects of Sorghum Crop. Sci. Pap. 2014, 14, 295–304. [Google Scholar]
  4. Gerik, T.; Bean, B.; Vanderlip, R. Sorghum Growth and Development. Agric. Commun. 2003, B-6137 7-03. [Google Scholar]
  5. Tao, Y.; Zhao, X.; Wang, X.; Hathorn, A.; Hunt, C.; Cruickshank, A.W.; van Oosterom, E.J.; Godwin, I.D.; Mace, E.S.; Jordan, D.R. Large-scale GWAS in Sorghum Reveals Common Genetic Control of Grain Size among Cereals. Plant Biotechnol. J. 2020, 18, 1093–1105. [Google Scholar] [CrossRef]
  6. Buhiniček, I.; Kaučić, D.; Kozić, Z.; Jukić, M.; Gunjača, J.; Šarčević, H.; Stepinac, D.; Šimić, D. Trends in Maize Grain Yields across Five Maturity Groups in a Long-Term Experiment with Changing Genotypes. Agriculture 2021, 11, 887. [Google Scholar] [CrossRef]
  7. Bais, A.F.; McKenzie, R.L.; Bernhard, G.; Aucamp, P.J.; Ilyas, M.; Madronich, S.; Tourpali, K. Ozone depletion and climate change: Impacts on UV radiation. Photochem. Photobiol. Sci. 2015, 14, 19–52. [Google Scholar] [CrossRef] [PubMed]
  8. Xu, H.; Twine, T.E.; Girvetz, E. Climate Change and Maize Yield in Iowa. PLoS ONE. 2016, 11, 156083. [Google Scholar] [CrossRef]
  9. Cockell, C.S.; Horneck, G. The History of the UV Radiation Climate Ofthe Earth—Theoretical and Space-Based Observations. Photochem. Photobiol. Sci. 2001, 73, 447–451. [Google Scholar] [CrossRef]
  10. Horneck, G.; Klaus, D.M.; Mancinelli, R.L. Space microbiology. Microbiol. Mol. Biol. Rev. 2010, 74, 121–156. [Google Scholar] [CrossRef] [PubMed]
  11. McKenzie, R.L.; Aucamp, P.J.; Bais, A.F.; Björn, L.O.; Ilyas, M.; Madronich, S. Ozone depletion and climate change: Impacts on UV radiation. Photochem. Photobiol. Sci. 2011, 10, 182–198. [Google Scholar] [CrossRef]
  12. Mmbando, G.S.; Teranishi, M.; Hidema, J. Very High Sensitivity Of African Rice to Artificial Ultraviolet-B Radiation Caused by Genotypeand Quantity of Cyclobutane Pyrimidine Dimer Photolyase. Sci. Rep. 2020, 10, 3158. [Google Scholar] [CrossRef]
  13. Tevini, M. UV-B Effects on Plants. In Environmental Pollution and Plant Responses; Routledge: Oxford, UK, 2023; pp. 83–97. [Google Scholar]
  14. Middleton, E.M.; Teramura, A.H. The Role of Flavonol Glycosides and Carotenoids in Protecting Soybean from Ultraviolet-B Damage. Plant Physiol. 1993, 103, 741–752. [Google Scholar] [CrossRef] [PubMed]
  15. Iwabuchi, K.; Hidema, J.; Tamura, K.; Takagi, S.; Hara-Nishimura, I. Plant Nuclei Move to Escape Ultraviolet-Induced DNA Damage Andcell Death. Plant Physiol. 2016, 170, 678–685. [Google Scholar] [CrossRef] [PubMed]
  16. Hermanowicz, P.; Banaś, A.K.; Sztatelman, O.; Gabryś, H.; Łabuz, J. UV-B Induces Chloroplast Movements in a Phototropin-Dependent Manner. Front. Plant Sci. 2019, 10, 1279. [Google Scholar] [CrossRef] [PubMed]
  17. Rácz, A.; Hideg, É.; Czégény, G. Selective Responses of Class III Plant Peroxidase Isoforms to Environmentally Relevant UV-B Doses. J. Plant Physiol. 2018, 221, 101–106. [Google Scholar] [CrossRef]
  18. Petrov, V.D.; Breusegem, F. Hydrogen Peroxide—A Central Hub for Information Flow in Plant Cells. AoB Plants 2012, 2012, pls014. [Google Scholar] [CrossRef]
  19. Czégény, G.; Wu, M.; Dér, A.; Eriksson, L.A.; Strid, Å.; Hideg, É. Hydrogen Peroxide Contributes to the Ultraviolet-B(280–315 Nm) Induced Oxidative Stress of Plant Leaves through Multiple Pathways. FEBS Lett. 2014, 588, 2255–2261. [Google Scholar] [CrossRef]
  20. Sachdev, S.; Ansari, S.A.; Ansari, M.I.; Fujita, M.; Hasanuzzaman, M. Abiotic Stress and Reactive Oxygen Species: Generation, Signaling, and Defense Mechanisms. Antioxidants 2021, 10, 277. [Google Scholar] [CrossRef]
  21. Pospíšil, P. Production of Reactive Oxygen Species by Photosystem II as a Response to Light and Temperature Stress. Front. Plant Sci. 2016, 7, 1950. [Google Scholar] [CrossRef]
  22. Li, X.; Ren, Q.; Zhao, W.; Liao, C.; Wang, Q.; Ding, T.; Hu, H.; Wang, M. Interaction between UV-B and Plant Anthocyanins. Funct. Plant Biol. 2023, 50, 599–611. [Google Scholar] [CrossRef]
  23. Li, Y.; Zu, Y.Q.; Chen, J.J.; Chen, H.Y. Intraspecific Responses in Crop Growth and Yield of 20 Soybean Cultivars to Enhanced Ultraviolet-B Radiation under Field Conditions. Field Crops Res. 2002, 78, 1–8. [Google Scholar] [CrossRef]
  24. Kataria, S.; Guruprasad, K.N. Solar UV-B and UV-A/B Exclusion Effects on Intraspecific Variations in Crop Growth and Yield of Wheat Varieties. Field Crops Res. 2012, 125, 8–13. [Google Scholar] [CrossRef]
  25. He, J.; Huang, L.K.; Chow, W.S.; Whitecross, M.I.; Anderson, J.M. Effects of Supplementary Ultraviolet-B Radiation on Rice and Pea Plants. Funct. Plant Biol. 1993, 20, 129–142. [Google Scholar] [CrossRef]
  26. Hofmann, R.W.; Campbell, B.D.; Bloor, S.J.; Swinny, E.E.; Markham, K.R.; Ryan, K.G.; Fountain, D.W. Responses to UV-B Radiation in Trifolium repens L.—Physiological Links to Plant Productivity and Water Availability. Plant Cell Environ. 2003, 26, 603–612. [Google Scholar] [CrossRef]
  27. Hunt, J.E.; McNeil, D.L. Nitrogen status affects UV-B sensitivity of cucumber. Funct. Plant Biol. 1998, 25, 79–86. [Google Scholar] [CrossRef]
  28. DeLong, J.M.; Steffen, K.L. Photosynthetic Function, Lipid Peroxidation, and α-Tocopherol Content in Spinach Leaves during Exposure to UV-B Radiation. Can. J. Plant Sci. 1997, 77, 453–459. [Google Scholar] [CrossRef]
  29. Shaukat, S.S.; Farooq, M.A.; Siddiqui, M.F.; Zaidi, S. Effect of Enhanced UV-B Radiation on Germination, Seedling Growth and Biochemical Responses of Vigna mungo (L.) Hepper. Pak. J. Bot. 2013, 45, 779–785. [Google Scholar]
  30. Carletti, P.; Masi, A.; Wonisch, A.; Grill, D.; Tausz, M.; Ferretti, M. Changes in Antioxidant and Pigment Pool Dimensions in UV-B Irradiated Maize Seedlings. Environ. Exp. Bot. 2003, 50, 149–157. [Google Scholar] [CrossRef]
  31. Gao, W.; Zheng, Y.; Slusser, J.R.; Heisler, G.M.; Grant, R.H.; Xu, J.; He, D. Effects of Suplementary Ultraviolet-B Irradiance on Maize Yield and Qualities: A Field Experiment. Photochem. Photobiol. 2004, 80, 127–131. [Google Scholar] [CrossRef]
  32. Zhang, S.; Gao, R. Diurnal Changes of Gas Exchange, Chlorophyll Fluorescence, and Stomatal Aperture of Hybrid Poplar Clones Subjected to Midday Light Stress. Photosynthetica 2000, 37, 559–571. [Google Scholar] [CrossRef]
  33. Jovanić, B.R.; Radenković, B.; Despotović-Zrakić, M.; Bogdanović, Z.; Barać, D. Effect of UV-B Radiation on Chlorophyll Fluorescence, Photosynthetic Activity and Relative Chlorophyll Content of Five Different Corn Hybrids. J. Photochem. Photobiol. 2022, 10, 100115. [Google Scholar] [CrossRef]
  34. Kataria, S.; Guruprasad, K.N. Intraspecific Variations in Growth, Yield and Photosynthesis of Sorghum Varieties to Ambient UV (280–400 Nm) Radiation. Plant Sci. 2012, 196, 85–92. [Google Scholar] [CrossRef]
  35. Yao, Y.; Yang, Y.; Ren, J.; Li, C. UV-Spectra Dependence of Seedling Injury and Photosynthetic Pigment Change in Cucumis Sativus and Glycine Max. Environ. Exp. Bot. 2006, 57, 160–167. [Google Scholar] [CrossRef]
  36. Dehariya, P.; Kataria, S.; Pandey, G.P.; Guruprasad, K.N. Photosynthesis and Yield in Cotton (Gossypium hirsutum L.) Var. Vikram after Exclusion of Ambient Solar UV-B/A. Acta Physiol. Plant. 2012, 34, 1133–1144. [Google Scholar] [CrossRef]
  37. Rrobson, T.M.; Klem, K.; Urban, O.; Jansen, M.A.K. Plant Morphological Responses to UV-B. Plant Cell Environ. 2015, 38, 856–866. [Google Scholar] [CrossRef]
  38. Yang, Y.; Yao, Y.; He, H. Influence of Ambient and Enhanced Ultraviolet-B Radiation on the Plant Growth and Physiological Properties in Contrasting Populations of Hippophae rhamnoides. J. Plant Res. 2008, 121, 377–385. [Google Scholar] [CrossRef]
  39. Klem, K.; Ac, A.; Holub, P.; Kovac, D.; Spunda, V.; Robson, T.M.; Urban, O. Interactive Effects of PAR and UV Radiation on the Physiology, Morphology and Leaf Optical Properties of Two Barley Varieties. Environ. Exp. Bot. 2012, 75, 52–64. [Google Scholar] [CrossRef]
  40. Robson, T.M.; Aphalo, P.J. Species-Specific Effect of UV-B Radiation on the Temporal Pattern of Leaf Growth. Physiol. Plant. 2012, 144, 146–160. [Google Scholar] [CrossRef]
  41. Liaqat, W.; Altaf, M.T.; Barutçular, C. Ultraviolet-B Radiation in Relation to Agriculture in the Context of Climate Change: A Review. Cereal Res. Commun. 2024, 52, 1–24. [Google Scholar] [CrossRef]
  42. Wong, H.M.; Hofmann, R.W.; Reichman, S.M. The Interactions of Iron Nutrition, Salinity and Ultraviolet-B Radiation on the Physiological Responses of Wheat (Triticum aestivum L.). Environ. Exp. Bot. 2023, 207, 105201. [Google Scholar] [CrossRef]
  43. Srivastava, G.; Kumar, S.; Dubey, G. Nickel and Ultraviolet-B Stresses Induce Differential Growth and Photosynthetic Responses in Pisum sativum L. Seedlings. Biol. Trace Elem. Res. 2012, 149, 86–96. [Google Scholar] [CrossRef]
  44. Schmitz-Hoerner, R.; Weissenböck, G. Contribution of Phenolic Compounds to the UV-B Screening Capacity of Developing Barley Primary Leaves in Relation to DNA Damage and Repair under Elevated UV-B Levels. Phytochemistry 2003, 64, 243–255. [Google Scholar] [CrossRef] [PubMed]
  45. Ruhland, C.T.; Eatwell, M.F. The Effects of Ultraviolet Radiation on the Brown Midrib Mutants of Zea mays and Sorghum bicolor. Theor. Exp. Plant Physiol. 2017, 29, 87–94. [Google Scholar] [CrossRef]
  46. Zhang, L.; Allen, L.H.; Vaughan, M.M.; Hauser, B.A.; Boote, K.J. Solar Ultraviolet Radiation Exclusion Increases Soybean Internode Lengths and Plant Height. Agric. For. Meteorol. 2014, 184, 170–178. [Google Scholar] [CrossRef]
  47. Coleman, R.S.; Day, T.A. Response of Cotton and Sorghum to Several Levels of Subambient Solar UV-B Radiation: A Test of the Saturation Hypothesis. Physiol. Plant. 2004, 122, 362–372. [Google Scholar] [CrossRef]
  48. Chen, W.; Jia, B.; Chen, J.; Feng, Y.; Li, Y.; Chen, M.; Yin, Z. Effects of Different Planting Densities on Photosynthesis in Maize Determined via Prompt Fluorescence, Delayed Fluorescence and P700 Signals. Plants 2021, 10, 276. [Google Scholar] [CrossRef]
  49. Pónya, Z.s.; Jócsák, I.; Keszthelyi, S. Detection of Ultra-Weak Photon Emission in Sunflower (Helianthus annuus L.) Infested by Two Spotted-Spider Mite, Tetranychus Urticae Koch-Research Note. Phytoparasitica 2022, 50, 43–50. [Google Scholar] [CrossRef]
  50. Jócsák, I.; Csima, F.; Somfalvi-Tóth, K. Alterations of Photosynthetic and Oxidative Processes Influenced by the Presence of Different Zinc and Cadmium Concentrations in Maize Seedlings: Transition from Essential to Toxic Functions. Plants 2024, 13, 1150. [Google Scholar] [CrossRef]
  51. Sánchez-Moreiras, A.M.; Graña, E.; Reigosa, M.J.; Araniti, F. Imaging of Chlorophyll a Fluorescence in Natural Compound-Induced Stress Detection. Front. Plant Sci. 2020, 11, 583590. [Google Scholar] [CrossRef]
  52. Lukács, H.; Jócsák, I.; Somfalvi-Tóth, K.; Keszthelyi, S. Physiological Responses Manifested by Some Conventional Stress Parameters and Biophoton Emission in Winter Wheat as a Consequence of Cereal Leaf Beetle Infestation. Front. Plant Sci. 2022, 13, 839855. [Google Scholar] [CrossRef]
  53. Jocsak, I.; Malgwi, I.; Rabnecz, G.; Szegő, A.; Varga-Visi, E.; Végvári, G.; Ponya, Z. Effect of Cadmium Stress on Certain Physiological Parameters Antioxidative Enzyme Activities Biophoton Emission of Leaves in Barley (Hordeum vulgare L.) Seedlings. PLoS ONE 2020, 15, 240470. [Google Scholar] [CrossRef]
  54. Wu, G.; Bornman, J.F.; Bennett, S.J.; Clarke, M.W.; Fang, Z.; Johnson, S.K. Individual Polyphenolic Profiles and Antioxidant Activity in Sorghum Grains Are Influenced by Very Low and High Solar UV Radiation and Genotype. J. Cereal Sci. 2017, 77, 17–23. [Google Scholar] [CrossRef]
  55. Podolec, R.; Demarsy, E.; Ulm, R. Perception and Signaling of Ultraviolet-B Radiation in Plants. Annu. Rev. Plant Biol. 2021, 72, 793–822. [Google Scholar] [CrossRef] [PubMed]
  56. Haripriya Anand, M.; Byju, G. Chlorophyll Meter and Leaf Colour Chart to Estimate Chlorophyll Content, Leaf Colour, and Yield of Cassava. Photosynthetica 2008, 46, 511–516. [Google Scholar] [CrossRef]
  57. R Core Team. R: A Language and Environment for Statistical Computing; R Foundation for Statistical Computing: Vienna, Austria, 2023; Available online: https://www.R-project.org/ (accessed on 18 July 2025).
  58. Mendiburu, F. Agricolae: Statistical Procedures for Agricultural Research. R package version 4.3.2. 2023.
  59. Santos, I.; Almeida, J.; Salema, R. The Influence of UV-B Radiation on the Superoxide Dismutase of Maize, Potato, Sorghum, and Wheat Leaves. Can. J. Bot. 2016, 77, 70–76. [Google Scholar] [CrossRef]
  60. Correia, C.M.; Coutinho, J.F.; Björn, L.O.; Torres-Pereira, J.M. Ultraviolet-B Radiation and Nitrogen Effects on Growth and Yield of Maize under Mediterranean Field Conditions. Eur. J. Agron. 2000, 12, 117–125. [Google Scholar] [CrossRef]
  61. Goltsev, V.; Zaharieva, I.; Chernev, P.; Strasser, R. Delayed Chlorophyll Fluorescence as a Monitor for Physiological State of Photosynthetic Apparatus. Biotechnol. Biotechnol. Equip. 2009, 23, 452–457. [Google Scholar] [CrossRef]
  62. Hideg, É.; Juhász, M.; Bornman, J.F. The Distribution and Possible Origin of Blue—Green Fluorescence in Control and Stressed Barley Leaves. Photochem. Photobiol. Sci. 2002, 1, 934–941. [Google Scholar] [CrossRef]
  63. Shine, M.B.; Guruprasad, K.N. Oxyradicals and PSII Activity in Maize Leaves in the Absence of UV Components of Solar Spectrum. J. Biosci. 2012, 37, 703–712. [Google Scholar] [CrossRef]
  64. Papadopoulos, Y.A.; Gordon, R.J.; Mcrae, K.; Bush, R.; Belanger, G.; Butler, G.E.; Sherry, A.E.; Morrison, F.M. Current and Elevated Levels of UV-B Radiation Have Few Impacts on Yields of Perennial Forage Crops. Glob. Change Biol. 1999, 5, 847–856. [Google Scholar] [CrossRef]
  65. Kakani, V.G.; Reddy, K.R.; Zhao, D.; Sailaja, K. Field Crop Responses to Ultraviolet-B Radiation: A Review. Agric. For. Meteorol. 2003, 120, 191–218. [Google Scholar] [CrossRef]
  66. Casati, P.; Walbot, V. Rapid Transcriptome Responses of Maize (Zea mays) to UV-B in Irradiated and Shielded Tissues. Genome Biol. 2004, 5, R16. [Google Scholar] [CrossRef] [PubMed]
  67. Pitz, A.; Somfalvi-Tóth, K. A Kukorica És a Cirok Vizsgálata Juvenilis Fejlődési Szakaszban Különböző Abiotikus Stresszorok (Víz, UV-B Sugárzás) Hatása Mellett. In Proceedings of the 2. Alkalmazott Növénytudományi Konferencia: Roncsolásmentes Képalkotó Technológiák a Növénytermesztésben: Legújabb Eredmények és Alkalmazási Lehetőségek, Balatonkenese, Hungary, 28 September 2023; Keszthelyi, S., Jócsák, I., Eds.; Magyar Agrár- és Élettudományi Egyetem, Növénytermesztési-tudományok Intézet: Kaposvár, Magyarország, 2023; p. 35. [Google Scholar]
  68. Pitz, A.; Somfalvi-Tóth, K. Abraktakarmányok (Kukorica, Szemes Cirok) Stresszreakciója Magas UV-B Besugárzás Hatására. In Proceedings of the XIV, Magyar Növénybiológiai Kongresszus: Összefoglaló Kötet, Balatonkenese, Hungary, 28–30 August 2024; Magyar Növénybiológiai Társaság, Ed.; Szegedi Biológiai Kutatóközpont: Szeged, Magyarország, 2024; p. 92. [Google Scholar]
  69. Selye, H. The Stress of Life, Rev ed; McGraw Hill: New York, NY, USA, 1978. [Google Scholar]
  70. Höhner, R.; Aboukila, A.; Kunz, H.H.; Venema, K. Proton Gradients and Proton-Dependent Transport Processes in the Chloroplast. Front. Plant Sci. 2016, 7, 218. [Google Scholar] [CrossRef]
  71. Foyer, C.H.; Shigeoka, S. Understanding Oxidative Stress and Antioxidant Functions to Enhance Photosynthesis. Plant Physiol. 2011, 155, 93–100. [Google Scholar] [CrossRef]
  72. Wilson, S.; Johnson, M.P.; Ruban, A. V Proton Motive Force in Plant Photosynthesis Dominated by ΔpH in Both Low and High Light. Plant Physiol. 2021, 187, 263–275. [Google Scholar] [CrossRef]
  73. Lima-Melo, Y.; Alencar, V.T.; Lobo, A.K.; Sousa, R.H.; Tikkanen, M.; Aro, E.M.; Gollan, P.J. Photoinhibition of Photosystem I Provides Oxidative Protection during Imbalanced Photosynthetic Electron Transport in Arabidopsis Thaliana. Front. Plant Sci. 2019, 10, 916. [Google Scholar] [CrossRef]
  74. Michelet, L.; Zaffagnini, M.; Morisse, S.; Sparla, F.; Pérez-Pérez, M.E.; Francia, F.; Lemaire, S.D. Redox Regulation of the Calvin–Benson Cycle: Something Old, Something New. Front. Plant Sci. 2013, 4, 470. [Google Scholar] [CrossRef]
  75. Tripathy, B.C.; Oelmüller, R. Reactive Oxygen Species Generation and Signaling in Plants. Plant Signal. Behav. 2012, 7, 1621–1633. [Google Scholar] [CrossRef]
  76. Zhang, H.; He, H.; Song, W.; Zheng, L. Pre-Harvest UVB Irradiation Enhances the Phenolic and Flavonoid Content, and Antioxidant Activity of Green- and Red-Leaf Lettuce Cultivars. Horticulturae 2023, 9, 695. [Google Scholar] [CrossRef]
  77. Yao, Y.; Xuan, Z.; He, Y.; Lutts, S.; Korpelainen, H.; Li, C. Principal Component Analysis of Intraspecific Responses of Tartary Buckwheat to UV-B Radiation under Field Conditions. Environ. Exp. Bot. 2007, 61, 237–245. [Google Scholar] [CrossRef]
  78. Zhang, R.; Huang, G.; Wang, L.; Zhou, Q.; Huang, X. Effects of Elevated Ultraviolet-B Radiation on Root Growth and Chemical Signaling Molecules in Plants. Ecotoxicol. Environ. Saf. 2019, 171, 683–690. [Google Scholar] [CrossRef] [PubMed]
  79. Mathur, S.; Bheemanahalli, R.; Jumaa, S.H.; Kakar, N.; Reddy, V.R.; Gao, W.; Reddy, K.R. Impact of Ultraviolet-B Radiation on Early-Season Morpho-Physiological Traits of Indica and Japonica Rice Genotypes. Front. Plant Sci. 2024, 15, 1369397. [Google Scholar] [CrossRef]
  80. Yang, J.; Li, M.R.; Qin, L.; Feng, S.H.; Zhan, F.D.; Li, Y.; He, Y.M. The Effects of Enhanced UV-B Radiation on Root Morphology and Secretion Content of Rice (Oryza sativa Linn.). IOP Conf. Ser. Earth Environ. Sci. 2020, 446, 032073. [Google Scholar] [CrossRef]
  81. Sah, S.K.; Reddy, K.R.; Li, J. Silicon Enhances Plant Vegetative Growth and Soil Water Retention of Soybean (Glycine max) Plants under Water-Limiting Conditions. Plants 2022, 11, 1687. [Google Scholar] [CrossRef]
  82. Canbay, S.; Polat, E. UV-B ışın uygulamalarının domates, hıyar ve patlıcan fidelerinde fide gelişimi ve kalitesi üzerine etkileri. Mediterr. Agric. Sci. 2019, 32, 79–84. [Google Scholar] [CrossRef]
  83. Meng, F.; Xiang, D.; Zhu, J.; Li, Y.; Mao, C. Molecular Mechanisms of Root Development in Rice. Rice 2019, 12, 1. [Google Scholar] [CrossRef] [PubMed]
  84. Cybulski, W.J.I.; Peterjohn, W.T. Effects of Ambient UV-B Radiation on the above-Ground Biomass of Seven Temperate-Zone Plant Species. Plant Ecol. 1999, 145, 175–181. [Google Scholar] [CrossRef]
  85. Wijewardana, C.; Henry, W.B.; Gao, W.; Reddy, K.R. Interactive Effects on CO2, Drought, and Ultraviolet-B Radiation on Maize Growth and Development. J. Photochem. Photobiol. 2016, 160, 198–209. [Google Scholar] [CrossRef]
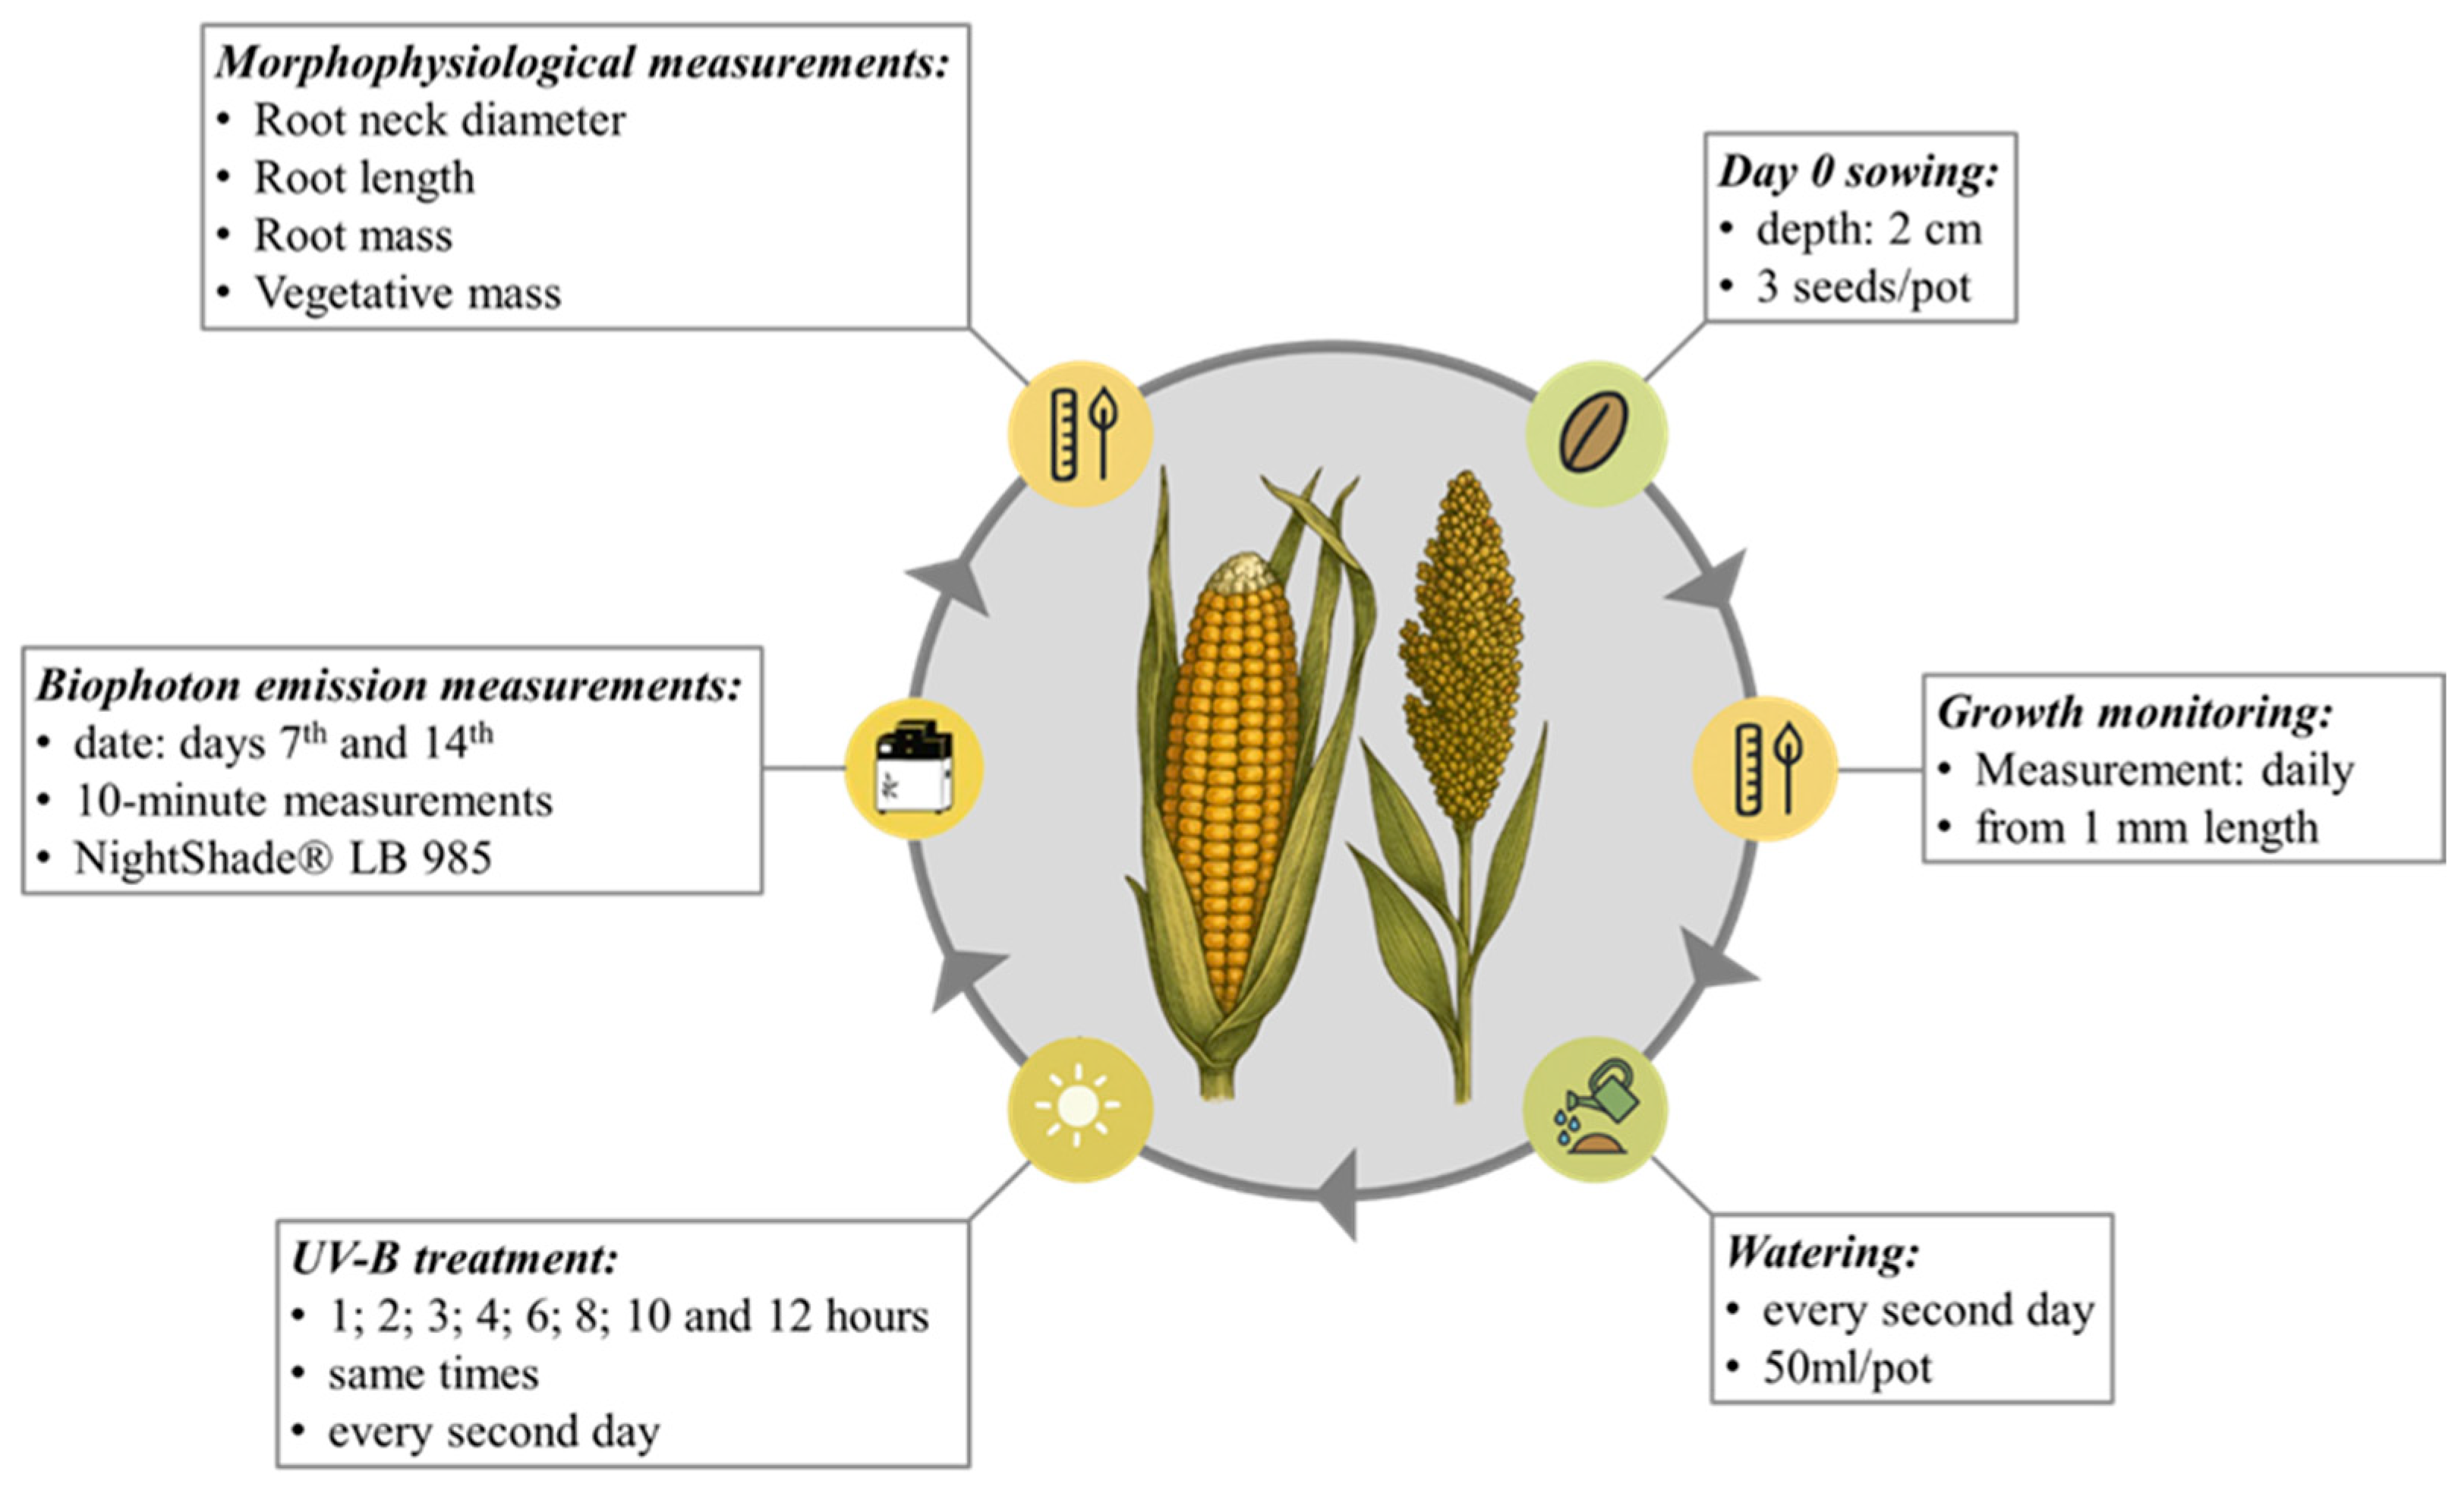
Figure 1. Summary chart of the experimental setup of the project. The morphophysiological measurements were the final step of the experiment on the 14th day after sowing.
Agronomy 15 02224 g001
Figure 2. The variation in coloration of the leaves is indicative of the initial biophoton emission intensity, which is observed within the first minute. (A) Biophoton emission of grain sorghum in the first minute. (B) Maize biophoton emission in the first minute.
Agronomy 15 02224 g002
Figure 3. The evolution of initial biophoton emission intensity on the 7th (A) and 14th day (B) after sowing. The letters indicate the result of the Duncan post hoc test. The 0 h column is indicative of the control group. The experimental design comprised 16 plant for each treatment, with the exception of the control group, which contained 32 plants. The post hoc test was conducted on individual plants and measurements rather than on the entire dataset.
Agronomy 15 02224 g003
Figure 4. Mean initial biophoton rate (cps/mm2) on the 7th and 14th day after sowing. With regard to the initial biophoton emission intensity, higher values are indicative of lower stress effects on the plant.
Agronomy 15 02224 g004
Figure 5. The rate of the initial biophoton emission intensity [cps/mm2] and the decay between the first- and second-time step of the biophoton emission intensity. The higher the initial biophoton emission intensity, the less stressed the plant. The higher the decay of biophoton intensity, the more stressed the plant. The lines function is exclusively to provide a visual aid.
Agronomy 15 02224 g005
Figure 6. The initial biophoton emission intensity [cps/mm2] right after the UV-B exposition and on the next, 7th day, along with the different UV-B expositions. The experimental design included 16 plants for each treatment, except for the control group, which contained 32 plants.
Agronomy 15 02224 g006
Figure 7. The change (Δ%) of initial biophoton emission intensity between the measurement after the irradiation and the next day as the function of the duration (hours) of UV-B irradiation. A positive (negative) change indicates that the initial biophoton emission intensity increased (decreased) by the following day, reflecting an improvement (reduction) in the plant’s stress state.
Agronomy 15 02224 g007
Figure 8. The initial biophoton emission intensity [cps/mm2] right after the UV-B exposition and on the next, 14th day, along with the different UV-B exposition times. The experimental design comprised 16 plant species for each treatment, with the exception of the control group, which contained 32 plants.
Agronomy 15 02224 g008
Figure 9. Distribution of all SPAD values (7th and 14th days) comparing maize and sorghum along with different UV exposure times. The control group is referred to as 0 h of UV exposition. The p-value (α = 5%) in each case compares the SPAD values of corn and sorghum “After UV irradiation” (6th and 13th days) and the “Next day” (7th and 14th days).
Agronomy 15 02224 g009
Figure 10. The results of measurements taken on various plant components on the 14th day of the experiment, comparing the performance of maize and sorghum (A) root length (mm), (B) root collar diameter (mm), (C) root weight (g), (D) stem weight (g). The 0 h column is indicative of the control group. The experimental design comprised 16 plant species for each treatment, with the exception of the control group, which contained 32 plants. The post hoc test was conducted on individual plants and measurements rather than on the entire dataset. The letters indicate the result of the Duncan post hoc test.
Agronomy 15 02224 g010
Disclaimer/Publisher’s Note: The statements, opinions and data contained in all publications are solely those of the individual author(s) and contributor(s) and not of MDPI and/or the editor(s). MDPI and/or the editor(s) disclaim responsibility for any injury to people or property resulting from any ideas, methods, instructions or products referred to in the content.