Article

Improving Root Nitrogen Uptake via Organic Fertilizer Substitution Enhances Yield and Efficiency in Dryland Maize

State Key Laboratory of Arid Land Crop Science, College of Agronomy, Gansu Agricultural University, Lanzhou 730070, China
*
Author to whom correspondence should be addressed.
These authors contributed equally to this study.
Agronomy 2025, 15(9), 2216; https://doi.org/10.3390/agronomy15092216
Submission received: 20 August 2025 / Revised: 17 September 2025 / Accepted: 18 September 2025 / Published: 19 September 2025
(This article belongs to the Section Soil and Plant Nutrition)

Abstract

Using a maize planting system with full film mulching on double ridges and furrow sowing in the arid and semi-arid regions of the Loess Plateau, this study aims to explore the optimal proportion of organic fertilizer to replace basal chemical fertilizers; clarify its regulatory mechanism on nitrogen metabolism in maize roots and yield, so as to simultaneously achieve the reduction in chemical fertilizers and stable yield increase; and provide technical support for the global green production of dryland agriculture. Using fully mulched ridge–furrow cropping maize as the research object, four treatments were established with an equal nitrogen application rate (200 kg/hm2): 100% chemical fertilizer (T1), 50% chemical fertilizer + 50% organic fertilizer (T2), 62.5% chemical fertilizer + 37.5% organic fertilizer (T3), and no fertilization (T4). The nitrogen content in roots, metabolic enzyme activities in different soil layers during the filling stage, as well as indicators such as yield and nitrogen use efficiency were measured. The T3 treatment showed the highest root nitrogen content, accumulation, and metabolic enzyme activity in the 0–20 cm soil layer. The nitrogen assimilation amount after flowering was 10.7% higher than that of T1. The grain yield and grain weight per ear were the highest in two years, reaching 6388.9 kg/hm2 in 2022, which was 11.8% higher than that of T1. The agronomic utilization efficiency increased by 22.8%, while the partial productivity of nitrogen fertilizer increased by 11.5%. The T2 treatment led to yield loss due to the excessive application of organic fertilizer. Overall, substituting 37.5% of the basal chemical fertilizer with organic fertilizer enhanced root activity and nitrogen metabolism enzyme activities, thereby improving nitrogen uptake and translocation efficiency, which ultimately increased kernel number per ear and kernel weight per ear, leading to higher grain yield. Therefore, this approach can be recommended for the green production of maize in the arid and semi-arid regions of the Loess Plateau.

1. Introduction

Currently, the global population has exceeded 8 billion and is expected to reach 10 billion by the middle of the century [1]. Rising temperatures and frequent droughts pose severe challenges to agriculture [2]. Dryland farming plays a vital role in ensuring food security. Globally, drylands cover 41% of arable land and support 38% of the population [3]. In China, dryland farmland reaches 64.33 million hectares, about 50.33% of the total arable land [4]. Thus, developing dryland farming is crucial to balance food supply and demand. The Loess Plateau, situated in arid and semi-arid regions, receives abundant sunlight and heat but experiences uneven rainfall and high evaporation. Limited water availability is the primary constraint on agriculture, making rainfed dryland farming the dominant production system [5]. The soil here is loessial, with organic matter below 12 g/kg and total nitrogen less than 0.8 g/kg, which further limits crop productivity [6].
To address both drought and poor soil, the full plastic film mulching with double ridges and furrow planting has been widely applied in central Gansu since the early 21st century [7]. This technology changes flat planting to ridge furrow planting, fully covering the surface with plastic film. It achieves rainwater harvesting, soil moisture conservation, and temperature increase [8]. Mulching reduces evaporation, improves water storage, and raises soil temperature, ensuring maize growth [9]. Compared with traditional planting, this method increases maize yield by more than 55% in central Gansu, making it a key yield enhancing technology [10]. Consequently, maize has become a major crop in the region, and its yield stability is directly linked to food security and agricultural development. However, long term application has exposed problems in fertilizer management, especially the overuse of chemical fertilizers. Chemical fertilizers, with high nutrient content and fast release, are essential for modern agriculture [11,12]. They quickly meet maize’s nitrogen demand; however, excessive use causes nutrient loss, ecological damage, and low efficiency. These problems threaten sustainable agriculture on the Loess Plateau. In contrast, organic fertilizers improve soil structure and coordinate nutrient supply, offering long term benefits [13]. Rational fertilizer management is therefore key to achieving high yield, ecofriendly farming.
Balancing the pros and cons of fertilizers, partial substitution of chemicals with organic fertilizers has become the best option to ensure yield, efficiency, and sustainability. Global studies show that partial substitution improves soil fertility, crop yield, and fertilizer use efficiency [14,15]. In China, substituting 20–50% of nitrogen with organic fertilizer maintains or increases maize and wheat yields while boosting soil organic matter, total N, available P and K, enzyme activity, and microbial diversity [16,17,18]. On the Loess Plateau, this practice enhances drought resistance, yield stability, water and fertilizer efficiency, and reduces N2O emissions [19,20]. Yet, suitable substitution ratios differ by crop and region and must match crop demand with soil nutrient supply. This study previously revealed that substituting 37.5–50% of chemical fertilizer with organic fertilizer optimizes nutrient supply, maintains photosynthesis, and enhances leaf enzyme activity, thus ensuring yield [21,22]. However, current research mainly focuses on aboveground nitrogen use. Roots, as the primary organ for nitrogen uptake, directly influence efficiency and yield through their morphology and physiology [23]. Studies indicate that partial substitution increases root biomass and density, improving nitrogen use efficiency [24]. But in the full film ridge furrow system, the effects of substitution ratios on root nitrogen distribution, vitality, and enzyme activity across soil layers remain unclear. The synergistic role of roots and shoots in yield formation requires deeper study. On the Loess Plateau, where maize roots adapt spatially to drought, their interaction with organic fertilizer substitution is particularly complex and needs systematic investigation.
Root vitality, root nitrogen content, and nitrogen metabolism enzymes are key factors for nitrogen uptake and assimilation in maize [25,26]. Improving these traits supports nutrient acquisition and promotes the efficient conversion of inorganic nitrogen into amino acids for grain development [27]. Therefore, substituting organic fertilizer for basal chemical fertilizer can optimize root nitrogen uptake and metabolism, thereby enhancing yield and nitrogen use efficiency under dryland conditions. In summary, maize production under full film mulching with double ridges and furrow planting in central Gansu faces the dual challenges of reducing chemical fertilizer use and maintaining stable yields. Replacing chemical fertilizers with organic fertilizers is a key strategy to address this issue. However, the suitable substitution ratio and its regulatory effects on root nitrogen metabolism remain unclear, limiting precise application. Based on this, we established treatments with different organic fertilizer substitution ratios under equal nitrogen input (200 kg/hm2). We systematically examined their effects on root nitrogen content, enzyme activities, nitrogen transport efficiency, and yield during the grain filling stage. The aims were: (1) to clarify the regulatory effects of optimal substitution ratios on root nitrogen metabolism in dryland maize; and (2) to reveal the relationship between root nitrogen metabolism, yield, and nitrogen use efficiency. This study provides theoretical and technical support for optimizing nitrogen management and achieving green, sustainable maize production, with important implications for the high-quality development of dryland farming on the Loess Plateau.

2. Materials and Methods

2.1. Experimental Site

This experiment was based on a long-term field trial established in 2016 at the Dryland Farming Research Station of Gansu Agricultural University in Dingxi, Gansu Province (104°36′ E, 35°35′ N), and was conducted during 2021–2022. This area is located in the south–central part of Gansu Province and belongs to the mid temperate semi-arid zone. The average altitude is 2000 m, the average annual solar radiation is 592.85 kJ/cm2, the sunshine duration is 2476.6 h, the average annual temperature is 6.4 °C, the accumulated temperature ≥ 0 °C is 2933.5 °C, the accumulated temperature ≥ 10 °C is 2239.1 °C, and the frost-free period is 140 d. The multi-year average precipitation is 390.9 mm, the annual evaporation is 1531 mm, and the aridity is 2.53, making it a typical semi-arid rain—fed agricultural area. The soil of the experimental field is loessial soil, with deep soil layer and uniform texture. The average soil bulk density of the 0–20 cm soil layer is 1.17 g/cm3, the wilting moisture content is 7.3%, the saturated moisture content is 28.6%, the pH value is 8.36, the soil organic matter in the plow layer is 11.92 g/kg, the total nitrogen is 0.78 g/kg, and the total phosphorus is 1.81 g/kg [20]. The precipitation in 2021 was 296.9 mm, and the precipitation during the growth period was 213.3 mm; the precipitation in 2022 was 246.8 mm throughout the year, and the precipitation during the growth period was 221.9 mm (Figure 1). Both years were dry years. In 2021, maize was planted on 23 April and harvested on 26 September; in 2022, the experiment started on 25 April and the maize was harvested on 10 October. Since 2016, the fertilization measures for each treatment have remained the same. Yield data were collected over two consecutive years (2021–2022), while root morphological, physiological, and nitrogen metabolism parameters were investigated in 2022 due to the intensive sampling requirements.

2.2. Experimental Design and Field Management

The experiment adopted a single factor randomized block design, with three treatments of different ratios of organic fertilizer substituting for basal chemical fertilizer, and the treatment without nitrogen application as the control (Table 1). There were a total of four treatments, each with three replicates, resulting in 12 plots in total. The plot area was 37.4 m2 (8.5 m × 4.5 m). The maize variety used in the experiment was ‘Xianyu 335’, and the maize planting density was 52,500 plants/hm2. The organic fertilizer used in the experiment was jointly developed by the project team and Gansu Daxing Agricultural Technology Co., Ltd., Lanzhou, China. This commercial organic fertilizer was specifically developed for maize cultivation. It is primarily derived from cow manure, fully decomposed through fermentation, and refined with the addition of essential microelements, humic acid, and other beneficial components. It contained more than 3.3% N, 1.0% P, and 0.7% K, with organic matter content exceeding 60%. The nutrients in the organic fertilizer are released gradually through mineralization, providing a slow but sustained supply of available nitrogen, phosphorus, and potassium during crop growth. For equal nutrient application, the fertilization rates were 200 kg hm−2 of pure N for nitrogen and 150 kg hm−2 of pure P2O5 for phosphorus.

2.3. Measurement Index and Methods

2.3.1. Root Dry Weight

Root dry weight samples were collected using the excavation method, encompassing entire root systems [28]. At the jointing, large bell, flowering, and filling stages (20 days post flowering), well developed maize plants were selected from each plot. The excavation area was a cuboid measuring 60 cm × 60 cm × 80 cm, centered on the plant, with three replicates per plot. Roots were separated from the soil using a 0.2 mm mesh sieve combined with a gentle elutriation under low flow circulating water. The wash effluent was subsequently passed through a 150 μm nylon mesh to ensure complete recovery of fine root fragments. Root samples were subjected to a stepwise drying protocol. First, samples were dehydrated at 105 °C for 30 min to rapidly inactivate enzymatic activity and terminate metabolic processes. They were then transferred to 85 °C for 2–3 h to accelerate water removal and subsequently maintained at 70 °C for 48 h until reaching a constant weight (defined as a mass difference < 0.001 g between successive weighings). The final root dry weight was then recorded.

2.3.2. Nitrogen Content in Roots

The root samples that were completely excavated at the filling stage (20 days after flowering) and dried to constant weight, were crushed and passed through a 0.2 mm sample sieve for the subsequent determination of nitrogen content. The Kjeldahl method was employed to measure the total nitrogen content in the roots [29]. The nitrogen accumulation is calculated by the following formula:
Nitrogen accumulation (g/plant) = Dry matter weight × Nitrogen concentration/100

2.3.3. Roots Activity and Nitrogen Metabolism Enzyme Activities in Roots

Roots Sampling Method
The root biochemical indicators were assessed using the root auger sampling method [30]. At the corn filling stage (20 days after flowering), uniformly growing plots were selected for sampling. Root samples were collected from five positions within each treatment plot, including on the plant, between plants, and between rows. The root auger was drilled vertically to a depth of 80 cm, and samples were taken at 20 cm intervals. The roots from each soil layer were retrieved by washing and manual picking, with three replicates per plot. The root samples were promptly wrapped in tin foil, flash frozen in liquid nitrogen, and stored in an ultra-low temperature freezer at −80 °C for subsequent analysis of nitrogen metabolic enzyme activity and root vigor.
Roots Activity
Root activity was assessed using the Triphenyl Tetrazolium Chloride (TTC) method [31]. A 0.4 g root tip sample was immersed in 10 mL of a 4% TTC solution with phosphate buffer and incubated in the dark for 4 h at 37 °C. The reaction was halted by adding 1 mol/L sulfuric acid. Decolorization was achieved using methanol, and absorbance was measured at 485 nm. The absorbance was then compared to a standard curve to determine the tetrazole reduction amount. Subsequently, the TTC reduction (calculated by fresh weight) and root activity were determined. Tetrazolium reduction intensity (mg/(g·h)) = amount of tetrazolium reduction/root weight × time. The blank experiment was used as the reference zero, and the absorbance values of the experimental results were brought into the corresponding standard curves:
The reduction amount of tetrazole = 0.0031x + 0.0049, R2 = 0.9994
Nitrogen Metabolic Enzyme Activities in Roots
Root nitrate reductase enzymes were determined according to the method of Campbell et al. [32]; Root nitrite reductase enzymes were determined according to the method of Oaks et al. [33]; Root glutamine synthase and glutamate synthase enzymes were determined according to the method of Kamachi et al. [34] and Sodek et al. [35]. The blank experiment was used as the reference zero, and the absorbance values of the experimental results were brought into the corresponding standard curves:
Nitrate reductase (NR) activity = 61.179x − 2.6417, R2 = 0.9946
Nitrite reductase (NiR) activity = 192.2x − 12.34, R2 = 0.9973
Glutamine synthetase (GS) activity = 29.859x − 0.3773, R2 = 0.9952
Glutamate synthase (GOGAT) activity = 261.39x − 5.7096, R2 = 0.9974

2.3.4. Biomass, Yield, and Yield Components

After harvesting mature maize, 10 uniform ears were selected from each treatment to measure indicators such as grains per ear, grain weight per ear, and 100-grain weight. After the unified harvest of each treatment plot, yield was measured, and above-ground biomass was collected to determine total biomass, with biomass yield expressed on a fresh weight basis. Yield was calculated by measuring the grain yield of each plot post-harvest, adjusting it to a standard moisture content of 14%, and converting it to yield per hectare (kg/hm2).

2.3.5. Nitrogen Accumulation and Translocation Efficiency

Total nitrogen accumulation (g/plant) = Total nitrogen content × Dry matter weight.
Nitrogen translocation amount in roots before anthesis (NTA) = Nitrogen accumulation in roots at anthesis stage − Nitrogen accumulation in roots at maturity stage.
Nitrogen translocation efficiency in roots (NTE) (%) = NTA/Nitrogen accumulation in roots at anthesis stage
Nitrogen contribution rate of roots to grains (NCP) (%) = NTA/Nitrogen accumulation in grains at maturity stage × 100%
Amount of assimilated nitrogen after anthesis (AANAA) (kg/hm2) = Nitrogen accumulation in grains at maturity stage − NTA

2.3.6. Nitrogen Fertilizer Use Efficiency

Agronomic efficiency of nitrogen fertilizer (AE) (kg/kg) = (Grain yield in nitrogen − applied plot − Grain yield in non − nitrogen − applied plot)/Amount of nitrogen applied
Partial factor productivity of nitrogen fertilizer (PFP) (kg/kg) = Grain yield in nitrogen − applied plots/Nitrogen application rate
Nitrogen fertilizer contribution rate (FCR) (%) = (Grain yield in nitrogen − applied plot − Grain yield in nitrogen − unapplied plot)/Grain yield in nitrogen − applied plot

2.4. Data Organization and Processing

Data analysis was conducted using Excel 2016 (Microsoft, Redmond, WA, USA). Correlation analyses employed SPSS Statistics v22.0 (IBM, Armonk, NY, USA). Significance analysis was performed using Duncan’s multiple range test, and correlation analysis was conducted using Pearson’s method, both under a single factor randomized block design with a significance threshold of p < 0.05. Visualizations were generated using Origin 2024b (OriginLab, Northampton, MA, USA). Pearson correlation analysis was further executed in R 4.4.1 (R Foundation for Statistical Computing, Vienna, Austria), utilizing the “psych” and “corrplot” packages for computing pairwise correlation coefficients, and the “plspm” package for constructing the Partial Least Squares Structural Equation Modeling (PLS-SEM).

3. Results

3.1. Effects of Organic Fertilizer Substitution for Basal Chemical Fertilizer on Physiological Characteristics of Maize Roots

3.1.1. Effects of Organic Fertilizer Substitution for Basal Chemical Fertilizer on the Root Dry Weight of Maize

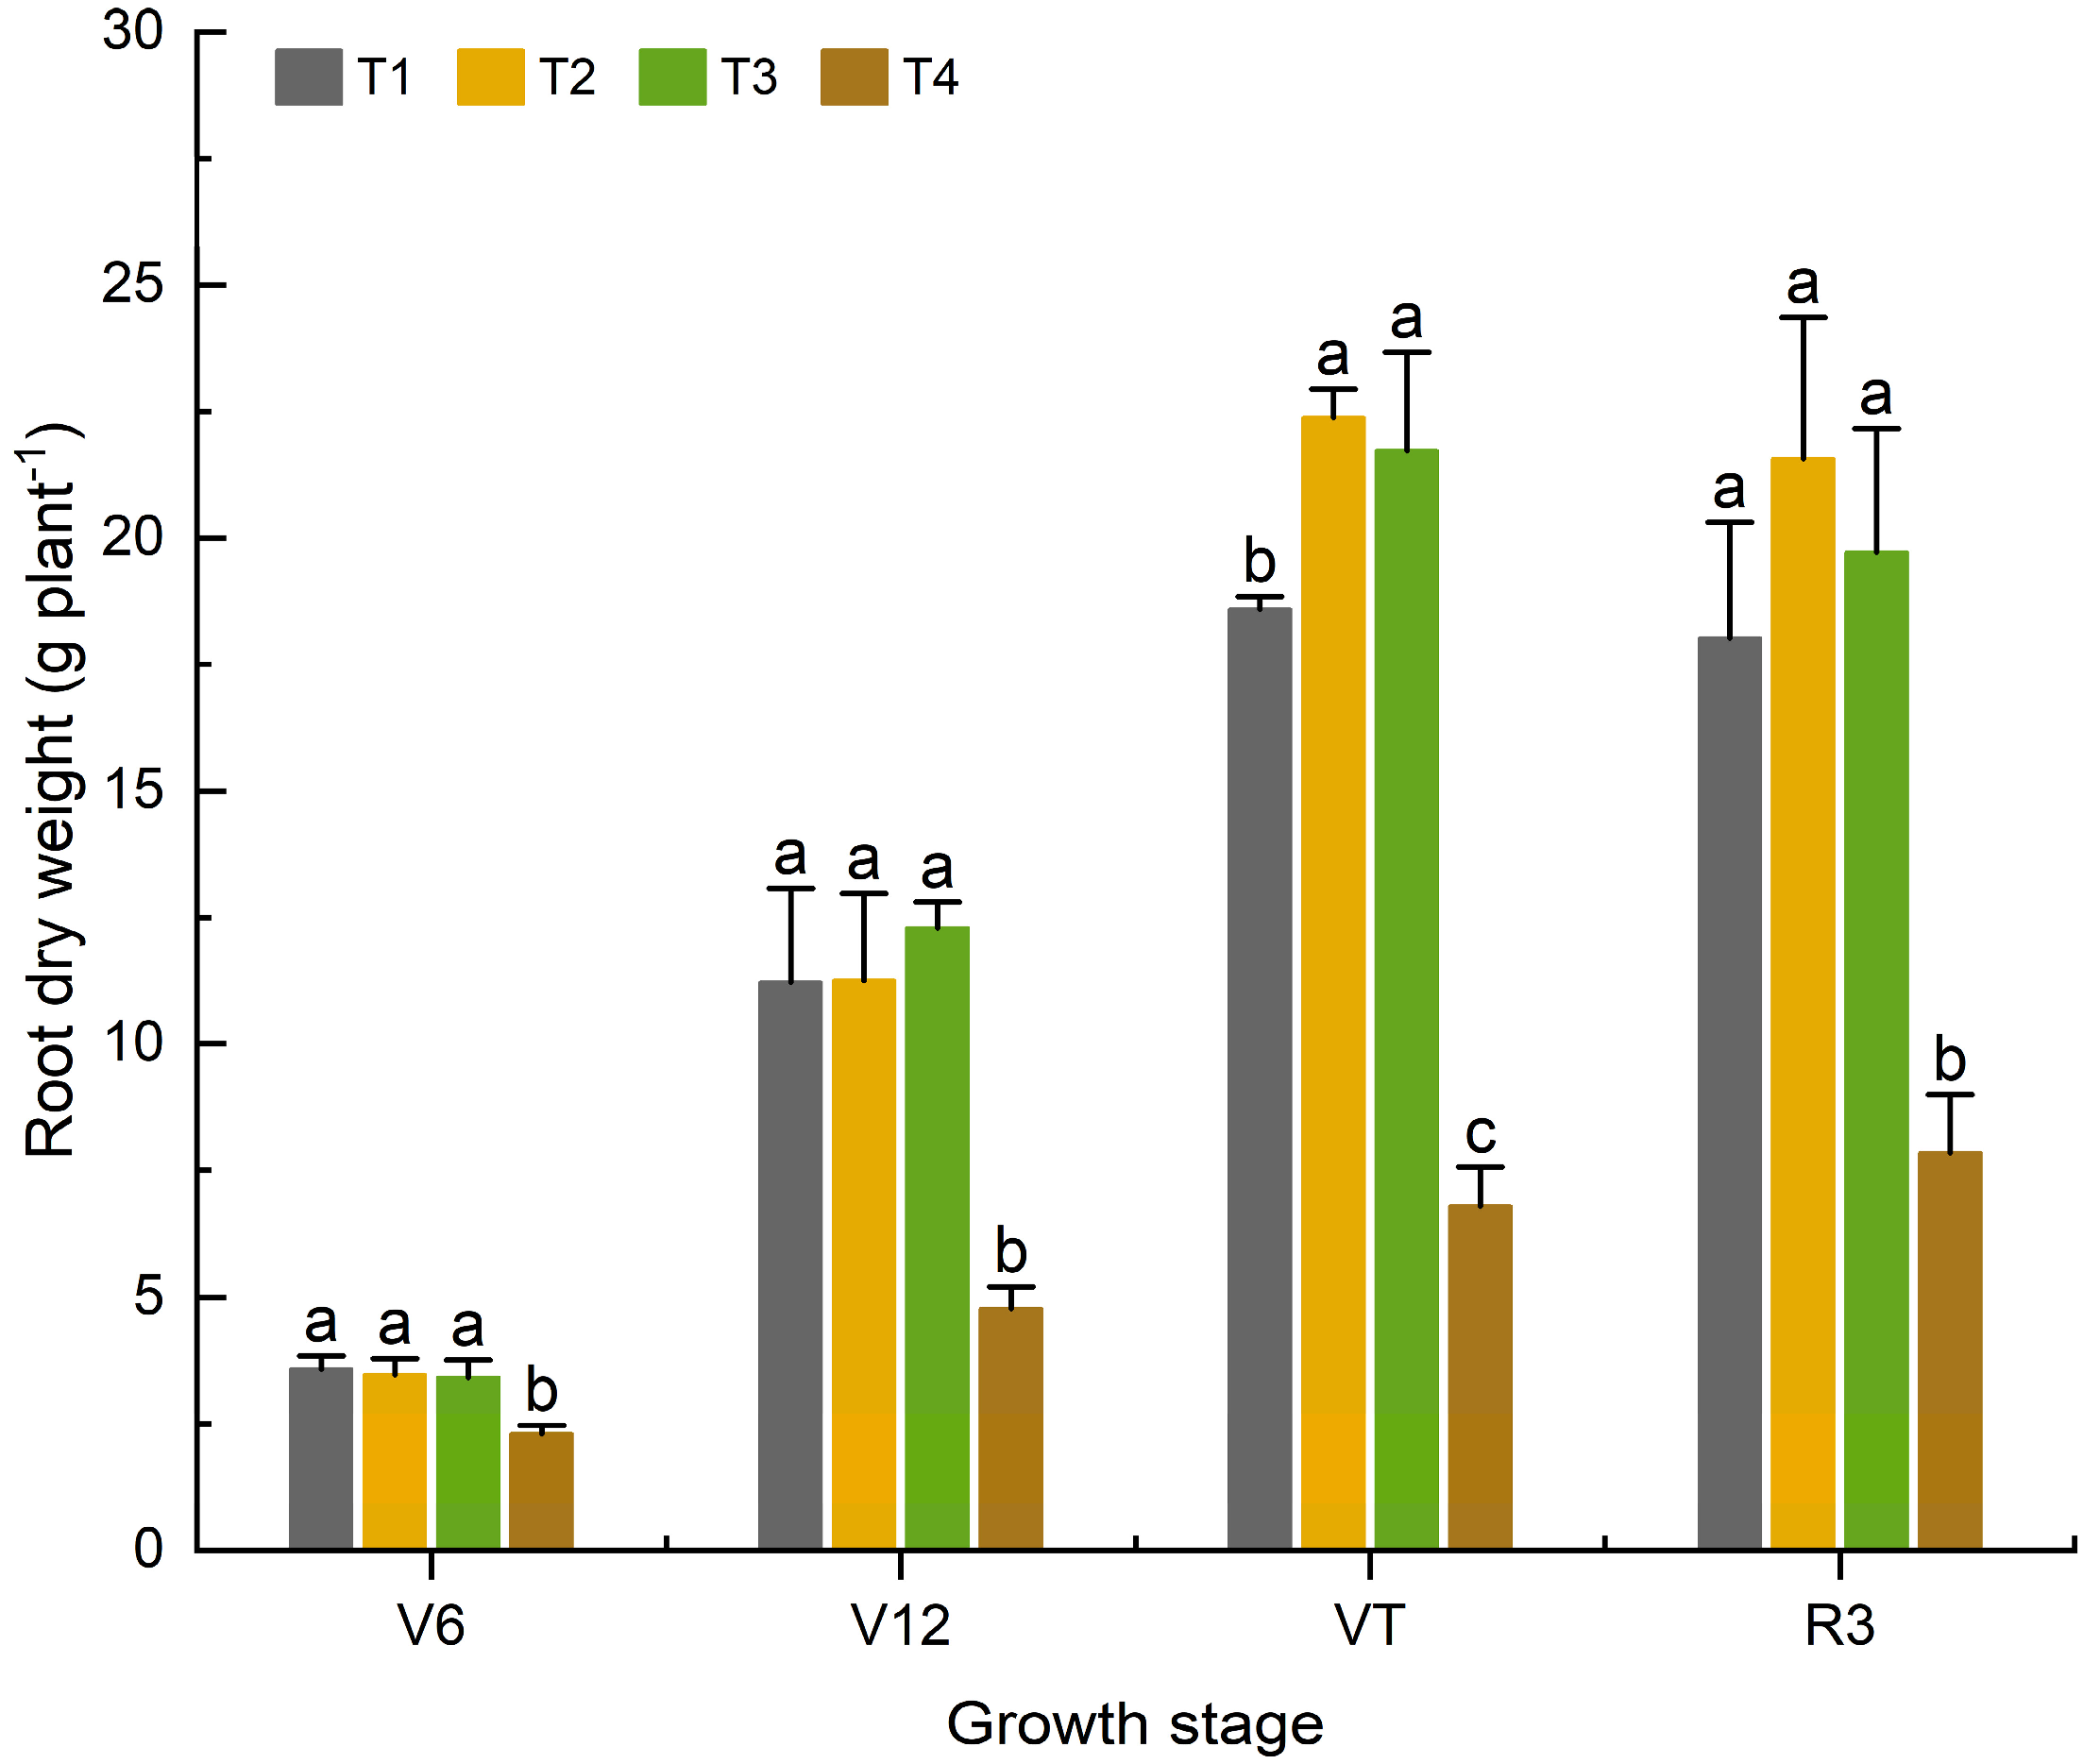
Root dry weight exhibited a unimodal pattern, increasing during the early growth stages and subsequently declining at later stages (Figure 2). The root dry weight under each treatment reached the maximum at the VT stage and then decreased slowly. At the V6 and V12 stages, there were significant differences between nitrogen applied treatments and non-nitrogen applied treatment, but there were no significant differences among nitrogen applied treatments. At the VT stage, the root dry weight was in the order of T2 > T3 > T1 > CK. Compared with the non-nitrogen treatment, root dry weight increased significantly under nitrogen application, by 173.5% in T1, 229.4% in T2, and 220.6% in T3. However, no significant difference was observed between the T2 and T3 treatments. At the R3 stage, compared with the non-nitrogen treatment, root dry weight increased significantly under nitrogen application, by 127.8% in T1, 173.4% in T2, and 149.4% in T3. This indicates that whether nitrogen is applied has a very significant impact on root dry weight. In the early growth stage, the effects of single application of chemical fertilizers and organic substitution at different ratios on root dry weight were not obvious. After the flowering stage, 50% and 37.5% organic substitution were beneficial to increasing root dry weight.

3.1.2. Effects of Organic Fertilizer Substitution for Basal Chemical Fertilizer on the Root Activity of Maize

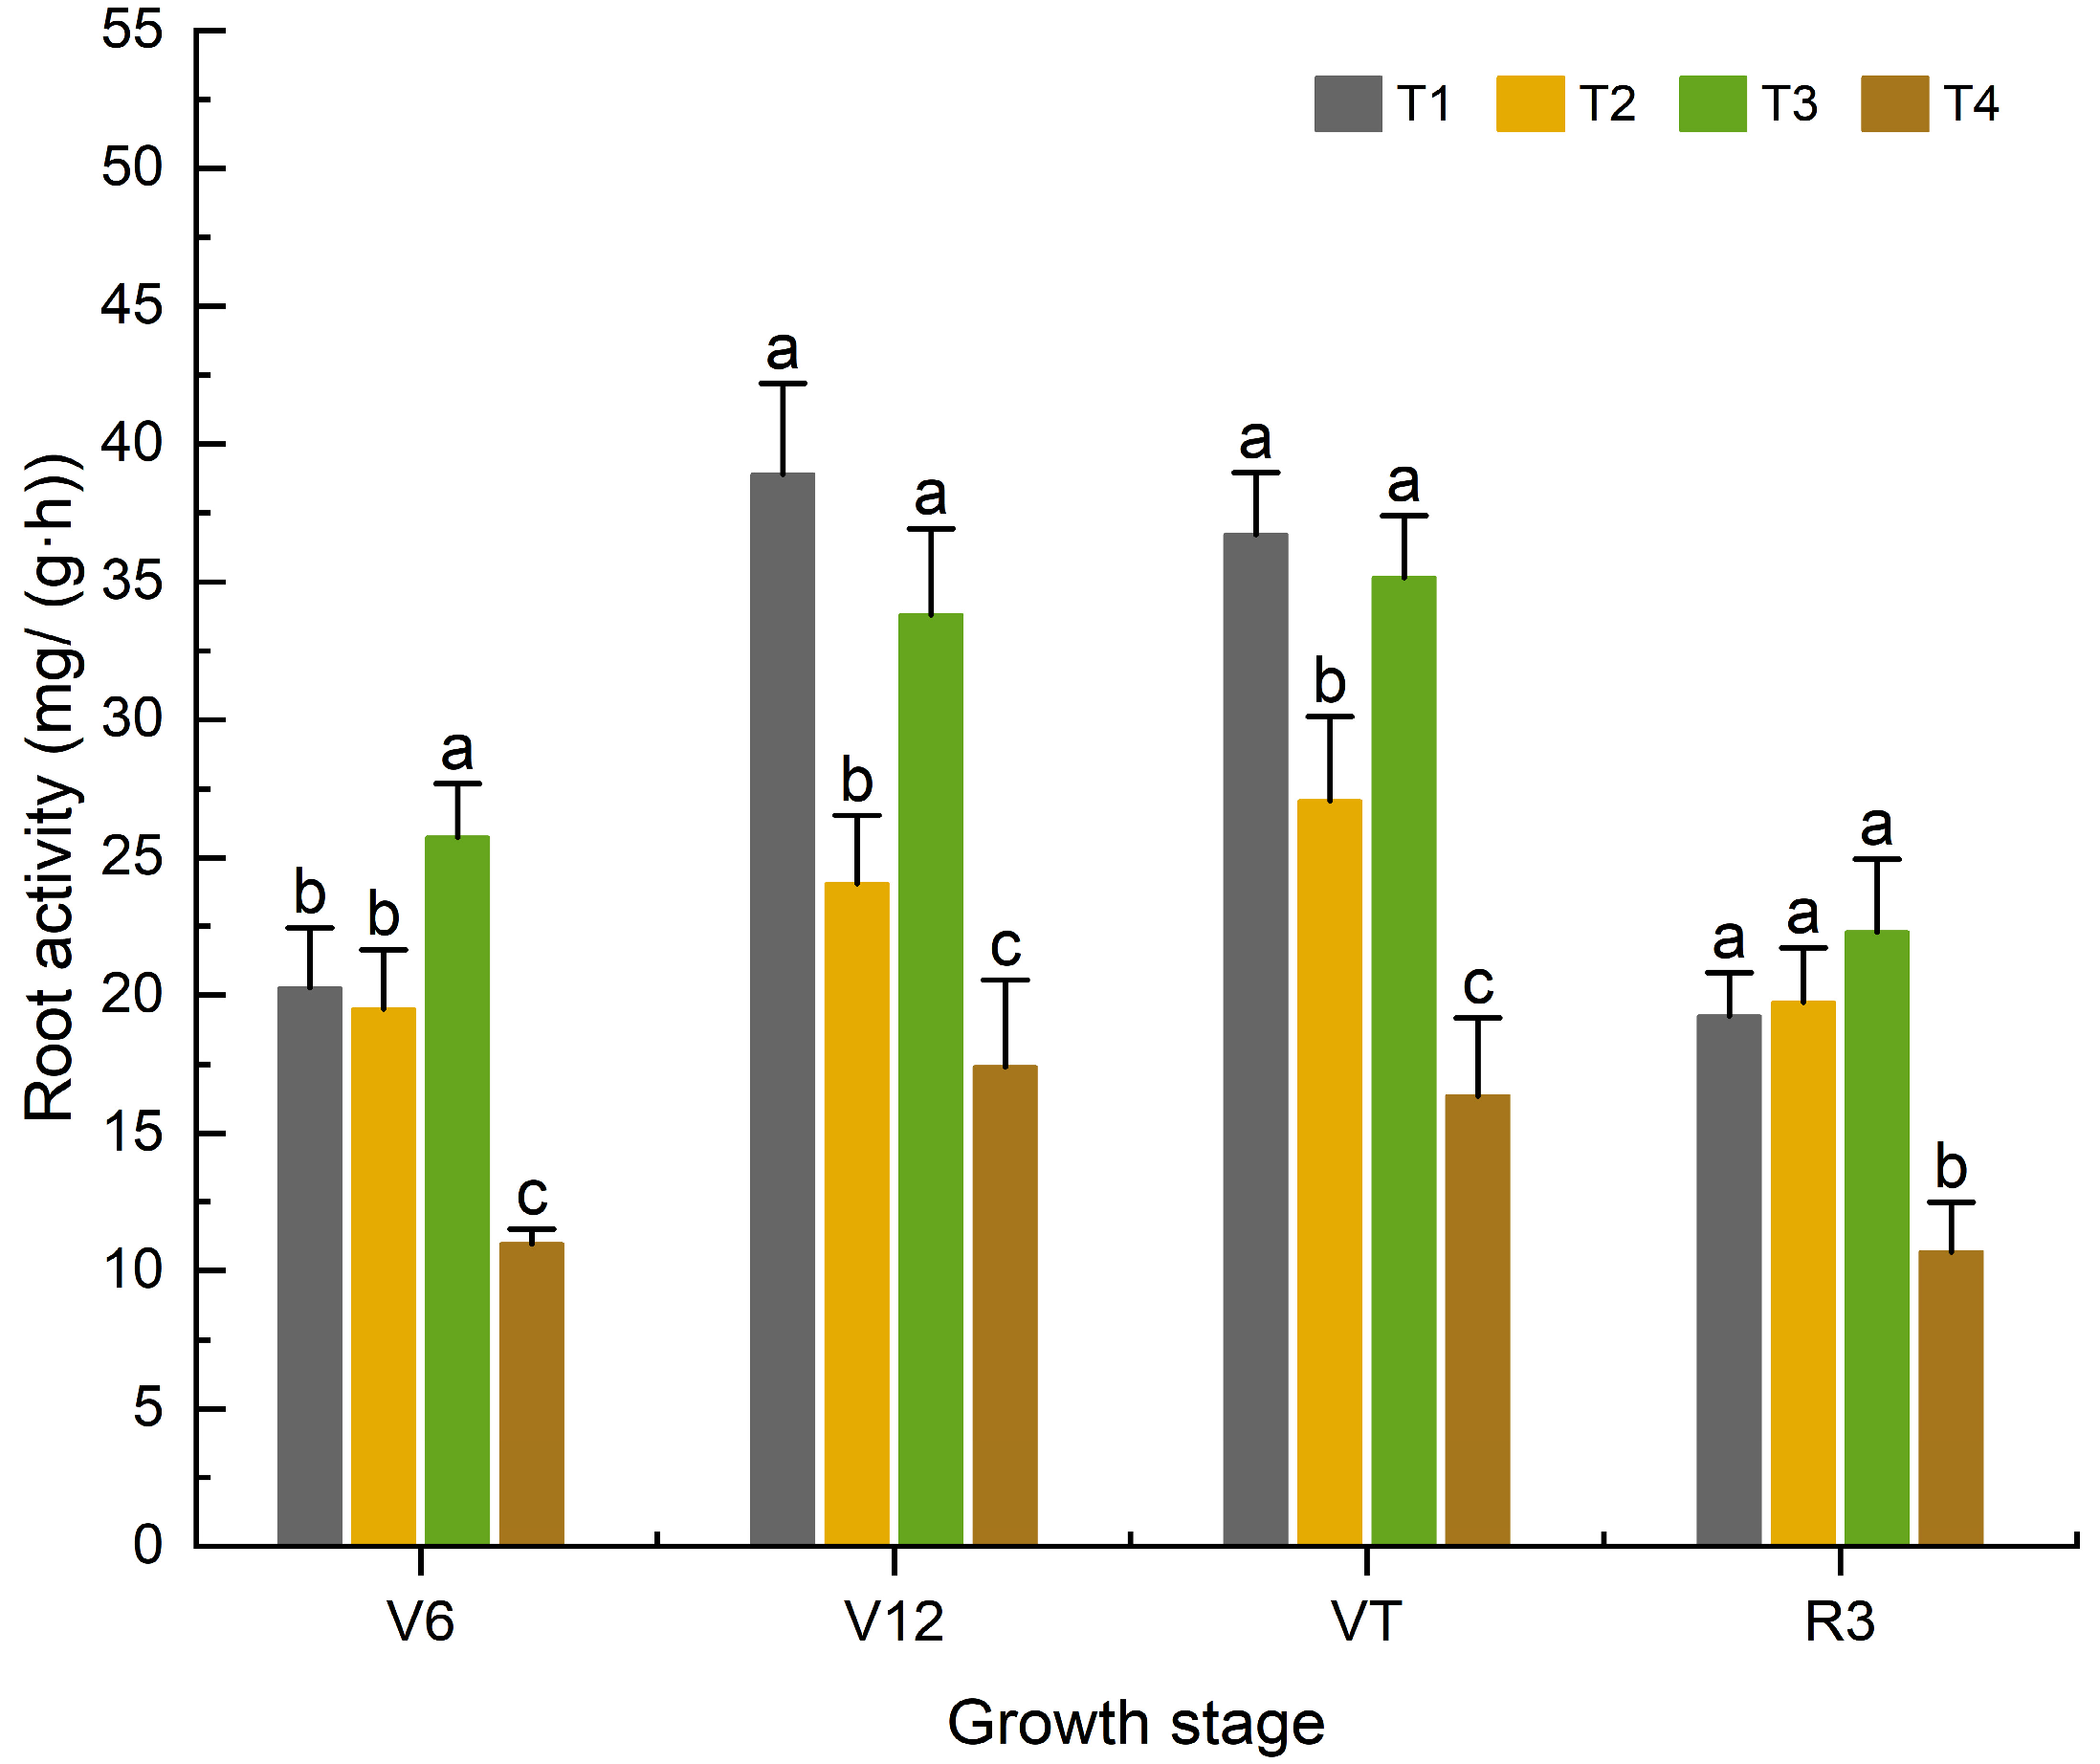
Root activity exhibited a unimodal dynamic, increasing during the early growth period and reaching a maximum between the V12 and VT stages, followed by a pronounced decline after VT (Figure 3). At the V6 growth stage, root activity in all nitrogen application treatments was significantly higher than that in the non-nitrogen treatment, while no significant differences were observed among the nitrogen treatments. At the V12 and VT stages, root activity followed a similar trend, with T1 showing the highest values, followed by T3. Compared with V12, root activity under organic fertilizer substitution treatments increased slightly at VT, whereas a decline was observed in T1. At the VT stage, root activity in T1, T2, and T3 increased significantly by 125.4%, 66.2%, and 115.6%, respectively, compared with the non-nitrogen treatment. At the R3 stage, no significant differences were found among nitrogen treatments; however, root activity under T1, T2, and T3 was still significantly higher than in the non-nitrogen control, by 79.8%, 85.5%, and 108.7%, respectively. These results indicate that root activity under T1 and the 37.5% substitution treatment were generally comparable at V12 and VT, whereas by R3, substitution ratios of 12.5%, 37.5%, and 50% effectively mitigated the decline in root activity.

3.1.3. Effects of Organic Fertilizer Substitution for Basal Chemical Fertilizer on Nitrogen Content and Accumulation in Maize Roots

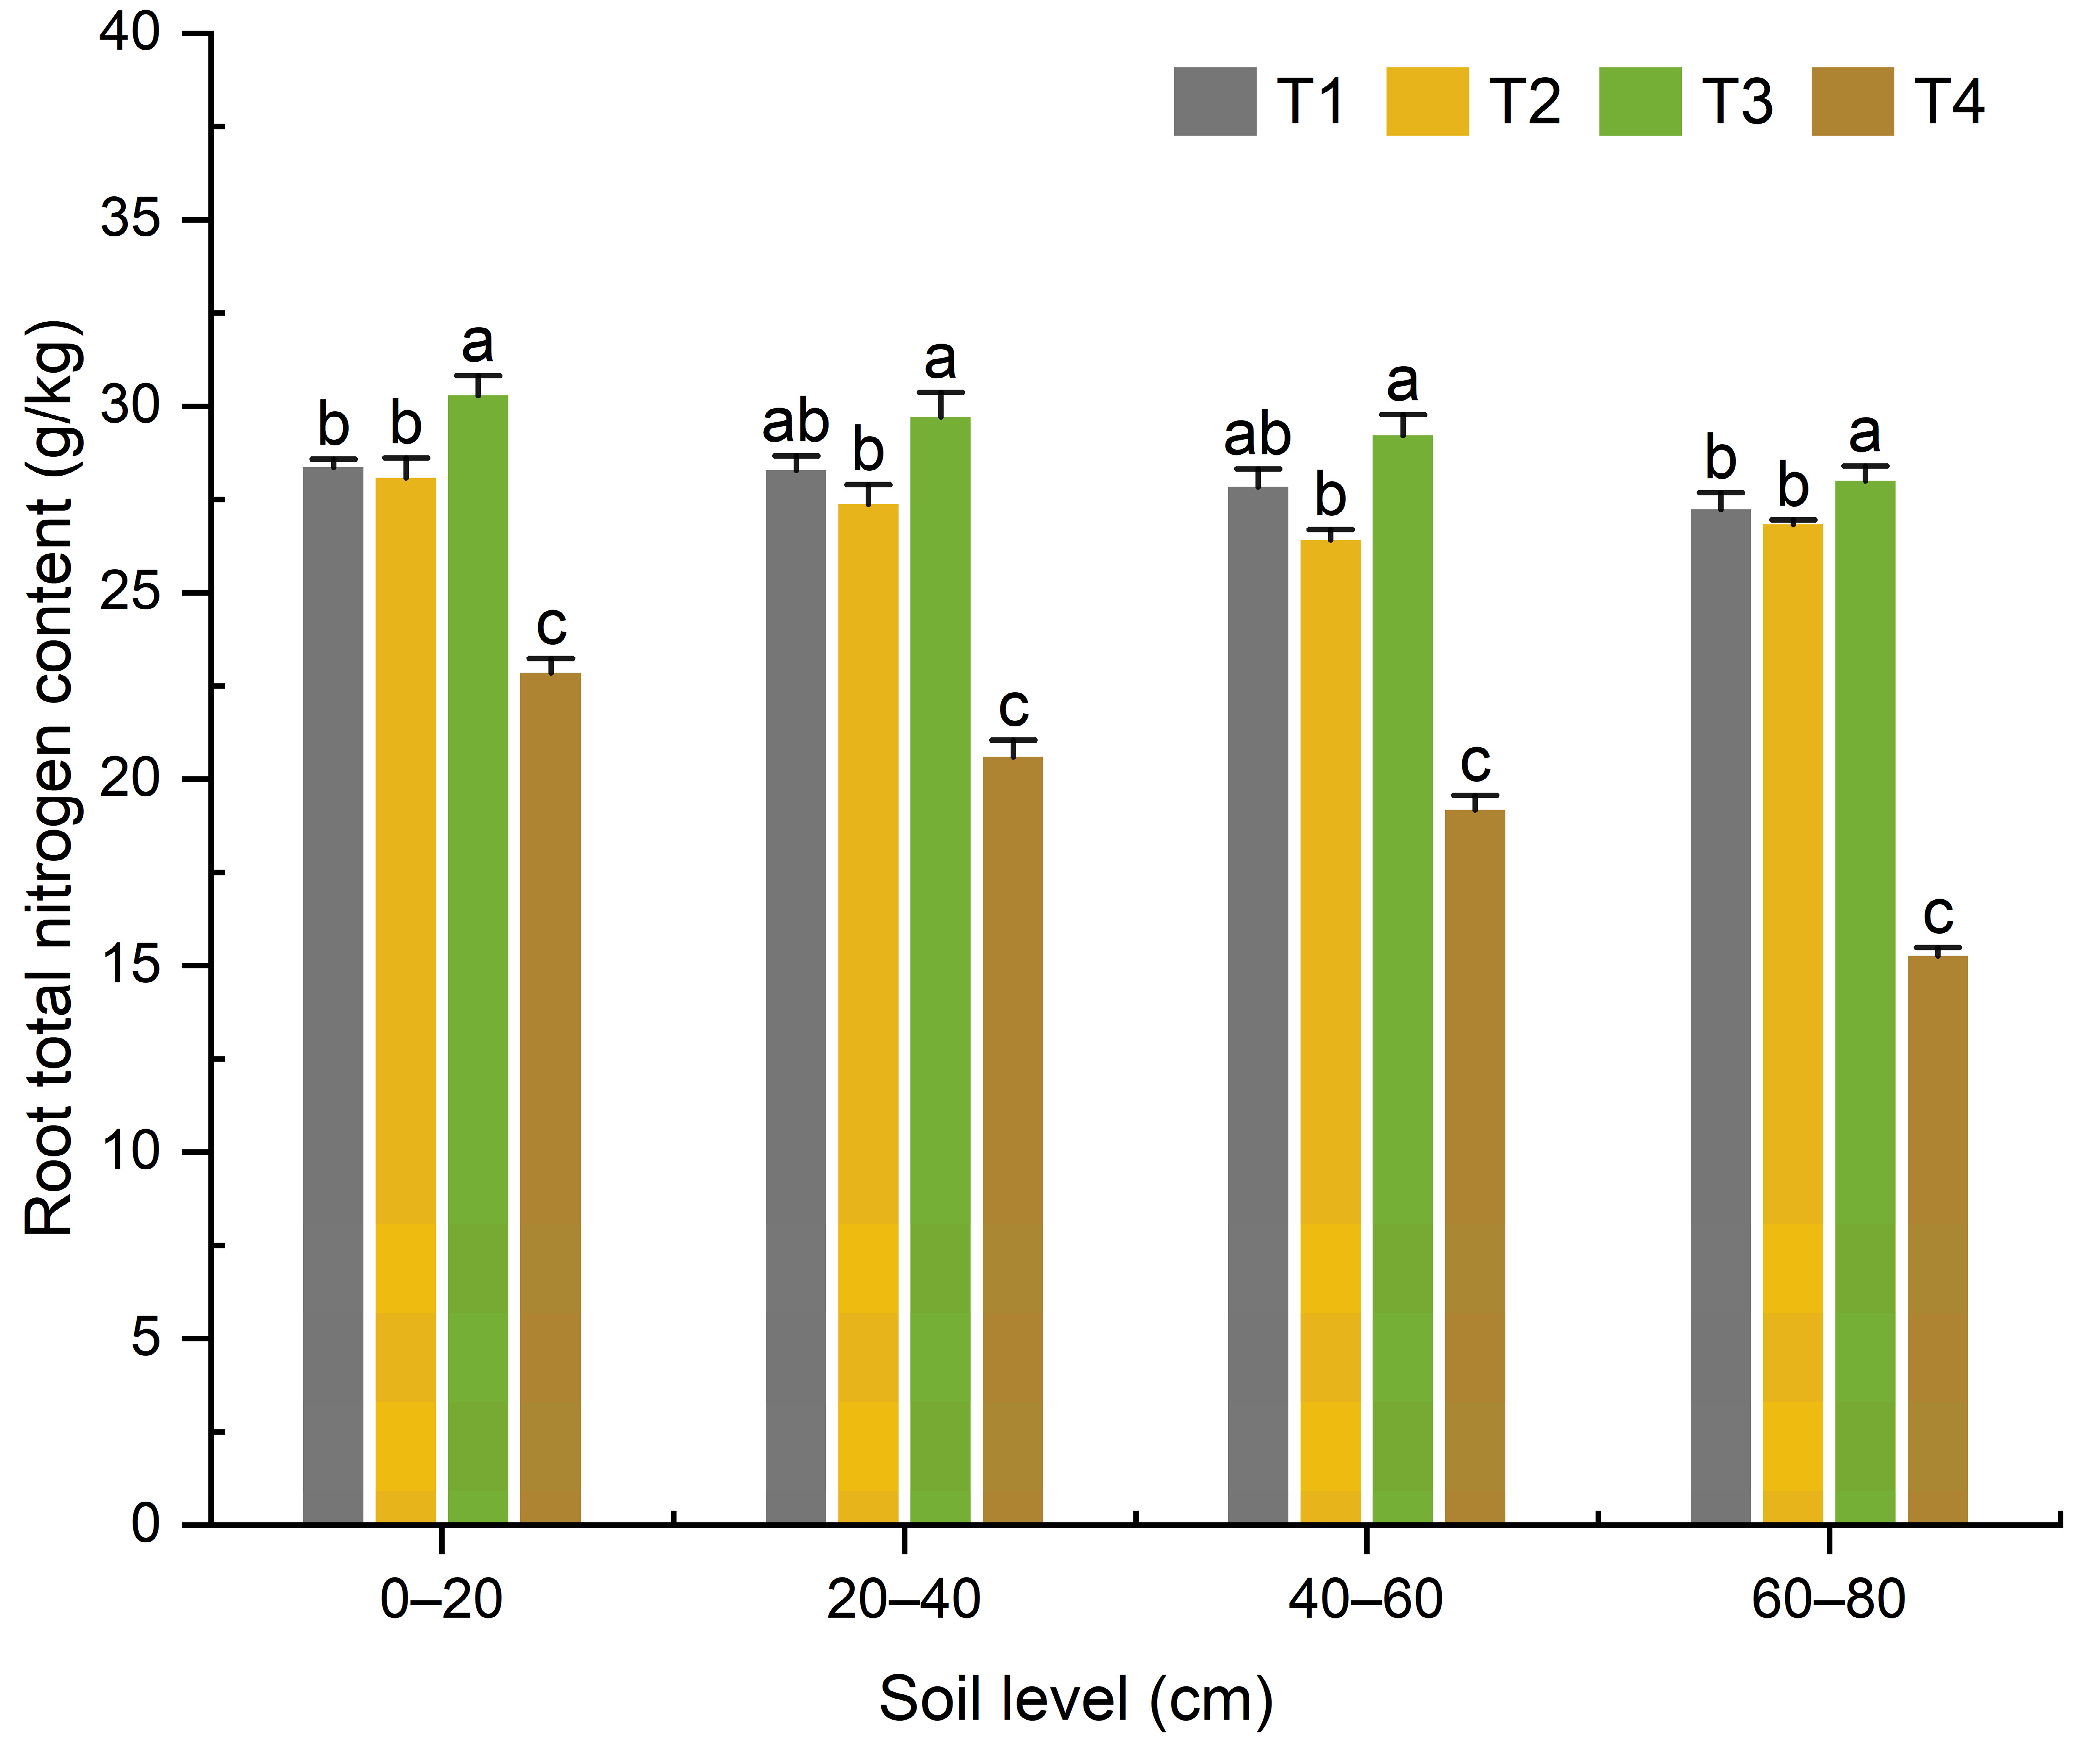
The root total nitrogen content remained stable across treatments within different soil layers and overall exhibited a relatively uniform distribution with soil depth (Figure 4). In the 0–20 cm soil layer, compared with the non-nitrogen treatment, root total nitrogen content increased significantly, by 24.1% in T1, 22.9% in T2, and 32.5% in T3. In the T3 treatment, root total nitrogen content was the highest, being 6.8% higher than T1 and 7.8% higher than T2, with both differences being significant, while no significant difference was observed between T1 and T2. In the 20–40 cm and 40–60 cm soil layers, root total nitrogen content under all nitrogen treatments was significantly higher than that under the non-nitrogen treatment. No significant difference was observed between T1 and T2 or between T1 and T3, whereas T2 and T3 differed significantly. Among the fertilization treatments, T3 consistently showed the highest root total nitrogen content, while T2 exhibited relatively lower values. In the 60–80 cm soil layer, compared with the non-nitrogen treatment, the total nitrogen content in the roots increased significantly by 78.4% in T1, 75.7% in T2, and 83.5% in T3. The nitrogen content in T3 was significantly higher than that in T1 and T2, whereas no significant difference was observed between T1 and T2. However, no significant differences were observed among the fertilization treatments themselves. The change trend of the total nitrogen content in the roots at different soil depths was not obvious. In the roots of each soil layer, the total nitrogen content was the highest in the T3 treatment, indicating that this substitution ratio was beneficial to the absorption of total nitrogen in the roots.
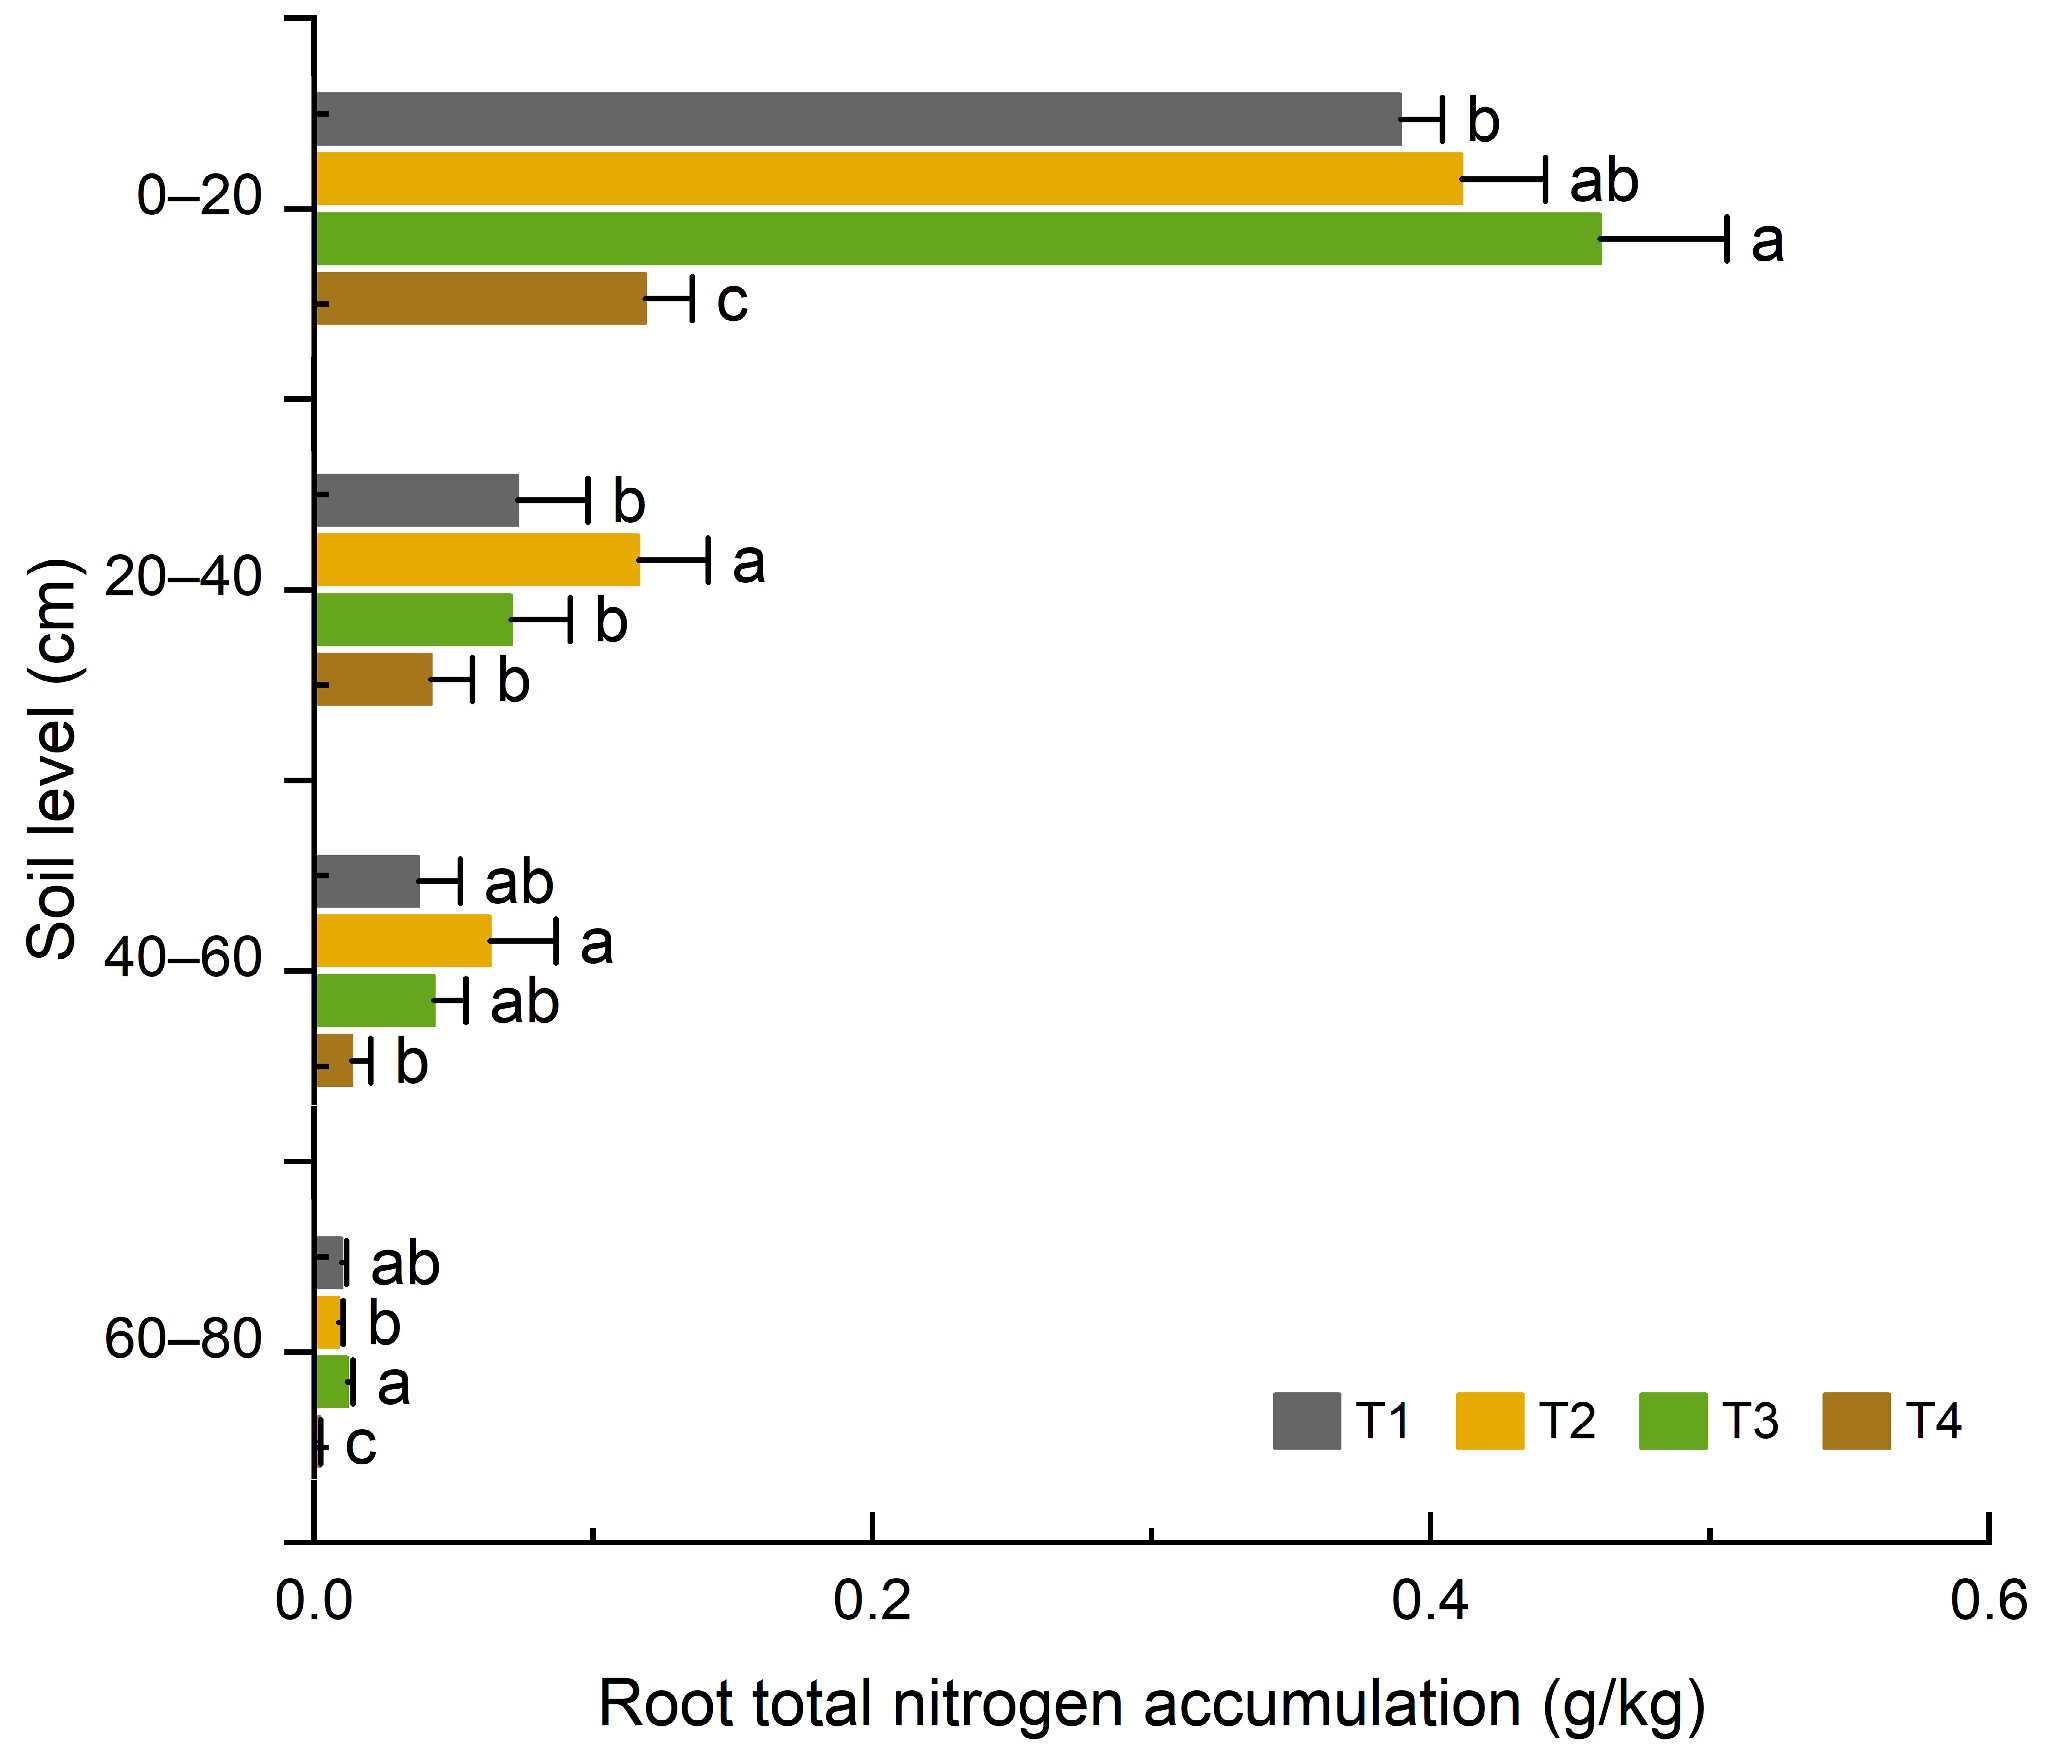
Maize root nitrogen accumulation exhibited a declining trend with soil depth, indicating reduced nitrogen storage in deeper soil layers (Figure 5). In the roots within the 0–20 cm soil layer, nitrogen accumulation under N application treatments increased significantly compared with the non-nitrogen control, by 228.2% in T1, 246.7% in T2, and 288.4% in T3, with T3 being the highest. In the 20–40 cm soil layer, nitrogen accumulation was highest in the T2 treatment, which was significantly greater than in T1, T3, and T4, while no significant differences were observed among T1, T3, and T4. In the 40–60 cm soil layer, nitrogen accumulation was also highest in T2, significantly higher than in T4, whereas no significant differences were detected among T1, T2, and T3. In the deep 60–80 cm soil layer, T3 showed the highest nitrogen accumulation, followed by T1 and T2, all of which were significantly higher than T4, with significant differences among the treatments. Overall, maize root nitrogen accumulation was concentrated in the 0–20 cm layer and decreased with increasing soil depth.

3.1.4. Effects of Organic Fertilizer Substitution for Basal Chemical Fertilizer on Nitrogen Metabolic Enzymes in Maize Roots

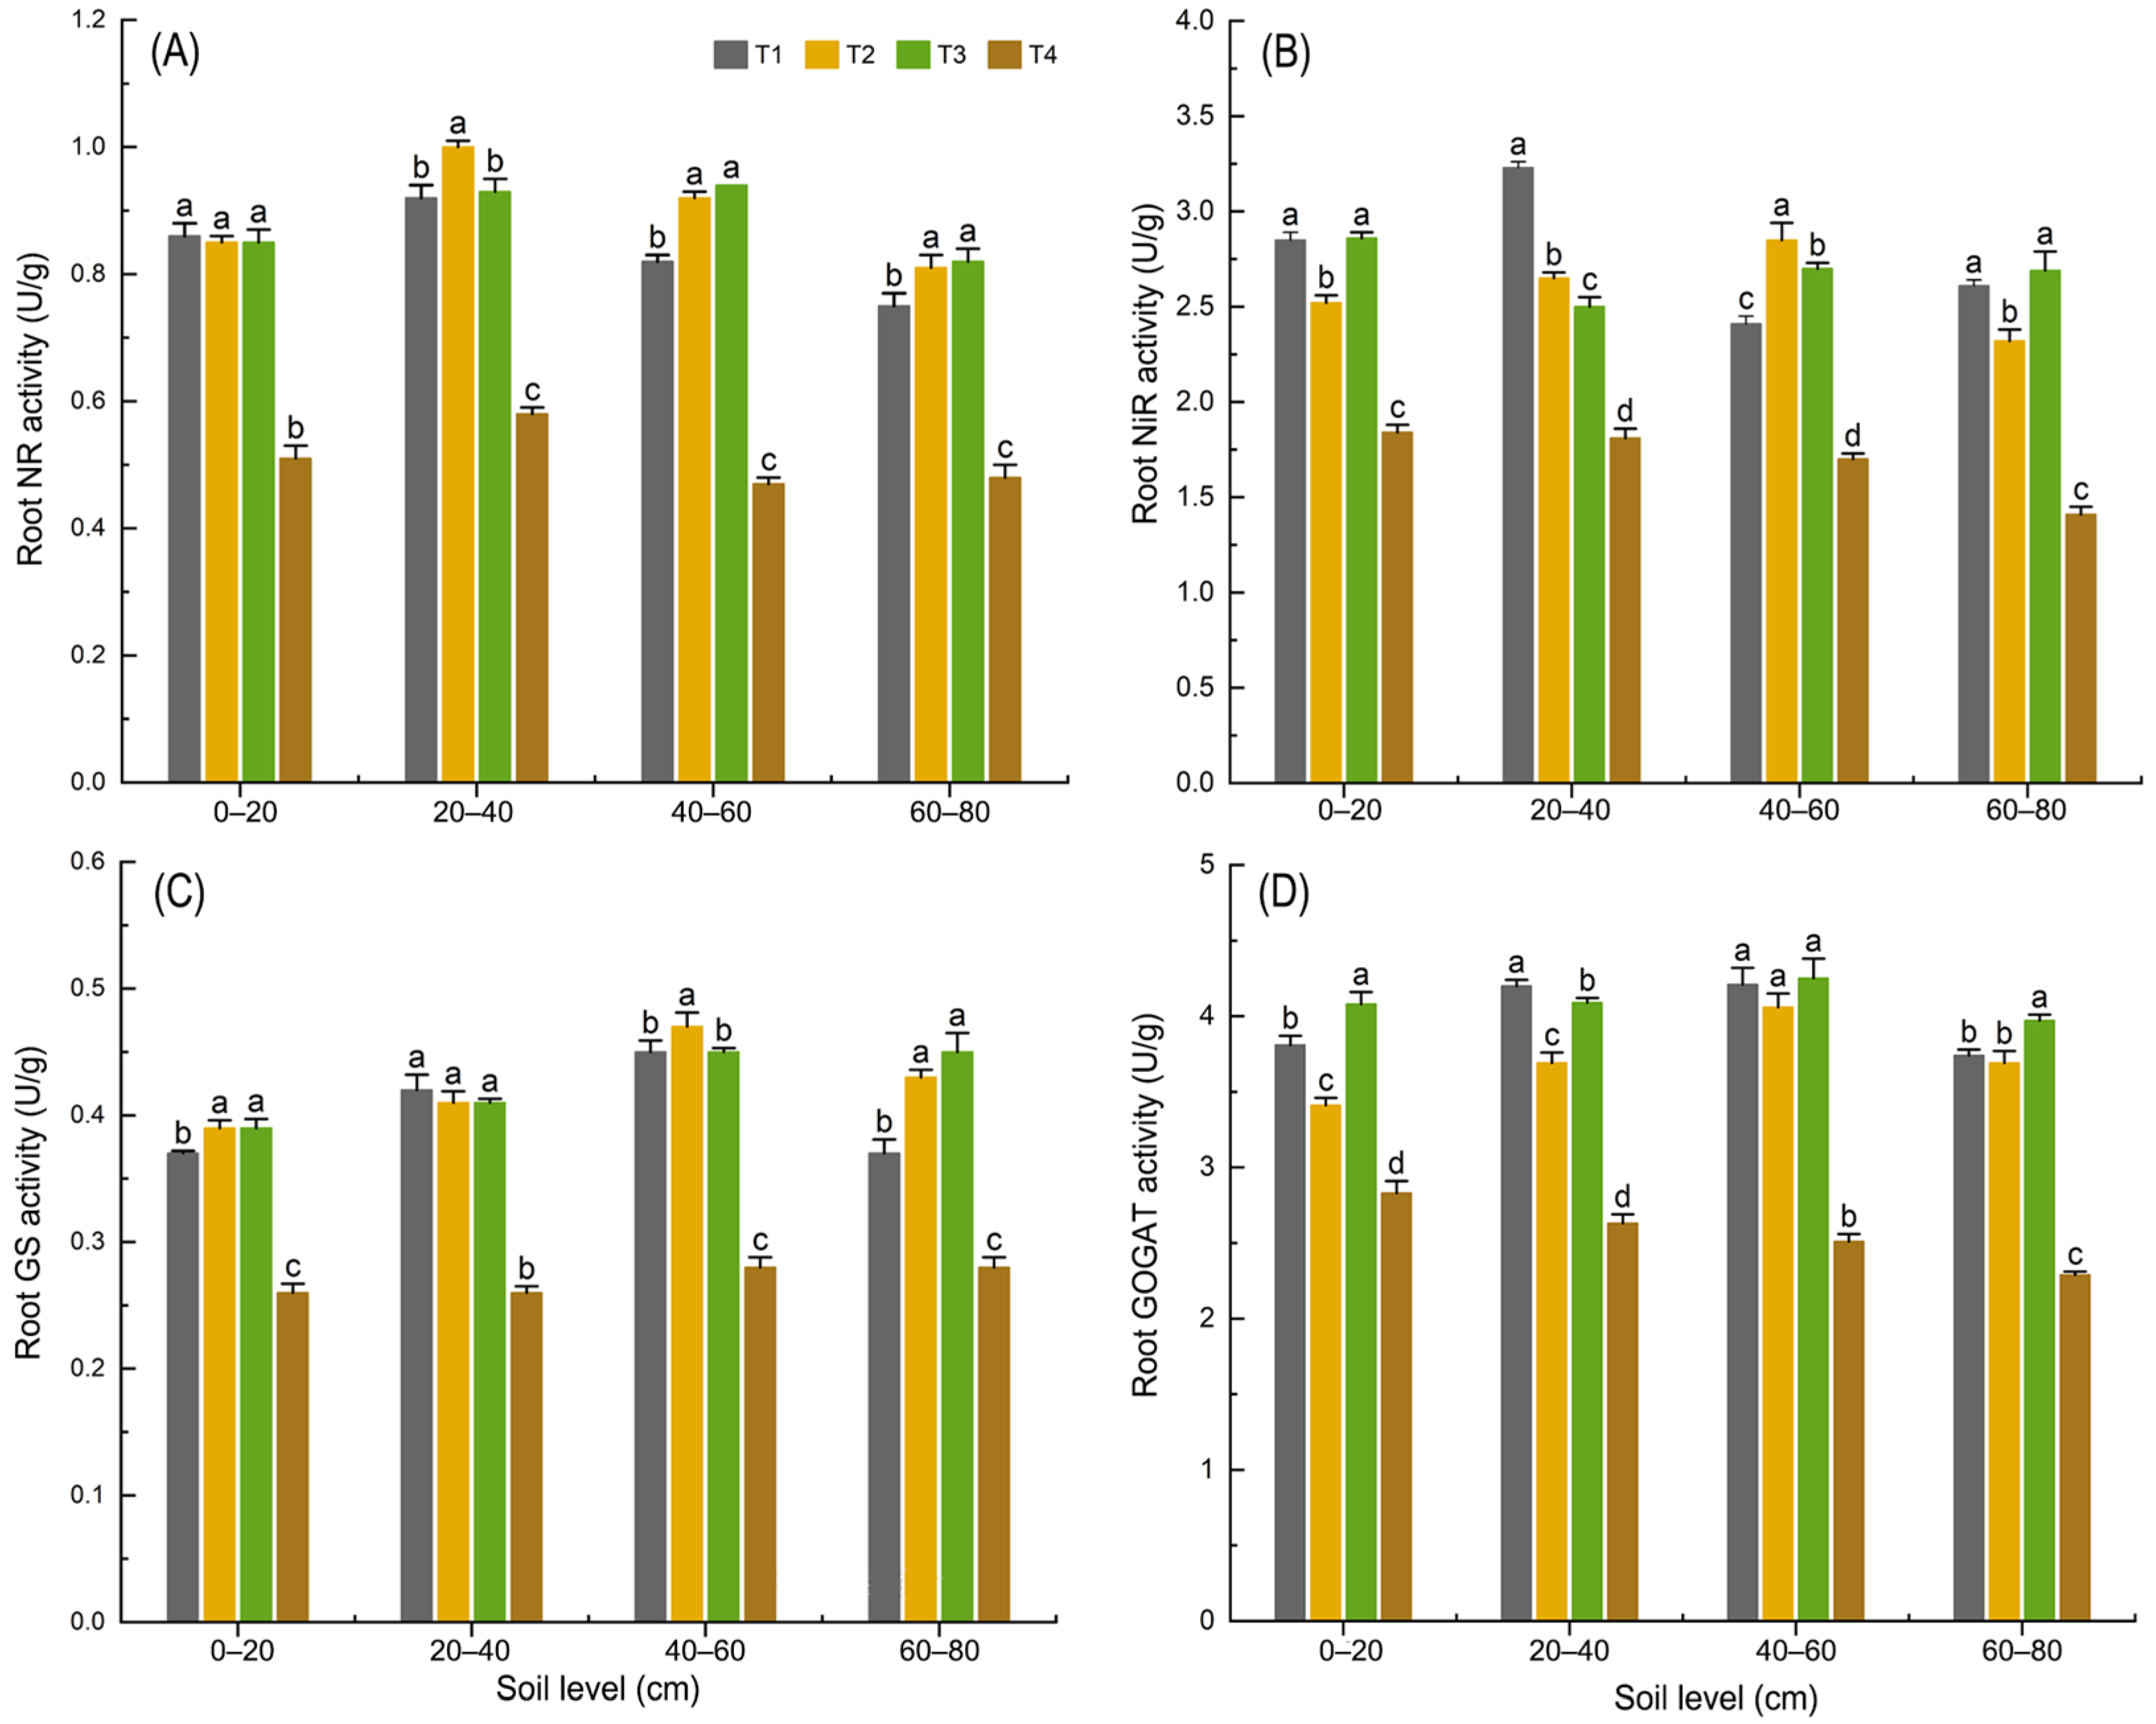
At the R3 stage, root NR activity exhibited a unimodal pattern with soil depth, increasing first and reaching a maximum in the 20–40 cm layer, followed by a decline in deeper layers (Figure 6A). In the 0–20 cm soil layer, NR activity in nitrogen applied treatments was significantly higher than in the non-nitrogen treatment, by 69.3% in T1, 66.0% in T2, and 67.3% in T3. In the 20–40 cm soil layer, NR activity was highest in T2, showing a significant 9.1% increase compared with T1. In the 40–60 cm soil layer, NR activity in T2 and T3 were significantly higher than in the other treatments, but no significant difference was observed between T2 and T3. In the 60–80 cm soil layer, the change trend of NR activity under each treatment was similar to that in the 40–60 cm soil layer, with better performance in T2 and T3 treatments.
In terms of root NiR activity, T2 showed a unimodal trend with soil depth, increasing first and then decreasing, with the peak observed at 40–60 cm. By contrast, T1 and T3 fluctuated across soil layers, with the peak in T1 appearing at 20–40 cm and in T3 at 0–20 cm (Figure 6B). In the 0–20 cm and 60–80 cm soil layers, NiR activity in T1 and T3 was significantly higher than in T2, while no significant difference was detected between T1 and T3. In the 20–40 cm soil layer, NiR activity in T1 was significantly higher than in the other treatments, and T2 was significantly higher than T3. In the 40–60 cm soil layer, NiR activity ranked as T2 > T3 > T1 > CK, with significant differences among all treatments.
Root GS activity exhibited a unimodal trend with soil depth, increasing initially and reaching a maximum in the 40–60 cm layer, followed by a gradual decline in deeper layers (Figure 6C). In the 0–20 cm soil layer, GS activity in T2 and T3 was 4.2% and 6.0% higher than in T1, respectively, with no significant difference between T2 and T3. In the 20–40 cm soil layer, no significant differences in GS activity were observed among nitrogen treatments. In the 40–60 cm soil layer, GS activity in T2 was significantly higher than in T1 and T3, while no significant difference was found between T1 and T3. In the 60–80 cm soil layer, GS activity was highest in T3, being significantly higher than T1 by 22.1% and T4 by 58.7%, whereas no significant difference was observed between T2 and T3.
GOGAT activity across treatments exhibited a unimodal trend with soil depth, increasing first and then decreasing, and reaching its maximum in the 40–60 cm soil layers (Figure 6D). In the 0–20 cm soil layer, GOGAT activity in T3 was the highest, 7.2% greater than in T1, with the difference being statistically significant. In the 20–40 cm soil layer, GOGAT activity was highest in T1, significantly greater than in T2 and T3, while T3 was also significantly higher than T2. In the 40–60 cm soil layer, no significant differences were observed among nitrogen treatments. In the 60–80 cm soil layer, GOGAT activity was highest in T3, 6.6% greater than in T1 and 8.2% greater than in T2, with both differences being statistically significant, whereas no significant difference was detected between T2 and T3.
Overall, the activities of root nitrogen metabolism enzymes exhibited unimodal patterns with soil depth, showing higher values in the 0–40 cm layers and declining progressively in deeper layers. NR and NiR peaked in the 20–40 cm and 40–60 cm layers, respectively, while GS activity reached its maximum at 40–60 cm and GOGAT at 40–60 cm. Among treatments, nitrogen application consistently enhanced enzyme activities compared with the control, with T2 and T3 generally outperforming T1. Notably, T3 frequently exhibited the highest activities, particularly in the surface (0–20 cm) and deep (60–80 cm) soil layers, whereas T2 showed advantages in the mid soil layers.

3.1.5. Effects of Organic Fertilizer Substituting Basal Chemical Fertilizer on Nitrogen Transport Efficiency in Maize Roots

Root nitrogen transport efficiency before flowering increased with organic fertilizer substitution (Table 2). NTA was highest in T2, significantly greater than T1, while T3 was intermediate with no significant difference from either T1 or T2. NTE was significantly higher in T3, being 11.8% and 8.6% greater than T1 and T2, respectively, with no significant difference between T1 and T2. In contrast, AANAA and NCP showed no significant differences among treatments, although both recorded the highest values in T3. Overall, although the three treatments showed an increasing trend in AANAA and NCP with higher substitution ratios, no significant differences were observed among treatments, despite T3 having the highest values. The effect of organic fertilizer substitution on root nitrogen translocation was mainly reflected in NTA and NTE, with T3 enhancing the contribution of root nitrogen to maize grain filling primarily through a significant improvement in NTE.

3.2. Effects of Organic Fertilizer Substitution for Basal Chemical Fertilizer on Maize Yield and Nitrogen Fertilizer Use Efficiency

3.2.1. Effects of Organic Fertilizer Substitution for Basal Chemical Fertilizer on Maize Yield and Its Yield Components

In 2022, fresh biomass, grain yield, kernel weight per ear, and 1000-kernel weight under all nitrogen treatments showed a declining trend compared with 2021. In the combined analysis across the two years, T1 and T3 performed similarly across these indices, with no significant differences observed between them (Table 3). In terms of the biomass at the maize maturity stage, the performance over the two years followed the trend of T1 > T3 > T2 > T4. Biomass under T1 was significantly higher than under T2, by 10.99% in 2021 and 13.25% in 2022, but did not differ significantly from T3. The average yield trend of biomass was the same over the two years. In 2021, the grain yield showed a similar trend to the biomass. The grain yield under the T1 treatment was significantly higher than that under the T2 treatment among the fertilization treatments, but there were no significant differences compared with the T3 treatment. In 2022, grain yield under T1, T2, and T3 increased significantly by 109.7%, 99.2%, and 134.6%, respectively, compared with the non-nitrogen treatment. Grain yield was highest under T3, being 11.8% higher than T1 and 17.8% higher than T2. However, there were no significant differences in grain yield among the nitrogen application treatments over the two years, and the numerical values showed the trend of T3 > T1 > T2. In 2021, there were no significant differences in the number of grains per ear among the nitrogen application treatments. In 2022, the number of grains per ear under the nitrogen application treatments increased by 218.4%, 206.6%, and 225.9% compared with no nitrogen application, all showing significant differences. Based on the average analysis of 2021 and 2022, there were no significant differences in kernel number per ear among the different nitrogen application treatments. In 2021, the grain weight per ear under the nitrogen application treatments were significantly different from that under no nitrogen application, but there were no significant differences among the fertilization treatments. In 2022, the grain weight per ear was the highest under the T3 treatment, which was 5.3% and 7.8% higher than that under the other nitrogen application treatments, showing significant differences. There were no significant differences in the grain weight per ear between the T3 and T1 treatments over the two years, and the T3 treatment was significantly higher than the T2 treatment by 7.86%. Regarding the 1000-kernel weight, there were no significant differences under the T3 treatment compared with the T1 and T2 treatments, and the performance was consistent over the two years. Overall, although the T1 treatment had relatively large biomass, it showed relatively low performance in grain yield accumulation, which may be related to the lower nitrogen transport efficiency of the roots. The T3 treatment could allocate above ground biomass to grain yield, and the yield was comparable to or even higher than that of the T1 treatment, possibly coordinating the relationship between vegetative growth and reproductive growth during the maize growth period.

3.2.2. Effects of Organic Fertilizer Substitution for Basal Chemical Fertilizer on Nitrogen Use Efficiency of Maize

In 2021, maize PFP, AE, and FCR decreased progressively with increasing proportions of organic fertilizer substitution. In contrast, in 2022, these indices first increased and then declined as the substitution proportion increased (Table 4). In 2021, the PFP in T1 was significantly higher than in T2 by 5.79% and higher than in T3 by 3.45%, while no significant difference was observed between T2 and T3. In 2022, the partial factor productivity (PFP) of the T3 treatment was significantly higher than that of T2 by 17.71%. Nevertheless, when averaged across the two years, no significant differences in PFP were detected among T1, T2, and T3 treatments. In 2021, the AE in treatment T1 was significantly 9.59% higher than that in treatment T2, but there were no significant differences between treatment T3 and treatments T1 and T2. In 2022, AE was highest in T3, being significantly higher than T1 by 22.82% and higher than T2 by 35.56%, while no significant difference was observed between T1 and T2. In 2021, the FCR in treatment T:1 was significantly higher than that in treatment T3, and there were no significant differences between treatment T2 and treatments T1 and T3. In 2022, the FCR in T3 was 9.8% higher than in T1 and 15.8% higher than in T2. ANOVA of PFP, AE, and FCR across the two years showed no significant differences in PFP, AE, and FCR among T1–T3 treatments, although T3 consistently performed better, being either comparable to or higher than T1.

3.3. Relationship Between Physiological Characteristics of Maize Roots and Yield

Root dry weight, root activity, root total nitrogen content, GS activity, grain number per ear, and 1000-kernel weight were significantly positively correlated with maize yield (Figure 7). Root total nitrogen content was significantly positively correlated with root dry weight. In addition, root dry weight, root activity, and root nitrogen accumulation were significantly positively correlated with both grain number per ear and 1000-kernel weight. These results indicate that root physiological characteristics may influence maize yield formation by affecting the yield-contributing factors of maize.

3.4. Partial Least Squares Structural Equation Modeling (PLS-SEM)

PLS-SEM can characterize both direct and indirect effects within a predefined biological pathway framework, integrating root traits, nitrogen metabolism, yield components, and final grain yield into a single analytical model. The results of the partial least squares structural equation model indicate that nitrogen metabolism enzyme activity, the total nitrogen content in maize roots, root activity, root dry weight, kernel number per ear, and 1000-kernel weight collectively explain 88.8% of the variation in grain yield (adjusted R2) (Figure 8). Specifically, root nitrogen metabolism enzymes regulate maize yield formation mainly through indirect pathways. Among them, the activities of glutamine synthetase (GS) and nitrite reductase (NiR) are the key regulatory factors. From the perspective of metabolic pathways, nitrogen metabolism enzyme activities promote root nitrogen accumulation, which in turn exerts a positive effect on root activity. Enhanced root activity further facilitates the increase in root dry weight, and greater root dry weight positively influences both kernel number per ear and thousand-kernel weight. Among these yield components, kernel weight shows a direct positive effect on grain yield. Overall, reducing chemical nitrogen fertilizer application and substituting it with organic fertilizer effectively enhances the activities of root nitrogen metabolism enzymes, thereby strengthening root nitrogen uptake capacity, improving root activity, and promoting the increase in root dry weight and the development of a robust root system. Ultimately, these processes increase kernel number per plant and contribute to higher grain yield.

4. Discussion

4.1. Regulatory Effects on the Key Processes of Nitrogen Metabolism in the Roots of Dryland Maize Under the Optimal Proportion of Organic Fertilizer Substitution for Basal Chemical Fertilizer

Nitrogen uptake, reduction (NR/NiR), and assimilation via the GS–GOGAT cycle constitute the core physiological basis of plant NUE and yield formation [36]. As the main organ for crops to absorb nitrogen, the development status, nitrogen absorption capacity, and metabolic efficiency of roots are the key physiological bases affecting plant nitrogen utilization and yield formation [37]. Root activity is an important indicator for maintaining the root’s ability to absorb substances, and the strength of root activity directly affects nutrient absorption in the late growth stage of maize and the physiological activity of the above ground parts [38]. This study shows that the treatment of substituting 37.5% of chemical fertilizers with organic fertilizers can significantly promote the root development of maize, enhance the root’s nitrogen absorption and metabolism capabilities, and provide sufficient nitrogen sources for plant growth. In terms of root development, the changes in root dry weight and vitality at different growth stages clearly reflect the impact of organic fertilizer substitution. At the VT stage, the root dry weights of the treatments with 37.5% and 50% organic fertilizer substitution were significantly higher than that of the treatment with only chemical fertilizers; at the R3 stage, the root dry weights of the organic fertilizer substitution treatments still remained at a relatively high level. This indicates that an appropriate substitution of chemical fertilizer with organic fertilizer can delay root senescence by enhancing the activity of root antioxidant enzymes, thereby maintaining root function during the later growth stages of maize, which is crucial for sustained nitrogen uptake during the grain-filling period [39]. Meanwhile, the root vitality of the treatment with 37.5% organic fertilizer substitution was significantly higher than that of the 50% substitution treatment during the growth period but was similar to that of the treatment with only chemical fertilizers, suggesting that its roots have stronger physiological activity and more vigorous nutrient absorption ability. This may be related to the improvement of the soil microenvironment by organic fertilizers. Since organic fertilizers increase soil organic matter, they can reduce soil bulk density and increase soil porosity, providing a more spacious space for root growth [14,24]. At the same time, substances such as humic acid produced by the decomposition of organic fertilizers can stimulate root cell division and elongation, promote the increase in root length and root surface area, and thus enhance the root’s ability to capture water and nutrients [40].
In terms of nitrogen absorption, the total nitrogen content and accumulation in the roots within the treatment with 37.5% organic fertilizer substitution were better in each soil layer. Especially in the 0–20 cm soil layer, total nitrogen content and nitrogen accumulation increased significantly compared with the treatment with only chemical fertilizers, by 6.8% and 18.3%, respectively. This result is consistent with the current experimental observation that the 0–20 cm layer is the main area for maize root nitrogen absorption [39], indicating that the treatment with 37.5% organic fertilizer substitution can significantly enhance the root’s nitrogen absorption ability in the tillage layer. In addition, the total nitrogen content in the roots within the 37.5% substitution treatment in the 20–80 cm soil layers also performed well, indicating that the root’s nitrogen absorption ability in the surface and deeper layers of the soil profile had also been improved. This may be related to the promotion of root expansion into the deep layer by organic fertilizers, which helps to utilize nitrogen in deep layer soil and reduce nitrogen leaching losses.
In terms of nitrogen metabolism, the treatment with 37.5% organic fertilizer substitution significantly increased the activities of key metabolic enzymes in the roots, providing a physiological basis for nitrogen assimilation. NR and NiR are key enzymes for the conversion of nitrate nitrogen to ammonium nitrogen, and their activities directly affect the nitrogen reduction efficiency [41]. There were no significant differences in NR activity among treatments in the main nutrient absorbing 0–20 cm soil layer, but for NiR, the treatment with 37.5% organic fertilizer substitution had an enzyme activity comparable to that of the treatment with only chemical fertilizers, and both were significantly higher than that of the 50% substitution treatment, indicating that it can efficiently promote the reduction in nitrate nitrogen. GS and GOGAT are the core enzymes for ammonium nitrogen assimilation, and the GS–GOGAT cycle they form is the central link of plant nitrogen metabolism [42]. It is noteworthy that in the 0–20 cm soil layer of the 37.5% substitution treatment, the activities of GS and GOGAT were significantly higher than those of the chemical fertilizer only treatment. At the 60–80 cm depth, GOGAT activity was significantly higher than in the other treatments. Although GOGAT activity in the 20–40 cm layer was lower than in T1, it remained significantly higher than in T2. In the 40–60 cm layer, no significant differences were observed among the N fertilization treatments, yet enzyme activities still remained at a relatively high level. Overall, enzyme activities in the 20–60 cm middle layers were maintained at higher levels, indicating that this treatment can efficiently convert ammonium nitrogen into amino acids not only in the main absorption zone (0–20 cm) but also in the deeper soil layers, thereby providing the material basis for protein synthesis and grain development. This also verifies the conclusion in the experimental results that the 37.5% organic fertilizer substitution treatment promotes the transfer of nitrogen metabolites to grains. This partly explains the higher kernel number per ear, 1000-kernel weight, and grain yield, while the path analysis also indicated that kernel number per ear directly influences maize yield. Further analysis of the distribution of nitrogen metabolic enzyme activities in different soil layers shows that the activities of NR and NiR are higher in the 0–40 cm soil layer, while the activities of GS and GOGAT peak in the 40–60 cm soil layer. The treatment with 37.5% organic fertilizer substitution can maintain relatively high enzyme activities in each soil layer, indicating that it can coordinate the metabolic functions of roots in different soil layers and achieve efficient absorption, conversion, and transfer of nitrogen. At 50% substitution, yield declined probably because organic N mineralization was too slow to meet crop demand at the jointing–tasseling stage.

4.2. Correlation Mechanism Between Root Nitrogen Metabolism Characteristics, Yield, and Nitrogen Use Efficiency of Dryland Maize Under the Substitution of Base Applied Chemical Fertilizers with Organic Fertilizers

Nitrogen is a crucial nutrient for crop growth and high yields. Adequate and scientific nitrogen supply is of great significance for agricultural production and food security [43]. The preliminary results of this experiment showed that the replacement of 37.5% chemical fertilizers with organic fertilizers could increase the leaf area index and the activities of key photosynthetic enzymes during the filling stage of dryland maize, ensuring stable yields and improving nitrogen use efficiency [22]. Therefore, a good root shoot relationship can coordinate plant growth, nutrient allocation, and environmental responses. It is necessary to clarify the formation of crop yields from the perspective of roots. The results showed that in the treatment where 37.5% of chemical fertilizer was replaced with organic fertilizer, both the number of grains per ear and the grain weight per ear were highest, being 2.4% and 5.3% higher than T1, respectively. No significant difference in 1000-kernel weight was observed between this treatment and T1. This indicated that the coordinated increase in the number of grains per ear and the 1000-kernel weight was the main reason for the yield increase in the treatment of replacing 37.5% chemical fertilizers with organic fertilizers. Similarly, in the correlation analysis, thousand-kernel weight was significantly positively correlated with grain yield (r = 0.93), and kernel number per ear was also significantly positively correlated with grain yield (r = 0.95), with the latter showing a stronger correlation. It is worth noting that the treatment of applying chemical fertilizers alone had higher biomass, but the grain yield was lower than that of the treatment of replacing 37.5% chemical fertilizers with organic fertilizers. It is speculated that the reason may be related to the transfer efficiency of nitrogen to grains [44].
This study found that among all fertilization treatments, substituting 37.5% of chemical fertilizer with organic fertilizer resulted in a significantly higher NTE compared with the other treatments, while NTA showed no significant differences among the N applied treatments. Similarly, the 37.5% substitution showed a tendency toward higher values in both AANAA and NCP, suggesting that this treatment may facilitate more efficient nitrogen transfer from vegetative organs to grains and support continued nitrogen assimilation in the late growth stage, thereby contributing to grain filling In contrast, the grain yield of the treatment of replacing 50% chemical fertilizers with organic fertilizers was significantly lower than that of the treatments of applying chemical fertilizers alone and replacing 37.5% chemical fertilizers with organic fertilizers. Specifically, this was reflected in a significant reduction in yield components. This may be because a too high ratio of organic fertilizers led to a slow nutrient release that did not match the needs of maize: the slow mineralization rate of organic fertilizers in the early stage may not meet the rapid nitrogen demand of maize from the jointing stage to the large bell mouth stage, resulting in a certain inhibition of vegetative growth, while the nitrogen mineralized in the later stage may not be transferred to grains in time, causing redundancy in vegetative organs and ultimately affecting the grain yield [45]. In addition, the agronomic utilization rate and partial productivity of nitrogen fertilizers in the treatment of replacing 37.5% chemical fertilizers with organic fertilizers were significantly improved. The reason may be that the addition of organic fertilizers improved the soil structure and fertilizer holding capacity, reduced nitrogen leaching and volatilization losses, and promoted root absorption and assimilation of nitrogen, thus ensuring yield increase while reducing the use of chemical fertilizers [46].
The results of this study indicate that maize grain yield was primarily dependent on kernel number per ear and 1000-kernel weight, both of which showed highly significant positive correlations with yield (r = 0.95 and r = 0.93, respectively), with a strong inter-correlation between them (r = 0.98). This suggests that yield improvement mainly relies on the coordinated increase in kernel number and kernel weight. In addition, root dry weight, root activity, and root nitrogen accumulation were significantly and positively correlated with yield (r = 0.67–0.87), indicating that root traits play an important role in promoting grain formation. Among the nitrogen metabolism enzymes, glutamine synthetase (GS) was significantly correlated with yield (r = 0.60) and strongly associated with nitrite reductase (NiR) (r = 0.89), suggesting that the activity of key enzymes in nitrogen metabolism may indirectly promote yield formation by enhancing root nitrogen uptake and accumulation. Furthermore, the PLS-SEM analysis revealed that nitrogen metabolism enzymes indirectly regulated kernel number per ear and 1000-kernel weight through their effects on root nitrogen accumulation, root activity, and root dry weight, ultimately influencing grain yield via kernel number. Combined analyses demonstrated that the improvement of maize yield was not only determined by the direct contributions of kernel number and kernel weight but was also comprehensively regulated by root biomass, activity, and nitrogen metabolism enzyme activity.

5. Conclusions

In conclusion, under the full plastic film mulching with double ridges and furrow planting system in dry farming areas, a ratio of 37.5% organic fertilizer substituting for basal chemical fertilizer under an equal nitrogen application rate of 200 kg/hm2 showed favorable performance. This treatment tended to increase total nitrogen accumulation in roots at the 0–20 cm soil layer during the filling stage, enhance the activities of nitrogen metabolism enzymes such as NR and GS, and promote the translocation of nitrogen from roots to grains as well as the efficiency of pre-flowering nitrogen remobilization. Maize grain yield under this treatment was generally the highest, with agronomic efficiency improved by up to 22.8% and PFP by 11.5%. These results suggest that partial substitution can achieve a balance between reducing chemical fertilizer application and maintaining relatively high yield, thus providing useful technical support for the green and sustainable development of dryland agriculture in the region.

Author Contributions

Conceptualization, H.M. and L.L.; methodology, H.M. and X.T.; software, B.L. and X.T.; validation, J.X. and Z.Z.; formal analysis, H.M. and X.T.; investigation, X.T. and B.L.; resources, H.M. and L.L.; data curation, X.T. and B.L.; writing—original draft preparation, H.M., X.T. and B.L.; writing—review and editing, X.T., H.M., L.L., J.X. and Z.Z.; visualization, H.M. and X.T.; supervision, J.X. and Z.Z.; project administration, H.M. and L.L.; funding acquisition, H.M. and L.L. All authors have read and agreed to the published version of the manuscript.

Funding

This work was supported by National Key R&D Program of China (2022YFD1900300, 2021YFD1900700), Innovation Group of Basic Research in Gansu Province (25JRRA807), the Research Program Sponsored by the State Key Laboratory of Aridland Crop Science of China (GSCS-2022-Z02), Innovation Fund for Higher Education Institutions in Gansu Province (2022A-055), Innovation Star Project for Excellent Graduate Student of Gansu Province (2025CXZX-750).

Data Availability Statement

The original contributions presented in this study are included in the article. Further inquiries can be directed to the corresponding author.

Conflicts of Interest

The authors declare that they have no known competing financial interests or personal relationships that could have appeared to influence the work reported in this paper.

References

  1. Guillemot, J.R.; Zhang, X.; Warner, M.E. Population aging and decline will happen sooner than we think. Soc. Sci. 2024, 13, 190. [Google Scholar] [CrossRef]
  2. Roy, M.; Medhekar, A. Transforming smart farming for sustainability through agri-tech Innovations: Insights from the australian agricultural landscape. Farming Syst. 2025, 3, 100165. [Google Scholar] [CrossRef]
  3. Moreno-Jiménez, E.; Plaza, C.; Saiz, H.; Manzano, R.; Flagmeier, M.; Maestre, F.T. Aridity and reduced soil micronutrient availability in global drylands. Nat. Sustain. 2019, 2, 371–377. [Google Scholar] [CrossRef] [PubMed]
  4. Zhu, X.; Liu, Y.; Xu, K.; Pan, Y. Effects of Drought on vegetation productivity of farmland ecosystems in the drylands of northern china. Remote Sens. 2021, 13, 1179. [Google Scholar] [CrossRef]
  5. Wang, J.B.; Xie, J.H.; Li, L.L.; Adingo, S. Review on the fully mulched ridge–furrow system for sustainable maize production on the semi-arid loess plateau. J. Integr. Agric. 2023, 22, 1277–1290. [Google Scholar] [CrossRef]
  6. Zhang, D.; Cai, X.W.; Diao, L.F.; Wang, Y.Q.; Wang, J.S.; An, S.Q.; Cheng, X.L.; Yang, W. Changes in soil organic carbon and nitrogen pool sizes, dynamics, and biochemical stability during 160 years natural vegetation restoration on the loess plateau, china. CATENA 2022, 211, 106014. [Google Scholar] [CrossRef]
  7. Zhou, Y.J.; Xie, J.H.; Li, L.L.; Wang, L.L.; Luo, Z.Z.; Wang, J.B. Effects of long-term reduce/zero tillage and nitrogen fertilizer reducing on maize yield and soil carbon emission under fully plastic mulched ridge-furrow planting system. Sci. Agric. Sin. 2021, 54, 5054–5067. (In Chinese). [Google Scholar] [CrossRef]
  8. Xie, J.H.; Wang, L.L.; Li, L.L.; Coulter, J.A.; Chai, Q.; Zhang, R.Z.; Luo, Z.Z.; Carberry, P.; Rao, K.P.C. Subsoiling increases grain yield, water use efficiency, and economic return of maize under a fully mulched ridge-furrow system in a semiarid environment in China. Soil Tillage Res. 2020, 199, 104584. [Google Scholar] [CrossRef]
  9. Liu, Y.; Li, S.L.; Liu, Y.X.; Shen, H.Z.; Huang, T.T.; Ma, X.Y. Optimization of a nitrogen fertilizer application scheme for spring maize in full-film double-ridge furrow in longzhong, china. Agric. Water Manag. 2023, 290, 108580. [Google Scholar] [CrossRef]
  10. Liao, Z.Q.; Zhang, C.; Yu, S.L.; Lai, Z.L.; Wang, H.D.; Zhang, F.C.; Wu, P.; Fan, J.L. Ridge-furrow planting with black film mulching increases rainfed summer maize production by improving resources utilization on the loess plateau of china. Agric. Water Manag. 2023, 289, 108558. [Google Scholar] [CrossRef]
  11. Tian, S.; Xu, Y.; Wang, Q.S.; Zhang, Y.J.; Yuan, X.L.; Ma, Q.; Feng, X.F.; Ma, H.C.; Liu, J.X.; Liu, C.Q.; et al. The effect of optimizing chemical fertilizers consumption structure to promote environmental protection, crop yield and reduce greenhouse gases emission in China. Sci. Total Environ. 2023, 857, 159349. [Google Scholar] [CrossRef] [PubMed]
  12. Boh, M.Y.; Clark, O.G. Nitrogen and phosphorus flows in Ontario’s food systems. Resour. Conserv. Recy. 2020, 154, 104639. [Google Scholar] [CrossRef]
  13. Budiastuti, M.T.S.; Purnomo, D.; Pujiasmanto, B.; Setyaningrum, D. Response of maize yield and nutrient uptake to indigenous organic fertilizer from corn cobs. Agriculture 2023, 13, 309. [Google Scholar] [CrossRef]
  14. Zhang, C.; Zhao, Z.; Li, F.; Zhang, J. Effects of organic and inorganic fertilization on soil organic carbon and enzymatic activities. Agronomy 2022, 12, 3125. [Google Scholar] [CrossRef]
  15. Fan, F.; Zhang, H.; Alandia, G.; Luo, L.; Cui, Z.; Niu, X.; Liu, R.; Zhang, X.; Zhang, Y.; Zhang, F. Long-term effect of manure and mineral fertilizer application rate on maize yield and accumulated nutrients use efficiencies in north China plain. Agronomy 2020, 10, 1329. [Google Scholar] [CrossRef]
  16. Zhang, J.; Li, S.; Jiang, P.P.; Wang, R.R.; Guo, J.H.; Xiao, H.S.; Wu, J.Z.; Shaaban, M.; Li, Y.J.; Huang, M. Organic fertilizer substituting 20% chemical N increases wheat productivity and soil fertility but reduces soil nitrate-N residue in drought-prone regions. Front. Plant Sci. 2024, 15, 1379485. [Google Scholar] [CrossRef]
  17. Wang, X.; Tian, L.; Xu, L. Effects of manure-based nitrogen substitution for chemical nitrogen fertilizers on economic benefits and water-use efficiency of maize. Agronomy 2023, 13, 3031. [Google Scholar] [CrossRef]
  18. Ren, J.H.; Liu, X.L.; Yang, W.P.; Yang, X.X.; Li, W.G.; Xia, Q.; Li, J.H.; Gao, Z.Q.; Yang, Z.P. Rhizosphere soil properties, microbial community, and enzyme activities: Short-term responses to partial substitution of chemical fertilizer with organic manure. J. Environ. Manag. 2021, 299, 113650. [Google Scholar] [CrossRef]
  19. Xie, J.H.; Chai, Q.; Li, L.L.; Zhang, R.Z.; Wang, L.L.; Liu, C. Effects of the substitution of inorganic nitrogen by organic nitrogen fertilizer on maize grain yield and water and nitrogen use efficiency under plastic film fully mulched ridge-furrow in semi-arid area. J. Appl. Ecol. 2019, 30, 1199–1206. (In Chinese). [Google Scholar] [CrossRef]
  20. Xie, L.H.; Li, L.L.; Xie, J.H.; Wang, J.B.; Mumtaz, M.Z.; Effah, Z.; Fudjoe, S.K.; Khaskheli, M.A.; Luo, Z.Z.; Li, L.Z. Optimal substitution of inorganic fertilizer with organic amendment sustains rainfed maize production and decreases soil N2O emissions by modifying denitrifying bacterial communities in northern china. Eur. J. Agron. 2024, 160, 127287. [Google Scholar] [CrossRef]
  21. Xie, L.H.; Li, L.L.; Xie, J.H.; Wang, J.B.; Zhou, Y.J.; Chen, Q.; Fudjoe, S.K. Effects of substitution of chemical fertilizer by organic fertilizer on maize growth and field carbon emission in dry farming area of Longzhong, Gansu Province. J. Plant Nutr. Fertil. 2022, 28, 1029–1038. (In Chinese). [Google Scholar] [CrossRef]
  22. Liu, B.X.; Meng, H.F.; Li, L.L.; Xie, J.H.; Zhou, Y.J.; Tian, X.; Wang, C.Y.; Zhang, G.C. Effects of organic fertilizer substitution for basal chemical nitrogen on photosynthetic performance, yield, and nitrogen use efficiency in rainfed maize. J. Maize Sci. 2024, 32, 96–107. (In Chinese). [Google Scholar] [CrossRef]
  23. Zhang, P.; Wang, Y.Y.; Sheng, D.C.; Zhang, S.; Gu, S.C.; Yan, Y.; Zhao, F.C.; Wang, P.; Huang, S.B. Optimizing root system architecture to improve root anchorage strength and nitrogen absorption capacity under high plant density in maize. Field Crop Res. 2023, 303, 109109. [Google Scholar] [CrossRef]
  24. Feng, W.H.; Sánchez-Rodríguez, A.R.; Bilyera, N.; Wang, J.Q.; Wang, X.Q.; Han, Y.H.; Ma, B.X.; Zhang, H.Y.; Li, F.Y.; Zhou, J.; et al. Mechanisms of biochar-based organic fertilizers enhancing maize yield on a Chinese Chernozem: Root traits, soil quality and soil microorganisms. Environ. Technol. Innov. 2024, 36, 103756. [Google Scholar] [CrossRef]
  25. Meng, F.; Zhang, R.; Zhang, Y.; Li, W.; Zhang, Y.; Zhang, M.; Yang, X.; Yang, H. Improving maize carbon and nitrogen metabolic pathways and yield with nitrogen application rate and nitrogen forms. PeerJ 2024, 12, e16548. [Google Scholar] [CrossRef]
  26. Zayed, O.; Hewedy, O.A.; Abdelmoteleb, A.; Ali, M.; Youssef, M.S.; Roumia, A.F.; Seymour, D.; Yuan, Z.C. Nitrogen Journey in Plants: From Uptake to Metabolism, Stress Response, and Microbe Interaction. Biomolecules 2023, 13, 1443. [Google Scholar] [CrossRef]
  27. Cai, H.G.; Ma, W.; Zhang, X.Z.; Ping, J.P.; Yan, X.G.; Liu, J.Z.; Yuan, J.C.; Wang, L.C.; Ren, J. Effect of subsoil tillage depth on nutrient accumulation root distribution grain yield in spring maize. Crop J. 2014, 2, 297–307. [Google Scholar] [CrossRef]
  28. Kirk, P.L. Kjeldahl method for total nitrogen. Anal. Chem. 1950, 22, 354–358. [Google Scholar] [CrossRef]
  29. Barber, S.A. Effect of tillage practice on corn (Zea mays L.) root distribution and morphology. Agron. J. 1971, 63, 724–726. [Google Scholar] [CrossRef]
  30. Clemensson-Lindell, A. Triphenyltetrazolium chloride as an indicator of fine-root vitality and environmental stress in coniferous forest stands: Applications and limitations. Plant Soil 1994, 159, 297–300. [Google Scholar] [CrossRef]
  31. Campbell, W.; Remmler, J. Regulation of corn leaf nitrate reductase: I. immunochemical methods for analysis of the rnzyme’s protein component. Plant Physiol. 1986, 80, 435–441. [Google Scholar] [CrossRef]
  32. Oaks, A.; Wallace, W.; Stevens, D. Synthesis and turnover of nitrate reductase in corn roots. Plant Physiol. 1972, 50, 649–654. [Google Scholar] [CrossRef] [PubMed]
  33. Kamachi, K.; Yamaya, T.; Mae, T.; Ojima, K. A role for glutamine synthetase in the remobilization of leaf nitrogen during natural senescence in rice leaves. Plant Physiol. 1991, 96, 411–417. [Google Scholar] [CrossRef] [PubMed]
  34. Masclaux-Daubresse, C.; Daniel-Vedele, F.; Dechorgnat, J.; Chardon, F.; Gaufichon, L.; Suzuki, A. Nitrogen uptake, assimilation and remobilization in plants: Challenges for sustainable and productive agriculture. Ann Bot. 2010, 105, 1141–1157. [Google Scholar] [CrossRef]
  35. Sodek, L.; Silva, W. Glutamate synthase: A possible role in nitrogen metabolism of the developing maize endosperm. Plant Physiol. 1977, 60, 602–605. [Google Scholar] [CrossRef]
  36. Tegeder, M.; Masclaux-Daubresse, C. Source and sink mechanisms of nitrogen transport and use. New Phytol. 2018, 217, 35–53. [Google Scholar] [CrossRef] [PubMed]
  37. Wang, D.; Freschet, G.; McCormack, M.; Lambers, H.; Gu, J. Nutrient resorption of leaves and roots coordinates with root nutrient-acquisition strategies in a temperate forest. New Phytol. 2025, 246, 515–527. [Google Scholar] [CrossRef]
  38. Wang, J.Q.; Liu, Z.Y.; Shan, X.H.; Zhang, Y.L. Partial replacement of chemical fertilizer by manure affects maize root traits in north china plain. Soil Use Manag. 2023, 39, 1545–1556. [Google Scholar] [CrossRef]
  39. Rasool, R.; Kukal, S.S.; Hira, G.S. Root growth and soil water dynamics in relation to inorganic and organic fertilization in maize-wheat. Commun. Soil Sci. Plant Anal. 2010, 41, 2478–2490. [Google Scholar] [CrossRef]
  40. Costa-Broseta, Á.; Castillo, M.; León, J. Nitrite reductase 1 is a target of nitric oxide-mediated post-translational modifications and controls nitrogen flux and growth in arabidopsis. Int. J. Mol. Sci. 2020, 21, 7270. [Google Scholar] [CrossRef]
  41. Sullivan, D.M.; Moore, A.D.; Verhoeven, E.; Brewer, L.J. Baseline Soil Nitrogen Mineralization: Measurement and Interpretation. Oregon State University Extension Service. 2020. Available online: https://extension.oregonstate.edu/sites/default/files/documents/em9281.pdf (accessed on 15 August 2025).
  42. Liu, X.J.; Hu, B.; Chu, C.C. Nitrogen assimilation in plants: Current status and future prospects. J. Genet. Genom. 2021, 49, 394–404. [Google Scholar] [CrossRef]
  43. Hirel, B.; Tétu, T.; Lea, P.; Dubois, F. Improving nitrogen use efficiency in crops for sustainable agriculture. Sustainability 2011, 3, 1452–1485. [Google Scholar] [CrossRef]
  44. Zhai, L.C.; Wang, Z.B.; Zhai, Y.C.; Zhang, L.H.; Zheng, M.J.; Yao, H.P.; Lv, L.H.; Shen, H.P.; Zhang, J.T.; Yao, Y.R.; et al. Partial substitution of chemical fertilizer by organic fertilizer benefits grain yield, water use efficiency, and economic return of summer maize. Soil Tillage Res. 2022, 217, 105287. [Google Scholar] [CrossRef]
  45. Marchezan, C.; Ferreira, P.A.A.; Silva, L.S.; Bacca, A.; Krug, A.; Nicoloso, F.T.; Tarouco, C.P.; Tiecher, T.L.; Brunetto, G.; Ceretta, C.A. Nitrogen availability and physiological response of corn after 12 years with organic and mineral fertilization. J. Soil Sci. Plant Nutr. 2020, 20, 979–989. [Google Scholar] [CrossRef]
  46. Wang, X.; Liu, E.; Wang, L.; Lv, P. Changes in soil physical properties and maize productivity in response to nitrogen substitution by maize stover for mineral fertilizers. Agronomy 2025, 15, 587. [Google Scholar] [CrossRef]
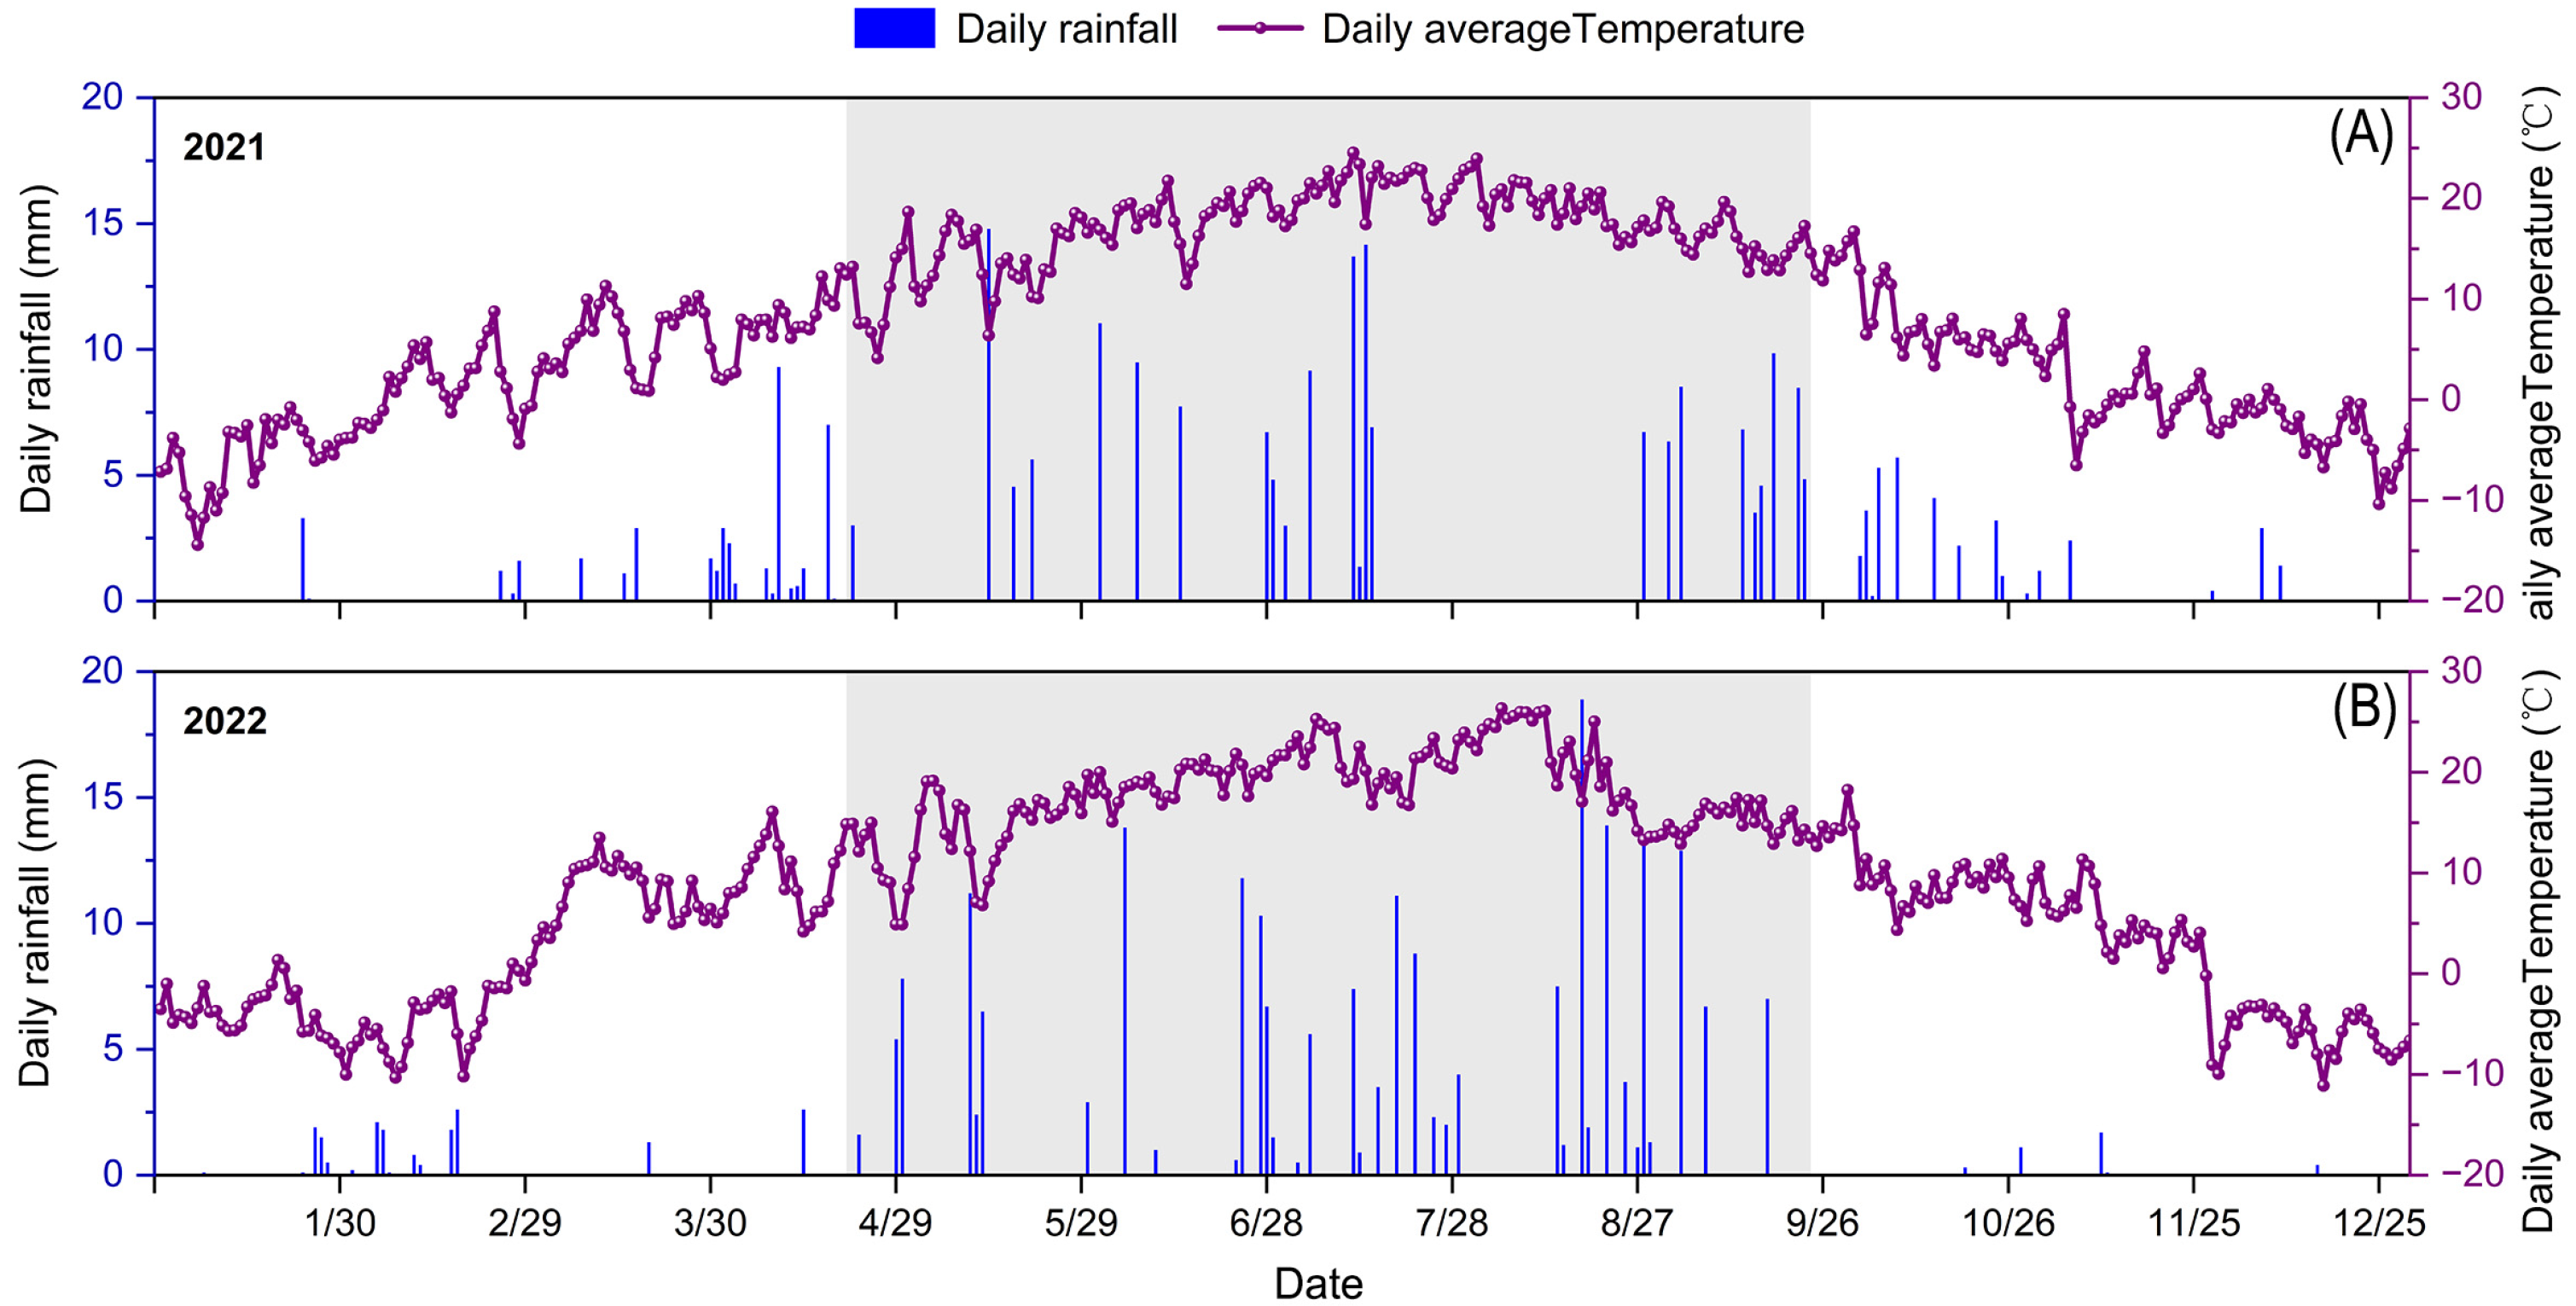
Figure 1. Monthly rainfall and average daily temperature in 2021 (A)–2022 (B). The bars in the figure represent daily precipitation, the line indicates daily average temperature, and the shaded gray area marks the maize growing season of that year.
Agronomy 15 02216 g001
Figure 2. Root dry weight of maize under different proportion of organic fertilizer replacing base chemical fertilizer (2022). T1: Chemical fertilizer applied alone; T2: 50% organic fertilizer replacing basal application of chemical fertilizer; T3: 37.5% organic fertilizer replacing basal application of chemical fertilizer; T4: No fertilizer application. In the figure, V6 represents the jointing stage, V12 the big trumpet stage, VT the tasseling stage, and R3 the milk stage (the same applies hereinafter). Error bars indicate standard deviation. Different letters above bars indicate significant differences at p < 0.05 according to Duncan’s multiple range test.
Agronomy 15 02216 g002
Figure 3. Root activity of maize under different proportions of organic fertilizer replacing base chemical fertilizer (2022). T1: Chemical fertilizer applied alone; T2: 50% organic fertilizer replacing basal application of chemical fertilizer; T3: 37.5% organic fertilizer replacing basal application of chemical fertilizer; T4: No fertilizer application. Error bars indicate standard deviation. Different letters above bars indicate significant differences at p < 0.05 according to Duncan’s multiple range test.
Agronomy 15 02216 g003
Figure 4. Root total nitrogen content of maize under different proportions of organic fertilizer replacing base chemical fertilizer (2022). T1: Chemical fertilizer applied alone; T2: 50% organic fertilizer replacing basal application of chemical fertilizer; T3: 37.5% organic fertilizer replacing basal application of chemical fertilizer; T4: No fertilizer application. Error bars indicate standard deviation. Different letters above bars indicate significant differences at p < 0.05 according to Duncan’s multiple range test.
Agronomy 15 02216 g004
Figure 5. Root total nitrogen accumulation of maize under different proportions of organic fertilizer replacing base chemical fertilizer (2022). T1: Chemical fertilizer applied alone; T2: 50% organic fertilizer replacing basal application of chemical fertilizer; T3: 37.5% organic fertilizer replacing basal application of chemical fertilizer; T4: No fertilizer application. Error bars indicate standard deviation. Different letters above bars indicate significant differences at p < 0.05 according to Duncan’s multiple range test.
Agronomy 15 02216 g005
Figure 6. Changes in activities of maize NR (A), NiR (B), GS (C), and GOGAT (D) under different proportions of organic fertilizer replacing basal application of chemical fertilizer (2022). T1: Chemical fertilizer applied alone; T2: 50% organic fertilizer replacing basal application of chemical fertilizer; T3: 37.5% organic fertilizer replacing basal application of chemical fertilizer; T4: No fertilizer application. Error bars indicate standard deviation. Different letters above bars indicate significant differences at p < 0.05 according to Duncan’s multiple range test.
Agronomy 15 02216 g006
Figure 7. Correlation analysis between root physiological characteristics, yield of maize under different proportion of organic fertilizer replacing base chemical fertilizer. Abbreviations are defined as follows: YG, grain yield; RDM, root dry weight; RA, root activity; RTN, root nitrogen accumulation; NR, nitrate reductase; NiR, nitrite reductase; GS, glutamine synthetase; GOGAT, glutamate synthase; KN, kernel number per ear; 1000-KW, 1000-kernel weight. Significance levels: * p < 0.05, ** p < 0.01, *** p < 0.001.
Agronomy 15 02216 g007
Figure 8. PLS-SEM of nitrogen metabolizing enzymes on nitrogen accumulation, root viability, root dry weight, grain number per ear, 1000-kernel weight and yield of maize. Path analysis shows the direct and indirect impact paths of enzyme activity on yield formation (direct paths with p > 0.05 are not presented in the figure). Colored lines indicate significant positive paths, and black dashed lines indicate non-significant paths. Numbers represent standard path coefficients (SPC). R2 denotes the proportion of variance explained for each dependent variable in the model. * p = 0.05, ** p = 0.01, *** p = 0.001.
Agronomy 15 02216 g008
Table 1. Treatment description and nitrogen fertilizer application scheme of each treatment (kg/hm2). T1: Chemical fertilizer applied alone; T2: 50% organic fertilizer replacing basal application of chemical fertilizer; T3: 37.5% organic fertilizer replacing basal application of chemical fertilizer; T4: No fertilizer application.
CodeTreatmentBase FertilizerJointing FertilizerLarge Belling Fertilizer
Organic Fertilizer (kg/hm2)Chemical Fertilizer (kg/hm2)Chemical Fertilizer (kg/hm2)
NP2O5K2ONP2O5K2ON
T1100% Chemical fertilizer0.00.00.0100.0150.010.660.040.0
T250% Chemical fertilizer +
50% Organic fertilizer
50.015.210.650.0134.80.060.040.0
T362.5% Chemical fertilizer +
37.5% Organic fertilizer
37.511.48.062.5138.62.660.040.0
T4No fertilizer0.00.00.00.00.00.00.00.0
Table 2. Effects of root nitrogen transport efficiency of maize under different proportions of organic fertilizer replacing base chemical fertilizer (2022). T1: Chemical fertilizer applied alone; T2: 50% organic fertilizer replacing basal application of chemical fertilizer; T3: 37.5% organic fertilizer replacing basal application of chemical fertilizer; T4: No fertilizer application. NTA, NTE, AANAA, NCP refer to nitrogen translocation amount in roots before anthesis, nitrogen translocation efficiency in roots, amount of assimilated nitrogen after anthesis, nitrogen contribution rate of roots to grains. Values are means ± SD (n = 3). Different lowercase letters indicate significant differences at p < 0.05 according to Duncan’s multiple range test.
TreatmentNTA (kg/hm2)NTE (%)AANAA (kg/hm2)NCP (%)
T110.3 ± 1.8 b37.3 ± 1.1 b7.0 ± 0.2 a16.9 ± 1.7 a
T214.7 ± 2.4 a38.4 ± 1.3 b7.5 ± 0.4 a17.1 ± 3.3 a
T312.7 ± 1.6 ab41.7 ± 1.3 a7.8 ± 0.7 a19.7 ± 2.8 a
Table 3. Yield and yield constituent factors of maize under different proportions of organic fertilizer replacing base chemical fertilizer. T1: Chemical fertilizer applied alone; T2: 50% organic fertilizer replacing basal application of chemical fertilizer; T3: 37.5% organic fertilizer replacing basal application of chemical fertilizer; T4: No fertilizer application. Different lowercase letters within the same year indicate significant differences among treatments according to the LSD test at p < 0.05. Values are means ± SD (n = 3). Different uppercase letters indicate significant differences among treatments based on the two year mean values p < 0.05 according to Duncan’s multiple range test.
YearTreatmentBiomass Yield (kg/hm2)Grain Yield (kg/hm2)Grain Number per EarsGrain Weight per Ears
(g)
1000-Kernel Weight
(g)
2021T123,021.50 ± 947.7 a8406.16 ± 213.5 a653 ± 19 a180.9 ± 5.2 a293.5 ± 12.05 a
T220,742.5 ± 1251.3 b7951.98 ± 205.2 a599 ± 25 a165.9 ± 0.9 b276.5 ± 4.45 b
T322,132.5 ± 199.5 ab8118.07 ± 56 aa625 ± 32 a178.7 ± 7.6 ab282.5 ± 10.35 ab
T46831.5 ± 909.9 c2457.82 ± 248.6 b260 ± 38 b50.5 ± 11.7 c217.5 ± 4.45 c
2022T120,125.3 ± 1058.6 a5711.5 ± 401.1 ab675 ± 16 a158.8 ± 2.8 b282.5 ± 3.51 a
T214,340.9 ± 1268.6 c5424.8 ± 490.4 b650 ± 6 b155.1 ± 1.6 b265.5 ± 1.51 b
T317,770.3 ± 116.1 b6388.9 ± 279.8 a691 ± 7 a167.2 ± 3.5 a276.5 ± 3.21 a
T48082.3 ± 298.4 d2723.7 ± 353.3 c212 ± 8 c40 ± 0.8 c198.5 ± 8.51 c
AverageT121,573.4 ± 1801.2 A7058.9 ± 1503.6 A663.6 ± 24.5 A170.1 ± 12.7 AB288 ± 9.97 A
T217,541.7 ± 3606.8 B6684.8 ± 1420 A624.7 ± 32.5 A160.2 ± 5.8 B271 ± 6.7 B
T319,951.4 ± 2459.7 AB7253.5 ± 964.2 A658.2 ± 42 A172.8 ± 7.9 A279.5 ± 7.6 AB
T47456.7 ± 952.4 C2590.8 ± 309.6 B236.2 ± 36.7 B45.6 ± 6.9 C20.8 ± 12 C
Table 4. Nitrogen use efficiency for maize under different proportions of organic fertilizer replacing base chemical fertilizer. T1: Chemical fertilizer applied alone; T2: 50% organic fertilizer replacing basal application of chemical fertilizer; T3: 37.5% organic fertilizer replacing basal application of chemical fertilizer; T4: No fertilizer application. PFP, AE, FCR refer to Partial factor productivity of nitrogen fertilizer, Agronomic efficiency of nitrogen fertilizer, Nitrogen fertilizer contribution rate. Different lowercase letters within the same year indicate significant differences among treatments according to the LSD test at p < 0.05. Values are means ± SD (n = 3). Different uppercase letters indicate significant differences among treatments based on the two-year mean values p < 0.05 according to Duncan’s multiple range test.
YearTreatmentPFP (kg/kg)AE (kg/kg)FCR (%)
2021T142.0 ± 1.07 a29.7 ± 1.15 a70.7 ± 0.75 a
T239.7 ± 0.97 b27.1 ± 1.58 b69.1 ± 0.75 ab
T340.6 ± 0.28 b28.3 ± 1.52 ab69.7 ± 0.21 b
2022T128.6 ± 1.2 ab14.9 ± 1 b52.2 ± 1.9 b
T227.1 ± 1.4 b13.5 ± 1.1 b49.5 ± 2.6 b
T331.9 ± 0.8 a18.3 ± 1.4 a57.3 ± 1.1 a
AverageT135.3 ± 7.5 A22.3 ± 8.3 A61.5 ± 10.3 A
T233.4 ± 7.1 A20.3 ± 8 A59.3 ± 10.9 A
T336.3 ± 4.8 A23.3 ± 5.6 A63.5 ± 6.9 A
Disclaimer/Publisher’s Note: The statements, opinions and data contained in all publications are solely those of the individual author(s) and contributor(s) and not of MDPI and/or the editor(s). MDPI and/or the editor(s) disclaim responsibility for any injury to people or property resulting from any ideas, methods, instructions or products referred to in the content.