Article

Design and Evaluation of a High-Speed Airflow-Assisted Seeding Device for Pneumatic Drum Type Soybean Precision Seed Metering Device

Nanjing Institute of Agricultural Mechanization, Ministry of Agriculture and Rural Affairs, Nanjing 210014, China
*
Author to whom correspondence should be addressed.
Agronomy 2025, 15(9), 2202; https://doi.org/10.3390/agronomy15092202
Submission received: 16 August 2025 / Revised: 8 September 2025 / Accepted: 13 September 2025 / Published: 16 September 2025
(This article belongs to the Section Precision and Digital Agriculture)

Abstract

To improve the uniformity and precision of soybean seeding, this study designed a high-speed airflow-assisted seeding system for the pneumatic drum-type high-speed precision seed-metering device. The system accelerates seed delivery through airflow and ensures precise seed placement using a seed press wheel. Computational Fluid Dynamics (CFD) and Discrete Element Method (DEM) coupling simulations were employed to analyze the seed motion trajectory, collision process, and velocity changes. Key design parameters of the airflow-assisted delivery system were optimized, including a tube diameter of 16 mm, a curved section radius of 80 mm, a seed delivery angle of 33.65°, and a press wheel diameter of 254 mm. The simulation results indicated that the relative position between the seed delivery tube and the seed drum significantly impacts seed trajectory and uniformity. Lowering the tube to align with the seed velocity direction minimized collisions and enhanced seed spacing consistency during high-speed operation. Increasing inlet air pressure improved seed distribution uniformity by accelerating seeds within the tube, reducing travel time and collisions; a 500 Pa pressure increase raised the maximum flow velocity by approximately 5 m/s. However, seed acceleration exhibited diminishing returns: pressure increase from 2.5 kPa to 3.5 kPa increased seed speed by 2.1 m/s, while a further increase to 4.5 kPa only added 1.1 m/s. The optimal inlet pressure for efficient energy transfer and seed acceleration was approximately 3.5 kPa. The press wheel played a crucial role by dispersing the impact force when seeds contact the soil, which achieved high capture rates above 94.0% across the seed drum rotary speed range of 11 to 19 rpm. This research provides theoretical and experimental support for the optimization of high-speed airflow-assisted seeding systems, offering significant practical value for large-scale agricultural production by enhancing seeding efficiency and quality.

1. Introduction

Soybean (Glycine max), as the fourth largest staple crop in China, plays a crucial role in safeguarding national food security and economic development [1,2]. According to statistics, China’s soybean consumption has reached a staggering 107 million metric tons in recent years, with over 90% imported from countries like the United States and Brazil [3,4,5]. Against the backdrop of the Russia–Ukraine conflict and Sino–US trade frictions, the soybean import–export landscape has deteriorated, making boosting domestic soybean production an urgent strategic imperative [6]. High-speed precision seeding enhances yield through improved plant spacing uniformity, resulting in optimized resource distribution and reduced interplant competition [7,8,9,10]. The core of high-speed precision seeding lies in its precision seeding system, which primarily consists of two key components: the seed metering device and the seed delivery mechanism. Currently, high-performance soybean seed metering devices have reached relative maturity. Thus, the critical bottleneck in enhancing seeding quality resides in the seed delivery phase, particularly the precision of seed release. This factor decisively influences overall seeding uniformity and precise field spacing control [11]. At present, seed delivery predominantly relies on conventional seed tubes. Under low-speed operating conditions, their performance suffices for basic requirements. However, as operational speeds increase, the limitations of this structure become increasingly prominent: under high-speed conditions, seeds frequently collide with the tube walls and experience “bounce misalignment” upon landing in the furrow. These misalignments lead to uneven seed distribution, severely limiting high-speed seeding performance [12,13,14].
To address high-speed delivery challenges, numerous researchers and institutions have explored optimized delivery systems, which can be categorized into three main types (Table 1). The first type is the mechanical belt-type delivery system: Precision Planting (USA) developed the SpeedTube, a belt-driven system that uses fingers to transfer seeds from the metering device into partitioned compartments on a moving belt. The seeds are transported synchronously to the drop point, ensuring precise placement in the furrow. The key innovation is real-time synchronization of belt speed with both the seed disc rotation and ground speed, maintaining uniform seed spacing across varying operational speeds [15]. Liu et al. proposed a zoned seed delivery device based on a secondary seeding principle, reducing seed collisions with the seedbed through simulation studies [11]. The second type is the brush belt-type delivery system: John Deere (USA) designed a brush belt system where seeds are guided from the seed disc into the brush belt via a fluted wheel. By adjusting the brush belt speed, the horizontal velocity component of falling seeds is neutralized, achieving near-zero relative velocity seed drop (zero-speed seeding), thereby improving uniformity [16]. Du and Liu developed a brush belt mechanism that gently and synchronously guides cleaned seeds to the seed disc, enhancing distribution uniformity [17]. The third type is the airflow-assisted delivery system: Liu Rui et al. designed a positive-pressure airflow-assisted delivery system based on the Venturi principle, employing DEM-CFD coupled simulations to optimize the system for zero-speed seeding. By analyzing airflow fields and seed ejection velocities, they determined critical structural parameters (infeed chamber, mixing chamber, delivery chamber) and optimized the delivery tube curvature, improving seeding quality at high speeds [18]. Although mechanical and brush belt systems improve seed transport orderliness and uniformity at high speeds, they necessitate precise coordination between belt and seed disc velocities, depend on motor-driven mechanisms, and are susceptible to failure in complex field conditions. In contrast, existing airflow-assisted systems lack a seed press mechanism, resulting in residual horizontal seed velocity under air pressure fluctuations, which undermines seeding stability and uniformity.
To overcome these limitations, this study proposes an “airflow-assisted seed delivery + press wheel seed locking” method. By synergizing high-speed airflow acceleration with precise press wheel positioning, this approach actively eliminates trajectory deviations caused by seed-tube collisions and seed-furrow impacts, even at extremely high seed velocities, thereby mitigating spacing errors and improving seeding quality. Methodologically, this study employs CFD-DEM coupled simulations to investigate the underlying mechanisms of airflow-assisted high-speed seeding. Rigorous comparisons between simulation and experiment will validate the feasibility and effectiveness of the proposed soybean seed delivery system. This research aims to establish a theoretical foundation for advancing airflow-assisted high-speed seeding technology.

2. Materials and Methods

2.1. Structure and Working Principle of the Seeding System

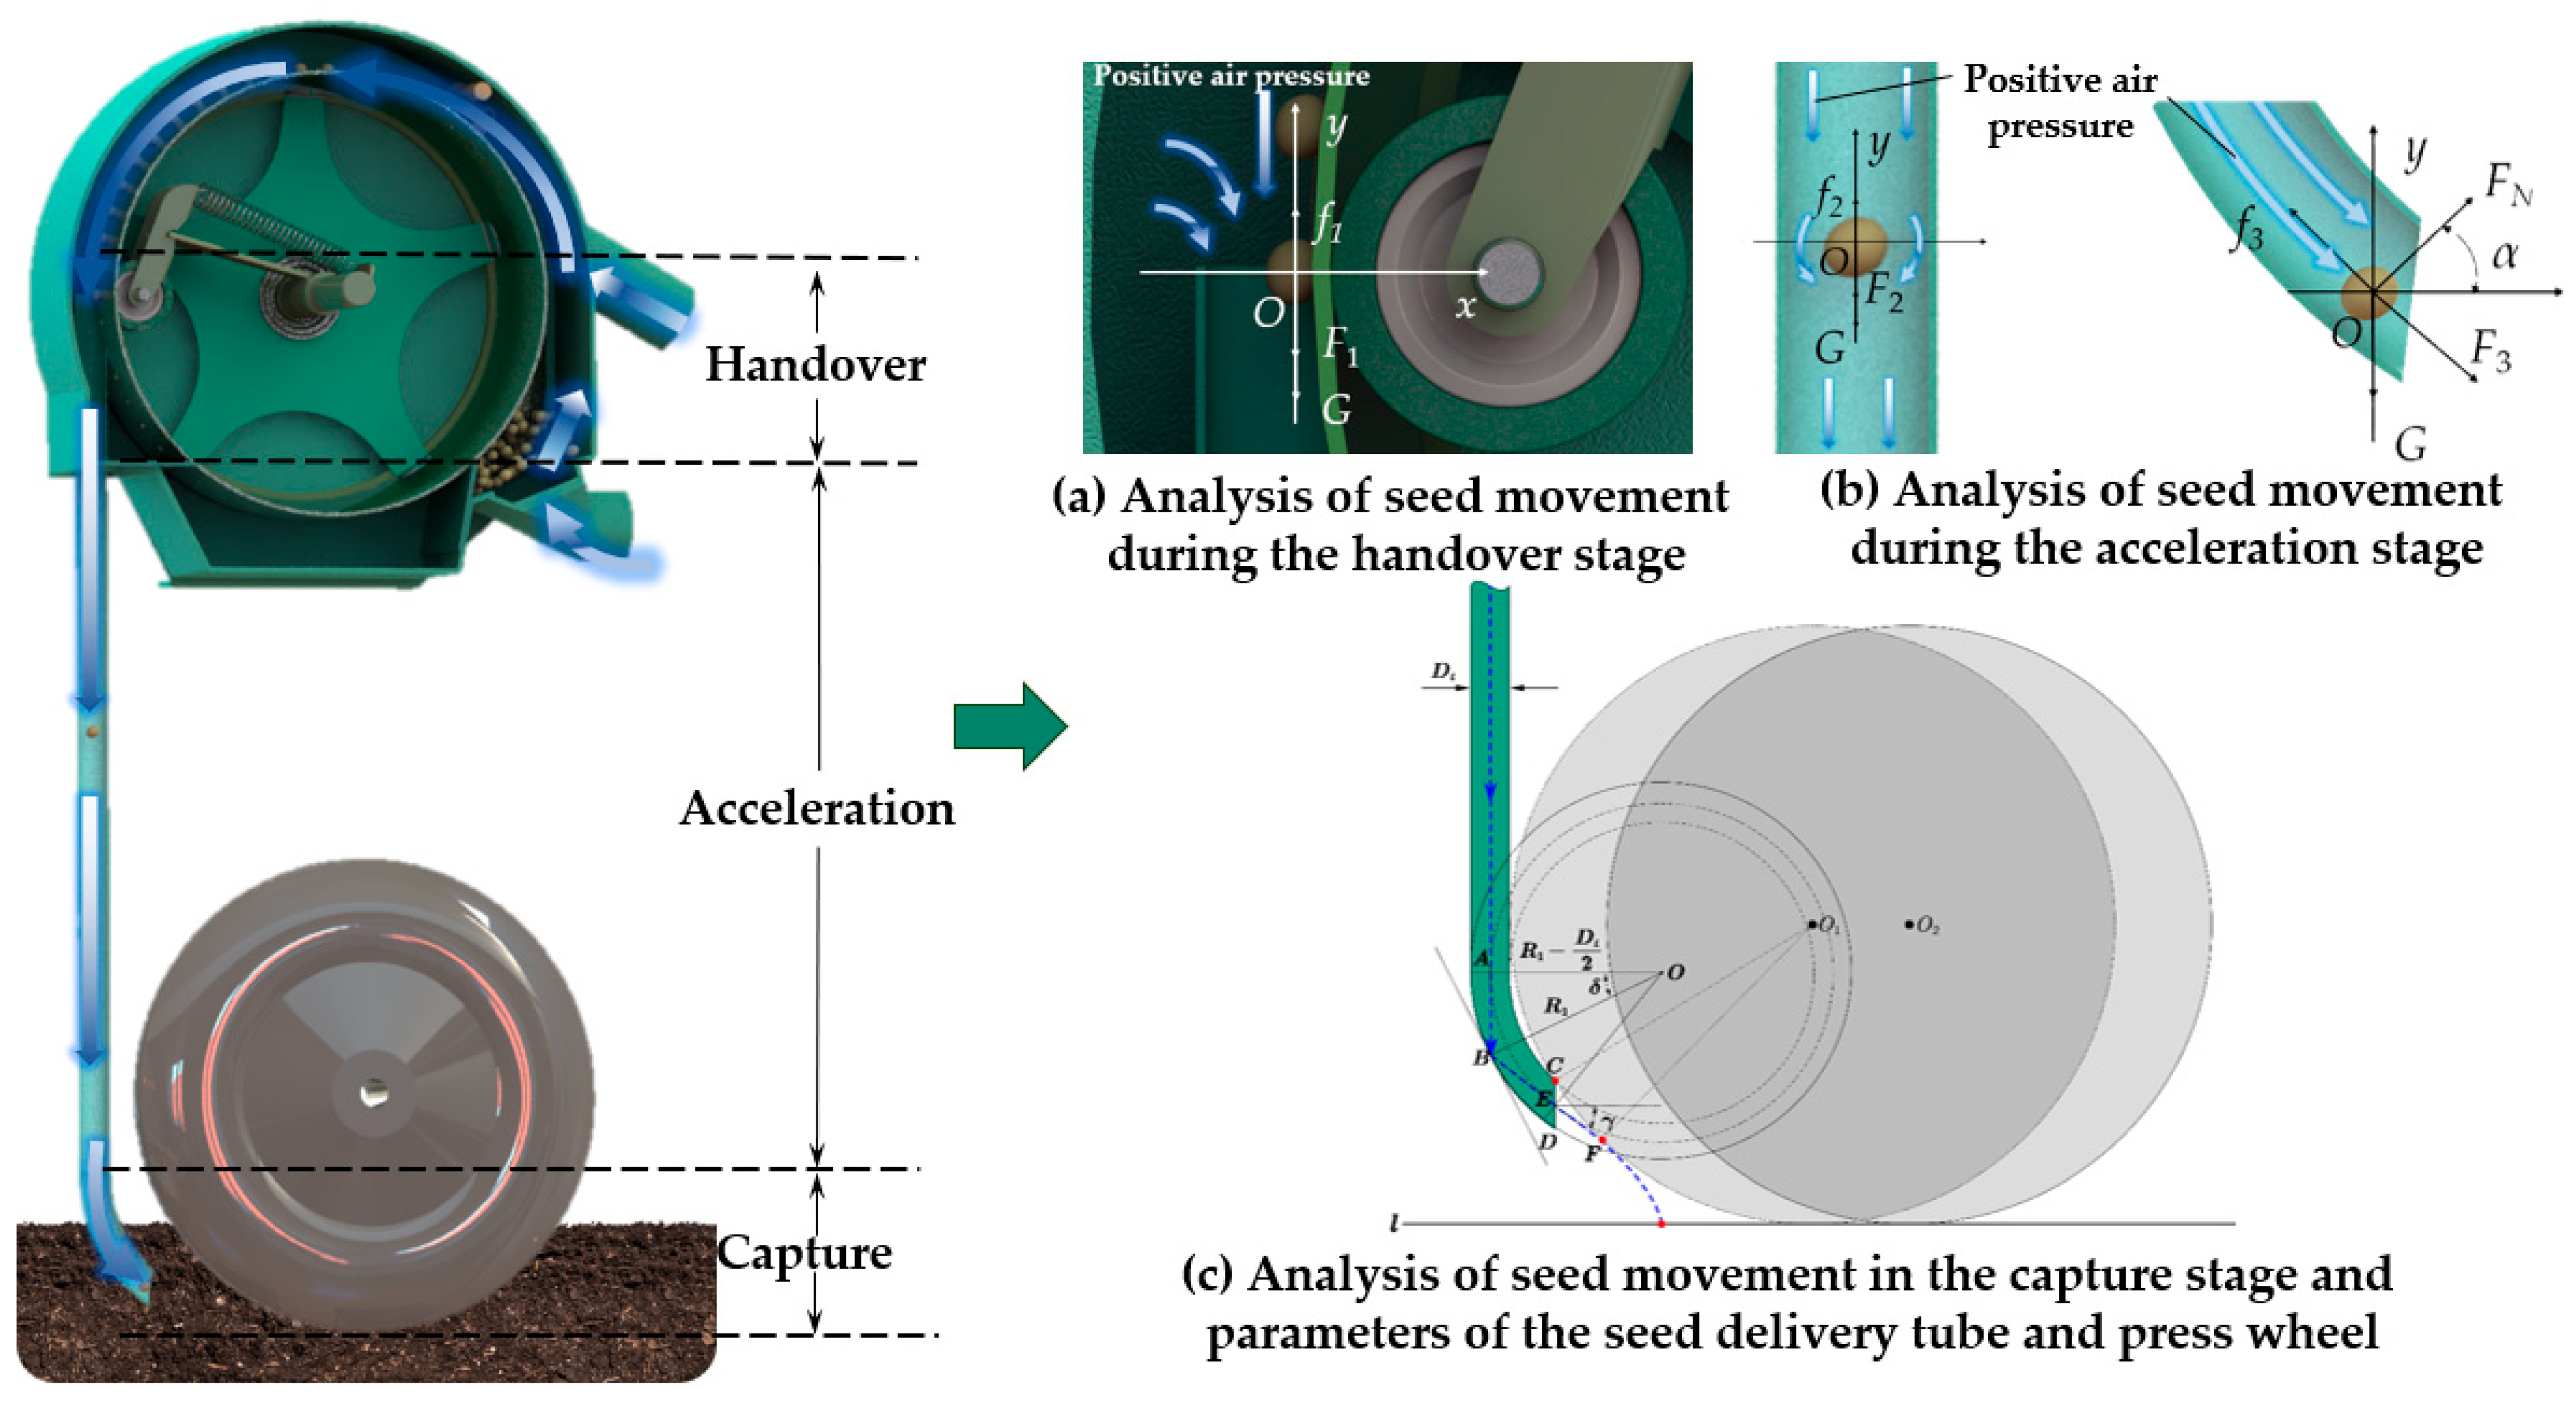
The soybean precision seeding system primarily consists of a pneumatic roller-type precision seed metering device and an airflow-assisted seed delivery device. The pneumatic roller-type high-speed precision seed metering device (Figure 1) is composed of components such as housing cover, seed drum, seed cleaning device, air inlet, air delivery pipe, seed box, and pressure relief wheel. The seed cleaning device is mounted on the housing cover, while the pressure relief wheel is installed via a bracket at the rotating shaft and contacts the seed drum. This seed drum, fixed to the rotating shaft by a connecting bracket, undergoes rotary motion. The airflow-assisted seed delivery device, comprising a seed delivery tube (including straight sections and curved sections) and a seed press wheel, completes the assembly. During operation, soybean seeds enter through the seed box by gravity, forming a controlled seed layer behind a baffle plate. Positive-pressure airflow enters via the air inlet and air delivery pipe, establishing a pressure differential across holes on the seed drum surface. As the seed drum rotates, seeds adhere to the holes through this pressure difference when passing through the seed population. Subsequent rotation brings seeds to the seed cleaning device, where excess seeds are removed and returned to the filling zone, ensuring single-seed retention per hole. Near the discharge port, sealing with the pressure relief wheel eliminates the pressure differential, releasing seeds into the airflow for transport to the seed furrow by the seed delivery tube. Finally, the seed press wheel captures and positions seeds accurately, thereby achieving precise high-speed seeding.

2.2. Kinematic Mechanism Analysis of Soybean Seeds Delivery Process

The seed deposition process comprises three sequential stages: handover, acceleration, and capture. Seeds discharged from the metering device first enter the delivery tube, traverse its straight and curved sections, and exit near the ground surface where they are subsequently pinned by the seed press wheel. The trajectory within the tube and the kinematic parameters (e.g., velocity, angle) at the point of tube exit critically determine the final seed placement location, thereby informing the optimal spatial relationship between the press wheel and delivery tube. Consequently, analyzing the dynamic forces and motion trajectories during seed discharge and pressing provides a theoretical foundation for identifying key operational parameters governing press wheel performance. During pneumatic seed conveyance, adjacent seeds exhibit aerodynamic interference when separation distances fall below critical thresholds, altering the airflow resistance acting on each seed. Based on the theory of Stokes number in particle-fluid two-phase flow and the mechanical characteristics of particle motion, interference becomes negligible when the seed-to-seed spacing ratio exceeds 2.5 times the seed diameter [19,20,21]. Hence, this study exclusively models the pneumatic transport behavior of individual seeds.

2.2.1. Analysis of the Handover Process When Seeds Leave the Seed Metering Device

At the seed discharge outlet, the interaction with the pressure relief wheel eliminates the pressure differential across the seed-filling holes. The kinematic and dynamic analysis of soybean seeds at this stage is illustrated in Figure 2a. The force analysis of soybean seeds at the entrance of the seed delivery tube is presented in Equation (1).
Σ y = G + F 1 f 1
where G is the gravitational force acting on soybean seeds (N); f1 is the resistance of the soybean seed (N); and F1 is the pressure acting on soybean seeds at the seed discharge port (N). The F1 value can be derived through a hydrodynamic analysis of seeds: The flow field surrounding the seed delivery tube forms a hemispherical volume centered approximately at point O (selected as a reference point on the centerline of the seed outlet). This hemisphere is composed of numerous equipotential surfaces. On each equipotential surface, the airflow velocity can be considered approximately uniform, with magnitude dependent solely on the radial distance from the center point O. Consequently, the volumetric airflow rate through any given equipotential surface (Q, m3/s) can be expressed as the following equation:
Q = 2 π R 2 u R
where R is the distance between the equipotential surface and the center of the flow field (m); and uR is the velocity of the airflow (m/s). Assuming that the air is incompressible and the air density near the seed discharge port remains unchanged, and according to the fluid mechanics mass conservation equation, at any time, the airflow rate flowing through any hemispherical equipotential surface is equal to the airflow rate passing through the seed discharge tube. Then, the value of uR at a distance R from the center of the flow field can be obtained using Equation (3), and the value of F1 at the seeding port can be calculated using Equation (4).
u R = d h 2 8 R 2 2 Δ p ρ
F 1 = C d π d s 2 d h 2 Δ p 256 R 4
where Δp is the static pressure difference between the flow field center and the flow field edge (Pa); ρ is the air density (kg/m3); Cd is the dimensionless drag coefficient, which is related to seed shape, surface condition, and Reynolds number; dh is the diameter of the drum’s holes (m); and ds is the diameter of the seed (m). Compared with air pressure, soybeans are only slightly affected by gravity and viscous resistance. Here, ignoring the effects of gravity and viscous resistance [22], Equation (1) can be rewritten as Equation (5):
Σ y = F 1
In order to facilitate the analysis of the seeding process, the soybean seed model was simplified into a sphere. When the seeds leave the seed drum, the velocity is mainly composed of the initial velocity and the velocity of the driving airflow [23]. The velocity of soybean seeds can be calculated using Equation (6):
a = 6 F 1 π d s 3 ρ 1 v 0 = ω r + a t ω = 2 π n
where ρ1 is the density of soybean seeds (kg/m3); v0 is the seed speed (m/s); ω and r are the angular velocity (rad/s) and radius (m) of the seed drum, respectively; a is the acceleration (m/s2); t is the time (s); and n is the rotational speed of the seed drum (r/s).

2.2.2. Analysis of the Acceleration Process of Seeds in the Seed Delivery Tube

  • Analysis of seed movement in the straight section of the seed delivery tube
In the straight section of the seed delivery tube, soybeans are jointly affected by the thrust force F2 of the airflow (N), gravity G, and viscous resistance f2 (Figure 2b). Due to the relatively high speed of the seeds, the influences of gravity and air resistance are ignored; here, soybean seeds move after t time, and the acceleration equation is as follows:
F 2 = π d s 2 ρ 1 6 d v 1 d t
where v1 is the velocity of soybean seeds (m/s). The aerodynamic thrust equation is as follows:
F 2 = C d π ρ d s 2 8 v k v 1 2
where vk is the airflow velocity after positive pressure acceleration. According to the above formula, the differential equation of the characteristic aerodynamic acceleration of soybean seeds in positive pressure accelerated airflow is as follows:
d v 1 d t = 3 C d ρ 4 d s ρ 1 ( v k v 1 ) 2 d l d t = 4 v 1 d s ρ 1 3 C d ρ ( v k v 1 ) 2
where l is the movement distance of the seed at time t (m). It can be known from the above formula that the greater the relative velocity difference between the positive pressure accelerating airflow velocity and the seed movement velocity, the more favorable it is for the pneumatic acceleration of soybean seeds. Although the length of the straight seed tube is relatively short, if the value of the relative velocity is relatively large, then the accelerating effect of the high-speed airflow on the seeds is still relatively obvious.
2.
Analysis of seed movement in the curve section of the seed delivery tube
It can be seen from Figure 2c that the seed will collide with the curved tube. It is assumed that the principle of mirror image collision is satisfied; that is, the motion trajectory after the collision is symmetrical, and the collision angle is also symmetrical. In order to ensure that seeds of different sizes can all be ejected from the seed delivery tube, the ejection point is preferably at the center of the curved tube. Based on this design criterion, the angle and diameter of the curved tube are determined. However, in the actual seed metering process, after soybean seeds enter the curved tube, they will move along the seed delivery tube. This is because the boundary layer effect generated by air viscosity subjects the seeds to a lateral drag force, the friction between the seeds and the tube wall hinders their rebound, and the delivery field formed by the airflow at the curved part of the tube pushes the seeds. Under the combined action of multiple factors, the seeds tend to continue moving along the seed delivery tube. The equation of motion for the seeds in the curved tube can be derived based on Newton’s second law:
m a = G + F 3 + f 3 + F N
in which
F 3 = F 2
f 3 = μ F N
where F3 is the thrust force of the airflow (N); μ is the coefficient of friction between the seeds and the tube wall; F N is the normal pressure exerted by the seeds on the tube wall (N); and R 1 is the trajectory radius of seeds in the curved section (m). When seeds collide with the tube wall, the normal pressure F N is the following:
F N = m v 1 2 R 1 + G cos α
where α is the angle between the seed velocity direction line and the horizontal line. With a steel–soybean static friction coefficient μ = 0.27 (Table 1), radii R1 < 70 mm cause sliding instability (FN > μG), while R1 > 90 mm induces airflow separation. Therefore, the R1 value in this study was determined to be 80 mm.
Ideally, the seed falls to the bending point B and collides, undergoing specular reflection before exiting the tube along the direction BE. If the seed can pass through the center of the bend (point E) and be ejected, the probability of the seed colliding again with the tube wall is minimized, which is more beneficial for improving the stability of seed spacing. Based on this condition, the seed delivery angle is described and shown in Figure 2c. By solving the triangle OAB, the optimal seed delivery angle γ can be calculated, and its formula is the following:
γ = 90 2 arccos R 1 D t 2 R 1
D t = k d max
Here, Dt is the diameter of the seed tube, k is the safety factor, and dmax is the maximum size of the seed’s long axis. The safety factor k generally ranges from 1.5 to 2.5 and is flexibly determined based on seed shape, flowability, and seeding accuracy requirements. For seeds with regular shapes and good flowability, k can be set at 1.5, while for irregular shapes or poor flowability, it can be set at 2.5. In this study, the maximum long-axis size of soybeans is 10.32 mm, and k is set at 1.5. Substituting these values, the calculated Dt is 15.48 mm, which is rounded to 16 mm for practical purposes. By substituting each parameter, γ is calculated to be 33.65°.
3.
Analysis of the process of seeds leaving the tube and being captured by the seed press wheel
The trajectory equation of the seed after leaving the tube is as follows:
D = v 3 t cos γ H = v 3 t sin γ + 1 2 g t 2
where v3 is the velocity of the seed when it leaves the seed delivery tube (m/s); D is the horizontal distance from the seed delivery tube to the point where the seed press wheel touches down (m); and H is the vertical distance from the end of the seed delivery tube to the ground (m). The diameter of the press wheel (Dw) is mainly constrained by the following factors: ① The circle where the press wheel rim is located must be tangent to the ground line l to ensure its ability to press seeds into the soil. ② The end point C of the seed delivery tube is the limit position point for the circle where the press wheel rim is located. Beyond this point, interference will occur between the seed delivery tube and the press wheel. ③ The point F on the parabolic trajectory of the seed after leaving the seed delivery tube is closest to the center of the press wheel. If F is inside the circle where the press wheel rim is located, it will cause a collision between the seed and the press wheel rim, reducing the stability of the seed distance. Therefore, when the circle where the press wheel rim is located passes through points F, C, and is tangent to the ground line l, the diameter of the press wheel reaches its limit value. Through modeling with SolidWorks software 2021 (Dassault Systemes, Velizy-Villacoublay, France), the value of Dw under these conditions is determined to be 254 mm (Figure 2c).

2.3. Numerical Simulation Analysis of the Soybean Precision Seeding System Performance

In the precision seeding system, the seeds exist in a dilute phase flow condition. The high-speed airflow within the seed delivery tube has a remarkable influence on the acceleration effect of soybean seeds, which subsequently affects the seed performance. In this study, the CFD-DEM coupling approach is employed to analyze the posture and velocity variations in soybean seeds within the seed delivery tube, and the relationship between the inlet air pressure and the seed dropping velocity in the tube is investigated.

2.3.1. Establishment of the Simulation Model

  • Meshing of the precision seeding system
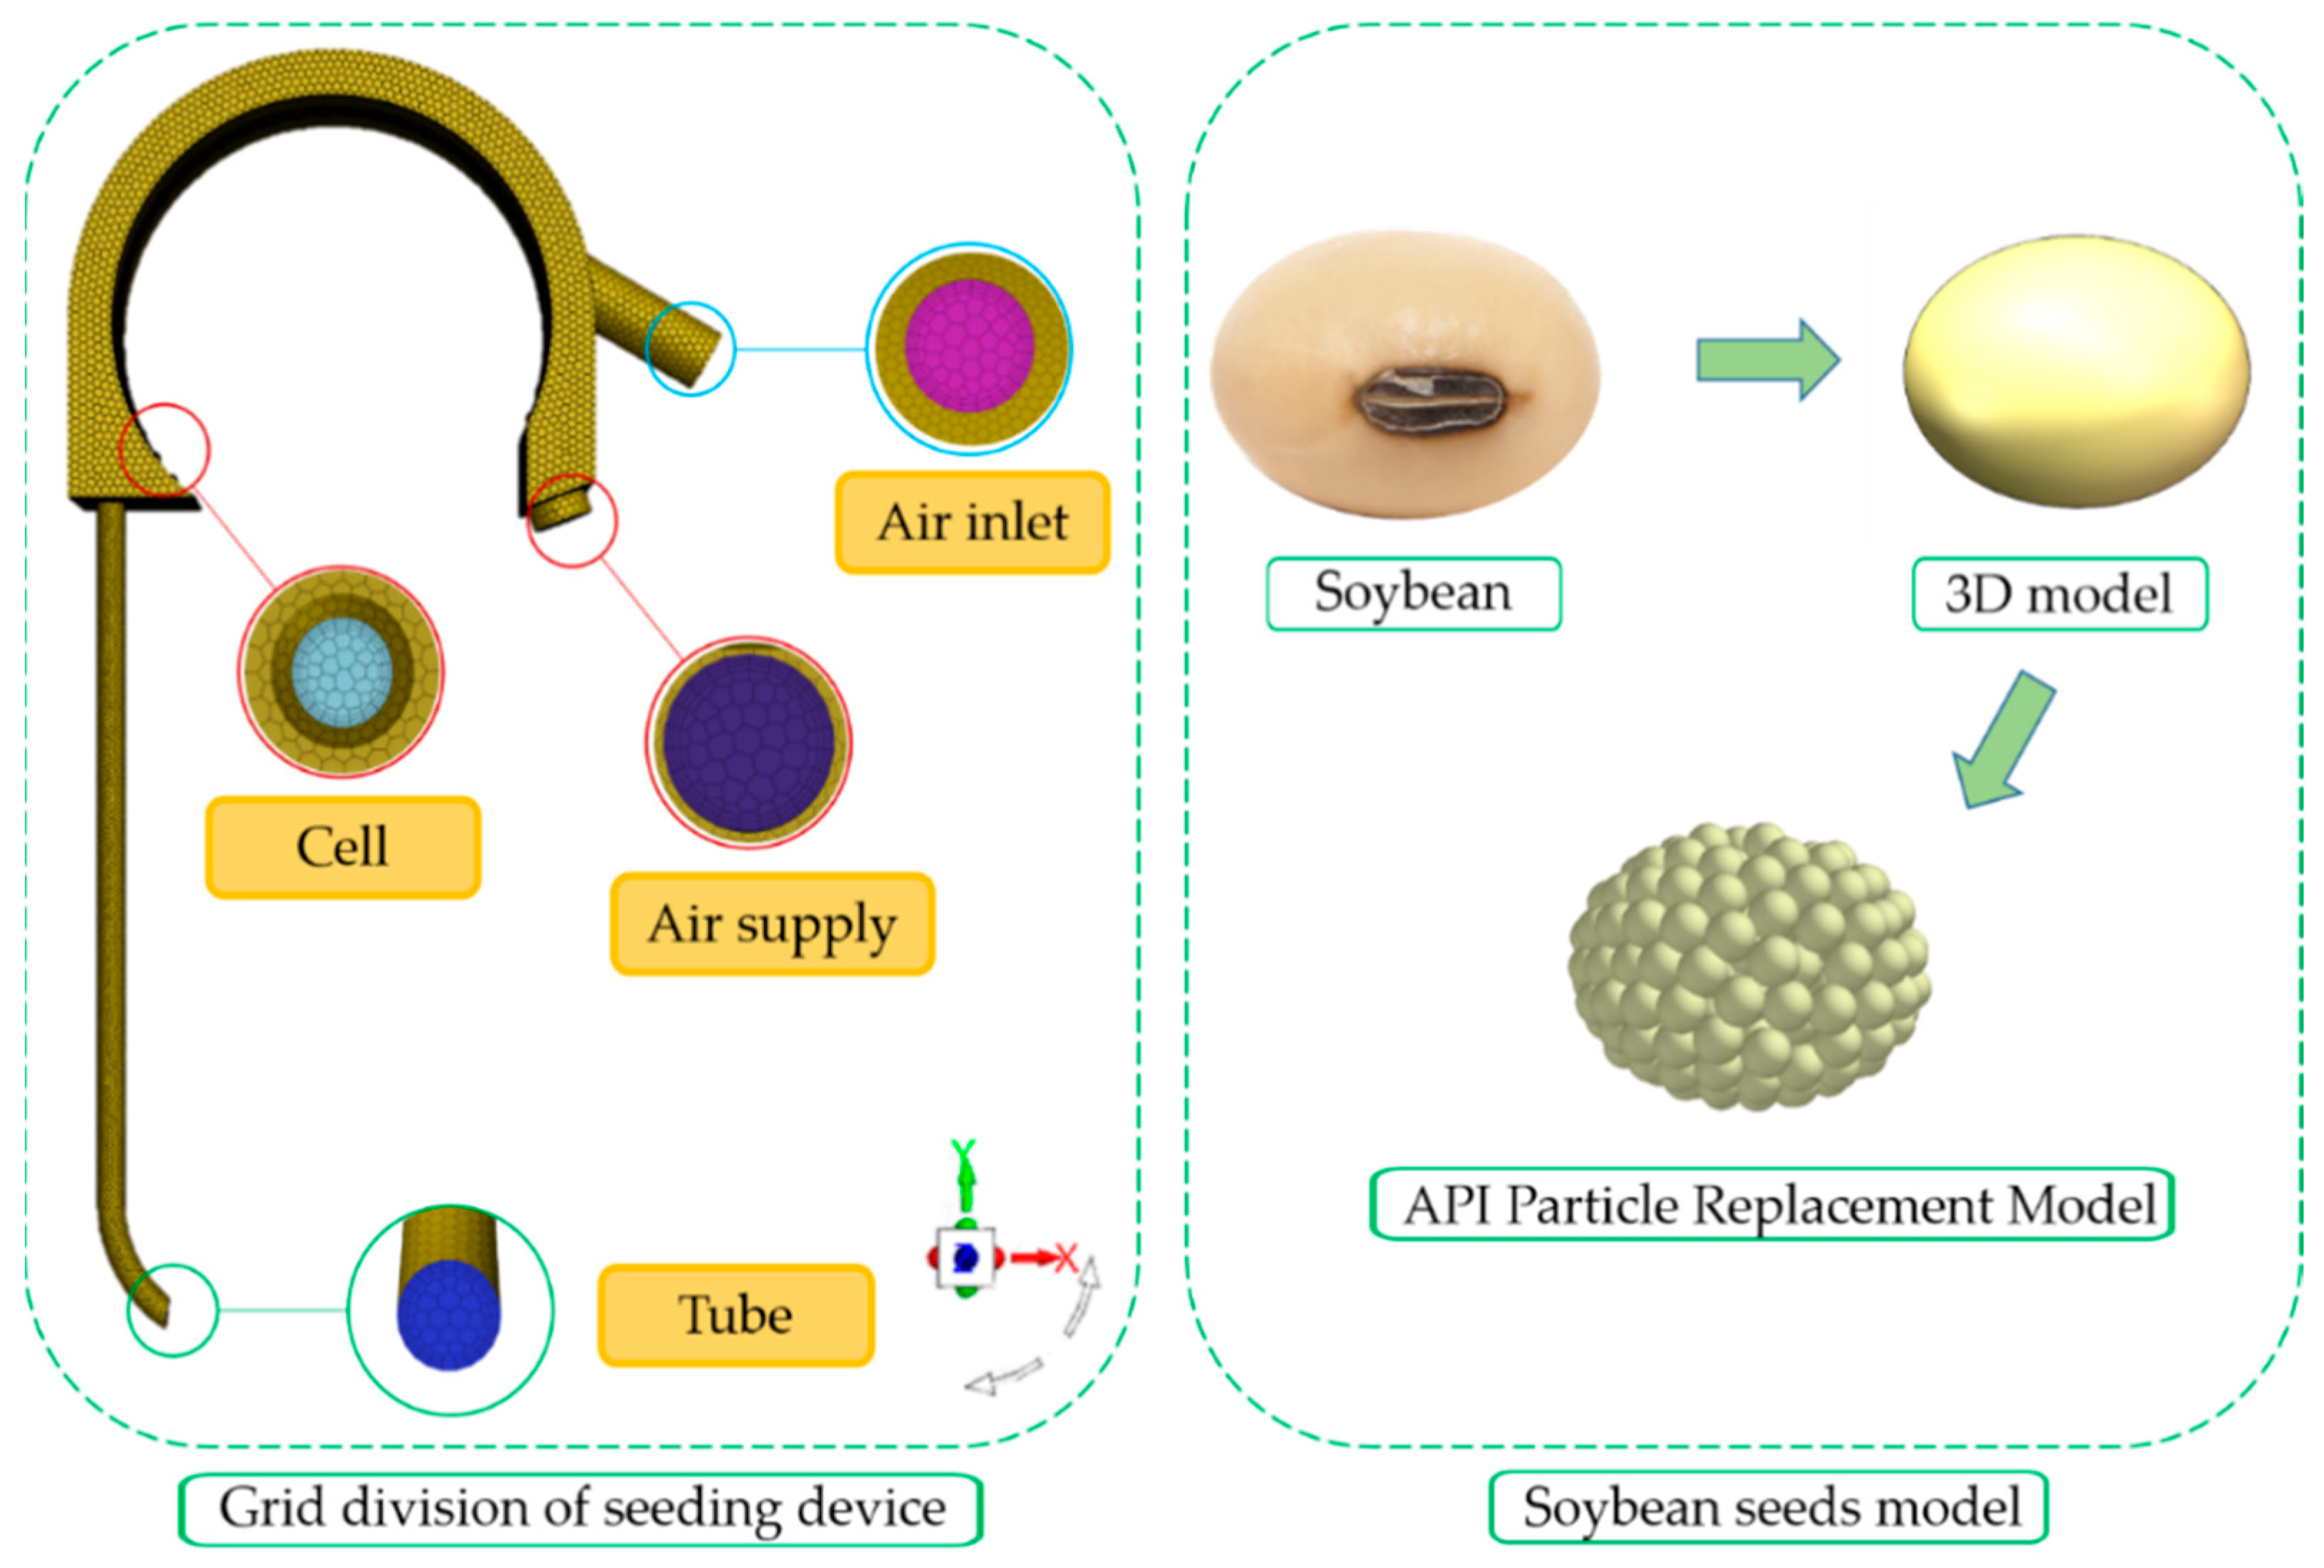
The grid layout of the entire precision seeding system consists of two main parts, namely, (1) the seed metering device and (2) the seed delivery device. The grid model unit is meshed using Fluent 2022 software, with a maximum size of 1.5 × 10⁻² m and a minimum size of 0.5 × 10⁻³ m. When conducting CFD-DEM coupling, the grid model elements are subjected to meshing by means of the Workbench 2022 software. The maximum dimension is set at 5 × 10⁻³ m, and the minimum dimension is 1.5 × 10⁻³ m. The gas–solid coupling simulation software used is EDEM 2022 (DEM Solutions Ltd., Edinburgh, UK) and ANSYS Fluent 2022 (ANSYS, Inc., Canonsburg, PA, USA). For setting the boundary conditions, the air inlet and air supply tube both adopt a pressure inlet. The terminal of the seed delivery is set as a pressure outlet. The gravity direction is set to the negative direction of the Y axis. Fluent uses the standard k-epsilon turbulence model, and EDEM uses the Hertz–Mindlin (no-slip) model.
2.
Construction of the soybean seed simulation model
The soybean seeds were measured with a vernier caliper, and the average values of the three-axis dimensions were calculated to be 8.50 mm, 7.43 mm, and 6.47 mm. The ideal soybean seed model was established using SolidWorks software. The three-dimensional model was imported into EDEM 2022. The discrete element model of soybean seeds was established using the API particle replacement method. In this approach, the complex seed morphology was represented by an assembly of spherical filling particles, each with a radius of 0.5 mm, which collectively approximated the overall shape and volume of the actual soybean seed (as depicted in Figure 3). It is important to note that this representation simplifies the actual seed geometry, which may affect the accuracy of simulated particle-to-particle and particle-to-boundary interactions. But this simplification was necessary to make the large-scale CFD-DEM simulation computationally feasible.
3.
Setting of CFD-DEM simulation parameters
The simulation calculation is carried out by adopting the Eulerian coupling model. Table 2 presents the relevant parameters for the coupling simulation settings and reference documents. The Lagrangian coupling method is selected for the coupling interface, and the rest are set by default. To achieve a satisfactory convergence effect, the time steps of EDEM and CFD are selected as 2 × 10⁻⁵ s and 1 × 10⁻³ s, and the time is 5 s. EDEM and Fluent record data every 1 × 10⁻³ s.

2.3.2. Contents and Methods of Simulation Test

  • Setting of test factors for seed delivery tube position and press wheel seed capture simulation
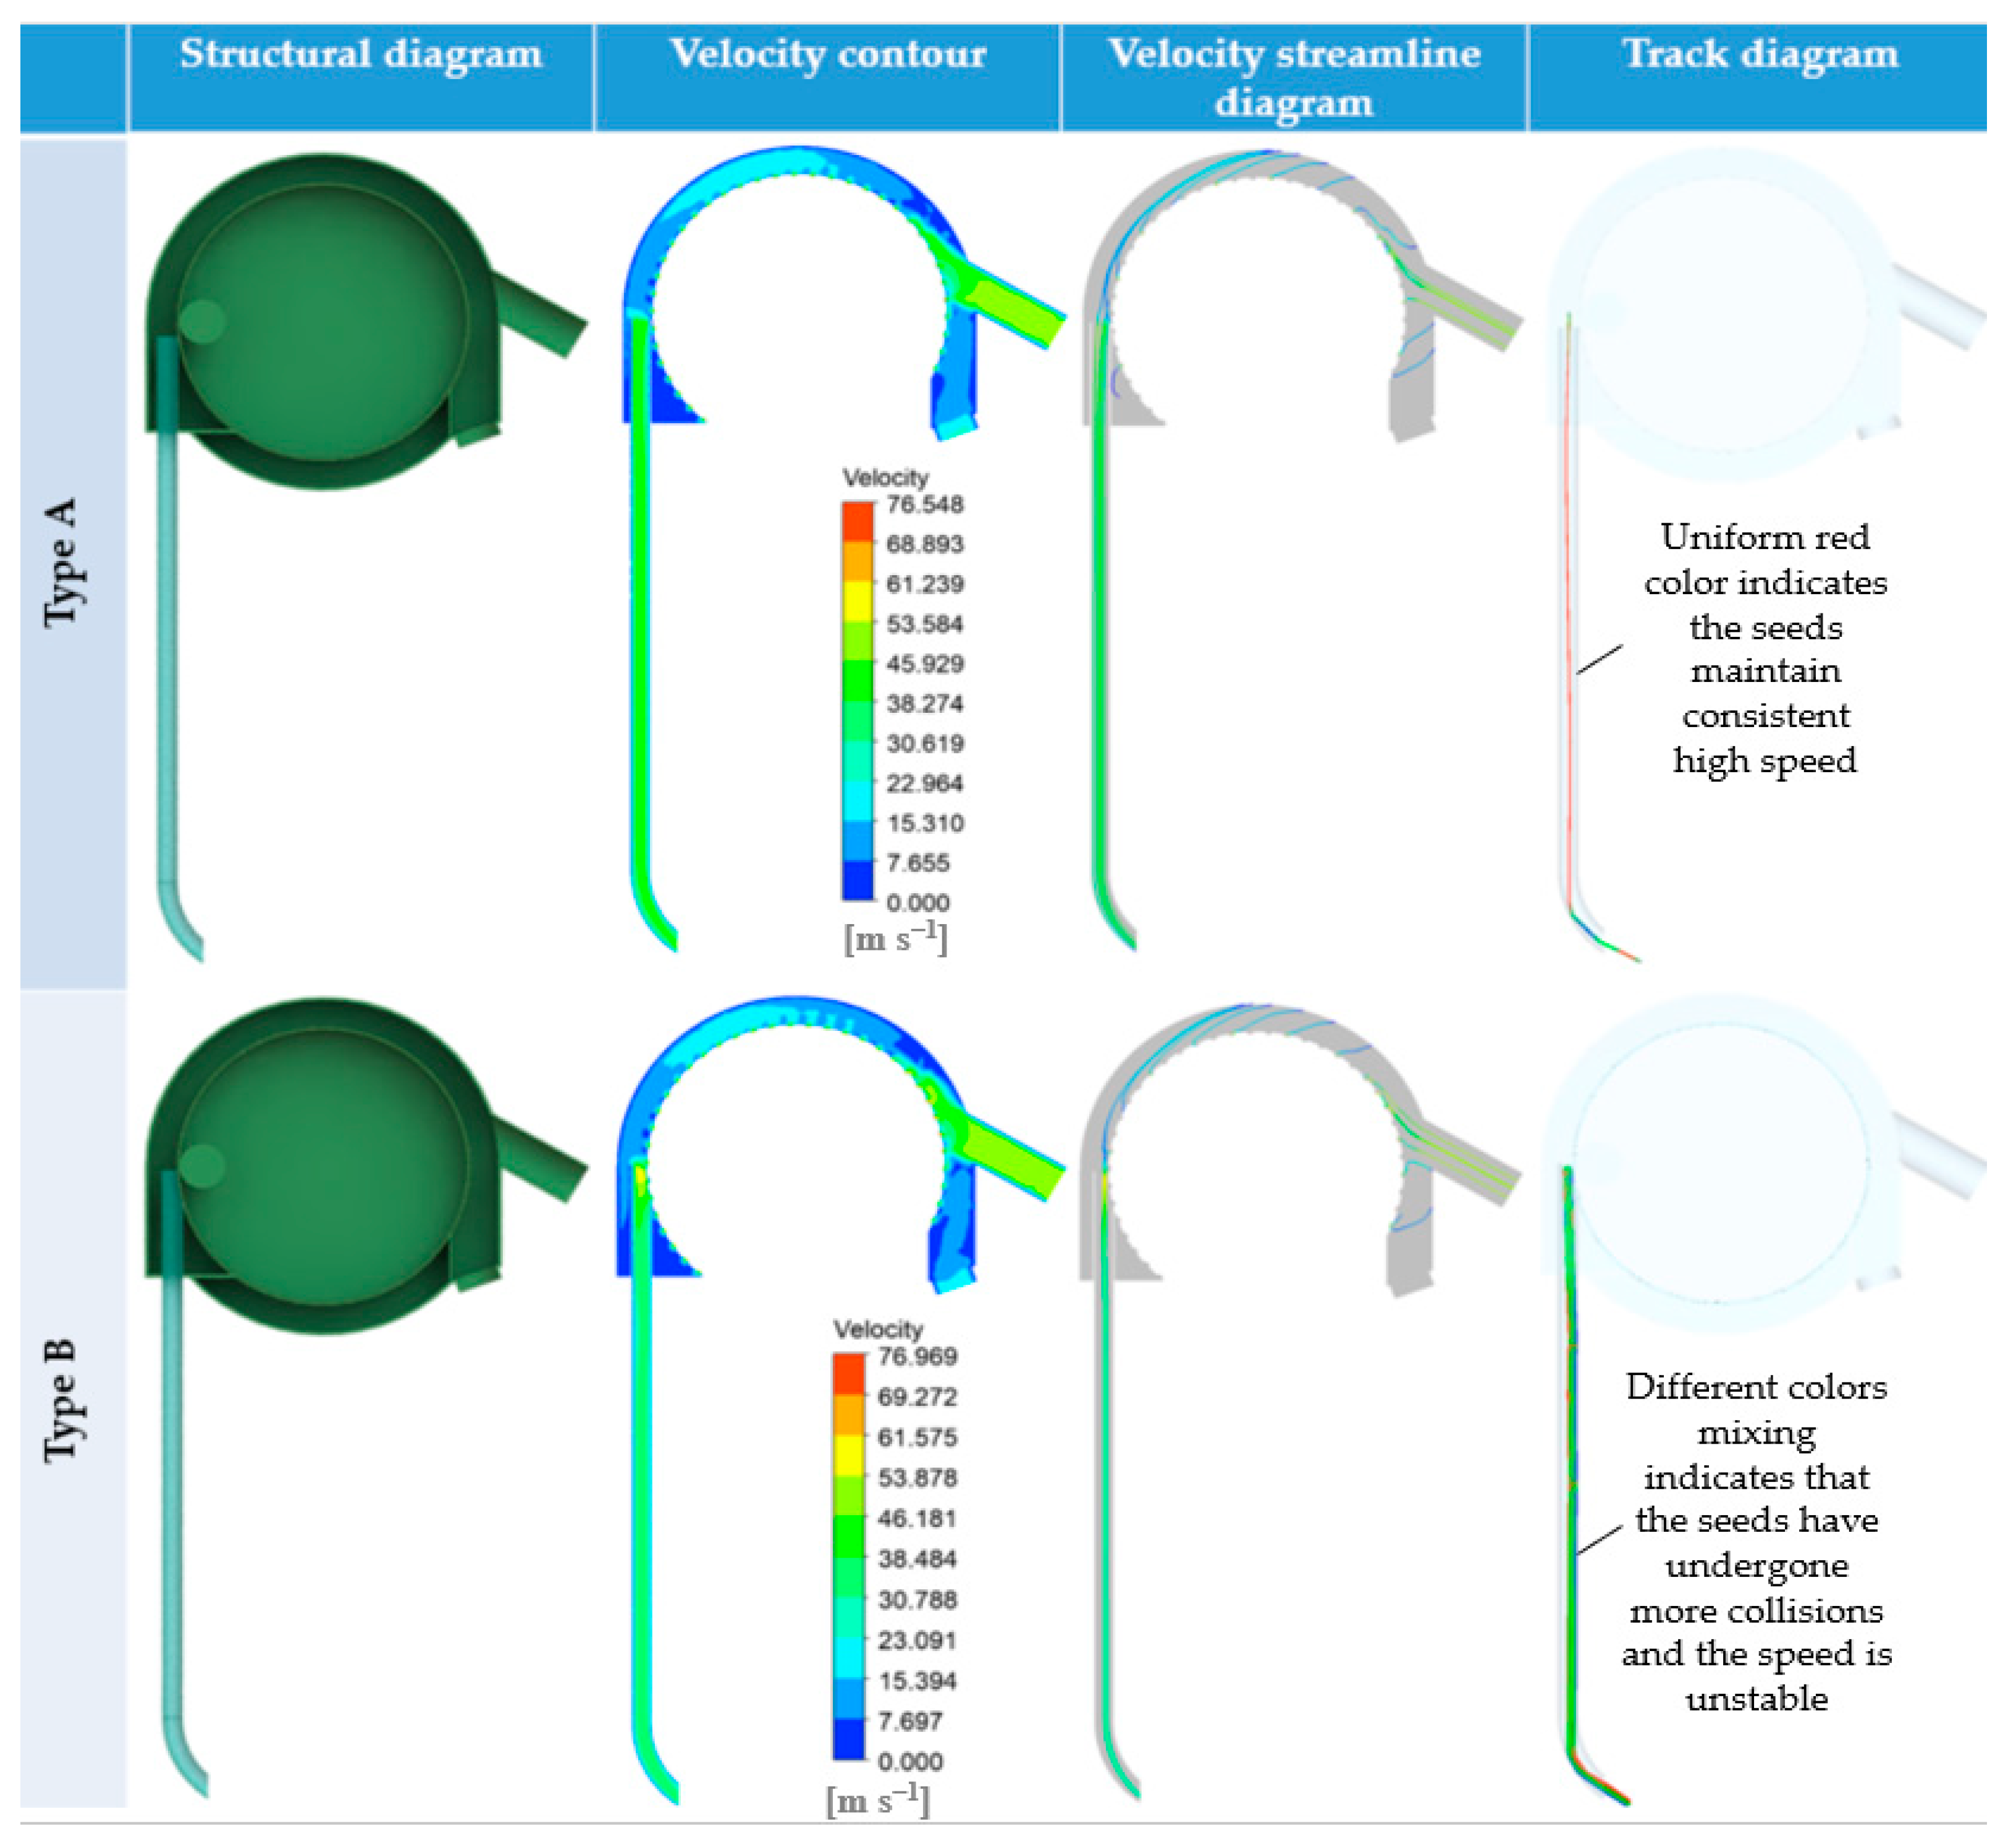
The influence of the relative position between the seed delivery tube and the seed drum on seed transfer was investigated. Using the seed motion trajectory as the evaluation index, a CFD-DEM coupling simulation comparison test was conducted under identical working conditions to verify the impact of this relative position on transfer fluency and trajectory. Two specific configurations were tested: Type A, where the seed delivery tube position was lowered while maintaining its central axis coincident with the seed velocity direction, and Type B, where the arc at the top of the seed delivery tube was designed to fit the cylinder, also ensuring central axis alignment with the seed velocity direction. For these specific tests, the inlet air pressure was fixed at 3.5 kPa, the air supply tube pressure was set to 0.5 kPa based on prior results, and the seed drum rotation speed was 24 rpm. Additionally, a separate simulation study focused on the seed capture process by the press wheel. A 3D model of the press wheel–soil–seed system, based on actual dimensions, was established. Soil particles and seed particles were modeled using EDEM 2022. This simulation monitored seed trajectories and the probability of capture by the press wheel.
2.
Setting of Factors in the Coupling Simulation Test
Coupled simulation tests are carried out in three cases: ① When the inlet pressure is the same at 3.5 kPa, after the soybean seeds leave the seed drum, they enter the seed delivery tube with a certain initial velocity. The rotational speeds of the seed drum are set at 11, 13, 16, 19, 21, and 24 rpm. ② When the rotational speed of the seed drum is the same at 19 rpm, an analysis is conducted on different inlet pressures under the same seed drum speed. The inlet pressures are set at 2.5, 3.0, 3.5, 4.0, and 4.5 kPa. ③ When the inlet pressure is 3.5 kPa and the rotational speed of the seed drum is 19 rpm, the movement of soybean seeds in the seed delivery tube is accurately simulated through coupled simulation, and the parameters such as the movement speed and time are examined.

3. Results and Discussion

3.1. Analysis of the Influence of Relative Positions of Different Seed Delivery Tubes on Seed Drop Trajectory

Through the comparative observation of Figure 4, we can see that the velocity contour of Type A and Type B was basically not much different. However, at the seed dropping port, a high-speed area was formed at Type B, thus affecting the motion trajectory of the seeds. The velocity streamline diagram of Type A was basically a straight line, while the yellow area of Type B had some bending and was biased towards the side of the drum cell. This was because the high-speed airflow flowed out from the inside of the cell, thus having a certain impact on the trajectory of the seeds. Through the comparison of the trajectory diagrams, it can be observed that, in the seed trajectory diagram of Type B, the seeds moved towards the right side wall of the seed tube and had a collision. This would cause movement variation in the seeds due to the collision and reduce the consistency of the seed spacing in high-speed operation. Therefore, the structural method of Type A was adopted in the subsequent tests.

3.2. Analysis of Single Factor Coupling Results

  • Analysis of different seed drum rotational speeds at the same inlet pressure
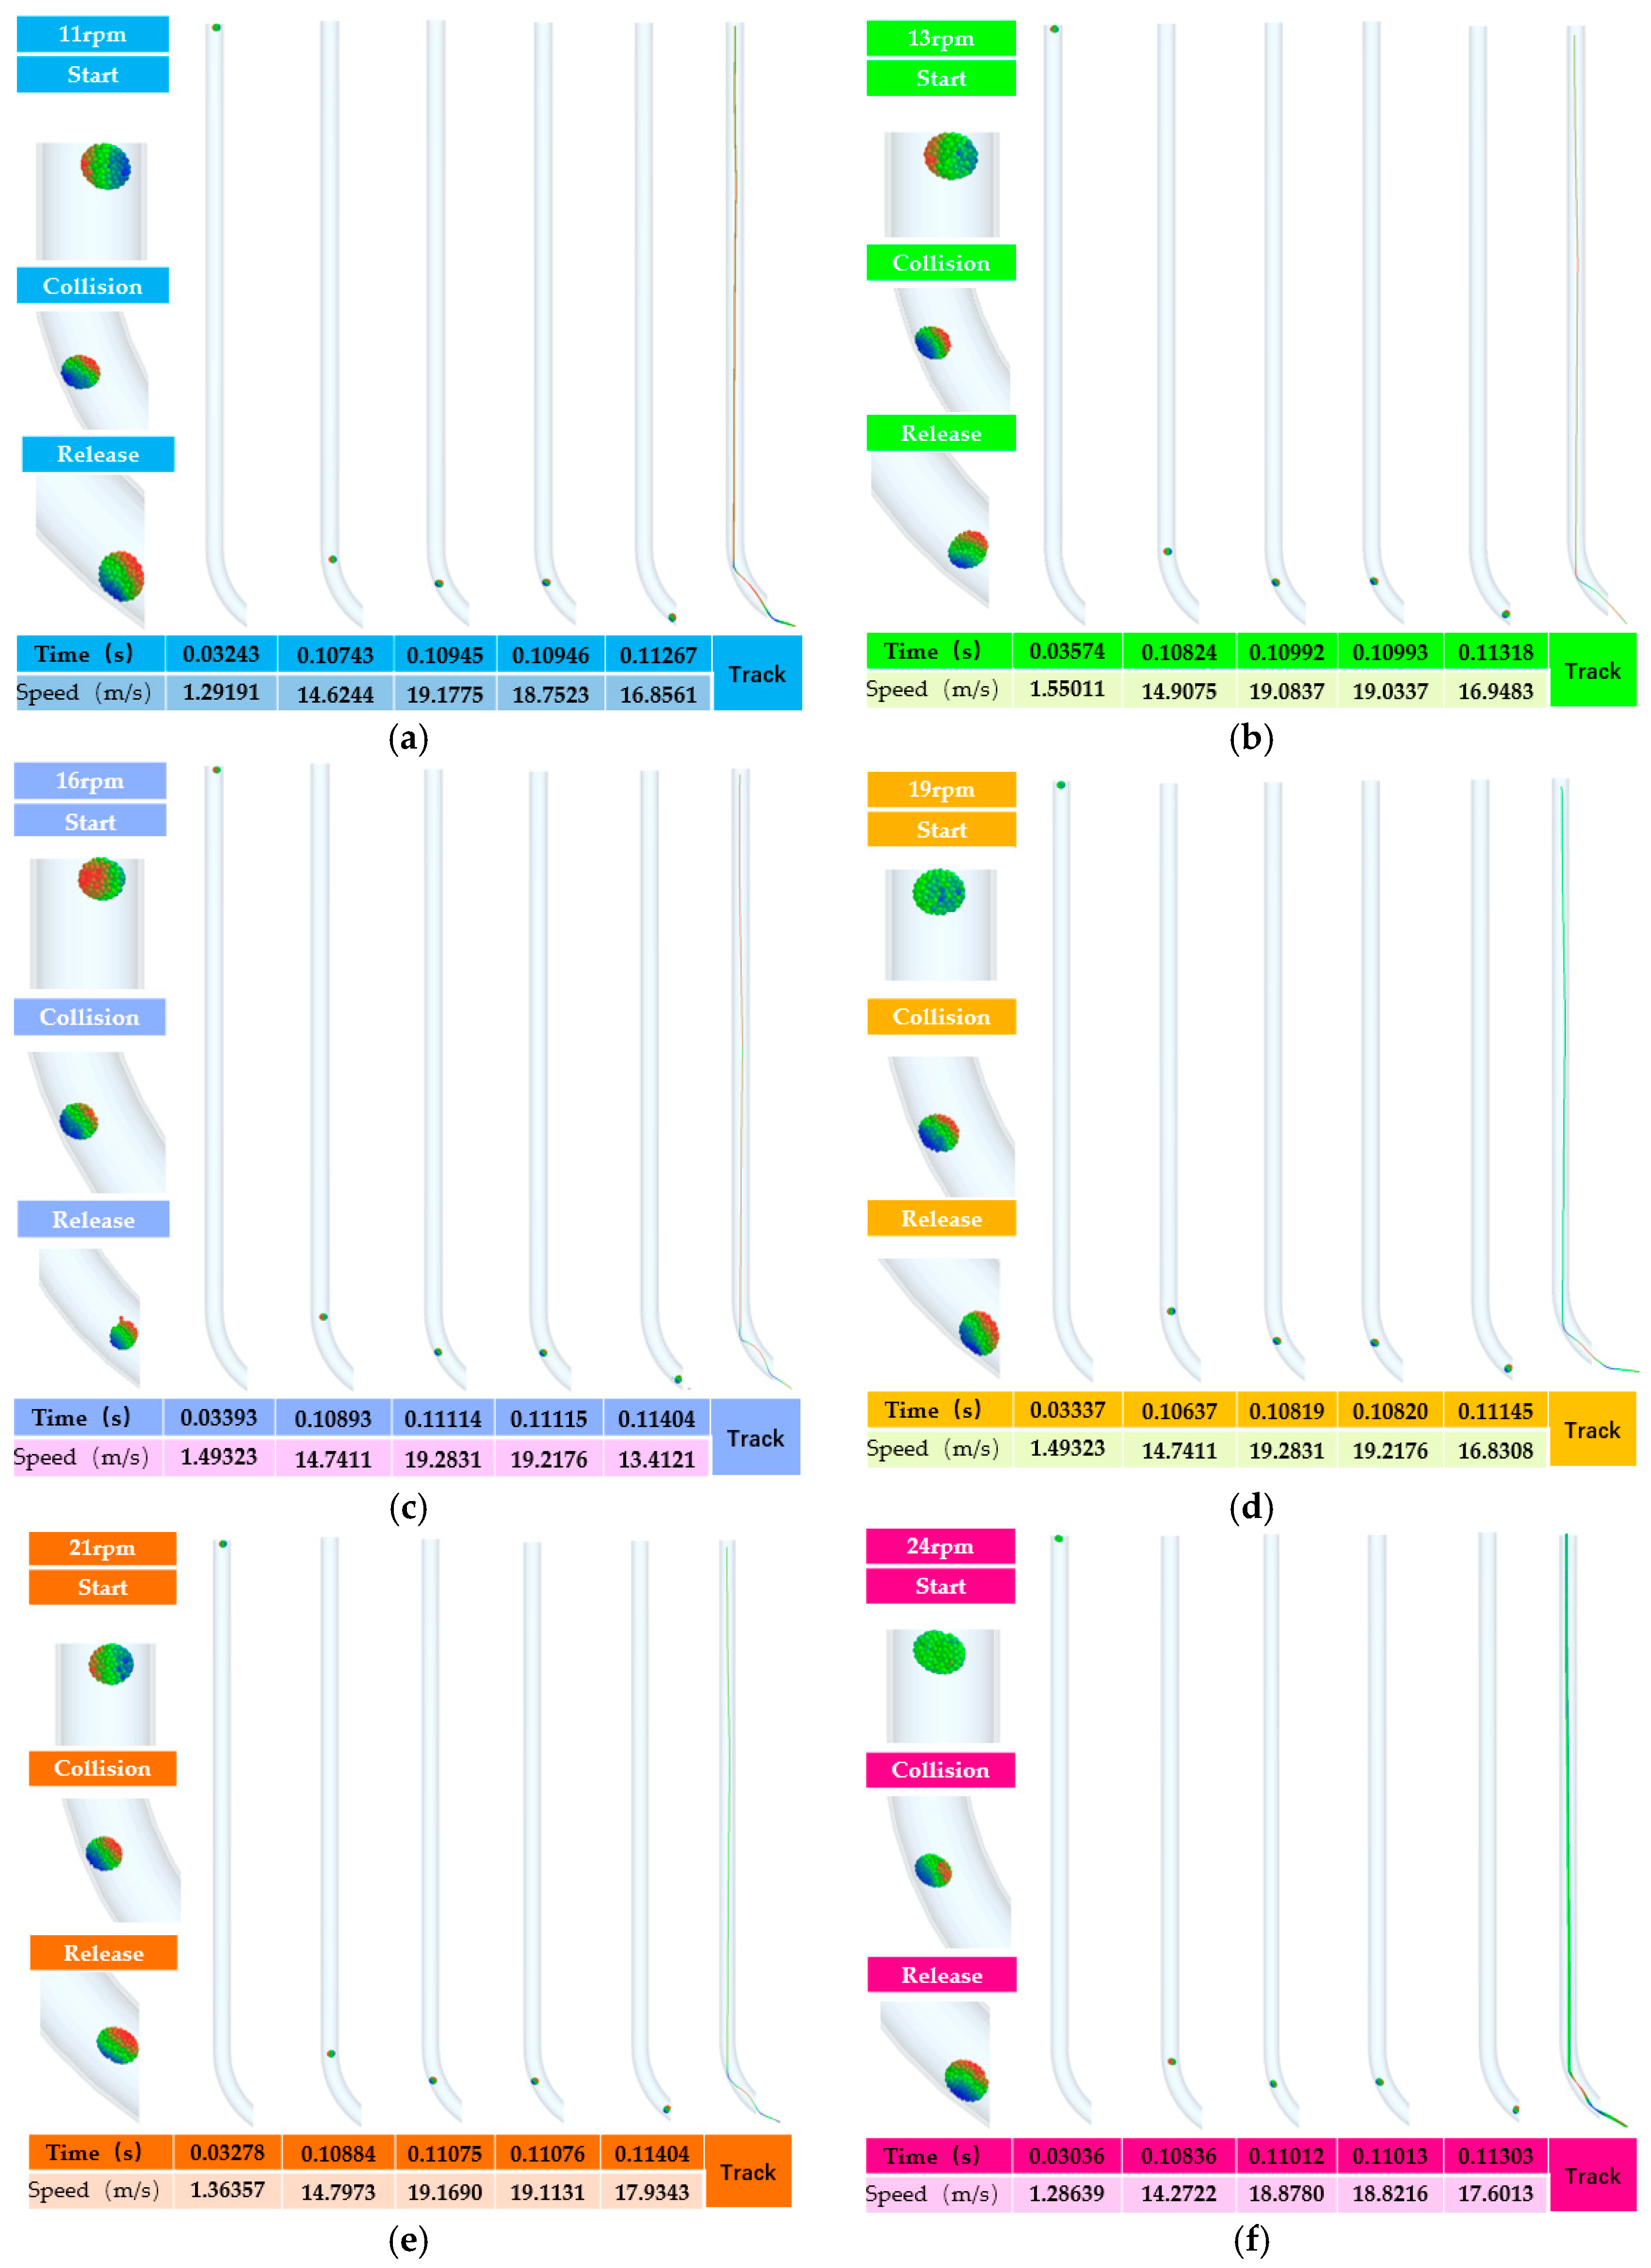
Figure 5 presents the diagrams depicting the position, attitude, and trajectory of the seeds within the seed tube under the conditions where the inlet pressure of the seeding device was set at 3.5 kPa, the air supply pressure at 0.5 kPa, and the drum rotated at speeds of 11, 13, 16, 19, 21, and 24 rpm. It is evident that under the identical inlet pressure condition, the flow field situation within the entire seed metering device remains essentially unchanged. Nevertheless, with the continuous increase in the rotational speed of the seed drum, the linear velocity of the seeds adhering to the cells also steadily augments. Consequently, the movement time of the seeds within the seed tube is significantly reduced, thereby decreasing the likelihood of collisions among the seeds in the tube. During the simulation tests, all the seeds commenced to depart from the drum and enter the “handover stage” at 0.002 s. When the seeds reached that position in the tube, their velocities all increased to varying extents, but were basically at approximately 1.3–1.5 m/s, with minimal disparity. This is attributed to the interaction between the seeds and the air pressure flow field. The seeds collided with the tube at the elbow, and the velocity of the seeds during the collision was greater and was approximately 19 m/s. In this manner, when the seed metering device is operating, the inconsistency of the seed spacing resulting from the variation in the air supply pressure can be mitigated.
2.
Analysis of different inlet pressures at the same seed drum speed
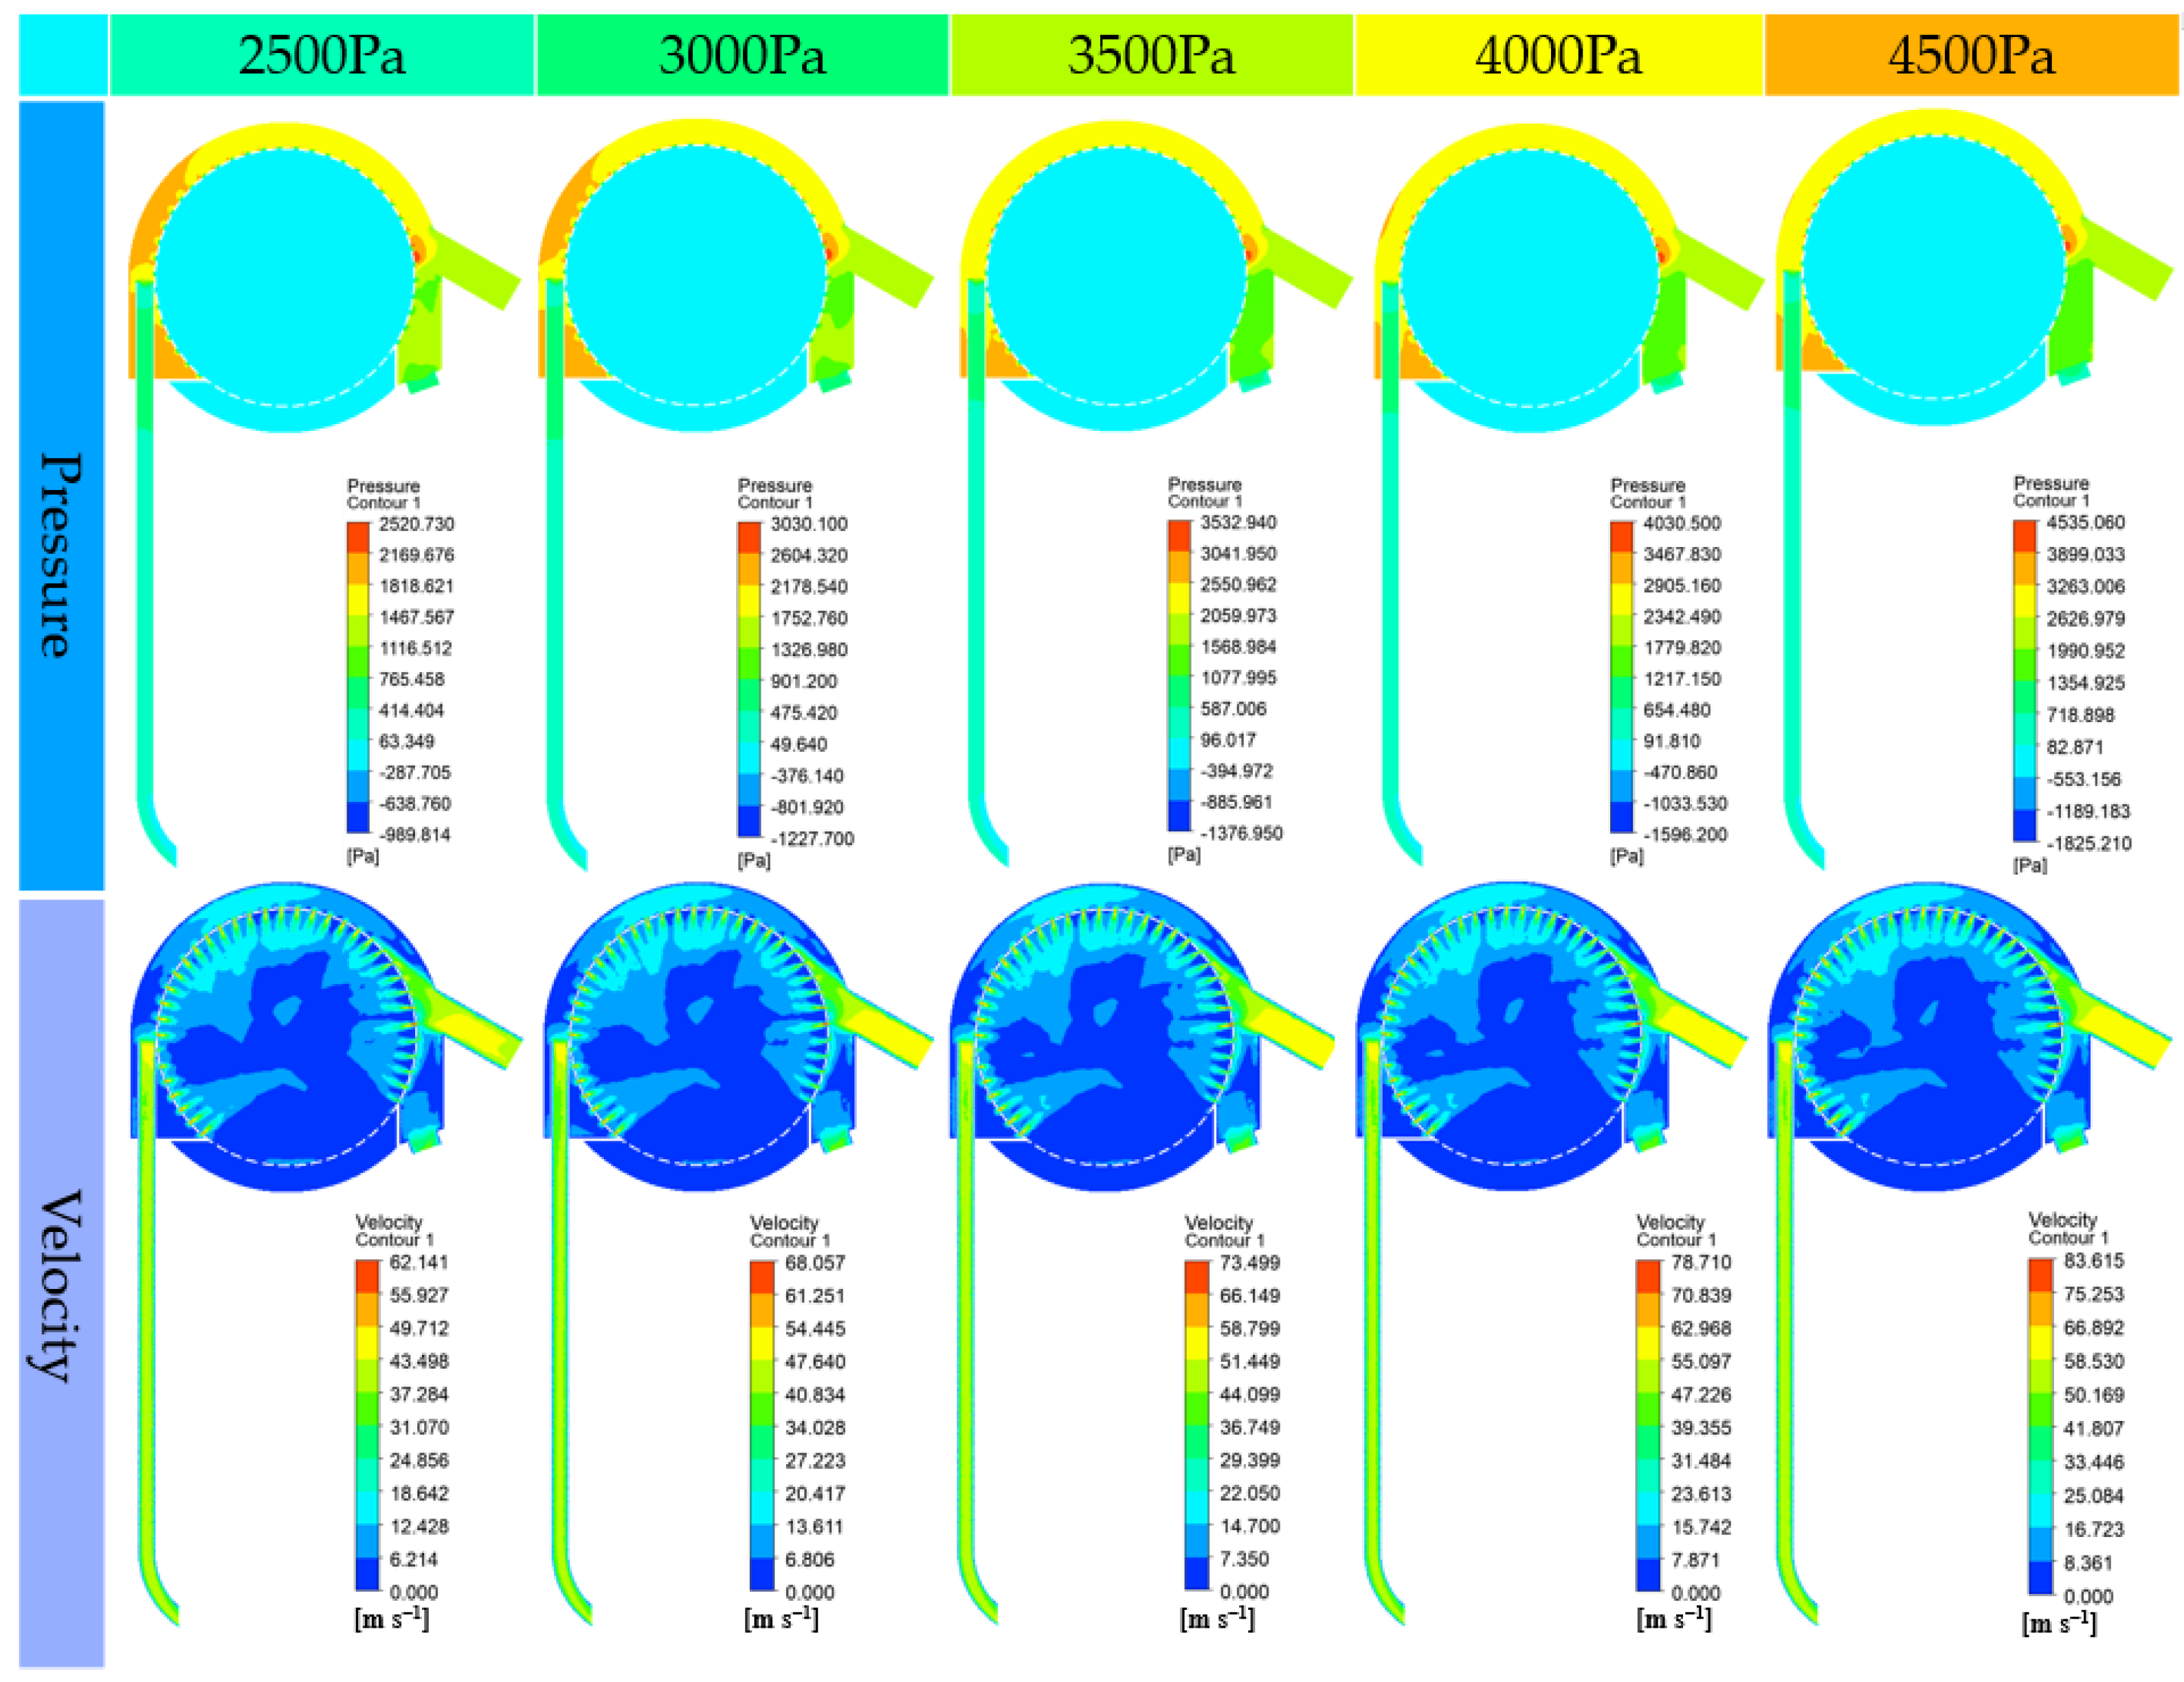
It can be ascertained from Figure 6 that with the continuous increase in the inlet pressure, the air pressure within the seed metering device steadily rises, and the airflow velocity inside the seed delivery tube also continuously augments. When the inlet pressure is relatively high, the airflow effect on the seeds in the seed delivery tube is more intense, which will cause the seeds to move faster and have a shorter movement time in the seed delivery tube, and is more conducive to enhancing the uniformity of sowing. As the inlet pressure increases by 500 Pa each time, the maximum flow velocity inside the seed metering device increases by approximately 5 m/s. However, the range of air pressure and flow velocity inside the seed tube remains relatively stable under different pressures, with air pressure ranging between 63.34 and 718.90 Pa and flow velocity consistently between 15 and 40 m/s. This can avoid an impact on the consistency of the seed due to the change in air pressure during operation.
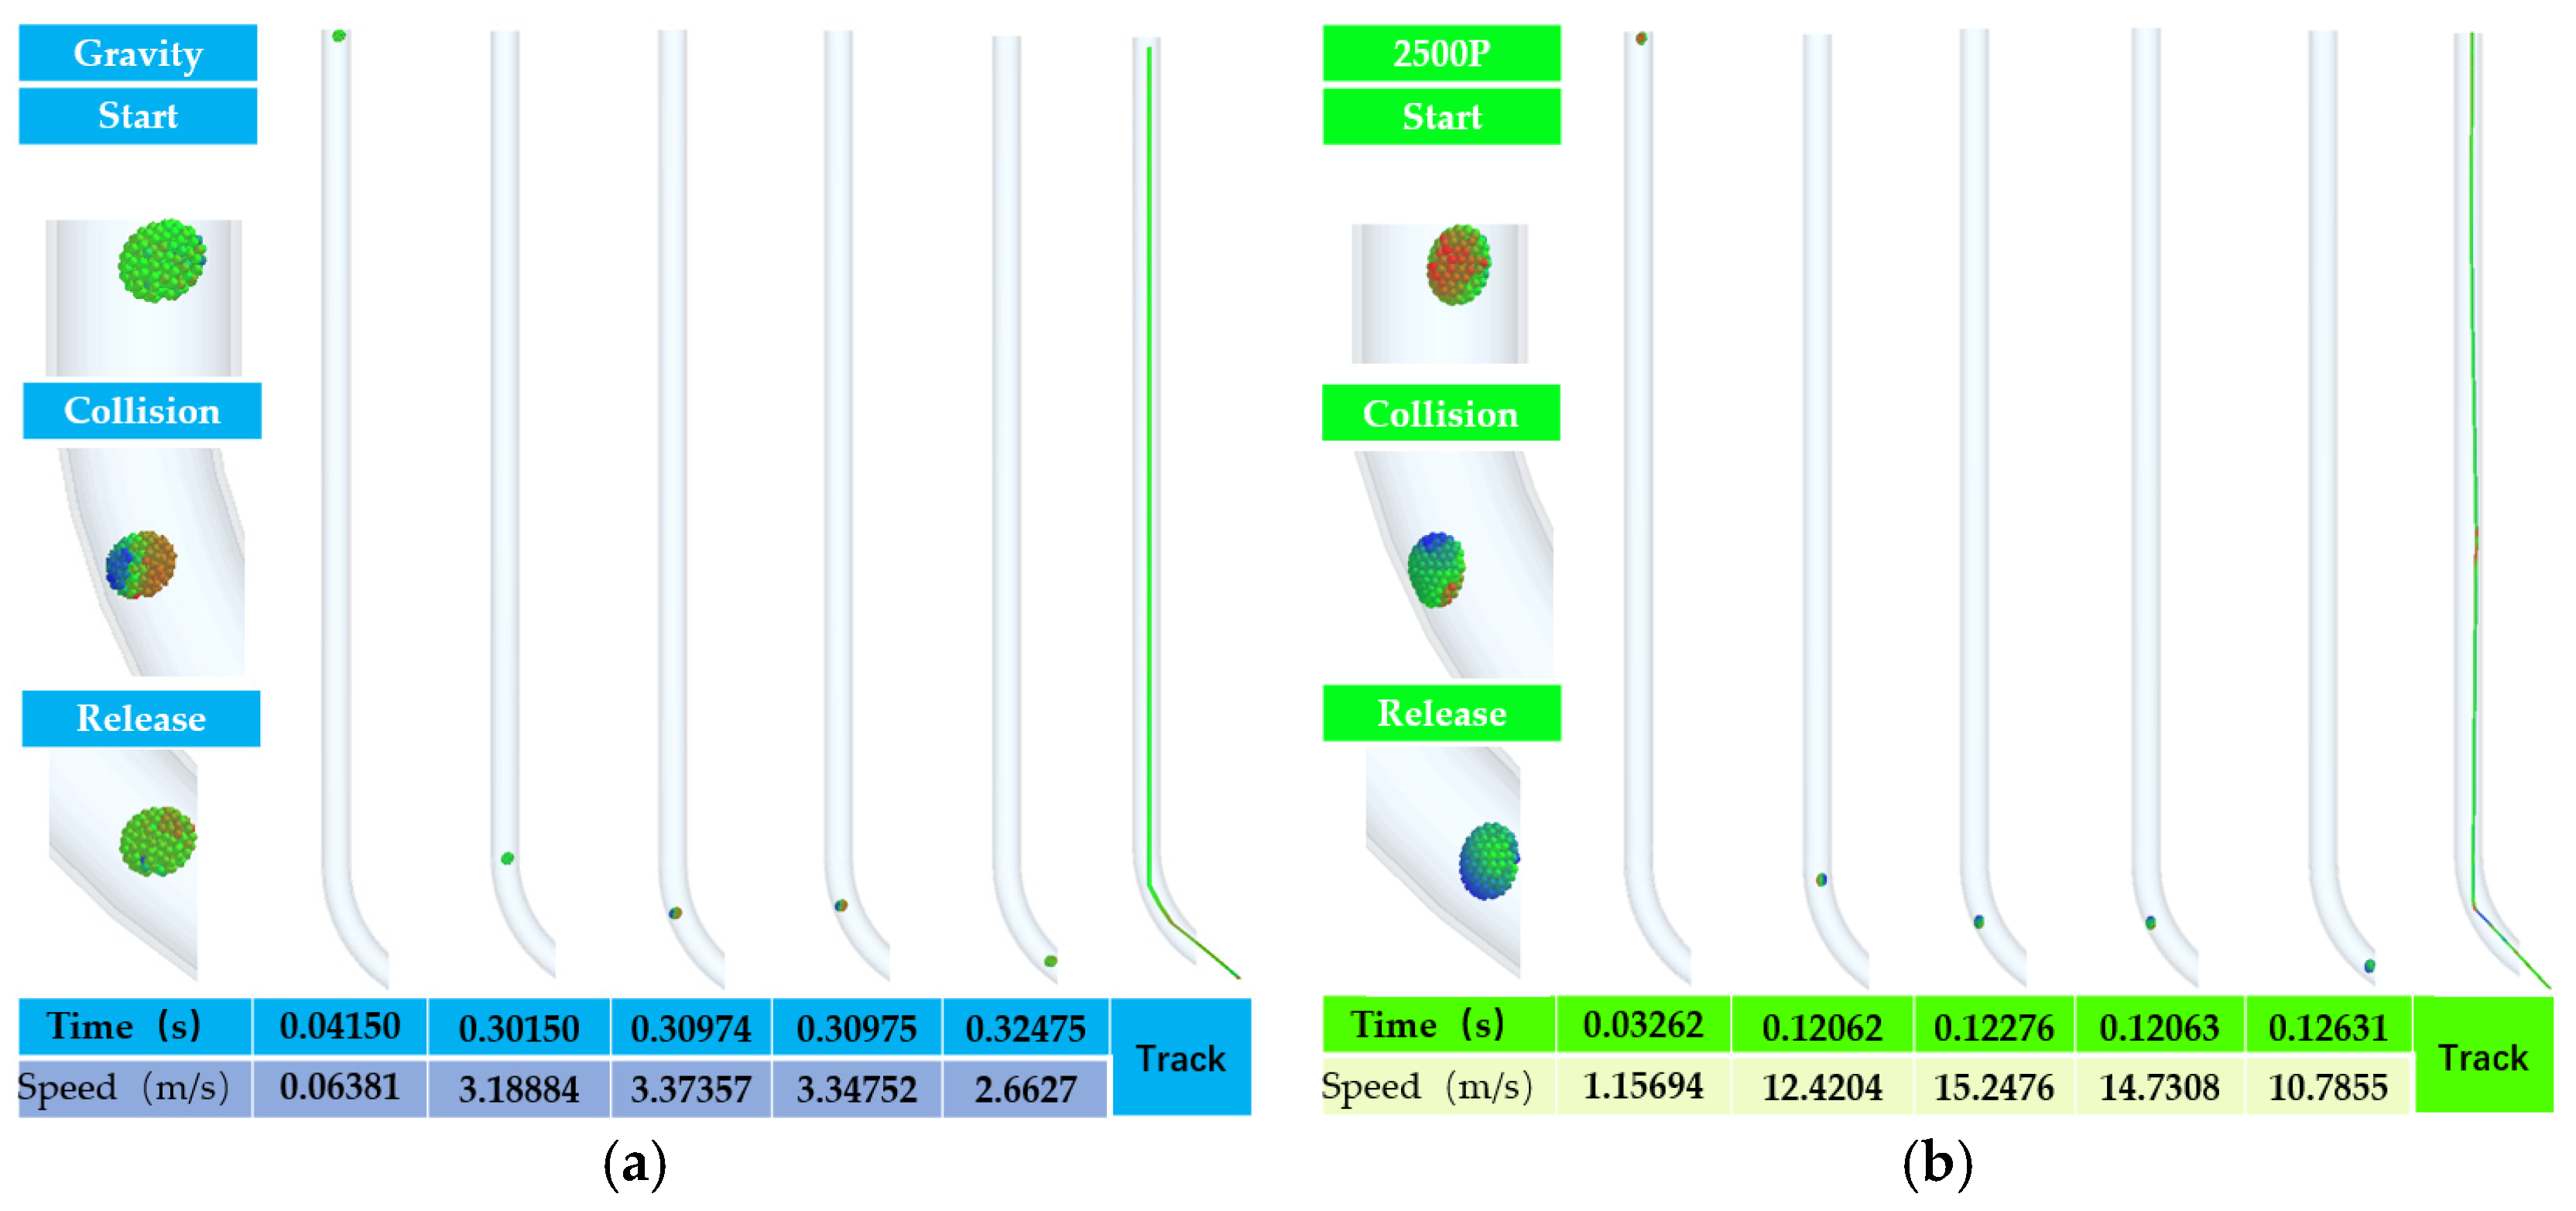
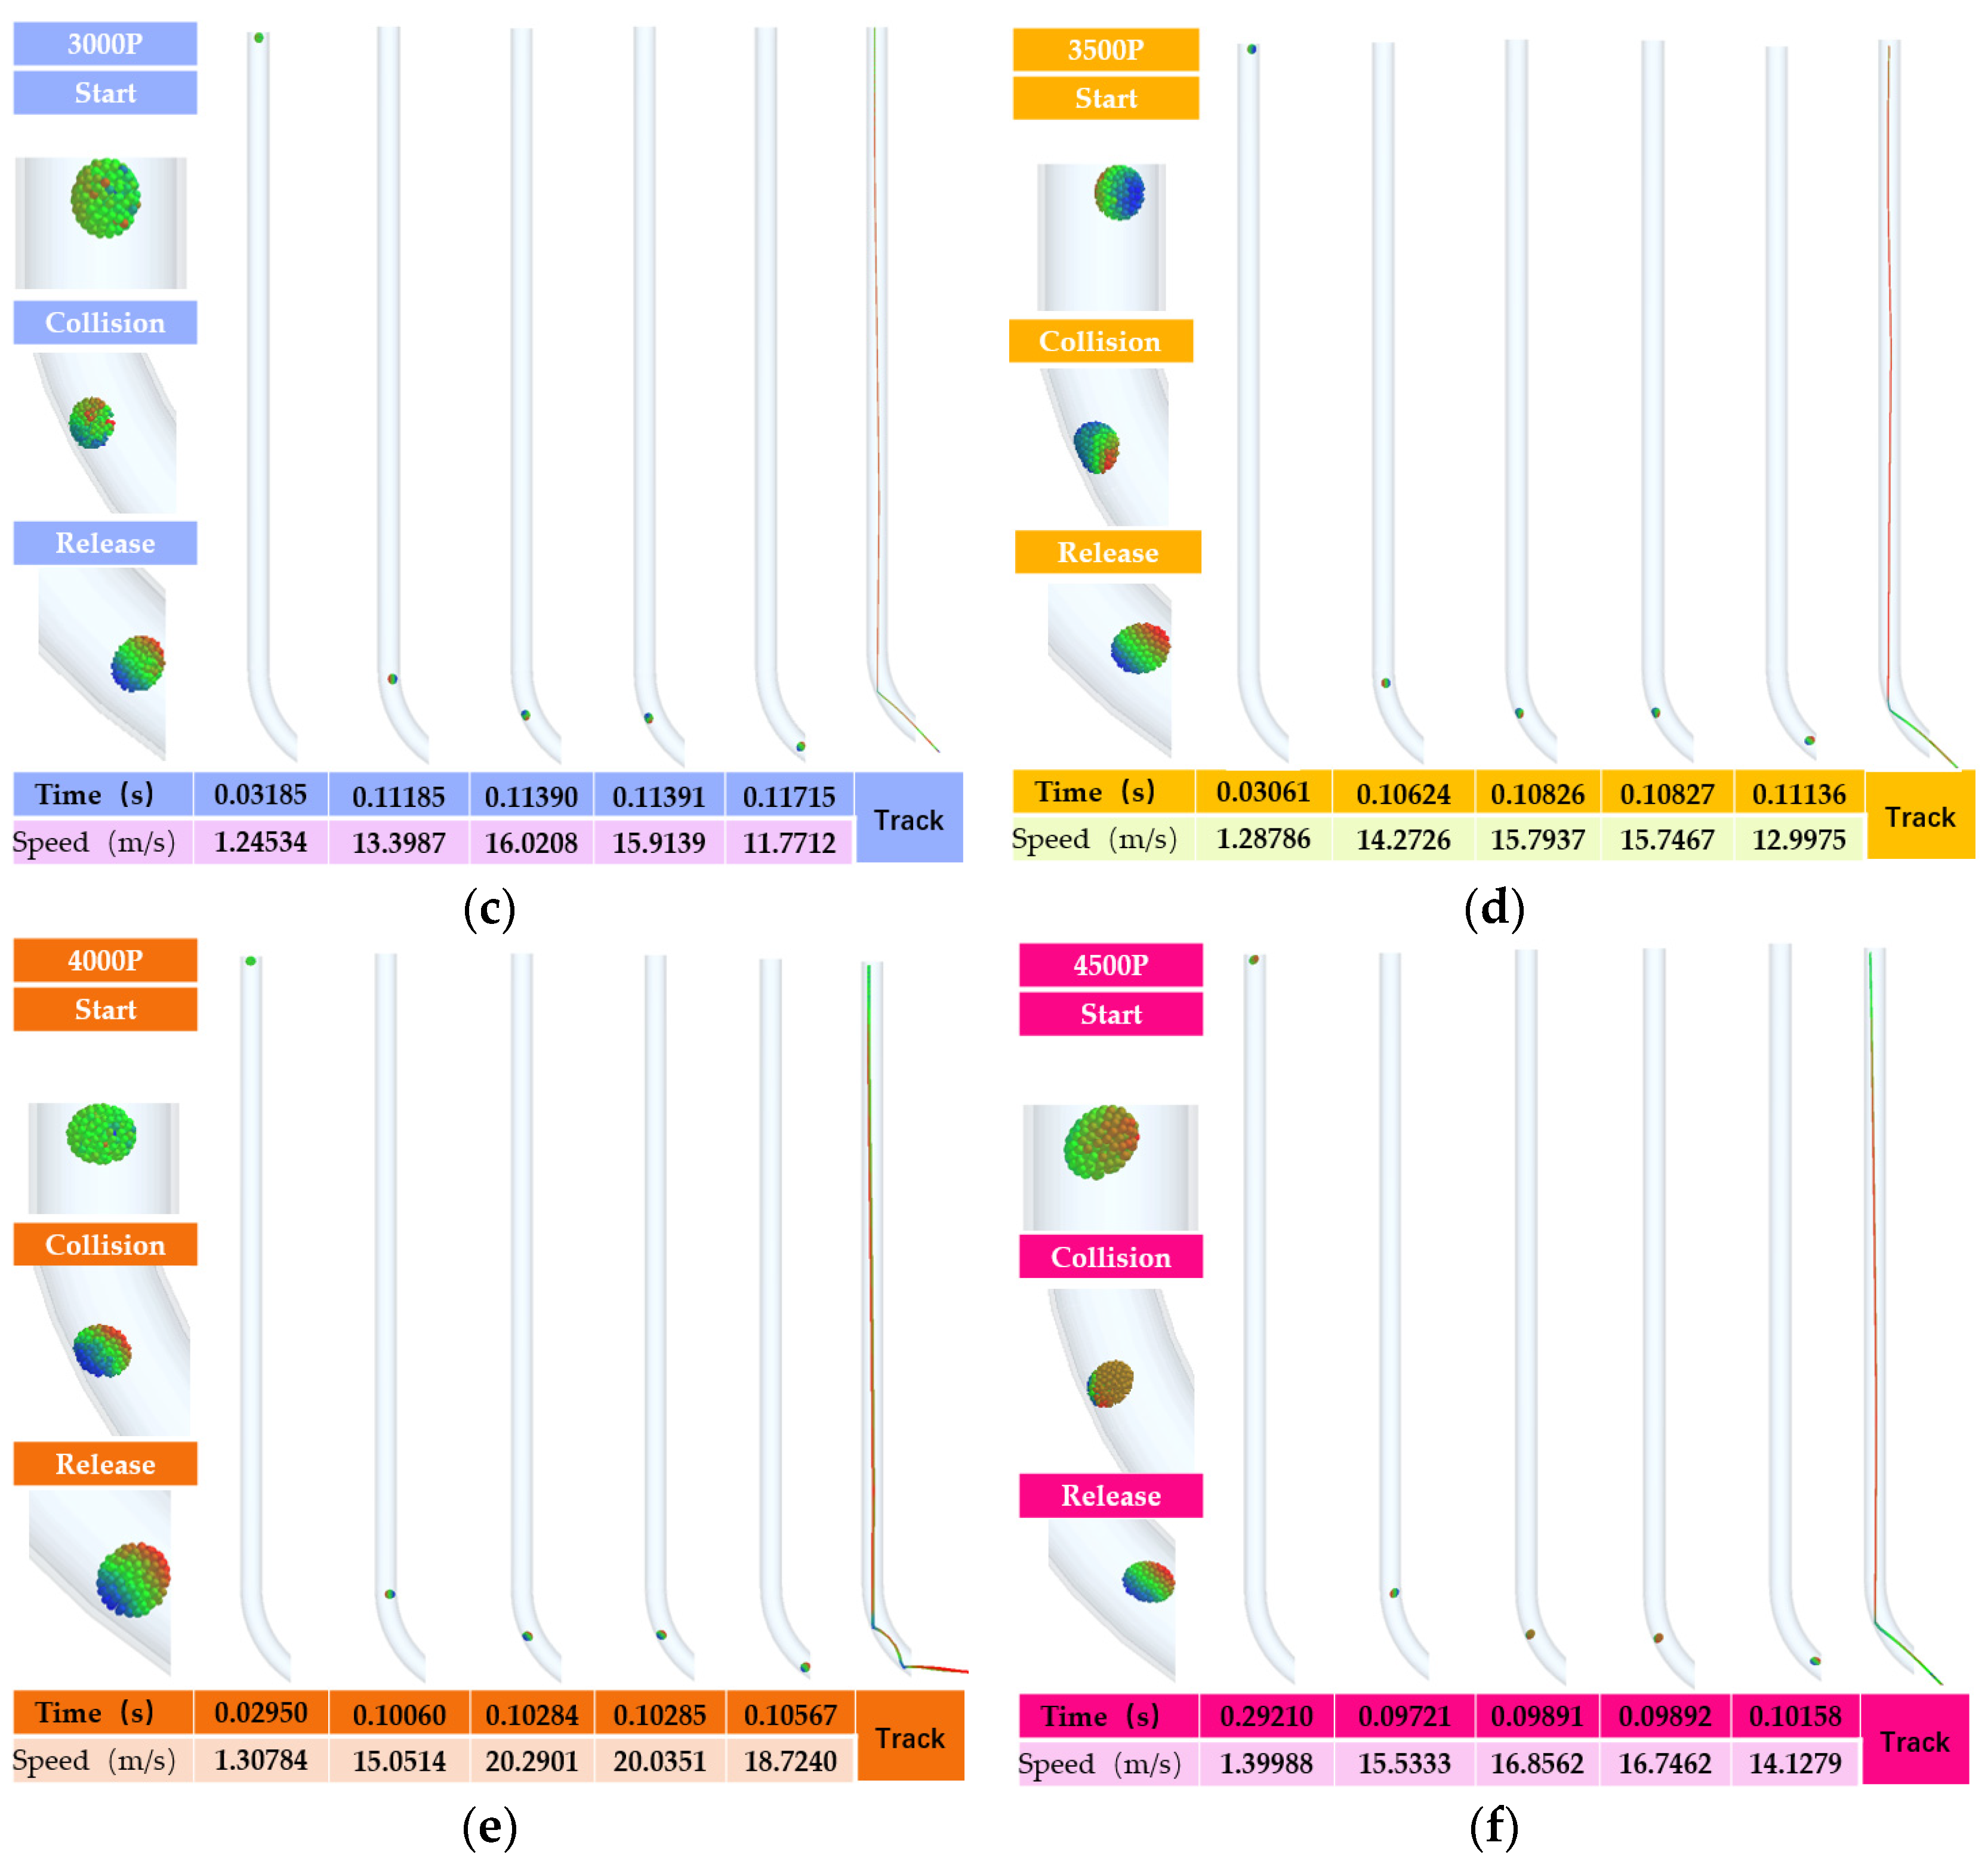
Figure 7 shows the coupling simulation process of seeds in the seed delivery tube under different inlet pressures when the drum rotation speed was 30 rpm. It can be seen from the figure that when the seeds leave the drum, their initial velocities are basically the same. In order to make a comparison of the test results, this study added the process of free-fall motion of seeds under the same conditions as a comparison, as shown in Figure 7a. For the purpose of accurately analyzing the speed variations for each soybean seed within the seed delivery tube, the real-time speed change for each soybean seed in the seed tube is obtained via EDEM post-processing. As observed from Figure 7, it can be noted that there is an acceleration phase after the seed departs from the drum, seeds move in a straight line within the tube, and the posture of the seeds is relatively stable. As the inlet air pressure increases, the seeds move at a faster speed, and the time for them to leave the seed-metering device becomes shorter. When the seeds encounter the curved tube area and collide with the tube, substantial changes take place in the movement speed, direction, and posture of the soybean seeds. Upon observation, it can be noted that the location of the collision point between the seeds and the tube remains essentially unchanged, and the variations in angle and speed after the collision are also extremely small. Consequently, it can be regarded that the seed trajectories are basically identical. This facilitates the fixation of the position of the seed press wheel. As the inlet pressure increases from 2.5 kPa to 3.5 kPa, the speed of the seeds at the end of the curved section increases by approximately 2.1 m/s. However, when the inlet pressure increases from 3.5 kPa to 4.5 kPa, the seed speed only increases by about 1.1 m/s. Therefore, to achieve the most efficient energy transfer and seed acceleration, the operator should maintain the inlet pressure at approximately 3.5 kPa, avoiding excessively high intake pressure to prevent diminishing marginal returns on energy input. The movement time of seeds inside the tube is also gradually reduced but remains approximately 0.12 s. By conducting a comparison with Figure 7a in this research, it can be ascertained that there is a significant difference in the time and speed between the seed accelerated by airflow and the seed in free fall with a certain initial velocity. However, as pressure increases, the acceleration effect of the positive-pressure airflow on seeds within the delivery tube attenuates. This finding contradicts the conventional assumption that higher air pressure invariably results in higher seed speeds. Further analysis reveals that the attenuation is primarily due to the reduced relative speed between the airflow and the seeds. Flow field velocity analysis indicates that the airflow velocity inside the tube ranges from 15 to 40 m/s, while the initial velocity of seeds after exiting the drum can approach this range under varying rotational speeds. As seed velocity increases, the relative speed decreases, thereby diminishing the acceleration effect. Crucially, when the seed velocity approaches or matches the airflow velocity, the acceleration becomes negligible. This insight underscores a fundamental design principle for optimizing airflow-assisted devices: to maximize acceleration, the relative speed between airflow and seeds must be maintained at a sufficient level, avoiding scenarios where seed velocity converges with airflow velocity.
Through analysis, it is concluded that under the action of positive pressure airflow, the number of collisions between soybean seeds and the tube wall will be reduced, the movement time of the seeds in the seed delivery tube is short, and the movement trajectories of each soybean seed under different pressures are basically the same, which reduces the influence of the air supply pressure on seed metering, thus improving the quality of seed metering. Therefore, the structure and parameters of the seed metering device adopted in this study can reduce the movement time and the number of collisions of seeds in the seed delivery tube, and further improve the uniformity of sowing spacing.
3.
Analysis of the movement states of different seeds under the same pressure and drum rotational speed
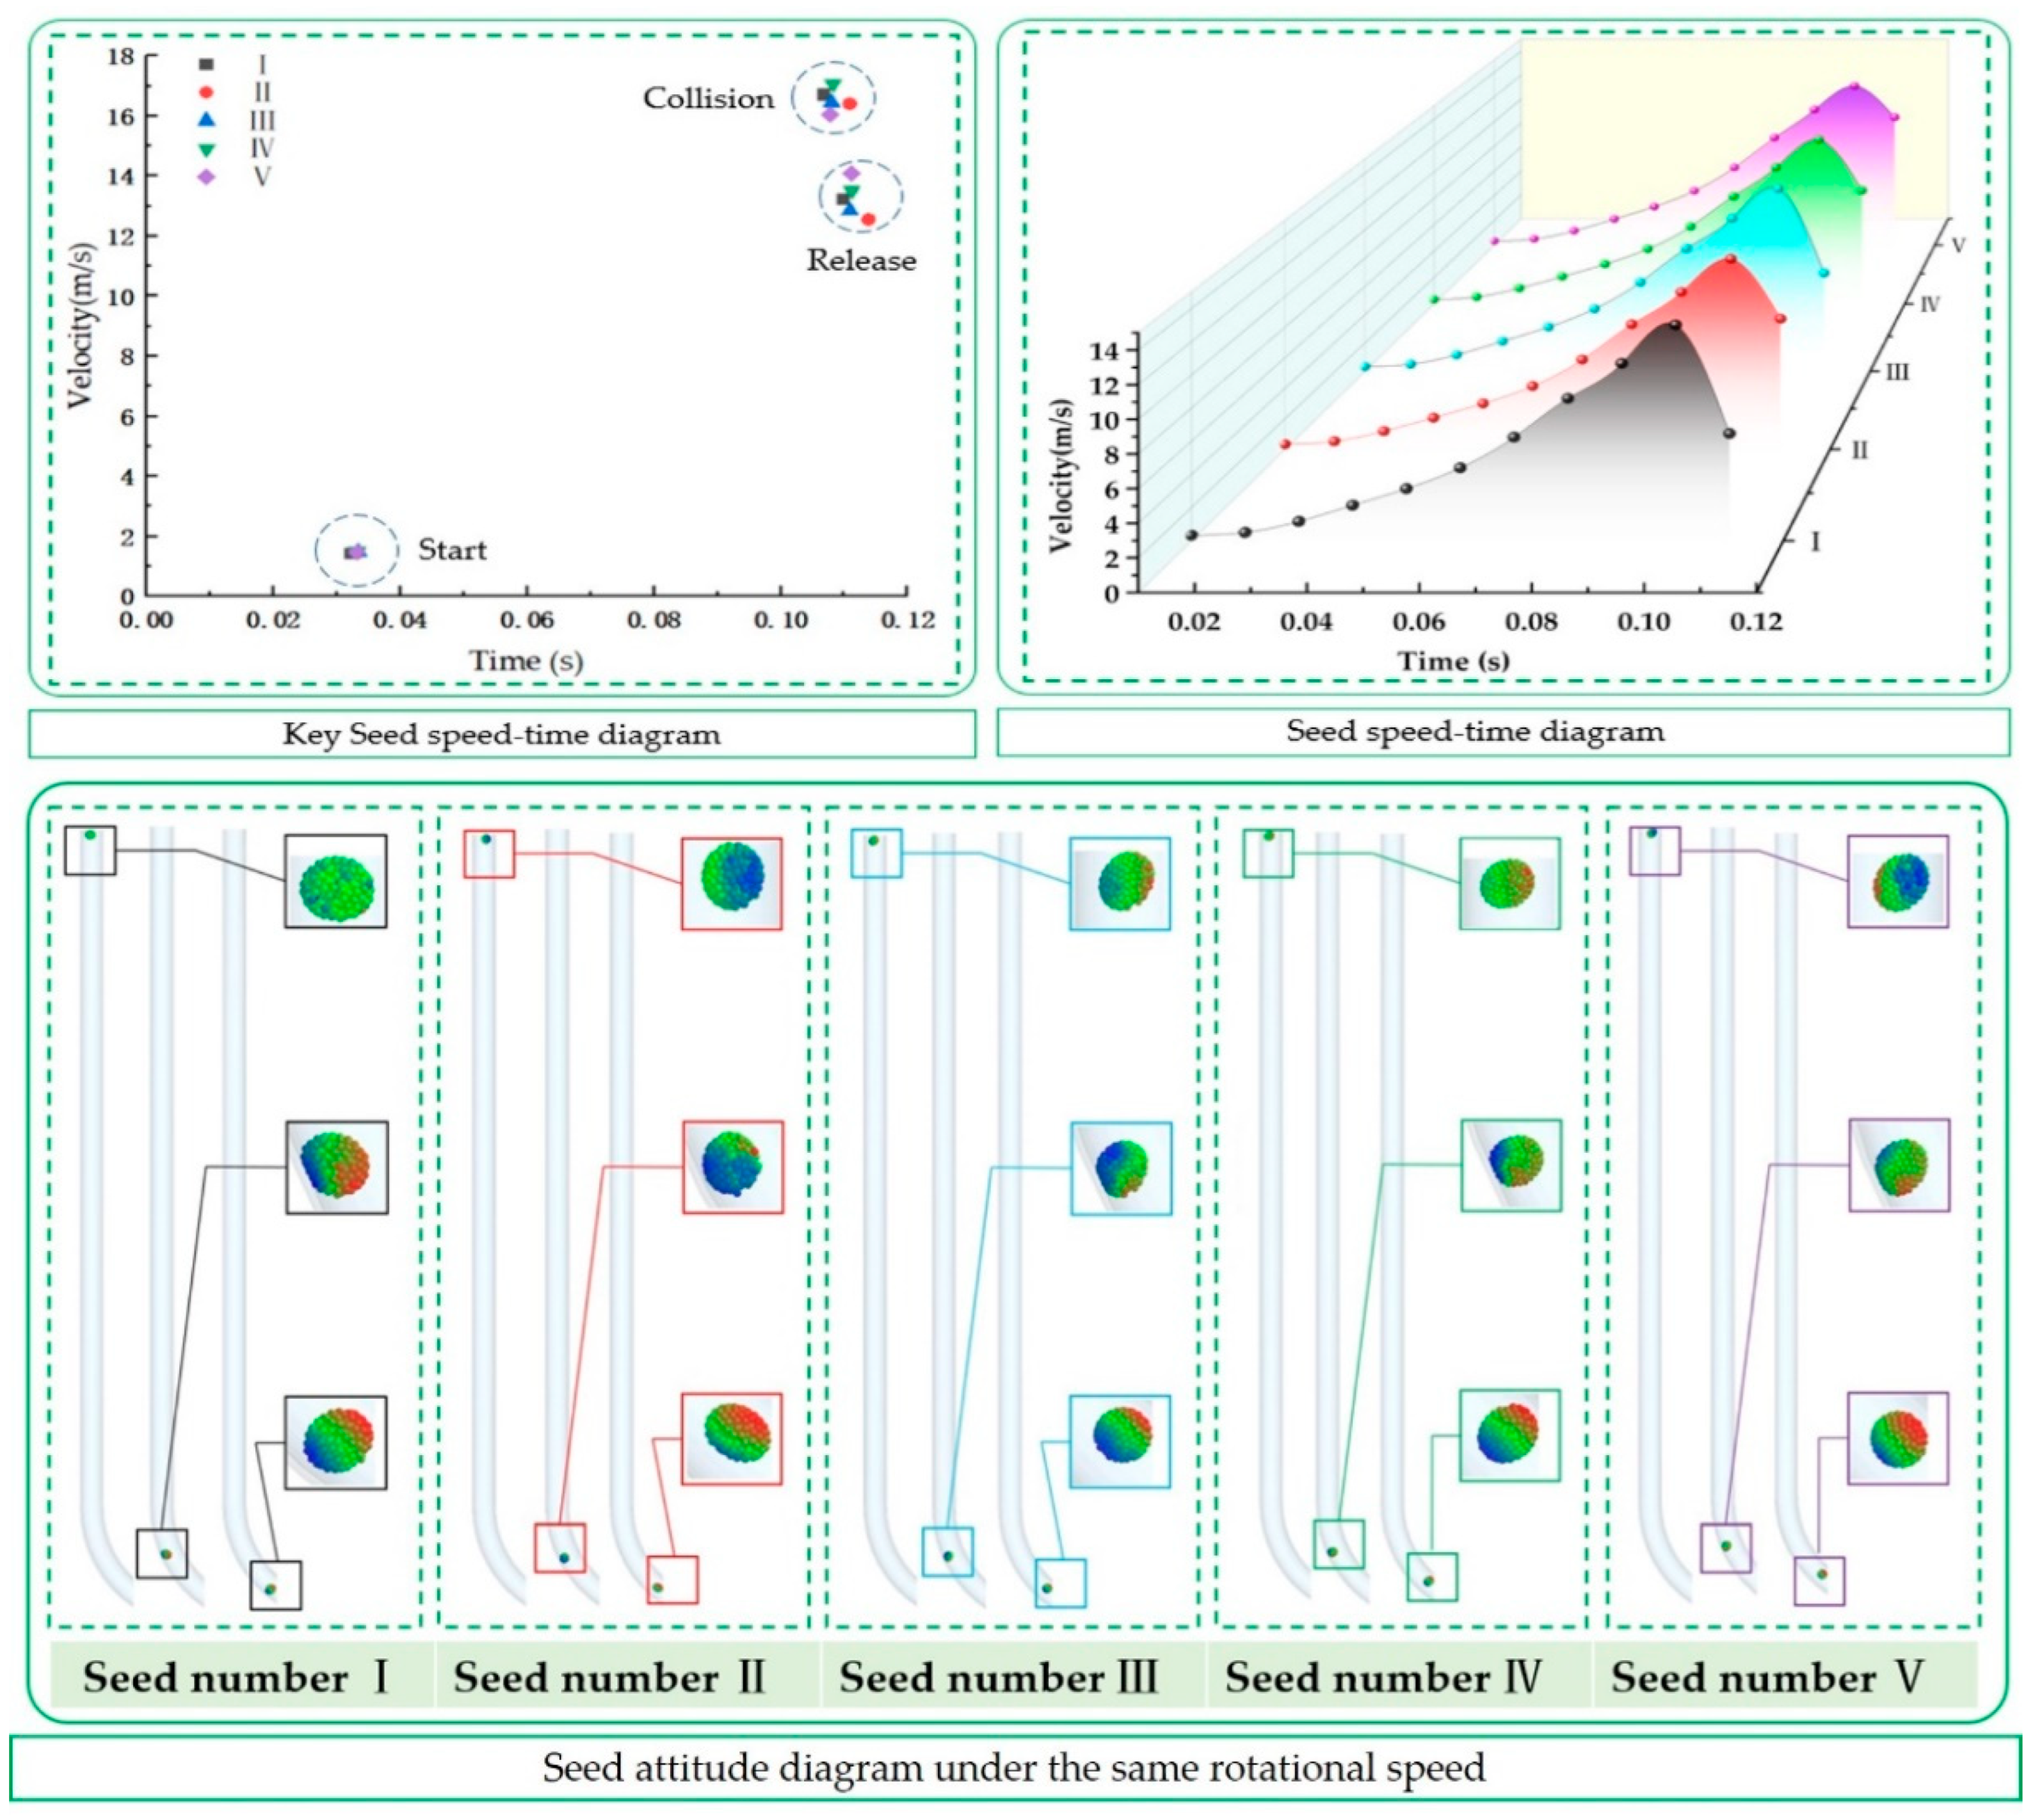
Figure 8 illustrates a coupling simulation experiment conducted with an inlet pressure of 3.0 kPa and a drum rotational speed of 19 rpm. Five seeds, numbered I to V, were randomly selected for analysis at three key moments: entry into the seed delivery tube (start), collision with the tube (collision), and exit from the tube (release). At the start, the seeds entered the tube at 0.033 ± 0.001 s with a speed of 1.471 ± 0.042 m/s. Upon collision, occurring at 0.108 ± 0.002 s, the speed increased to 15.900 ± 2.700 m/s. By the time they exited the tube at 0.112 ± 0.002 s, the speed had decreased to 13.886 ± 2.525 m/s. The seeds’ movement time and speed change remained relatively minor from entry to just before collision. Analysis of the comparison diagrams of the five seeds revealed that their initial posture upon entering the tube influenced their movement time and speed within the tube. During the collision, the speed changed due to the collision posture affecting both the magnitude and direction of the post-collision speed and trajectory. Nonetheless, overall changes in speed magnitude and direction were not substantial.
4.
Analysis of the seed capture process
When seeds in a state of high-speed movement are ejected from the seed tube, they come into contact with the soil at a relatively high velocity. In the absence of a press wheel, seeds are highly likely to bounce due to the impact force, thereby influencing the uniformity of sowing. The presence of the press wheel offers a buffering effect for the seeds. At the instant when the seeds contact the soil, through its own weight and contact pressure with the soil, the press wheel disperses the impact force of the seeds over a larger area, thereby effectively reducing the instantaneous impact force endured by the seeds, as shown in Figure 9. Through analysis, it is found that the soybean seeds gain a certain acceleration in the seed delivery tube, and there is only one collision occurring in the seed delivery tube. The speed experiences a small fluctuation, but the overall speed changes in a certain quantity of soybean seeds are more or less the same. After the seeds leave the seed delivery tube, due to the effect of the seed pressing wheel and as the seeds move at a high speed, the capture time is also short. In this way, the variation time of the seeds after being dropped can be greatly reduced, and the uniformity of seed distribution can be increased. From the value of the single-grain velocity of soybean seeds, it can be observed that the value of the single-grain velocity of soybean seeds remains essentially constant. Under the condition where each seed has the same displacement, the time taken for each soybean seed to pass through the tube is also approximately the same. This shows that the seed transportation within the tube has good uniformity, and the posture of soybean seeds in the tube has a relatively minor impact on the stability of seed dropping.

3.3. Bench Test

3.3.1. Bench Test Conditions and Experimental Arrangements

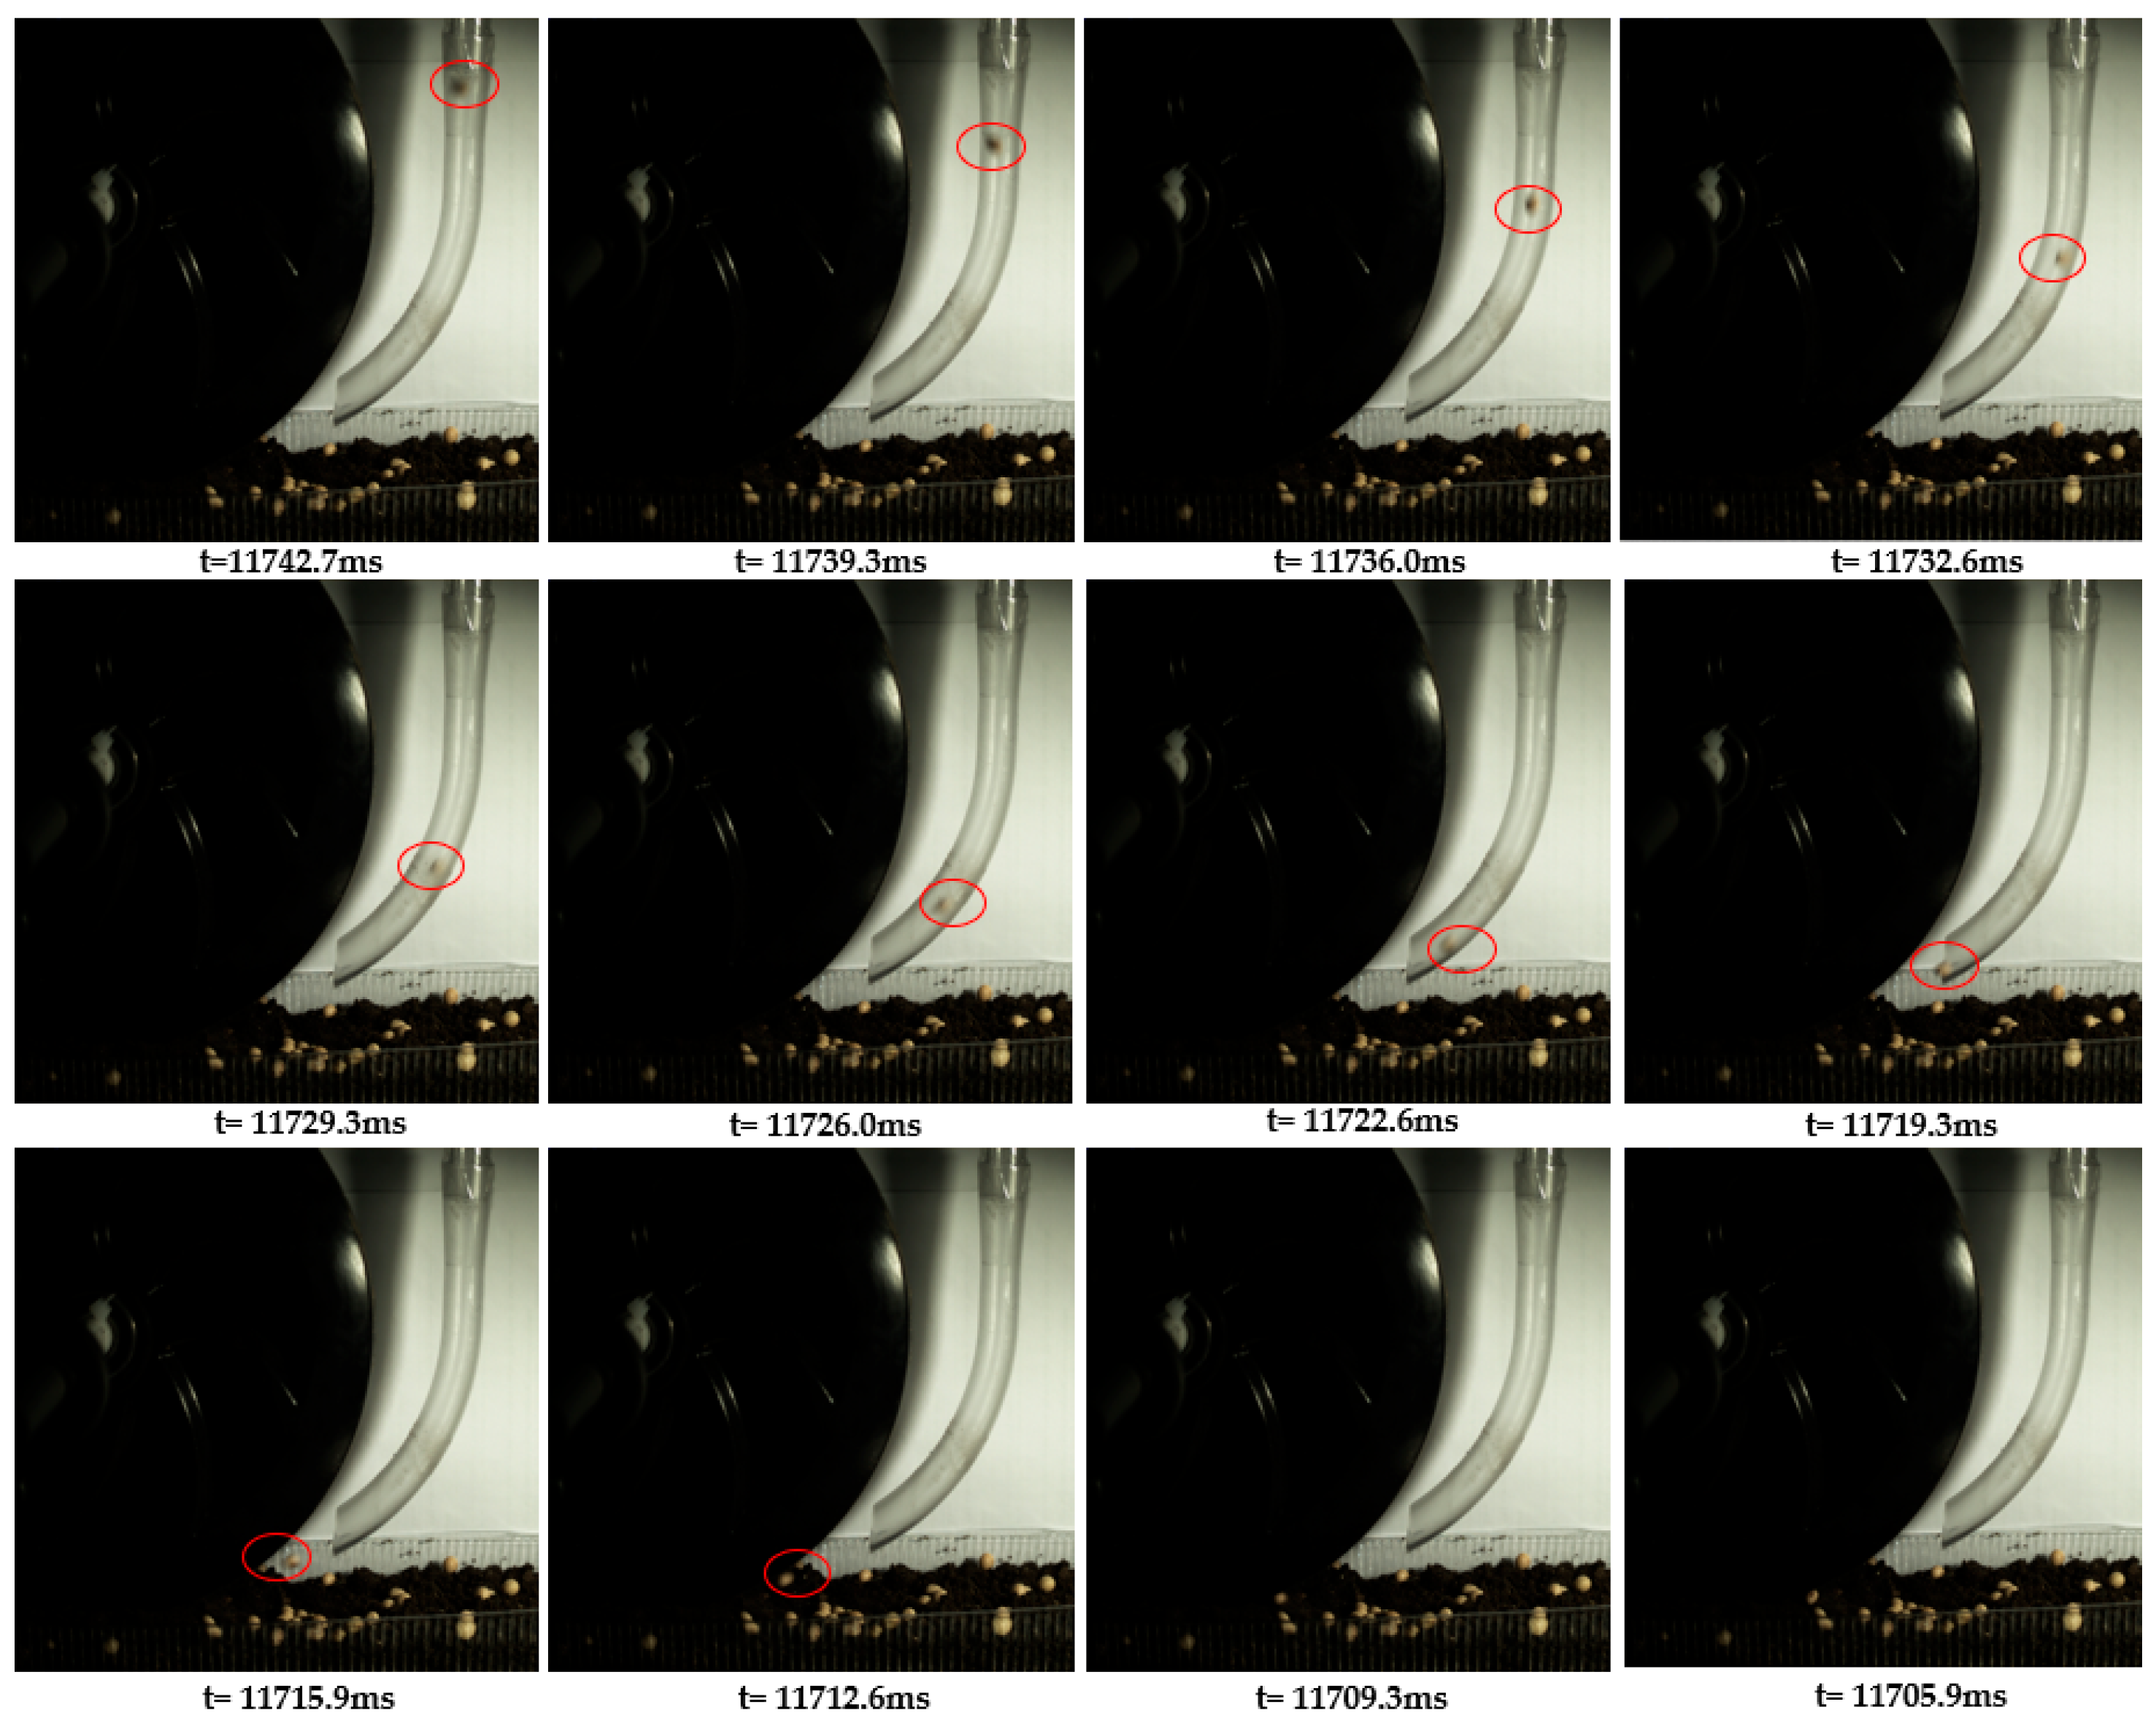
Based on simulation-derived parameters, the seed delivery tube was fabricated using 3D printing. The assembled seed metering device was subsequently mounted on a performance test bench (Figure 10) capable of emulating field sowing operations. Adjustable parameters enabled replication of diverse seeding conditions. The conveyor belt simulated seeder forward velocity, while a high-speed camera (300 fps) captured soybean seed trajectories during metering and assessed press wheel efficacy. To validate simulation reliability and device functionality, seed drop and press performance were analyzed using high-speed videography. Videos recorded seed displacement trajectories and attitude changes at real-time resolution, with data stored digitally for processing. The test factors and level settings of the bench test are consistent with those of the simulation test.
Moreover, to quantitatively evaluate the seed capture performance of the press wheel, a dedicated experiment was conducted under different seed drum rotational speeds (11, 13, 16, and 19 rpm) with three replicates per speed level. Each test planted 100 soybean seeds continuously, and seed capture events were recorded using the high-speed camera. The capture rate (CI) was defined as the percentage of seeds completely covered by the press wheel without rebound after contacting the soil.

3.3.2. Results and Discussion of the Bench Tests

Due to the inconvenience of measuring sowing spacing during bench tests, a video is used to measure the seed metering time of the seed metering device test bench (Figure 11). At a working pressure of 3.0 kPa, as the rotational speed of the seed drum increases, the seed qualification rate initially rises and then declines, aligning with simulation results. When the rotational speed exceeds 30 r/min, soybean seeds spend less time in the seed filling area, causing the drum’s holes to rotate away before seeds are “adsorbed,” leading to missed sowing. Tests reveal that the coefficient of variation for the seed metering device with a seed delivery tube is significantly lower than that without one. For devices without a seed delivery tube, the coefficient of variation sharply increases with higher working speeds. In contrast, for devices with a seed delivery tube and press wheel, the coefficient of variation rises more slowly as speed increases. This may result from the fact that without a seed delivery tube, seeds may deviate from their intended path after release. Adding a seed delivery tube and press wheel provides airflow assistance, shortens seed landing time, restricts seed trajectory, and ensures uniform seed spacing, allowing the device to operate at higher speeds. The test results show that when the inlet pressure is 3.0 kPa and the rotational speed is 19 rpm, the time for the seeds to leave the seed delivery tube is approximately 0.115 ± 0.005 s. The images from the high-speed camera show that the seeds have few collisions inside the seed delivery tube. The bench test results for press wheel capture performance are summarized in Table 3. The press wheel consistently achieved high capture indices, with the mean CI ranging from 94.0% to 96.0% across the operational speed range of 11 to 19 rpm. This demonstrates the effectiveness of the press wheel design in securing seeds upon contact with the soil, a critical factor for minimizing the coefficient of variation. By comparing the test results with the simulation data, it can be seen that the seed trajectories and collision times are consistent with the results of the CFD-DEM coupled simulation, which verifies the accuracy of the simulation model. However, there are slight differences in the seed velocities after the collision, which may be caused by the simplification of the assumed conditions in the simulation model. In conclusion, the bench test shows that combining these two components enhances seed distribution uniformity. However, this evaluation was conducted under controlled laboratory conditions. Further field tests are essential to determine the device’s performance in real-world settings.

4. Conclusions

This study designed and optimized a high-speed pneumatic seed-metering system using coupled CFD-DEM simulations and bench testing. The key conclusions are as follows:
(1)
Optimized Airflow-Assisted Seed Delivery Device: Key structural parameters were determined, including a seed tube diameter of 16 mm, a curved section radius of 80 mm, a seed delivery angle γ of 33.65°, and a press wheel diameter of 254 mm. The Type A structure, which aligns the tube outlet with the seed velocity direction, minimized collisions and improved seeding uniformity during high-speed operation.
(2)
Impact of Inlet Air Pressure: Increasing inlet air pressure enhanced seed distribution uniformity by accelerating seeds and reducing travel time. A 500 Pa increase in pressure raised the maximum airflow velocity by approximately 5 m/s. However, seed acceleration exhibited diminishing returns: a pressure increase from 2.5 kPa to 3.5 kPa increased seed speed by 2.1 m/s, while a further increase to 4.5 kPa only added 1.1 m/s. The optimal inlet pressure for efficient energy transfer and seed acceleration was approximately 3.5 kPa.
(3)
Performance of the Press Wheel: The press wheel significantly improved seeding uniformity by reducing seed rebound upon soil contact. It achieved high and consistent capture rates, ranging from 94.0% to 96.0% across operational speeds of 11 to 19 rpm, ensuring stable seed spacing and uniform crop emergence.
(4)
Validation of Simulations: Bench tests using high-speed cameras confirmed the accuracy of the CFD-DEM coupling simulations, as seed movement trajectories and collision patterns closely matched predictions. This validates the model’s reliability for predicting seed behavior under various operational conditions.

Author Contributions

Conceptualization, Y.D., G.Z. and B.Q.; methodology, Y.D. and G.Z.; software, Q.X.; validation, Y.D. and G.Z.; formal analysis, Y.W.; investigation, Y.W.; resources, Q.X. and H.Z.; data curation, Y.D. and G.Z.; writing—original draft preparation, Y.D.; writing—review and editing, Y.D., G.Z., R.W. and H.Z.; visualization, R.W.; supervision, W.Z.; project administration, B.Q.; funding acquisition, W.Z. and B.Q. All authors have read and agreed to the published version of the manuscript.

Funding

This research was funded by the National Key Research and Development Program of China (Grant No. 2023YFD2000502), the Agricultural Science and Technology Innovation Program (ASTIP, CAAS-ZDRW202413), the Natural Science Foundation of Jiangsu Province (BK20240275), the Innovation Program of Chinese Academy of Agricultural Sciences (CAAS-SAE-202301), The Jiangsu Province Modern Agricultural Machinery Equipment and Technology Promotion Project (NJ2025-03) and 2023 Project of Pneumatic High-Speed Precision Seed Metering Devices and Key Components of High-Speed Electrically Driven Seeders (2023ZY02009-03).

Data Availability Statement

The data presented in this study are available on request from the authors.

Acknowledgments

The authors thank the editor and anonymous reviewers for providing helpful suggestions for improving the quality of this manuscript.

Conflicts of Interest

The authors declare no conflicts of interest.

Abbreviations

GGravitational force acting on soybean seeds (N)
F1Pressure acting on soybean seeds at the seed discharge port (N)
f1Resistance of the soybean seed (N)
QVolumetric airflow rate through any given equipotential surface (m3/s)
RDistance between the equipotential surface and the center of the flow field (m)
uRVelocity of the airflow (m/s)
ΔpStatic pressure difference between the flow field center and the flow field edge (Pa)
ρAir density (kg/m3)
CdDimensionless drag coefficient (1)
dhDiameter of the seed drum’s holes (m)
dsDiameter of the seed (m)
ρ1Density of soybean seeds (kg/m3)
v0Seed speed (m/s)
ωAngular velocity of the seed drum (rad/s)
rRadius of the seed drum (m)
aAcceleration of the seed (m/s2)
nRotational speed of the seed drum (r/s)
vkAirflow velocity after positive pressure acceleration (m/s)
lMovement distance of the seed (m)
F3Thrust force of the airflow (N)
uCoefficient of friction between the seeds and the tube wall (1)
F N Normal pressure exerted by the seeds on the tube wall (N)
R 1 Trajectory radius of seeds in the curved section (m)
αAngle between the seed velocity direction line and the horizontal line (°)
DtDiameter of the seed tube (m)
dmaxMaximum size of the seed’s long axis (m)
γSeed delivery angle (°)
DHorizontal distance from the seed delivery tube to the point where the seed press wheel touches down (m)
HVertical distance from the end of the seed delivery tube to the ground (m)
DwDiameter of the press wheel (m)

References

  1. Dun, G.; Mao, N.; Gao, Z.; Wu, X.; Liu, W.; Zhou, C. Model construction of soybean average diameter and hole parameters of seed-metering wheel based on DEM. Int. J. Agric. Biol. Eng. 2022, 15, 101–110. [Google Scholar] [CrossRef]
  2. Xu, J.; Wang, X.; Zhang, Z.; Wu, W. Discrete Element Modeling and Simulation of Soybean Seed Using Multi-Spheres and Super-Ellipsoids. IEEE Access 2020, 8, 222672–222683. [Google Scholar] [CrossRef]
  3. National Bureau of Statistics. The 2024 National Economic and Social Development Statistical Bulletin of the People’s Republic of China. Available online: https://www.stats.gov.cn/sj/zxfb/202502/t20250228_1958817.html (accessed on 16 July 2025).
  4. Ma, J.; Zhao, P.; Li, M.; Niu, J. The evolution of global soybean trade network pattern based on complex network. Appl. Econ. 2024, 56, 3133–3149. [Google Scholar] [CrossRef]
  5. Wang, M.; Liu, D.; Wang, Z.; Li, Y. Structural Evolution of Global Soybean Trade Network and the Implications to China. Foods 2023, 12, 1550. [Google Scholar] [CrossRef]
  6. Laber, M.; Klimek, P.; Bruckner, M.; Yang, L.; Thurner, S. Shock propagation from the Russia–Ukraine conflict on international multilayer food production network determines global food availability. Nat. Food 2023, 4, 508–517. [Google Scholar] [CrossRef]
  7. Ding, Y.; Yang, L.; Zhang, D.; Cui, T.; He, X.; Zhong, X. Control System of Motor-driving Maize Precision Planter Based on GPS Speed Measurement. Nongye Jixie Xuebao/Trans. Chin. Soc. Agric. Mach. 2018, 49, 42–49. [Google Scholar] [CrossRef]
  8. Ding, Y.; Yang, L.; Zhang, D.; Cui, T.; Li, Y.; Zhong, X.; Xie, C.; Ding, Z. Novel low-cost control system for large high-speed corn precision planters. Int. J. Agric. Biol. Eng. 2021, 14, 151–158. [Google Scholar] [CrossRef]
  9. Yang, L.; Yan, B.; Zhang, D.; Zhang, T.; Wang, Y.; Cui, T. Research progress on precision planting technology of maize. Nongye Jixie Xuebao/Trans. Chin. Soc. Agric. Mach. 2016, 47, 38–48. [Google Scholar] [CrossRef]
  10. Xue, P.; Xia, X.; Gao, P.; Ren, D.; Hao, Y.; Zheng, Z.; Zhang, J.; Zhu, R.; Hu, B.; Huang, Y.; et al. Double-Setting seed-metering device for precision planting of soybean at high speeds. Trans. ASABE 2019, 62, 187–196. [Google Scholar] [CrossRef]
  11. Liu, Q.; Cui, T.; Zhang, D.; Yang, L.; Wang, Y.; He, X.; Wang, M. Design and experimental study of seed precise delivery mechanism for high-speed maize planter. Int. J. Agric. Biol. Eng. 2018, 11, 81–87. [Google Scholar] [CrossRef]
  12. Carpes, D.P.; Alonço, A.D.S.; Rossato, F.P.; Veit, A.A.; De Souza, L.B.; Francetto, T.R. Effect of different conductor tubes on the longitudinal distribution of corn seeds. Rev. Bras. Eng. Agrícola E Ambient. 2017, 21, 657–662. [Google Scholar] [CrossRef]
  13. Wang, B.; Liao, Q.; Wang, L.; Shu, C.; Cao, M.; Du, W. Design and Test of Air-Assisted Seed-Guiding Device of Precision Hill-Seeding Centralized Seed-Metering Device for Sesame. Agriculture 2023, 13, 393. [Google Scholar] [CrossRef]
  14. Yazgi, A. Effect of seed tubes on corn planter performance. Appl. Eng. Agric. 2016, 32, 783–790. [Google Scholar] [CrossRef]
  15. Precision Planting LLC SpeedTube-Highspeed Seed Delivery System. Available online: https://www.precisionplanting.com/products/planters/speedtube (accessed on 17 July 2025).
  16. John Deere LLC ExactEmerge. Available online: https://www.deere.com/en/planting-equipment/row-units/exactemerge-row-unit/ (accessed on 17 July 2025).
  17. Du, X.; Liu, C. Design and testing of the filling-plate of inner-filling positive pressure high-speed seed-metering device for maize. Biosyst. Eng. 2023, 228, 1–17. [Google Scholar] [CrossRef]
  18. Liu, R.; Liu, Y.; Liu, Z.; Liu, L. Research on Positive Pressure Airflow Assisted Blowing and Seed Guiding Device of Corn High-speed Precision Planter. Nongye Jixie Xuebao/Trans. Chin. Soc. Agric. Mach. 2023, 54, 156–166. [Google Scholar] [CrossRef]
  19. Lau, T.C.W.; Nathan, G.J. Influence of Stokes number on the velocity and concentration distributions in particle-laden jets. J. Fluid Mech. 2014, 757, 432–457. [Google Scholar] [CrossRef]
  20. Salewski, M.; Fuchs, L. Effects of aerodynamic particle interaction in turbulent non-dilute particle-laden flow. J. Turbul. 2008, 9, 1–23. [Google Scholar] [CrossRef]
  21. Guzman, L.; Chen, Y.; Landry, H. Coupled CFD-DEM Simulation of Seed Flow in Horizontal-Vertical Tube Transition. Processes 2023, 11, 909. [Google Scholar] [CrossRef]
  22. Wang, Y.; Zhang, W.; Yan, W.; Qi, B. Design and Experiment of Seed Pressing Device for Precision Seeder Based on Air Flow Assisted Seed Delivery. Nongye Jixie Xuebao/Trans. Chin. Soc. Agric. Mach. 2020, 51, 69–76. [Google Scholar] [CrossRef]
  23. Lei, X.; Liao, Y.; Zhang, Q.; Wang, L.; Liao, Q. Numerical simulation of seed motion characteristics of distribution head for rapeseed and wheat. Comput. Electron. Agric. 2018, 150, 98–109. [Google Scholar] [CrossRef]
  24. Wang, X.; Hu, H.; Wang, Q.; Li, H.; He, J.; Chen, W. Calibration Method of Soil Contact Characteristic Parameters Based on DEM Theory. Nongye Jixie Xuebao/Trans. Chin. Soc. Agric. Mach. 2017, 48, 78–85. [Google Scholar] [CrossRef]
  25. Han, D.D.; Wang, Q.; Wang, Y.X.; Li, W.; Tang, C.; Lv, X.R. Determination and parameters calibration of the soybean-bonded particle model based on discrete element method. Comput. Part. Mech. 2025, 12, 231–244. [Google Scholar] [CrossRef]
  26. Tang, H.; Xu, F.; Xu, C.; Zhao, J.; Wang, Y.J. The influence of a seed drop tube of the inside-filling air-blowing precision seed-metering device on seeding quality. Comput. Electron. Agric. 2023, 204, 107555. [Google Scholar] [CrossRef]
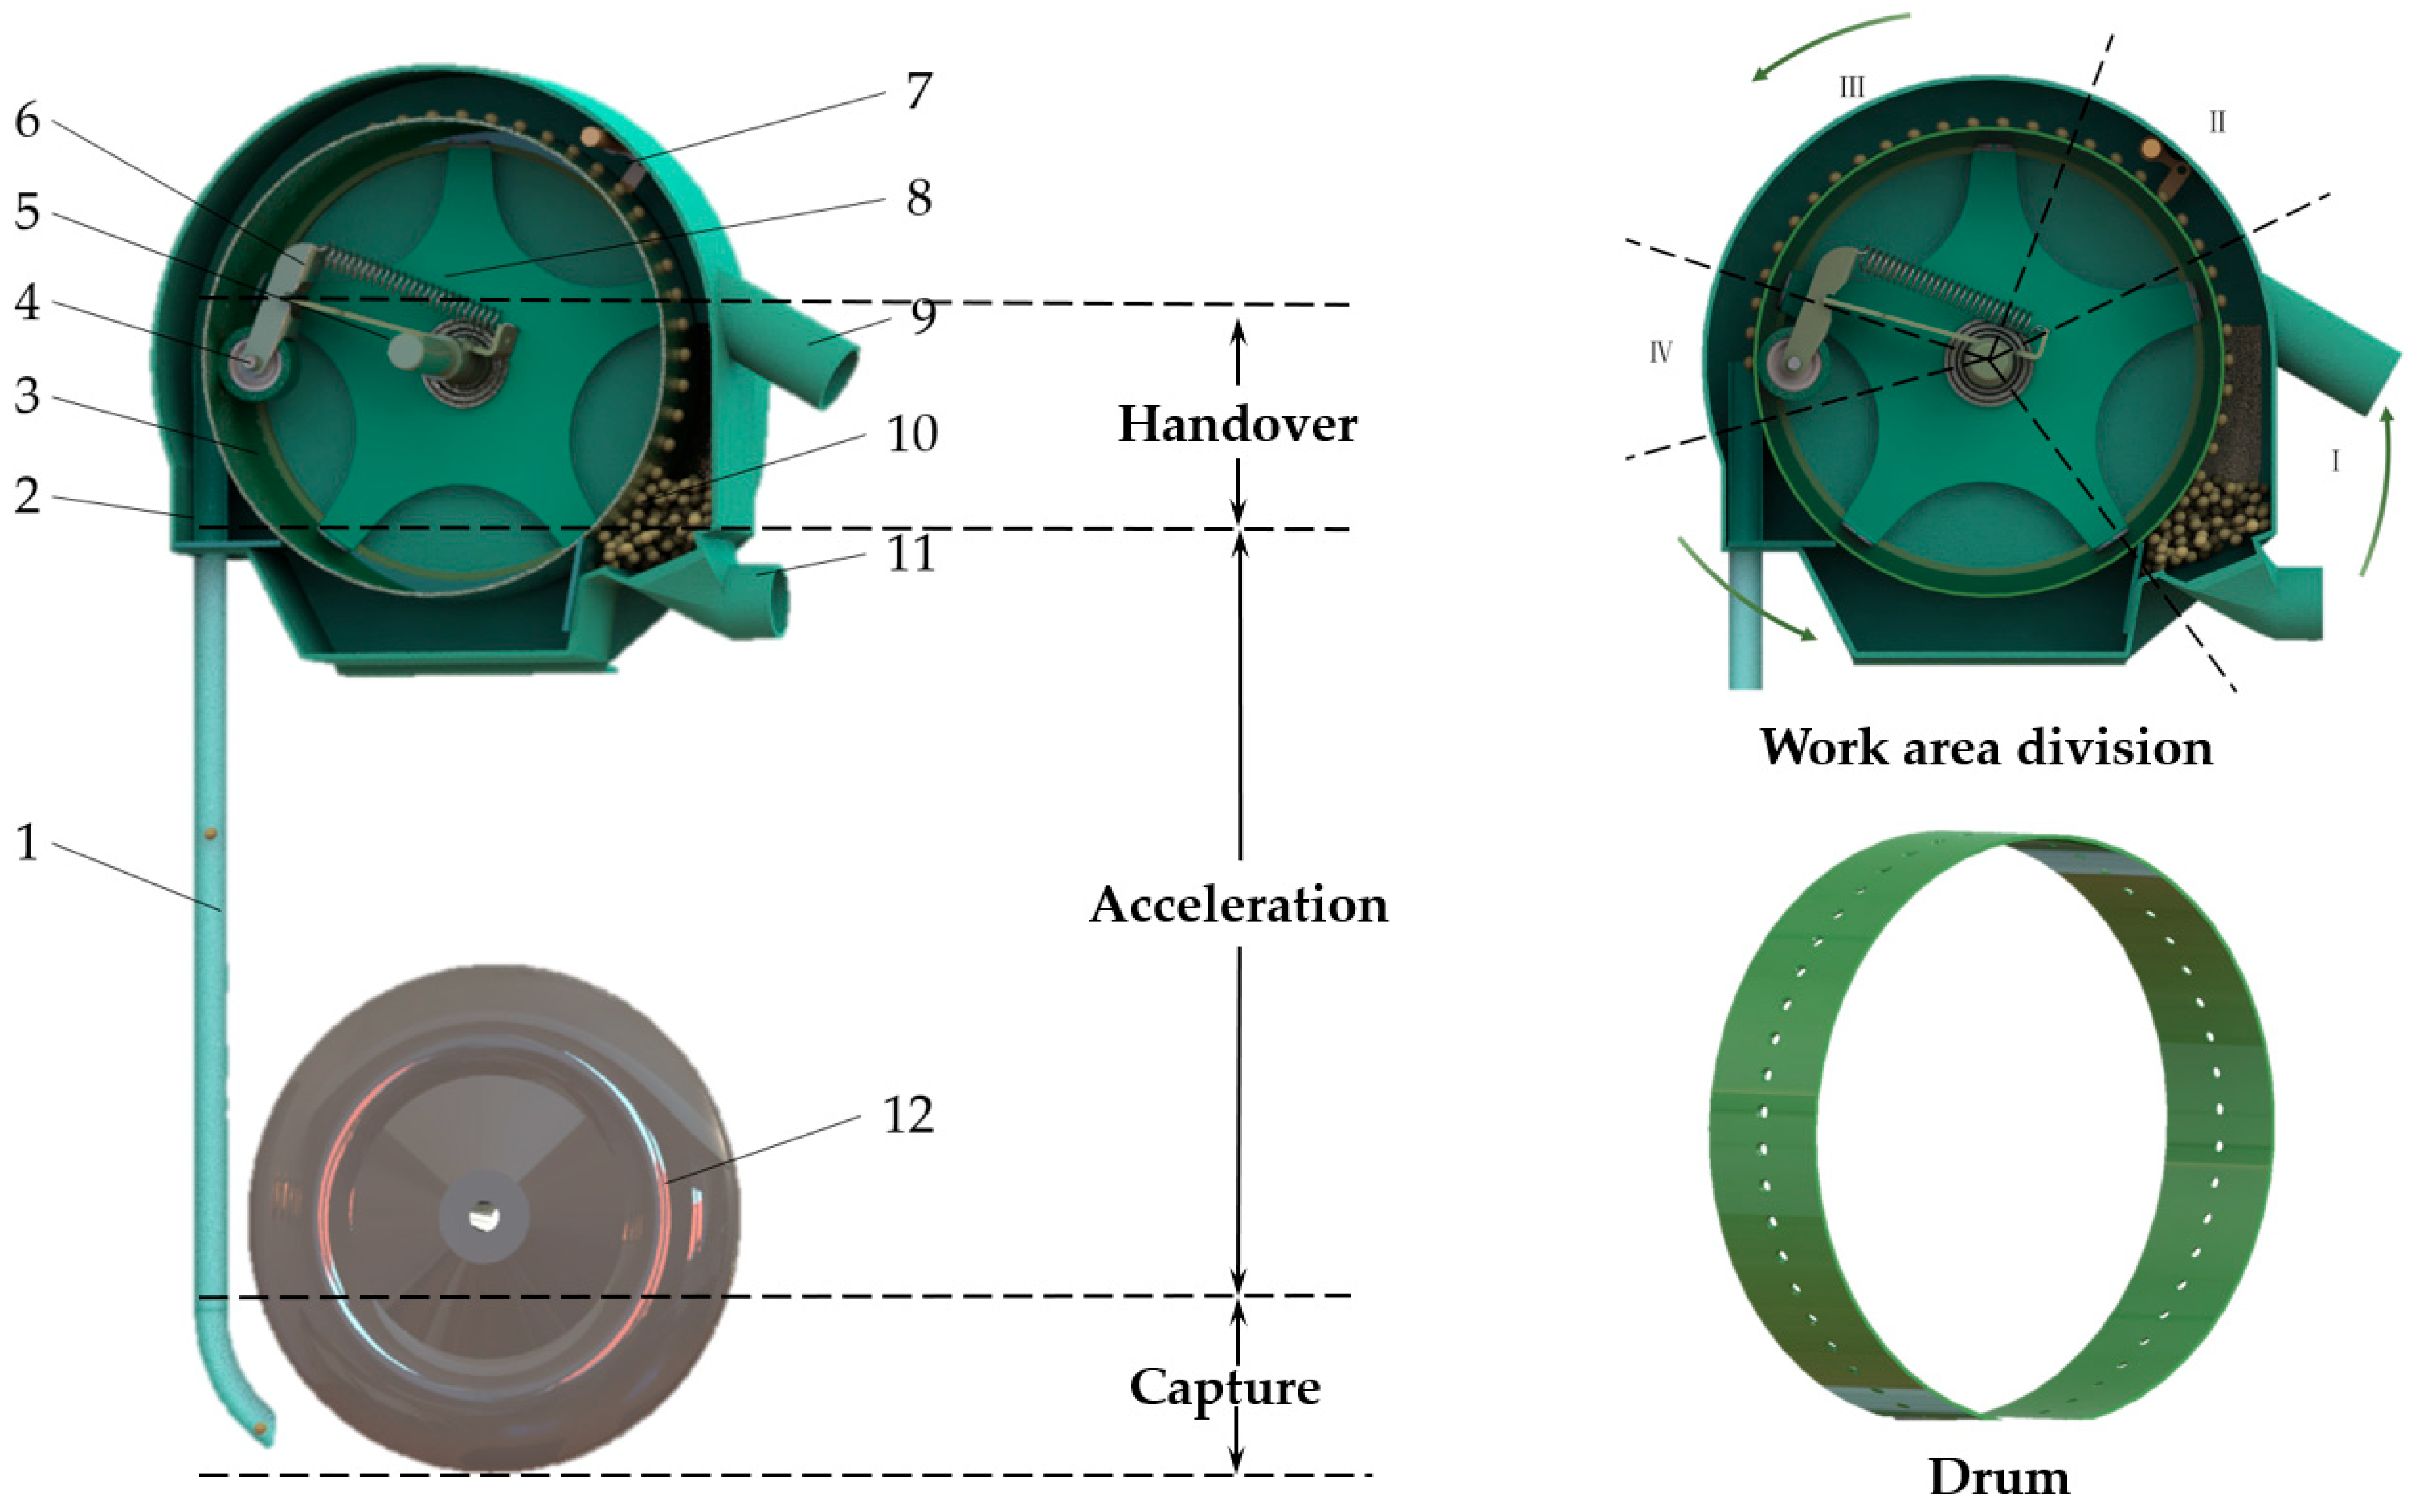
Figure 1. Structure and working principle of the seeding system. 1. Seed delivery tube, 2. the housing cover, 3. seed drum, 4. pressure relief wheel, 5. rotation shaft, 6. bracket, 7. seed cleaning device, 8. spring, 9. air inlet, 10. soybean seeds, 11. air delivery tube, and 12. seed press wheel. I. Seed filling zone, II. seed clearing zone, III. seed carrying zone, and IV. seed unloading zone.
Agronomy 15 02202 g001
Figure 2. Analysis of kinematic and mechanical models of soybean seeds during the handover, acceleration, and capture phases, and the numerical values of key parameters, such as Dt, DW, and γ, obtained based on this analysis.
Agronomy 15 02202 g002
Figure 3. Establishment of the simulation model.
Agronomy 15 02202 g003
Figure 4. Seeds trajectory under different positions of seed delivery tubes.
Agronomy 15 02202 g004
Figure 5. Seed velocity and trajectory in the seed delivery tube under different seed drum speeds. (a) Seed velocity and trajectory under a drum rotation speed of 11 rpm, (b) seed velocity and trajectory under a drum rotation speed of 13 rpm, (c) seed velocity and trajectory under a drum rotation speed of 16 rpm, (d) seed velocity and trajectory under a drum rotation speed of 19 rpm, (e) seed velocity and trajectory under a drum rotation speed of 21 rpm, and (f) seed velocity and trajectory under a drum rotation speed of 24 rpm.
Agronomy 15 02202 g005
Figure 6. Pressure and velocity graph for different inlet pressures at the same seed drum speed.
Agronomy 15 02202 g006
Figure 7. Seed velocity and trajectory in the seed delivery tube under different air inlet pressures. (a) Seeds velocity and trajectory at different times when the air pressure is zero, (b) seeds velocity and trajectory at different times under 2.5 kpa air pressure, (c) seeds velocity and trajectory at different times under 3.0 kpa air pressure, (d) seeds velocity and trajectory at different times under 3.5 kpa air pressure, (e) seeds velocity and trajectory at different times under 4.0 kpa air pressure, and (f) seeds velocity and trajectory at different times under 4.5 kpa air pressure.
Agronomy 15 02202 g007aAgronomy 15 02202 g007b
Figure 8. The seed’s attitude and trajectory in the seed delivery tube under the same inlet air pressure and rotational speed.
Agronomy 15 02202 g008
Figure 9. Simulation analysis of the seed compaction process by the press wheel.
Agronomy 15 02202 g009
Figure 10. Testing bench for seed-metering device performance. 1. Seed press wheel; 2. seed delivery tube; 3. the pneumatic drum seed-metering device; 4. seed-metering device test bench; 5. control panel; 6. control interface; 7. software display interface; 8. laptop computer; 9. fill light; 10. high-speed camera; and 11. conveyor belt.
Agronomy 15 02202 g010
Figure 11. Images of the sowing process captured by high-speed camera. The red circle marks the location of the seed and time stamps indicate milliseconds before the trigger event (t = 0 ms).
Agronomy 15 02202 g011
Table 1. Comparison of characteristics of different seed delivery devices.
TypesCharacteristicsPicture
Mechanical belt-type delivery systemEach seed is isolated within the compartments, effectively preventing bouncing, but the structure is relatively complex, and the rotational speed of the seed disc must be precisely synchronized with the mechanical belt.Agronomy 15 02202 i001
Brush belt-type delivery systemSeeds are fixed at specific positions by bristles, effectively preventing bouncing, but the structure is complex too, requiring precise coordination between the seed disc speed and the brush belt to achieve uniform seed distribution.Agronomy 15 02202 i002
Airflow-assisted delivery systemUtilizing airflow to carry seeds at high speeds, reducing collision chances, with a simple structure that does not require additional high-precision motors. However, the downside is that the high speed of the seeds causes them to bounce upon contact with soil.Agronomy 15 02202 i003
Airflow-assisted delivery system + press wheelThe seed delivery process involves minimal collision, has a simple structure, and during the high-speed landing of seeds, they are immediately pressed by the press wheel, resulting in uniform seed spacing.Agronomy 15 02202 i004
Table 2. Coupled simulation parameters.
ParametersSoybeansSoilSteelReference
Solid phasePoisson’s ratio0.2450.350.30[24,25]
Shear modulus (Pa)7.5 × 1071 × 1061.37 × 108
Density (kg/m3)122025507850
Restitution coefficient (with particle)0.390.60.52
Static friction coefficient (with particle)0.290540.27
Rolling friction coefficient (with particle)0.050.310.05
Gas phaseFluidAir [26]
Gravitational acceleration (m/s2)9.81
Density (kg/m3) 1.225
Table 3. Press wheel capture performance under different drum rotational speeds.
Seed Drum Rotational Speeds Speed (rpm)ReplicateCI (%)Mean CI
(%)
11196.096.0
295.0
397.0
13195.094.3
295.0
393.0
16195.094.3
294.0
394.0
19194.094.0
294.0
394.0
Disclaimer/Publisher’s Note: The statements, opinions and data contained in all publications are solely those of the individual author(s) and contributor(s) and not of MDPI and/or the editor(s). MDPI and/or the editor(s) disclaim responsibility for any injury to people or property resulting from any ideas, methods, instructions or products referred to in the content.