Article

Optimizing Growth, Physiology, and Saponin Production in Primula veris L. Through Tailored LED Light Spectra for Energy-Efficient Cultivation

1
Institute of Plant Breeding and Genetic Resources, Hellenic Agricultural Organization Demeter, Thermi, 57001 Thessaloniki, Greece
2
Laboratory of Range Science, Department of Forestry and Natural Environment, Aristotle University of Thessaloniki, 54124 Thessaloniki, Greece
3
Center of Research and Innovation, Fondazione Edmund Mach, San Michele all’Adige, 38098 Trento, Italy
*
Author to whom correspondence should be addressed.
Agronomy 2025, 15(9), 2184; https://doi.org/10.3390/agronomy15092184
Submission received: 9 July 2025 / Revised: 10 September 2025 / Accepted: 11 September 2025 / Published: 13 September 2025
(This article belongs to the Special Issue Light Environment Regulation of Crop Growth)

Abstract

Primula veris L. (cowslip) is a medicinal plant traditionally used for respiratory ailments, with its therapeutic properties attributed to triterpene saponins and phenolic glycosides found in the roots and the aerial parts. The present study aimed to investigate the impact of different LED light spectra (red, blue, red:blue, and white fluorescent as a control) on P. veris’s relative growth rate, physiology, and secondary metabolite production to optimize its cultivation under controlled conditions. The results demonstrate that the light quality significantly influences P. veris’s growth characteristics, physiology, and secondary metabolite production. Red light promoted leaf expansion, while the red:blue LED combination enhanced the root fresh weight and concentration of total chlorophylls and carotenoids in primrose leaves in comparison to the white fluorescent and solitary red light, respectively. Red light significantly increased the accumulation of key secondary metabolites (primeverin, primulaverin, and primulic acids) in roots during the flowering phase compared with the white inflorescent. In addition, the concentration of phenolic compounds was strongly influenced, showing a decrease between the vegetative and the flowering stage of development. Finally, this study highlights the potential of tailored LED lighting to optimize P. veris cultivation, enhancing both biomass and the production of valuable bioactive compounds, taking into account the developmental stage of the plants.

1. Introduction

Primula veris L. (syn: Primula officinalis; Fam. Primulaceae), commonly known as cowslip, is a herbaceous perennial medicinal plant that thrives in diverse habitats, from grasslands to forests, of Europe and West Asia [1,2]. Cowslip develops leaves in rosette, yellow flowers in clusters early in spring and grows up to 25 cm in height. The roots contain significant amounts of triterpene saponins, products of the secondary metabolism of cowslip, with expectorant, sedative, diuretic, and anticoagulant properties [3,4]. According to the existing EMA monograph (EMA/HMPC/104095/2012) [5], cowslip root herbal preparations are mainly used in the treatment of respiratory tract conditions, such as asthma, bronchitis, and catarrh, due to the secretolytic and secretomotoric activity of the triterpenoid saponins, which are present in up to 12% of the plant material.
Secondary metabolites are accumulated in diverse plant organs (leaves, stems, flowers, roots, etc.) in relatively low amounts, and although they are not considered necessary for plant survival, they are important for their adaptation under adverse conditions [6]. Besides others, some of the most abundant secondary metabolites in cowslip have been reported as metabolic markers for root raw materials, such as primulic acid I and II (triterpene saponins), and phenolic glycosides, such as primeverin and primulaverin [7,8,9].
The light quality and intensity as well as the photoperiod, apart from playing a pivotal role on the survival of plants, have a significant impact on the biosynthesis of numerous secondary metabolites, which are considered important characteristics for crops [10,11], especially medicinal ones [12,13]. Light is primarily responsible for triggering the production of secondary metabolites through the link of photons with photoreceptors, which results in altered gene expression and signaling pathway networks. The characteristics of light absorption are determined by the interaction between a chromophore and a photoreceptor protein [14,15]. Plants absorb red (600–700 nm) and blue (400–500 nm) wavelengths via chlorophylls and carotenoids, with these specific spectral qualities known to profoundly influence photosynthetic processes and root development [16,17].
Recent studies underscore the potential of tailored LED spectra to enhance the production of defense-related secondary metabolites in various medicinal species. Notably, the accumulation of triterpenoid saponins—a class of compounds structurally similar to those in P. veris—has been significantly influenced by LED lighting. For instance, the steroidal saponin concentration and biomass production in Paris polyphylla were stimulated under red-blue light, which also upregulated related metabolic pathways [18]. Similarly, red and blue light treatments substantially increased triterpenoid saponin glycosides in Bacopa monnieri [19] and the total saponin concentration in Panax ginseng, concurrently enhancing ginsenoside biosynthetic gene transcription [20]. Beyond saponins, red light has also improved adventitious root biomass and the accumulation of compounds like hypericin in Hypericum perforatum [21].
While the regulatory effects of specific light spectra on plant growth characteristics and the secondary metabolism are increasingly recognized in diverse medicinal plants [13,22,23,24,25,26,27,28,29], the knowledge regarding P. veris and the optimization of its valuable triterpene saponin and phenolic glycoside production under tailored LED lighting remains notably scarce. Taking into account the cowslip’s important medicinal uses and applications and its significance as a constituent of terrestrial ecosystems themselves, it is necessary to assemble the modulatory effects of LED lights on cowslip production under controlled conditions towards the production of superior root biomass through the development of an LED species-specific system with tailored profiles. The aim of the present study was to investigate the effect of different LED light spectra (red, blue, red:blue, and white) on cowslip’s relative growth rate characteristics as well as physiological and biochemical processes. Ultimately, the goal was to investigate whether under controlled light conditions cowslip could produce stable and superior biomass in terms of valuable secondary metabolites such as triterpenoid saponins and phenolic glycosides.

2. Materials and Methods

2.1. Plant Material, Growth Conditions, and Light Treatments

Inflorescences of P. veris plants were harvested during 2019 from a wild population of Cholomontas mount (North Greece, 40.43273 N, 23.50500 E), seeds were collected, and voucher specimens were saved at the Institute of Plant Breeding & Genetic Resources. The seeds were stratificated for 6 months under 4 °C, and after treatment of 500 ppm GA3 for 24 h, they were sowed in plastic containers containing peat (Terrahum and TS2 in ratio of 3:1) for germination. The young plantlets obtained were transplanted into 0.5 L pots filled with TS2 peat:perlite (3:1) and acclimated in a greenhouse under natural light conditions until 8 leaves were fully developed. During this period plants were irrigated weekly with 200 mL of tap water. The experiment was conducted in an 18 m2 container-type indoor vertical farming system with dimensions of 7.2 m (L) × 2.5 m (W) × 2.3 m (H), under artificial lighting, at the facilities of Sustainable Agricultural Structures & Renewable Energy Resources Lab (SASRER Lab) in ELGO-DIMITRA (Thermi Thessaloniki, Greece).
Different light treatments were applied, using LEDs based on our preliminary experiments on P. veris, while the chosen conditions represent optimal ranges often used in such studies to support plant growth. Photosynthetic Photon Flux Density (PPFD) was set at 200 ± 10 μmol m−2 s−1 over the plant canopy and measured using LI-180 Spectrometer (LI-COR Inc, Lincoln, NE, USA). The photoperiod was set at 14/10 h (day/night) and the temperature at 18 ± 2 °C, using an air conditioning unit. Relative humidity was set at 60 ± 10% and controlled with the use of humidifier. LED treatments were characterized by three different photon flux ratios of red (651 nm) and blue (451 nm), red:blue = 4, red:blue = 1, and red:blue = 0.3, with fluorescence white as a control (Figure 1).
For each treatment, 24 replicates were randomly allocated to four spectral light treatments. Irrigation was applied twice per week (each pot received 100 mL of water), in which fertilization was supplemented with half-strength Hoagland once per week. The duration of the experiment was 16 weeks, and the experiment was terminated at the flowering stage of the plants.

2.2. The Determination of the Relative Increase from Leaf Characteristics and Plant Biomass Production

To monitor the relative increase of the plants leaf characteristics under the effect of the different light treatments, the number of fully developed leaves and the length and width of two selected and marked leaves were monitored weekly. The relative increase (ΔΤ) of each leaf parameter was evaluated according to the following equation:
Relative Increase ΔΤ = [(Τ2 − Τ1)/Τ1] × 100
where T2 was the final and Τ1 the initial point of the time interval in which each leaf parameter was evaluated.
At the end of the experiment, plants were uprooted under tap water, preserving their root system, and allowed to drain from water on filter paper. Fresh weight of root system, aerial parts, single leaf, and whole plant were determined during vegetative and flowering developmental stage. For each individual plant, the biomass of its different tissues (roots, leaves, inflorescences) was collected in separate plastic bags and stored in −20 °C for further analysis.

2.3. The Determination of Leaf Photosynthetic Parameters

The leaf photosynthetic parameters, referring to net photosynthetic rate (μmol CO2 m−2 s−1), transpiration rate (mmol m−2 s−1), and stomatal conductance (mol m−2 s−1), were measured twice during the experiment. The first record took place 45 days after the start of the experiment (vegetative stage) and the second one at the flowering stage (one day before harvesting and termination of the experiment). Measurements were performed between 9 and 11 a.m. on three fully expanded and healthy leaves of six randomly selected plants per treatment, using an infrared gas analyzer (LCi-SD portable photosynthesis system, ADC BioScientific Ltd., Hoddesdon, UK).

2.4. Determination of Total Chlorophylls and Carotenoids

For the extraction of chlorophyll (a and b) and carotenoids, leaf disks with an area of 1.0 cm2 were collected from leaf parts lacking thick veins. A quantity of 100 mg of fresh leaf disks was mixed with 15 mL ethanol (96% v/v) and incubated at 78 °C in a water bath for 4 h until complete discoloration. The concentration of total chlorophylls and carotenoids was determined according to Wintermans and Mots [30] through monitoring the absorbance of the ethanolic extracts under 440, 649 και 665 nm using a spectrophotometer (HITACHI, U-1900, Hitachi High Technologies America, Inc., Schaumburg, IL, USA). The concentration of chlorophylls was determined according to the following equation:
TChl (α + b) (mg/g F.W) = (6.10 × A665 + 20.04 × A649) × 15/1000/Fresh weight
Carotenoids concentration was estimated using the following equation:
TCar (mg/g F.W) = (4.69 × A440 − 1.96 × A665 − 4.74 × A649) × 15/1000/Fresh weight

2.5. Determination of Chlorophyll Fluorescence

Chlorophyll fluorescence measurements were performed on leaves of five plants per treatment, using an Imaging PAM M-Series system (Heinz Walz Instruments, Effeltrich, Germany) as described by Moustakas et al. [31]. By using Win V2.41a software (Heinz Walz GmbH, Effeltrich, Germany), the following parameters were estimated: (a) the maximum efficiency of PSII photochemistry (Fv/Fm), (b) the effective quantum yield of PSII photochemistry (ΦPSII), (c) the quantum yield of regulated non- photochemical energy loss (ΦNPQ), (d) the quantum yield of non-regulated energy (ΦNO), and (e) the photochemical quenching that is the redox state of the plastoquinone pool (qP) that represents the fraction of open PSII reaction centers, at the actinic light intensity of 205 μmol m−2 sec−1, similar to the plants’ growth light. Briefly, the maximum efficiency of PSII photochemistry (Fv/Fm) was calculated as (Fm − Fo)/Fm, where Fm is the maximum fluorescence, and Fo is the minimal level of fluorescence in the dark-adapted state, whereas the effective quantum yield of PSII photochemistry (ΦPSII) was calculated as (F − Fs)/F. The maximum chlorophyll fluorescence in the light-adapted leaf (F) was measured with saturation pulses every 20 s for 5 min after application of the actinic light (205 μmol photons m−2 s−1), and the steady-state photosynthesis (Fs) was measured after 5 min illumination time before switching off the actinic light of 205 μmol photons m−2 s−1.

2.6. Extraction of Triterpene Saponins and Phenolic Compounds and Ultra Performance Liquid Chromatography–Mass Spectrometry (UPLC-MS/MS, MRM) Analyses

The frozen roots, leaves, and flowers were freeze-dried separately in −24 °C for 48 h (Freeze-dryer Alpha 1–2 LD plus, Christ, Osterode, Germany) and powdered using a laboratory Mill IKA A11. One hundred mg of powdered tissue was mixed with 4 mL methanol (80% v/v) for 30 min at room temperature under orbital shaking and sonicated for 20 min, and the extraction proceeded overnight at 4 °C in the dark. Each extract was filtered on an MILLEX 13 mm-0.22 µm PTFE membrane into glass vial and directly injected for LC-MS/MS analysis.
Targeted UPLC analysis was performed on a Waters Acquity UPLC system (Milford, MA, USA) using a Waters Acquity HSS T3 column 1.8 μm, 100 mm × 2.1 mm for the separation of polyphenolic and triterpene saponin metabolites. The analyses were performed following the previously described method by Vrhovsek et al. [32] using water and acetonitrile as mobile phases for the gradient and enriched with two phenolic compounds (primeverin and primulaverin) and two main triterpene saponins (primulic acid I and II), as described by Sarropoulou et al. [9]. Mass spectrometry detection was performed on a Waters Xevo TQMS instrument (Waters Corporation, Milford, MA, USA) equipped with an electrospray (ESI) source. Data processing was performed using the Mass Lynx Target Lynx Application Manager (Waters).

2.7. Energy Usage, Water Usage, and Land Area Usage

Electrical energy consumption was determined using an energy data logger attached to the growth room, as well as manufacturer’s information of the rated power of the devices used throughout the cultivation period. Regarding energy consumption, LED lighting was the sole differentiating factor between the treatments. Energy use efficiency (EUE) was calculated following the methodology of Pennisi et al. [33], as the ratio between total fresh yield and the corresponding electricity consumption per treatment (g FW kWh−1). Water usage remained constant across all treatments, as an equal volume of water was supplied to each plant. Water use efficiency (WUE) was expressed as the ratio of total plant fresh weight to the total amount of water delivered per plant (g FW L−1 H2O) [34]. Land use efficiency (LUE) was determined based on the projected annual yield per square meter (kg m−2 a−1), following the approach of Pennisi et al. [33]. Two scenarios were considered: one assuming single-layer cultivation and another simulating a vertical system with four stacked layers. Each cycle lasted approximately 16 weeks, allowing for an estimated three-cycle annual production.
All efficiency calculations were based on the final yields and resource input recorded at the end of the cultivation period. In this context, total yield was defined as the fresh weight of the entire plant, including both aerial parts and root system. Yield values were scaled to a per square meter basis, according to planting density. Likewise, both energy and water consumption values were normalized to the same area unit (m2) to ensure comparability.

2.8. Statistical Analysis

The plant growth characteristics were monitored in 24 individual plants per light treatment (24 replicates), and the results are expressed as mean values. The photosynthetic and physiological parameters together with phytochemical characteristics were recorded in 6 replicates per light treatment, and the results are expressed as mean values ± Standard Error. For mean comparison, Duncan’s multiple range test was used at p ≤ 0.05. All statistical analyses were performed with the statistical package SPSS Ver. 23.0.0 (SPSS Inc. Chicago, IL, USA).

3. Results and Discussion

3.1. Relative Growth Rate with Focus on Leaf Characteristics Under Effect of Different LEDs

The morphological observations of P. veris rosettes revealed distinct relative growth responses under different LED treatments. During the first month (ΔT1–4), no significant differences in the leaf number relative increase were observed across the treatments (Figure 2A). The initial lack of variation across all light treatments during the first month suggests that young P. veris plants may exhibit a degree of developmental plasticity, initially relying on stored resources rather than immediate light-driven growth. However, from the sixth week onward (ΔT6), blue light reduced the relative increase of the leaf number compared to all other treatments, including the white fluorescent light, red, and red:blue, indicating a potential limitation in cell division or differentiation processes.
The red light significantly increased the leaf size (length and width) in P. veris after the fifth week of development (ΔT5) compared to all other LED treatments (Figure 2B,C). This observation is consistent with numerous studies including medicinal plants, such as Salvia plebeia and Thymus vulgaris, reporting that red light promotes leaf expansion and overall plant growth [35,36]. Red light is efficiently absorbed by phytochromes, photoreceptors that regulate various developmental processes, including leaf expansion, flowering transition, and germination control [37]. The enhanced leaf size under red light in P. veris suggests that phytochromes play a dominant role in promoting leaf growth in this species. Despite the observed increase in primrose leaf dimension relative growth rates (and as a result to their leaf area), the red light treatment recorded the lowest fresh weight (0.39 g), though differences in the fresh weight of individual leaves were not significant across treatments during the vegetative stage (Table 1). This implies that leaves under red light seemed to present a lower leaf mass area (LMA) compared to other treatments. Such a morphological adjustment, where plants prioritize increasing the leaf surface area over thickness, is a common physiological response to optimize light capture, particularly under light conditions that stimulate expansive growth [38]. Interestingly, the white fluorescent light resulted in the lowest relative increase of the leaf length and width, suggesting that the specific spectral composition of the other LED treatments, particularly the red and red:blue combinations, was more beneficial for leaf expansion.
As cowslip is valorized both for its medicinally important roots but also inflorescences, the productive potential of the plants under all four LEDs were investigated under two developmental stages: (a) the vegetative and (b) flowering stage. According to the results presented in Table 1, the total plant fresh weight, the aerial part fresh weight, and the single leaf fresh weight were not significantly affected under the different light treatments during the vegetative stage. Similar results were found for two types of basil (green and purple-leaved sweet basil), where no significant differences were observed in the biomass production under different light spectra [38]. Nevertheless, plants seemed to significantly increase their root fresh biomass under the blue and red:blue light treatments compared with the white fluorescent. During the flowering stage, almost a 2-fold increment in root biomass production was observed under the red and red:blue treatment. In addition, plants showed a significantly higher total plant fresh weight under red and red:blue treatments compared to those under the white fluorescent and blue light. This agrees with the view that red light is required for photosynthesis, but along with this, blue light is also important to increase the growth of plants [39,40]. Al Murad et al. [40] concluded that red light directly affects plant growth by increasing the plant fresh and dry weight, while blue light indirectly affects plant growth by influencing functions such as photosynthesis and chlorophyll and chloroplast development. Therefore, a combination of these two light spectra could have a positive effect on the biomass fresh weight. Najafabadi et al. [21] also reported an improved adventitious root biomass in Hypericum perforatum under a red light treatment. Overall, in P. veris the red:blue light’s growth-promoting effect seemed to balance the individual effects of the red and blue light.

3.2. Photosynthetic Parameters Under the Effect of Different LEDs

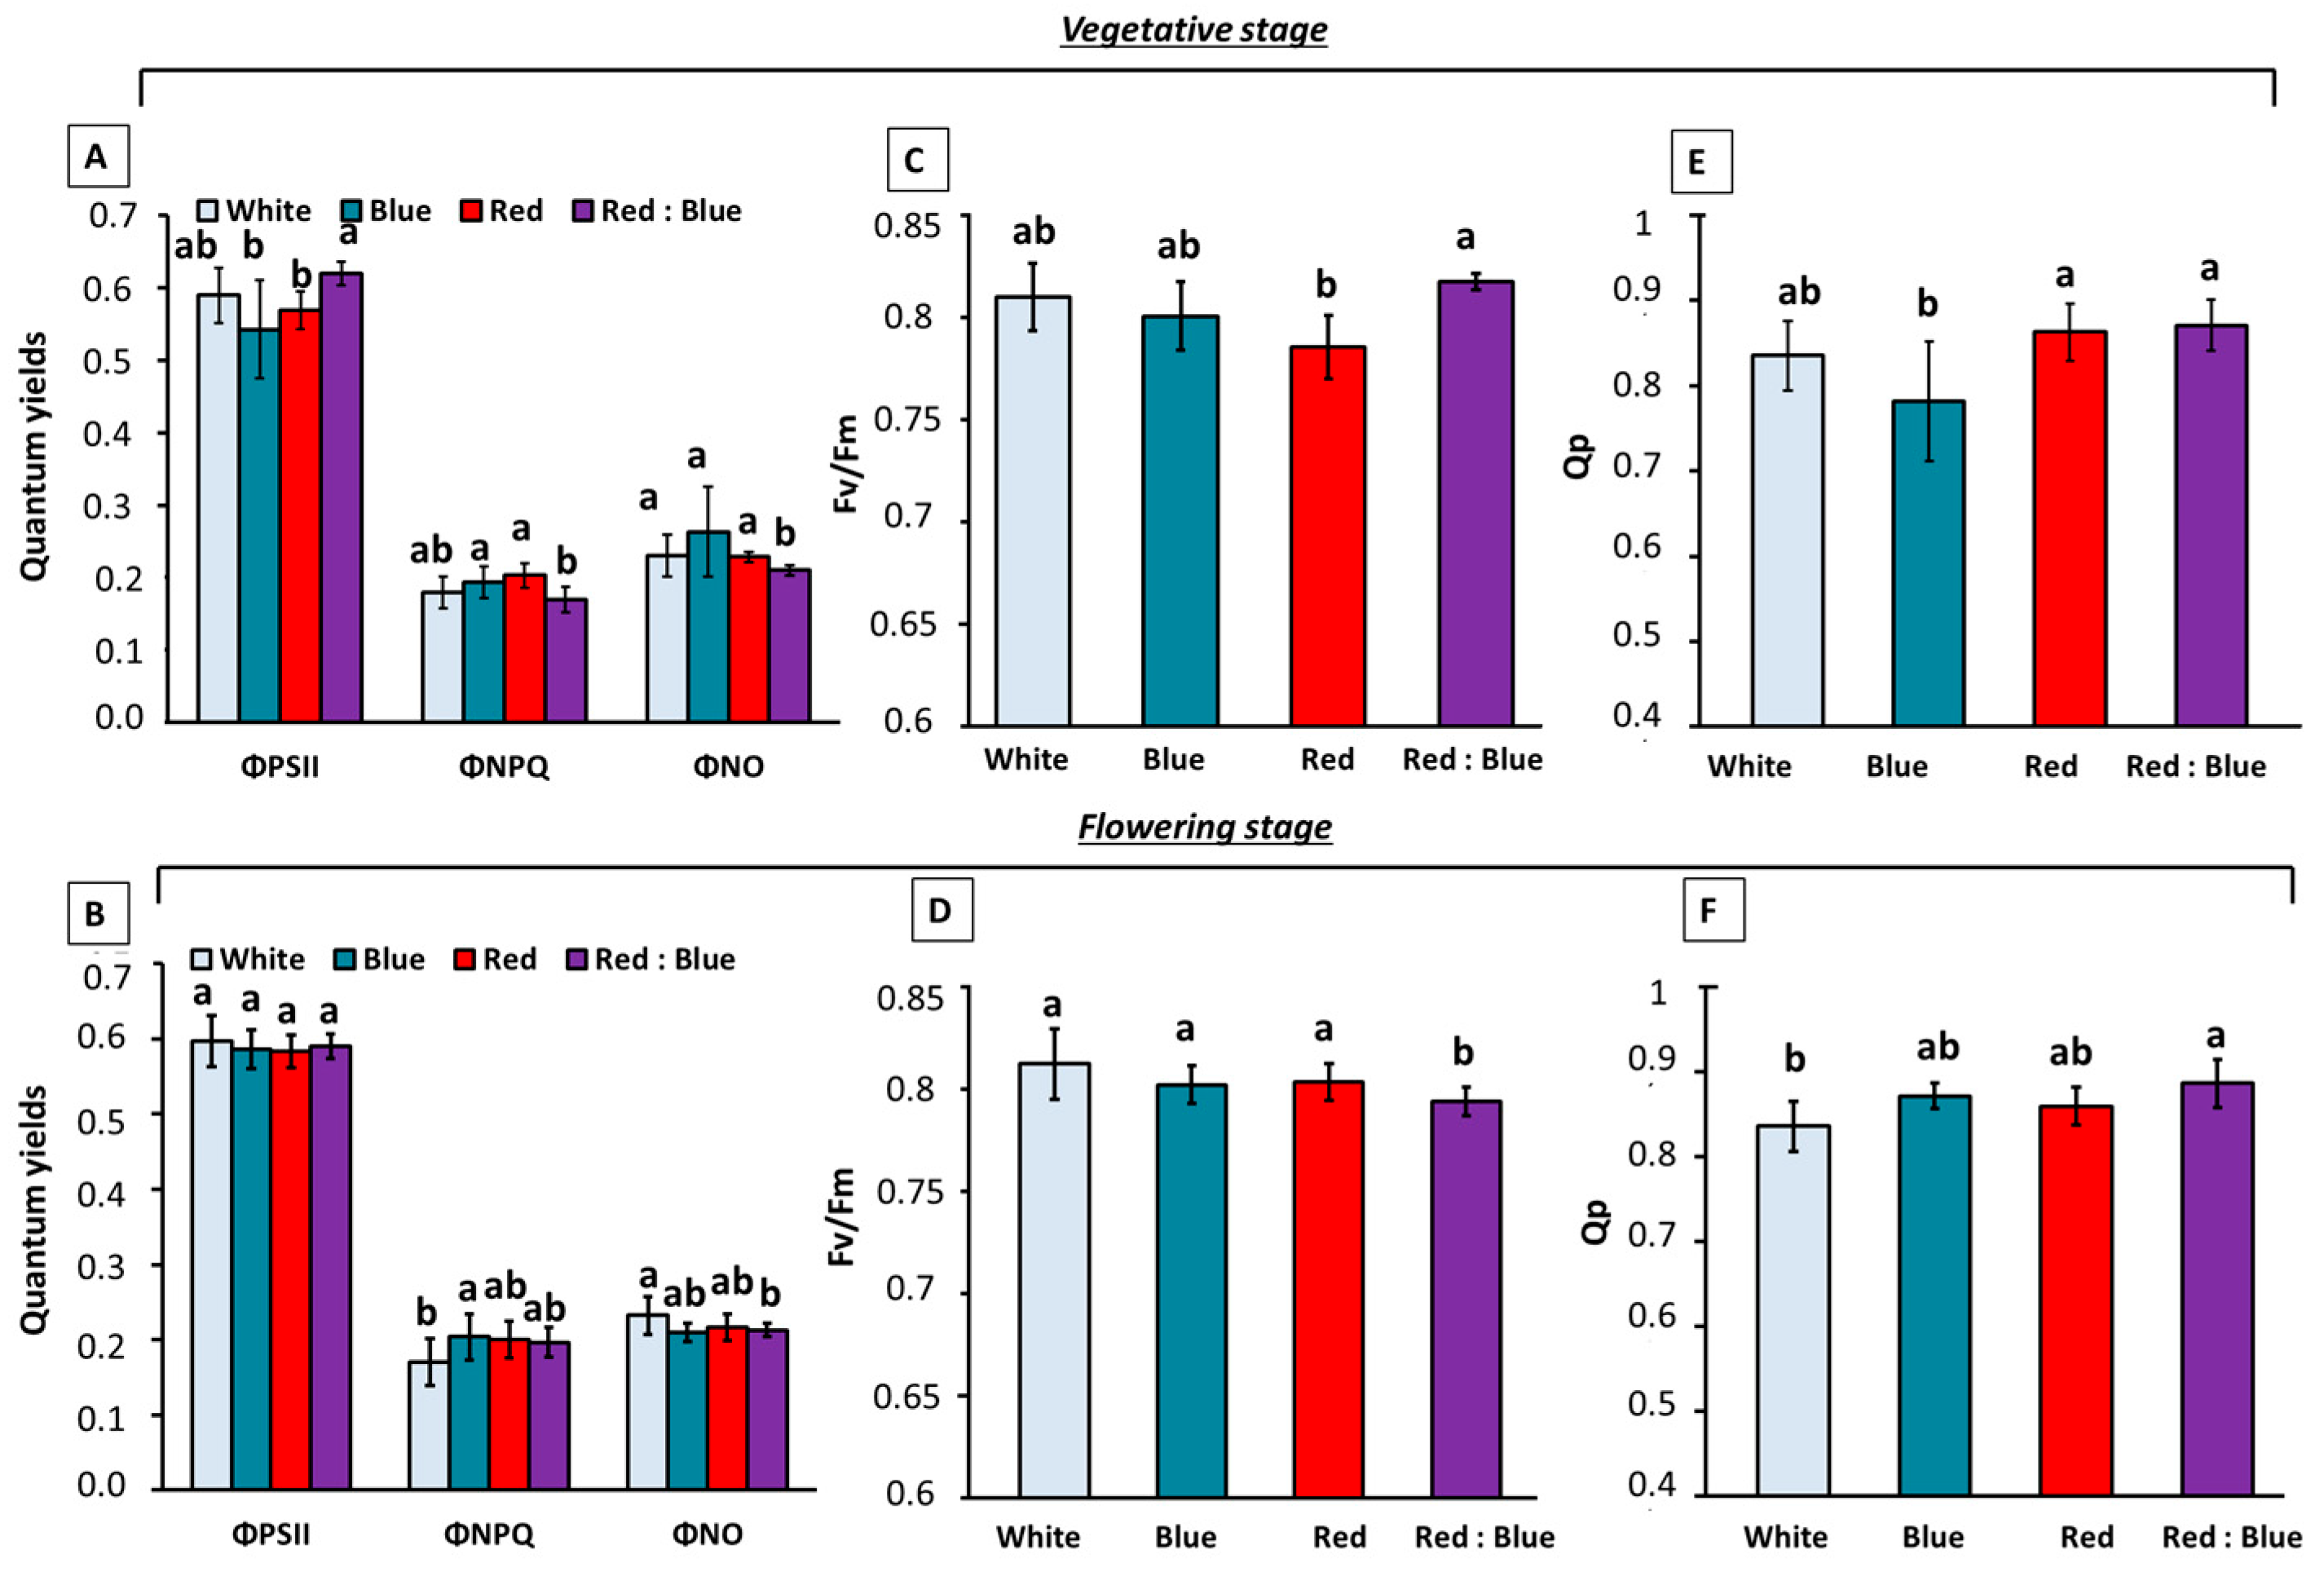
The changes in the light energy utilization in the PSII of cowslip leaves under four LED treatments during the vegetative and flowering stage were estimated by measuring the amount of light energy allocated for photochemistry in PSII (ΦPSII), regulated non-photochemical energy loss (ΦNPQ), and non-regulated energy loss in PSII (ΦNO) (Figure 3). During the vegetative stage, the effective quantum yield of the PSII photochemistry (ΦPSII) of plants treated with the red:blue light presented the highest value, indicating an improved light energy utilization for photochemistry, but was significantly increased only compared to those treated with red or blue light (Figure 3A). This was accompanied by a significant decrease in both the photoprotective energy dissipation as heat (ΦNPQ) as well as the quantum yield of the non-regulated energy (ΦNO), further supporting the enhanced efficiency of the light energy utilization under this treatment. This result indicates that the red:blue light optimized the balance between light absorption and energy dissipation, minimizing photoinhibition and maximizing photosynthetic efficiency. The maximum efficiency of PSII (Fv/Fm) also showed a significant increase under the red:blue treatment compared to the red or blue light during the vegetative stage (Figure 3C,D), while the redox state of quinone A (qP), an estimate of the fraction of open PSII reaction centers, was significantly increased under the red:blue treatment compared to the blue light alone (Figure 3E,F). These results further confirm that the red:blue (1:1) ratio promotes optimal PSII function and electron transport during early growth. During the flowering stage, despite the fact that the red:blue treatment scored a lower maximum efficiency of PSII (Fv/Fm) compared to the white light, suggesting possible photoinhibition, the effective quantum yield (ΦPSII) remained unchanged due to the significantly increased fraction of the open reaction centers (qP) (Figure 3E,F).
While the leaf photosynthetic rate did not show significant differences among treatments during the vegetative stage (Figure 4A), transpiration rates were significantly higher under the red:blue light compared to the red light alone (Figure 4B). Moreover, the stomatal conductance was higher under both the blue and red:blue light compared to the red light (Figure 4C). These findings indicate that the red:blue treatment may enhance gas exchange and water transport, potentially contributing to the observed increase in biomass production. Blue light is known to regulate stomatal opening [41], and the increased stomatal conductance under the blue and red:blue light could facilitate CO2 uptake for photosynthesis.
During the flowering stage, significant variations were observed in photosynthetic rates, with blue, red, and red:blue treatments showing higher rates compared to the white fluorescent light (Figure 4D). While red and red:blue treatments appeared to improve the stomatal conductance visually, these differences were not statistically significant (Figure 4F). Nonetheless, these findings indicate that specific LED spectra (blue, red, and red:blue) offer clear advantages over traditional white, fluorescent light in terms of the net photosynthetic rate during the flowering phase, even if their overall effect on other gas exchange parameters might be less pronounced.
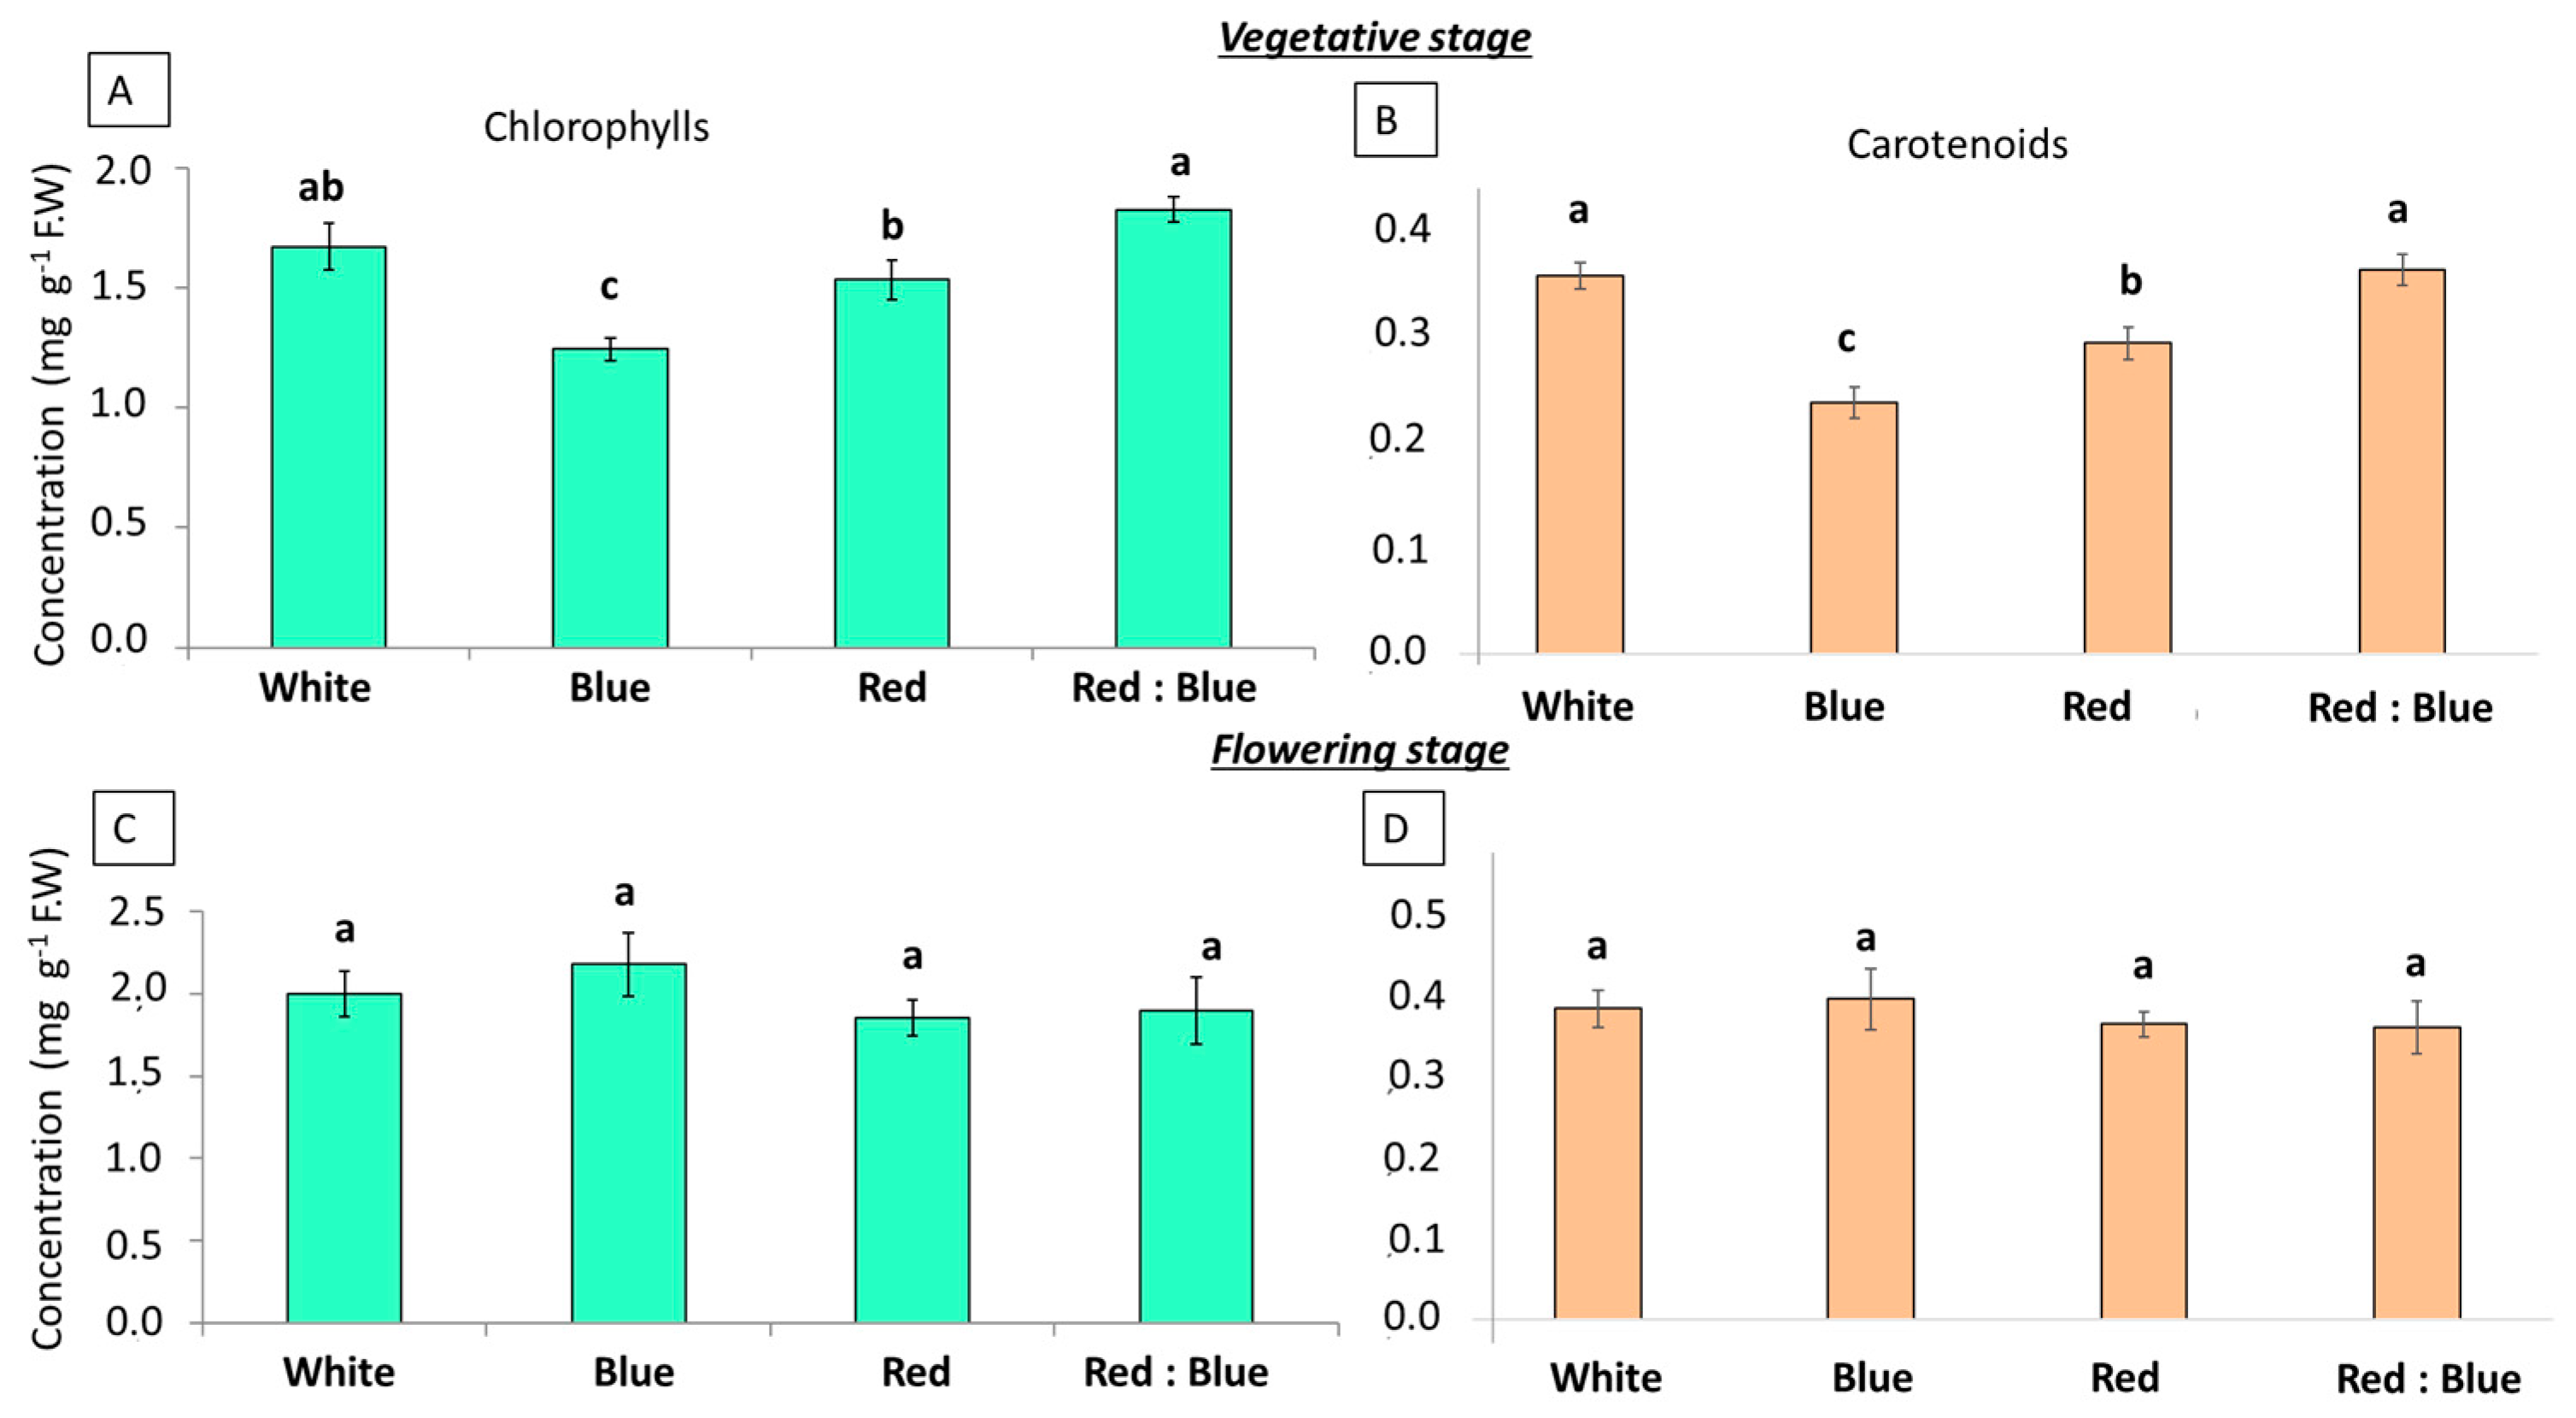
During the vegetative stage, chlorophyll (a + b) concentrations ranged from approximately 1.2 mg g−1 FW (under blue light) to 1.8 mg g−1 FW (under red:blue light). The red:blue treatment resulted in significantly higher chlorophyll contents compared to individual red or blue light treatments (Figure 5A). Similarly, for carotenoids red:blue and white fluorescent treatments showed significantly higher concentrations than red light, which in turn was significantly higher than the blue light treatment (Figure 5B). In particular, under the red:blue light treatment, the enhanced pigment accumulation aligns with the observed increase in photosynthetic efficiency in the vegetative stage.
Chlorophylls are the primary light-absorbing pigments, and carotenoids play a role in photoprotection and light harvesting, while chlorophyll a and b absorb light most strongly in the red and blue regions of the spectrum [26]. Whereas blue light plays a crucial role in regulating the expression of genes involved in chlorophyll biosynthesis by activating photoreceptors, such as cryptochromes, that trigger signaling pathways enhancing the production of enzymes necessary for chlorophyll synthesis, the red light absorbed by both chlorophyll a and b provides the energy needed to drive the photosynthetic reactions, so it is essential for the function of photosynthesis itself [42]. Despite being accessory pigments, carotenoids also play a vital role in photosynthesis, absorbing light in the blue–green region of the spectrum and transferring energy to chlorophylls, extending the range of light wavelengths that can be used for photosynthesis. In addition, they quench excess energy and reactive oxygen species (ROS) that can be generated under high-light conditions, preventing damage to the photosynthetic apparatus, and serve as a photoprotective mechanism [43]. The enhanced pigment concentration in P. veris under the red:blue light during the vegetative stage suggests that this treatment promotes the development of a more robust photosynthetic apparatus, supporting the synergistic effect of these two wavelengths that may lead to a greater capacity for light absorption and energy conversion. In contrast, the influence of the light quality on the pigment content was notably diminished during the flowering stage. Chlorophyll concentrations ranged from approximately 1.9 mg g−1 FW (under red light) to 2.2 mg g−1 FW (under blue light). Moreover, at this developmental stage, insignificant differences were observed on both chlorophyll and carotenoid concentrations among the four applied light treatments (Figure 5C,D). Conclusively, the influence of the light quality on the pigment concentration is more pronounced during the vegetative stage in P. veris.

3.3. Saponins and Phenolic Metabolites Under the Effect of Different LEDs

The targeted metabolite profiling through an LC-MS/MS analysis of leaf, root, and flower extracts determined the presence of 11 secondary metabolites, 9 phenolic and 2 triterpenoid saponins (Tables S1 and S2), in cowslip inflorescence extracts. Among them, six were only identified in leaf samples (primulaverin, primeverin, robinin, epigallocatechin, primulic acid I and II) (Table S1), and four were identified in root extracts. As inflorescences and leaves contained traces of most of the identified secondary metabolites, a special focus was placed on roots as the most abundant tissue in the two species-characteristic phenolic glycosides (primulaverin, primeverin) and two triterpenoid saponins (primulic acid I and II). Primeverin and primulic acid I were the major secondary metabolites in the extracts at both stages (vegetative and flowering) (Figure 6A,B). At the vegetative stage, the primulaverin concentration ranged between 1.6 and 2.4 mg g−1 root DW, primeverin ranged between 9.9 and 12.6 mg g−1 root DW, primulic acid I ranged between 4.3 and 4.7 mg/g root DW, and primulic acid II ranged between 0.2 and 0.4 mg g−1 root DW.
During the vegetative stage, the triterpenoid saponin concentration showed no significant variations among the different LED treatments. Possibly, in P. veris the biosynthesis of saponins might be less sensitive to the light quality during the early growth stage, indicating that other factors, such as developmental programming or resource allocation towards primary growth, play a more dominant role at this stage. However, the primeverin concentration was stimulated in plants treated with red light compared to white and blue treatments (Figure 6A), indicating that red light could play a specific role in promoting the biosynthesis of this phenolic glycoside during early growth. During the flowering stage, both primeverin and primulaverin concentrations were significantly altered in the roots of plants treated with red light compared to the white fluorescent light (Figure 6B). In addition, red and red:blue light treatments promoted primulic acid I accumulation, increasing its concentration by almost 19% compared to the white fluorescent and blue light. Red light also induced a 2-fold increase in the primulic acid II concentration compared to blue light. As a result, red light, either alone or in combination with blue light, plays a crucial role in enhancing the production of both phenolic glycosides and triterpenoid saponins during the flowering stage, potentially through the activation of specific enzymes or signaling pathways. For example, red light could affect the accumulation of saponin or phenolic metabolites in P. veris through the activation of phytochrome, which can trigger complex signaling cascades that ultimately lead to changes in gene expression, including the upregulation of genes’ encoding enzymes involved in secondary metabolite biosynthesis [44]. Besides affecting the gene expression, red light could also influence the enzyme activity and carbon allocation; therefore, light signaling may lead to post-translational modifications or changes in enzyme localization that enhance their catalytic activity, while promoting photosynthesis and carbon fixation may provide more precursors for the biosynthesis of secondary metabolites. The findings of this study on P. veris are in line with previous reports recognizing both red and blue light qualities as effective elicitors for the regulation of terpenoids and phenolic compounds in medicinal plants such as Salvia przewalskii, Scutellaria baicalensis, Verbena officinalis, Rhodiola imbricata, Mentha canadensis, and others [29,45,46,47,48,49]. The plant species-dependent variable responses, together with the diverse nature of the secondary metabolite profile across species, underscore the importance of species-specific light quality optimization in maximizing both growth and the production of desired secondary metabolites.
The comparison of the concentrations of the four major secondary metabolites in the roots of plants harvested at the vegetative and flowering stage indicated that apart from the light quality, the developmental stage may play a pivotal role in the accumulation of the characteristic phenolic glycosides. Noticeably, a 2- to 3-fold reduction was recorded for the concentration of primulaverin and primeverin, respectively, between the vegetative and flowering period. Therefore, the developmental stage of the plant seems to be the most significant factor influencing the observed variations in the accumulated secondary metabolites in the present experiment. In more detail, the root concentration in primulaverin and primeverin was affected significantly by plants’ developmental stage, while to a lesser extent it was impacted by its interaction with the light treatment. In contrast, the concentration of primulic acid I and II in roots was influenced significantly by both the developmental stage and the light treatment. The strong influence of developmental stage on the levels of phenolic compounds in P. veris highlights the need to assess the plant’s phenological stage when investigating the effects of environmental factors on secondary metabolite production. Regarding the effect of the light interaction with secondary metabolites, this remains unclear for most of the medicinal plants. While the light quality can modulate the accumulation of specific metabolites, the developmental stage appears to be a major determinant of overall metabolite profiles. The close relationship of the developmental stage and the chemical profile of the plant is highlighted in several reports, pointing out that during the different stages of growth, the concentration of secondary metabolites may vary, and the stage of the plant organ development can play a crucial role [50,51,52,53,54]. Nevertheless, optimizing the total yield of these valuable metabolites per plant root biomass could be an important metric for a maximum compound production output. The total compound content (a compound yield index derived from metabolite concentration × estimated root dry weight, from estimated cowslip root dry matter content of 17%) represents distinct patterns among the metabolites. For primeverin and primulaverin, despite a notable increase in root biomass at the flowering stage, this growth did not fully offset their concurrent sharp decrease in concentration. This suggests that the total primeverin and primulaverin accumulated per plant might be similar or even slightly greater at the end of the vegetative phase, pointing to a potentially more time-efficient harvest window for these specific compounds. These contrasting accumulation dynamics underscore that optimal harvest timing in P. veris cultivation is highly dependent on the specific target compound and its unique developmental trajectory.

3.4. Energy Usage, Water Usage, and Land Area Usage

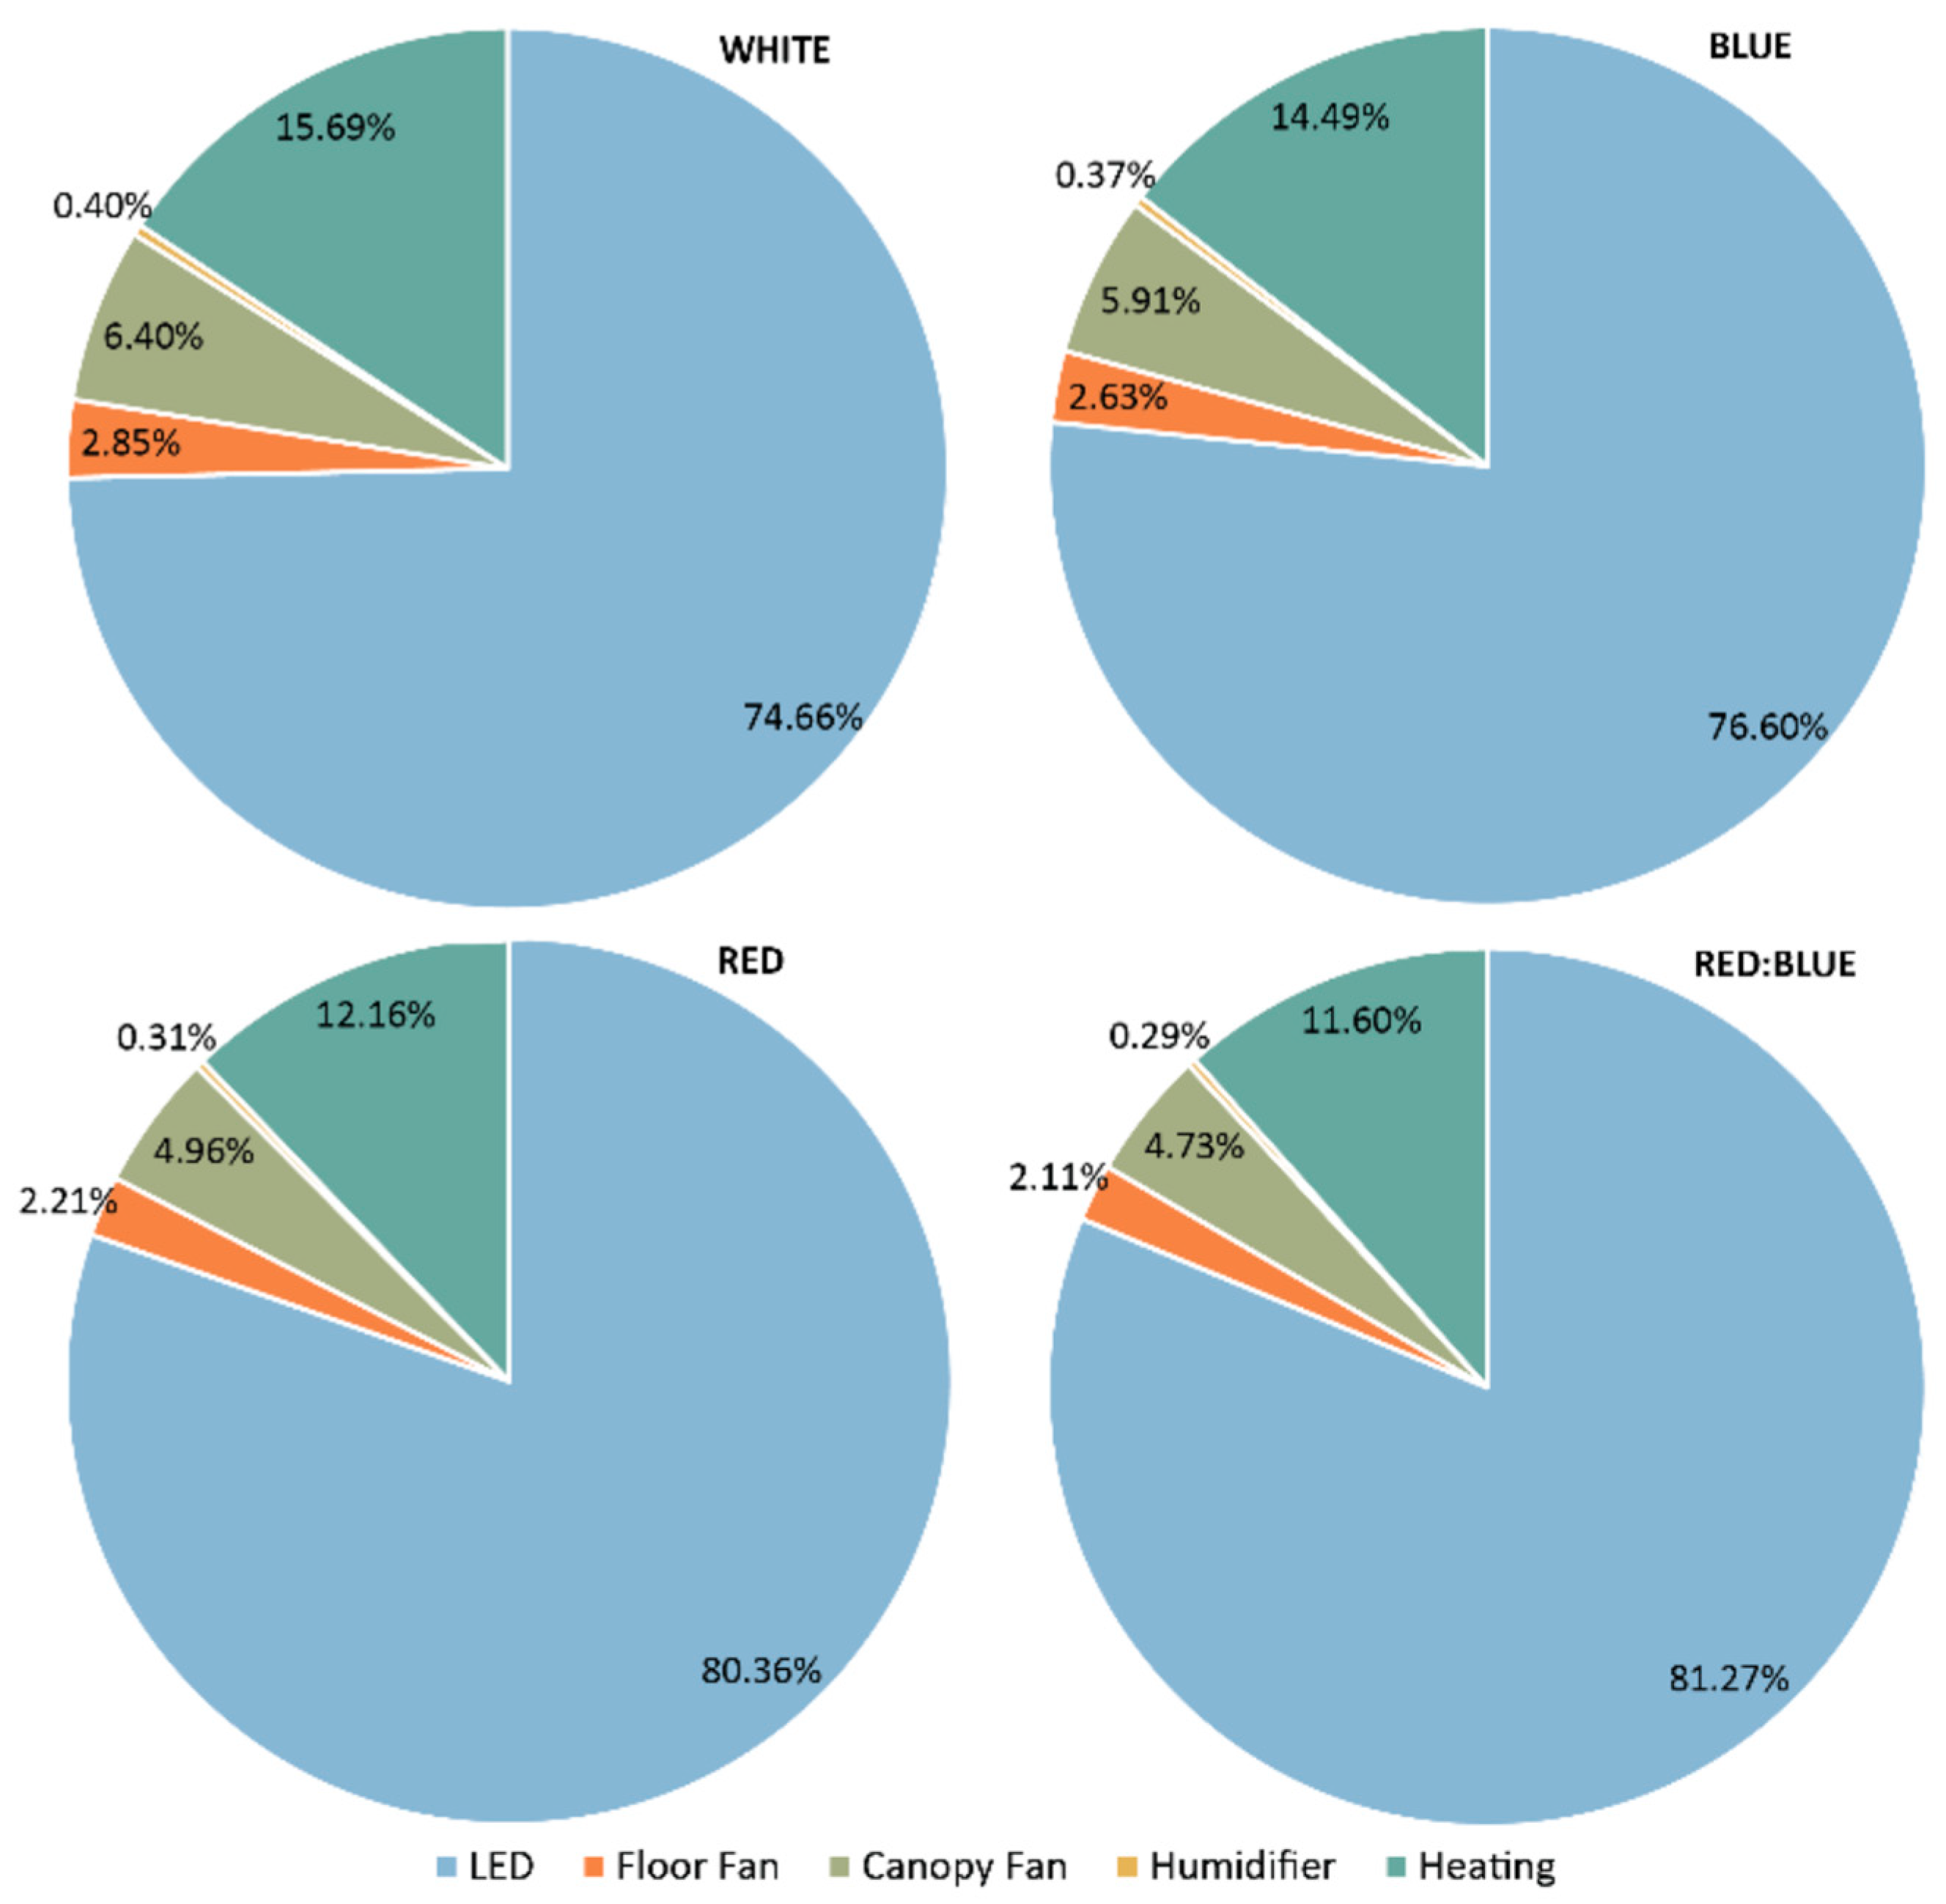
The system operated exclusively under artificial lighting, which significantly contributed to the overall electricity consumption. Climate control also played a role, although to a lesser extent. Specifically, LED lighting accounted for approximately 75–80% of the total energy consumption per treatment, depending on the applied light spectrum, whereas the energy consumption related to climate control was considerably lower, at around 12% (Figure 7). Notably, different LED fixtures—depending on their dominant spectral composition (e.g., red:blue, red, or full-spectrum)—exhibit distinct power requirements. As a result, both the total energy consumption and the proportion of electricity allocated to the LED lighting varied among treatments. Although the energy use distribution differed from the ratios reported by Orsini et al. [55], where lighting accounted for 50–55% and climate control for 30–35% of the total energy use, our findings nonetheless support the broader consensus that artificial lighting is the primary driver of energy consumption in closed growth chamber systems.
Energy use efficiency measures how effectively plants convert the electrical energy supplied by growth lights into usable plant biomass. It is largely influenced by variations in LED lighting, particularly differences in the light spectrum, as the plant growth and yield are directly affected by the light quality [56]. A red-to-blue light ratio ranging from two to four has been reported to optimize both the yield and EUE in several crops. Most studies have focused primarily on lettuce and basil [24,57,58], although Pistillo et al. [59] report similar findings in Callendula officinalis. Results on the EUE from the present study ranged from 4.64 g FW kWh−1 in the red treatment to 3.68 g FW kWh−1 in the blue treatment (Table 2). The EUE of the blue treatment differed significantly only in the red and red:blue treatments, whereas plants grown under the white LED light did not show significant differences in any treatment.
Water use efficiency values reflected the differences observed in the fresh biomass yield, since the amount of irrigation water supplied per plant was identical across treatments. Accordingly, the higher WUE recorded in the red and red:blue treatments compared with white and blue treatments (Table 2) is a direct consequence of their higher biomass production. Although the statistical significance follows that of the yield, the inclusion of the WUE remains important, as it frames crop productivity relative to the water input and enhances comparability with other production systems where water management is a key limiting factor.
A similar pattern was observed for LUE, which was calculated as the yield (kg) per square meter per cultivation cycle, under two spatial scenarios: single-layer cultivation and vertical cultivation in four stacked layers. Under the single-layer assumption, the LUE was again higher for the red and red:blue treatments compared with white and blue treatments (Table 2). When scaled to a four-layer vertical system, these values were quadrupled, reaching 17.67 ± 0.56 kg m−2 a−1 for red light and 18.06 ± 0.91 kg m−2 a−1 for red:blue, light compared with 12.75 ± 0.57 kg m−2 a−1 for white light and 11.75 ± 0.38 kg m−2 a−1 for blue light. Although the statistical relationships remain unchanged compared to the yield, the LUE provides an indication of the productivity potential of the controlled environment cultivation when the chamber space is fully exploited through vertical stacking.
In conclusion, while the WUE and LUE in this study follow the same statistical patterns as the yield, their value lies in expressing productivity relative to resource use and in facilitating cross-system comparisons. Such indices are widely applied in agronomic and horticultural research; however, in the case of cowslip, the available literature remains very limited, and according to our knowledge, these indices have not been previously reported. Nevertheless, their inclusion provides a baseline that can support future comparisons and highlights the potential of controlled environment systems in terms of resource efficiency and productivity.

4. Conclusions

In conclusion, the present study provides the first insights on the significant potential of LED lighting to modulate the leaf growth, physiology, and secondary metabolism of P. veris. The red:blue light emerged as a particularly beneficial treatment for promoting leaf relative growth rate characteristics and photosynthetic efficiency during the vegetative stage of P. veris, while the red light, either alone or in combination with blue light, enhanced the production of valuable secondary metabolites during the flowering stage. However, the plant’s developmental stage was the primary determinant of phenolic glycoside levels, emphasizing the need for a tailor-made approach to light optimization. This study contributes to the growing body of evidence supporting the use of LED lighting as a powerful tool for enhancing the in-house cropping of medicinal plants and optimizing the production of valuable compounds. According to our knowledge, this is the first comprehensive effort to elucidate the role of different LED light treatments on P. veris’s physiological and phytochemical characteristics. Nevertheless, further investigation is required to fully understand the effect of different LED lights on the biosynthesis of these important secondary metabolites in P. veris plant organs. This should involve combined omics approaches (such as transcriptomics with metabolomics) to elucidate gene-to-metabolite pathways and also address the interaction of light treatments with various environmental and stress-related factors like temperature or drought.

Supplementary Materials

The following supporting information can be downloaded at https://www.mdpi.com/article/10.3390/agronomy15092184/s1: Table S1: Targeted LC-MS/MS analysis of the methanolic extracts obtained from leaf tissue of cowslip plants under four light treatments (white fluorescent, blue, red, and red:blue) in two developmental stages. Table S2: Targeted LC-MS/MS analysis of the methanolic extracts obtained from inflorescences of cowslip plants under four light treatments (white fluorescent, blue, red, and red:blue).

Author Contributions

Conceptualization, E.S. and G.K.N.; methodology, D.K.; formal analysis, A.A.; data curation, D.K., I.C., N.T., and I.S.; writing—original draft preparation, E.S., I.C., I.S., and N.T.; writing—review and editing, E.A., G.K.N., S.P., E.A., S.M., I.S., and E.S. All authors have read and agreed to the published version of the manuscript.

Funding

This research received no external funding.

Data Availability Statement

The original contributions presented in the study are included in the article, further inquiries can be directed to the corresponding author.

Conflicts of Interest

The authors declare no conflicts of interest.

References

  1. Wichtl, M. Herbal Drugs and Phytopharmaceuticals: A Handbook for Practice on a Scientific Basis; CRC Press: Boca Raton, FL, USA, 2004; ISBN 978-0-8493-1961-7. [Google Scholar]
  2. Brys, R.; Jacquemyn, H. Biological Flora of the British Isles: Primula veris L. J. Ecol. 2009, 97, 581–600. [Google Scholar] [CrossRef]
  3. Hostettmann, K.; Marston, A. Chemistry and Pharmacology of Natural Products; Cambridge University Press: Cambridge, UK, 1995; Volume 548, pp. 326–327. [Google Scholar]
  4. Marchyshyn, S.; Slobodianiuk, L.; Budniak, L.; Shostak, L.; Gerush, O. Investigation on the Expectorant Effect of Extracts from Primula veris L. Open Access Maced. J. Med. Sci. 2022, 10, 1368–1372. [Google Scholar] [CrossRef]
  5. EMA/HMPC/104095/2012 Committee on Herbal Medicinal Products (HMPC) Community Herbal Monograph on Primula veris L. and/or Primula elatior (L.) Hill, Radix. European Medicines Agency. 2013. Available online: https://www.ema.europa.eu/en/documents/herbal-monograph/final-community-herbal-monograph-primula-veris-l-and-or-primula-elatior-l-hill-radix_en.pdf (accessed on 19 September 2012).
  6. Zandalinas, S.I.; Sales, C.; Beltrán, J.; Gómez-Cadenas, A.; Arbona, V. Activation of Secondary Metabolism in Citrus Plants Is Associated to Sensitivity to Combined Drought and High Temperatures. Front. Plant Sci. 2017, 7, 1954. [Google Scholar] [CrossRef] [PubMed]
  7. Müller, A.; Ganzera, M.; Stuppner, H. Analysis of Phenolic Glycosides and Saponins in Primula elatior and Primula veris (Primula Root) by Liquid Chromatography, Evaporative Light Scattering Detection and Mass Spectrometry. J. Chromatogr. A 2006, 1112, 218–223. [Google Scholar] [CrossRef]
  8. Apel, L.; Kammerer, D.R.; Stintzing, F.C.; Spring, O. Comparative Metabolite Profiling of Triterpenoid Saponins and Flavonoids in Flower Color Mutations of Primula veris L. Int. J. Mol. Sci. 2017, 18, 153. [Google Scholar] [CrossRef]
  9. Sarropoulou, V.; Sarrou, E.; Angeli, A.; Martens, S.; Maloupa, E.; Grigoriadou, K. Developing an in Vitro Elicitation Strategy for Specialized Secondary Metabolites Production in Adventitious Root Cultures of Primula veris subsp. veris. Ind. Crops Prod. 2023, 197, 116618. [Google Scholar] [CrossRef]
  10. Chen, M.; Chory, J.; Fankhauser, C. Light Signal Transduction in Higher Plants. Annu. Rev. Genet. 2004, 38, 87–117. [Google Scholar] [CrossRef] [PubMed]
  11. Siddiqui, M.W.; Bansal, V.; Prasad, K. (Eds.) Plant Secondary Metabolites, Volume Two: Stimulation, Extraction, and Utilization; CRC Press: Boca Raton, FL, USA, 2017. [Google Scholar]
  12. Appolloni, E.; Pennisi, G.; Zauli, I.; Carotti, L.; Paucek, I.; Quaini, S.; Orsini, F.; Gianquinto, G. Beyond Vegetables: Effects of Indoor LED Light on Specialized Metabolite Biosynthesis in Medicinal and Aromatic Plants, Edible Flowers, and Microgreens. J. Sci. Food Agric. 2022, 102, 472–487. [Google Scholar] [CrossRef]
  13. Cáceres-Cevallos, G.J.; Jordán, M.J. Effects of LED Light on Aromatic Medicinal Plants from Lavandula, Salvia, and Thymus Genera: A Systematic Review. Stresses 2024, 4, 627–640. [Google Scholar] [CrossRef]
  14. Tilbrook, K.; Arongaus, A.B.; Binkert, M.; Heijde, M.; Yin, R.; Ulm, R. The UVR8 UV-B Photoreceptor: Perception, Signaling and Response. Arab. Book 2013, 11, e0164. [Google Scholar] [CrossRef]
  15. Folta, K.M.; Carvalho, S.D. Photoreceptors and Control of Horticultural Plant Traits. HortScience 2015, 50, 1274–1280. [Google Scholar] [CrossRef]
  16. Miao, Y.; Wang, X.; Gao, L.; Chen, Q.; Qu, M. Blue Light Is More Essential than Red Light for Maintaining the Activities of Photosystem II and I and Photosynthetic Electron Transport Capacity in Cucumber Leaves. J. Integr. Agric. 2016, 15, 87–100. [Google Scholar] [CrossRef]
  17. Christiaens, A.; Gobin, B.; Van Labeke, M.C. Light Quality and Adventitious Rooting: A Mini-Review. Acta Hortic. 2016, 1134, 385–394. [Google Scholar] [CrossRef]
  18. Li, Y.; Xu, J.; Zhang, F.; Gu, Y.; Tian, W.; Tian, W.; Tong, Y.; Li, J. The Combination of Red and Blue Light Increases the Biomass and Steroidal Saponin Contents of Paris polyphylla var. Yunnanensis. Ind. Crops Prod. 2023, 194, 116311. [Google Scholar] [CrossRef]
  19. Watcharatanon, K.; Ingkaninan, K.; Putalun, W. Improved Triterpenoid Saponin Glycosides Accumulation in in Vitro Culture of Bacopa monnieri (L.) Wettst with Precursor Feeding and LED Light Exposure. Ind. Crops Prod. 2019, 134, 303–308. [Google Scholar] [CrossRef]
  20. Di, P.; Sun, Z.; Cheng, L.; Han, M.; Yang, L.; Yang, L. LED Light Irradiations Differentially Affect the Physiological Characteristics, Ginsenoside Content, and Expressions of Ginsenoside Biosynthetic Pathway Genes in Panax ginseng. Agriculture 2023, 13, 807. [Google Scholar] [CrossRef]
  21. Sobhani Najafabadi, A.; Khanahmadi, M.; Ebrahimi, M.; Moradi, K.; Behroozi, P.; Noormohammadi, N. Effect of Different Quality of Light on Growth and Production of Secondary Metabolites in Adventitious Root Cultivation of Hypericum perforatum. Plant Signal. Behav. 2019, 14, 1640561. [Google Scholar] [CrossRef]
  22. Cáceres-Cevallos, G.; Martínez-Conesa, C.; García-Aledo, I.; Quílez-Simón, M.; Romero-Espinar, P.; Jordán, M.J. Lavandula latifolia Medik. Grown with LED Emitting Diode Light Technology, an Initial Approach. Acta Hortic. 2023, 1358, 303–310. [Google Scholar] [CrossRef]
  23. Bantis, F.; Radoglou, K. Testing the Potential of LEDs to Enhance Growth and Quality Characteristics of Salvia fruticosa. Hortic. Sci. 2019, 46, 98–106. [Google Scholar] [CrossRef]
  24. Lee, H.R.; Kim, H.M.; Jeong, H.W.; Hwang, S.J. Growth and Bioactive Compounds of Salvia plebeia R. Br. Grown under Various Ratios of Red and Blue Light. Horticulturae 2020, 6, 35. [Google Scholar] [CrossRef]
  25. Tohidi, B.; Rahimmalek, M.; Arzani, A.; Sabzalian, M.R. Thymol, Carvacrol, and Antioxidant Accumulation in Thymus Species in Response to Different Light Spectra Emitted by Light-Emitting Diodes. Food Chem. 2020, 307, 125521. [Google Scholar] [CrossRef]
  26. Costine, B.; Zhang, M.; Pearson, B.; Nadakuduti, S.S. Impact of Blue Light on Plant Growth, Flowering and Accumulation of Medicinal Flavones in Scutellaria baicalensis and S. lateriflora. Horticulturae 2022, 8, 1141. [Google Scholar] [CrossRef]
  27. d’Aquino, L.; Lanza, B.; Gambale, E.; Sighicelli, M.; Menegoni, P.; Modarelli, G.C.; Rimauro, J.; Chianese, E.; Nenna, G.; Fasolino, T.; et al. Growth and Metabolism of Basil Grown in a New-Concept Microcosm under Different Lighting Conditions. Sci. Hortic. 2022, 299, 111035. [Google Scholar] [CrossRef]
  28. Feldzensztajn, M.; Wierzba, P.; Mazikowski, A. Examination of Spectral Properties of Medicinal Plant Leaves Grown in Different Lighting Conditions Based on Mint Cultivation. Sensors 2021, 21, 4122. [Google Scholar] [CrossRef] [PubMed]
  29. Zhang, S.; Zhang, L.; Zou, H.; Qiu, L.; Zheng, Y.; Yang, D.; Wang, Y. Effects of Light on Secondary Metabolite Biosynthesis in Medicinal Plants. Front. Plant Sci. 2021, 12, 781236. [Google Scholar] [CrossRef]
  30. Wintermans, J.F.G.M.; De Mots, A. Spectrophotometric Characteristics of Chlorophylls a and b and Their Phenophytins in Ethanol. Biochim. Et Biophys. Acta (BBA)—Biophys. Incl. Photosynth. 1965, 109, 448–453. [Google Scholar] [CrossRef]
  31. Moustakas, M.; Bayçu, G.; Sperdouli, I.; Eroğlu, H.; Eleftheriou, E.P. Arbuscular Mycorrhizal Symbiosis Enhances Photosynthesis in the Medicinal Herb Salvia fruticosa by Improving Photosystem II Photochemistry. Plants 2020, 9, 962. [Google Scholar] [CrossRef] [PubMed]
  32. Vrhovsek, U.; Masuero, D.; Gasperotti, M.; Franceschi, P.; Caputi, L.; Viola, R.; Mattivi, F. A Versatile Targeted Metabolomics Method for the Rapid Quantification of Multiple Classes of Phenolics in Fruits and Beverages. J. Agric. Food Chem. 2012, 60, 8831–8840. [Google Scholar] [CrossRef] [PubMed]
  33. Pennisi, G.; Blasioli, S.; Cellini, A.; Maia, L.; Crepaldi, A.; Braschi, I.; Spinelli, F.; Nicola, S.; Fernandez, J.A.; Stanghellini, C.; et al. Unraveling the Role of Red:Blue LED Lights on Resource Use Efficiency and Nutritional Properties of Indoor Grown Sweet Basil. Front. Plant Sci. 2019, 10, 305. [Google Scholar] [CrossRef]
  34. Pennisi, G.; Pistillo, A.; Orsini, F.; Cellini, A.; Spinelli, F.; Nicola, S.; Fernandez, J.A.; Crepaldi, A.; Gianquinto, G.; Marcelis, L.F.M. Optimal Light Intensity for Sustainable Water and Energy Use in Indoor Cultivation of Lettuce and Basil under Red and Blue LEDs. Scientia Horticulturae 2020, 272, 109508. [Google Scholar] [CrossRef]
  35. Park, H.; Yu, Y.J.; Choi, E.Y. Effects of Fluorescent Light and Light-Emitting Diodes on Leaf Morphology, Growth and Antioxidant Capacity of Salvia plebeia. J. Bio-Environ. Control. 2017, 26, 208–214. [Google Scholar] [CrossRef]
  36. Seyedi, F.S.; Nafchi, M.G.; Reezi, S. Effects of Light Spectra on Morphological Characteristics, Primary and Specialized Metabolites of Thymus vulgaris L. Heliyon 2024, 10, e23032. [Google Scholar] [CrossRef]
  37. Paik, I.; Huq, E. Plant Photoreceptors: Multi-Functional Sensory Proteins and Their Signaling Networks. Semin. Cell Dev. Biol. 2019, 92, 114–121. [Google Scholar] [CrossRef]
  38. Matysiak, B.; Kowalski, A. White, Blue and Red LED Lighting on Growth, Morphology and Accumulation of Flavonoid Compounds in Leafy Greens. Zemdirbyste-Agriculture 2019, 106, 281–286. [Google Scholar] [CrossRef]
  39. Snowden, M.C.; Cope, K.R.; Bugbee, B. Sensitivity of Seven Diverse Species to Blue and Green Light: Interactions with Photon Flux. PLoS ONE 2016, 11, e0163121. [Google Scholar] [CrossRef]
  40. Al Murad, M.; Razi, K.; Jeong, B.R.; Samy, P.M.A.; Muneer, S. Light Emitting Diodes (LEDs) as Agricultural Lighting: Impact and Its Potential on Improving Physiology, Flowering, and Secondary Metabolites of Crops. Sustainability 2021, 13, 1985. [Google Scholar] [CrossRef]
  41. Inoue, S.; Kinoshita, T. Blue Light Regulation of Stomatal Opening and the Plasma Membrane H+-ATPase. Plant Physiol. 2017, 174, 531–538. [Google Scholar] [CrossRef] [PubMed]
  42. Kami, C.; Lorrain, S.; Hornitschek, P.; Fankhauser, C. Chapter Two—Light-Regulated Plant Growth and Development. In Current Topics in Developmental Biology; Timmermans, M.C.P., Ed.; Plant Development; Academic Press: Cambridge, MA, USA, 2010; Volume 91, pp. 29–66. [Google Scholar]
  43. Simkin, A.J.; Kapoor, L.; Doss, C.G.P.; Hofmann, T.A.; Lawson, T.; Ramamoorthy, S. The Role of Photosynthesis Related Pigments in Light Harvesting, Photoprotection and Enhancement of Photosynthetic Yield in Planta. Photosynth. Res. 2022, 152, 23–42. [Google Scholar] [CrossRef] [PubMed]
  44. Cheng, M.-C.; Kathare, P.K.; Paik, I.; Huq, E. Phytochrome Signaling Networks. Annu. Rev. Plant Biol. 2021, 72, 217–244. [Google Scholar] [CrossRef] [PubMed]
  45. Li, L. The Influence of Elicitor on the Accumulation of Several Metabolites in the Seedling Salvia przewalskii Maxim. Master’s Thesis, Sichuan Agricultural University, Ya’an, China, 2014. [Google Scholar]
  46. Kapoor, S.; Raghuvanshi, R.; Bhardwaj, P.; Sood, H.; Saxena, S.; Chaurasia, O.P. Influence of Light Quality on Growth, Secondary Metabolites Production and Antioxidant Activity in Callus Culture of Rhodiola imbricata Edgew. J. Photochem. Photobiol. B Biol. 2018, 183, 258–265. [Google Scholar] [CrossRef]
  47. Stepanova, A.; Solov’yova, A.; Salamaikina, S. Influence of Spectral Light Composition on Flavones Formation in Callus Culture of Scutellaria baicalensis Georgi. Pharmacogn. Mag. 2020, 16, 156–160. [Google Scholar] [CrossRef]
  48. Kubica, P.; Szopa, A.; Prokopiuk, B.; Komsta, Ł.; Pawłowska, B.; Ekiert, H. The Influence of Light Quality on the Production of Bioactive Metabolites—Verbascoside, Isoverbascoside and Phenolic Acids and the Content of Photosynthetic Pigments in Biomass of Verbena officinalis L. Cultured in Vitro. J. Photochem. Photobiol. B Biol. 2020, 203, 111768. [Google Scholar] [CrossRef]
  49. Ueda, T.; Murata, M.; Yokawa, K. Single Wavelengths of LED Light Supplement Promote the Biosynthesis of Major Cyclic Monoterpenes in Japanese Mint. Plants 2021, 10, 1420. [Google Scholar] [CrossRef] [PubMed]
  50. Shohael, A.M.; Ali, M.B.; Yu, K.W.; Hahn, E.J.; Islam, R.; Paek, K.Y. Effect of Light on Oxidative Stress, Secondary Metabolites and Induction of Antioxidant Enzymes in Eleutherococcus senticosus Somatic Embryos in Bioreactor. Process Biochem. 2006, 41, 1179–1185. [Google Scholar] [CrossRef]
  51. Cirak, C.; Radusiene, J.; Camas, N.; Caliskan, O.; Odabas, M.S. Changes in the Contents of Main Secondary Metabolites in Two Turkish Hypericum Species during Plant Development. Pharm. Biol. 2013, 51, 391–399. [Google Scholar] [CrossRef]
  52. Sarrou, E.; Martens, S.; Chatzopoulou, P. Metabolite Profiling and Antioxidative Activity of Sage (Salvia fruticosa Mill.) under the Influence of Genotype and Harvesting Period. Ind. Crops Prod. 2016, 94, 240–250. [Google Scholar] [CrossRef]
  53. Sarrou, E.; Tsivelika, N.; Chatzopoulou, P.; Tsakalidis, G.; Menexes, G.; Mavromatis, A. Conventional Breeding of Greek Oregano (Origanum vulgare ssp. hirtum) and Development of Improved Cultivars for Yield Potential and Essential Oil Quality. Euphytica 2017, 213, 104. [Google Scholar] [CrossRef]
  54. Önder, S.; Tonguç, M.; Erbaş, S.; Önder, D.; Mutlucan, M. Investigation of Phenological, Primary and Secondary Metabolites Changes during Flower Developmental of Rosa damascena. Plant Physiol. Biochem. 2022, 192, 20–34. [Google Scholar] [CrossRef] [PubMed]
  55. Orsini, F.; Pennisi, G.; Zulfiqar, F.; Gianquinto, G. Sustainable Use of Resources in Plant Factories with Artificial Lighting (PFALs). Eur. J. Hortic. Sci. 2020, 85, 297–309. [Google Scholar] [CrossRef]
  56. Bantis, F.; Chatzigeorgiou, I.; Sismanis, M.; Ntinas, G.K.; Koukounaras, A. Vegetable Production in PFALs: Control of Micro-Environmental Factors, Principal Components and Automated Systems. Agriculture 2024, 14, 642. [Google Scholar] [CrossRef]
  57. Kong, Y.; Nemali, A.; Mitchell, C.; Nemali, K. Spectral Quality of Light Can Affect Energy Consumption and Energy-Use Efficiency of Electrical Lighting in Indoor Lettuce Farming. HortScience 2019, 54, 865–872. [Google Scholar] [CrossRef]
  58. Pennisi, G.; Orsini, F.; Blasioli, S.; Cellini, A.; Crepaldi, A.; Braschi, I.; Spinelli, F.; Nicola, S.; Fernandez, J.A.; Stanghellini, C.; et al. Resource Use Efficiency of Indoor Lettuce (Lactuca sativa L.) Cultivation as Affected by Red:Blue Ratio Provided by LED Lighting. Sci. Rep. 2019, 9, 14127. [Google Scholar] [CrossRef] [PubMed]
  59. Pistillo, A.; Pennisi, G.; Crepaldi, A.; Giorgioni, M.E.; Minelli, A.; Orsini, F.; Gianquinto, G. Influence of Red:Blue Ratio in LED Lighting for Indoor Cultivation of Edible Marigold Flowers. Acta Hortic. 2022, 1337, 249–254. [Google Scholar] [CrossRef]
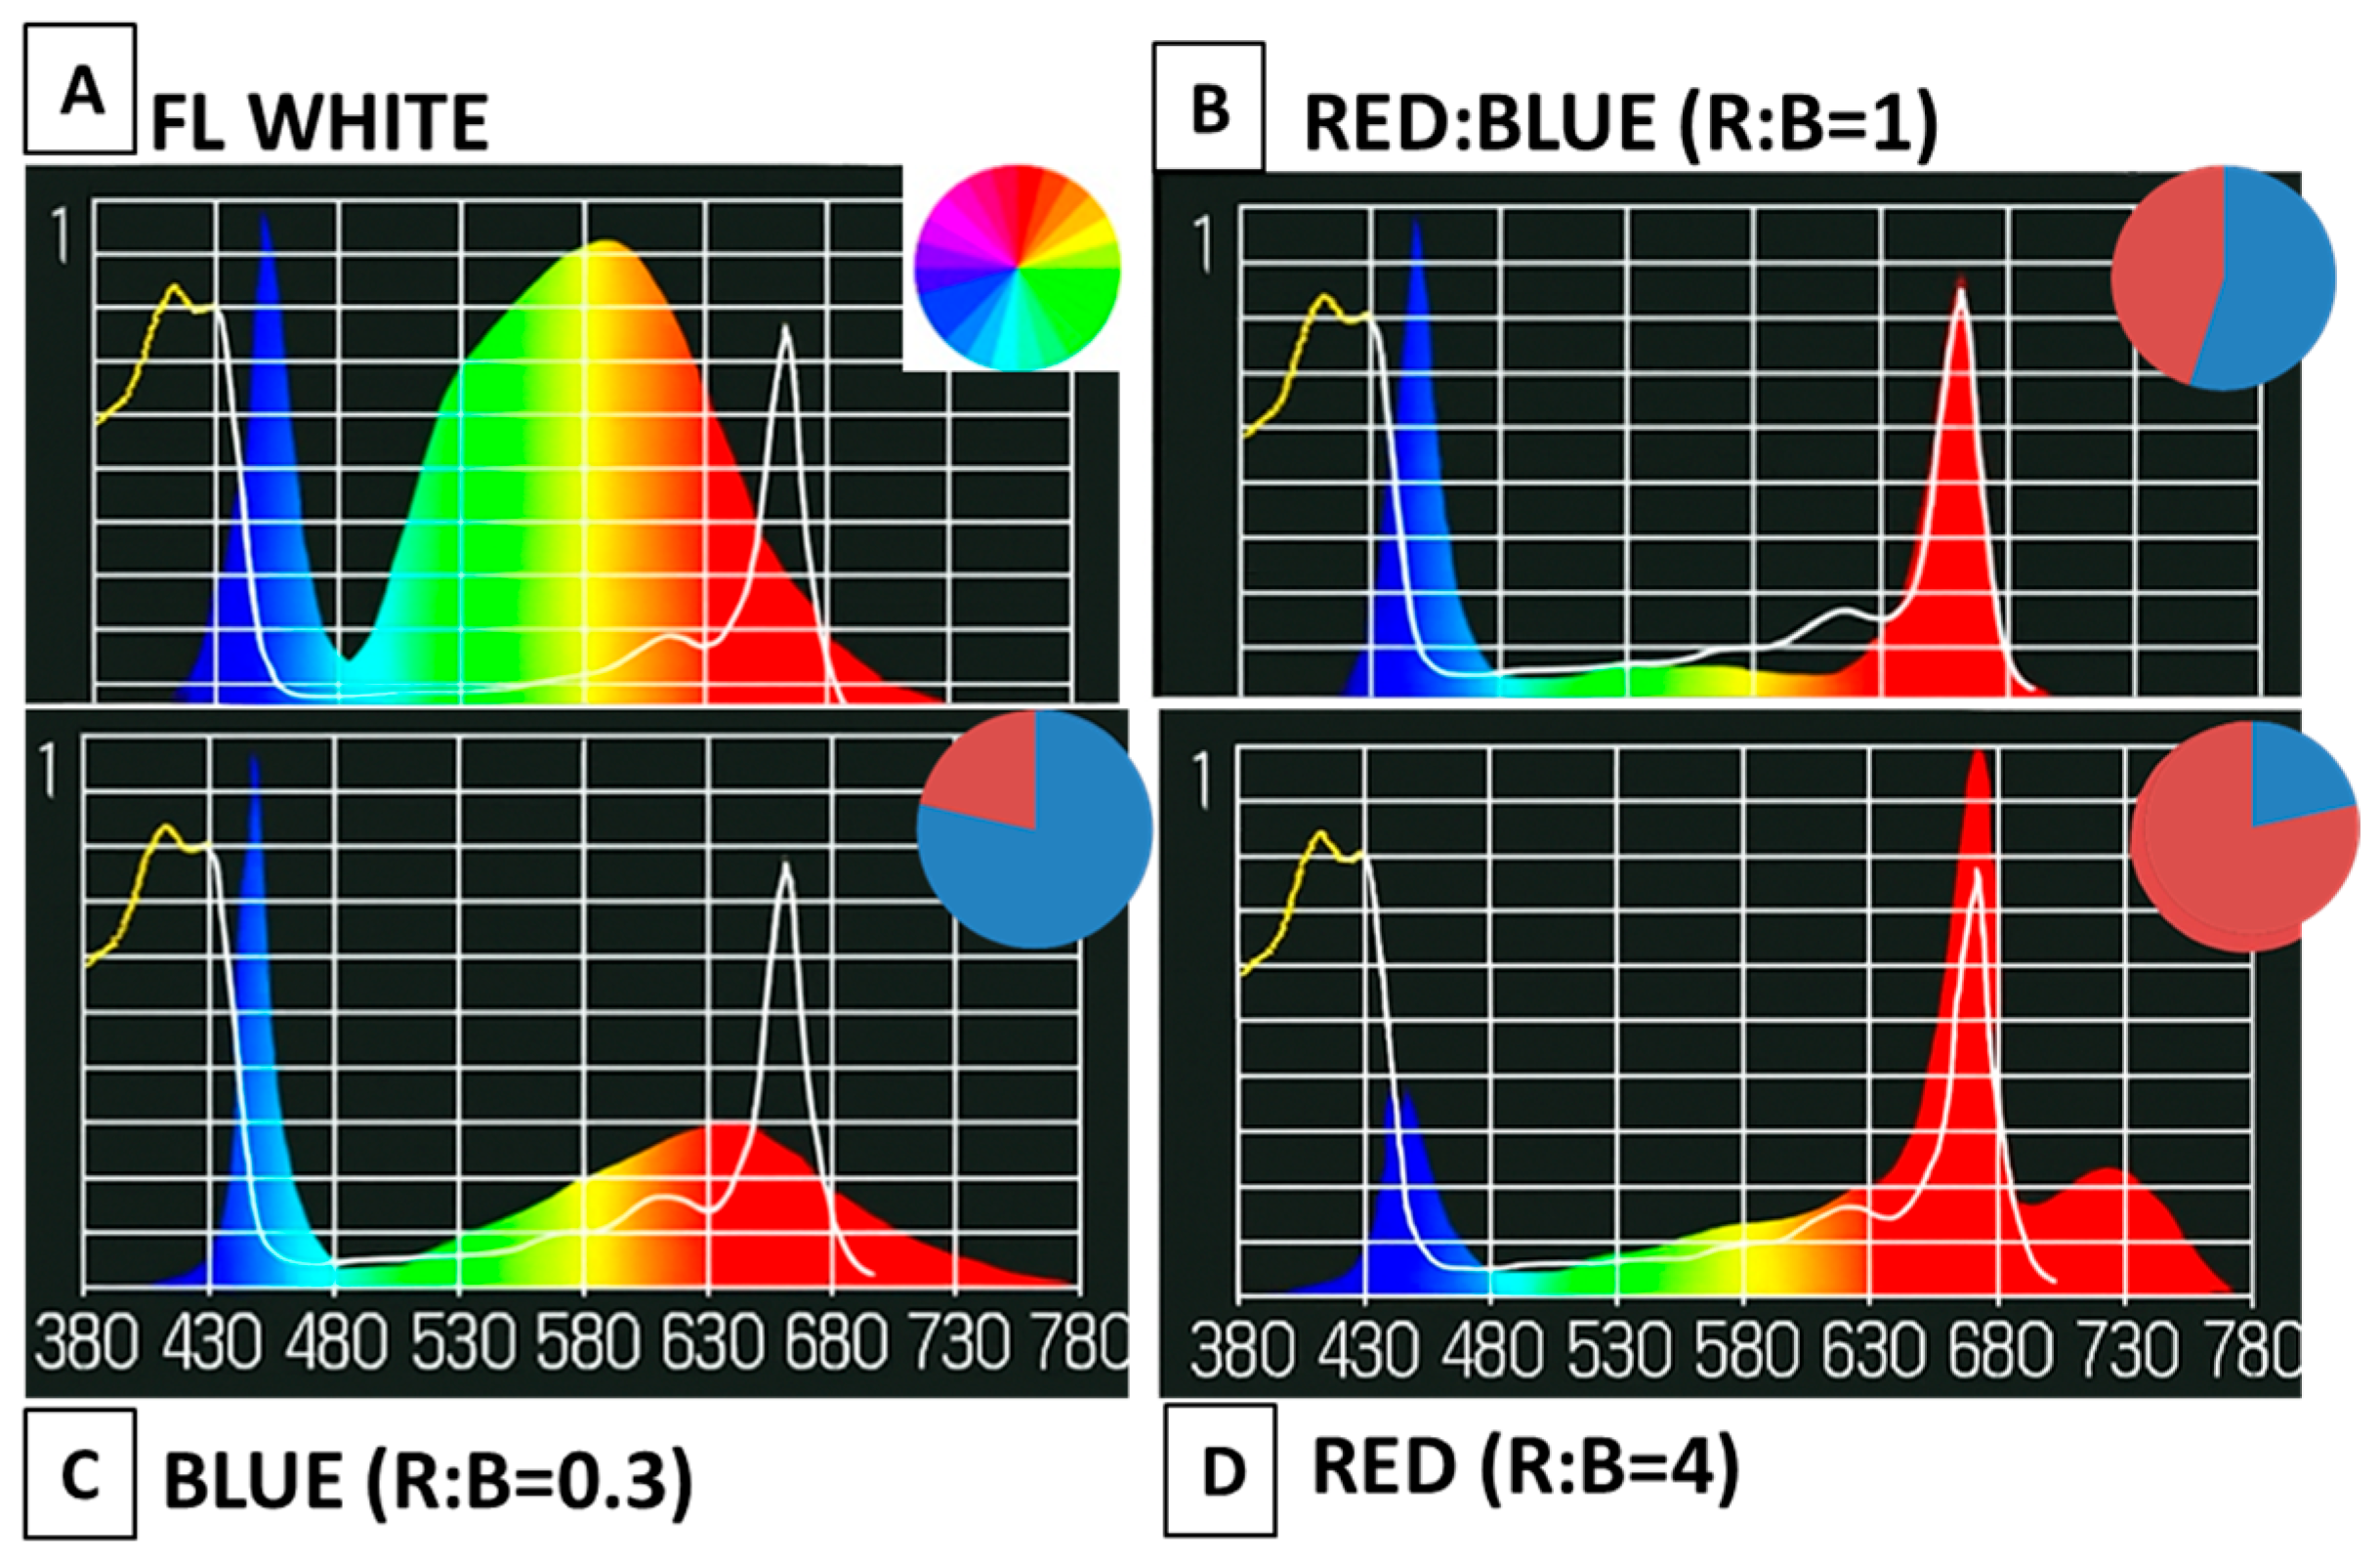
Figure 1. Light spectra details and photon flux ratios of red (651 nm) and blue (451 nm) used in the experiments. (A) White fluorescent, (B) red:blue, (C) blue, and (D) red light treatments. The faint continuous white line in the graph, not varying between treatments, indicates the wavelengths of chlorophyll a absorption.
Agronomy 15 02184 g001
Figure 2. Relative increase (RI) of cowslip leaf number (A), leaf length (B), and leaf width (C) under four light treatments (white fluorescent, blue, red, and red:blue) during the vegetative stage of plants development. All data represent the mean values ± Standard Error. Values with different letters represent statistical differences with Duncan’s test for p ≤ 0.05. Absence of letters indicates no statistical differences among mean values.
Agronomy 15 02184 g002
Figure 3. Effective quantum yield of PSII photochemistry (ΦPSII), quantum yield of regulated non-photochemical energy loss in PSII (ΦNPQ), and quantum yield of non-regulated energy dissipated in PSII (ΦNO) of cowslip plants under four light treatments (white fluorescent, blue, red, and red:blue) determined during (A,C,E) the vegetative stage and (B,D,F) the flowering stage of plant development. Maximum efficiency of PSII photochemistry (Fv/Fm) of cowslip plants under four light treatments determined during (C) the vegetative stage and (D) the flowering stage of plant development. The fraction of open PSII reaction centers (qp) of cowslip plants under four light treatments determined during (E) the vegetative stage and (F) the flowering stage of plant development. Error bars are standard deviations (n = 6). Different letter columns for the same parameters indicate significant differences (p ≤ 0.05).
Agronomy 15 02184 g003
Figure 4. Leaf net photosynthesis rate (A,D), transpiration rate (B,E), and stomatal conductance (C,F) of cowslip plants under four light treatments (white fluorescent, blue, red, and red:blue) determined during the vegetative stage of plant development. Bars represent the mean values of six independent replicates ± Standard Error. Same letter bars indicate insignificant mean differences with Duncan’s test for p ≤ 0.05. Statistical analysis was performed separately for the two different harvest points. There were no statistical differences between bars with no letters.
Agronomy 15 02184 g004
Figure 5. Total chlorophyll and carotenoid concentration (mg g−1 fresh weight) of cowslip leaves under four light treatments (white fluorescent, blue, red, and red:blue) determined during the vegetative (A,B) and flowering stage (C,D) of plant development. Bars represent the mean values of six independent replicates ± Standard Error. Bars with different letters represent significant mean differences with Duncan’s test for p ≤ 0.05. Statistical analysis was performed separately for the two different harvest points.
Agronomy 15 02184 g005
Figure 6. Concentration (mg g−1 dry weight) of the main phenolic acid glycosides (primulaverin and primeverin) and triterpene saponins (primulic acid I and II) of cowslip roots under four light treatments (white fluorescent, blue, red, and red:blue) determined during the vegetative (A) and flowering (B) stage of plant development. Bars represent the mean values ± Standard Error. Same letter bars indicate insignificant mean differences with Duncan’s test for p ≤ 0.05. Statistical analysis was performed separately for the two different harvest points; bars with no letters indicate no statistical differences.
Agronomy 15 02184 g006
Figure 7. Energy consumption per category, expressed as a percentage of total energy consumption, for each treatment.
Agronomy 15 02184 g007
Table 1. Fresh biomass production of aerial parts and roots of cowslip plants under four light treatments (white fluorescent, blue, red, and red:blue), determined during vegetative and flowering developmental stage.
Vegetative Stage
Light TreatmentsTotal Plant Fresh Weight (g)Root Fresh Weight (g)Aerial Part Fresh Weight (g)Single Leaf Fresh Weight (g)
White10.66 a ± 1.864.9 b ± 0.285.71 a ± 1.010.51 a ± 0.08
Blue11.81 a ± 2.586.08 a ± 0.415.67 a ± 1.070.57 a ± 0.14
Red11.24 a ± 1.515.88 ab ± 0.185.33 a ± 0.730.39 a ± 0.05
Red:Blue11.62 a ± 0.936.16 a ± 0.215.37 a ± 0.560.49 a ± 0.04
Flowering Stage
White18.59 b ± 0.838.47 b ± 0.359.89 a ± 2.340.89 a ± 0.15
Blue17.14 b ± 0.558.79 b ± 0.958.24 a ± 1.420.82 a ± 0.14
Red25.77 a ± 0.8214.13 a ± 0.4712.53 a ± 1.571.07 a ± 0.12
Red:Blue26.34 a ± 1.3314.82 a ± 0.6811.30 a ± 1.160.98 a ± 0.07
All data represent the mean values of six independent replicates ± Standard Error. Values with different letters within columns are statistically different with Duncan’s test for p ≤ 0.05. Statistical analysis performed separately for the two different harvest points; same letters indicate no statistical differences between mean values.
Table 2. Average values of fresh weight of the whole plant (root FW, aerial part FW) (g m−2), water use efficiency (g FW L−1 H2O), energy use efficiency (g FW kWh−1), and land use efficiency (kg m−2 a−1) for each LED treatment.
Whole Plant Fresh Weight
(g m−2)
Water Use Efficiency
(g FW L−1 H2O)
Energy Use Efficiency
(g FW kWh−1)
1 Land Use Efficiency—3 Cultivation/year
(kg m−2 a−1)
1 Layer4 Layers
White1062.57 ± 47.43 b4.92 ± 0.22 b4.32 ± 0.19 ab3.19 ± 0.14 b12.75 ± 0.57 b
Blue979.52 ± 31.25 b4.53 ± 0.14 b3.68 ± 0.14 b2.94 ± 0.09 b11.75 ± 0.38 b
Red1472.38 ± 46.65 a6.82 ± 0.22 a4.64 ± 0.15 a4.42 ± 0.14 a17.67 ± 0.56 a
Red:Blue1505.24 ± 76.14 a6.97 ± 0.35 a4.53 ± 0.23 a4.52 ± 0.23 a18.06 ± 0.91 a
1 Land use efficiency was evaluated as the yield (kg) per square meter per cultivation cycle under two spatial scenarios: single-layer cultivation and vertical cultivation in four stacked layers. All data represent the mean values of six independent replicates ± Standard Error. Values with different letters within columns are statistically different with Duncan’s test for p ≤ 0.05. Statistical analysis was performed separately for the two different harvest points; same letters indicate no statistical differences between mean values.
Disclaimer/Publisher’s Note: The statements, opinions and data contained in all publications are solely those of the individual author(s) and contributor(s) and not of MDPI and/or the editor(s). MDPI and/or the editor(s) disclaim responsibility for any injury to people or property resulting from any ideas, methods, instructions or products referred to in the content.