Integrating Solar Energy into German Vineyards: A Geospatial Framework for Identifying Agrivoltaic Potential
Abstract
1. Introduction
2. Materials and Methods
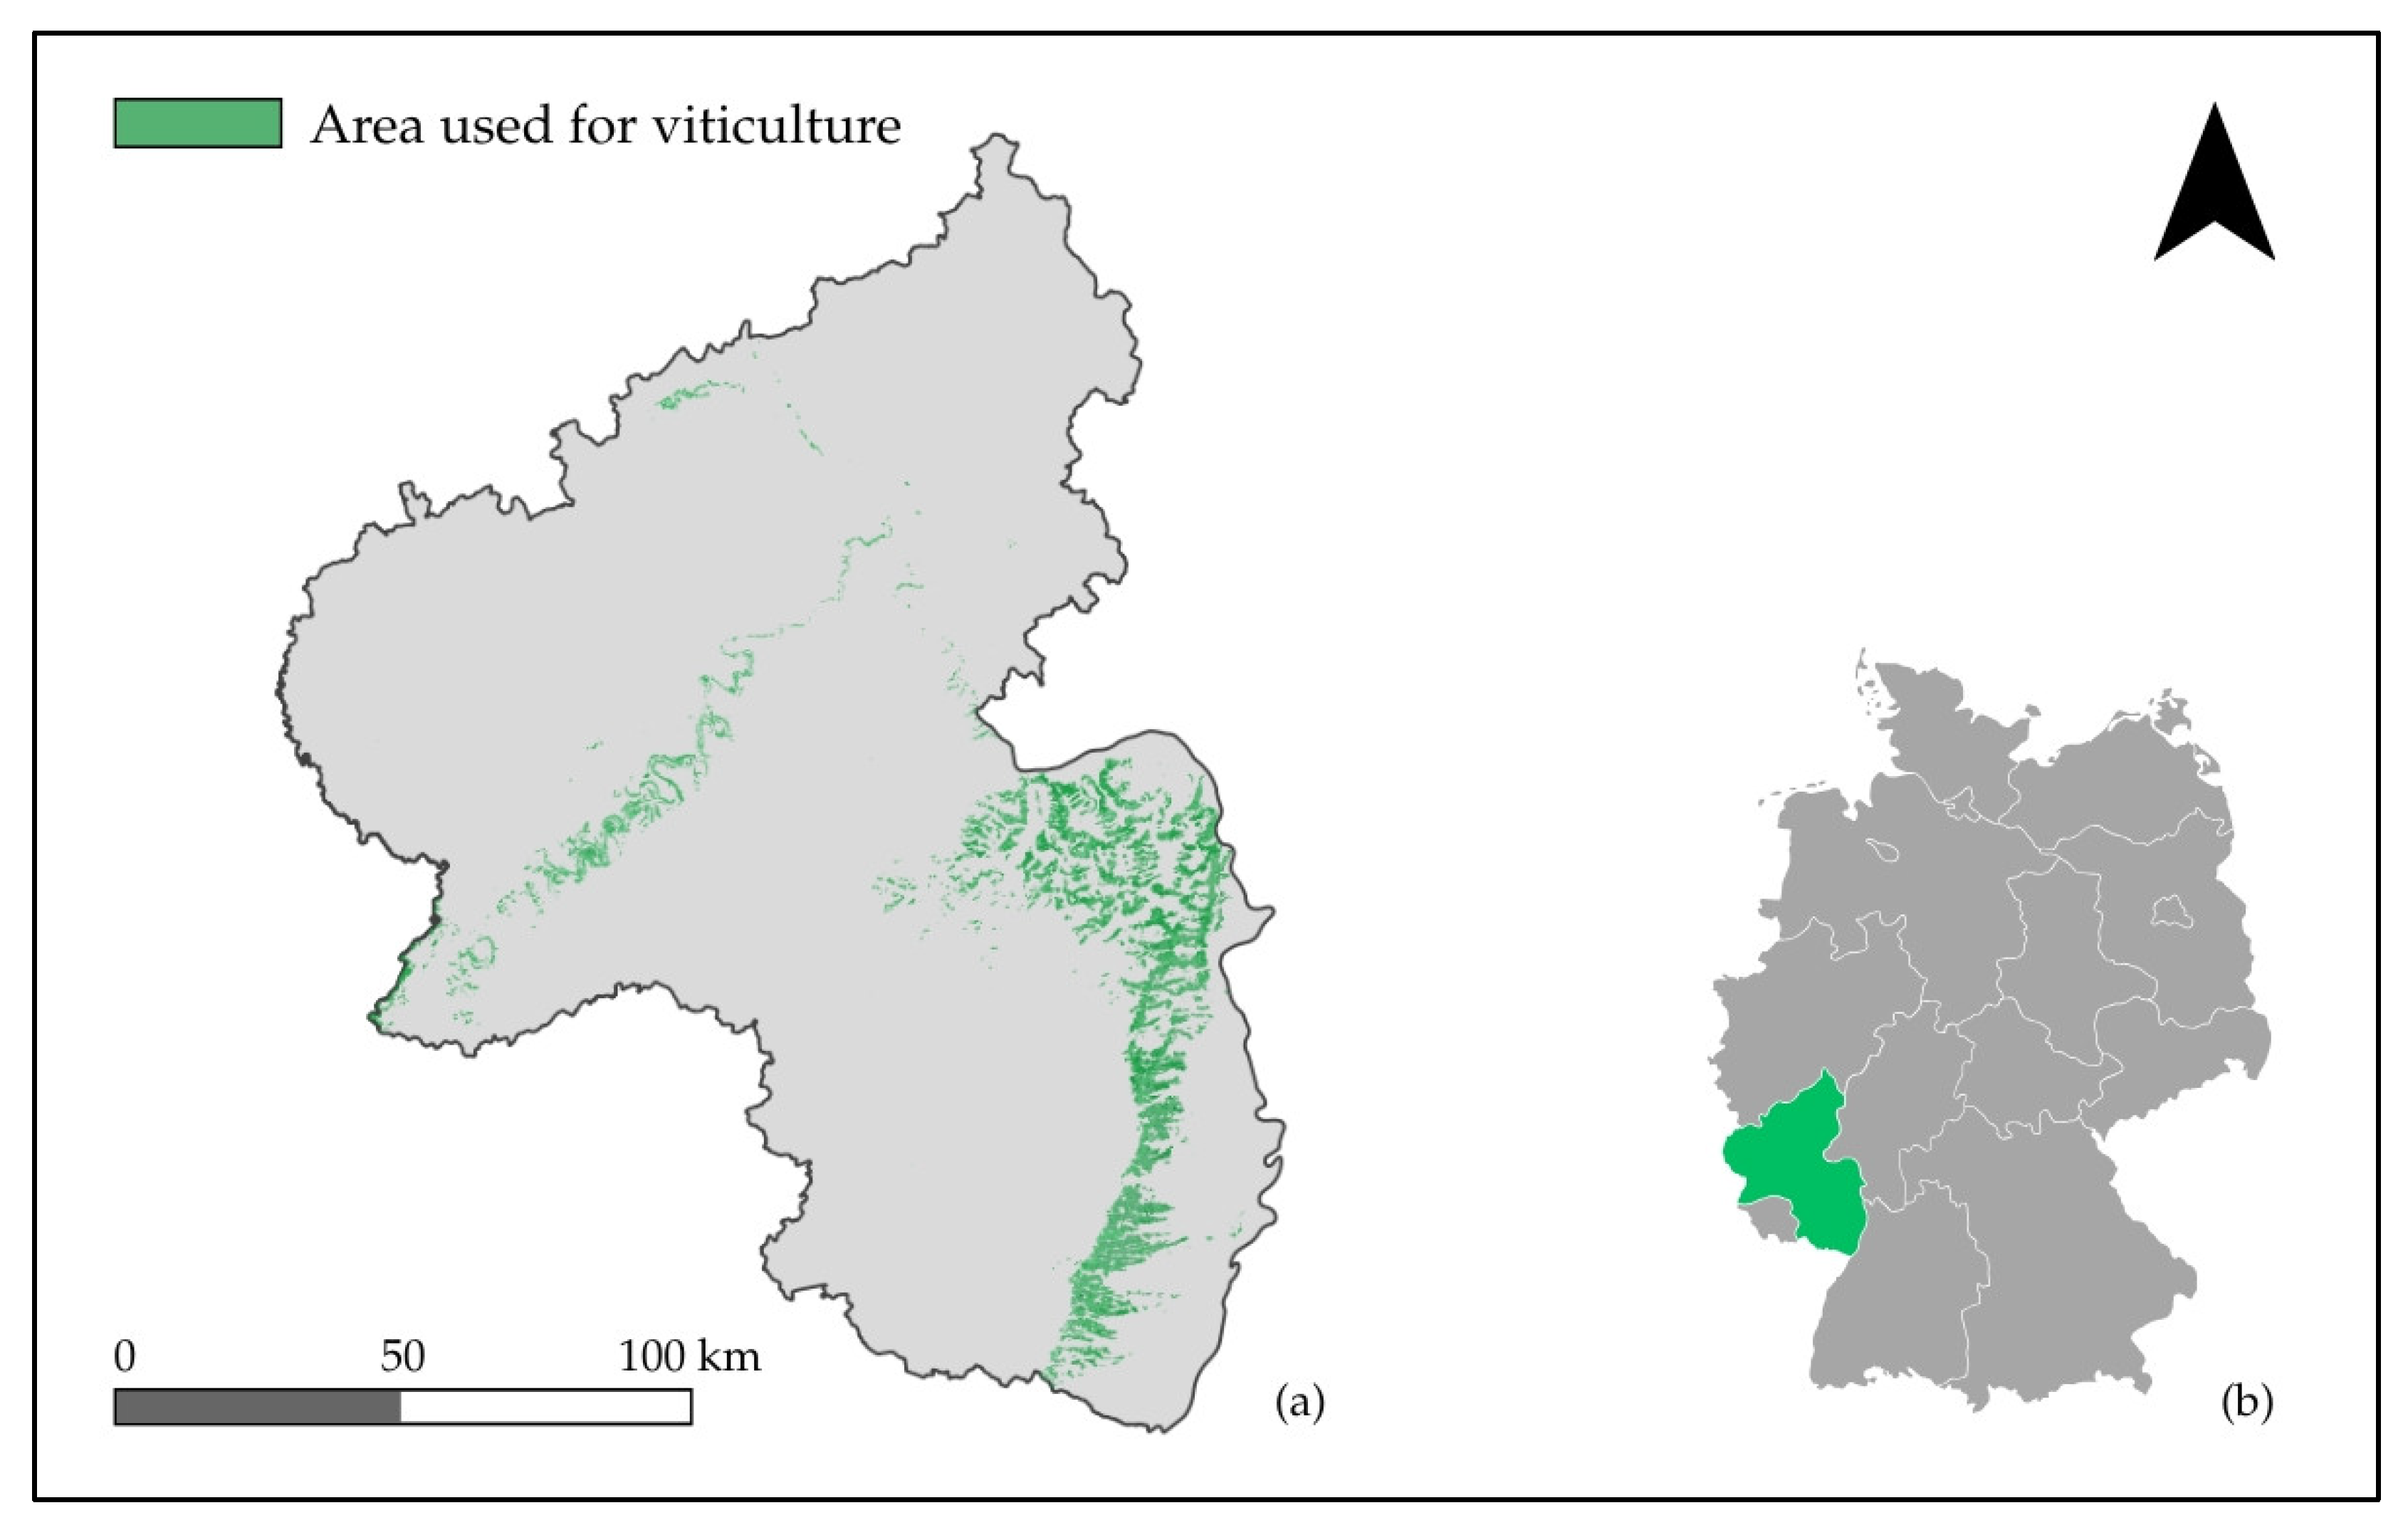
2.1. The Study Area
2.2. The Methodological Framework
- Planted area: The analysis uses the cadastral vineyard area to assess agrivoltaic potential. This reflects current regulatory frameworks, which require that agricultural productivity (a minimum required yield per hectare) must be maintained for land to be recognized as ‘agrivoltaic’. Installing PV modules over the whole property area would compromise the agricultural function of the site and violate the intended crop-integrated character of agrivoltaic systems. ‘Planted area’ denotes the actively cultivated vineyard area within a cadastral plot.
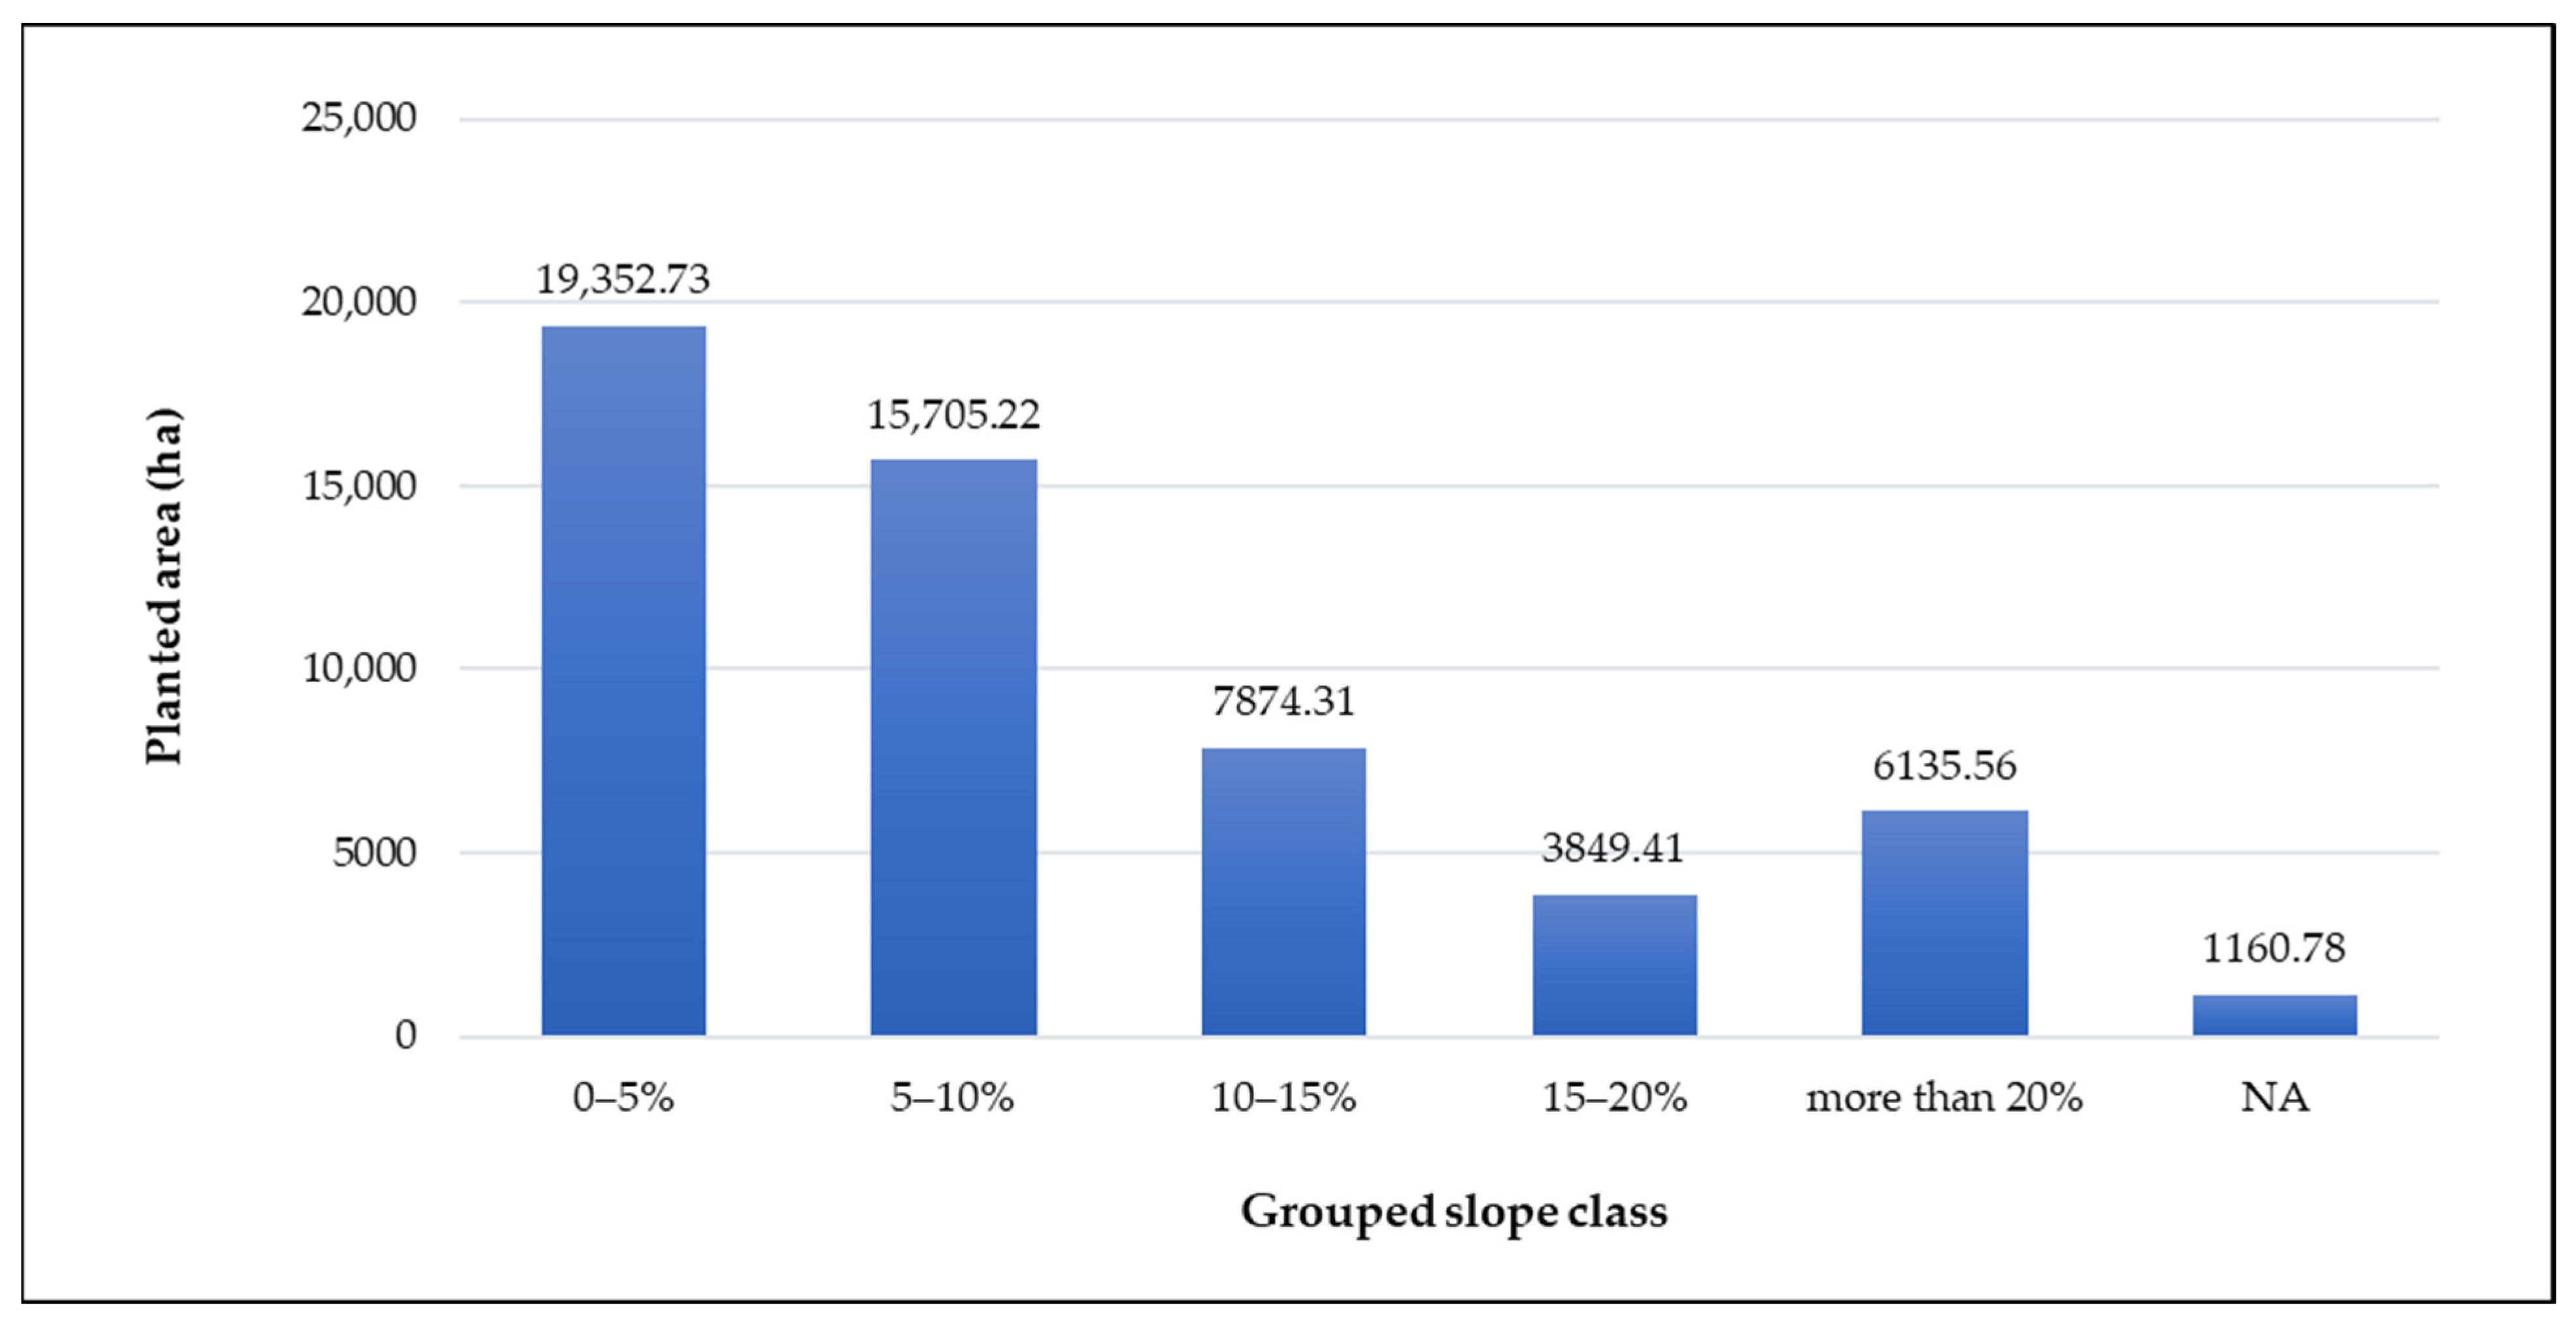
- Slope: Vineyards in Germany are commonly classified according to their slope gradient [31]. German law distinguishes between hillside locations and flat sites. Steep-slope vineyards are defined as those with a slope of more than 30%. This classification is widely used in viticultural practice, as slope has direct implications for vineyard management, mechanization, microclimate, and, in this context, the technical feasibility of elevated agrivoltaic systems. Due to technical considerations, particularly the increasing construction complexity on steeper terrain, we differentiated vineyard plots by slope gradient into three classes: 0–5% (low), 5–15% (moderate), and >15% (high). Slopes above 15% typically entail significant additional construction effort and may require adapted mounting structures or specialized installation techniques [20].
- Plot size: Plot size influences both grid integration requirements and economic viability, as larger systems may benefit from economies of scale but place greater demands on infrastructure. Following the approach proposed by Rösch et al. (2025), systems are differentiated by a threshold of 2.5 hectares, as German building law allows simplified approval procedures for agrivoltaic installations below this size [20,21].
- Restricted area: As part of the spatial filtering process, areas designated under the Natura 2000 network were excluded from the analysis. Although viticulture exists within some Natura 2000 sites, the installation of agrivoltaic systems in these protected areas is highly unlikely due to regulatory restrictions and potential conflicts with conservation objectives [22]. Construction may be legally permitted in individual cases under building law. However, new agrivoltaic installations in these areas are excluded from public funding under the German Renewable Energy Sources Act (EEG), § 37 (3), further limiting their practical feasibility [32].
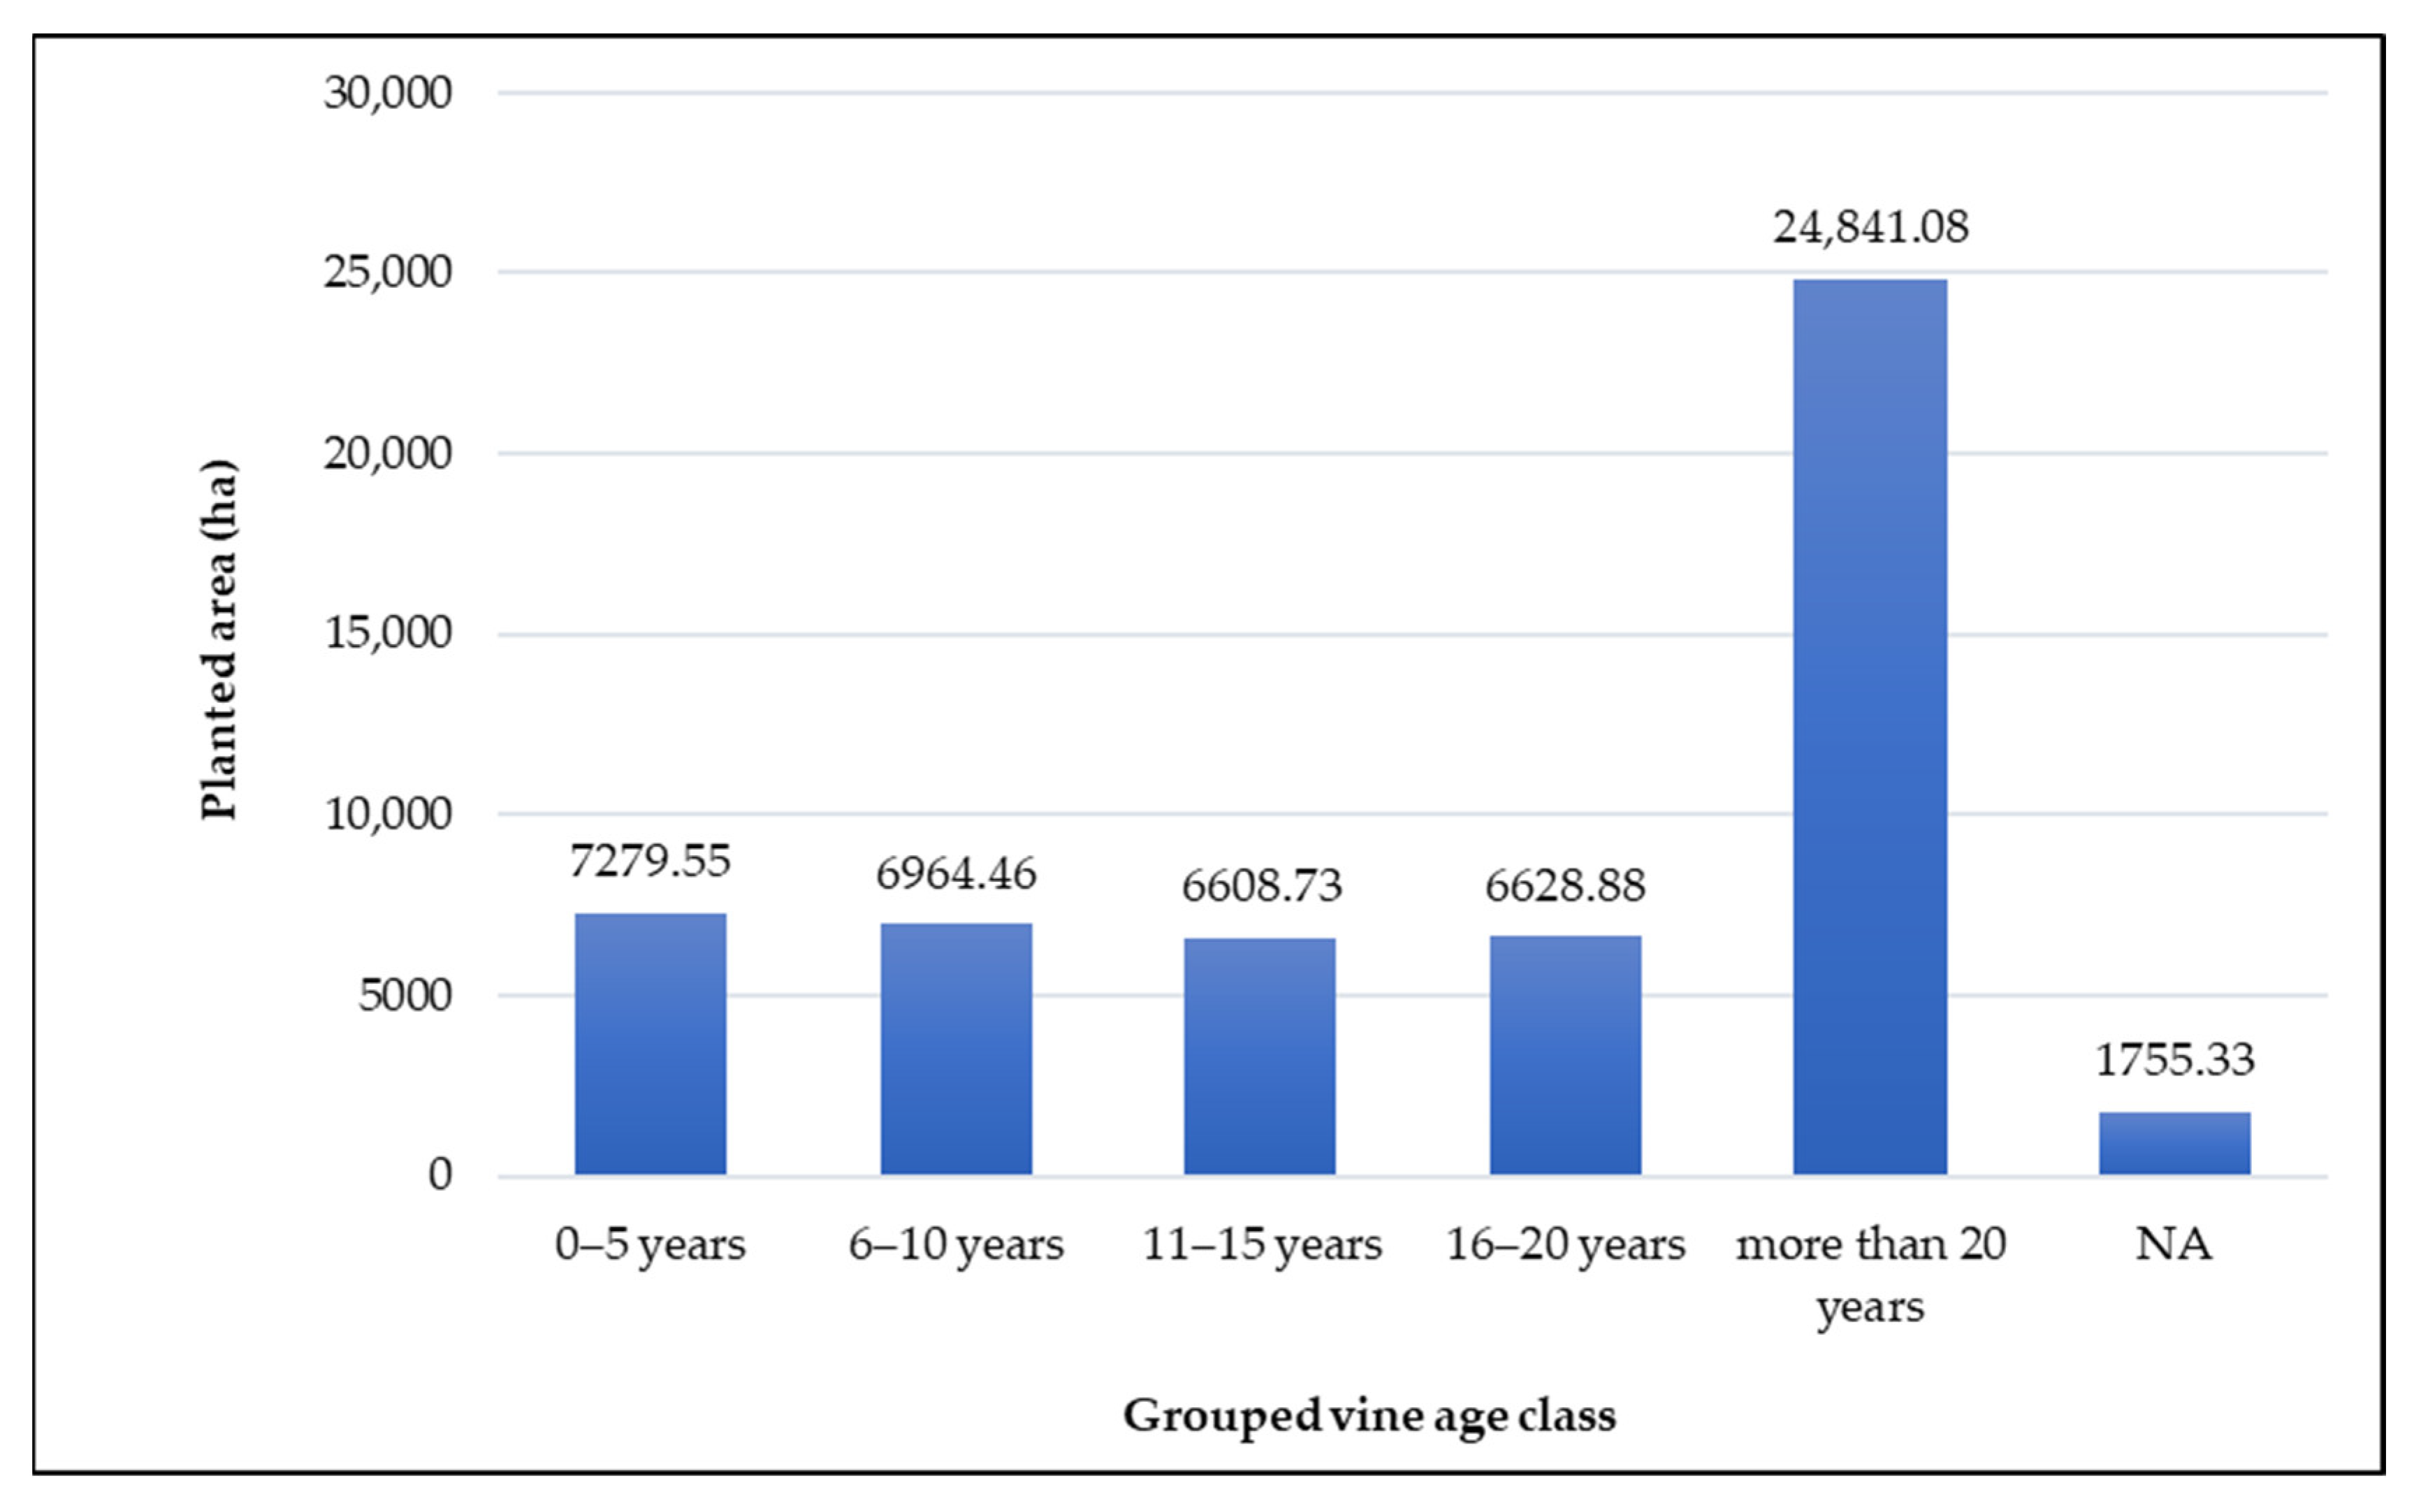
- Vine age: This parameter enables the identification of either young vineyards that may require adapted agrivoltaic designs, or older vineyards approaching the end of their productive lifecycle, which may be more compatible with structural retrofitting. To account for the age of the vineyard plots, the planting year was used to calculate the vine age as of the 2025 growing season. Based on viticultural lifecycle stages and practical decision-making horizons, vine age was grouped into five discrete classes: 0–5 years, 6–10 years, 11–15 years, 16–20 years, and more than 20 years. This categorization serves as a proxy and addresses an assessment of potential age-related constraints or opportunities for agrivoltaics implementation.
- Grape variety: Based on ongoing field trials, selected grape varieties can be filtered. For this study, the most common grape varieties in Germany are categorized into white and red grape varieties. Given the significant diversity of grape varieties cultivated in Germany, the 12 most commonly planted varieties were selected. In our framework, grape variety is treated as a descriptive variable that can be filtered to reflect the distribution of grape varieties. However, this does not imply any inference about varietal shade tolerance, which is beyond the scope of the present analysis.
3. Results
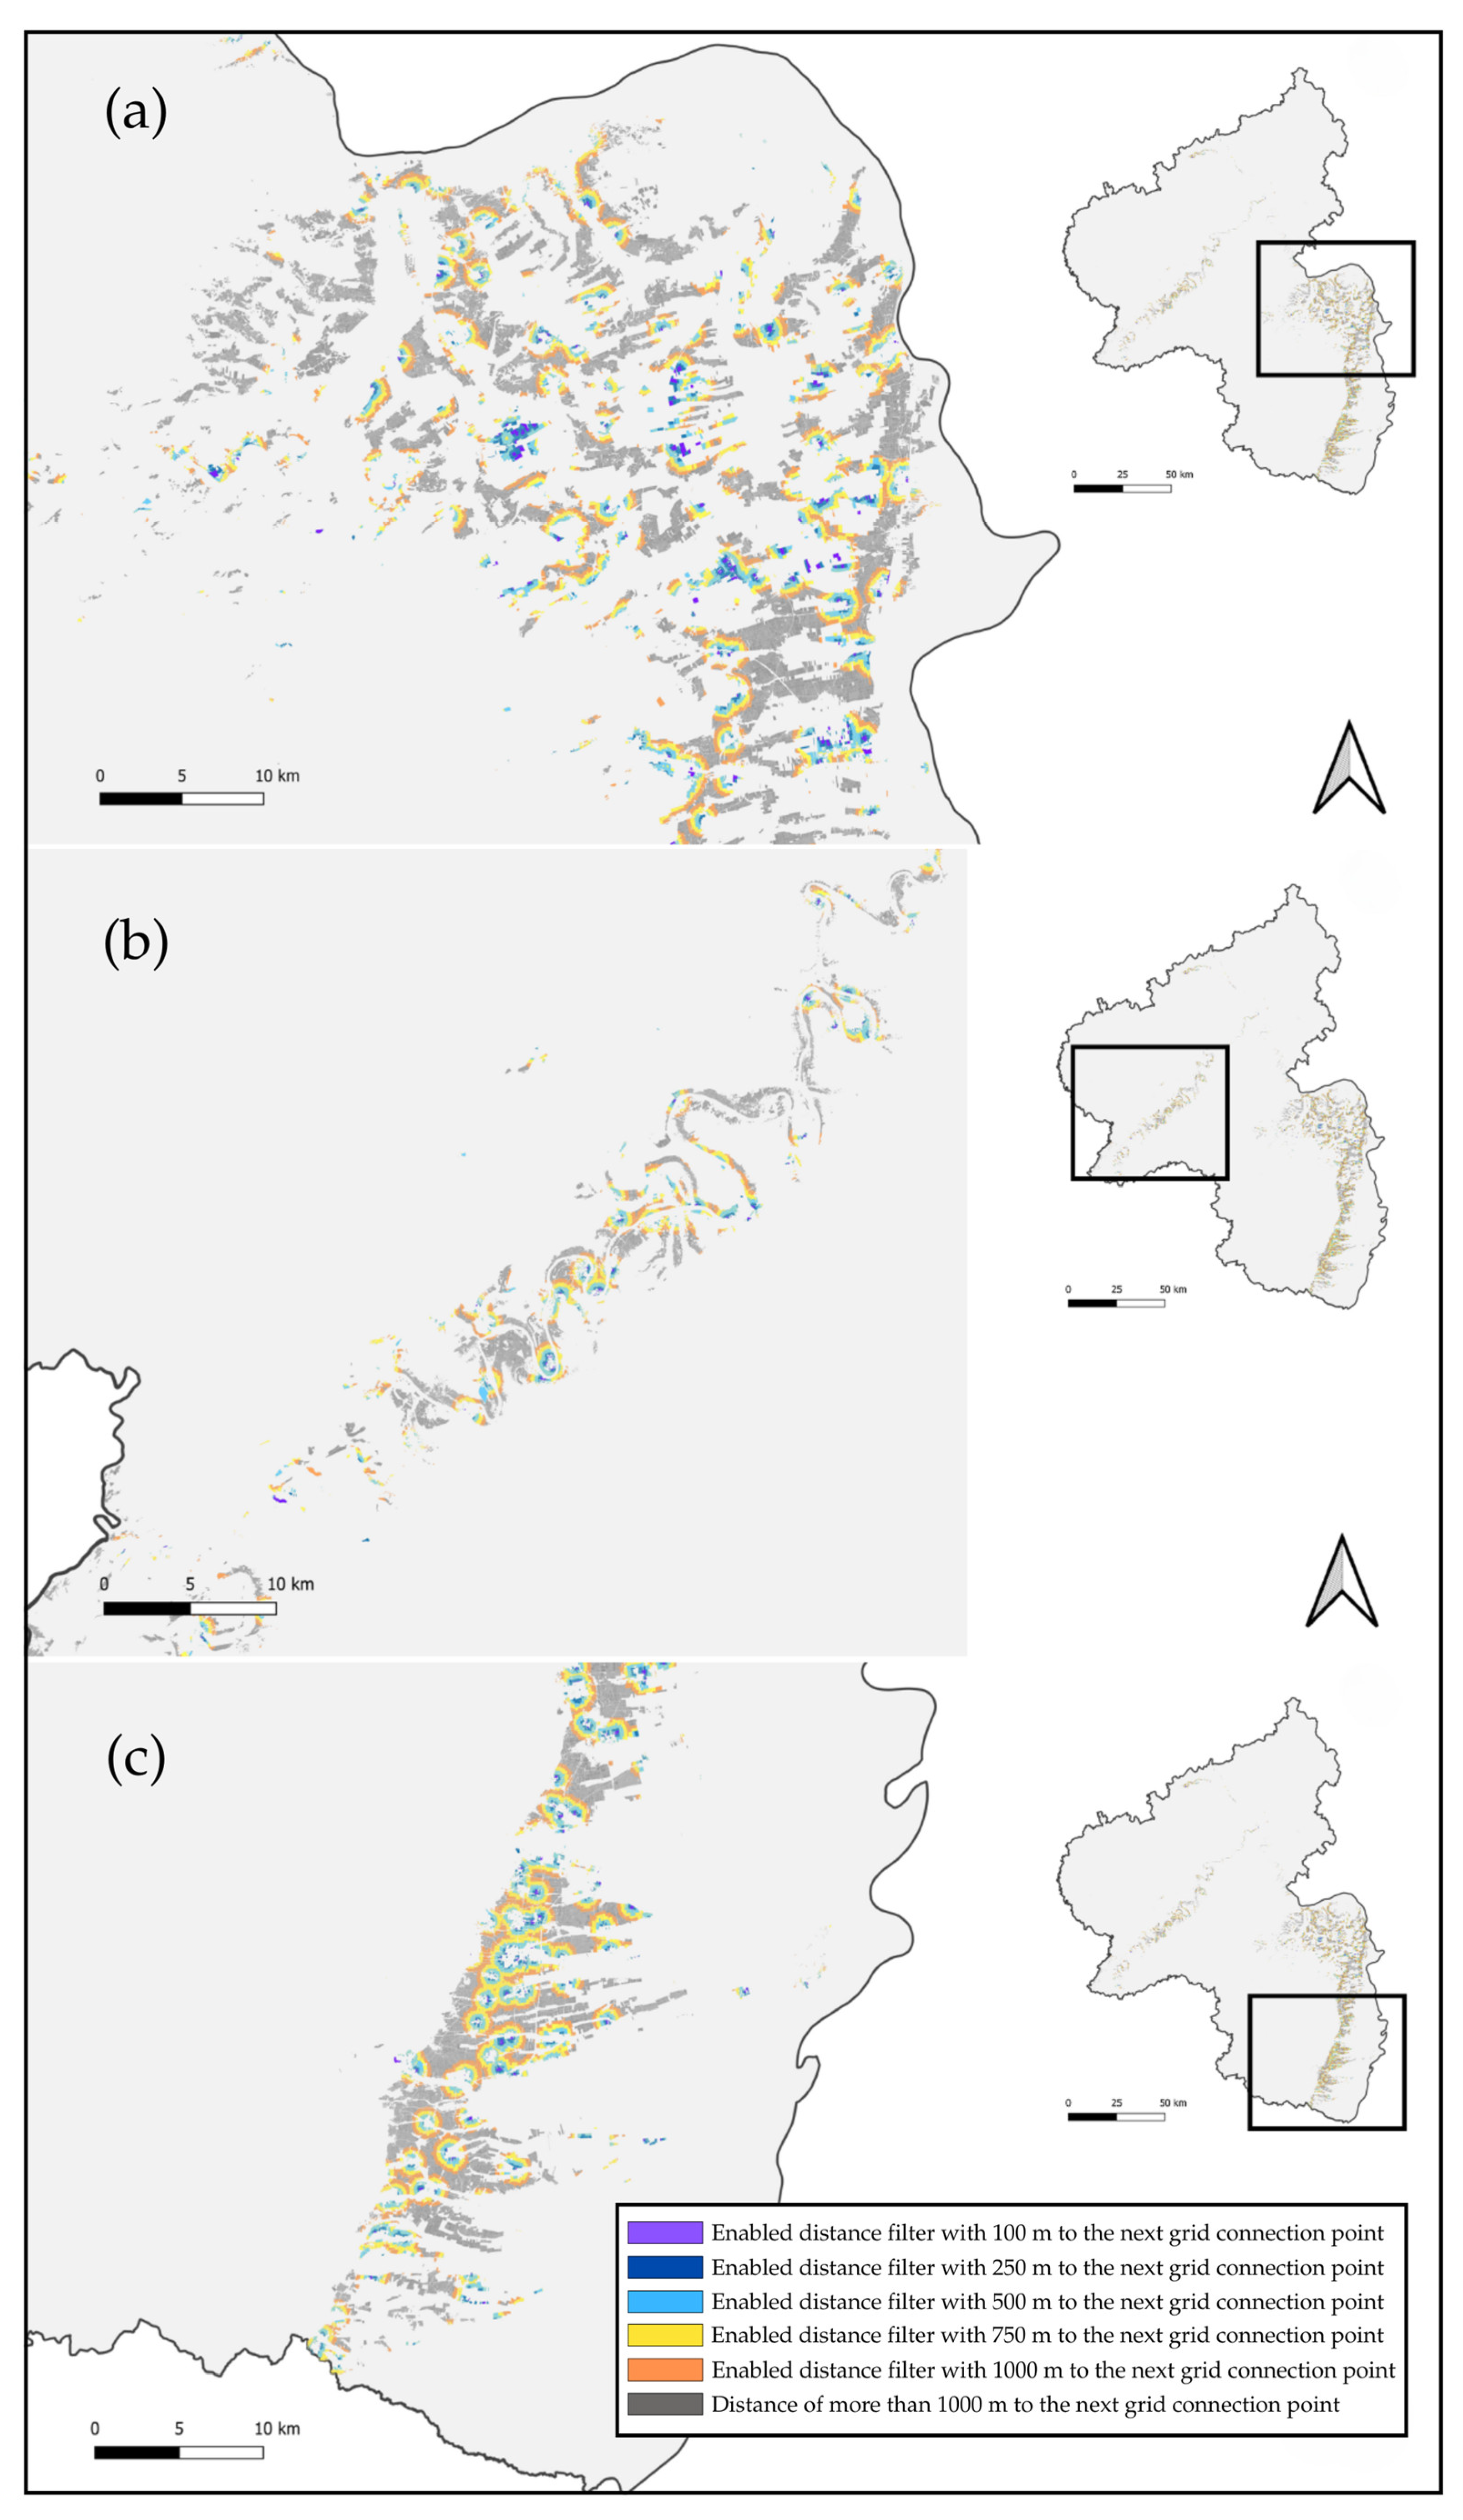
3.1. Integration of Grid Infrastructure Data
| Distance to Grid Connection Point | Planted Area | Share of Total Planted Area (%) | Installable Capacity (GWp) |
|---|---|---|---|
| All | 54,078.0 | 100% | 37.85 |
| ≤1500 m grid distance | 37,964.7 | 70% | 24.68 |
| ≤1000 m grid distance | 24,031.5 | 44% | 15.62 |
| ≤750 m grid distance | 15,416.7 | 29% | 10.02 |
| ≤500 m grid distance | 7578.4 | 14% | 4.93 |
| ≤250 m grid distance | 2155.3 | 4% | 1.40 |
| ≤100 m grid distance | 405.1 | 1% | 0.26 |
3.2. Filtering by Agronomic Criteria
4. Discussion
4.1. Discussion of Results in Relation to Existing Research
4.2. Critical Reflection on Methodological Robustness
4.3. Practical Implications
4.4. Future Research Needs
5. Conclusions
Author Contributions
Funding
Data Availability Statement
Acknowledgments
Conflicts of Interest
Abbreviations
| approx. | approximately |
| BLE | Federal Office for Agriculture and Food |
| BMLEH | Federal Ministry of Agriculture, Food, and Regional Identity |
| GHI | global horizontal irradiation |
| GWp | gigawatt peak |
| Ha | hectare |
| m | meter |
| MCDA | multi-criteria decision-making analysis |
| MWp | megawatt peak |
| OAT | one-at-a-time |
| PV | photovoltaics |
Appendix A
Appendix A.1
Appendix A.2
Appendix A.3
Appendix B
- Coordination of the reference system. All distance-based operations were carried out in a metric CRS (EPSG:25832, UTM 32N). Layers used for proximity calculations were projected to EPSG:25832 before the main analysis.
- Geometry validation (QA). The Rhineland-Palatinate (RLP) boundary (WFS vermkv:landesgrenze_rlp) and Natura 2000 polygons were checked for geometry validity using qgis:checkvalidity to avoid topology issues in downstream overlays.
- Study-area clipping of protected areas. Natura 2000 polygons were clipped to the RLP boundary (native:clip/native:intersection) to restrict protected-area geometries to the study area and to improve the efficiency of analytical runs.
- Consolidation of potential grid-access points. Power-grid point layers from powergrid_2024-11-25.gpkg (substation, switch, minor_distribution, distribution, connection, and generator_renewable filtered to source = ‘wind’) were unified through a multi-step native:union sequence to produce a single consolidated multipoint dataset.
- Reprojection of the consolidated grid dataset. The consolidated grid-access points were reprojected to EPSG:25832 (native:reprojectlayer) to ensure that all subsequent distance thresholds were interpreted in meters.
- Plot proximity classification. Aggregated vineyard plots were classified by distance to the consolidated grid-access points using native:selectwithindistance. Reported distance bands were 100 m, 500 m, and 1000 m (additional thresholds were explored for exploratory reasons only).
- Protected-area flagging/exclusion. Plots intersecting Natura 2000 (RLP-clipped) were identified with native:selectbylocation (predicates including intersects/within/touches) and were flagged or excluded for the main analysis and sensitivity checks.
| Step | What Was Done | Input Data | Key Parameter | Output | Purpose |
|---|---|---|---|---|---|
| 1 | Project setup and coordinate system | — | Target CRS for all distance operations: ETRS_1989_UTM_Zone_32N | Common metric coordinate basis | Ensures all buffers/proximity calculations are in meters (consistent, comparable distances). |
| 2 | Geometry validity check | Rhineland-Palatinate boundary (WFS vermkv:landesgrenze_rlp), Natura 2000 polygons (Natura2000_end2023.gpkg) | qgis:checkvalidity (default settings) | Valid (cleaned) geometries | Reduces topology errors and prevents failures in overlay/clip operations. |
| 3 | Clip Natura 2000 to study area | Natura 2000 polygons + RLP boundary | native:clip/native:intersection | Natura 2000 polygons restricted to RLP | Guarantees protected-area layers match the study extent; avoids cross-border artefacts. |
| 4 | Consolidate potential grid-access points | powergrid_2024-11-25.gpkg point layers: substation, switch, minor_distribution, distribution, connection, generator_renewable (filtered to source = ‘wind’) | Sequence of native:union operations | Consolidated multipoint dataset of potential grid-access locations | Unifies all relevant grid POIs into a single, robust candidate set for proximity analysis. |
| 5 | Reproject consolidated points to metric CRS | Consolidated grid-access points (from Step 4) | native:reprojectlayer: ETRS_1989_UTM_Zone_32N | Grid-access points in uniform projected system | Required so distance thresholds are interpreted in meters. |
| 6 | Classify vineyard plots by proximity to grid-access points | Vineyard plots (aggregated cadastral layer) + consolidated grid-access points | native:selectwithindistance; thresholds used in reporting: 100 m, 500 m, 1000 m | Selection per distance band | Produces the proximity classes cited in the main text (e.g., the 1 km figure). |
| 7 | Flag/exclude plots with protected-area overlap | Vineyard plots + Natura 2000 (RLP-clipped) | native:selectbylocation; predicates incl. intersects/within/touches | Plots flagged or excluded if intersecting Natura 2000 | Reflects ecological/regulatory constraints in the site selection and sensitivity analysis. |
References
- European Union. Regulation (EU) 2021/1119 of the European Parliament and of the Council of 30 June 2021 Establishing the Framework for Achieving Climate Neutrality and Amending Regulations (EC) No 401/2009 and (EU) 2018/1999 (‘European Climate Law’), OJ L 243, 9 July 2021; European Parliament: Strasbourg, France, 2021; pp. 1–17. [Google Scholar]
- European Union. Regulation (EU) 2018/1999 of the European Parliament and of the Council of 11 December 2018 on the Governance of the Energy Union and Climate Action. Off. J. Eur. Union 2018, L 328, 1–77. Available online: https://eur-lex.europa.eu/legal-content/EN/TXT/PDF/?uri=OJ:L:2018:328:FULL (accessed on 9 September 2025).
- Kiesecker, J.M.; Evans, J.S.; Oakleaf, J.R.; Dropuljić, K.Z.; Vejnović, I.; Rosslowe, C.; Cremona, E.; Bhattacharjee, A.L.; Nagaraju, S.K.; Ortiz, A.; et al. Land use and Europe’s renewable energy transition: Identifying low-conflict areas for wind and solar development. Front. Environ. Sci. 2024, 12, 1355508. [Google Scholar] [CrossRef]
- Hilker, J.M.; Busse, M.; Müller, K.; Zscheischler, J. Photovoltaics in agricultural landscapes: “Industrial land use” or a “real compromise” between renewable energy and biodiversity? Perspectives of German nature conservation associations. Energy Sustain. Soc. 2024, 14, 6. [Google Scholar] [CrossRef]
- Zeddies, H.H.; Parlasca, M.; Qaim, M. Agrivoltaics Increases Public Acceptance of Solar Energy Production on Agricultural Land. Land Use Policy 2025, 156, 107604. [Google Scholar] [CrossRef]
- Dinesh, H.; Pearce, J.M. The potential of agrivoltaic systems. Renew. Sustain. Energy Rev. 2016, 54, 299–308. [Google Scholar] [CrossRef]
- Dupraz, C.; Marrou, H.; Talbot, G.; Dufour, L.; Nogier, A.; Férard, Y. Combining solar photovoltaic panels and food crops for optimising land use: Towards new agrivoltaic schemes. Renew. Energy 2011, 36, 2725–2732. [Google Scholar] [CrossRef]
- Amaducci, S.; Yin, X.; Colauzzi, M. Agrivoltaic systems to optimise land use for electric energy production. Appl. Energy 2018, 220, 545–561. [Google Scholar] [CrossRef]
- Statistisches Bundesamt (Destatis). Land Use in Germany; Statistisches Bundesamt: Wiesbaden, Germany, 2023.
- Bundesministerium für Wirtschaft und Klimaschutz (BMWK). Photovoltaik-Strategie: Handlungsfelder und Maßnahmen für Einen Beschleunigten Ausbau der Photovoltaik; BMWK: Berlin, Germany, 2023. Available online: https://www.bundeswirtschaftsministerium.de/Redaktion/DE/Publikationen/Energie/photovoltaik-stategie-2023.pdf (accessed on 29 August 2025).
- Wagner, M.; Stanbury, P.; Dietrich, T.; Döring, J.; Ewert, J.; Foerster, C.; Freund, M.; Friedel, M.; Kammann, C.; Koch, M.; et al. Developing a Sustainability Vision for the Global Wine Industry. Sustainability 2023, 15, 10487. [Google Scholar] [CrossRef]
- Santos, J.A.; Fraga, H.; Malheiro, A.C.; Moutinho-Pereira, J.; Dinis, L.-T.; Correia, C.; Moriondo, M.; Leolini, L.; Dibari, C.; Costafreda-Aumedes, S.; et al. A Review of the Potential Climate Change Impacts and Adaptation Options for European Viticulture. Appl. Sci. 2020, 10, 3092. [Google Scholar] [CrossRef]
- van Leeuwen, C.; Destrac-Irvine, A.; Dubernet, M.; Duchêne, E.; Gowdy, M.; Marguerit, E.; Pieri, P.; Parker, A.; de Rességuier, L.; Ollat, N. An Update on the Impact of Climate Change in Viticulture and Potential Adaptations. Agronomy 2019, 9, 514. [Google Scholar] [CrossRef]
- Willockx, B.; Lavaert, C.; Cappelle, J. Geospatial Assessment of Elevated Agrivoltaics on Arable Land in Europe to Highlight the Implications on Design, Land Use and Economic Level. Energy Rep. 2022, 8, 8736–8751. [Google Scholar] [CrossRef]
- Trommsdorff, M.; Hopf, M.; Hörnle, O.; Berwind, M.; Schindele, S.; Wydra, K. Can synergies in agriculture through an integration of solar energy reduce the cost of agrivoltaics? An economic analysis in apple farming. Appl. Energy 2023, 350, 121619. [Google Scholar] [CrossRef]
- Du, F.; Deng, W.; Yang, M.; Wang, H.; Mao, R.; Shao, J.; Fan, J.; Chen, Y.; Fu, Y.; Li, C.; et al. Protecting grapevines from rainfall in rainy conditions reduces disease severity and enhances profitability. Crop Prot. 2015, 67, 261–268. [Google Scholar] [CrossRef]
- Magarelli, A.; Mazzeo, A.; Ferrara, G. Fruit Crop Species with Agrivoltaic Systems: A Critical Review. Agronomy 2024, 14, 722. [Google Scholar] [CrossRef]
- Agrivoltaics Map—Facilities Trackey by Fraunhofer ISE. Available online: https://agrivoltaicsmap.github.io/Facilities/ (accessed on 17 July 2025).
- Strub, L.; Wittke, M.; Trommsdorff, M.; Stoll, M.; Kammann, C.; Loose, S. Assessing the economic performance of agrivoltaic systems in vineyards—Framework development, simulated scenarios and directions for future research. Front. Hortic. 2024, 3, 1473072. [Google Scholar] [CrossRef]
- Rösch, C.; Fakharizadehshirazi, E. The spatial socio-technical potential of agrivoltaics in Germany. Renew. Sustain. Energy Rev. 2024, 202, 114706. [Google Scholar] [CrossRef]
- Cammerino, A.R.B.; Ingaramo, M.; Piacquadio, L.; Monteleone, M. How Much Longer Can We Tolerate Further Loss of Farmland Without Proper Planning? The Agrivoltaic Case in the Apulia Region (Italy). Agronomy 2025, 15, 1177. [Google Scholar] [CrossRef]
- European Environment Agency (EEA). Natura 2000 Areas—End 2023. 2024. Available online: https://www.eea.europa.eu/en/datahub/datahubitem-view/6fc8ad2d-195d-40f4-bdec-576e7d1268e4 (accessed on 31 July 2025).
- Hauger, S.; Lieb, V.; Glaser, R. Spatial Potential Analysis and Site Selection for Agrivoltaics in Germany. Renew. Sustain. Energy Rev. 2025, 213, 115469. [Google Scholar] [CrossRef]
- Statistisches Bundesamt (Destatis). Wine Production in Germany—Key Figures and Regional Data. Available online: https://www.destatis.de/EN/Themes/Economic-Sectors-Enterprises/Agriculture-Forestry-Fisheries/Wine/Tables/liste-wine.html (accessed on 17 July 2025).
- Statistical Office of Rhineland-Palatinate. Land Use of Agricultural Holdings, Bodennutzung Landwirtschaftlicher Betriebe 2024; Statistical Office of Rhineland-Palatinate: Bad Ems, Germany, 2024; p. 11. Available online: https://www.statistischebibliothek.de/mir/servlets/MCRFileNodeServlet/RPHeft_derivate_00008544/C1023_202400_1j_L.pdf (accessed on 17 July 2025).
- World Bank Group; Energy Sector Management Assistance Program (ESMAP). Global Solar Atlas—Online Tool. Entry for the Rheinhessen region. Available online: https://globalsolaratlas.info/map?c=49.246293,7.3526,8&s=49.824695,8.129196&m=site (accessed on 17 July 2025).
- Deutscher Wetterdienst (DWD). Klimastatusbericht 2024 (Climate Status Report 2024). Available online: https://www.dwd.de/DE/leistungen/klimastatusbericht/publikationen/ksb_2024.pdf (accessed on 17 July 2025).
- QGIS Development Team. QGIS Geographic Information System, Version 3.12.7. Open Source Geospatial Foundation Project. Available online: https://qgis.org (accessed on 17 July 2025).
- Landwirtschaftskammer Rheinland-Pfalz. Viticultural Cadastral Data—Digital Vector Dataset for Vineyard Plots in Rhineland-Palatinate; Landwirtschaftskammer Rheinland-Pfalz: Mainz, Germany, 2024. [Google Scholar]
- OpenStreetMap contributors. OpenStreetMap. Available online: https://www.openstreetmap.org (accessed on 17 July 2025).
- Bundesministerium der Justiz. Weinverordnung (WeinV)–§ 34b: Gebiete mit geschützter Ursprungsbezeichnung. Gesetze im Internet. 2024. Available online: https://www.gesetze-im-internet.de/weinv_1995/__34b.html (accessed on 17 July 2025).
- Öko-Institut. Potenzialflächen für Agri-Photovoltaik; Öko-Institut e.V.: Freiburg, Germany, 2024; Available online: https://www.oeko.de/fileadmin/oekodoc/Potenzialflaechen_fuer_Agri-Photovoltaik.pdf (accessed on 17 July 2025).
- Battaglini, A.; Komendantova, N.; Brtnik, P.; Patt, A. Perception of Barriers for Expansion of Electricity Grids in the European Union. Energy Policy 2012, 47, 254–259. [Google Scholar] [CrossRef]
- Strub, L.; Wittke, M.; Trommsdorff, M.; Stoll, M.; Kammann, C.; Loose, S. Schattendasein. Dtsch. Weinbau 2025, 9, 24–29. [Google Scholar]
- Steinbach, A. Barriers and Solutions for Expansion of Electricity Grids—The German Experience. Energy Policy 2013, 63, 224–229. [Google Scholar] [CrossRef]
- Gorman, W.; Kemp, J.M.; Rand, J.; Seel, J.; Wiser, R.; Manderlink, N.; Kahrl, F.; Porter, K.; Cotton, W. Grid connection barriers to renewable energy deployment in the United States. Joule 2025, 9, 101791. [Google Scholar] [CrossRef]
- Couto, A.; Estanqueiro, A. Wind Power Plants Hybridised with Solar Power: A Generation Forecast Perspective. J. Clean. Prod. 2023, 423, 138793. [Google Scholar] [CrossRef]
- The cost disadvantage of steep slope viticulture and strategies for its mitigation. OENO One 2021, 55, 224–229. [CrossRef]
- Fattoruso, G.; Toscano, D.; Venturo, A.; Scognamiglio, A.; Fabricino, M.; Di Francia, G. A Spatial Multicriteria Analysis for a Regional Assessment of Eligible Areas for Sustainable Agrivoltaic Systems in Italy. Sustainability 2024, 16, 911. [Google Scholar] [CrossRef]
- Hauger, S.; Bieber, L.-M.; Schürmer, T.; Lieb, V.; Trötsch, H.; Torres Boggio, A.A.; Hopf, M.; Rößner, J.-V.; Böhm, D.; Grolik, S.; et al. AgriChance. Agri-PV als Chance für Landwirtschaft und Energiewende in Hamburg—Entscheidungshilfevorhaben zur Darlegung des Potenzials, der Ökonomischen Betrachtung und Energetischen Integration. Abschlussbericht; Fraunhofer ISE: Freiburg, Germany, 2024; p. 173. [Google Scholar] [CrossRef]
- Uzun Bayraktar, T. New Approaches in Viticulture: Different Rates of Net Shadow Applications to Yield, Must, Color and Wine Quality. Horticulturae 2025, 11, 21. [Google Scholar] [CrossRef]
- Kiefer, C.; Szolnoki, G. Exploring Market Potential and Consumer Preferences for Fungus-Resistant Grape Varieties: A Discrete Choice Analysis in Germany. Future Foods 2024, 10, 100449. [Google Scholar] [CrossRef]
- KTBL (Kuratorium für Technik und Bauwesen in der Landwirtschaft e.V.). Weinbau und Kellerwirtschaft: KTBL-Datensammlung, 16th ed.; KTBL: Darmstadt, Germany, 2017; ISBN 978-3-945088-42-5. [Google Scholar]
- Marone, E.; Bertocci, M.; Boncinelli, F.; Marinelli, N. The Cost of Making Wine: A Tuscan Case Study Based on a Full Cost Approach. Wine Econ. Policy 2017, 6, 88–97. [Google Scholar] [CrossRef]
- Rathnayake, C.; Joshi, S.; Cerratto-Pargman, T. Mapping the Current Landscape of Citizen-Driven Environmental Monitoring: A Systematic Literature Review. Sustain. Sci. Pract. Policy 2020, 16, 326–334. [Google Scholar] [CrossRef]
- Werner, C.P.; Birkhaeuer, J.; Locher, C.; Gerger, H.; Heimgartner, N.; Colagiuri, B.; Gaab, J. Price Information Influences the Subjective Experience of Wine: A Framed Field Experiment. Food Qual. Prefer. 2021, 92, 104223. [Google Scholar] [CrossRef]
- Poni, S.; Gatti, M.; Palliotti, A.; Dai, Z.; Duchêne, E.; Truong, T.-T.; Ferrara, G.; Matarrese, A.M.S.; Gallotta, A.; Bellincontro, A.; et al. Grapevine Quality: A Multiple Choice Issue. Sci. Hortic. 2018, 234, 445–462. [Google Scholar] [CrossRef]

| Parameter | Unit/Scale | Relevance | Data Source |
|---|---|---|---|
| Slope | % | Limits technical feasibility, affects machinery use | Cadastral data |
| Plot size | ha | Total plot size, including landscape elements | Cadastral data |
| Planted area | ha | Planted area that is used for viticulture | Cadastral data |
| Grid connection proximity | Distance (m) | Determines connection cost and feasibility | Open Street Map (2024-11-25) |
| Vine age | Year | Indicates replanting cycles and investment timing | Cadastral data |
| Land use | Land use entry | Active viticultural management | Cadastral data |
| Restricted area (Natura 2000) | ha | Excluded due to environmental protection | European Environment Agency |
| Grape variety | Variety name | Determines shading tolerance and suitability | Cadastral data |
| Solar irradiance (GHI) | kWh/m2/year | Indicates PV energy potential | Global Solar Atlas (2.12) |
| Slope (%) | Planted Area (ha) |
|---|---|
| 0–5% | 19,352.7 |
| 5–10% | 15,705.2 |
| 10–15% | 7874.3 |
| 15–20% | 3849.4 |
| more than 20% | 6135.6 |
| NA | 1160.8 |
| Overall | 54,078.0 |
| Slope (%) | Plot Size < 2.5 ha | Plot Size ≥ 2.5 ha | Total |
|---|---|---|---|
| 0–5% | 19,235.99 | 116.7 | 19,352.7 |
| 5–10% | 15,652.3 | 52.9 | 15,705.2 |
| 10–15% | 7868.7 | 5.6 | 7874.3 |
| 15–20% | 3846.8 | 2.6 | 3849.4 |
| more than 20% | 6113.2 | 22.4 | 6135.6 |
| NA | 1153.1 | 7.7 | 1160.8 |
| Total | 53,870.1 | 207.9 | 54,078.0 |
| Grape Variety Category | Planted Area (ha) | Share of Total Planted Area (%) |
|---|---|---|
| White | 33,261.5 | 62% |
| Red | 8451.6 | 16% |
| Other | 12,364.9 | 23% |
| Total | 54,078.0 | 100% |
| Year Category | Planted Area (ha) | Share of Total Planted Area (%) |
|---|---|---|
| 0–5 years | 7279.6 | 13% |
| 6–10 years | 6964.5 | 13% |
| 11–15 years | 6608.7 | 12% |
| 16–20 years | 6628.9 | 12% |
| more than 20 years | 24,851.1 | 46% |
| NA | 1755.3 | 3% |
| Overall | 54,078.0 | 100% |
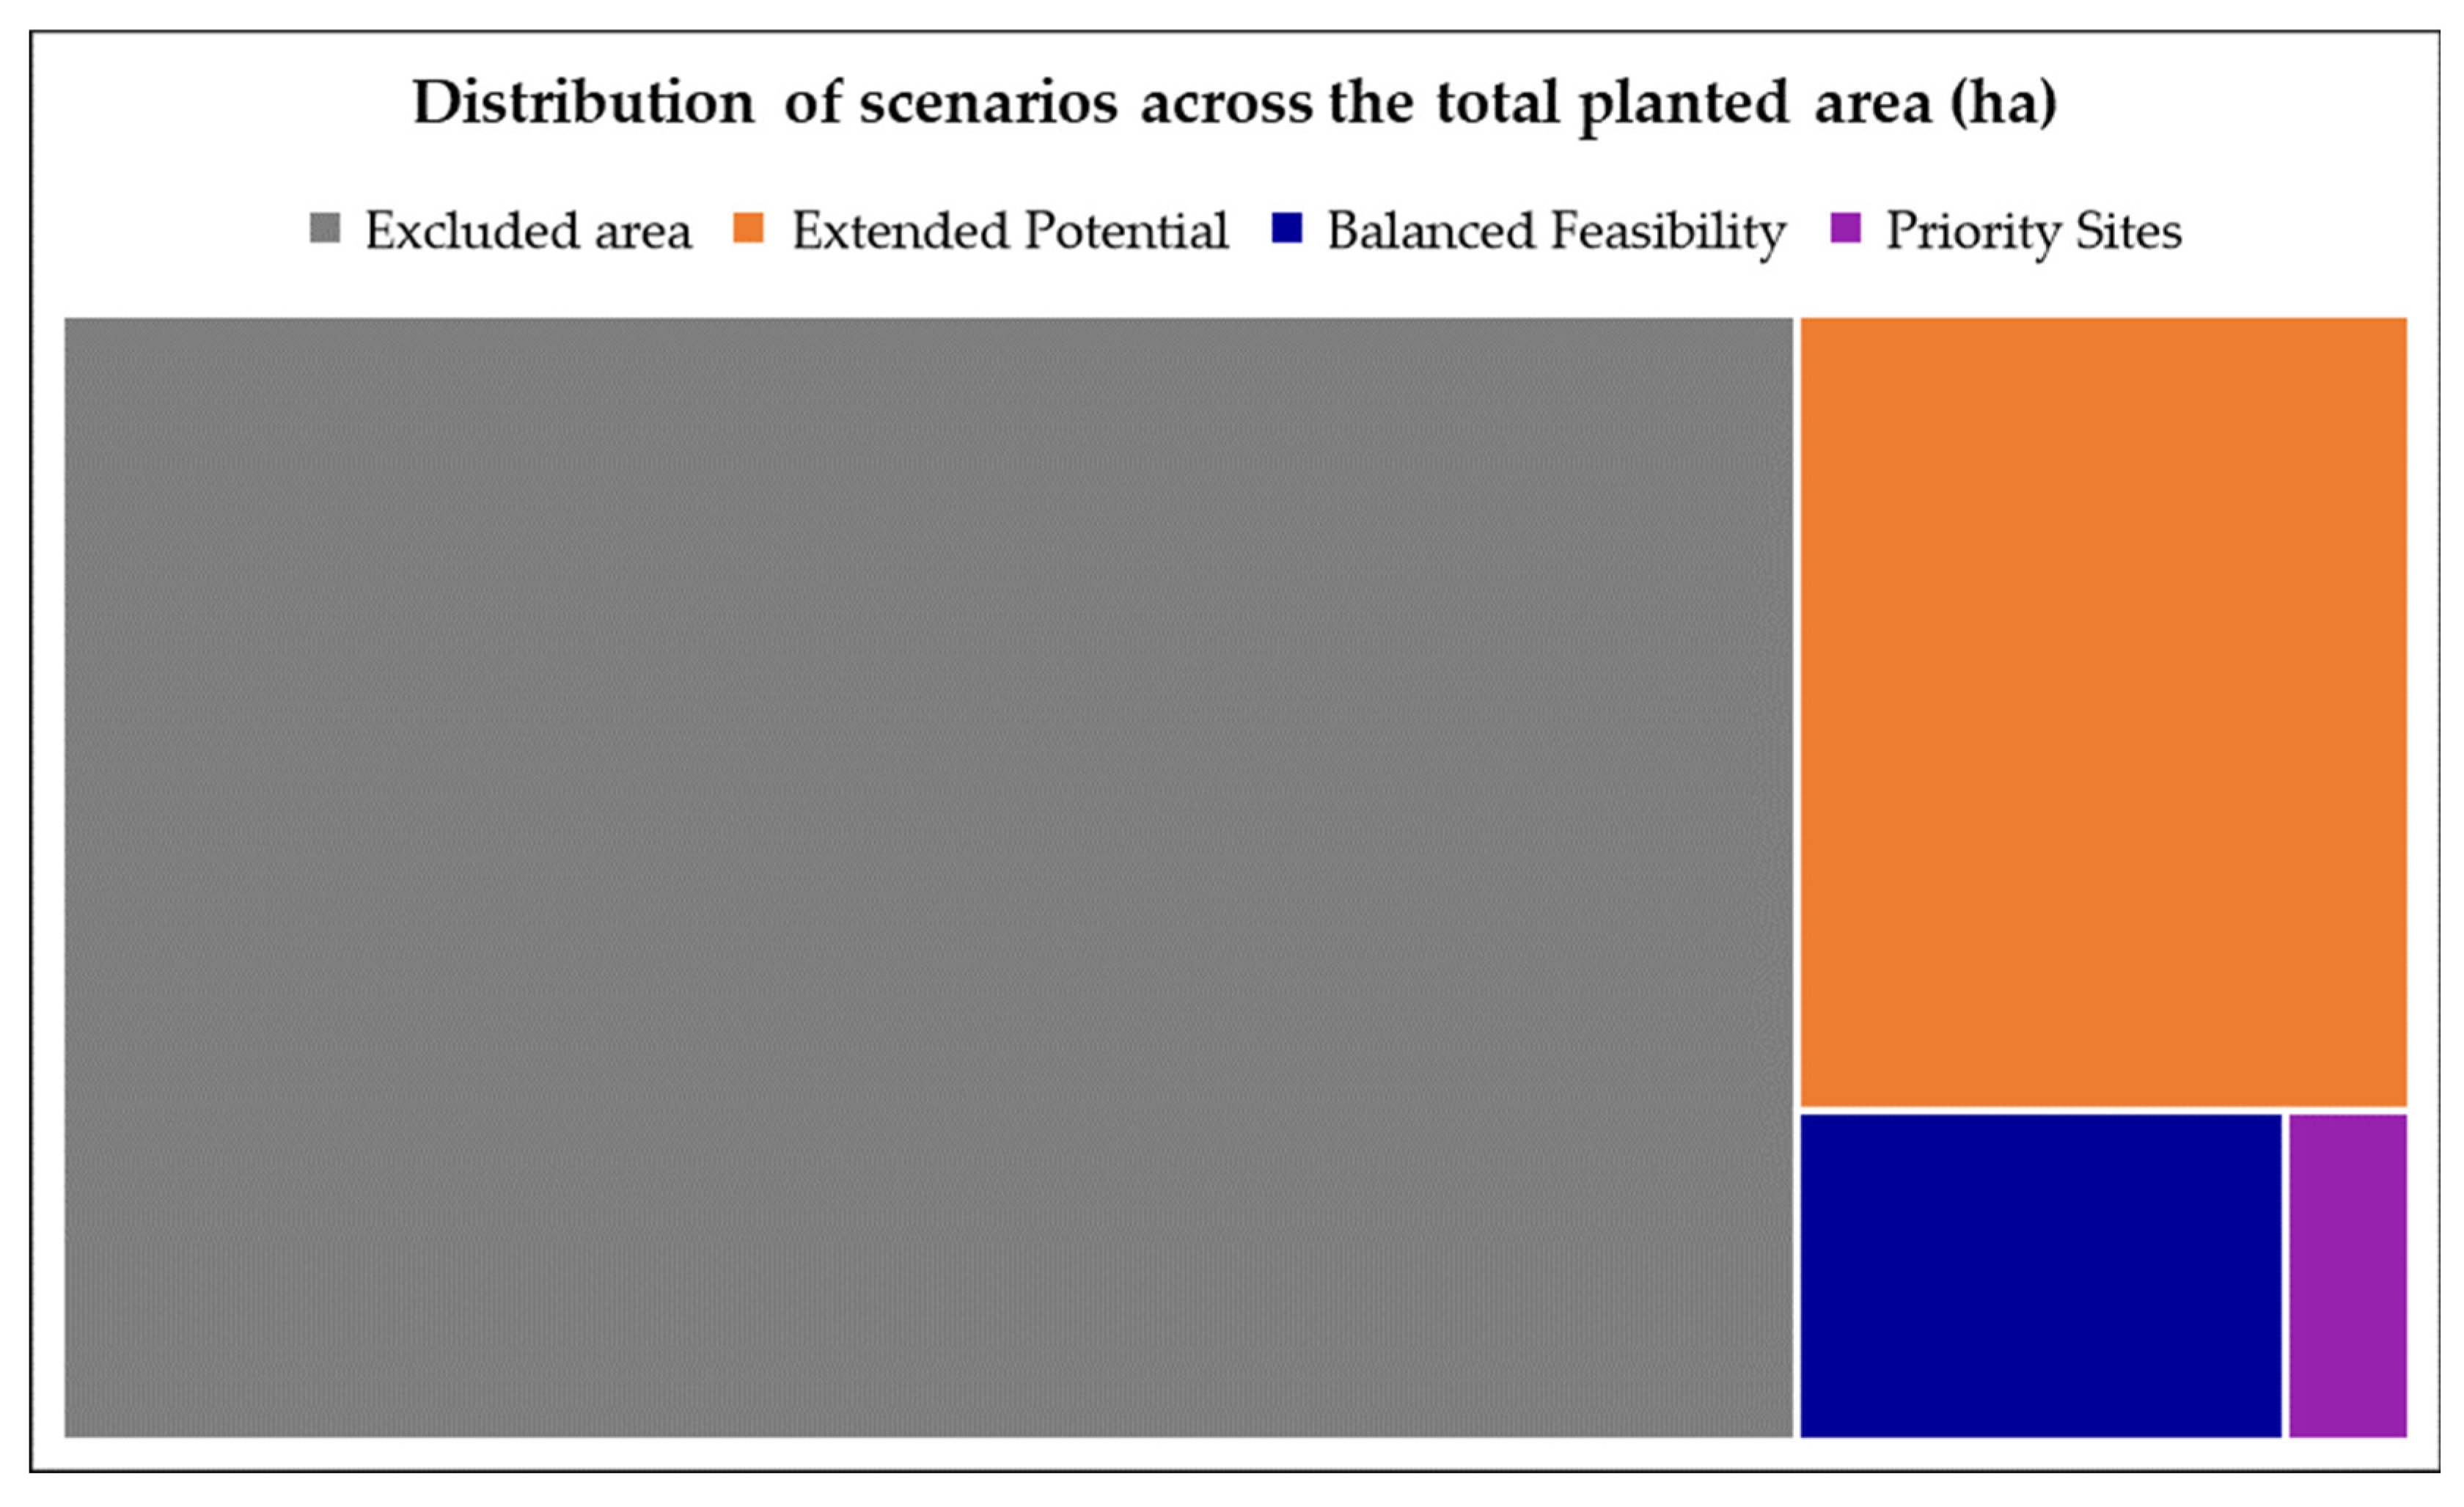
| Scenario | Planted Area (ha) | Share of Total Area (%) | Installable Capacity (GWp) 1 |
|---|---|---|---|
| High Priority | 844.2 | 1.6% | 0.55 |
| Balanced Feasibility | 4126.9 | 7.6% | 2.68 |
| Extended Potential | 14,111.1 | 26.1% | 9.17 |
| In-Field Integration | 792.4 | 1.5% | 0.52 |
| Scenario | Planted Area (ha) | Installable Capacity (GWp, 0.65 Factor) | Capacity Range (GWp, ±15%) |
|---|---|---|---|
| Baseline | 5836.26 | 3.79 | 3.22–4.36 |
| OAT—Age ≥ 10 years | 4126.92 | 2.68 | 2.28–3.08 |
| OAT—Age ≥ 15 years | 3388.86 | 2.20 | 1.87–2.53 |
| OAT—Grid ≤ 250 m | 1774.7 | 1.15 | 0.98–1.33 |
| OAT—Grid ≤ 1000 m | 18,404.83 | 11.96 | 10.17–13.76 |
| OAT—Variety (White) | 2796.71 | 1.82 | 1.55–2.09 |
| High Priority | 844.2 | 0.55 | 0.47–0.63 |
| Balanced Feasibility | 4126.9 | 2.68 | 2.28–3.08 |
| Extended Potential | 14,111.1 | 9.17 | 7.80–10.55 |
| In-Field Integration | 792.4 | 0.52 | 0.44–0.59 |
Disclaimer/Publisher’s Note: The statements, opinions and data contained in all publications are solely those of the individual author(s) and contributor(s) and not of MDPI and/or the editor(s). MDPI and/or the editor(s) disclaim responsibility for any injury to people or property resulting from any ideas, methods, instructions or products referred to in the content. |
© 2025 by the authors. Licensee MDPI, Basel, Switzerland. This article is an open access article distributed under the terms and conditions of the Creative Commons Attribution (CC BY) license (https://creativecommons.org/licenses/by/4.0/).
Share and Cite
Christ, M.; Wagner, M. Integrating Solar Energy into German Vineyards: A Geospatial Framework for Identifying Agrivoltaic Potential. Agronomy 2025, 15, 2174. https://doi.org/10.3390/agronomy15092174
Christ M, Wagner M. Integrating Solar Energy into German Vineyards: A Geospatial Framework for Identifying Agrivoltaic Potential. Agronomy. 2025; 15(9):2174. https://doi.org/10.3390/agronomy15092174
Chicago/Turabian StyleChrist, Marcel, and Moritz Wagner. 2025. "Integrating Solar Energy into German Vineyards: A Geospatial Framework for Identifying Agrivoltaic Potential" Agronomy 15, no. 9: 2174. https://doi.org/10.3390/agronomy15092174
APA StyleChrist, M., & Wagner, M. (2025). Integrating Solar Energy into German Vineyards: A Geospatial Framework for Identifying Agrivoltaic Potential. Agronomy, 15(9), 2174. https://doi.org/10.3390/agronomy15092174


